
Submitted:
17 October 2025
Posted:
20 October 2025
You are already at the latest version
Abstract
The significant changes resulting from the ongoing energy transition highlight the importance of energy sources and vectors. Among the latter, the electron is certainly the most important, therefore its efficient storage is a fundamental task. In this regard, lithium-ion batteries are currently the leading technology. In many applications these devices operate outdoors at temperatures below 0°C showing reduced performance due to lower ionic mobility. In recent years, several researchers have experimentally reproduced these operating conditions, looking for solutions that guarantee the maintenance of the desired performance. Based on this approach, an experimental set up was created to study these effects on commercial devices consisting of a single cell. The paper presents a preliminary investigation of a commercial LiFePO4 module with nominal voltage of 3.2 V and capacity of 23 Ah. For this module, in the temperature range -20 ÷ +55 °C, the open circuit voltage and the internal resistance were experimentally determined, both in the charging and discharging phases. Furthermore, in the temperature range between -20 °C and +10 °C, the improvements in performance resulting from the application of localized electric heating to the above-mentioned cell were evaluated.
Keywords:
LiFePO4 battery
; low temperature
; ions mobility
1. Introduction
In recent years, attempts to find alternative energy resources to traditional fuels have further increased both due to the limited temporal availability of the latter and the serious environmental consequences linked to their use. A clear alternative is to switch to renewable energy sources, which have the advantage of minimal environmental impact but pose the problem of managing the fact that by their nature they are predominantly intermittent, making the use of energy storage systems essential.
Depending on the needs for releasing the stored energy and the type of renewable energy to be converted, the storage system varies significantly [1,2]. Among potential storage technologies, batteries are of particular interest for several reasons, ranging from their relatively high energy density combined with low maintenance requirements [3,4] and the flexibility they allow for the electrical system [5]. There are many battery technologies available, but currently lithium-ion batteries represent the leading technology since they are characterized by high efficiency and relatively high energy density [6] even if their impact on the environment cannot be neglected [7].
There are several types of lithium batteries on the market, the main difference being the chemical composition of the cathode, while the anode is usually made of graphite, regardless of the composition of the cathode. In addition to lithium, the cathode contains other transition metal elements such as titanium, manganese, iron, cobalt, and nickel.
The chemical composition of the cathode determines some essential characteristics of the battery including capacity, power (maximum electrical current), performance, cost, safety, and number of charge-discharge cycles, i.e. the battery life.
Within this variety of cathodes, specific energy and power can vary appreciably. For example, lithium-cobalt cathode batteries have high specific energies with not so high specific powers, while lithium-iron-phosphate cathode batteries have high specific powers with lower specific energies [8].
A common feature of all lithium-ion batteries is the performance degradation at the extreme temperatures [9,10,11,12,13,14] particularly at low temperatures. Consequently, proper thermal management needs to be considered [15,16,17].
The paper presents, in the temperature range from -20 °C to +55 °C, the preliminary results regarding the open-circuit voltage and the so-called ohmic resistance, both of which are relevant to the charge and discharge capability of the battery module. To account for the reduction in battery performance, a kinetic model based on the classical Arrhenius model is proposed, which introduces the temperature dependence of the activation energy. The effect of localized electrical heating on improving performance at low temperatures is also evaluated.
2. Materials and Methods
Lithium-iron-phosphate battery modules () with solid electrolyte, able to operate at low temperature, were considered for the experimental investigation. According to the manufacturer (ShenZhen Zefeng Biotechnology Co. Ltd), each module consists of a single cell of nominal voltage of 3.2 V and nominal capacity of 23 Ah (73.6 Wh). These modules have a rectangular shape, external dimensions of 150 mm × 130 mm × 15 mm, and gross weight of 0.6 kg.
For this battery, the typical half-reactions at the cathode (the electrode where the reduction occurs) and at the anode (the electrode where the oxidation occurs) are respectively written as:
where both half-reactions evolving towards the right represent the charging process (anode as positive electrode), while the direction towards the left represents the discharging process (cathode as positive electrode).
Theoretically when the battery is fully charged there are no more available sites at the anode for ions because ideally it is fully lithiated and at the same time there is no more ionized material at the cathode because ideally it is fully delithiated. During the discharge process at the anode and cathode, the reverse process occurs, thus completely reconstructing the and graphite structures.
The reactions in Equation (1) are written on a stoichiometric basis and in a perfectly reversible manner, but it is known that real operating conditions show deviations from this ideal condition. In fact, as the battery ages, irreversible phenomena occur. Typically, these phenomena are mechanical or chemical and primarily affect the decomposition of the electrodes (e.g. the formation of dendrites on the cathode side).
As a result of the charge and discharge cycles, battery aging is usually identified through the decrease in its capacity and the increase in electrodes impedance [18]. Like aging are the effects produced on the battery by decreasing temperature [19]. Based on this finding, it is expected that temperature effects are reversible, since by returning the temperature to the initial values the battery resumes its nominal performance.
The anode and cathode typically consist of a crystalline structure in which ions are trapped in lattice sites while the intermediate electrolyte consists of a material that conducts ions well but not electrons. Furthermore, studies in the literature [20] demonstrate that ion migration increases in the presence of lattice defects due to the lack of proper lattice order and decreases as the temperature decreases. Moreover, it is known that for ion diffusion to occur, the lattice must contain vacancies, and the ions must have sufficient energy to pass through a vacancy. The energy required to force ions through the lattice is commonly called activation energy.
In the context of the chemical kinetics of reactions, this topic is widely discussed in the literature, starting from the second half of the nineteenth century [21]. The temperature dependence of a certain equilibrium constant for a given reaction occurring at constant pressure is established by the so called van’t Hoff – Arrhenius equation, which in its original differential form can be expressed as:
where, is in this case the dimensionless concentration constant at the equilibrium, the absolute temperature and (eV) is the total amount of energy (the activation energy) for kinetics to occur, while is the Boltzmann constant. By separating the variables, Equation (2) can be rewritten as:
In the case where the activation energy is assumed constant in the investigated temperature range, the solution of Equation (3) identifies the well-known Arrhenius equation: , where parameter is related to the integration constant, called pre exponential factor, which is the intercept obtained by extrapolating . In fact, the plot of against gives a straight line with negative slope . Alternatively, if for the kinetic constant we consider the reference value at temperature and introduce the equivalent kinetic coefficient , in this case , the solution of Equation (3) as definite integral between and the generic temperature is:
As established by Arrhenius [21], the equivalent kinetic coefficient can be written in terms of the ratio of forward or backward rate constants or ionic diffusion coefficients. In general, it can be written as the ratio of any chemical quantity related to the kinetics or transport phenomenon under study. If in the same semi-log plot the kinetics shows a deviation from the linear trend, it must be assumed that the activation energy depends on the temperature and therefore it is necessary to introduce a function that reproduces this dependence.
In the literature several cases can be found where this temperature dependence occurs. For example, in [22,23] where the case of ion diffusion inside the graphite anode of a lithium-ion cell is examined, the diffusion coefficient is investigated in the temperature range from -20 °C to +40 °C. In [22] the ion-diffusion coefficients are determined with a step of 10 K within the mentioned temperature range.
Figure 1 shows (empty circles) a trend of , which is clearly non-linear with respect to . This trend was obtained by choosing as reference the measured ionic diffusion coefficient at = 40 °C and considering and . In fact, if we assume that the activation energy at is constant, using Equation (4), the Arrhenius trend is indicated in Figure 1 by the dashed line. As visible in Figure 1, the slope allows us to reproduce only the few values included in the first 20 K from , providing an activation energy of an ion equal to = 2.6x10⁻⁵ eV.
Since a linear trend over the entire temperature range cannot be identified between the measured values and the classical Arrhenius model, a temperature dependence for the activation energy was imposed. In this case, the temperature dependence was assigned as a deviation from via a quadratic function of the temperature difference with respect to the reference value , such that:
where (eV/K2) represents a proper constant temperature coefficient. Reconsidering the solution of Equation (3) with the assigned , the following modified Arrhenius equation was obtained:
Note that Equation (6) with =0 yields the solution obtained with the classical Arrhenius model, as shown in Equation (4). Otherwise, assuming the previously found value for , with =2.76x10⁻⁴ eV/K2 we obtain the trend represented by the solid line in Figure 1 which is in good agreement with measurements over the whole temperature range.
In the case of anodic graphite, for ion diffusion to occur at low temperatures, the activation energy required increases by several orders of magnitude, as evident by Figure 1. In fact, at a temperature of 250 K, the energy required for ion mobility is approximately five times the value at . Therefore, in the absence of an adequate electric gradient, as the temperature decreases the ions stop.
Although these considerations only concern data relating to the anode, it can be assumed that a similar kinetic mechanism occurs for the cathode and the electrolyte. The kinetic model proposed through Equation (6) will then be used to describe the temperature trend of the investigated battery in equilibrium conditions. More specifically, through this kinetic we will try to justify the effect of temperature on the battery capacity, attributing this effect to the impossibility of providing the ions with the activation energy necessary for their mobility.
3. Results and Discussion
The temperature effect was investigated in the range from -20 °C to +55 °C. The higher value was assumed as the operating limit for safety reasons, while the lower value was chosen as the critical value attributable to external climatic conditions.
Two modules were utilized. The first module was used to establish the relationship between open circuit voltage (OCV) and state of charge (SOC) at different operating temperatures. The second one was only used to study the relationship between battery charge and discharge capacity as a function of temperature, verifying the suitability of the proposed modified Arrhenius kinetics via Equation (6). Since the aim was to highlight the effects of temperature on battery performance, it was assumed that the use of a single charge and discharge current would not represent a priori limitation, and therefore all investigations were performed using a single current of ±11.5 A, which corresponds to 0.5 C.
For this purpose, a Kikusui charge/discharge system controller PFX2500 Series equipped with a PWR801L DC power supply (0-40 V, 0-80 A) and a PLZ1001 electronic load (up to 1 kW) was used. The controller can perform charge and discharge processes at constant current, constant voltage, constant power or any user-defined current-voltage time profile.
To determine the OCV versus SOC, a procedure was followed in which, regardless of the test temperature, the initial SOC of the battery was assumed to be equal to the maximum SOC at room temperature assumed to correspond to 100% of the SOC. To limit any damage to the battery caused by overvoltage, the maximum charging voltage was set to =3.55 V, i.e., approximately 110% of the nominal voltage. The battery was then fully charged in two phases. The first phase was set at constant current (11.5 A). This phase which, depending on the initial SOC of the battery, can last from a few minutes to several hours, stops when the voltage is reached. The second phase was set at constant voltage (), with a maximum duration of 1.5 h, considering this time sufficient to reach a current close to zero. Then, to determine the actual OCV when the SOC is 100%, a relaxation time of 1.5 h was imposed during which the control system is at rest (zero supply current).
As an example, Figure 2 shows, for the test at room temperature, the trend of both the current and the voltage as a function of time. As can be seen, during the relaxation period the voltage decay tends to an asymptotic value. Some authors [24] assume the calculated value of this asymptote as the actual OCV value. For the tests performed, it was assumed that at the end of the relaxation time the measured voltage was very close to its asymptotic value and therefore practically coincident with the actual OCV.
During the discharge phase, the minimum voltage at which the battery was assumed to be completely discharged and therefore with a zero SOC value was set to approximately 85% of the nominal voltage, i.e., = 2.7 V. This choice is due to both the potential damage to the battery when the voltage values reached during the discharge phase are excessively low and, where applicable, to the need to maintain a battery voltage high enough to guarantee an adequate supply voltage for the loads connected to it. Regardless of the reasons for this choice just outlined, it was found that below the chosen voltage, the energy that the battery can still supply is practically negligible. Similarly to what was done for the charging phase, once the set voltage is reached, a rest/relaxation time equal to 1.5 h is set, after which the measured voltage value is the OCV value.
The SOC value was not set to zero at the end of all discharge tests. In fact, since the battery was assigned a 100% SOC after charging at room temperature, the minimum SOC value depends on the actual energy released during discharge, which is expected to vary with temperature. Based on the established operating voltage range, a few complete charge and discharge cycles were performed at a constant current of ±11.5 to identify the actual capacity of the battery at room temperature. Using simply constant current Coulomb counting, the capacity of the battery was evaluated during discharge, measuring the time needed to reach from the OCV measured at 100% SOC, and during charge by measuring the time needed to reach from the OCV measured at the end of the previous discharge. Under these conditions, the actual battery capacity at room temperature was on average slightly lower than the nominal one and the maximum value found, equal to 21.8 Ah, was chosen as reference value, , for determining the SOC at all other test temperatures.
For a constant discharge and charge current of ±11.5 A, the OCV values were determined in steps of 5% of the nominal capacity (23 Ah) corresponding to 6 minutes steps at constant current each of which was followed by a relaxation time of 1.5 hours before assigning the OCV. An example is shown in Figure 3 for the initial discharging phase. The current and voltage graphs are plotted as a function of relative time, which refers to the end of the relaxation time of the previous charging procedure (SOC 100%), which shows an OCV equal to 3.53 V. In the figure, the dashed line represents the current values, while the solid one represents the voltage measured at the battery terminals. The voltage curve over time is, as expected, exponential with a horizontal asymptote. It can be noted that the first discharge step (fully charged battery) has a greater voltage drop than the subsequent one. As is known, this is due to the so-called activation losses since the reaction initially occurs more slowly. During the relaxation period between the two discharges shown in the figure, it can be observed how the voltage increases by a few hundredths of a volt.
After the initial voltage drop due to activation, the various discharge steps occur regularly, each with a constant current load for 6 minutes and a relaxation time of 1.5 hours. Examining the data, a gradual decrease in OCV was observed, which, when the battery is operated at room temperature, remains above the nominal voltage even at low SOC values. The final part of the discharging process is shown in Figure 4, where at relative time zero, the SOC of the battery, assigned via the Coulomb counting, is approximately 10.1%.
In the step starting at the relative time zero the constant current discharge continues to last the expected 6 minutes because the voltage does not reach the set value. However, observing the voltage trend over time, a negative concavity can be seen with an apparently vertical asymptote in the final part of the discharge step. This voltage behavior begins to manifest itself when the SOC values drop below 30%, but when the SOC reaches 10% the voltage shows a much sharper drop. As can be seen in Figure 4, this sharp drop in voltage causes the voltage to drop below during the following discharge, and the control system interrupts the load after only about a couple of minutes. Applying the load for a few more steps, the energy exchanged is minimal. The final SOC value reached is around 1.5% and, after relaxation, the OCV is 2.82 V.
Figure 5 shows the temperature trend of the device over time, measured on the external surface of the battery, during the different discharge steps. The figure shows how a sharp decrease in voltage corresponds to a sharp increase in temperature. The temperature trend shown in Figure 5 refers to a relative time for which the zero value corresponds to the same value in Figure 4. For negative values of the relative time, Figure 5 shows that the temperature trend is almost regular, increasing during the application of the current load and decreasing in the relaxation phase, returning approximately to the initial value. On the positive side of the time axis, a sudden increase in temperature can be observed, albeit by a few tenths of a degree, which certainly indicates a singular event within the battery, likely an increase in internal resistance, the thermal effect of which disappears in the following step when the load duration decreases. Although these calorimetric aspects may provide interesting insights into the electrochemical behavior of the battery, they are beyond the scope of this work.
Starting from the SOC and OCV values obtained after the discharge sequence, the charging procedure was performed using constant current steps corresponding to 5% of the nominal capacity. As shown in Figure 6 and Figure 7, the behavior of the battery during charging is similar to that observed during discharging, and therefore similar considerations can be made. During the charging, the thermal behavior of the battery is comparable to that found during discharging, even with regards to the final part of the charge, highlighting a temperature trend like that shown in Figure 5. For this room temperature test the reference temperature value for the device, calculated as the average during discharging and charging, is approximately 22.0 °C.
The set of OCV against SOC values determined at room temperature during the discharging and charging are shown in Figure 8. In the figure, the circles and triangles represent the values measured during the charging and discharging steps, respectively, and the error bars for the voltage are equal to 1%. Observing the trends for the two phases, it can be seen that the voltage values are almost superimposable within the error bar. Therefore, it is not possible to highlight a significantly different behavior of the battery during discharge and charge at room temperature. The presence of hysteresis in the discharge and charge cycle is predictable, since a difference in OCV has always been found between charge and discharge at the same SOC.
The solid line in Figure 8 represents the OCV trend as a function of SOC calculated using a model available in literature [25], for which the authors propose the following formulation:
and, in the case of a battery operating at room temperature, the following values for the parameters: .
As can be seen, when the SOC varies from approximately zero up to 90% the model shows OCV values in good agreement with the measured ones, while for a SOC higher than 90% differences with the measured values are found. In fact, based on the experimental data, the battery, at room temperature, maintains a practically constant voltage even when it is close to SOC 100%. Tests at temperatures other than ambient were carried out in a thermostatic chamber by sequentially selecting the following set point: 0 °C, -10 °C, -20 °C and finally +55 °C. To ensure the same initial conditions, before each test temperature the battery was charged at room temperature following the procedure previously described, making the SOC 100% correspond to the previous obtained capacity value. Once a stable temperature in the thermostatic chamber value was obtained, the various 5% discharge and charge steps were performed using a current of ±11.5 A. The exchanged energy and the resulting capacity change at each step were determined by Coulomb counting, calculating the resulting SOC using the previously determined value.
The OCV versus SOC values obtained at various temperatures are shown in Figure 9, Figure 10, Figure 11 and Figure 12. The average temperature values measured on the external surface of the battery are as reported in the captions of the figures: 2.0 °C, -9.1 °C, -19.7 °C and 52.2 °C. In these figures, the values measured during charging and discharging are still represented by circles and triangles respectively, as well as the error bars still identify the 1% deviation. Furthermore, in the figures the theoretical model OCV vs SOC at room temperature is shown.
At temperature below 0 °C, these data, compared to those at room temperature, clearly show the effect of temperature on battery performance in terms of both voltage level and available energy. In fact, Figure 10 (-9.1 °C) and Figure 11 (-19.7 °C) highlight the significant reduction in available battery capacity, of approximately 15% and 35%, respectively and the overall reduction in OCV. For reasons that cannot be technically explained, it was not possible to charge the battery at the nominal temperature of -20 °C. A possible explanation for this failure could depend on the thermal behavior of the solid electrolyte, whose structure likely undergoes a solid-solid transition at a given temperature. Decreasing the temperature gradually makes migration paths of the ion less accessible, requiring a higher activation energy for diffusion to occur. At a given temperature (in this case close -20 °C), the required activation energy is so high that the ionic conduction stops due to overvoltage limit. It is worth noting that this temperature-induced limitation appears reversible. Indeed, it has been found that by returning the battery to the room temperature, the OCV shown in Figure 8 is practically reproducible without apparent irreversibility or definitive losses of capacity.
These critical issues disappear at temperatures above 0 °C. In fact, the OCV vs SOC plots reported in Figure 9 (+2.0 °C) and in Figure 12 (+52.2 °C) are similar and comparable to the one obtained at room temperature, except for a small reduction in useful capacity of approximately 5% in both cases.
The OCV values measured at the end of the discharge processes increase as the battery temperature decreases. For example, at the temperature of approximately -20 °C (Figure 11) the OCV was found close to 3.15 V, while at the temperature of about + 52 °C (Figure 12) the measured voltage was just above 2.75 V. Since the change in the molar Gibbs free energy (J/mol) due to both half reaction reported in Equation (1) is proportional to the OCV, in standard conditions it can be written as:
where is the Faraday constant (C/mol) and is unitary in this case. Figure 13 shows the molar Gibbs free energy obtained using the OCV values measured at the end of the discharge for the different test temperatures. The dashed line represents the linear regression performed on these values, and the error bars refer to a 2% deviation. In the same temperature range, it is interesting to note that the temperature dependence of the molar Gibbs free energy of a is also linear [26] and shows the same slope as the regression line in Figure 13 even though the literature values refer only to the cathode-material.
The reduced ionic mobility thus appears to actually cause a decrease in battery capacity, which is particularly noticeable at temperatures below 0 °C. Despite this criticality, as mentioned above, experimental tests have shown that increasing the battery temperature can restore its capacity to a value close to the nominal one. Since this occurs in tests aimed at finding a relationship between OCV and SOC, to further investigate on this behavior a new set of measurements was performed using a second new module.
The new battery was initially charged, discharged and recharged at room temperature following the procedure described previously. The new reference value for the capacity is = 22.4 Ah. Furthermore, in order to increase the temperature of the battery independently of the temperature of the measurement environment, a square heating film resistance (40 mm x 40 mm) capable of providing a heat flux in the range 0÷48 W was applied to each of the two large outer surfaces of the battery.
The tests were carried out in the thermostatic chamber with a fixed set point of -20°C. Once the chamber reached thermal stability, maintaining the previous voltage limits (= 3.55 V and = 2.7 V) and the same constant current (±11.5 A), the battery was subjected to a continuous process until complete discharge ( voltage reached) followed by a relaxation time of 1.5 hours, and to a continuous process until complete charge ( voltage reached). By performing both continuous discharge and charge, the heat generation due to the Joule effect produces higher internal temperatures in the battery than those previously achieved with a stepped discharge and charge process. Furthermore, the relaxation period between discharge and charge allows the battery to re-establish the pre-discharge temperature, thus allowing discharge and charge to be carried out under similar thermal conditions while maintaining the same average temperature.
In summary, after having fully charged the battery at room temperature and put it into the thermostatic chamber at the chosen set point temperature (-20 °C), in the absence of the heating that external resistances can provide, the discharge and charge cycle was performed, measuring the change in capacity via Coulomb counting.
Afterwards, with the thermal camera set at -20 °C, several discharge-charge cycles were performed, during which the resistors were powered, increasing the thermal output each time to heat the battery. For each test, the change in battery capacity was measured at the temperature reached with the help of the resistors. The results appear consistent with those already highlighted in the previous experiment, i.e. battery capacity decreases as its temperature decreases, similarly for both discharge and charge. It is important to note that, even without using the heating resistors, at the minimum battery temperature, in this case -17.3 °C, both the discharge and charge processes were possible.
Comparing this result with that obtained with the previous battery, which could not be charged at -19.7 °C, suggests that the cut-off temperature that inhibits ionic conduction in the electrolyte lies within this narrow range of temperatures.
The set of results obtained for the two battery modules was interpreted using the modified Arrhenius model proposed in Equation (6). The kinetic parameter can be in this case related to ionic mobility and the consequent change in capacity of the battery. It was therefore established that is equivalent to the ratio , where corresponds to the measured battery capacity at a given temperature, while represents its value in the chosen reference condition. The results are summarized in the semi-logarithmic diagram of Figure 14 for both battery modules. In this figure, the dashed (module #1) and solid (module #2) lines represent the output of the kinetic model of Equation (6). The model assumed the same value for the activation energy, = 1.0·10-3 eV, and different values for the temperature coefficient, =8.0·10-5 eV/K2 for module #1, and =6.7·10-5 eV/K2 for module #2. The need for a higher value of the temperature coefficient for the first module is probably related to its greater thermal aging. In fact, the first module was subjected to a much higher number of hours of testing (several hundred) than the second, as well as numerous charge and discharge cycles. From the graph it can be observed that, even considering measurement uncertainties of 5% for both tests, the different temperature behavior remains.
The good agreement between measurements and the proposed model seems to confirm the feasibility of expressing the performance of a battery using a kinetic approach, in which the reduced ion mobility is considered assuming the activation energy is a function of temperature. Based on these results, it can be noted that this behavior appears to be associated with the thermal state of the battery, regardless of the process occurring between different thermal levels. In fact, independent of how a given thermal level was established, the capacity of the battery depends only on its thermal level.
The right vertical axis of Figure 14 shows the absolute value of the relative capacity loss compared to the reference value . At the same temperature, it is systematically found that the capacity loss during charging is lower than during discharging. Although the difference is generally small (less than 5%), it cannot be explained by the kinetic model, which depends only on temperature. Since charging or discharging times depend on the instant at which the voltage extreme and are reached, the electrical resistance of the electrodes can also be relevant.
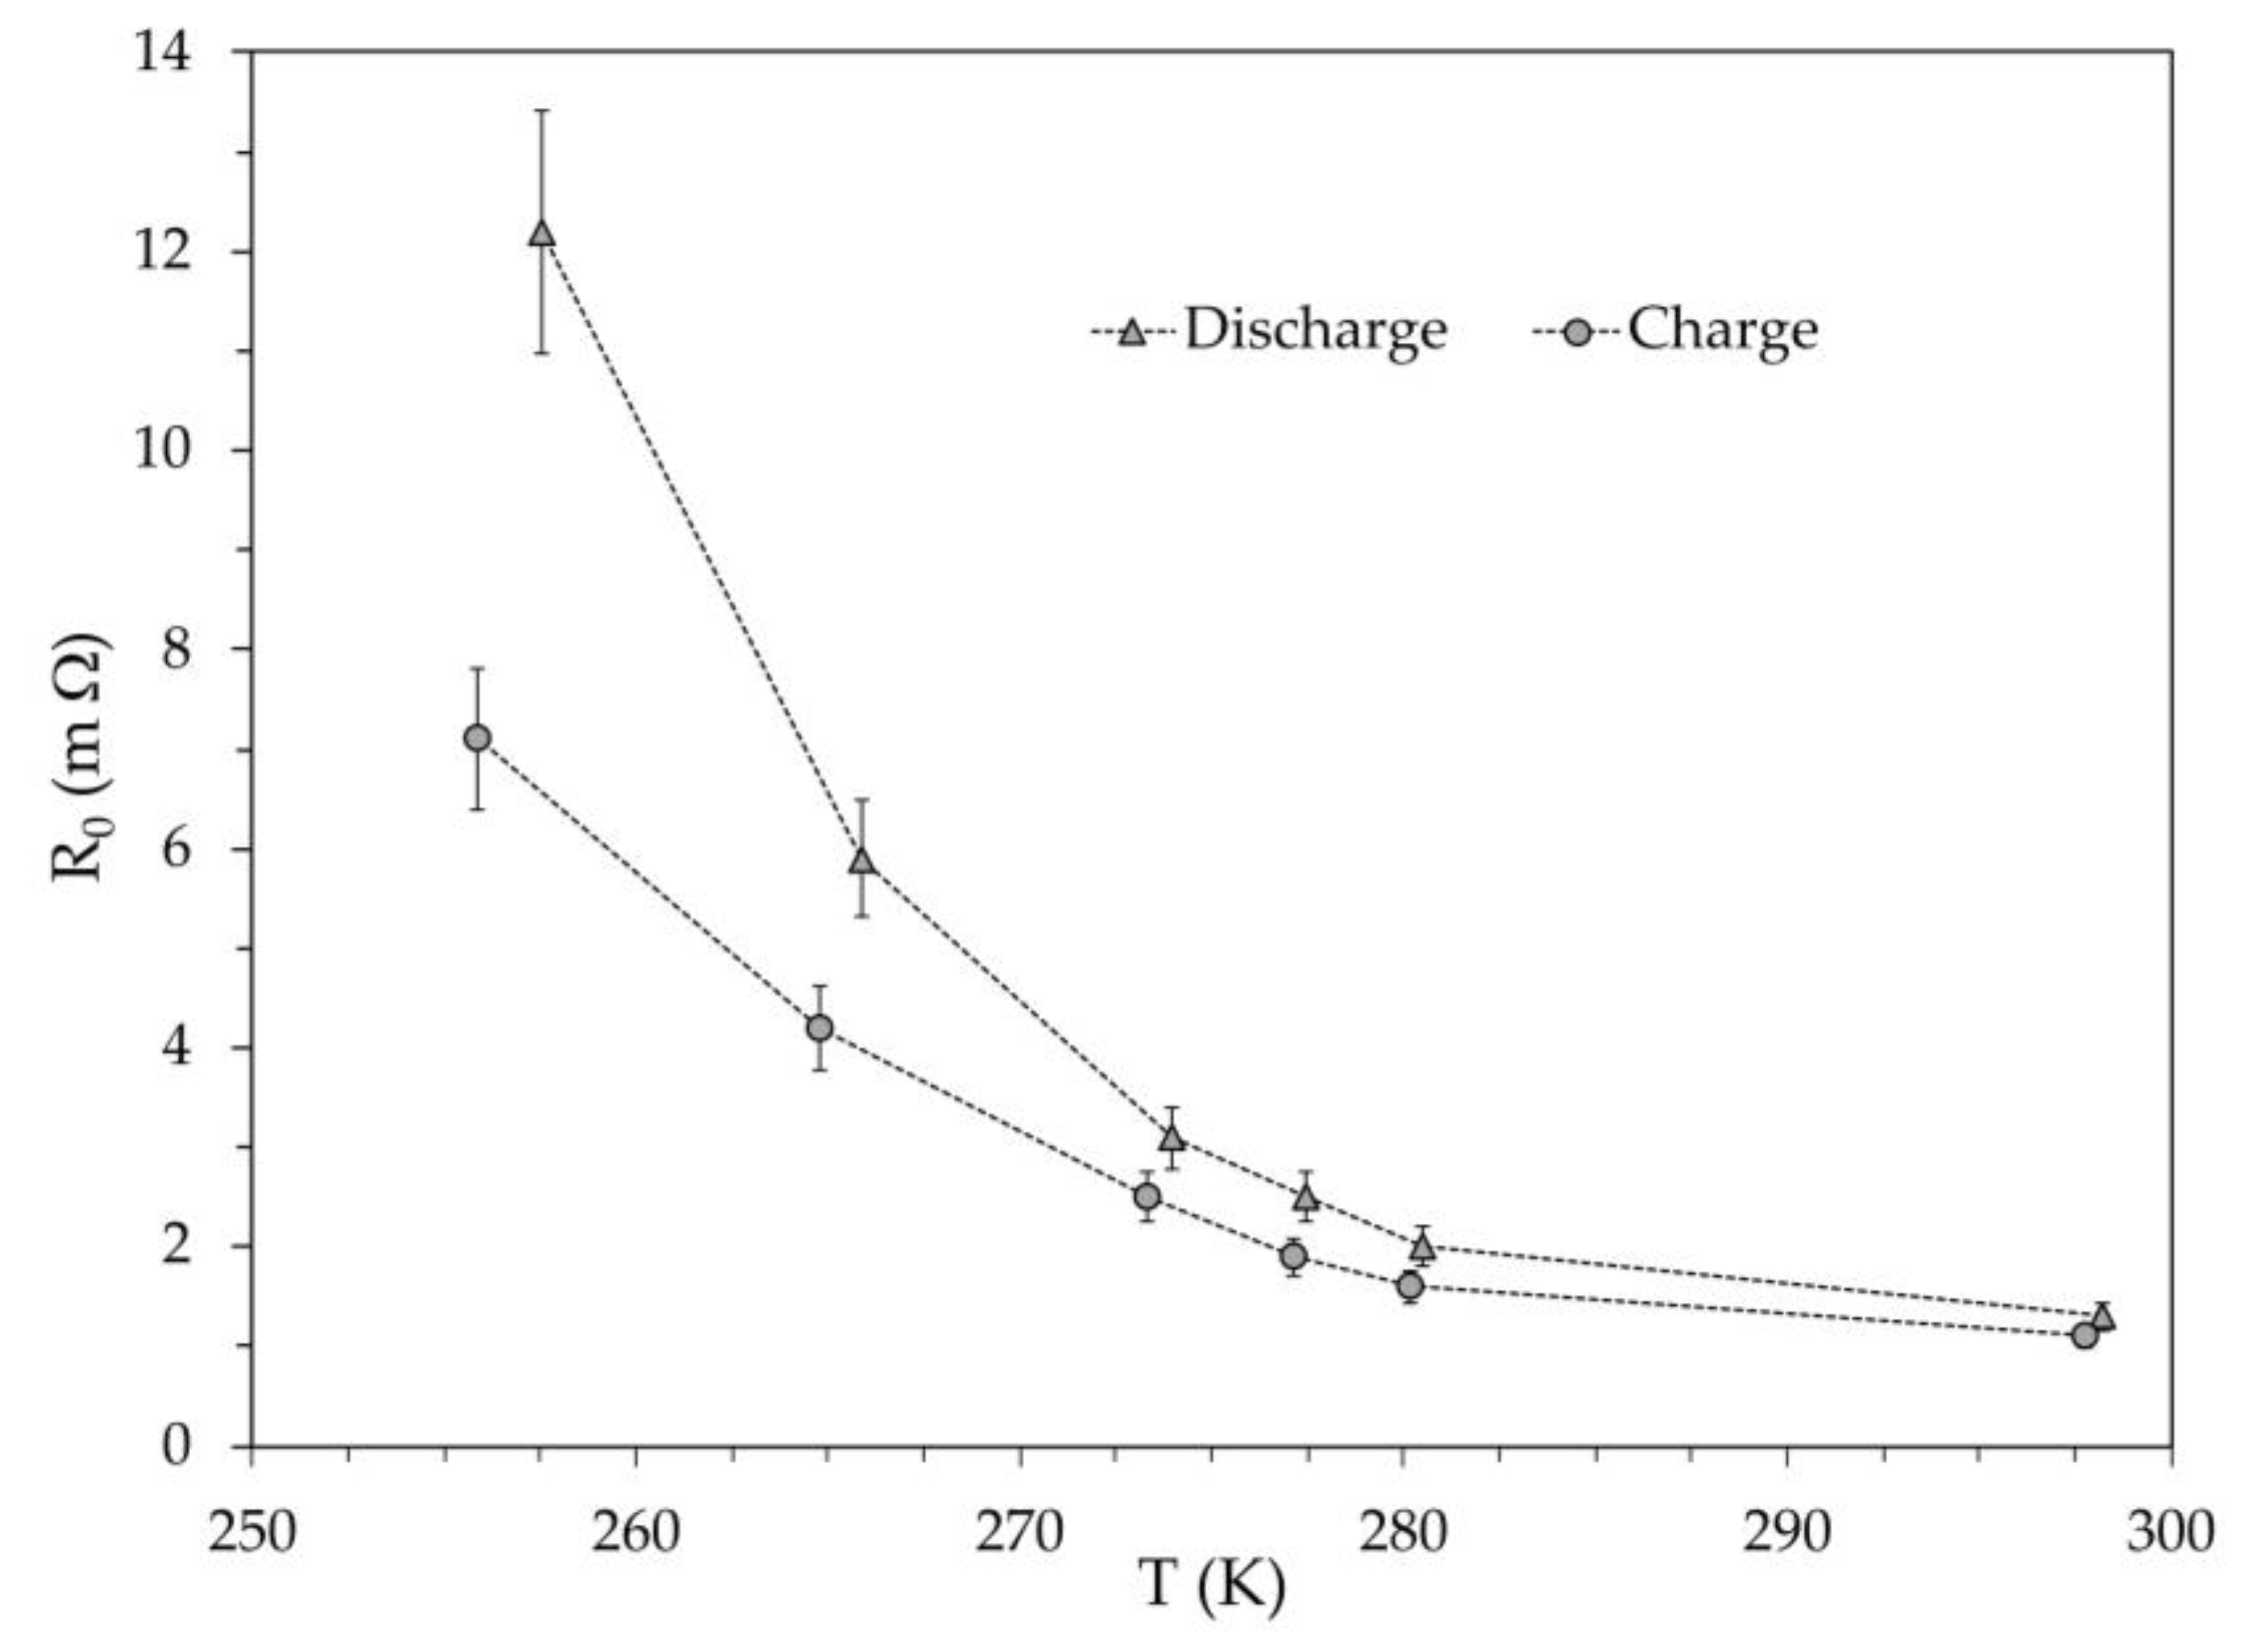
Beyond the equivalent electrical circuits used to simulate the dynamic behavior of a battery, the ohmic resistance is that associated with the instantaneous voltage drop or increase when the current is switched off or switched on to the battery, respectively. Figure 15 shows the ohmic resistance versus temperature determined for the module #2 at the beginning of the discharge and charge. The temperature dependence of is highly nonlinear, both during discharge and charge. It is difficult to attribute this behavior only to the material of electrodes, and we cannot exclude the possibility that it is due to a peculiar characteristic of the specific battery assembly. Even assuming a 10% uncertainty in determining the resistance , the value found for discharging was always higher than that for charging. This could justify the greater battery capacity achieved during charging compared to that available during discharging at the same temperature and could also explain the lower OCV found in the discharging compared to charging.
4. Conclusions
A preliminary experimental investigation of the thermal behavior of a lithium-iron-phosphate battery was proposed. The primary objective of the experiment was to verify the feasibility of a kinetic model to determine the reduction in battery capacity as the operating temperature decreases. Despite the good agreement obtained between theoretical and experimental results, validating the model requires extending the test conditions to different charge and discharge currents and applying the experiments to other types of lithium batteries. Even if these limitations are important, some concluding remarks can be highlighted:
- The relationship found between OCV and SOC is in good agreement with models proposed in the literature. This allows us to consider the chosen battery as representative of the lithium-iron-phosphate type;
- The reduction in battery capacity as the temperature decreases appears to be primarily attributable to ion conduction of electrolyte. In this regard, the decreasing temperature gradually makes the migration paths of ions within its structure less accessible, and there may be a specific threshold temperature for a given electrolyte that inhibits the ionic conduction;
- The reduction in battery capacity due to low temperatures appears reversible. In fact, returning the battery to higher temperatures restores the expected capacity value;
- Electron conduction also appears to influence battery performance at low temperatures. Experimental results show a significant increase in the so-called ohmic resistance at temperatures below ambient.
Author Contributions
Conceptualization, M.B., E.C. and V.G.; methodology, V.G.; investigation, M.B., E.C. and V.G.; writing—original draft preparation, E.C. and V.G.; writing—review and editing, E.C. and V.G. All authors have read and agreed to the published version of the manuscript.
Funding
This research received no external funding.
Conflicts of Interest
The authors declare no conflicts of interest.
Abbreviations
The following abbreviations are used in this manuscript:
| OCV | Open Circuit Voltage |
| SOC | State of Charge |
References
- Sayed, E. T.; Olabi, A. G.; Alami, A. H.; Radwan, A.; Mdallal, A.; Rezk, A.; Abdelkareem, A. M. Renewable Energy and Energy Storage Systems. Energies 2023, 16(3), 1415. [CrossRef]
- Koohi - Fayegh, S.; Rosen, M.A. A review of energy storage types, applications and recent developments, J. Energy Storage 2020, 27, 101047. [CrossRef]
- Lamnatou, C.; Chemisana, D.; Cristofari, C. Smart grids and smart technologies in relation to photovoltaics, storage systems, buildings and the environment. Renew. Energy 2022, 185, 1376-1391. [CrossRef]
- Pimm, A. J.; Cockerill, T. T.; Taylor, P. G. The potential for peak shaving on low voltage distribution networks using electricity storage. J. Energy Storage 2018, 16, 231-242. [CrossRef]
- Impram, S.; Nese, S. V.; Oral, B. Challenges of renewable energy penetration on power system flexibility: A survey. Energy Strateg Rev 2020, 31, 100539. [CrossRef]
- Chen, T.; Jin, J.; Lv, H.; Yang, A.; Liu, M.; Chen, B.; Xie, Y.; Chen, Q. Applications of Lithium-Ion Batteries in Grid-Scale Energy Storage Systems. Trans. Tianjin Univ. 2020, 26, 208–217. [CrossRef]
- Bawankar, S.; Dwivedi, G.; Nanda, I.; Jimenez Macedo, V. D.; Kesharvani, S.; Meshram, K.; Jain, S.; Mishra, S.; Singh, V. P.; Verma, P. Environmental impact assessment of lithium-ion battery employing cradle to grave. Sustain. Energy Technol. Assess. 2023, 60, 103530. [CrossRef]
- Miao, Y.; Hynan, P.;, von Jouanne, A.; Yokochi, A. Current Li-Ion Battery Technologies in Electric Vehicles and Opportunities for Advancements. Energies 2019, 12(6), 1074. [CrossRef]
- Liao, L.; Zuo, P.; Ma, Y.; Chena, X.; Ana, Y.; Gaoa, Y.; Yin, G. Effects of temperature on charge/discharge behaviors of LiFePO4 cathode for Li-ion batteries. Electrochim. Acta 2012, 60, 69-273. [CrossRef]
- Jin, G.; Zhao, W.; Zhang, J.; Liang, W.; Chen, M.; Xu, R. High-Temperature Stability of LiFePO4/Carbon Lithium-Ion Batteries: Challenges and Strategies”, Sustain. Chem. 2025, 6(1), 7. [CrossRef]
- Issa, F.; Diaconu, E. M.; Ardeleanu, M. N. Working temperature’s influence on the LiFePo4 battery generated power. Scientific Bulletin of the Electrical Engineering Faculty 2023, 2(49). [CrossRef]
- Gong, X.; Mi, C. C. Temperature-dependent performance of lithium-ion batteries in electric vehicles. In 2015 IEEE Applied Power Electronics Conference and Exposition (APEC)”, Charlotte, NC, USA, 2015, 1065-1072,. [CrossRef]
- Alipour, M.; Ziebert, C.; Conte, F. V.; Kizilel, R. A Review on Temperature-Dependent Electrochemical Properties, Aging, and Performance of Lithium-Ion Cells. Batteries 2020, 6(3), 35. [CrossRef]
- Karlsen, H.; Dong, T.; Yang, Z.; Carvalho, R. Temperature-Dependence in Battery Management Systems for Electric Vehicles: Challenges, Criteria, and Solutions. IEEE Access 2019, 7, 142203-142213. [CrossRef]
- Azizi, Y.; Sadrameli, S.M. Thermal management of a LiFePO4 battery pack at high temperature environment using a composite of phase change materials and aluminum wire mesh plates. Energy Conv. Manag. 2016, 128, 294-302. [CrossRef]
- Zhou, L.; Garg, A.; Li, W.; Gao, L. Intelligent temperature control framework of lithium-ion battery for electric vehicles, Appl. Therm. Eng. 2024, 236 Part C, 121577. [CrossRef]
- Jin, G.; Zhao, W.; Zhang, J.; Liang, W.; Chen, M.; Xu, R. High-Temperature Stability of LiFePO4/Carbon Lithium-Ion Batteries: Challenges and Strategies. Sustain. Chem. 2025, 6(1), 7. [CrossRef]
- Zhang, Q.; White, R.E. Capacity fade analysis of a lithium-ion cell. J Power Sources 2008, 179(2), 793–798. [CrossRef]
- Jaguemont, J.; Boulon, L.; Dubé, Y. A comprehensive review of lithium-ion batteries used in hybrid and electric vehicles at cold temperatures. Appl. Energy 2016, 164, 99-114. [CrossRef]
- Sotoudeh, M.; Baumgart, S.; Dillenz, M.; Döhn, J.; Forster-Tonigold, K.; Helmbrecht, K.; Stottmeister, D.; Groß, A. Ion Mobility in Crystalline Battery Materials. Adv. Energy Mater. 2024, 14, 2302550. [CrossRef]
- Laidler, K. J. The Development of the Arrhenius Equation. J. Chem. Educ. 1984, 61(6), 494–498. [CrossRef]
- Zhang, S.S.; Xu, K.; Jow, T.R. Low temperature performance of graphite electrode in Li-ion cells. Electrochim. Acta 2002, 48, 241–246. [CrossRef]
- Yang, H.; Wu, N. Ionic conductivity and ion transport mechanisms of solid-state lithium-ion battery electrolytes: A review. Energy Sci Eng. 2022, 10, 1643-1671. [CrossRef]
- Theuerkauf, D.; Swan, L. Characteristics of Open Circuit Voltage Relaxation in Lithium-Ion Batteries for the Purpose of State of Charge and State of Health Analysis. Batteries 2022, 8(8), 77-91. [CrossRef]
- Zhang, C., Jiang, J., Zhang, L., Liu, S., Wang, L., Loh, P.C. (2016). A generalized SOC-OCV model for lithium-ion batteries and the SOC estimation for LNMCO battery. Energies, 9 (900-911). [CrossRef]
- Wang, S.; Zhang, G.; Gao, J.; Wang, J.; Wang, Y.; Nan, C.; Huang, D.; Chen, L.; Song, J.; Luo, P. First-principles Study on LiFePO4 Materials for Lithium-ion Battery. Proceedings of the International Workshop on Materials, Chemistry and Engineering 2018, 133-138.
Figure 1.
Semi-log diagram of the equivalent kinetic coefficient vs the reciprocal of the absolute temperature. The empty circles refer to the measured values found in the literature [22], the dashed and solid lines represent the solution of the classical Arrhenius equation and the modified one proposed here, respectively.
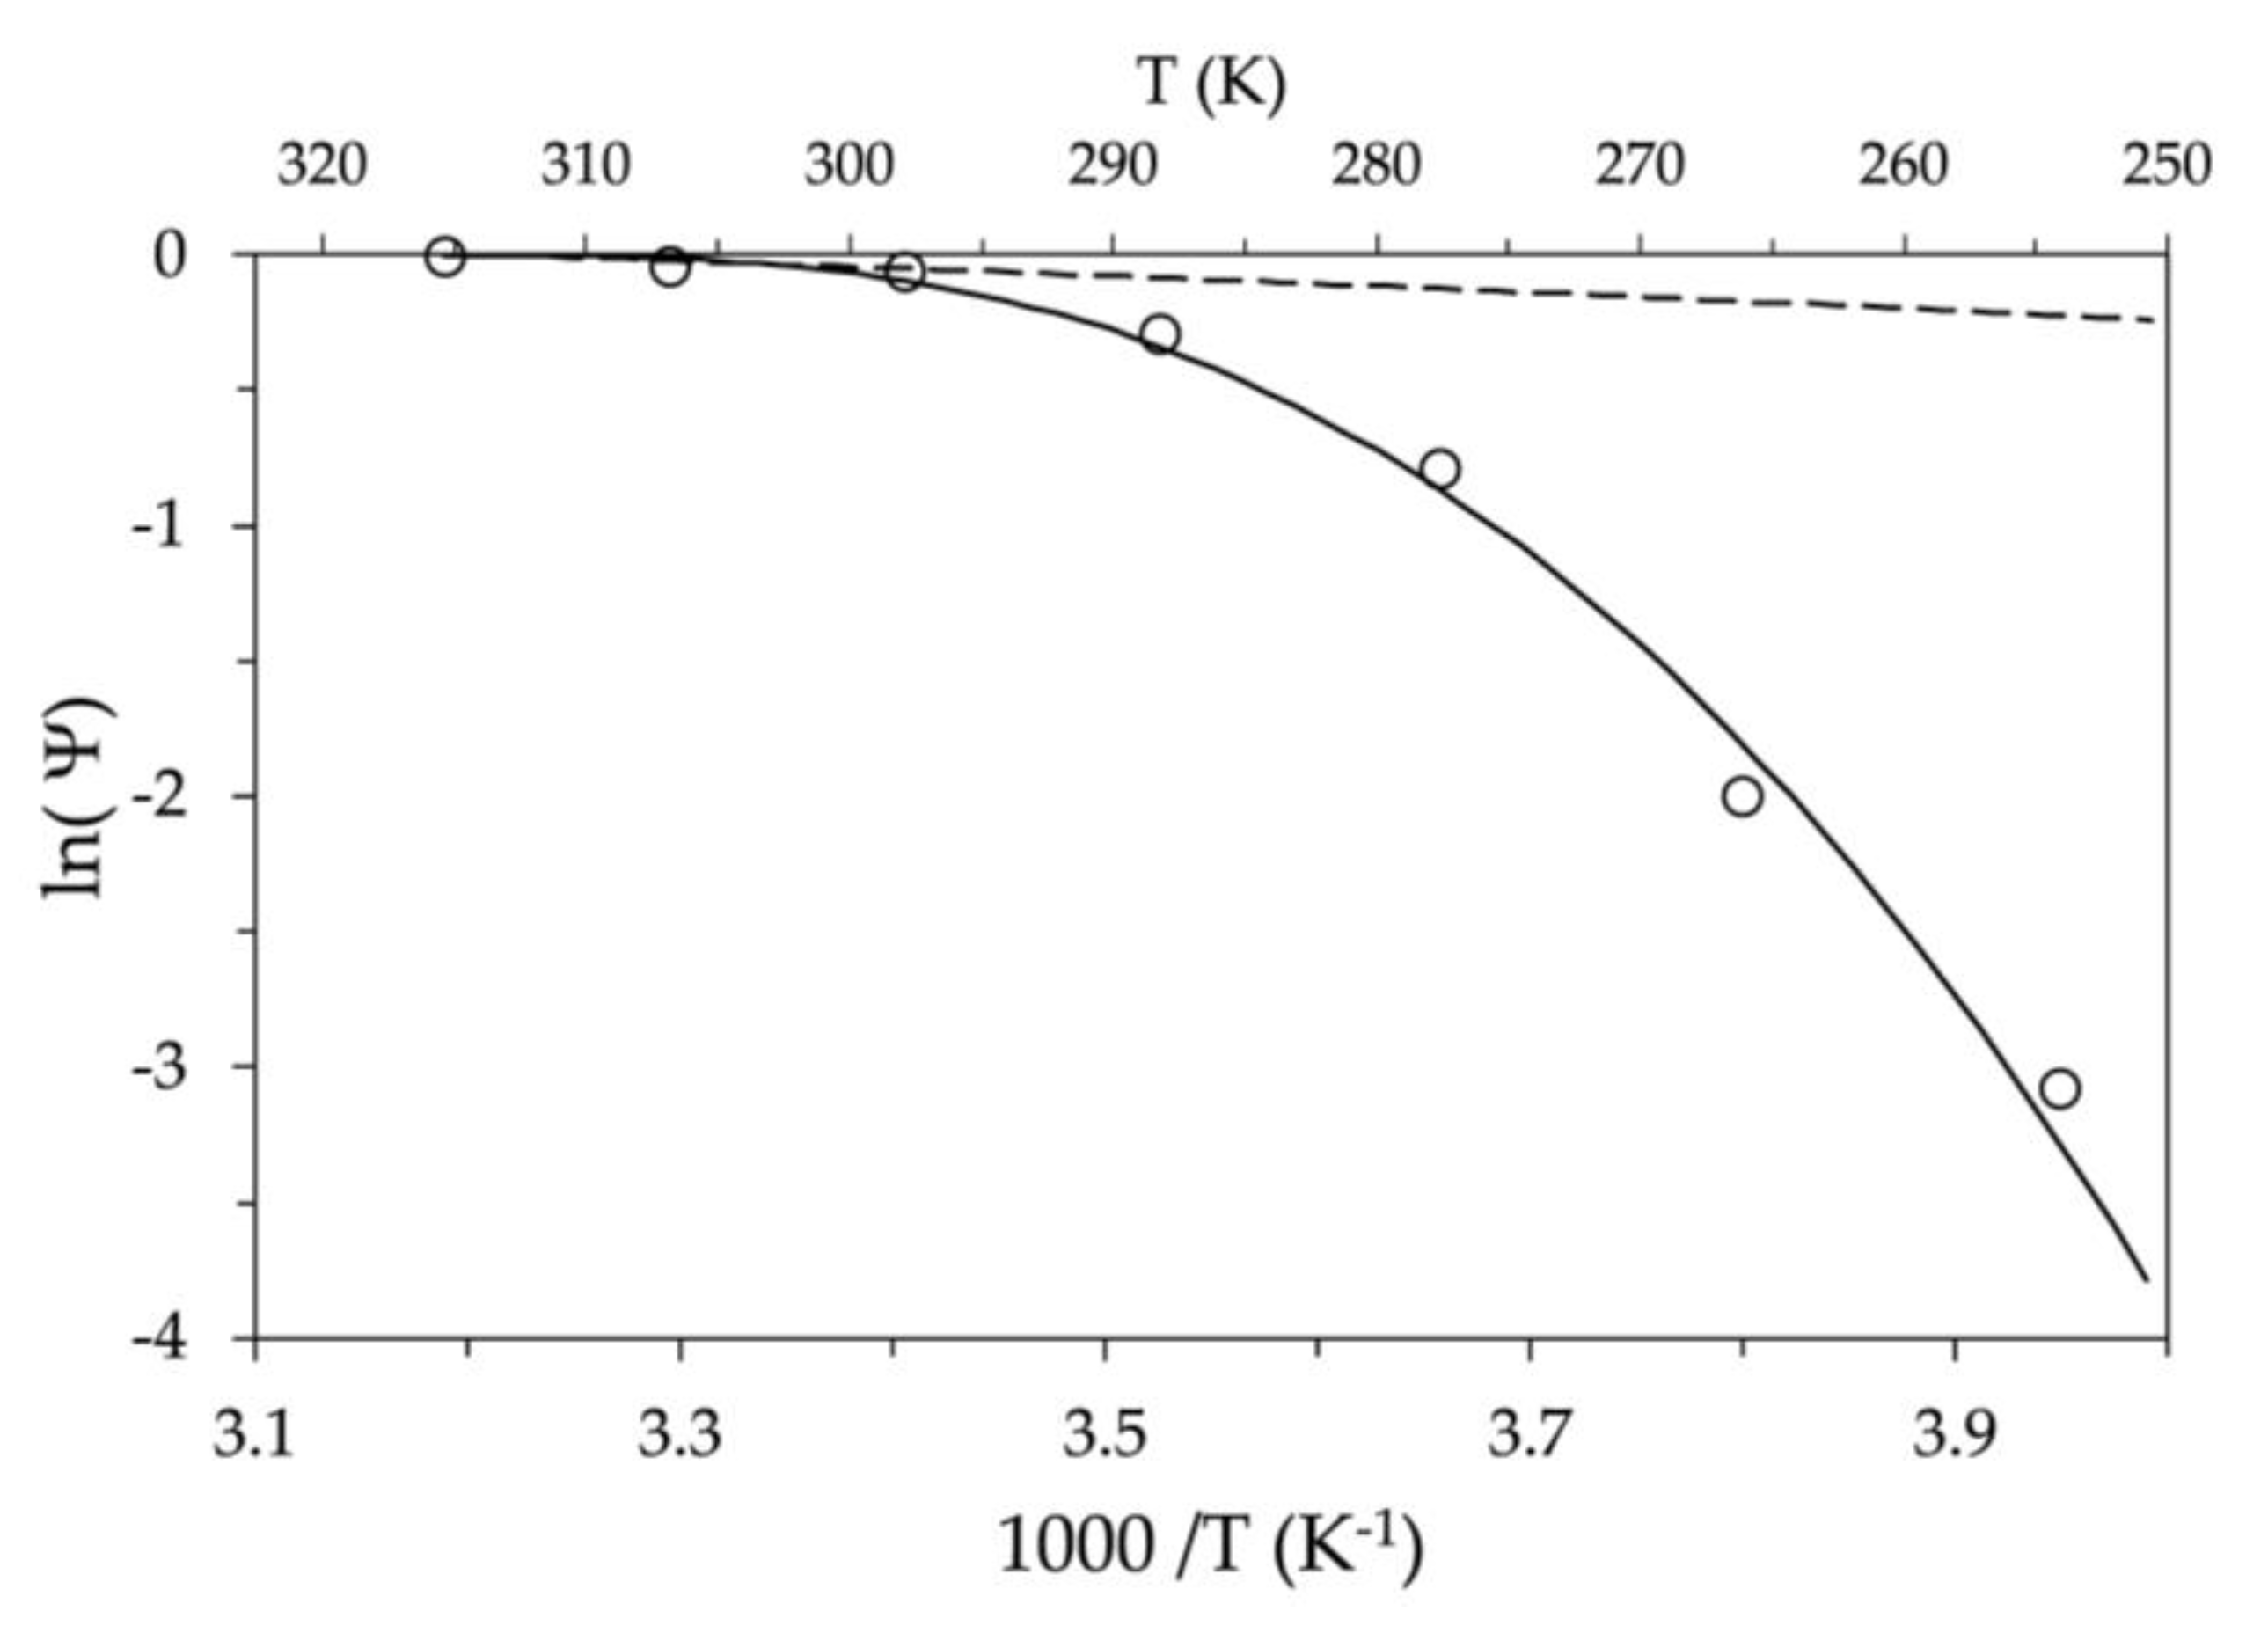
Figure 2.
Current and voltage time profiles for charging at room temperature. Negative relative time values refer to the constant current phase.
Figure 2.
Current and voltage time profiles for charging at room temperature. Negative relative time values refer to the constant current phase.
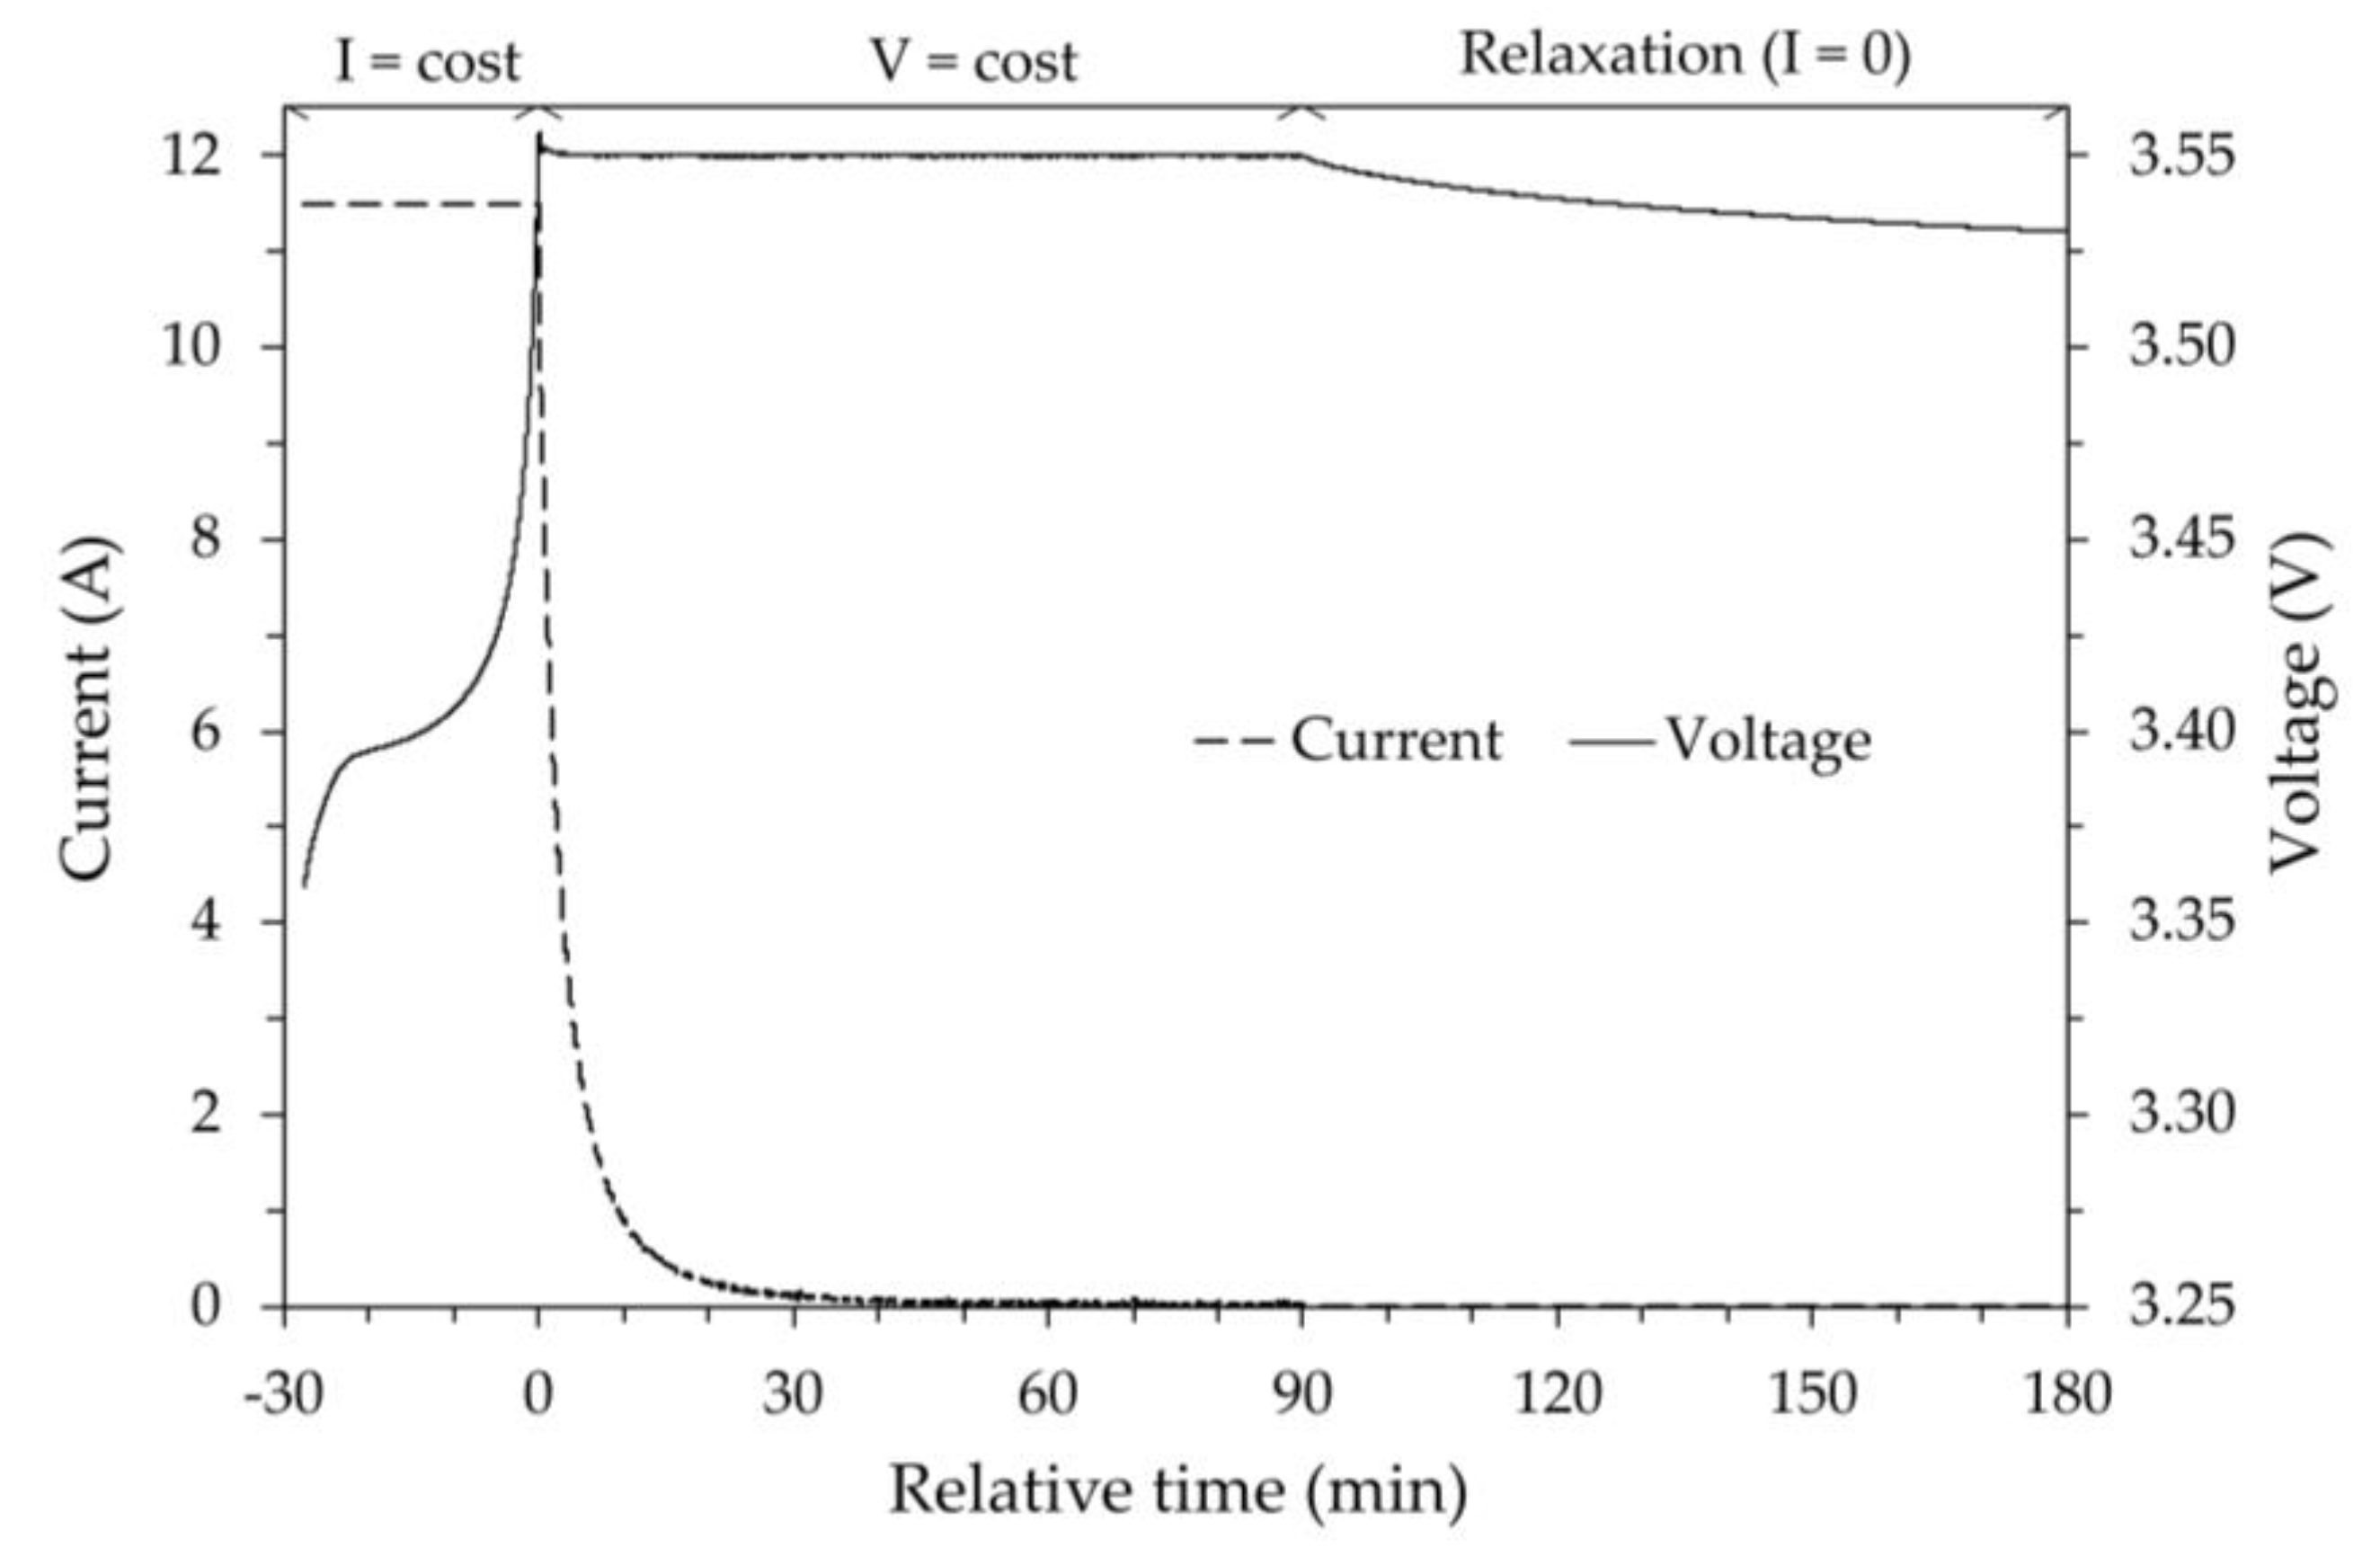
Figure 3.
Current and voltage as a function of relative time for the initial part of the discharge phase at room temperature. Negative values of the relative time refer to the relaxation period of the previous charging procedure.
Figure 3.
Current and voltage as a function of relative time for the initial part of the discharge phase at room temperature. Negative values of the relative time refer to the relaxation period of the previous charging procedure.
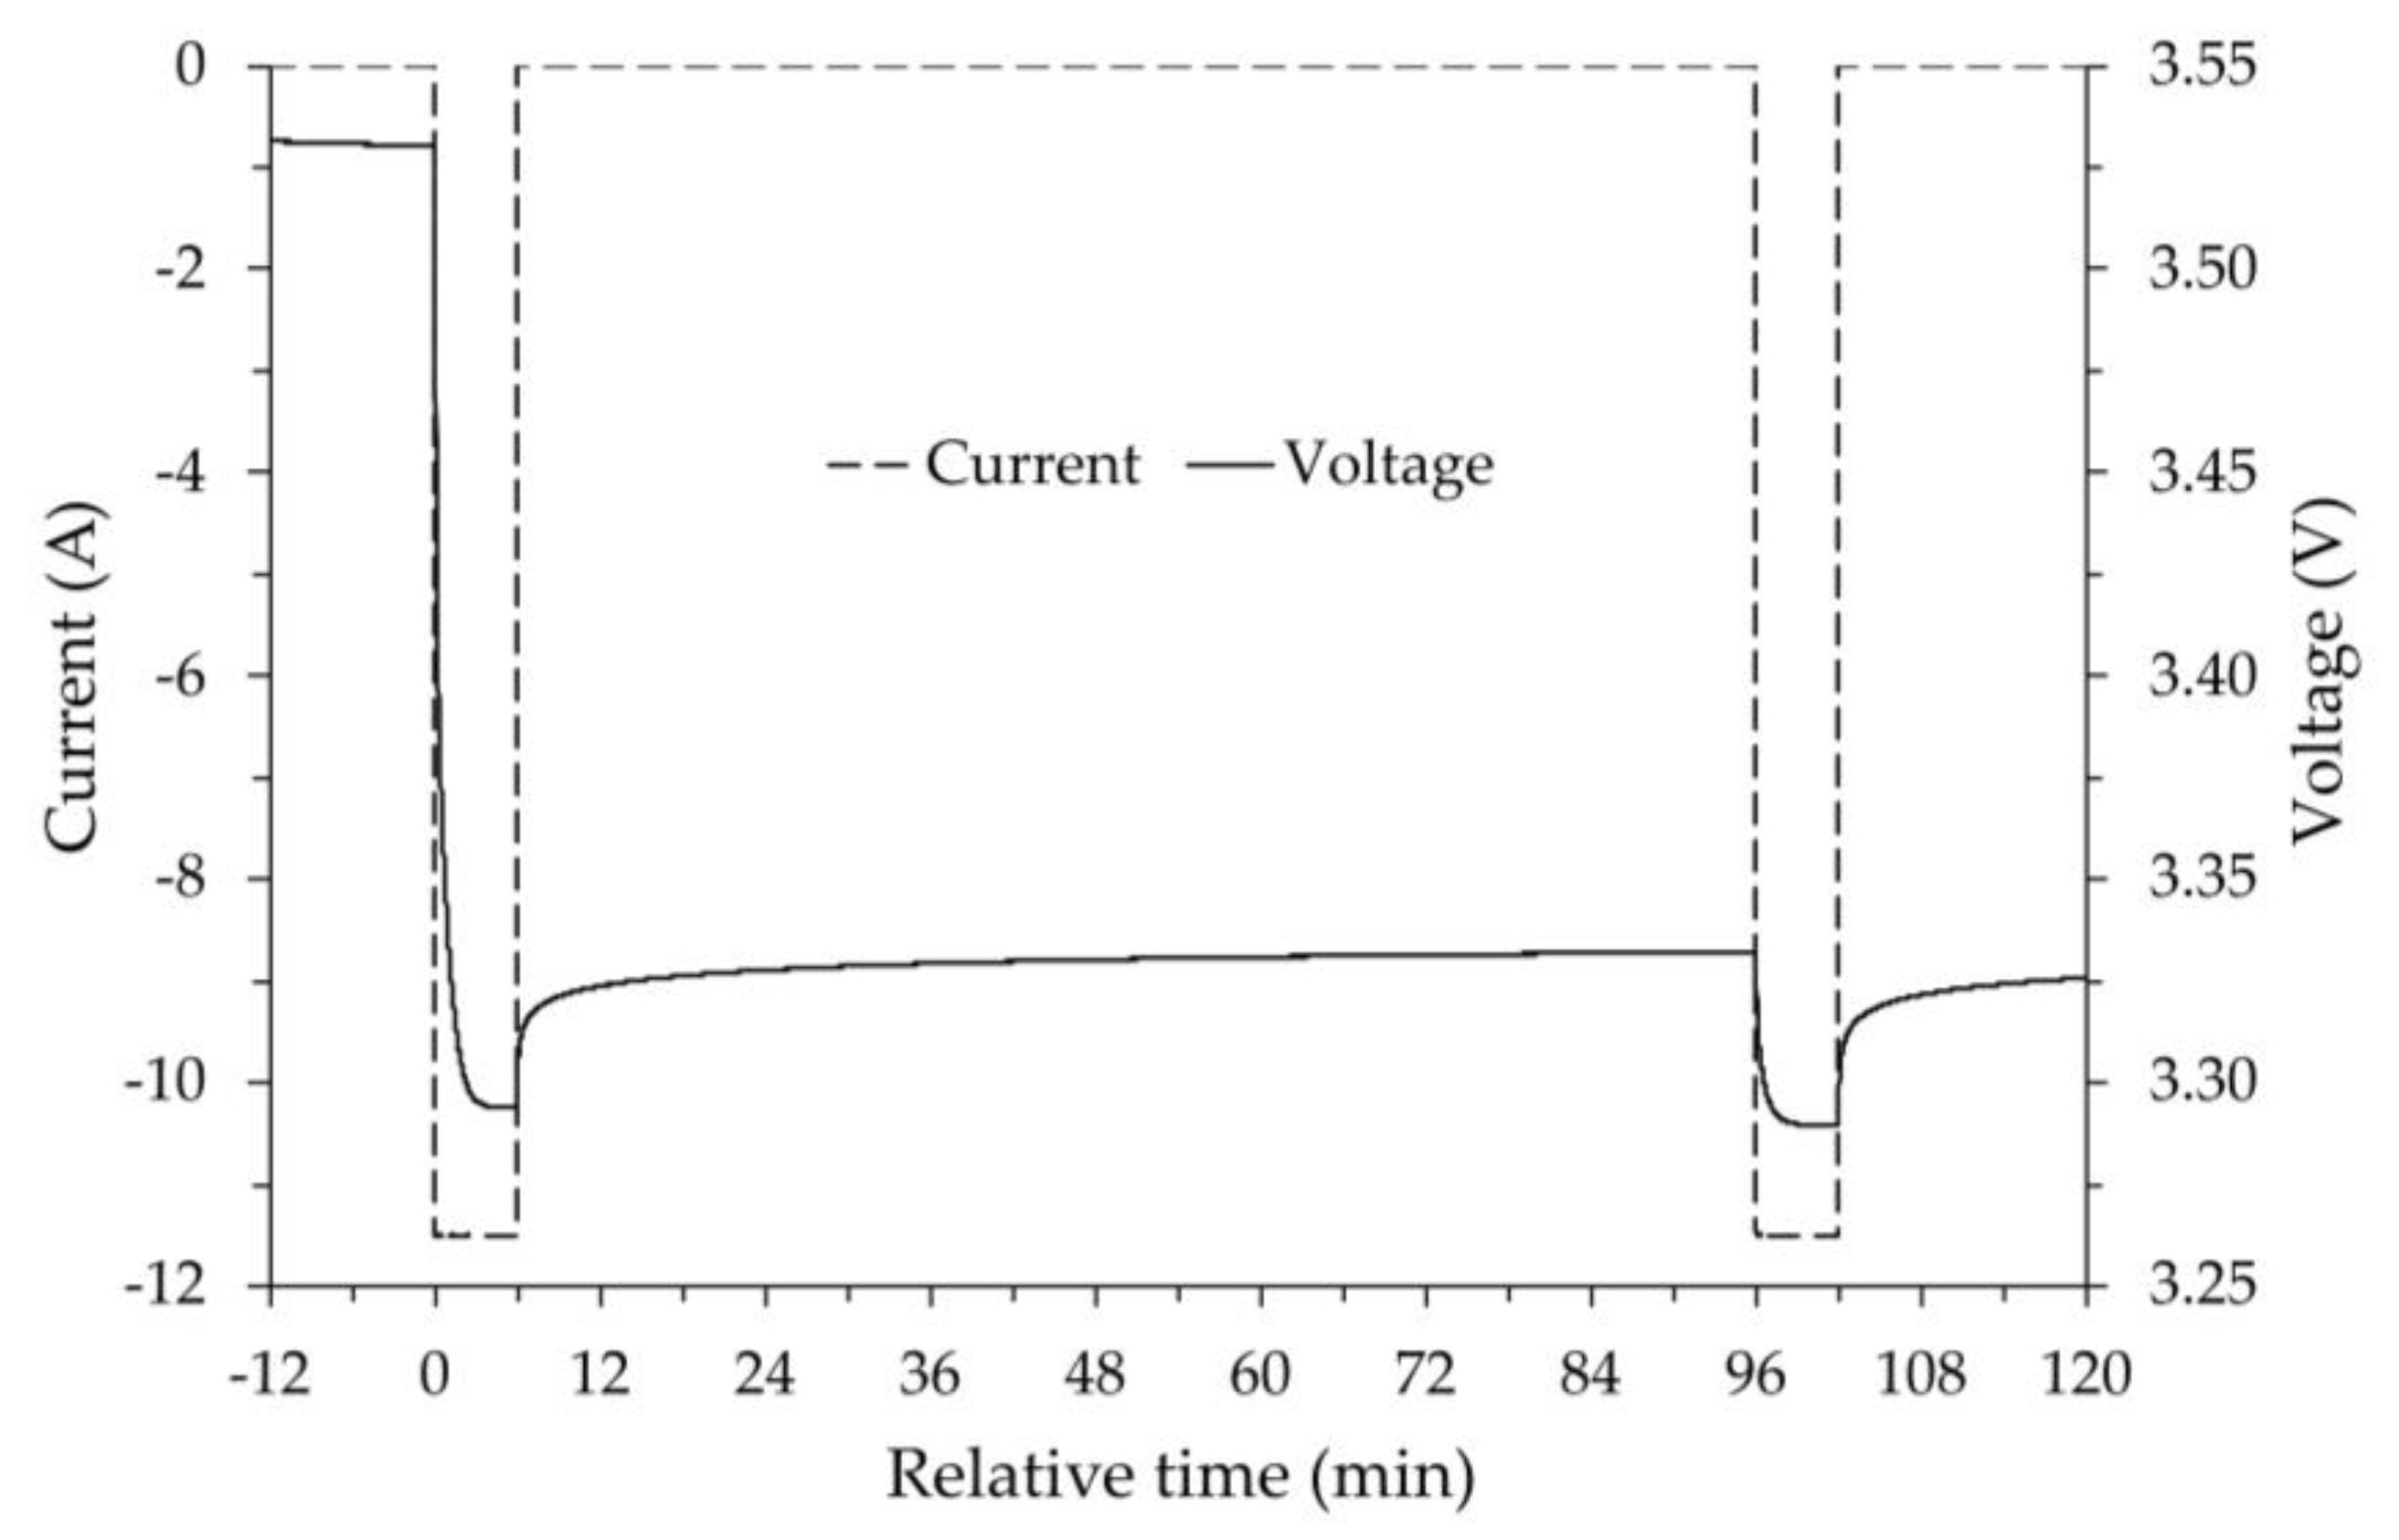
Figure 4.
Current and voltage vs relative time in the final part of discharging at room temperature. Negative values for the relative time refer to the relaxation period at SOC 10.1%.
Figure 4.
Current and voltage vs relative time in the final part of discharging at room temperature. Negative values for the relative time refer to the relaxation period at SOC 10.1%.
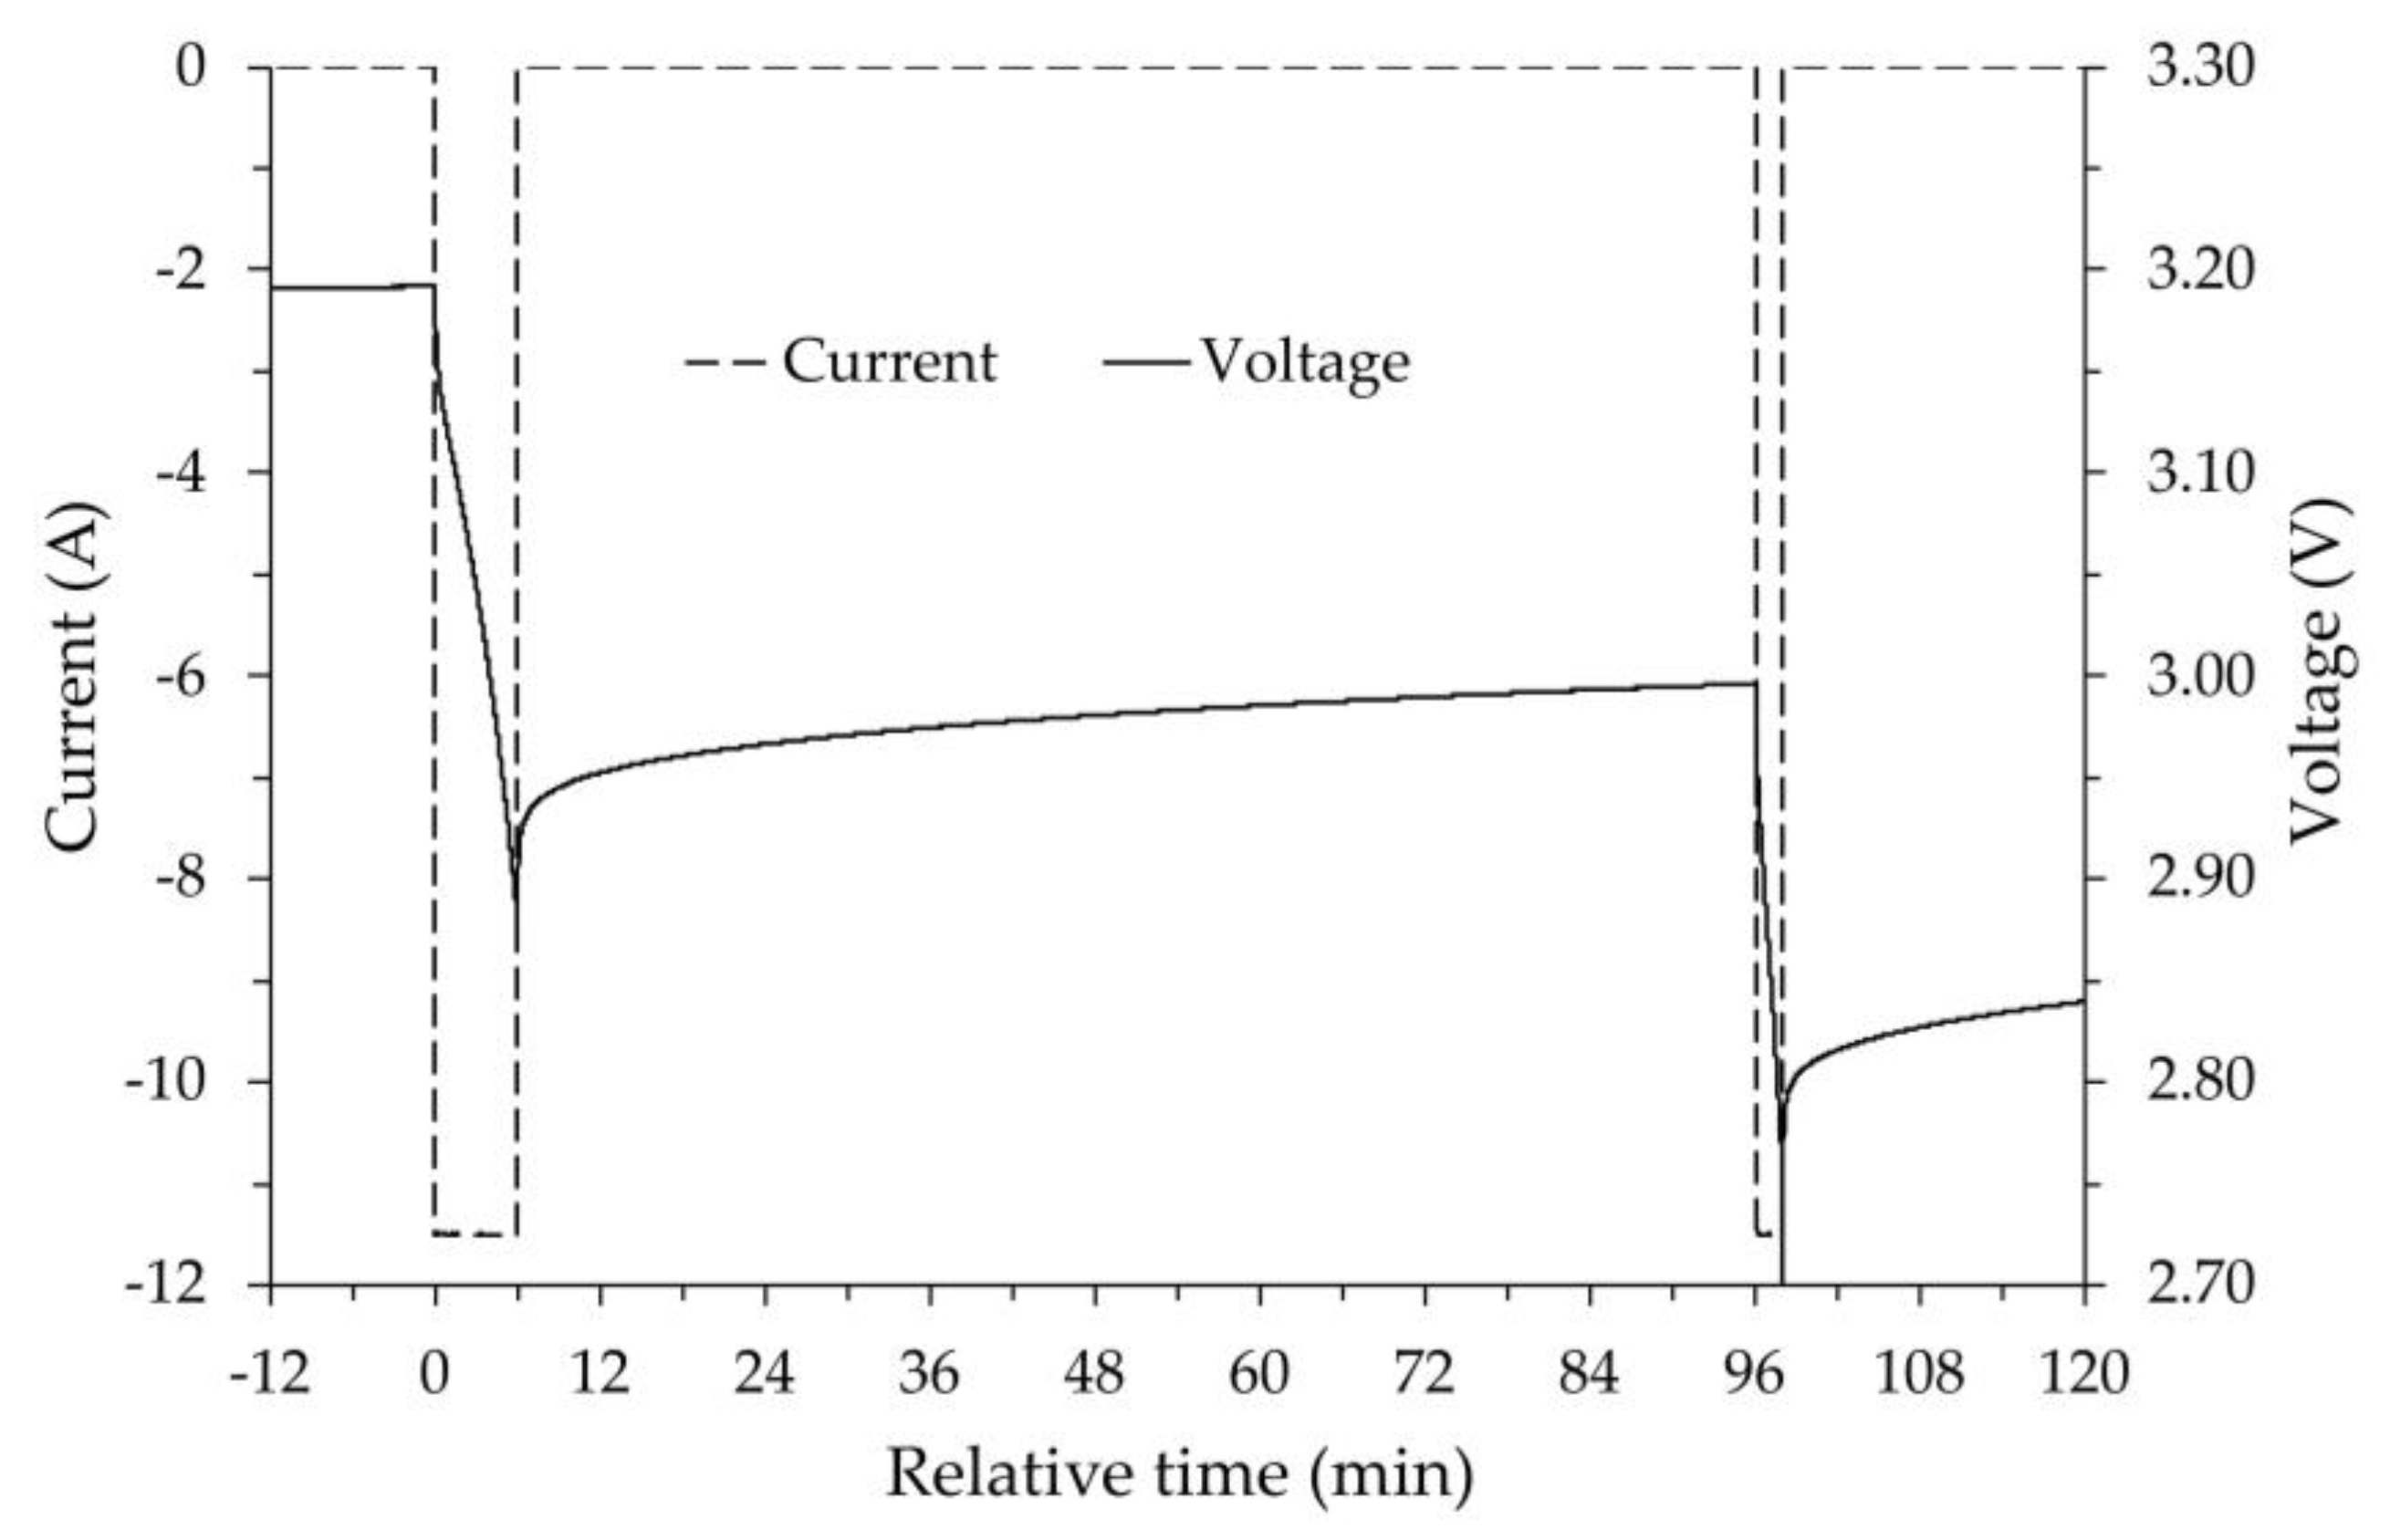
Figure 5.
Temperature vs time for the final part of the discharging process. Relative time zero is the same shown in Figure 4.
Figure 5.
Temperature vs time for the final part of the discharging process. Relative time zero is the same shown in Figure 4.
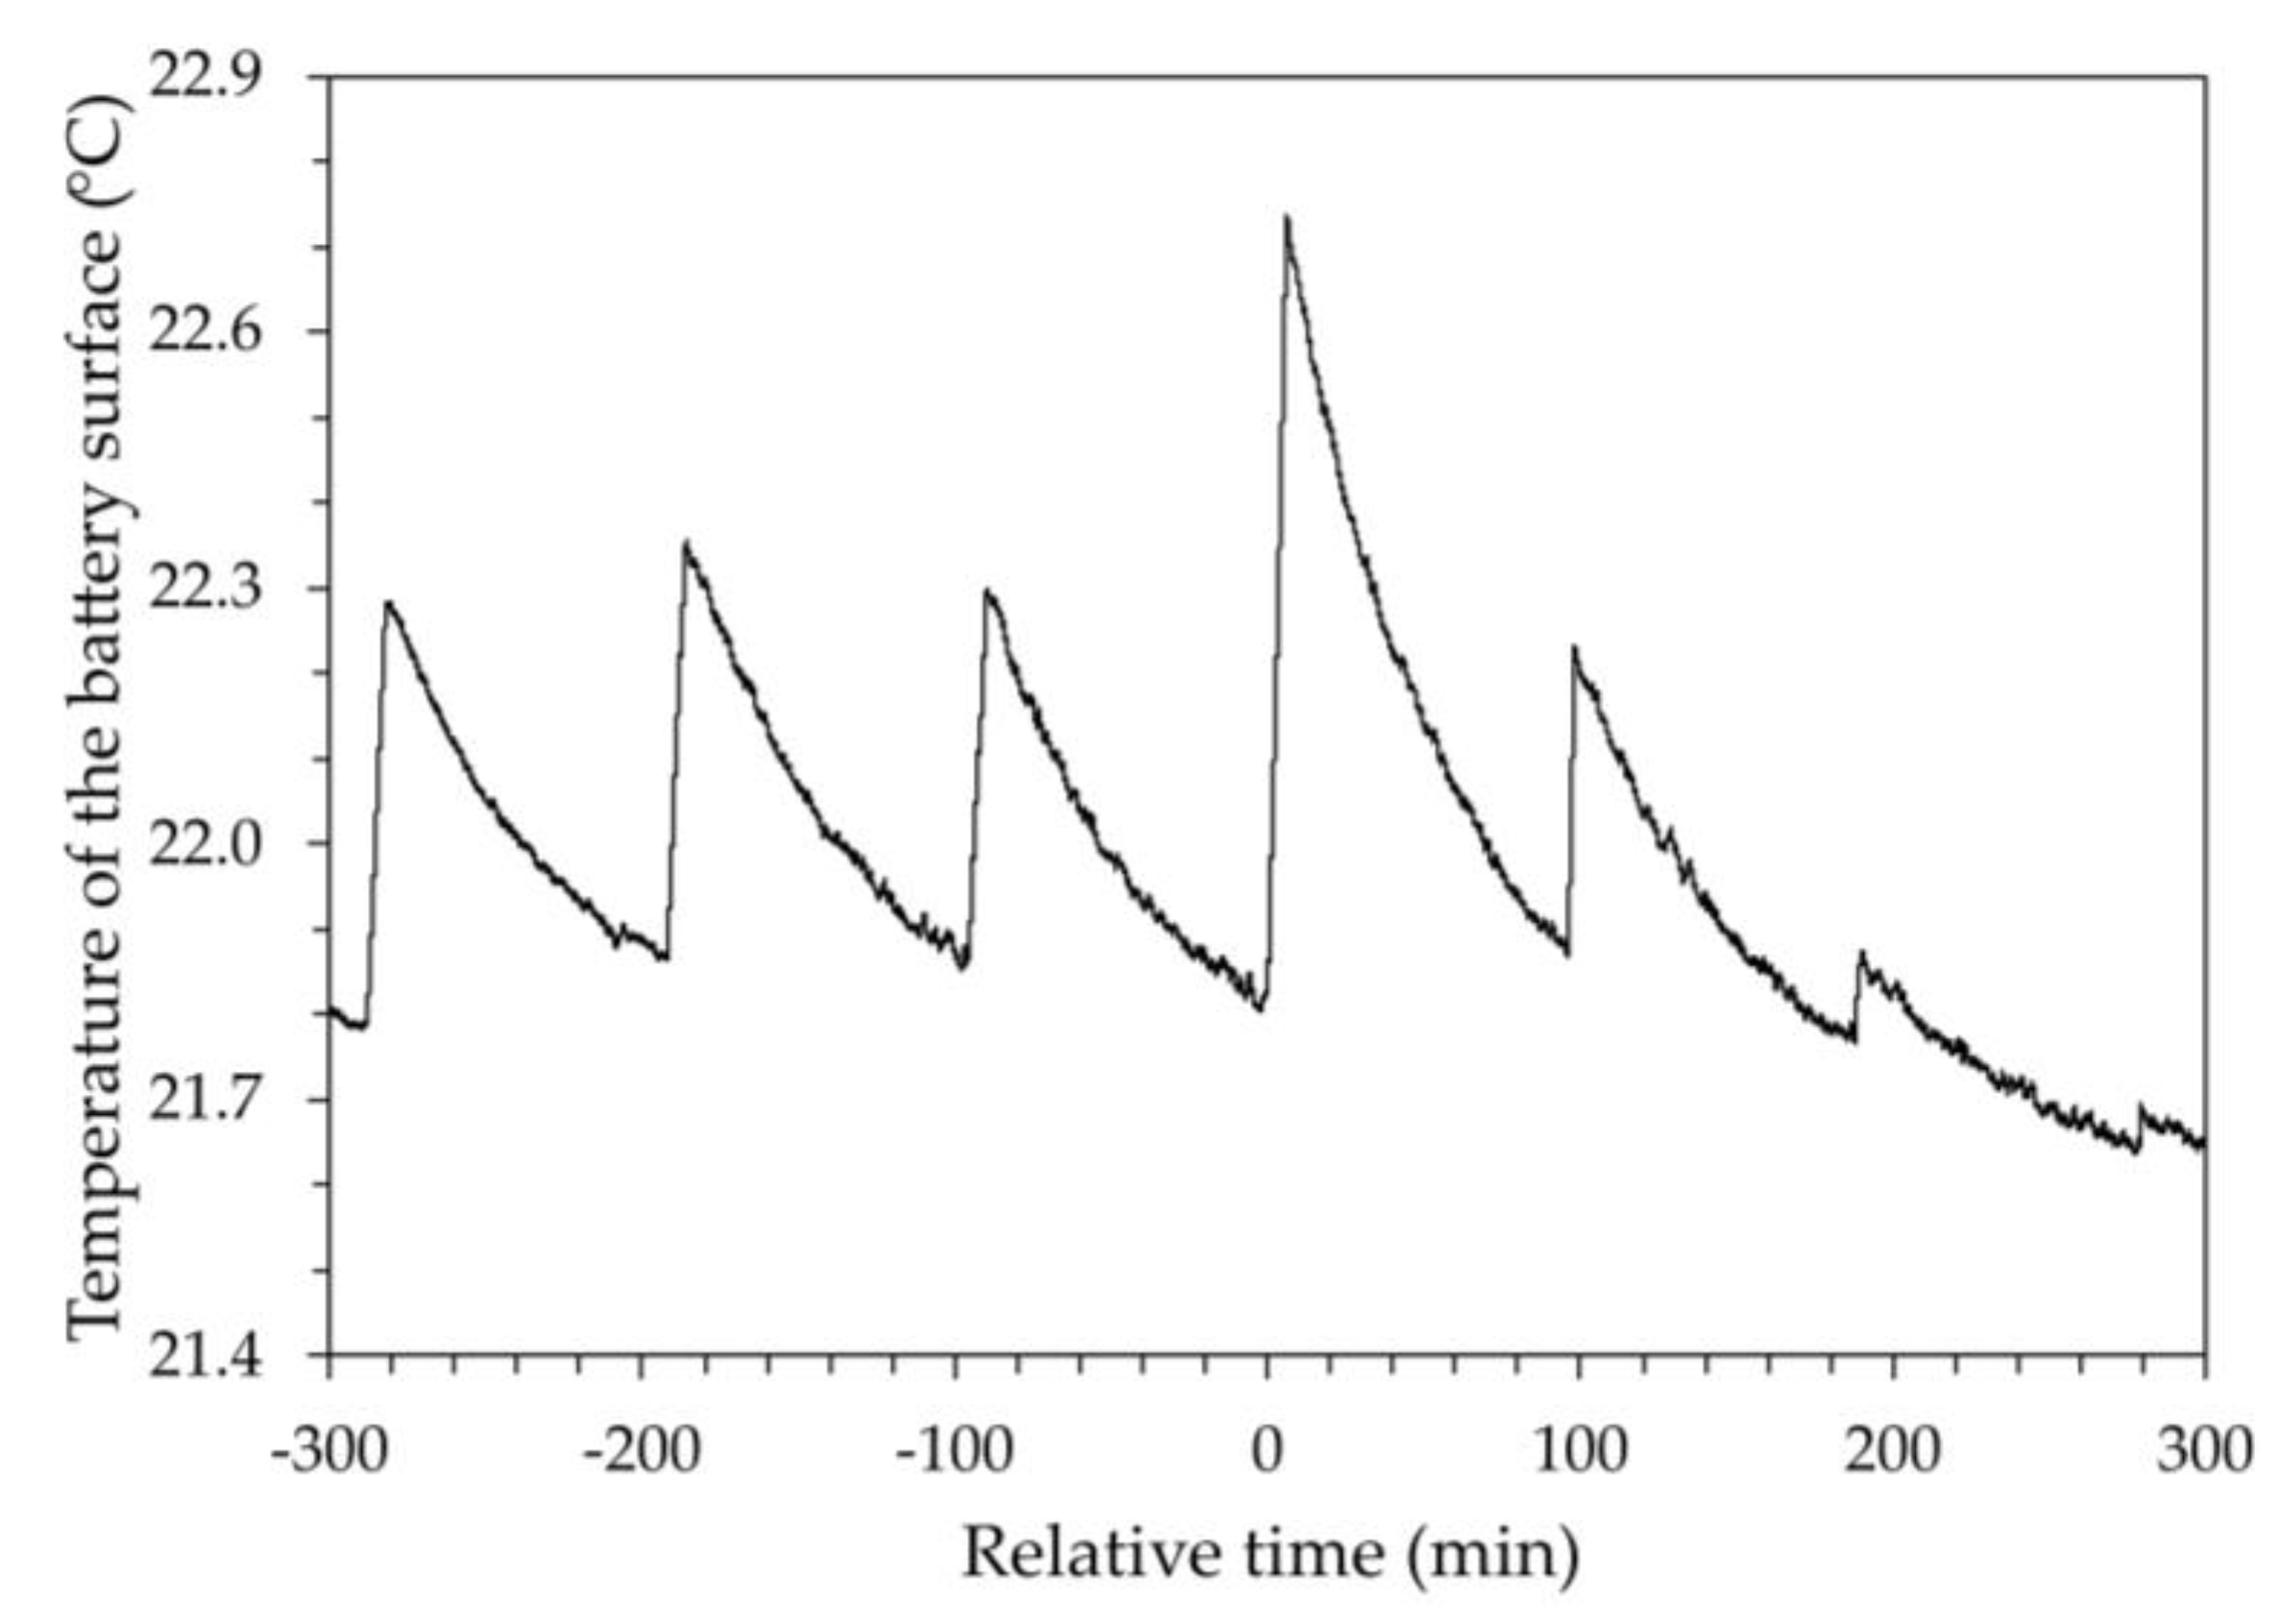
Figure 6.
Current and voltage vs time for the initial part of charging at room temperature. Negative values for the relative time refer to the end of the relaxation period after the discharge.
Figure 6.
Current and voltage vs time for the initial part of charging at room temperature. Negative values for the relative time refer to the end of the relaxation period after the discharge.
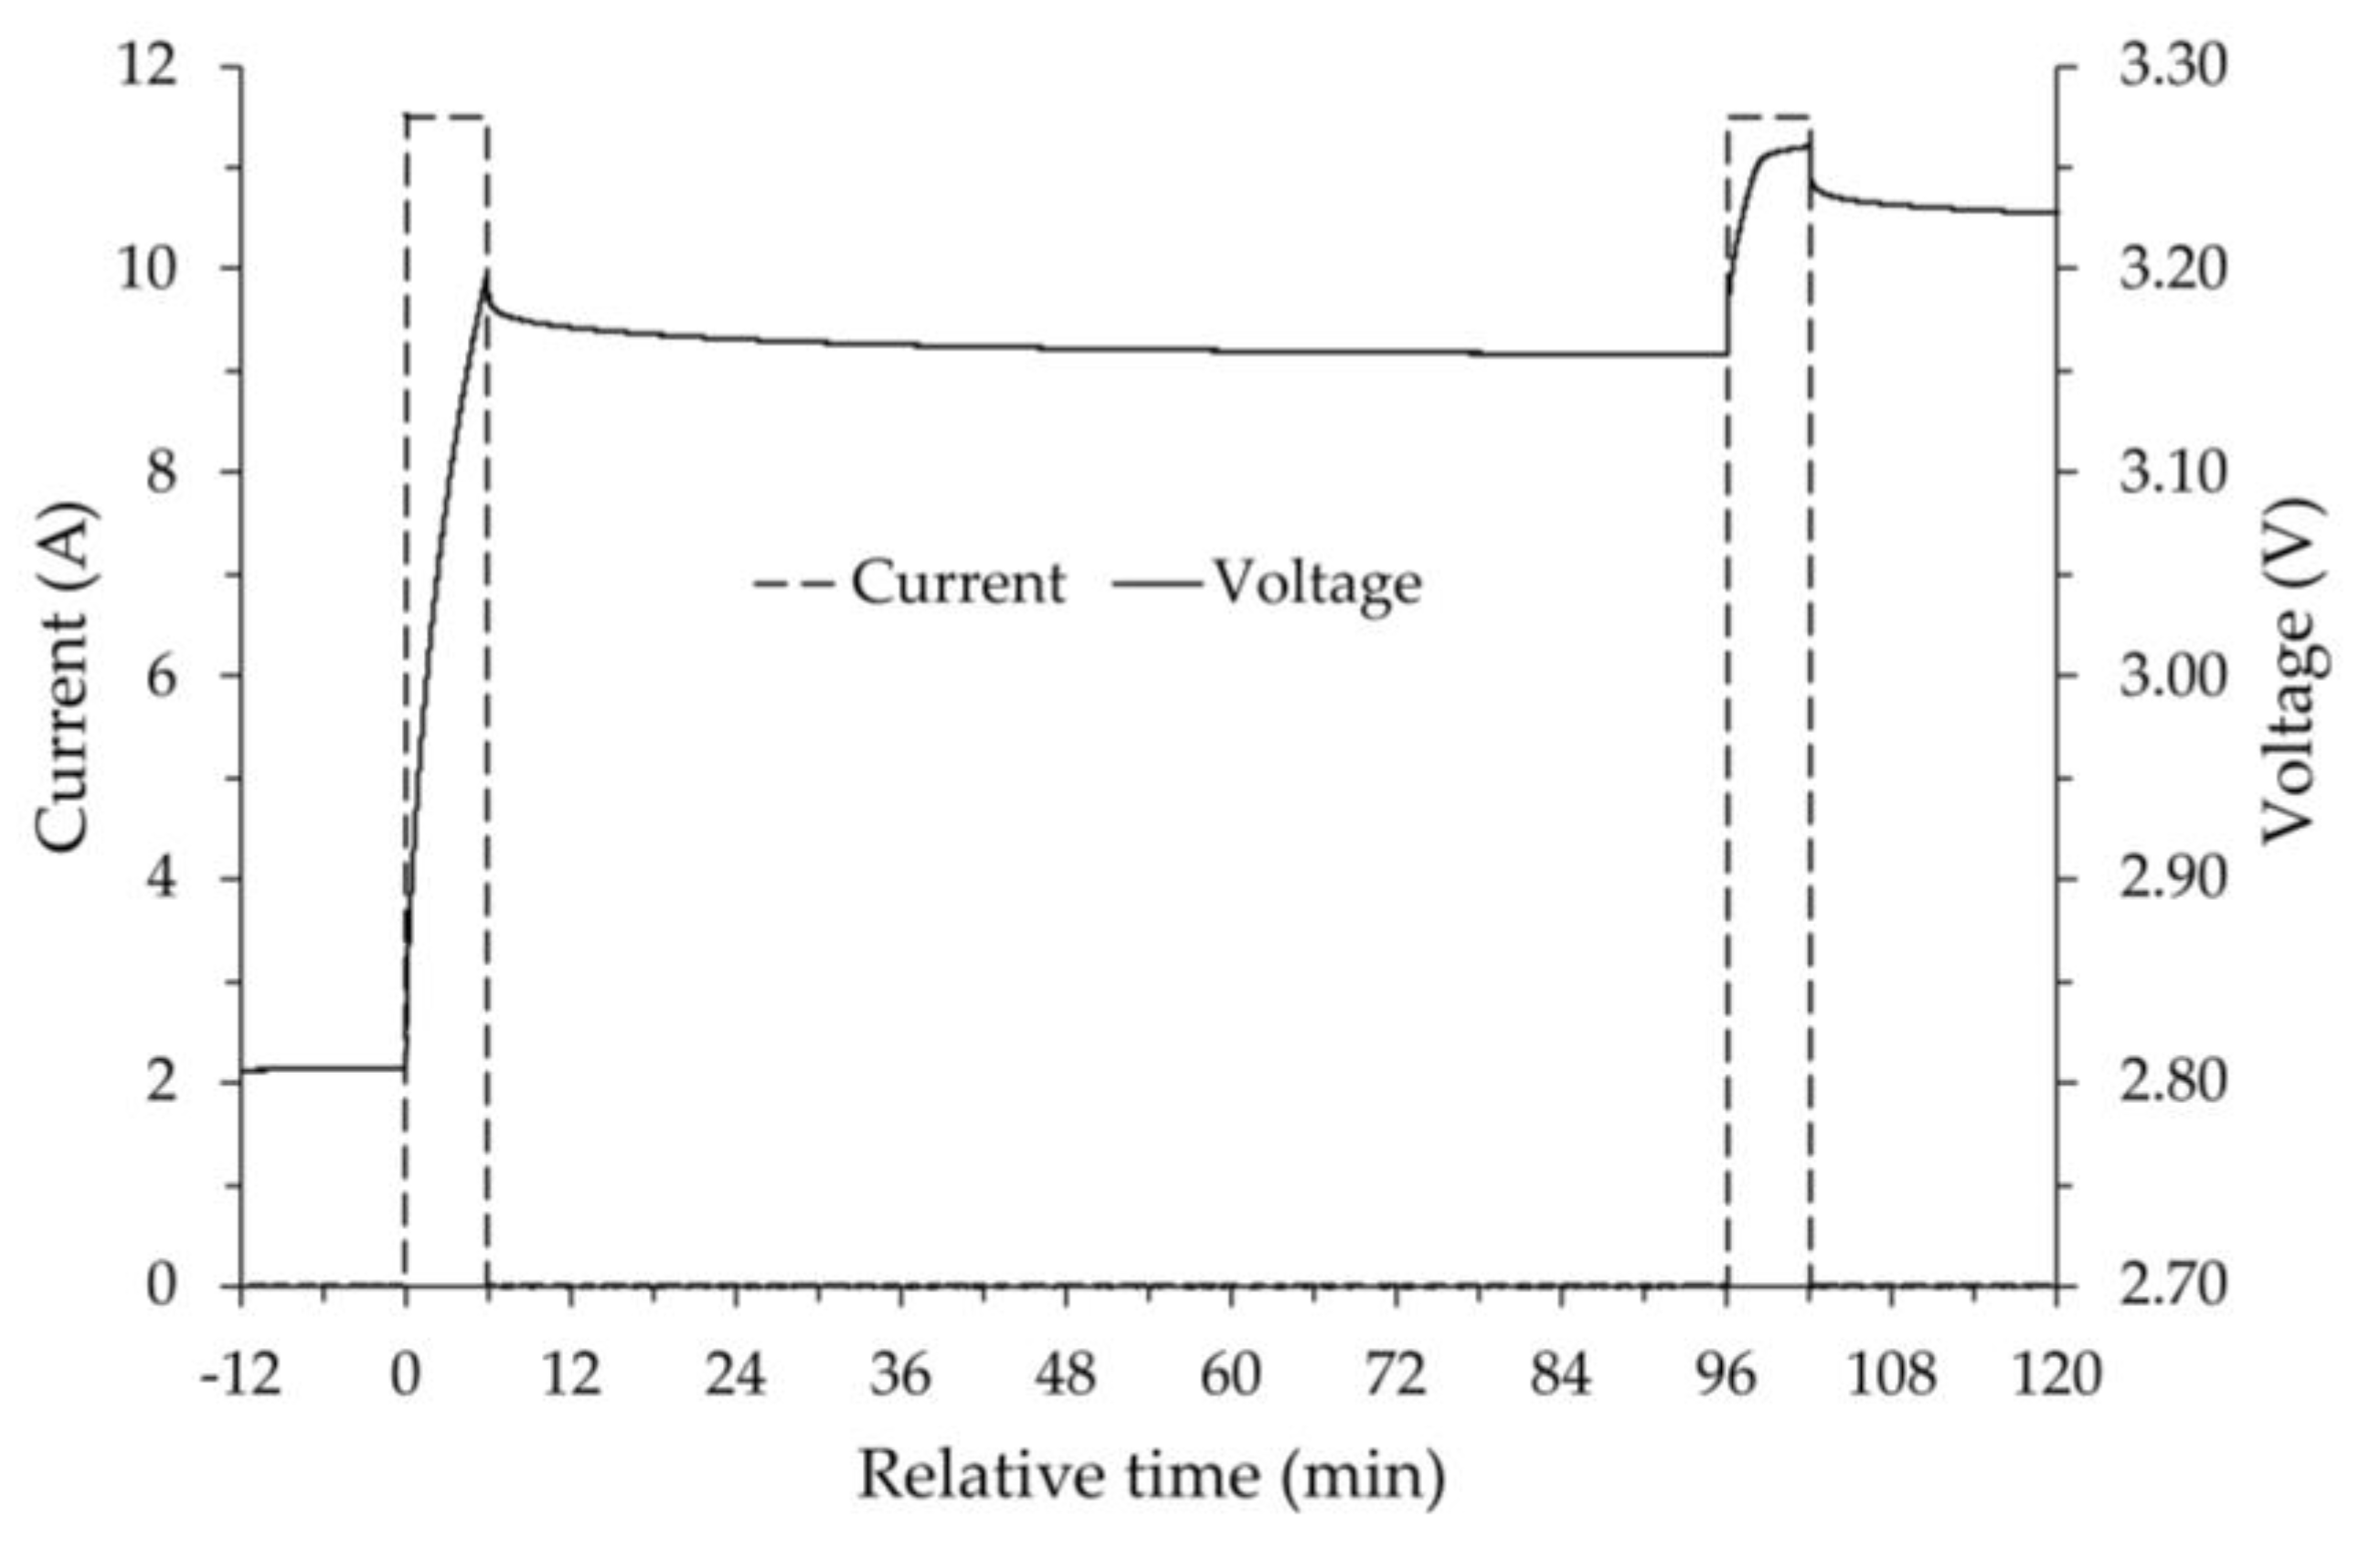
Figure 7.
Current and voltage vs time for the final part of charging at room temperature. Negative values for the relative time refer to the relaxation period at SOC 92.9%.
Figure 7.
Current and voltage vs time for the final part of charging at room temperature. Negative values for the relative time refer to the relaxation period at SOC 92.9%.
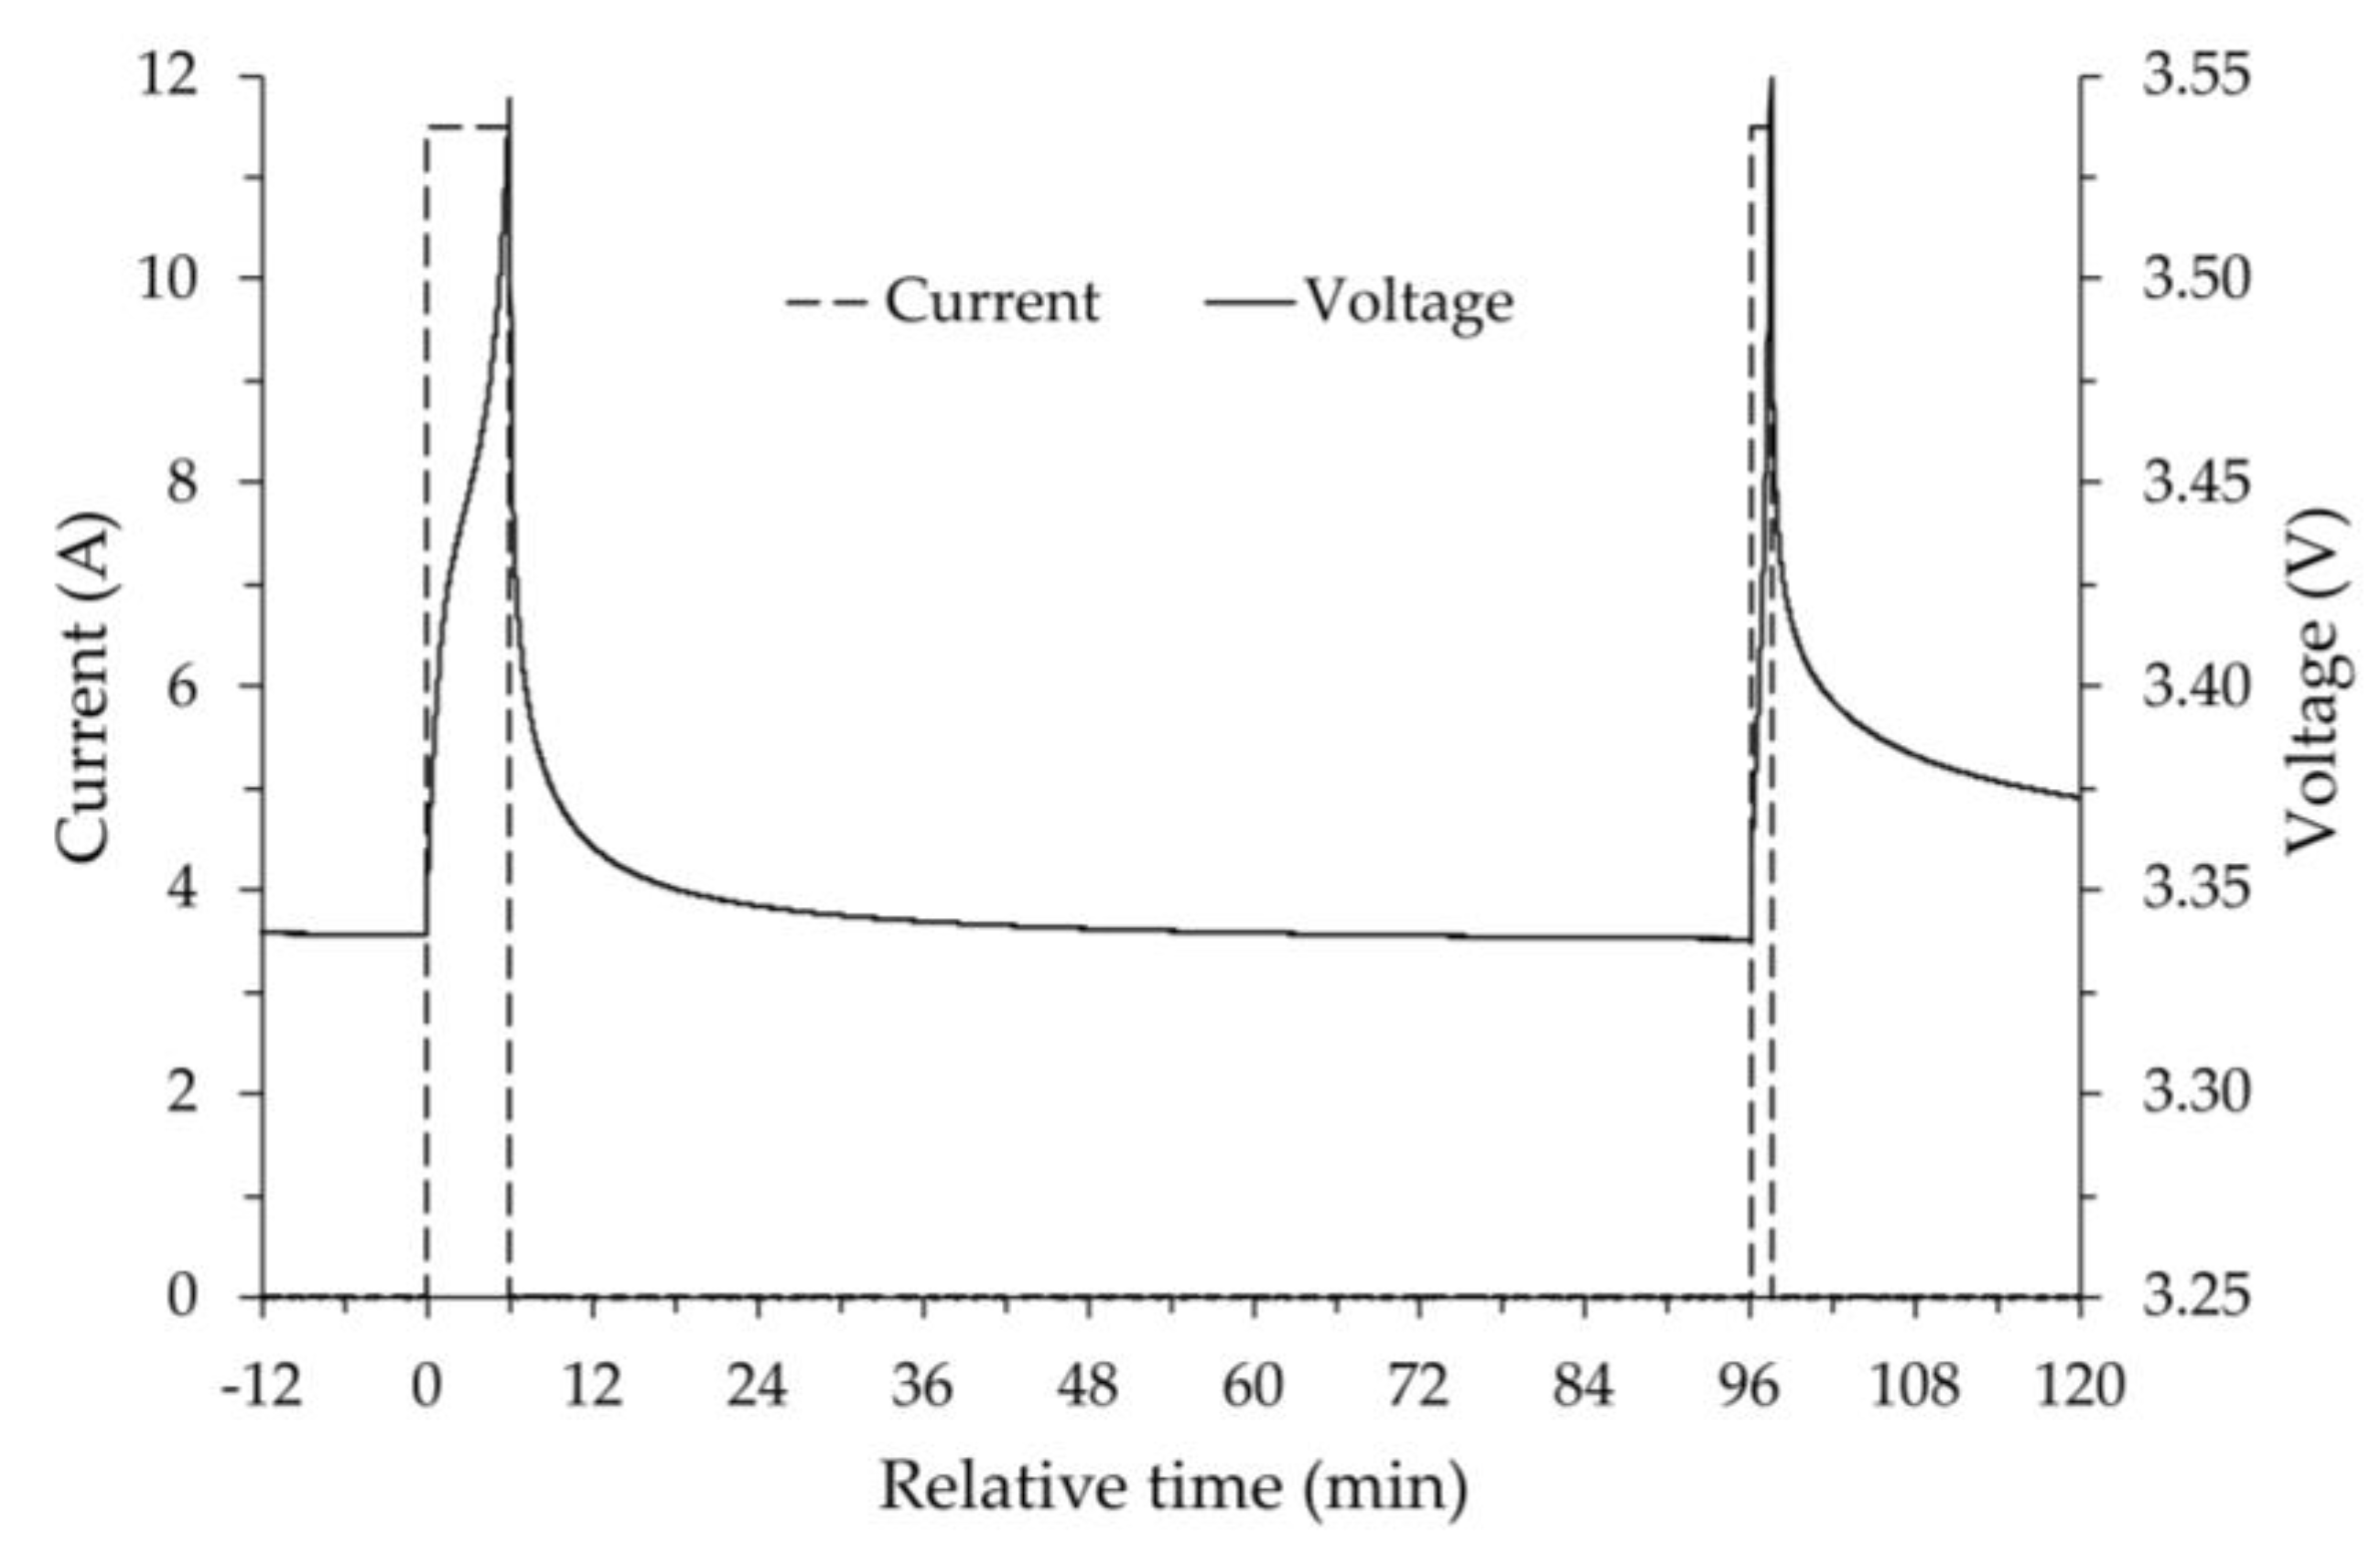
Figure 8.
Open circuit voltage vs state of charge at the calculated average battery temperature of 22.0 °C. Error bars are 1%.
Figure 8.
Open circuit voltage vs state of charge at the calculated average battery temperature of 22.0 °C. Error bars are 1%.
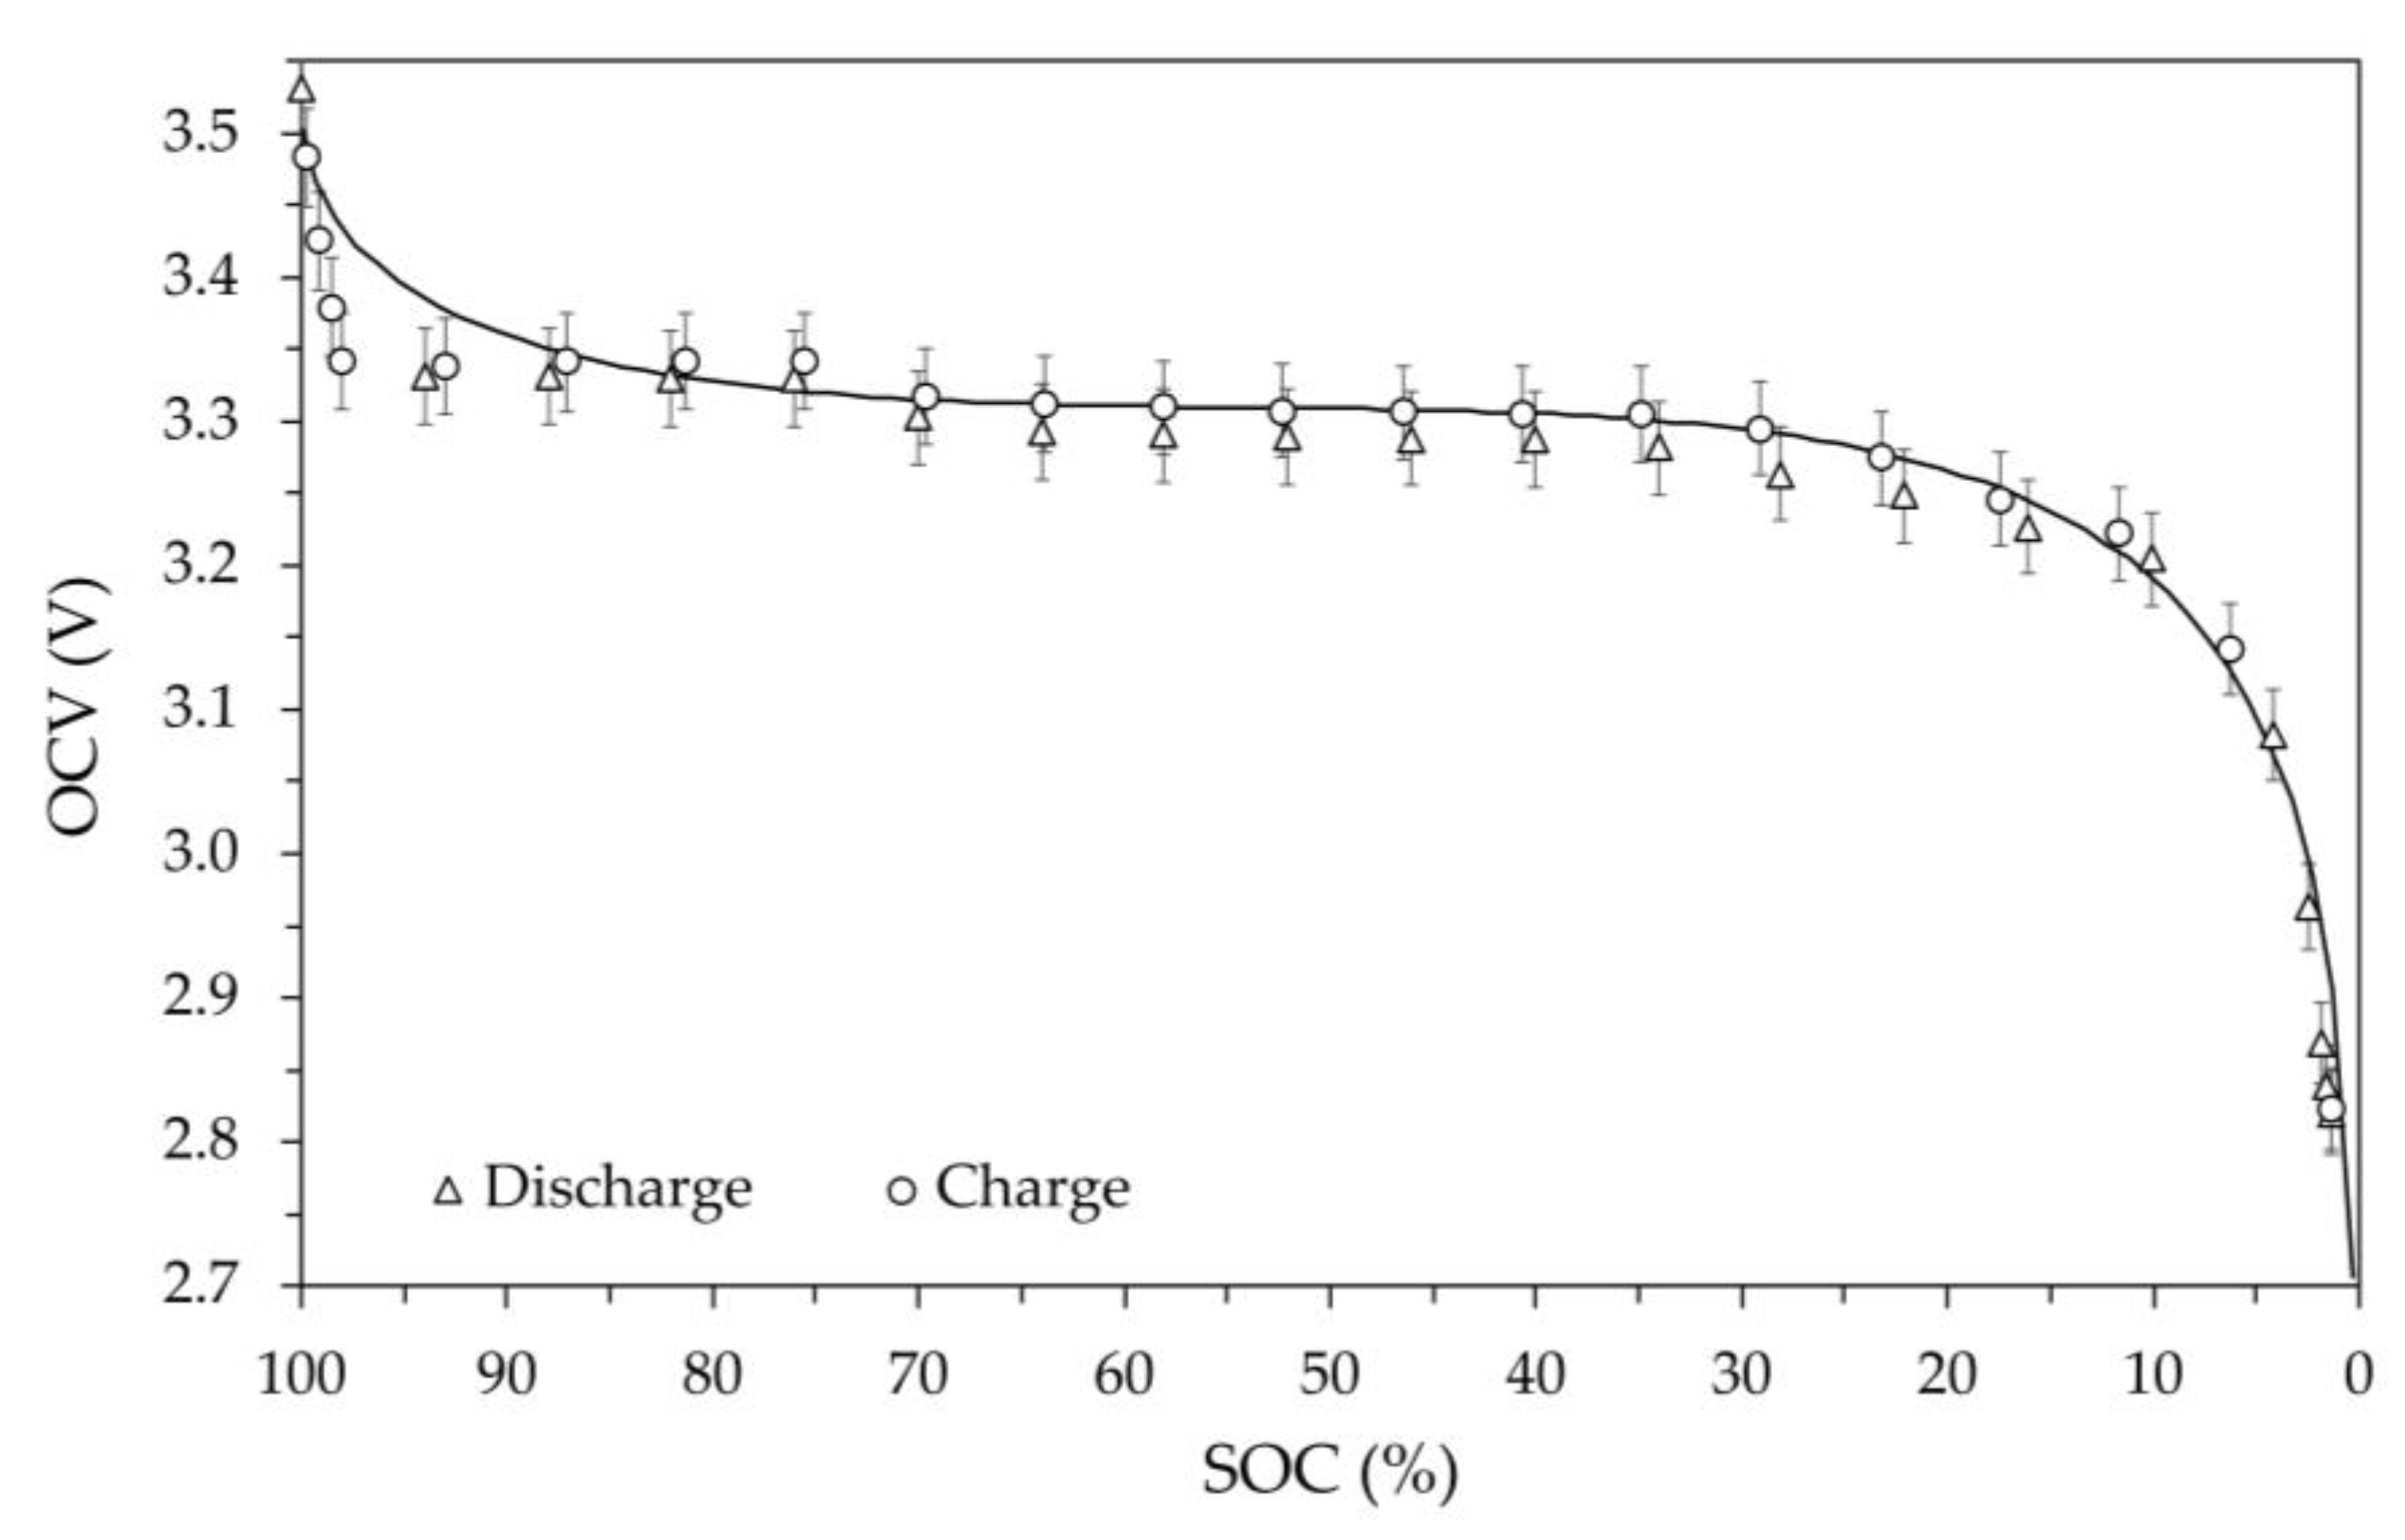
Figure 9.
OCV vs SOC at the average battery temperature of 2.0 °C. Error bars are 1%.

Figure 10.
OCV vs SOC at the average battery temperature of -9.1 °C. Error bars are 1%.
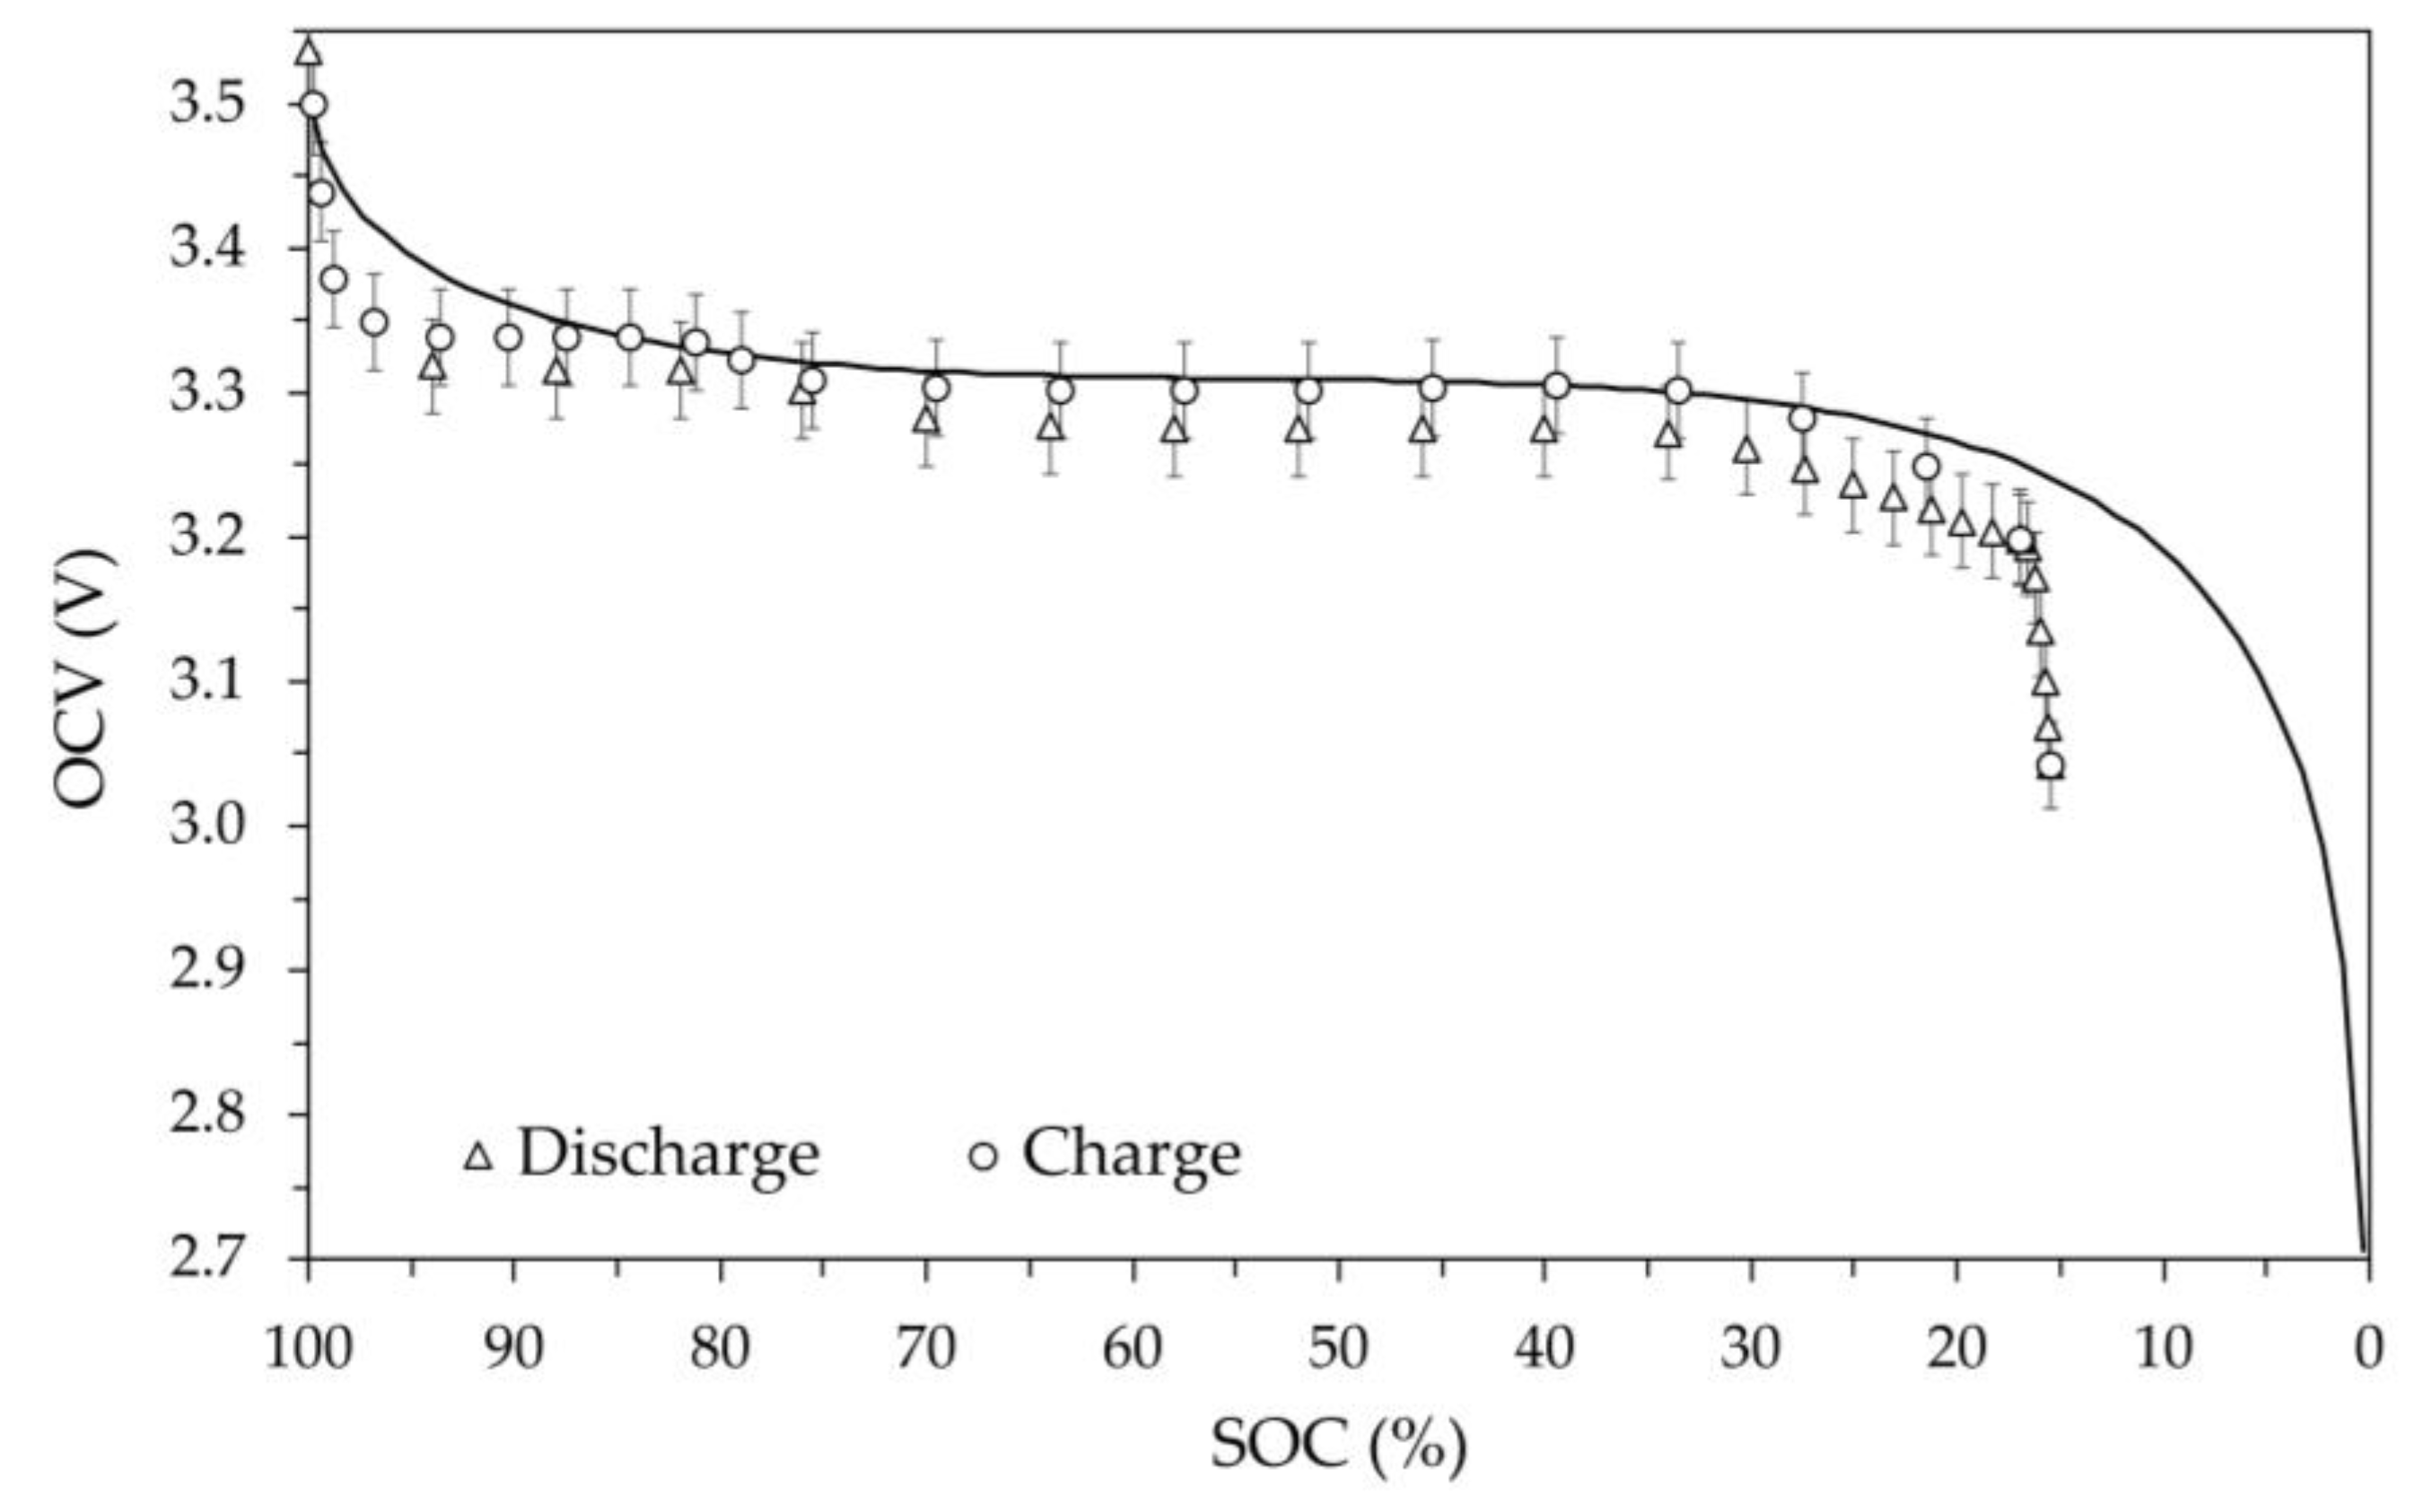
Figure 11.
OCV vs SOC at the average battery temperature of -19.7 °C. Error bars are 1%.
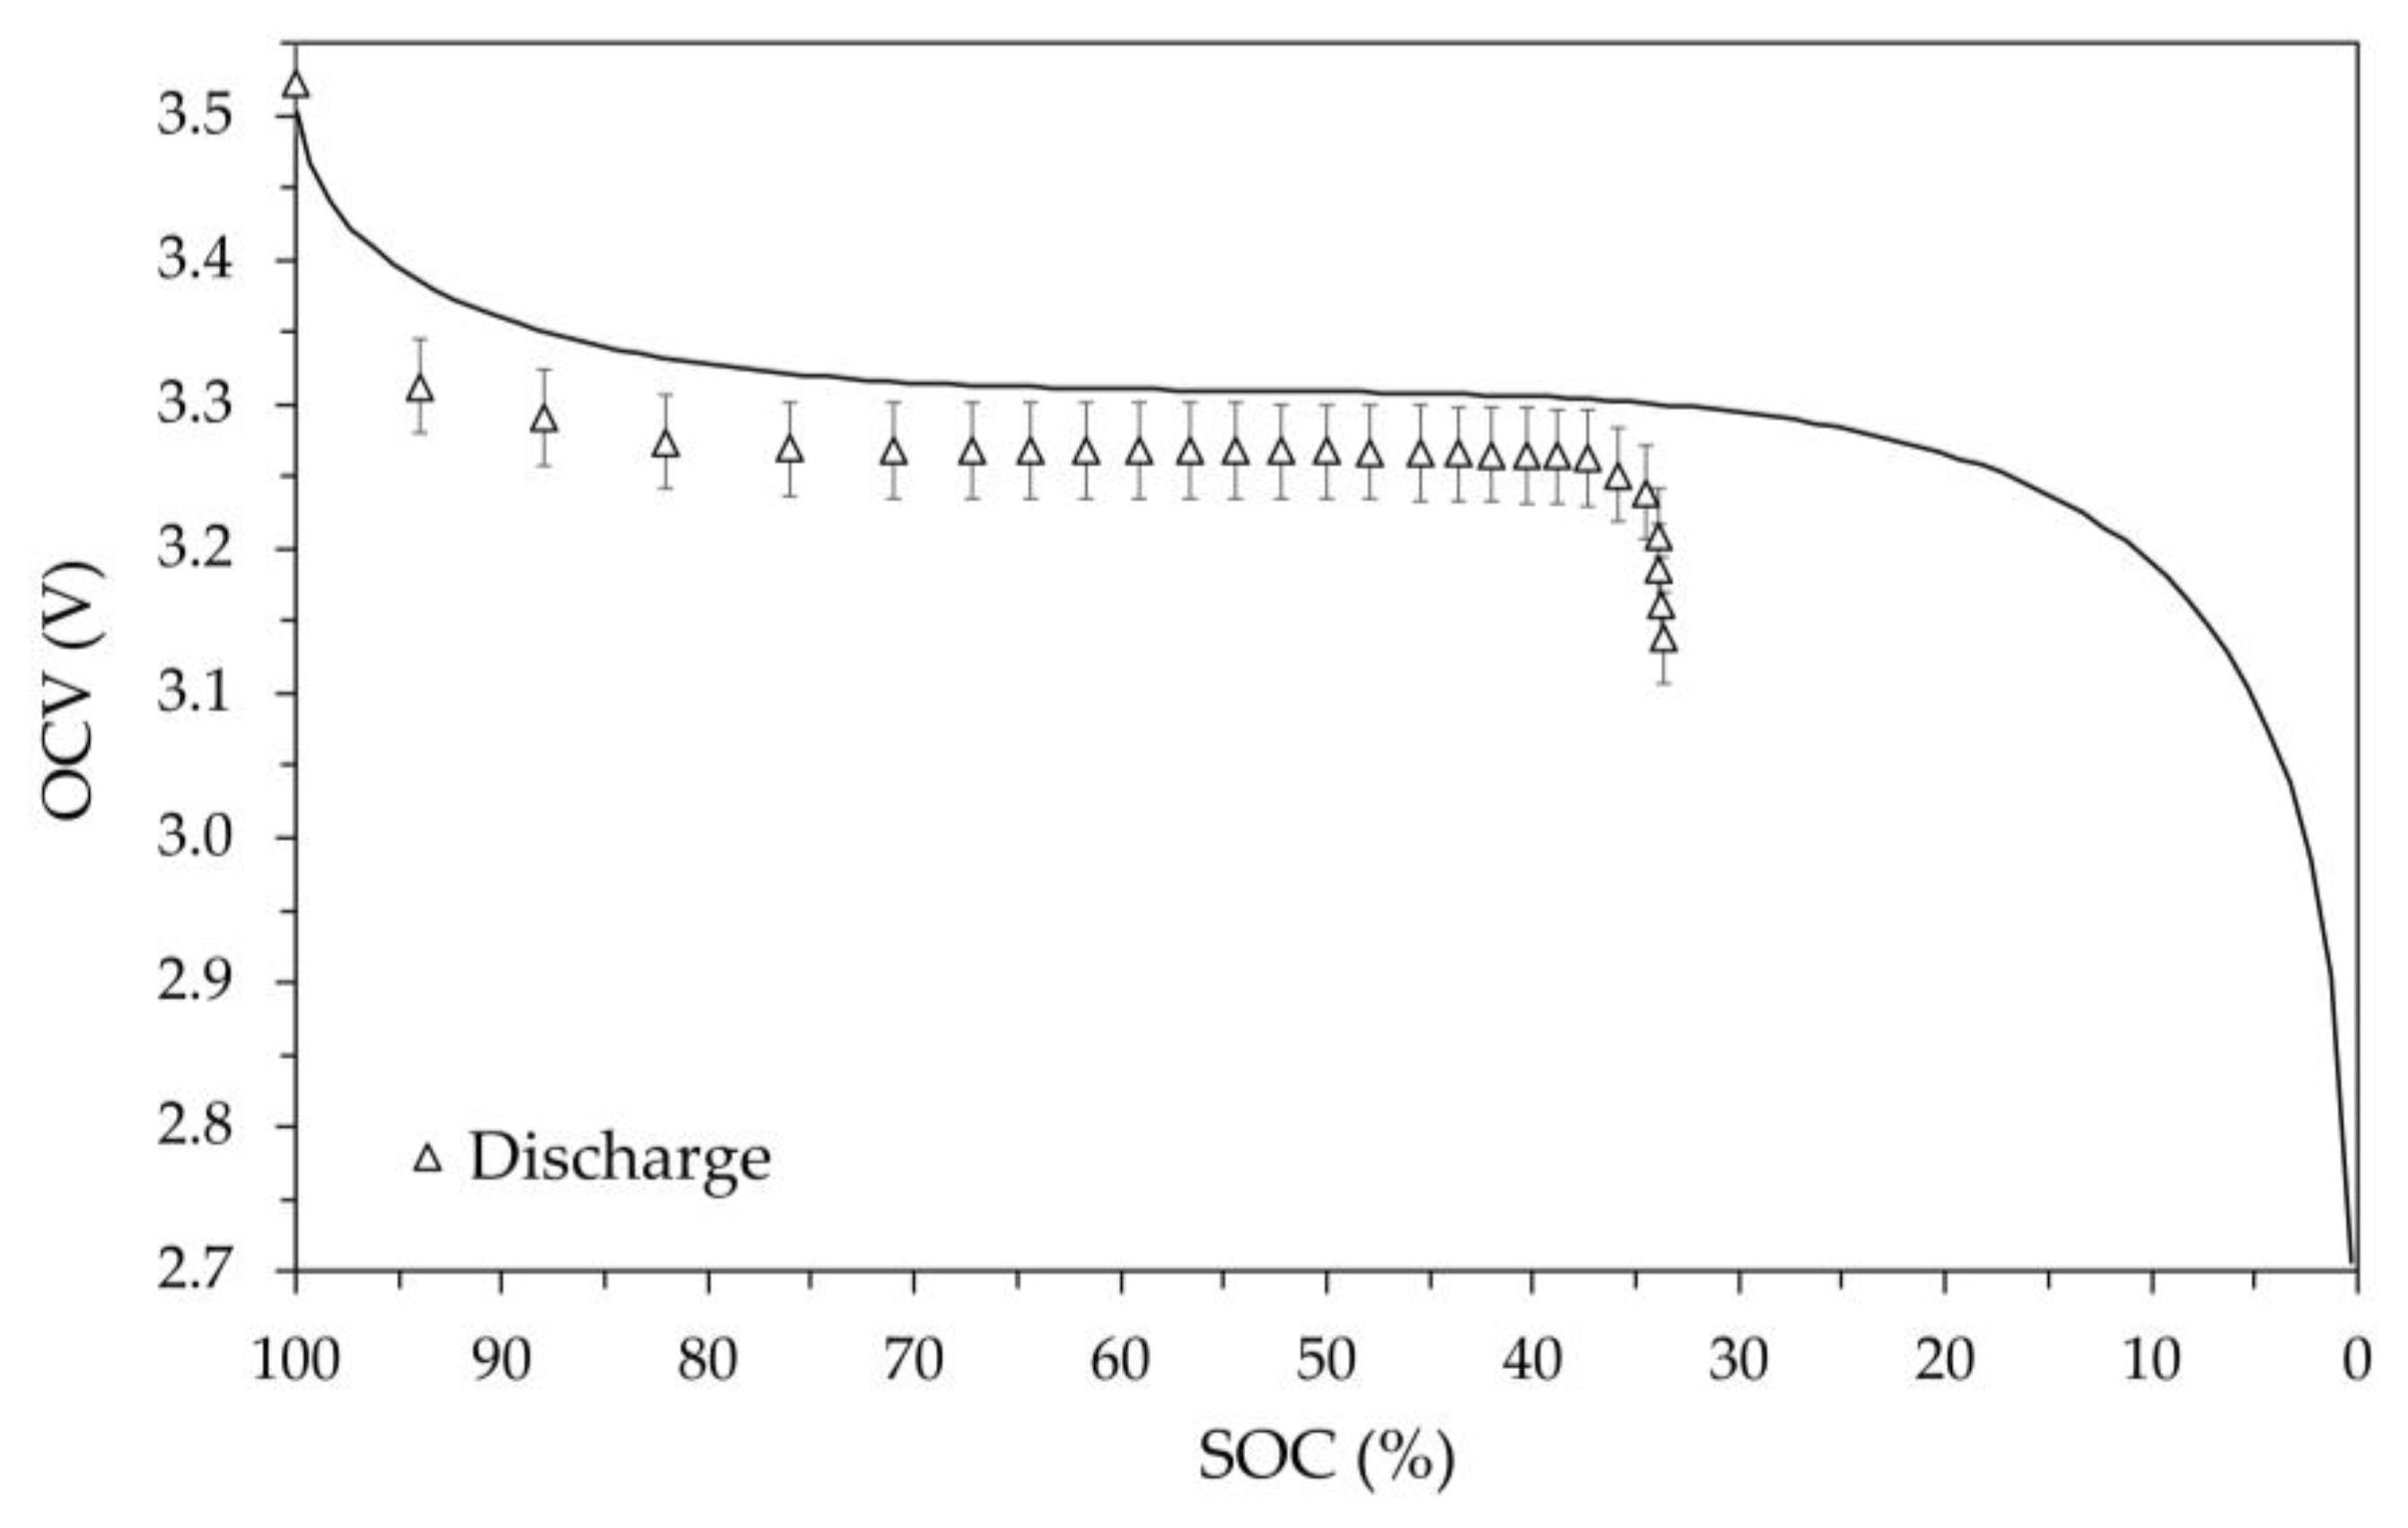
Figure 12.
OCV vs SOC at the average battery temperature of 52.2 °C. Error bars are 1%.
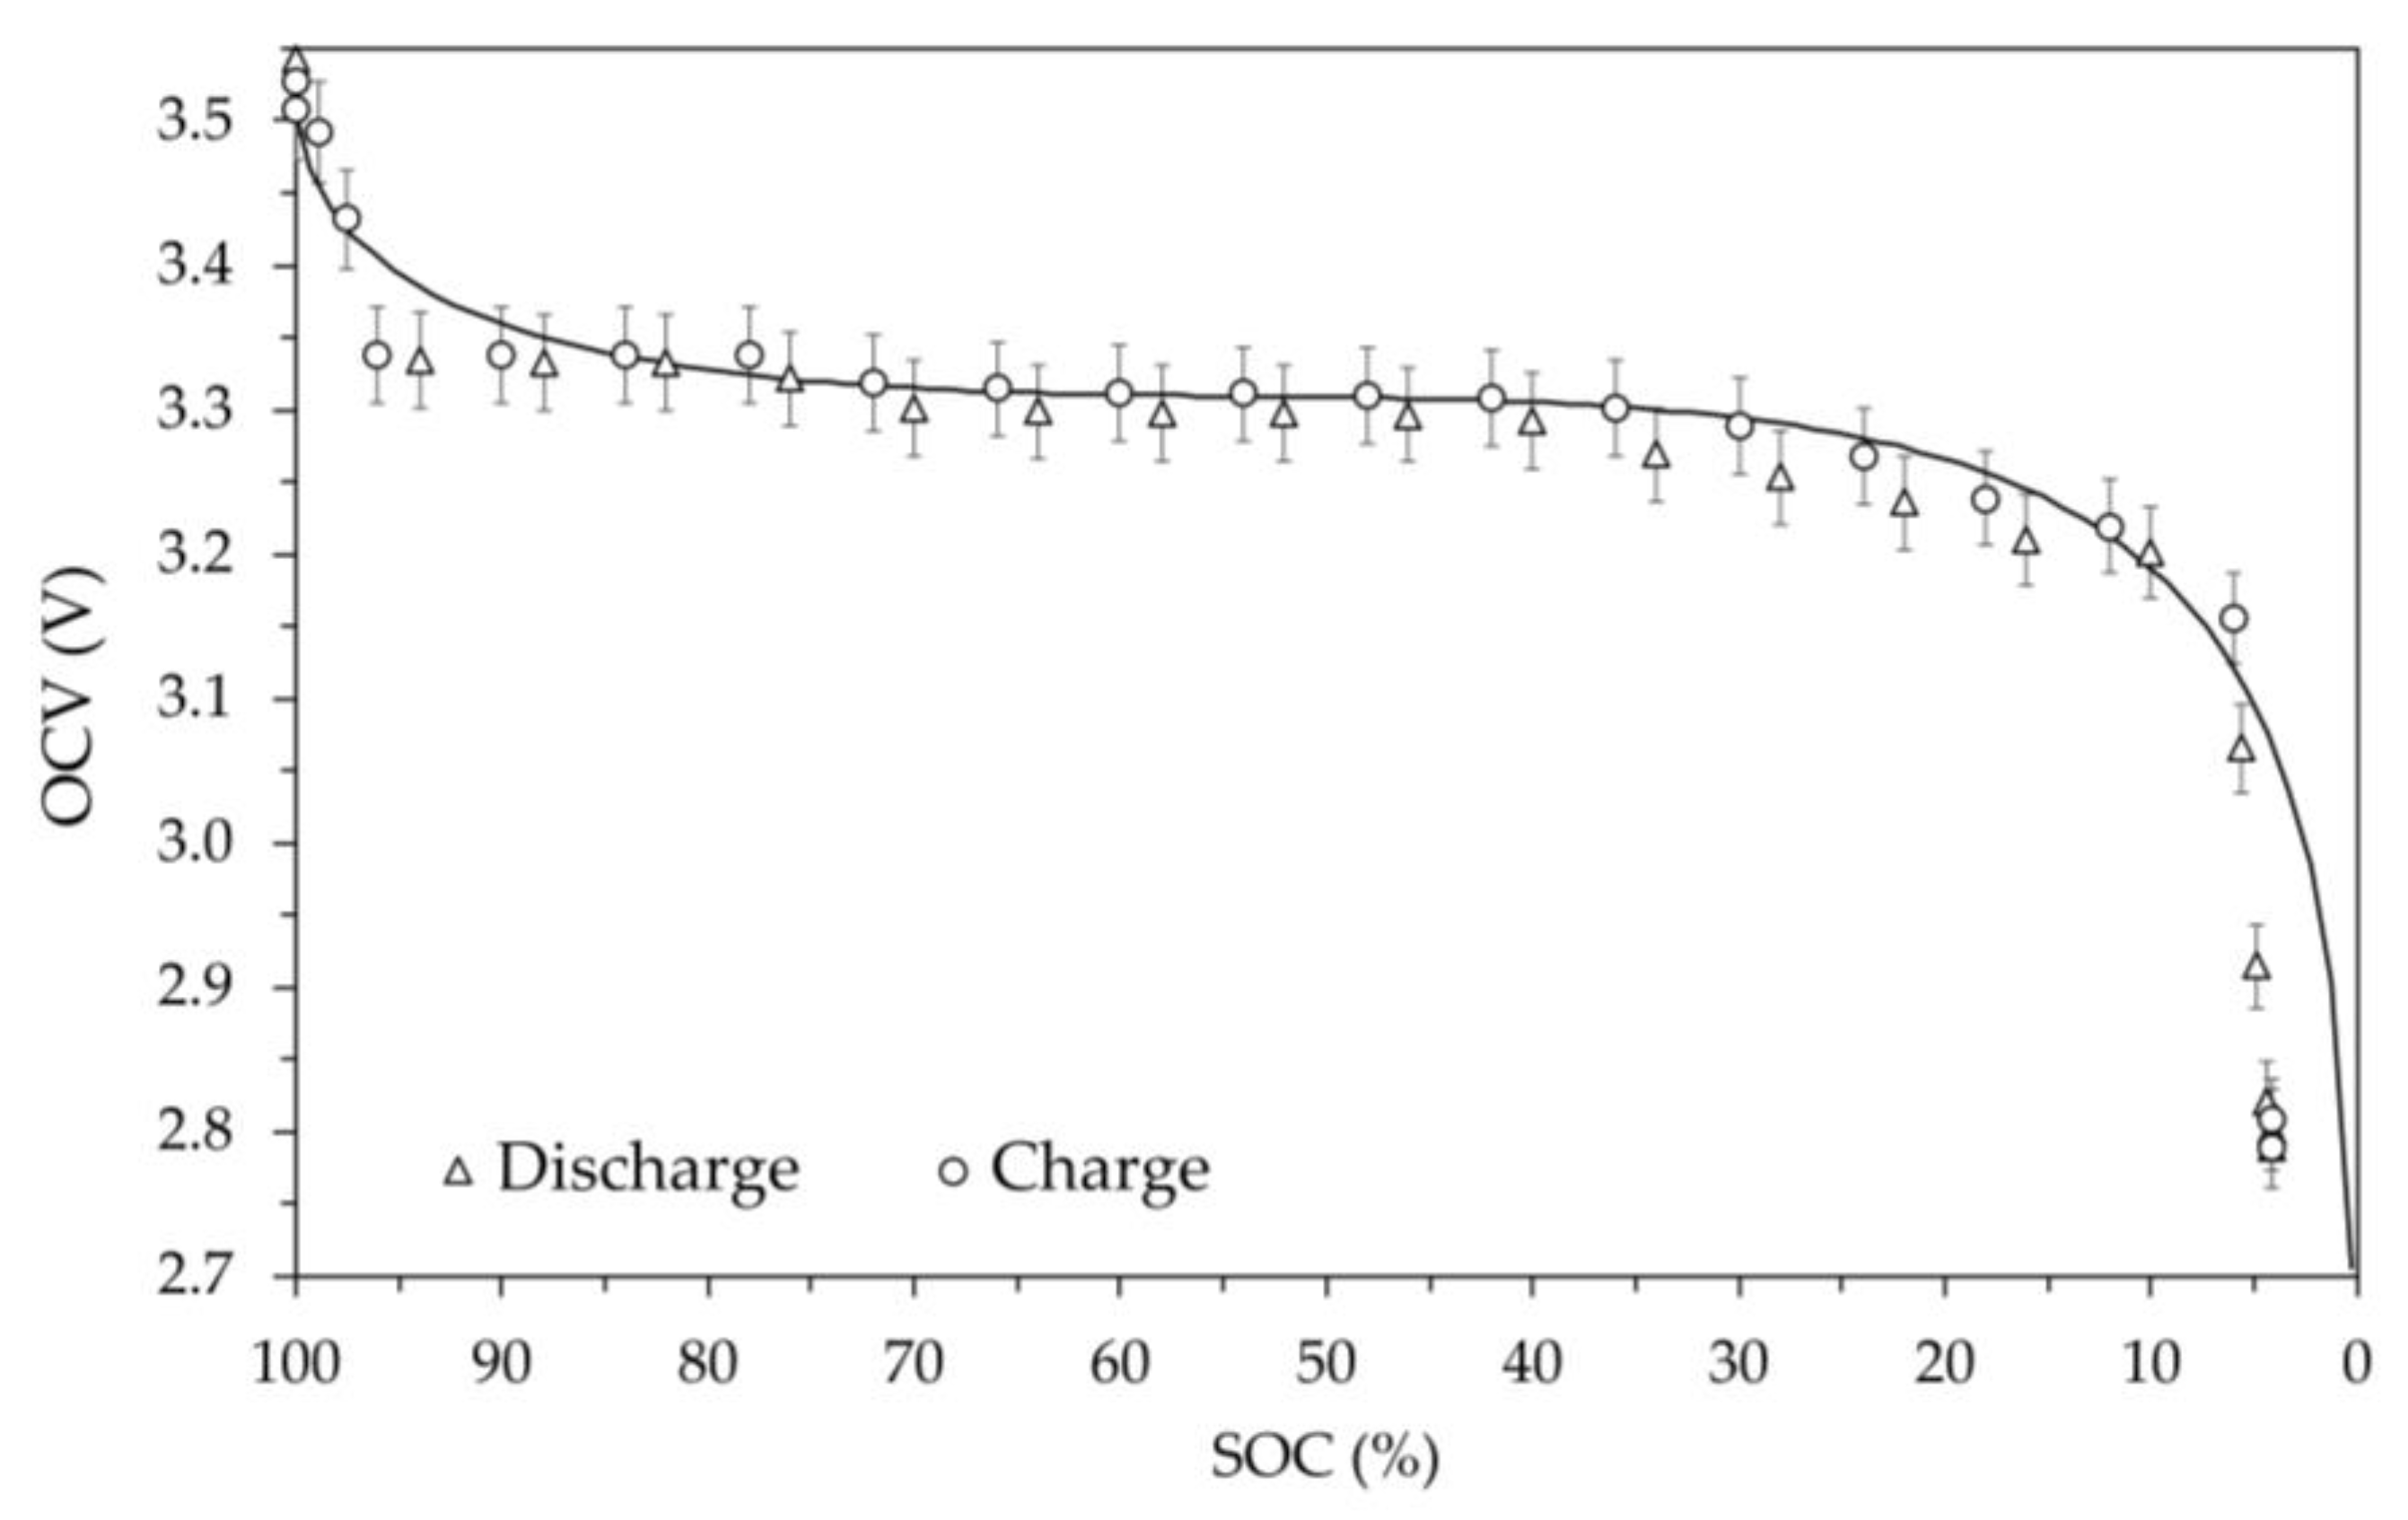
Figure 13.
Molar Gibbs free energy vs temperature. Triangles are the values obtained measuring the OCV at the end of discharge. Error bars represent 2% deviation, and dashed line is the linear regression of the measured values.
Figure 13.
Molar Gibbs free energy vs temperature. Triangles are the values obtained measuring the OCV at the end of discharge. Error bars represent 2% deviation, and dashed line is the linear regression of the measured values.
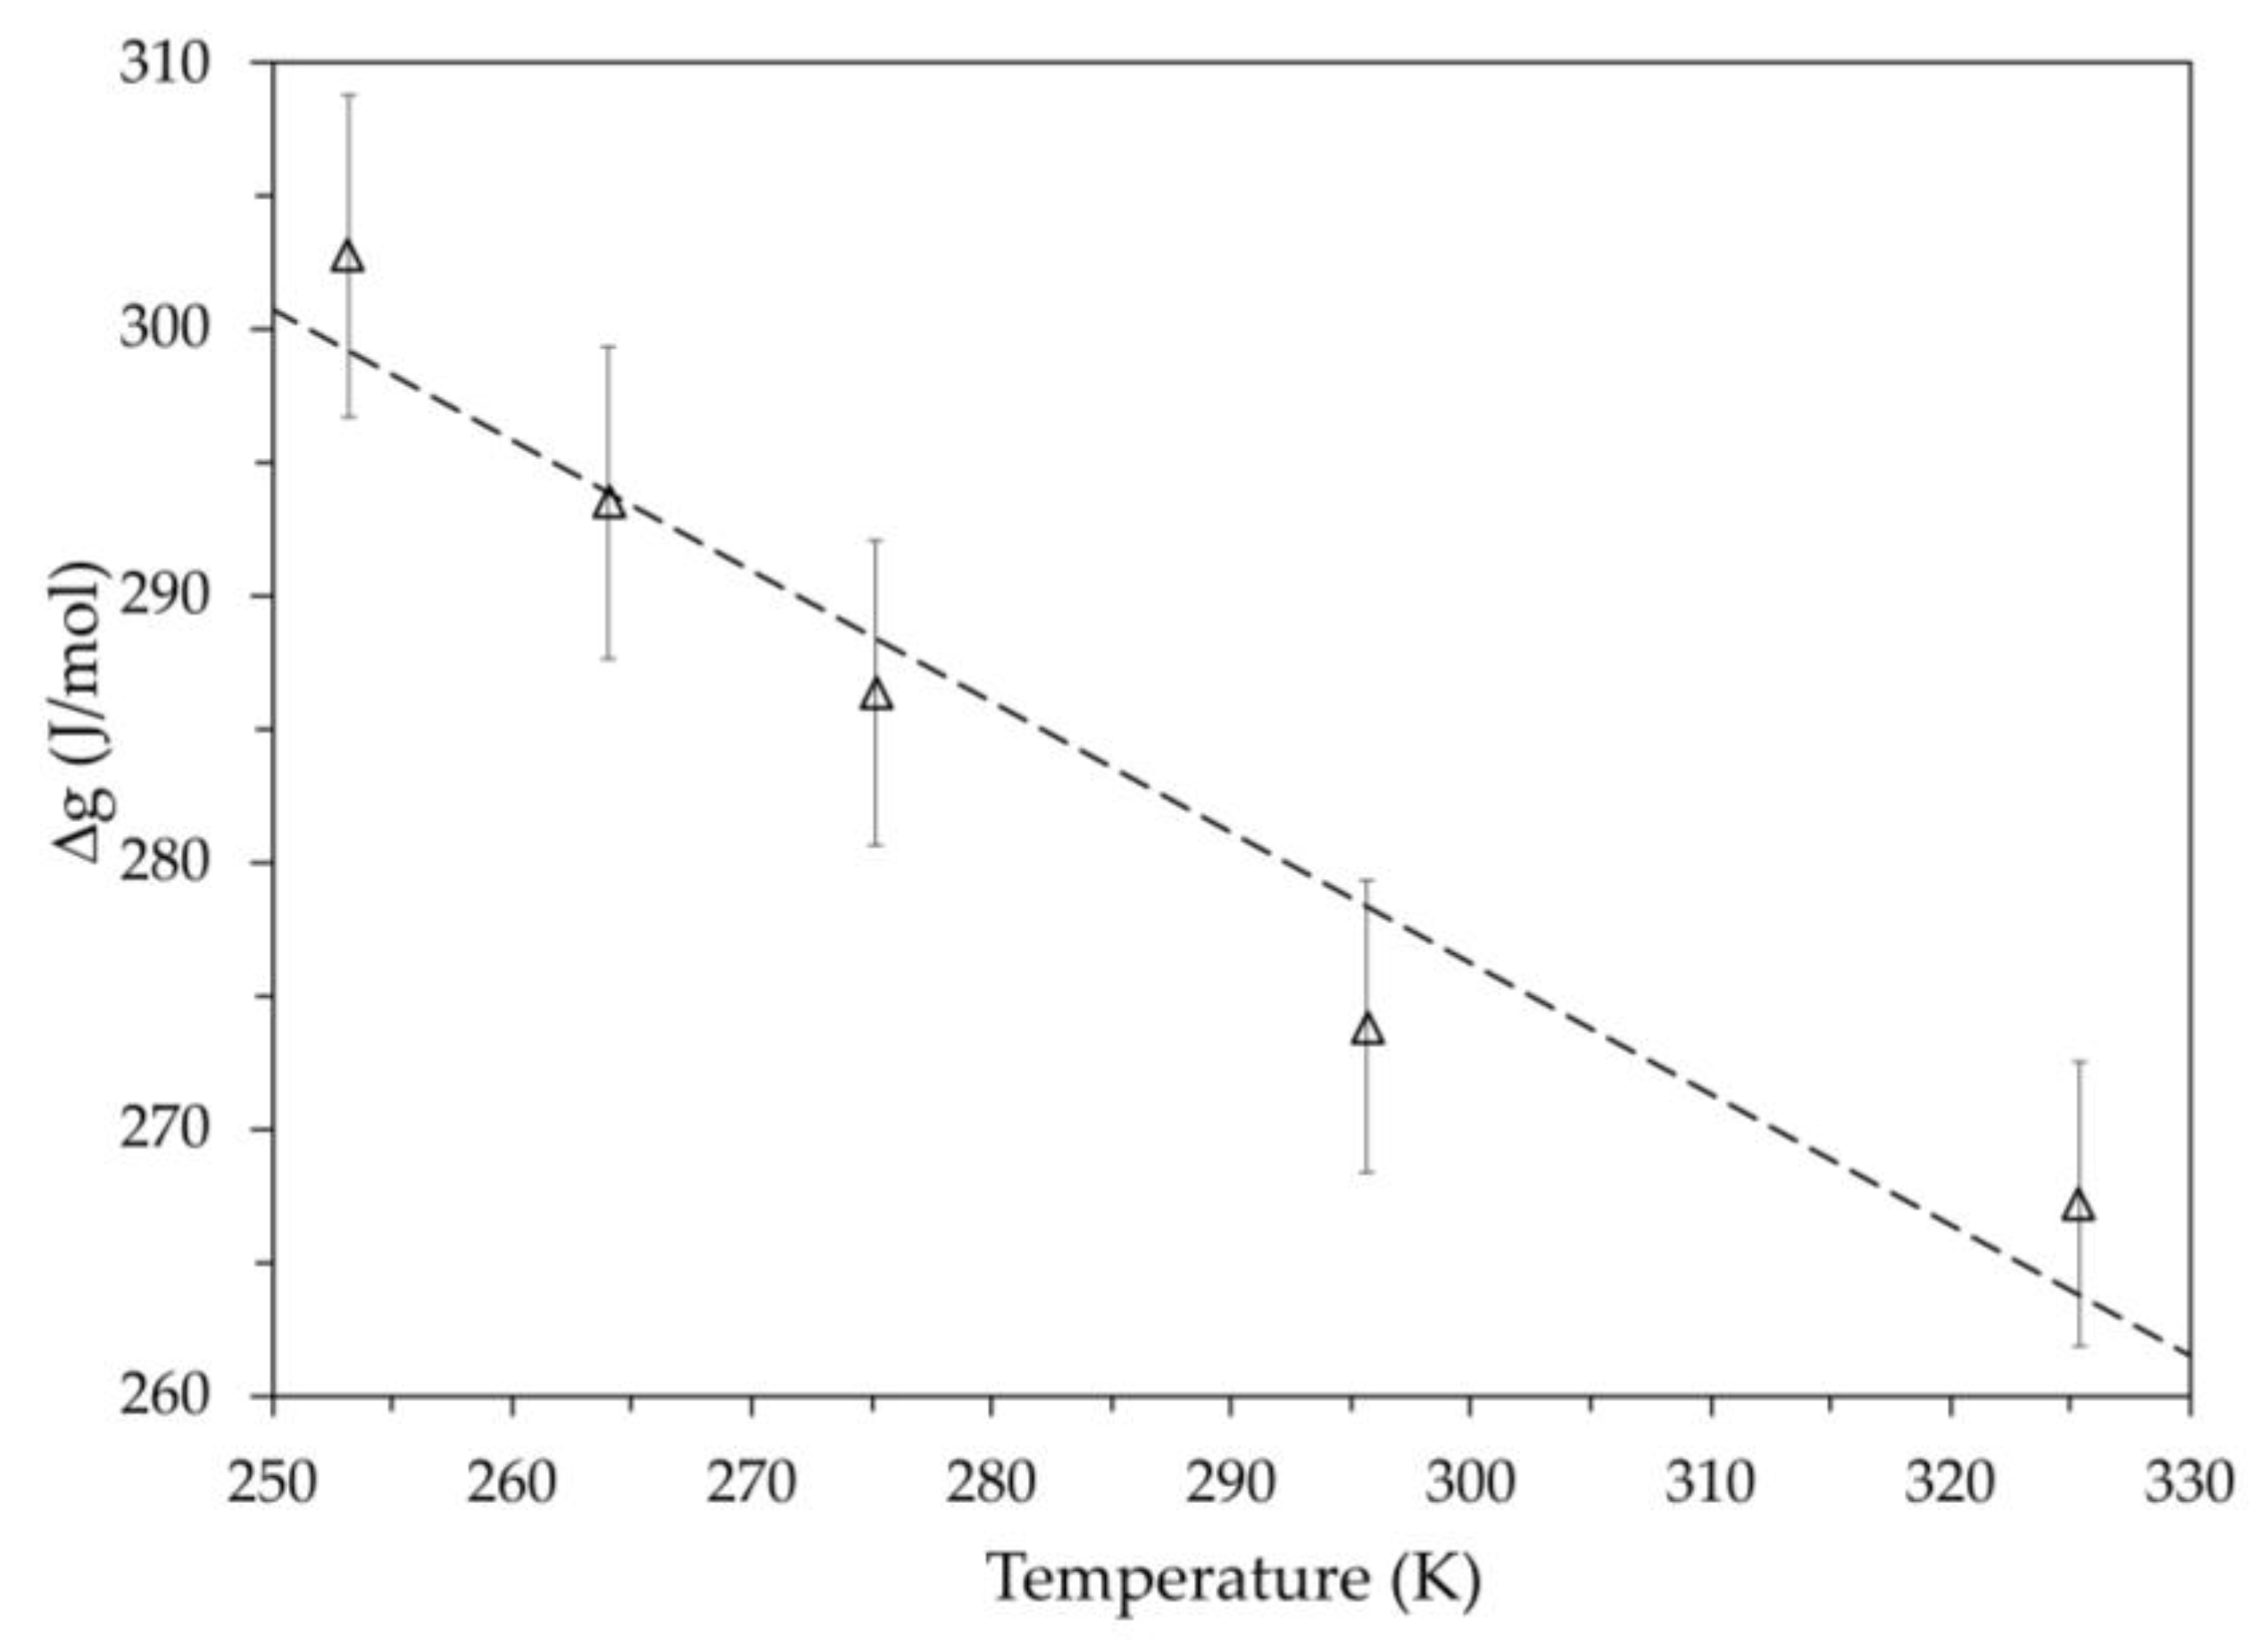
Figure 14.
Semi-log diagram of the equivalent kinetic coefficient vs the reciprocal of the absolute temperature. The dashed (module #1) and solid (module #2) lines refer to the modified Arrhenius model proposed in Equation (6). Error bars are 5%.
Figure 14.
Semi-log diagram of the equivalent kinetic coefficient vs the reciprocal of the absolute temperature. The dashed (module #1) and solid (module #2) lines refer to the modified Arrhenius model proposed in Equation (6). Error bars are 5%.
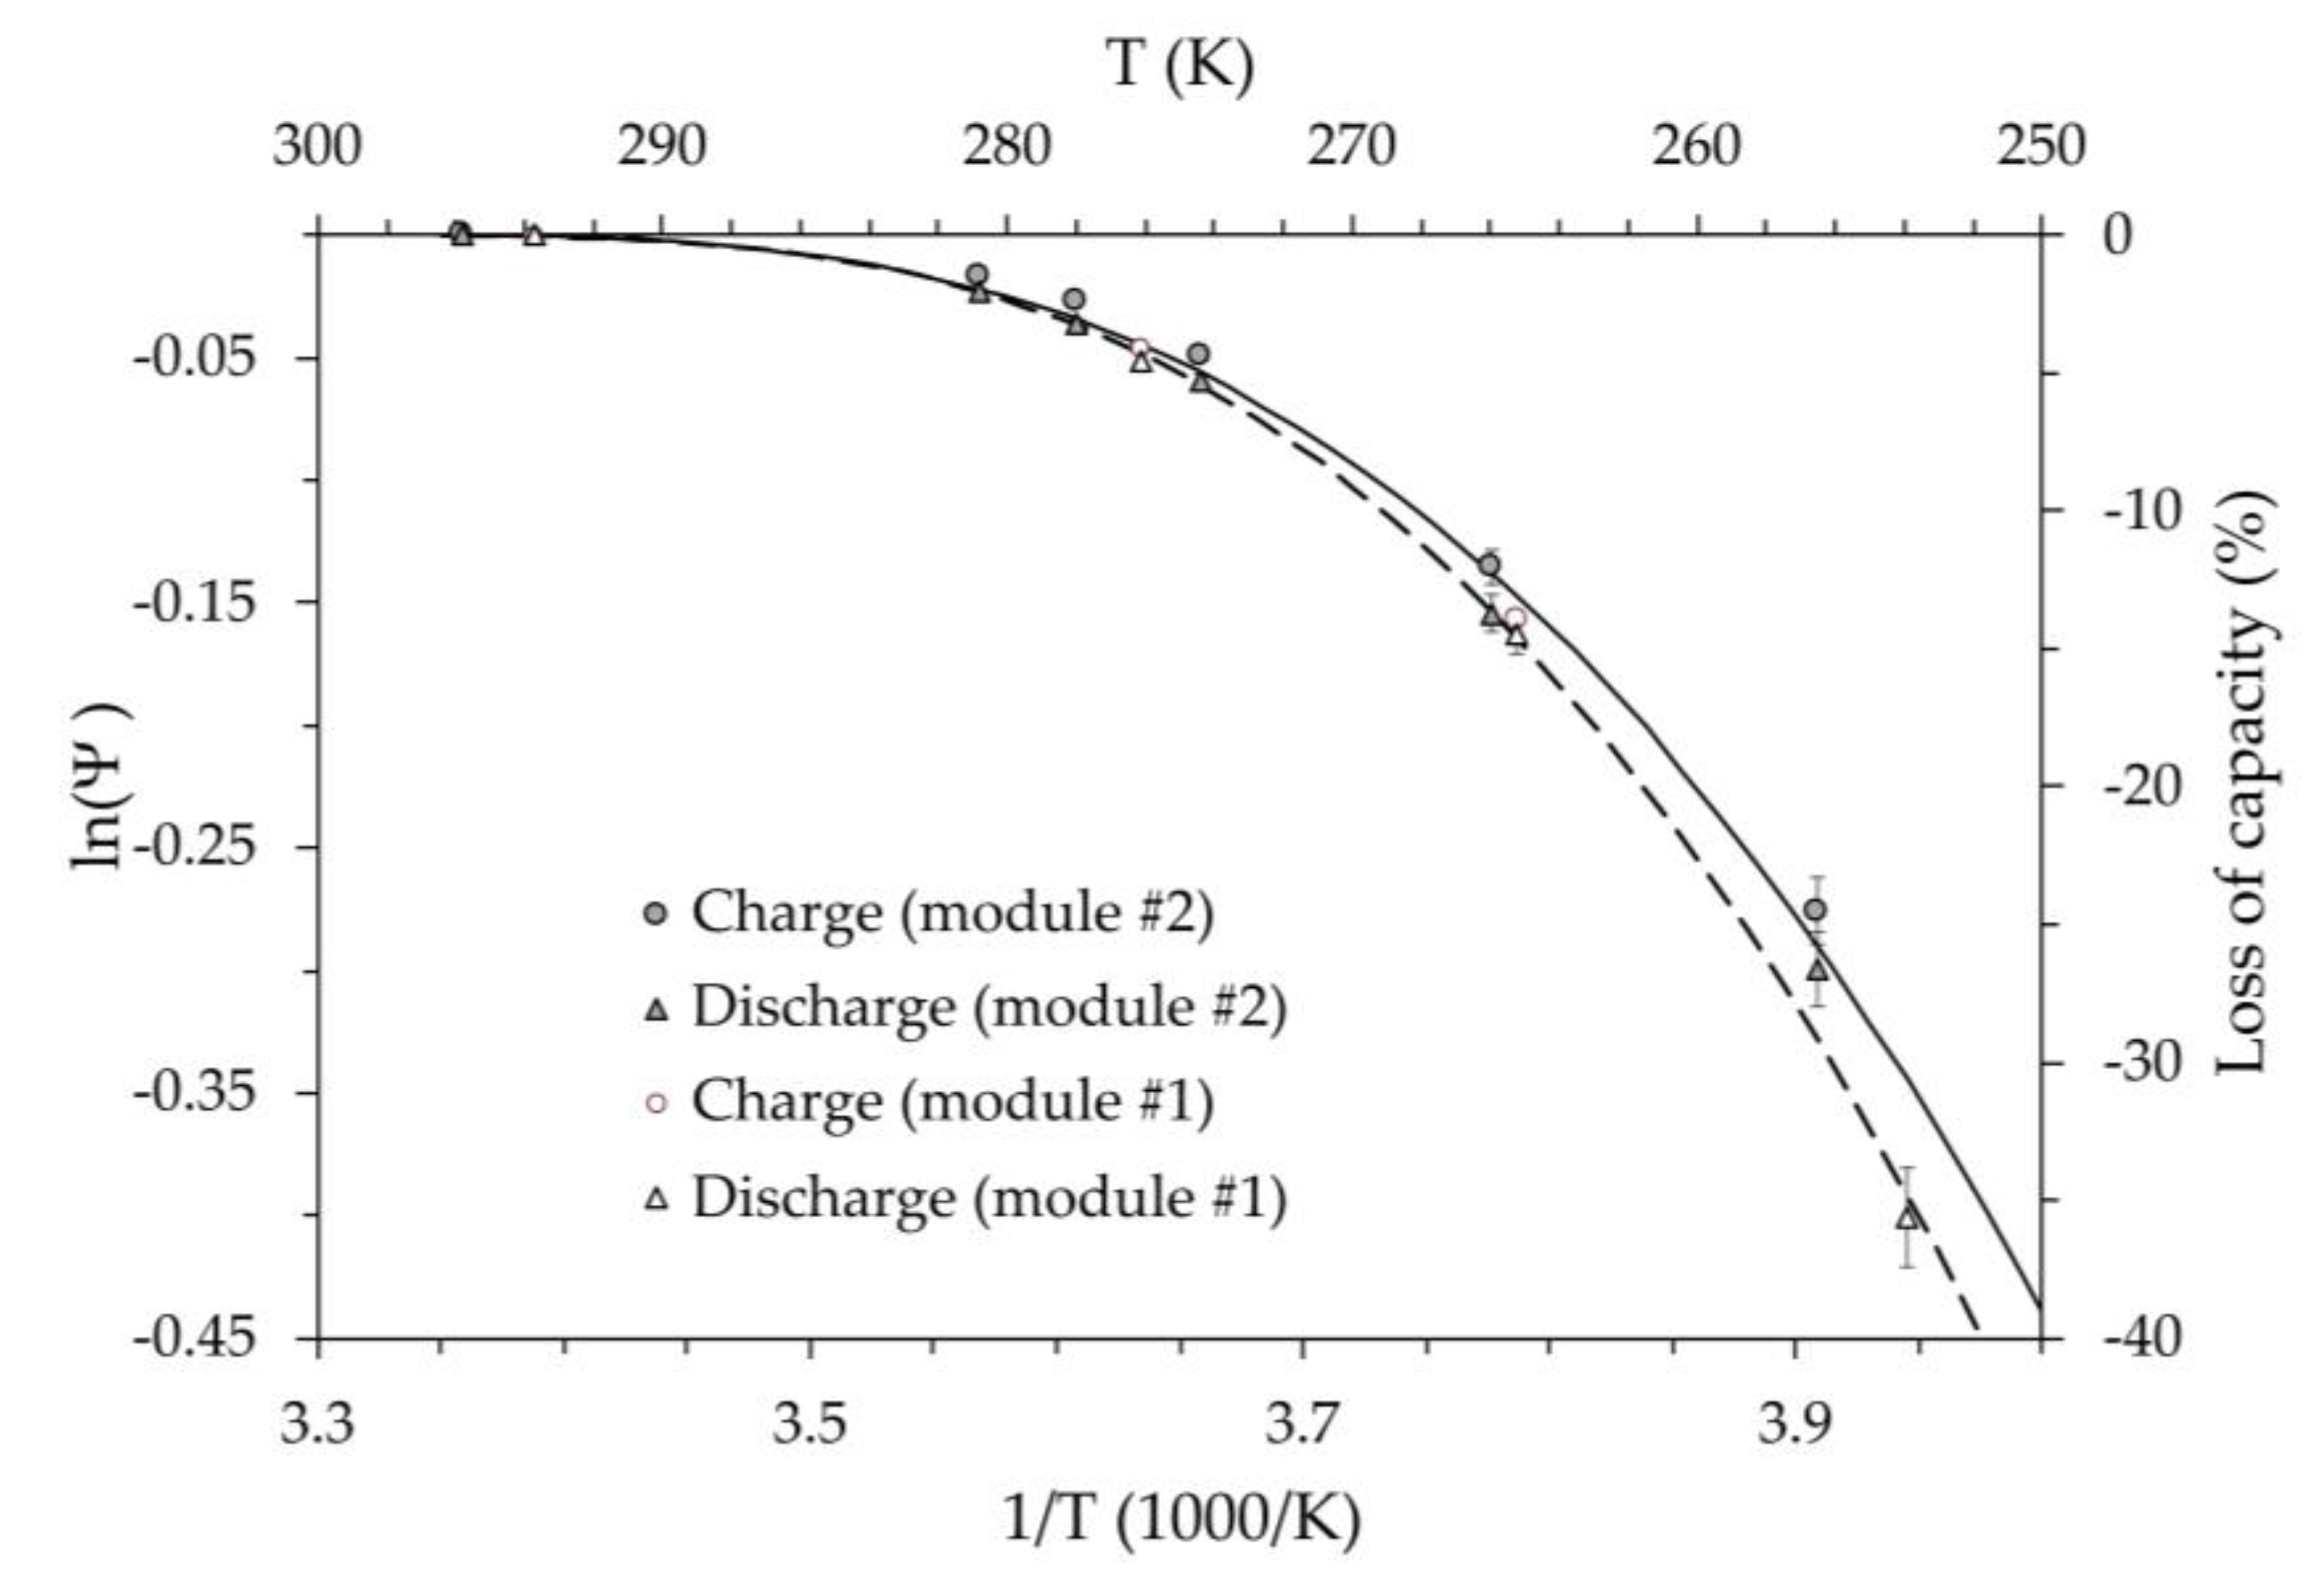
Figure 15.
Diagram of ohmic resistance for the discharge and charge vs absolute temperature for battery module #2. Error bars are 10%.
Figure 15.
Diagram of ohmic resistance for the discharge and charge vs absolute temperature for battery module #2. Error bars are 10%.
Disclaimer/Publisher’s Note: The statements, opinions and data contained in all publications are solely those of the individual author(s) and contributor(s) and not of MDPI and/or the editor(s). MDPI and/or the editor(s) disclaim responsibility for any injury to people or property resulting from any ideas, methods, instructions or products referred to in the content. |
© 2025 by the authors. Licensee MDPI, Basel, Switzerland. This article is an open access article distributed under the terms and conditions of the Creative Commons Attribution (CC BY) license (http://creativecommons.org/licenses/by/4.0/).
Copyright: This open access article is published under a Creative Commons CC BY 4.0 license, which permit the free download, distribution, and reuse, provided that the author and preprint are cited in any reuse.


