Submitted:
14 March 2025
Posted:
17 March 2025
You are already at the latest version
Abstract
This study investigates the spatiotemporal evolution of the Yellow River Delta shoreline from 1976 to 2024 using 156 remote sensing images and hydrological data. By integrating waterline extraction, DSAS model, and EPR index analysis, quantified shoreline dynamics and identified dominant drivers. Results reveal distinct subregional patterns: the Diaokou Subdelta transitioned from severe erosion (-372.1 m/a, 1976–2002) to dynamic equilibrium (109.5 m/a post-2016) under alternating marine and anthropogenic controls. The Qingshuigou Subdelta exhibited extreme shifts from rapid progradation (1453.9 m/a, 1976–1996) to intense erosion (-1761.0 m/a post-1996) due to channel diversion and sediment deprivation. Dongying Port maintained weak deposition (11.2 m/a) through artificial levee effects, while the active river mouth sustained persistent accretion (3.75 km/a post-2016) under natural sediment supply. Key drivers include fluvial sediment flux (dominant in progradation phases), marine erosion (critical in abandoned lobes), and engineering interventions (e.g., levees reduced erosion by 68.55 m/a). This study highlights the necessity of balancing natural processes and human interventions for coastal resilience, providing a scientific foundation for delta management and sustainable governance.
Keywords:
Yellow River Delta
; shoreline stability
; DEM (Digital Elevation Model)
; instantaneous water edge line
; Digital Shoreline Analysis System
; Water and Sediment fluxes
1. Introduction
The coastal zone, as an interface between marine and terrestrial environments, possesses significant ecological, economic, and social functions. Protecting and sustainably managing this zone demonstrates environmental stewardship and forms the foundation for future development[1]. The Yellow River Delta has been shaped by long-term depositional land-building processes driven by high sediment-laden river discharge, with its evolution governed by alternating cycles of deposition, extension, elevation, migration, and diversion[2]. Since 1855, the Yellow River has undergone multiple channel diversions (Figure 1), including the Shenxiangou course period (1954-1964), Diaokou River course period (1964-1976), Qingshuigou course period (1976-1996), and Qing 8 distributary course period (1996-present). These diversions have formed the Diaokou Subdelta, Dongying Port and adjacent areas, Qingshuigou Subdelta, and the active river mouth area.
In recent decades, scholars have conducted multidimensional studies on the Yellow River Delta. The erosion-deposition processes in tidal flats are influenced by natural factors including hydrological conditions (tidal dynamics[3,4], wave action[5]), meteorological factors[6,7](precipitation, wind forcing[7]), topographic features[8,9] (seabed morphology, tidal flat geometry[10]), biological activities (flora and fauna interactions[11]), geological processes[12,13](sediment provenance[14,15,16,17,18,19,20], crustal movements[21,22,23]), and anthropogenic factors such as engineering projects[24] and sand mining/wastewater discharge[13,25,26,27,28,29,30,31]. The system generally exhibits deposition during flow periods and erosion during non-flow periods. Under combined influences, distinct patterns emerge across subregions : Diaokou Subdelta: strong deposition-weak deposition-stabilization-erosion-coexisting erosion/deposition[24,32,33];Qingshuigou Subdelta: strong deposition-weak deposition-weak erosion-intense erosion[34,35,36]; Gudong nearshore: strong deposition-dynamic equilibrium-erosion-severe erosion[37,38]; Active river mouth area: persistent deposition with continuous coastline morphological changes[39,40,41].However, existing studies have limitations: limited remote sensing imagery datasets constrain statistical analysis of shoreline changes; focus predominantly on subdelta regions rather than holistic delta-scale investigations; Overreliance on mean high water line (MHWL) method for shoreline extraction, underutilizing instantaneous waterline data; Emphasis on large-scale water-sediment relationships and evolutionary patterns, insufficient attention to shoreline evolution stability near active channels; Predominant use of planimetric coastline retreat/advance metrics, lacking three-dimensional morphological models of the delta.
This study applied the OTSU algorithm[42,43,44,45,46] to extract instantaneous waterlines spanning 1976-2024, with subsequent annual median shoreline positions derived through the Digital Shoreline Analysis System (DSAS)[30,47,48,49,50,51]. An integrated analytical framework combining shoreline length metrics, endpoint rate (EPR), and stability indices[50,52,53] was developed to quantify shoreline migration dynamics, stability regimes, and spatiotemporal evolution mechanisms of the Yellow River Delta. Tidal elevation datasets enabled vertical referencing during DEM construction, while cross-sectional morphometric profiling provided enhanced visualization of coastal processes. This methodological advancement deepens mechanistic understanding of delta shoreline evolution, establishes technical foundations for coastal resilience enhancement, and promotes sustainable delta governance.
2. Materials and Methods
2.1. Research Region
The Yellow River Delta, an alluvial plain formed by sediment deposition in the Bohai Sag, extends from the apex at Kenli Ninghai in its modern configuration. Bounded by the Tiao'er River Estuary (north) and Zhimai Channel Estuary (south), it covers approximately 5,400 km², with 5,200 km² within Dongying City[1]. Historically significant channel diversions include: 1964 artificial breach at Luojiawuzi redirecting flow through the Diaokou River; 1976 artificial cutoff at Xihekou establishing the Qingshuigou course; 1996 Qing 8 distributary diversion (north of Qingshuigou) for Shengli Oilfield operations. These engineering interventions induced pronounced sediment deposition and land accretion. Shoreline evolution critically influenced by discharge channel shifts, directly impacts coastal industries, agriculture, and petroleum infrastructure safety, while abandoned channels retain strategic resource potential. Per regional planning: the Diaokou fluvial is maintained as a protected standby channel, Post-Qingshuigou fluvial retirement, Diaokou reactivation receives priority. Our study focuses on the modern Yellow River Delta (ca. 3,000 km² terrestrial area), partitioned into four zones per shoreline typology and historical analogs (Figure 2):
Diaokou Subdelta, Dongying Port and adjacent areas, Qingshuigou Subdelta, Active River Mouth, Spanning 37°36'-38°10'N, 118°36'-119°30'E, this investigation evaluates erosion-accretion patterns and vulnerability assessment frameworks across subregions.
2.2. Data Source and Preprocessing
The remote sensing datasets for this study were primarily acquired from the United States Geological Survey (USGS) (http://glovis.usgs.gov/) and China Centre for Resources Satellite Data and Application (CCRSDA) (https://data.cresda.cn/#/home), comprising 156 Landsat scenes (Figure 3). As the terminal hydrological control station before river-ocean interaction, Lijin Station—located approximately 100 km upstream from the active distributary mouth (Figure 2)—provides representative measurements of Water and Sediment fluxes entering the delta[15,55].The water and sediment flux dataset spans 1976-2024, integrating: Hydrological Characteristics of major Chinese Rivers (1976-1979); Lijin Hydrological Station records (1980-1999); China Sediment Bulletin (2000-2023). All data underwent rigorous Three-Criteria Hydrological Validation[56]. For the 156 satellite images (1976-2024), preprocessing workflows in ENVI/ArcGIS included: Scene subsetting, Radiometric calibration, Atmospheric correction, Geometric registration (referenced to the 1976-12-17 baseline image with ≤0.5 pixel accuracy)
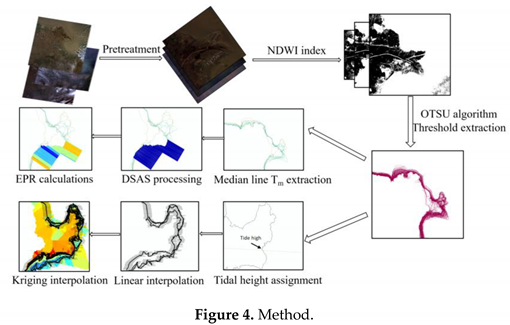
2.3. Methods
This study utilized remote sensing imagery (1976-2024) to extract instantaneous waterlines, with the intertidal median line (Tm) calculated to represent the mean shoreline position.
- (1)
- Image Preprocessing
Preprocessing workflows for the 156 satellite images (1976-2024) were conducted in ENVI/ArcGIS, including: scene subsetting (spatial domain masking); radiometric calibration (DN-to-reflectance conversion); atmospheric correction (FLAASH model implementation); geometric registration (referenced to the 1976-12-17 baseline image with ≤0.5 pixel accuracy)
- (2)
- Waterline Extraction and Vertical Referencing
Water-land classification was conducted using the Normalized Difference Water Index (NDWI)[57,58,59]. This method is applicable to Landsat 1-9 satellites and has been widely applied in the Yellow River Delta region. Its mathematical expression is:
In the formula, and are the pixel brightness values of the green band and the near - infrared band respectively. They correspond to Bands 1 and 3 of Landsat 2/3 MSS images, Bands 2 and 4 of Landsat 4, 5 MSS/TM images, and Bands 3 and 5 of Landsat 8, 9 OLI images.
Automated Threshold Segmentation using the OTSU algorithm was applied to generate land-water binary images, enabling precise delineation of the outermost water boundary. Given the study area's tidal flat characteristics seaward of the coastline, post-processing included: morphological smoothing of extracted waterlines. The smooth treatment method of the river channel is to connect the two sides of the river channel with vertical segments.
Obtain tide height data at satellite transit moments for five tide gauge stations (Wanwanggoukou, HuangheHaigang, Gudong, Kendong, Xiaodaohe) through field measurements and harmonic constant analysis and prediction( Formula 2 ) and using Kriging interpolation to construct DEM.
In the formula, is the average sea - level height during the analysis period; is the angular velocity of the tidal constituent; is the nodal factor; is the average amplitude of the tidal constituent; is the Greenwich initial phase angle of the tidal constituent; and is the local - time lag angle. Here, and vary with tidal constituent and locations, but they are constants for specific tidal constituent at specific locations, which are called tidal harmonic constants.
- (3)
- End Point Rate(EPR)
The Digital Shoreline Analysis System (DSAS) developed by the United States Geological Survey (USGS) was employed to quantify shoreline dynamics in the Yellow River Delta. This analysis established 11 median shoreline positions, with coastal segments classified into four zones based on shoreline orientation, tidal gauge station distribution, and change trajectories: Diaokou Subdelta, Dongying Port and adjacent areas, Qingshuigou Subdelta, Active River Mouth. Spatiotemporal evolution patterns were evaluated using the Endpoint Rate (EPR) metric[60], calculated as:
Where i represents the point where the coastline of the farthest year intersects with the surface line, and j represents the point where the coastline of the most recent year intersects with the transection. is EPR, represents the endpoint rate from the coastline of the farthest year to the coastline of the most recent year. and represent the distances from the coastline of the farthest year and the most recent year to the baseline of the coastline. represents the time interval between the most recent year and the farthest year.
- 2)
- Shoreline Stability
Based on multi-temporal shoreline changes, this study introduces three parameters to analyze spatial patterns of shoreline stability: shoreline vertical extent (D), annual change rate of vertical extent (SY), and shoreline stability index (E), providing theoretical support for coastal resource management. The definitions and computational models are as follows: shoreline vertical extent (D): horizontal displacement distance of shoreline toward sea/land under natural or anthropogenic influences; annual change rate of vertical extent (SY): Shoreline displacement distance per unit time (typically annual); shoreline stability index (E): Ratio of relatively stable segments (slight deposition, stable, slight erosion; classification criteria follow Standards for the Classification of deposition Levels [Table 1]) to total shoreline length within analytical units. Higher values indicate greater stability
Where: n is the number of profiles perpendicular to the dominant orientation of the shoreline; is the change distance on the k-th profiles; y is the time interval of shoreline change; is the total length of relatively stable shoreline segments (slight deposition/stable/slight erosion); is the length of the shoreline of the analysis unit.
3. Results
3.1. Coastline Length
Prior to the 1976-1996 Qingshuigou diversion, the Qingshuigou subdelta exhibited the highest shoreline progradation rate (1.84 km/a, total 39 km) in the study area, driven by unique water-sediment conditions. The Yellow River transported massive sediment loads from the Loess Plateau, which rapidly deposited in this zone due to flattened topography and reduced flow velocity. As the primary flow channel, Qingshuigou maintained sufficient sediment supply. Meanwhile, the adjacent current river mouth area received diffused sediments from the sub-delta through hydrodynamic transport, achieving secondary growth (1.43 km/a) under similar geomorphological settings but constrained by longer sediment transport distances.
Engineering Impact Period (1986-1996): the construction of artificial levees around Dongying Port and adjacent areas modified local hydrodynamic conditions, inducing sediment deposition with an average shoreline progradation rate of 1.29 km/a. However, sediment supply relied solely on localized flow transport, contrasting with Qingshuigou Subdelta's direct sediment supply from the Yellow River's main channel, resulting in slower growth. Diaokou Subdelta exhibited minimal shoreline change (0.33 km/a) due to limited sediment replenishment, as most river-derived sediments deposited near the estuary during long-distance transport.
Anthropogenic Intervention Period (1996-2016): artificial channel diversion altered the Yellow River's flow path and sediment transport direction during 1996-2016, while water-sediment regulation modified discharge-sediment ratios. These interventions reconfigured hydrodynamic patterns and sediment distribution across the delta. Initial shoreline progradation occurred in Diaokou, Dongying Port, and the active river mouth through sediment redistribution. Conversely, Qingshuigou Subdelta experienced 12 km shoreline loss due to artificial flow cutoff severing sediment supply, later stabilizing with gradual recovery through weak sediment accumulation.
Post-Regulation Period (2016-Present): following the cessation of water-sediment regulation in 2016, the active river mouth resumed natural hydrodynamic-sedimentary conditions, sustaining shoreline progradation at 3.75 km/a through continuous sediment deposition. Dongying Port maintained stabilized shoreline dynamics under persistent artificial levee influences. Conversely, Diaokou and Qingshuigou subdeltas transitioned to erosional phases post-2016, with shoreline loss rates reaching 1.13 km/a and 2.09 km/a respectively. This regime shift reflects diminished sediment replenishment and reduced fluvial protection after regulation termination, compounded by intensified marine erosion potentially linked to global sea-level rise.
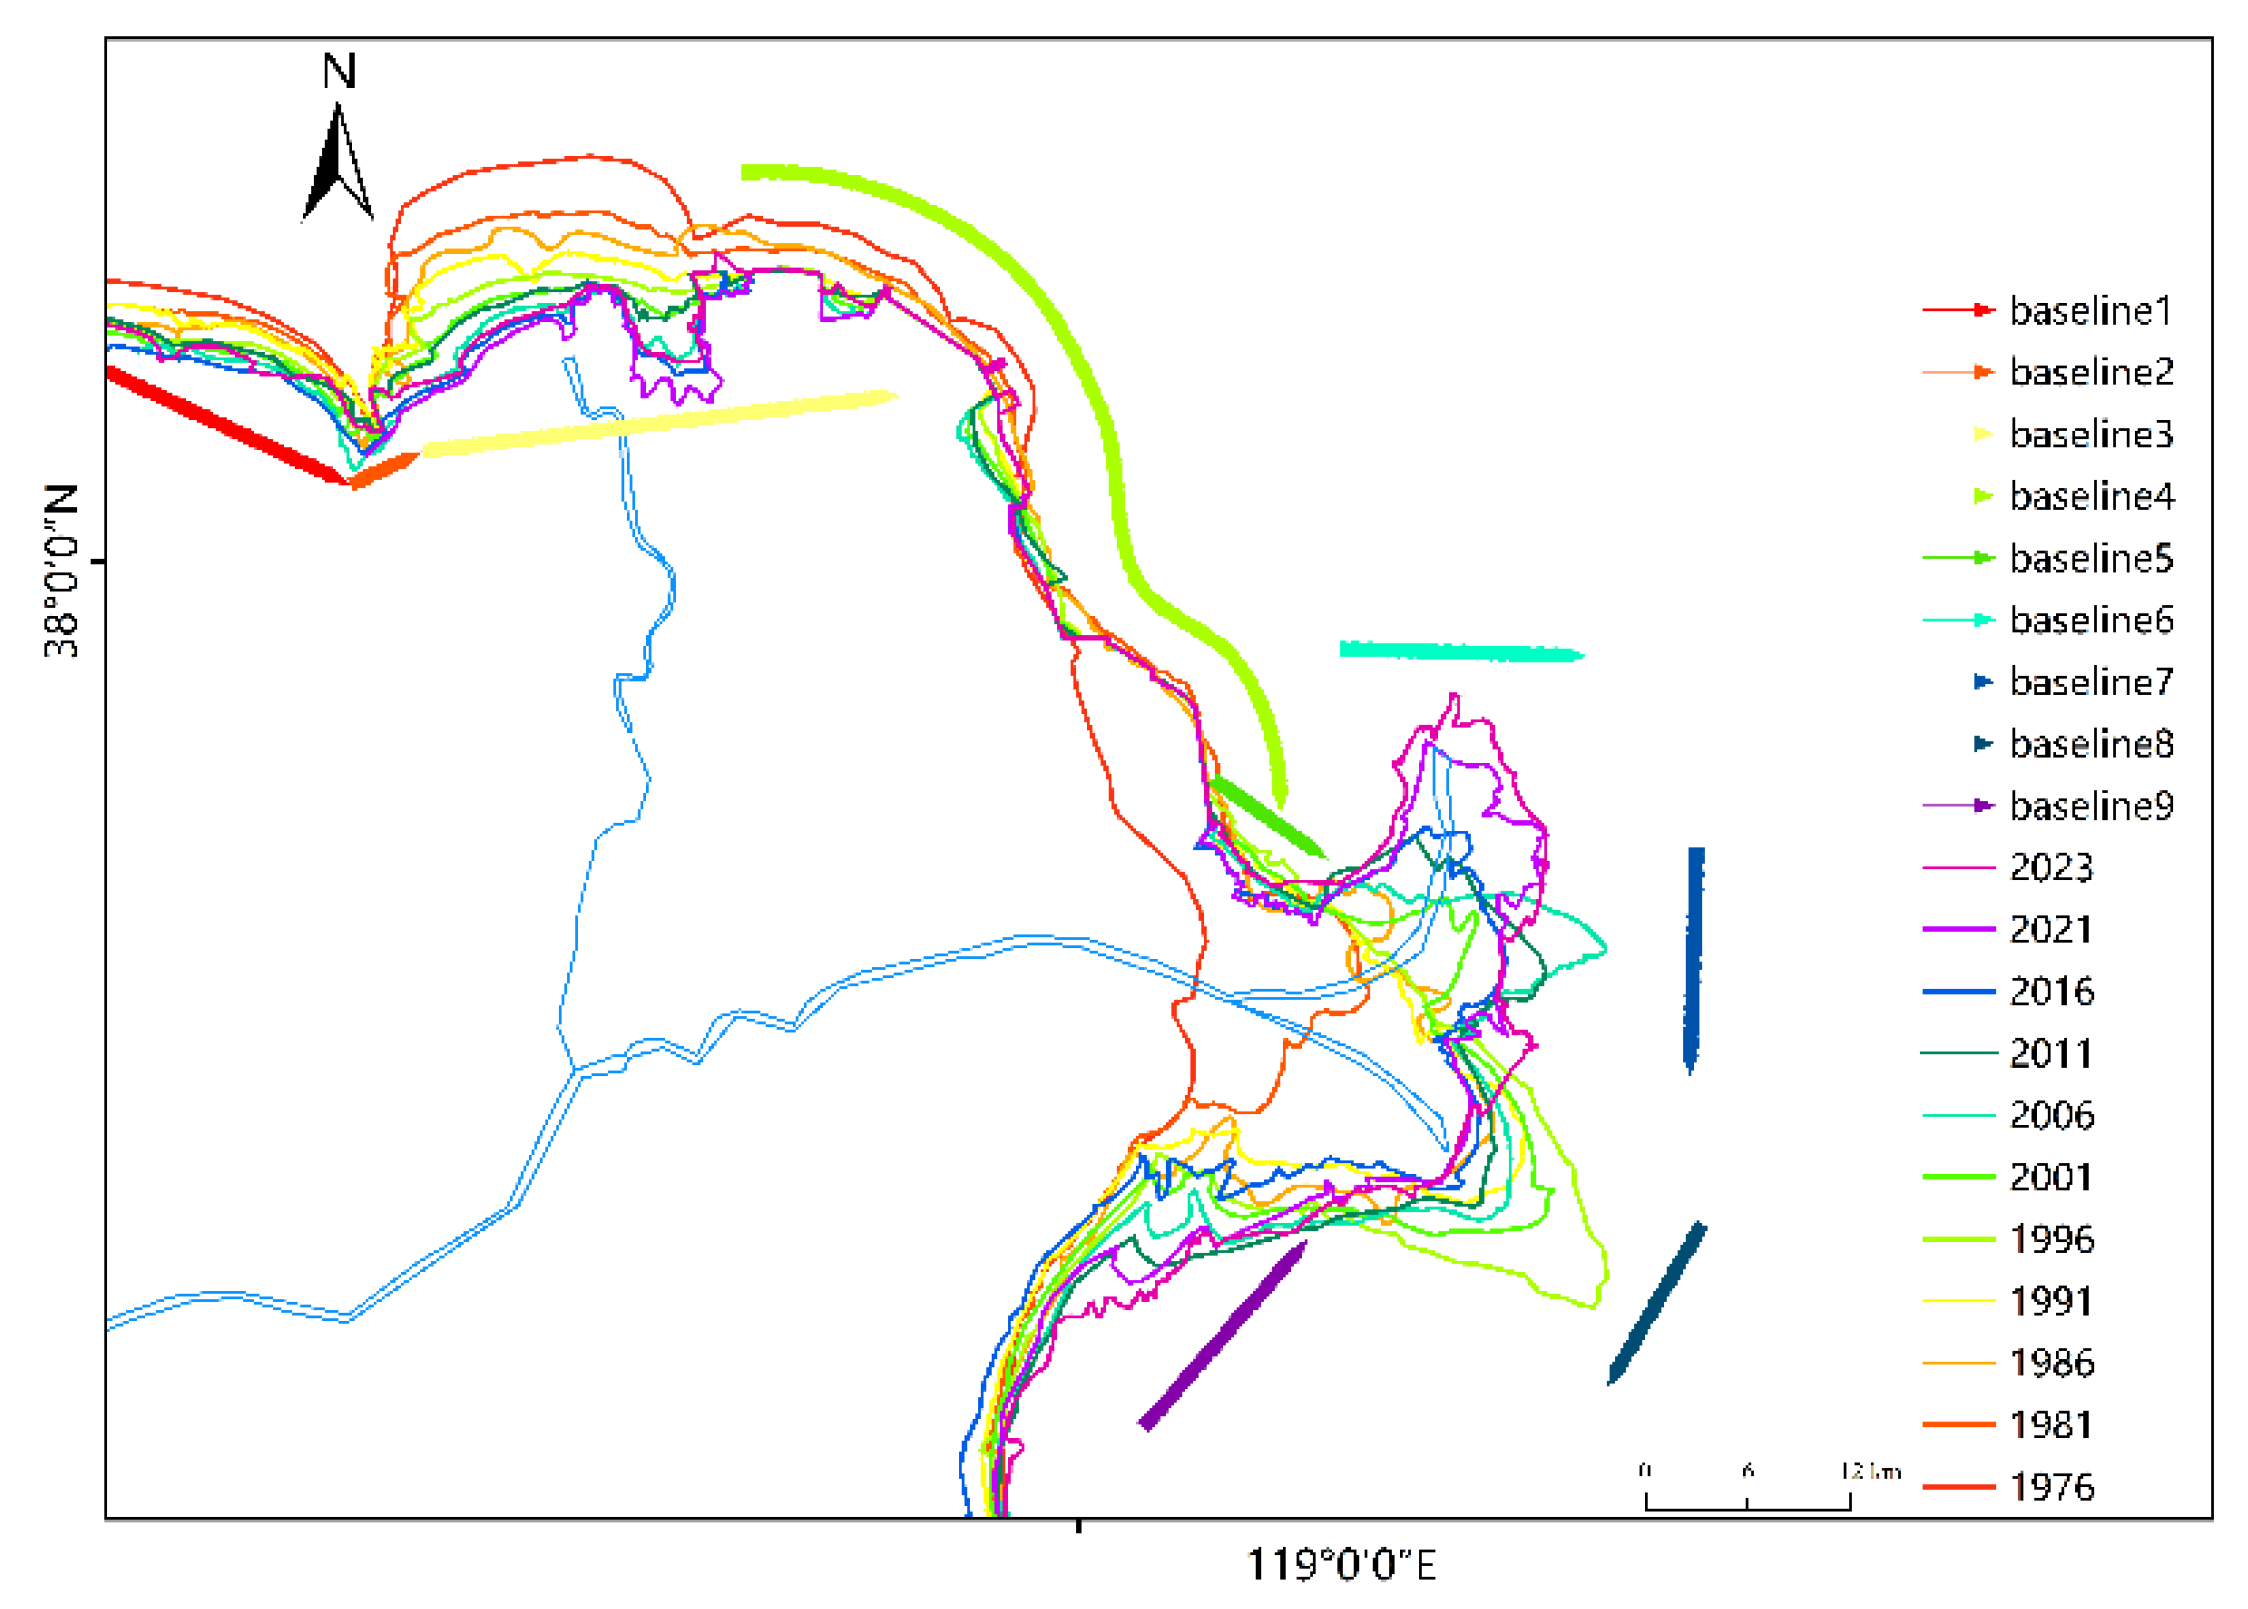
3.2. Coastline Variation Rate Analysis
The baseline, typically established in relatively stable coastal zones parallel to shoreline orientation as a straight/curvilinear reference, remains insensitive to short-term erosion/accretion cycles. Given the significant shoreline morphodynamics over this study's five-decade temporal span, we implemented differentiated baseline strategies: stable zones (e.g., Dongying Port [Baseline4]): Curvilinear baselines aligned with regional shoreline trends;Highly dynamic zones: Segmented baselines for sub-deltas including Diaokou (Baselines1-3), active river mouth (Baselines5-7), and Qingshuigou (Baselines8-9)
The DSAS (Digital Shoreline Analysis System) generated shore-normal profiles spaced at 20m intervals from these baselines to quantify shoreline change vectors.
Figure 5.
Baseline Distribution.
3.2.1. Diaokou Subdelta
1. Pre-Regulation Phase (1976-2002)
After the Yellow River shifted its course to Qingshuigou and prior to water-sediment regulation, the Diaokou River experienced a course change due to long-term sediment deposition, which caused channel narrowing, riverbed elevation, and reduced flood discharge and sediment transport capacity.
During this period, the region was dominated by marine dynamics:
- Periodic wave impact and tidal energy carried by ebb-flood cycles intensified coastal erosion, leading to a strong scouring trend
- Significant coarsening of lobe grain size occurred, with increased sand content and reduced sedimentation rate
- The influence of marine-derived organic matter on regional organic carbon burial increased
The old Yellow River estuary's unique topography concentrated wave energy, yielding a maximum shoreline retreat rate of -372.1 m/a in the concave area corresponding to baseline2, with an average retreat rate of -195.8 m/a. This aligns with Bai Xiaoxia's 1976–2000 study reporting an erosion rate of 1.96×10⁶ t/a for the abandoned Diaokou estuary[61].
2. Regulation Phase (2002-2016)
Artificial water-sediment regulation altered fluvial-marine interactions:
- Hydrodynamic modulation: Flow path modification attenuated marine erosion.
- Erosion mitigation: Mean erosion rate decreased to -87.3 m/a (↓108.5 m/a vs. pre-regulation)
3. Post-Regulation Phase (2016-2024)
Dynamic equilibrium emerged under mixed drivers:
- Fluvial inputs: Tributary sediment pulses (flood-induced overbank deposition)
- Marine redistribution: tidal currents transported external sediments to Bohai Sea
- Morphological feedbacks: Shoals/sandbars promoted localized deposition
Anthropogenic modulation:
- Coastal structures reduced deposition by 68.55 m/a (levee-dense zones)
- Ecological engineering enhanced sediment retention
- Baseline-Specific Phenomena:Baseline2 peak deposition (672.0 m/a): Synergy of Coastal water flow, Strong wind input, and precipitation; Baseline3 anomalies: Triangle protrusions from minor distributaries (suspended load deposition at confluences).
Figure 6.
EPR of Diaokou subdelta.
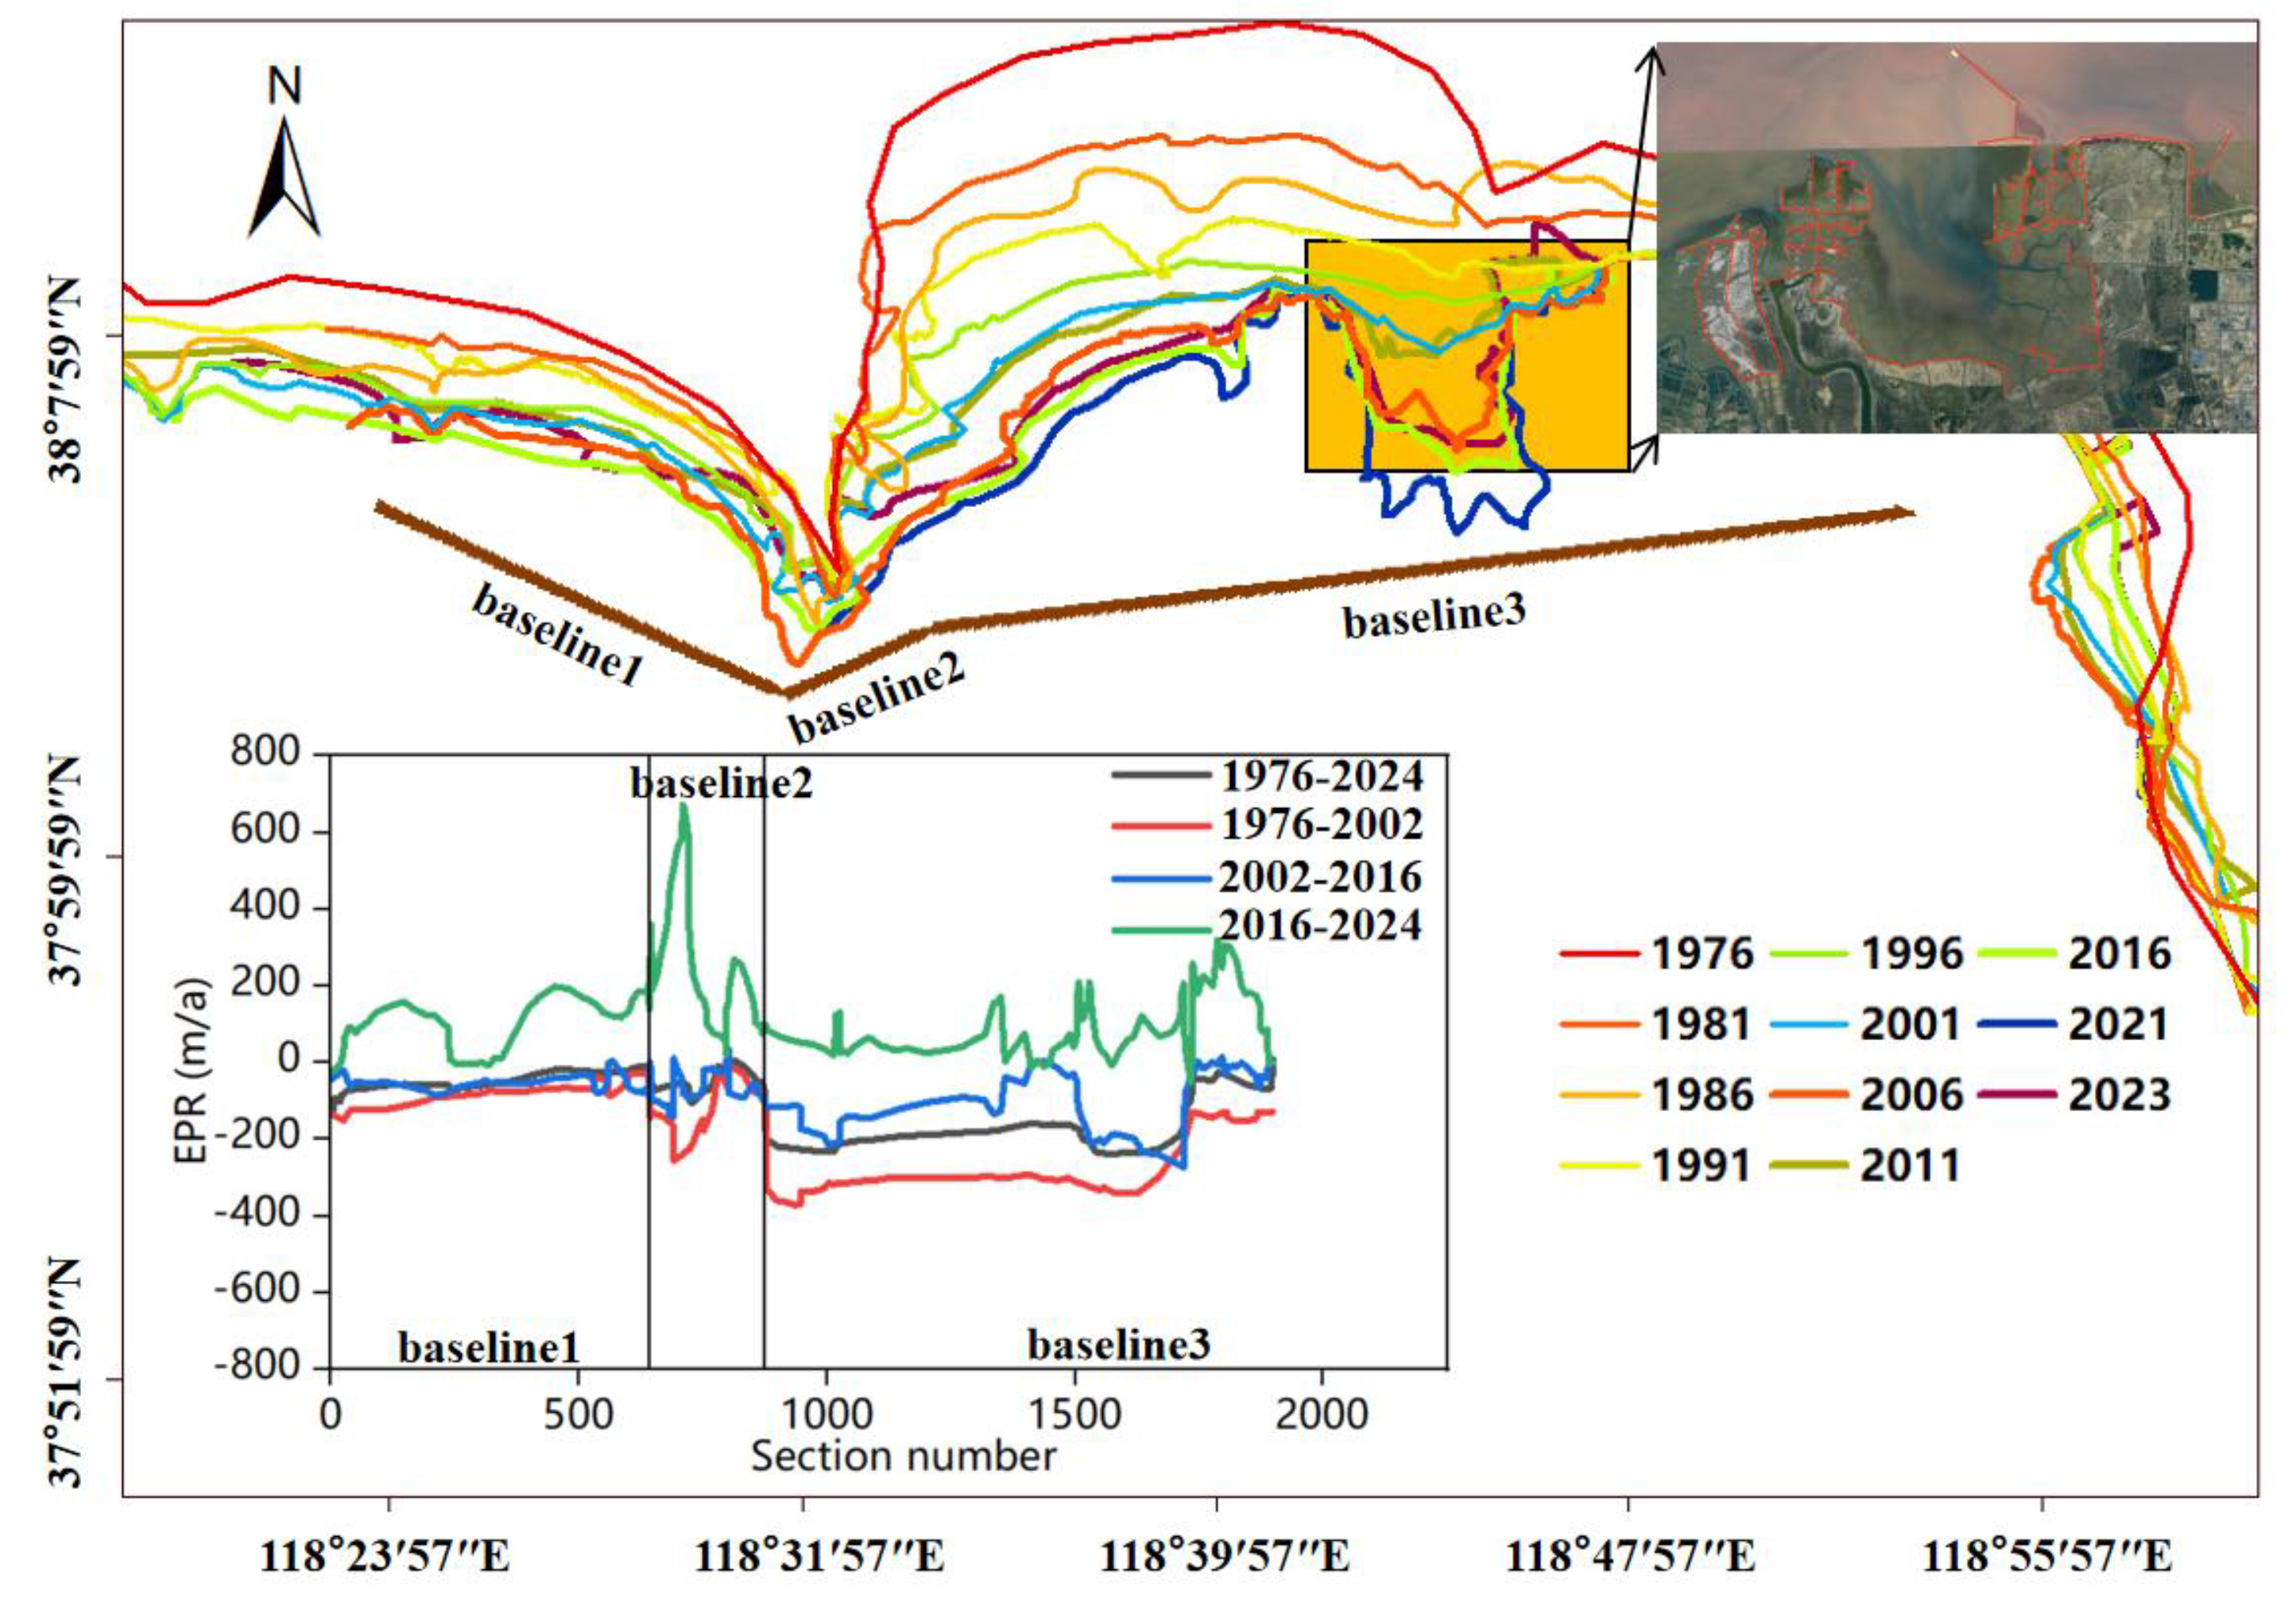

Table 2.
EPR(unit: m/a) of Diaokou subdelta.
| Period | Mean | Minimum | Median | Maximum |
|---|---|---|---|---|
| 1976-2024 | -115.8 | -240.6 | -71.7 | 7.8 |
| 1976-2002 | -195.8 | -372.1 | -151.2 | -3.4 |
| 2002-2016 | -87.3 | -273.9 | -72.2 | 33.2 |
| 2016-2024 | 109.5 | -50.5 | 83.8 | 672.0 |
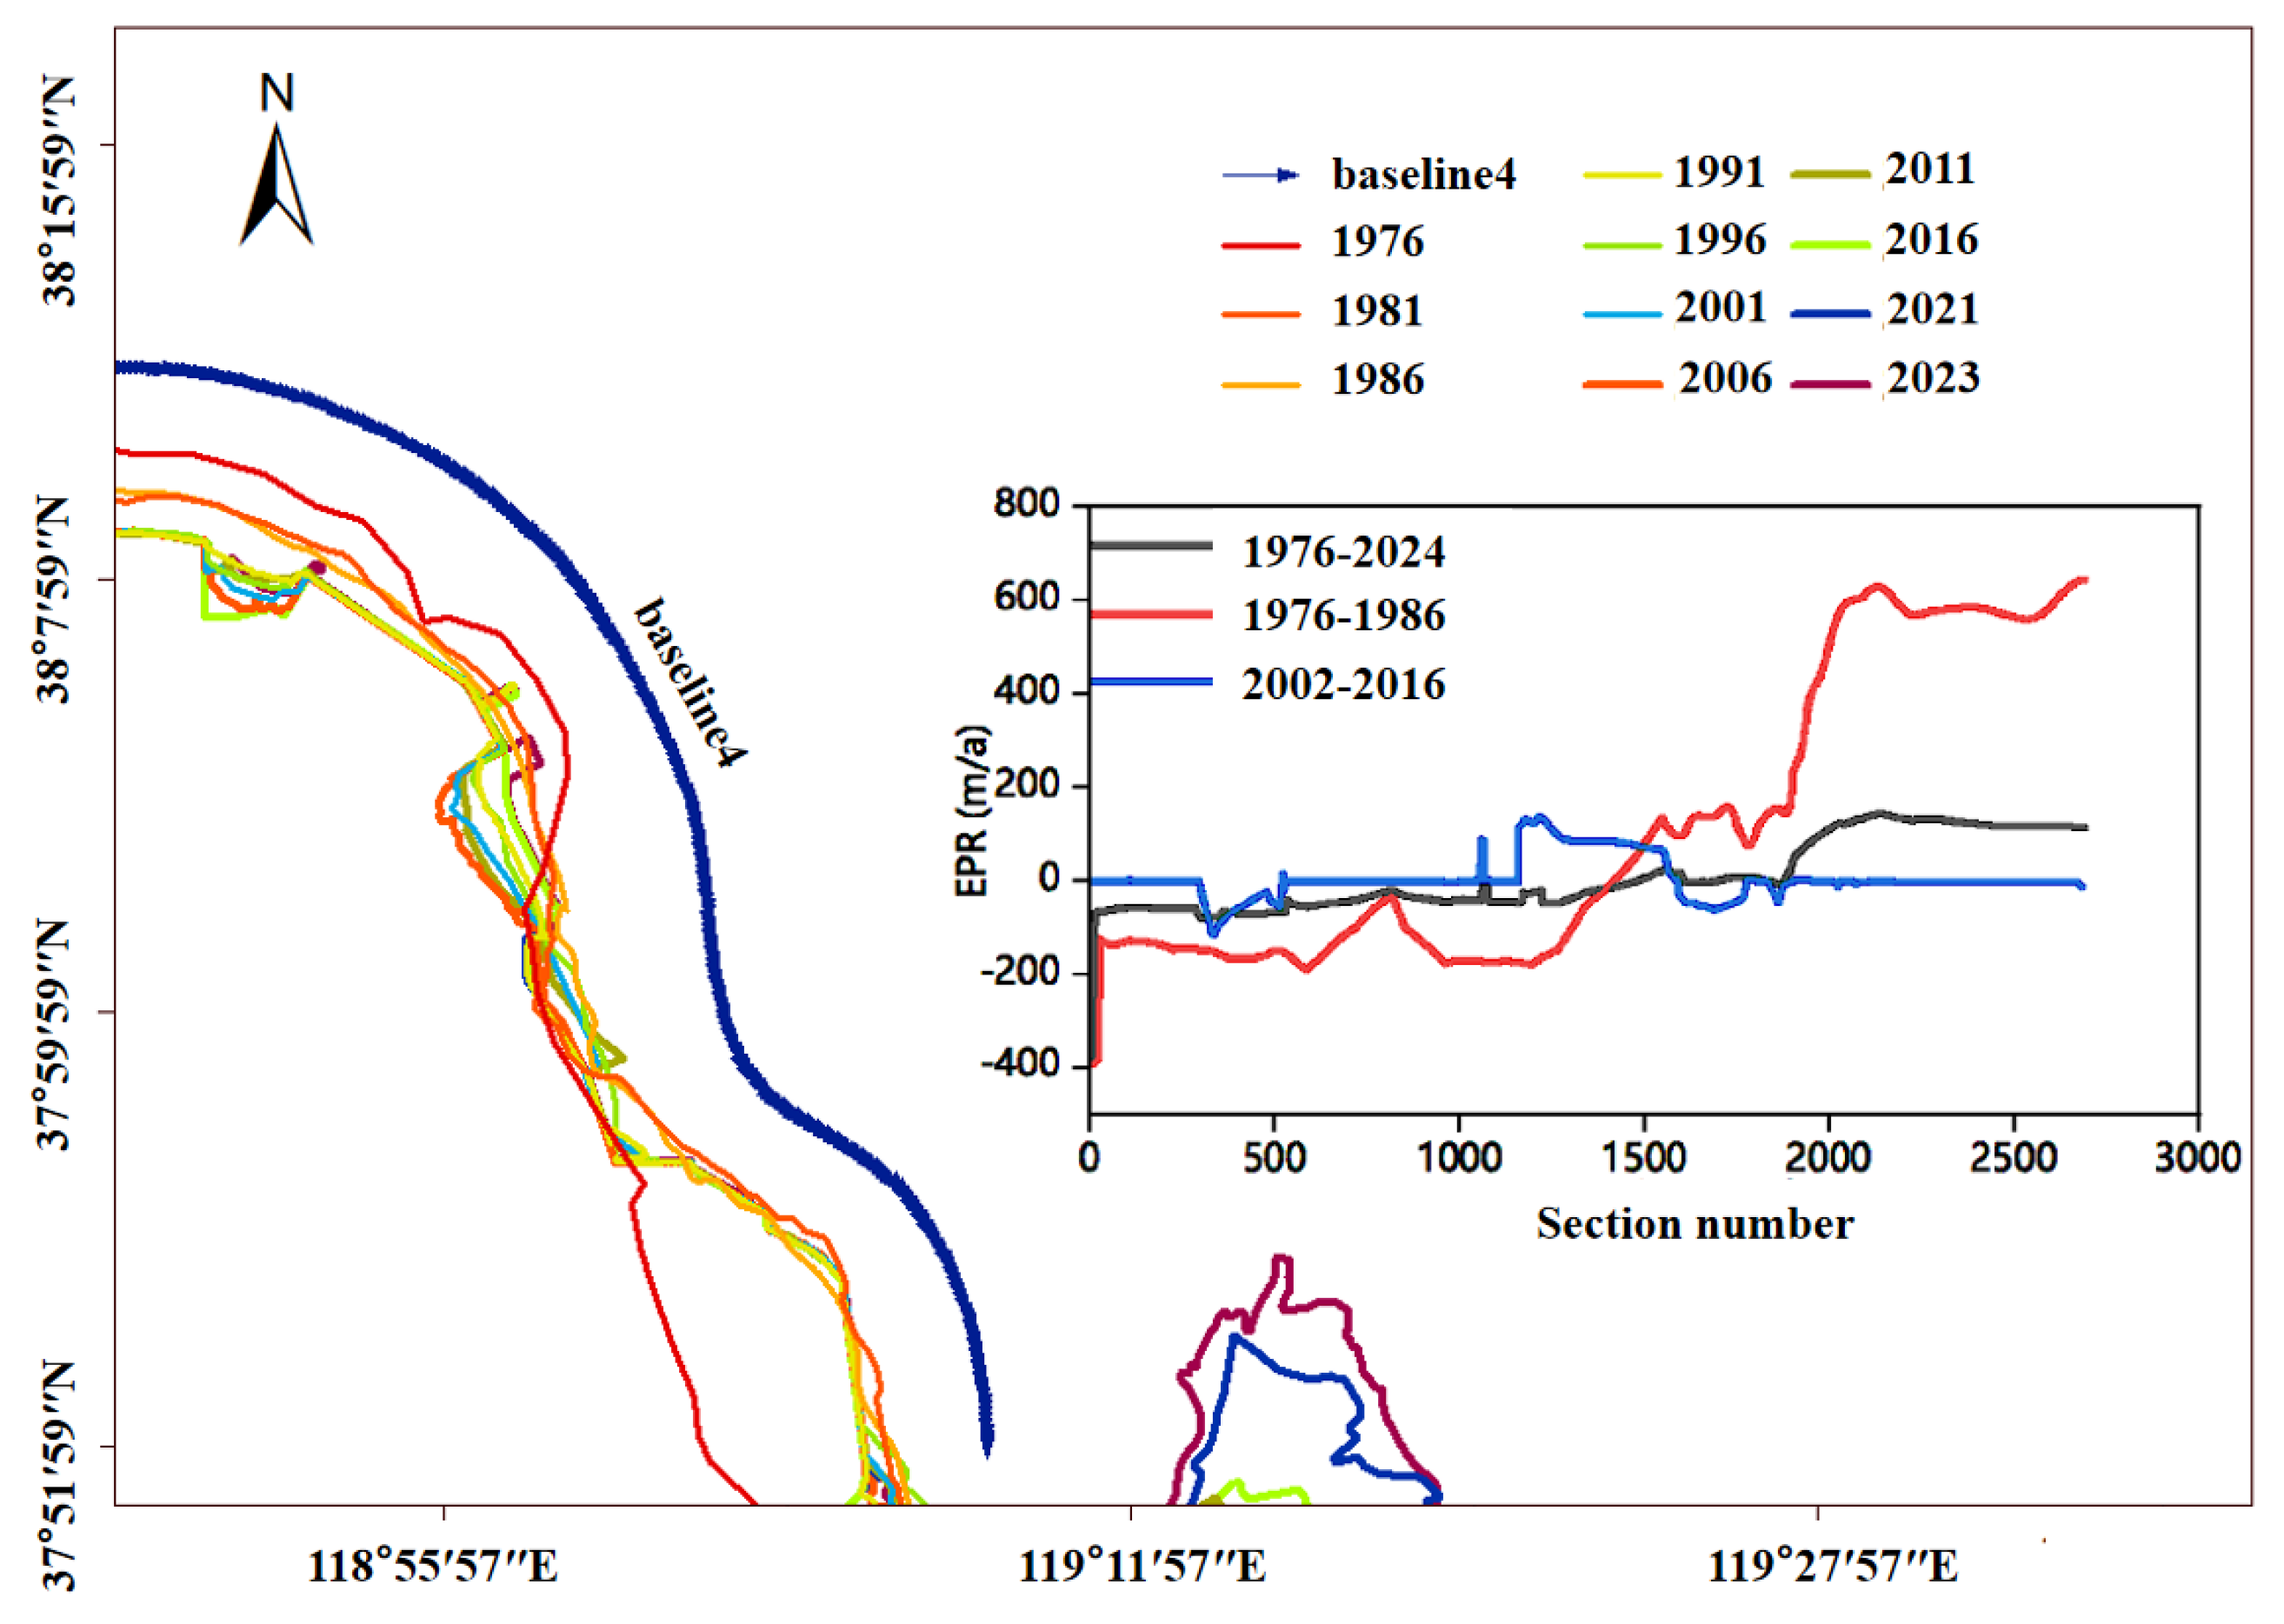
3.2.2. Dongying Port and Adjacent Areas
The Qingshuigou diversion area has maintained a net deposition regime since 1976, with mean
accumulation rate of 11.2 m/a. This weak deposition pattern reflects complex hydro-sedimentary
interactions across temporal and spatial scales
1. Pre-regulation phase (1976-1986)
- Near Diaokou River channel
Post-diversion hydrodynamic changes caused relatively strong fluvial scouring (-146.1 m/a
shoreline erosion rate), limiting sediment accumulation.
- Away from Diaokou River:
Reduced flow velocity allowed sediment settlement, resulting in localized deposition: An
extreme sedimentation peak of 645.1 m/a occurred at the artificial dike area, demonstrating human
activities' dominant environmental control; Average sedimentation rate in this segment: 587.6 m/a,
attributed to energy dissipation in the flat, open terminal reach terrain enabling gravity-driven
sedimentation.
2. Post-regulation phase (1986-present)
Shoreline stabilization occurred with a sedimentation rate of 5 m/a:
- Dikes altered local hydrodynamics by:
Blocking direct fluvial erosion, redirecting flow energy, and promoting sediment deposition
near dikes to counteract erosion. Dampening tidal/wave impacts, reducing marine erosion and
maintaining stability.
- This aligns with Niu Mingxiang's team's 1997-1999 observations of stable Dongying-section shorelines.
Figure 7.
EPR of Dongying Port and Adjacent areas.
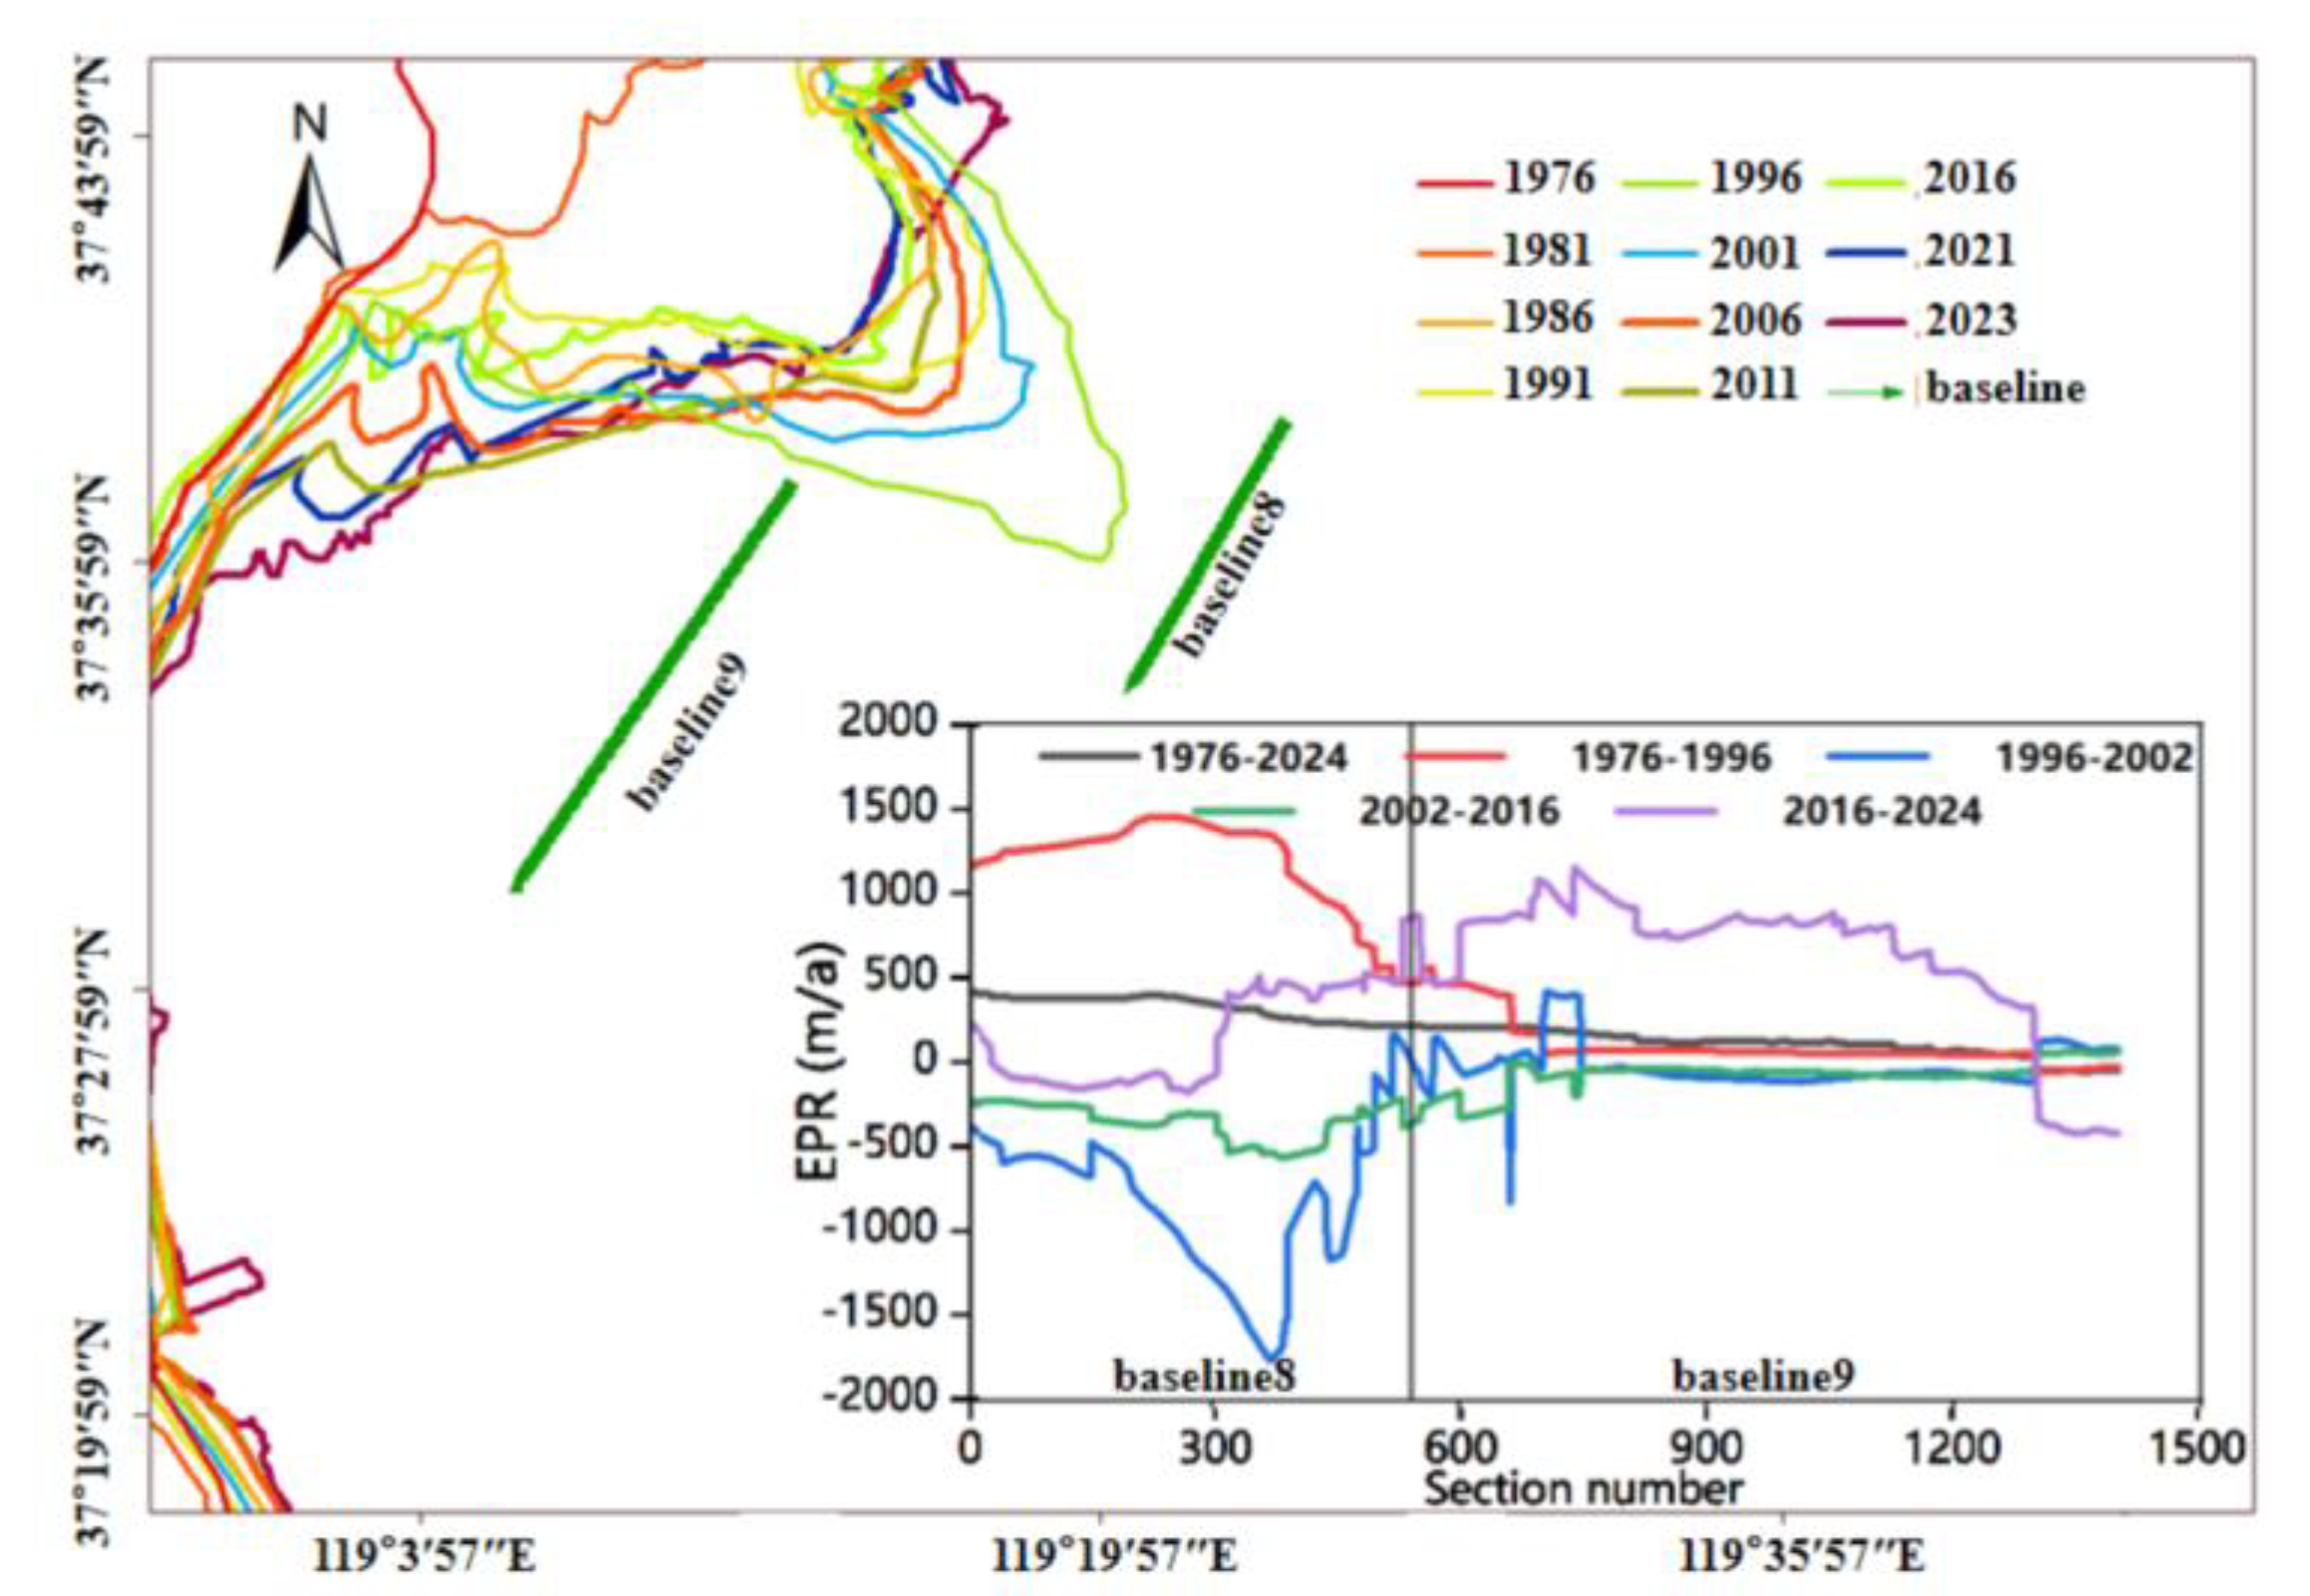
3.2.3. Qingshuigou Subdelta
Since the 1976 Qingshuigou diversion, the Yellow River estuary has exhibited complex erosiondeposition
dynamics.
1. Post-1976 Qingshuigou Diversion Initial Phase(1976-1996):
- Extremely significant sedimentation occurred in the Yellow River estuary:Average sedimentation rate: 527.7 m/a, peaking at 1453.9 m/a.
- Causal mechanisms: direct supply of fine-grained sediments to Laizhou Bay and the current estuary area reduced sand content and increased deposition rates. Slower initial flow velocity in the new channel limited sediment transport to deeper waters, leading to rapid landbuilding through near-estuary accumulation.
2. Post-Bifurcation to Pre-Water-Sediment Regulation Phase(1996-2002):
- Average erosion rate: -327.0 m/a.
- Mechanisms:Altered channel morphology and hydrodynamics increased fluvial scouring of channels and estuarine peripheries. Higher flow energy re-entrained and transported previously deposited sediments, causing significant erosion.
3. Water-Sediment Regulation Period(2002-2016):
- Erosion rate decreased to -181.6 m/a.
- Regulatory effects:engineered adjustments to discharge/sediment concentration maintained controlled scouring capacity.Balanced flow parameters prevented excessive bank/estuarine erosion while promoting relative shoreline stability.
4. Post-2016 monitoring reveals(2016-2024):
Overall stable estuary with net sedimentation (439.7 m/a), but localized erosion persisted:
- Average erosion rate: -187.1 m/a in specific areas.
- Mechanisms:residual hydrodynamic adjustments post-diversion caused localized flow velocity/direction changes.Topographic variations led to selective sediment removal, aligning with Liu Xinxin's team's 1996-2020 findings of -167 m/a average shoreline change rate in Qingshuigou[62].
Figure 8.
EPR of the Qingshuigou Subdelta.
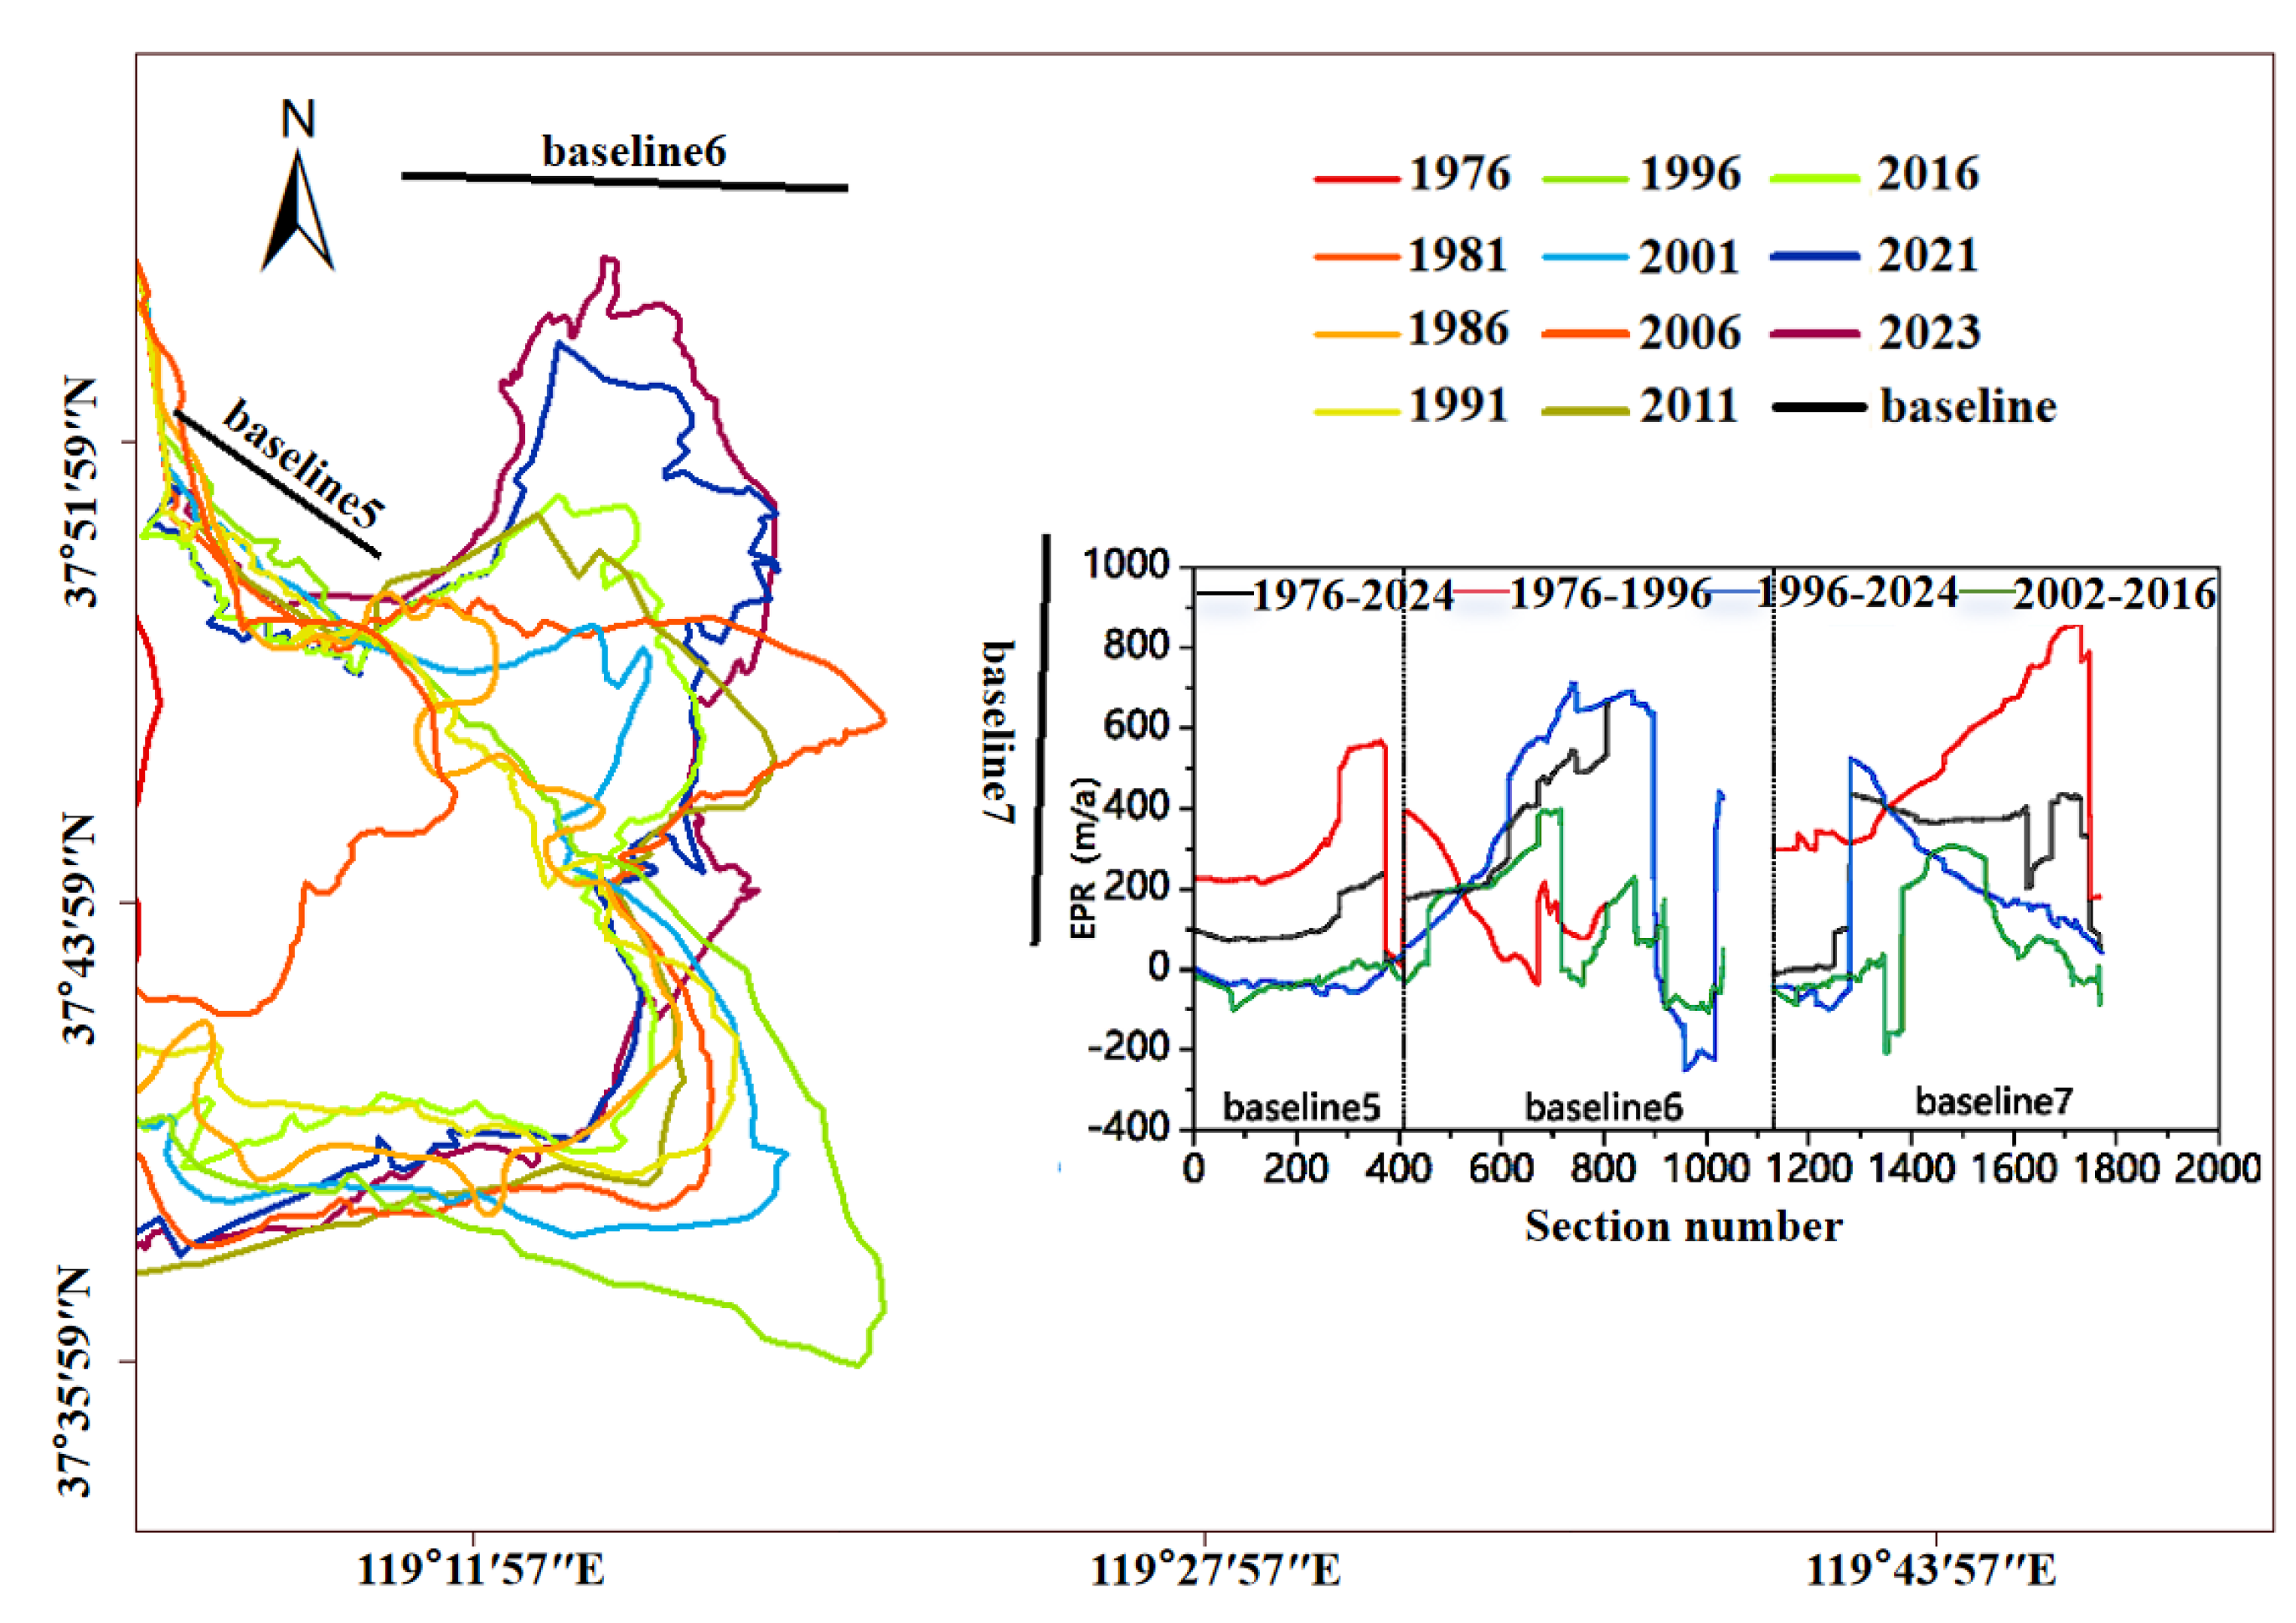
3.2.4. Qingshuigou Subdelta
1. Qingshuigou Flow Period (1976-1996):
During channel migration, baseline7 vertical direction showed significant sedimentation:
Maximum: 863 m/a, average: 353 m/a.
Mechanisms:
- Unstable sediment transport capacity due to shifting flow directions during migration.
- Flow deceleration created low-flow zones promoting sedimentation.
Baseline-specific patterns:
- Baseline5: reduced sedimentation from profile 380 onward, indicating stable low-flow areas.
- Baseline6: no data at profile 830 due to lateral shoreline extension beyond the surveyed area.
- Baseline7: steady sedimentation growth, reflecting unstable erosion processes near the active estuary, corroborates Liu Xinxin's team's 260 m/a sedimentation rate for the current estuary area[62].
2. Post-1996 Qing 8 Channel Bifurcation Project Phase:
Overall sedimentation trend with an average erosion-deposition rate (EPR) of 181 m/a, but
localized erosion occurred near channel margins:
- Total sedimentation likely resulted from altered flow paths/velocities causing sediment accumulation in new areas.
- Localized erosion may have been influenced by transverse circulation: centrifugal forces generated lateral flow currents near channel margins, scouring sediments from the riverbed.
3. Water-Sediment Regulation Period(2002-2016):
Result: the vertical extent in the Yellow River Delta remained stable (mean 63 m/a) during the
2002–2016 Water-Sediment Regulation (WSR), effectively mitigating large-scale deposition,
riverbank scouring, and localized erosion/deposition fluctuations
Causes: optimized sediment transport capacity through precise water-sediment flux ratio
adjustment. Balanced discharge control maintaining adequate hydrodynamic force while preventing
excessive flow intensity. Stable hydrodynamic conditioning suppressing abrupt hydraulic variations
during WSR operations
Figure 9.
EPR of Active River Mouth.
4. Discussion
The shoreline evolution of the Yellow River Delta is governed by a complex interplay of natural and anthropogenic factors, as evidenced by the spatiotemporal variations in erosion-deposition patterns across subregions. The following key influences are discussed:
1. Riverine Sediment Supply
High sediment discharge from the Yellow River historically drove rapid progradation in active distributary mouths, such as the Qingshuigou Subdelta during 1976–1996 (mean EPR: 527.7 m/a), accompanied by moderate shoreline stability (23%) and gentle DEM-derived bathymetric gradients (<0.1°). This aligns with studies emphasizing the dominance of fluvial sediment inputs in deltaic land-building processes[12,63]. However, post-diversion sediment deprivation (e.g., Qingshuigou’s post-1996 erosion at -327.0 m/a) triggered shoreline instability (10%) and DEM-identified incisions (0.3m depth) mirrors observations by Carvajal et al.[64], who noted that channel abandonment triggers marine-driven erosion due to severed sediment supply. Comparatively, the Diaokou Subdelta’s recovery during 2016–2024 (mean EPR: 109.5 m/a) exhibited moderate shoreline stability (18%) and DEM-mapped sediment lobes (1m depth) ,highlights the role of tributary sediment pulses, similar to findings by Sedigh et al[65]. on localized sediment redistribution.
2. Marine Dynamics
Wave energy and tidal currents significantly influenced erosional hotspots, particularly in abandoned lobes. For instance, the Diaokou Subdelta experienced severe retreat (-195.8 m/a) during 1976–2002, concurrent with persistently low shoreline stability indices (3% in 1976–1986, 5% in 1986–2002) and DEM-detected incision depths (1.6 m at Profile 1, 0.8 m at Profile 2 in 1976; 1.6 m at Profile 1, 1.2 m at Profile 2 in 1996). This aligns with Bai et al.[24], who attributed such retreat to concentrated wave energy in concave coastal zones. Similarly, localized erosion near the active river mouth (e.g., -203.8 m/a post-1996) reflects transverse circulation effects, corroborating Syvitski’s[66] model of hydrodynamic reworking at distributary margins. These erosional phases corresponded to abrupt declines in shoreline stability (e.g., Dongying Port: 1% in 1976–1986 to 17% in 1986–2002; active river mouth: 0% in 1976–1986 to 10% in 1986–2002) and intensified DEM-derived incision features (e.g., active river mouth profile: 0.5 m in 1976, 0.4 m in 1996, 0.7 m in 2024). Post-2016 recovery at Diaokou (shoreline stability: 18%; DEM incision depths: 1.0 m at Profile 1, 0.6 m at Profile 2 in 2024) contrasts sharply with Qingshuigou’s complete destabilization (0% stability in 2016–2024; DEM incision: 0.9 m in 2024), highlighting spatial heterogeneity in sediment resilience.
3. Anthropogenic Interventions
Engineering projects, such as artificial levees and water-sediment regulation, reshaped shoreline dynamics. The Dongying Port’s stabilization (post-1986 EPR: 5 m/a) demonstrates how dikes redirected flow energy and suppressed marine erosion, as observed in Wang et al.’s[27] analysis of hydraulic infrastructure impacts. This stabilization coincided with rising shoreline stability indices (1% in 1976–1986 to 86% in 2016–2024) and reduced DEM-detected incision depths (Profile 1: 0.35 m in 1976 → 0.7 m in 1996 → 0.4 m in 2024). The 1996 Qing 8 diversion triggered severe Qingshuigou erosion (average -327 m/a), marked by collapsing shoreline stability (23% in 1976–1986 → 0% in 2016–2024) and deepening DEM incisions (0.35 m in 1976 → 0.9 m in 2024). Conversely, water-sediment regulation (2002–2016) alleviated erosion rates (e.g., Diaokou: from -195.8 m/a to -87.3 m/a), paralleling improved shoreline stability (3% in 2002–2016 → 18% in 2016–2024) and moderated DEM incision depths (Profile 1: 1.6 m in 1976 → 1.0 m in 2024). These trends align with Li et al.’s[67] strategies for balancing erosion and deposition, underscoring how engineered interventions modulate both hydrodynamic forces and geomorphic feedbacks.
4. Geomorphological Feedback
Subdelta-specific responses underscore the role of local topography. For example, the active river mouth’s persistent progradation (3.75 km/a post-2016) reflects its low-gradient, deposition-prone morphology, consistent with Wang et al.[68]. This progradation occurred despite declining shoreline stability (40% in 2002–2016 to 6% in 2016–2024) and intensified DEM-detected incision depths (profile: 0.4 m in 1996 → 0.7 m in 2024), suggesting localized depositional dominance over broader erosional trends. In contrast, the Diaokou Subdelta’s transition to dynamic equilibrium post-2016 highlights how antecedent morphology (e.g., shoals) and water-sediment balance modulated its recovery. Post-regulation shoreline stability rose from 3% (2002–2016) to 18% (2016–2024), coupled with reduced DEM incision depths (Profile 1: 1.6 m in 1976 → 1.0 m in 2024; Profile 2: 1.2 m in 1996 → 0.6 m in 2024), aligning with Wang et al.’s [69] framework of morphodynamic feedbacks. Qingshuigou’s complete destabilization (0% stability in 2016–2024) and deepening DEM incisions (0.35 m in 1976 → 0.9 m in 2024) further emphasize how abandoned lobes lacking topographic resilience amplify erosion under sediment deprivation.
Figure 10.
Water and Sediment fluxes with DEM.
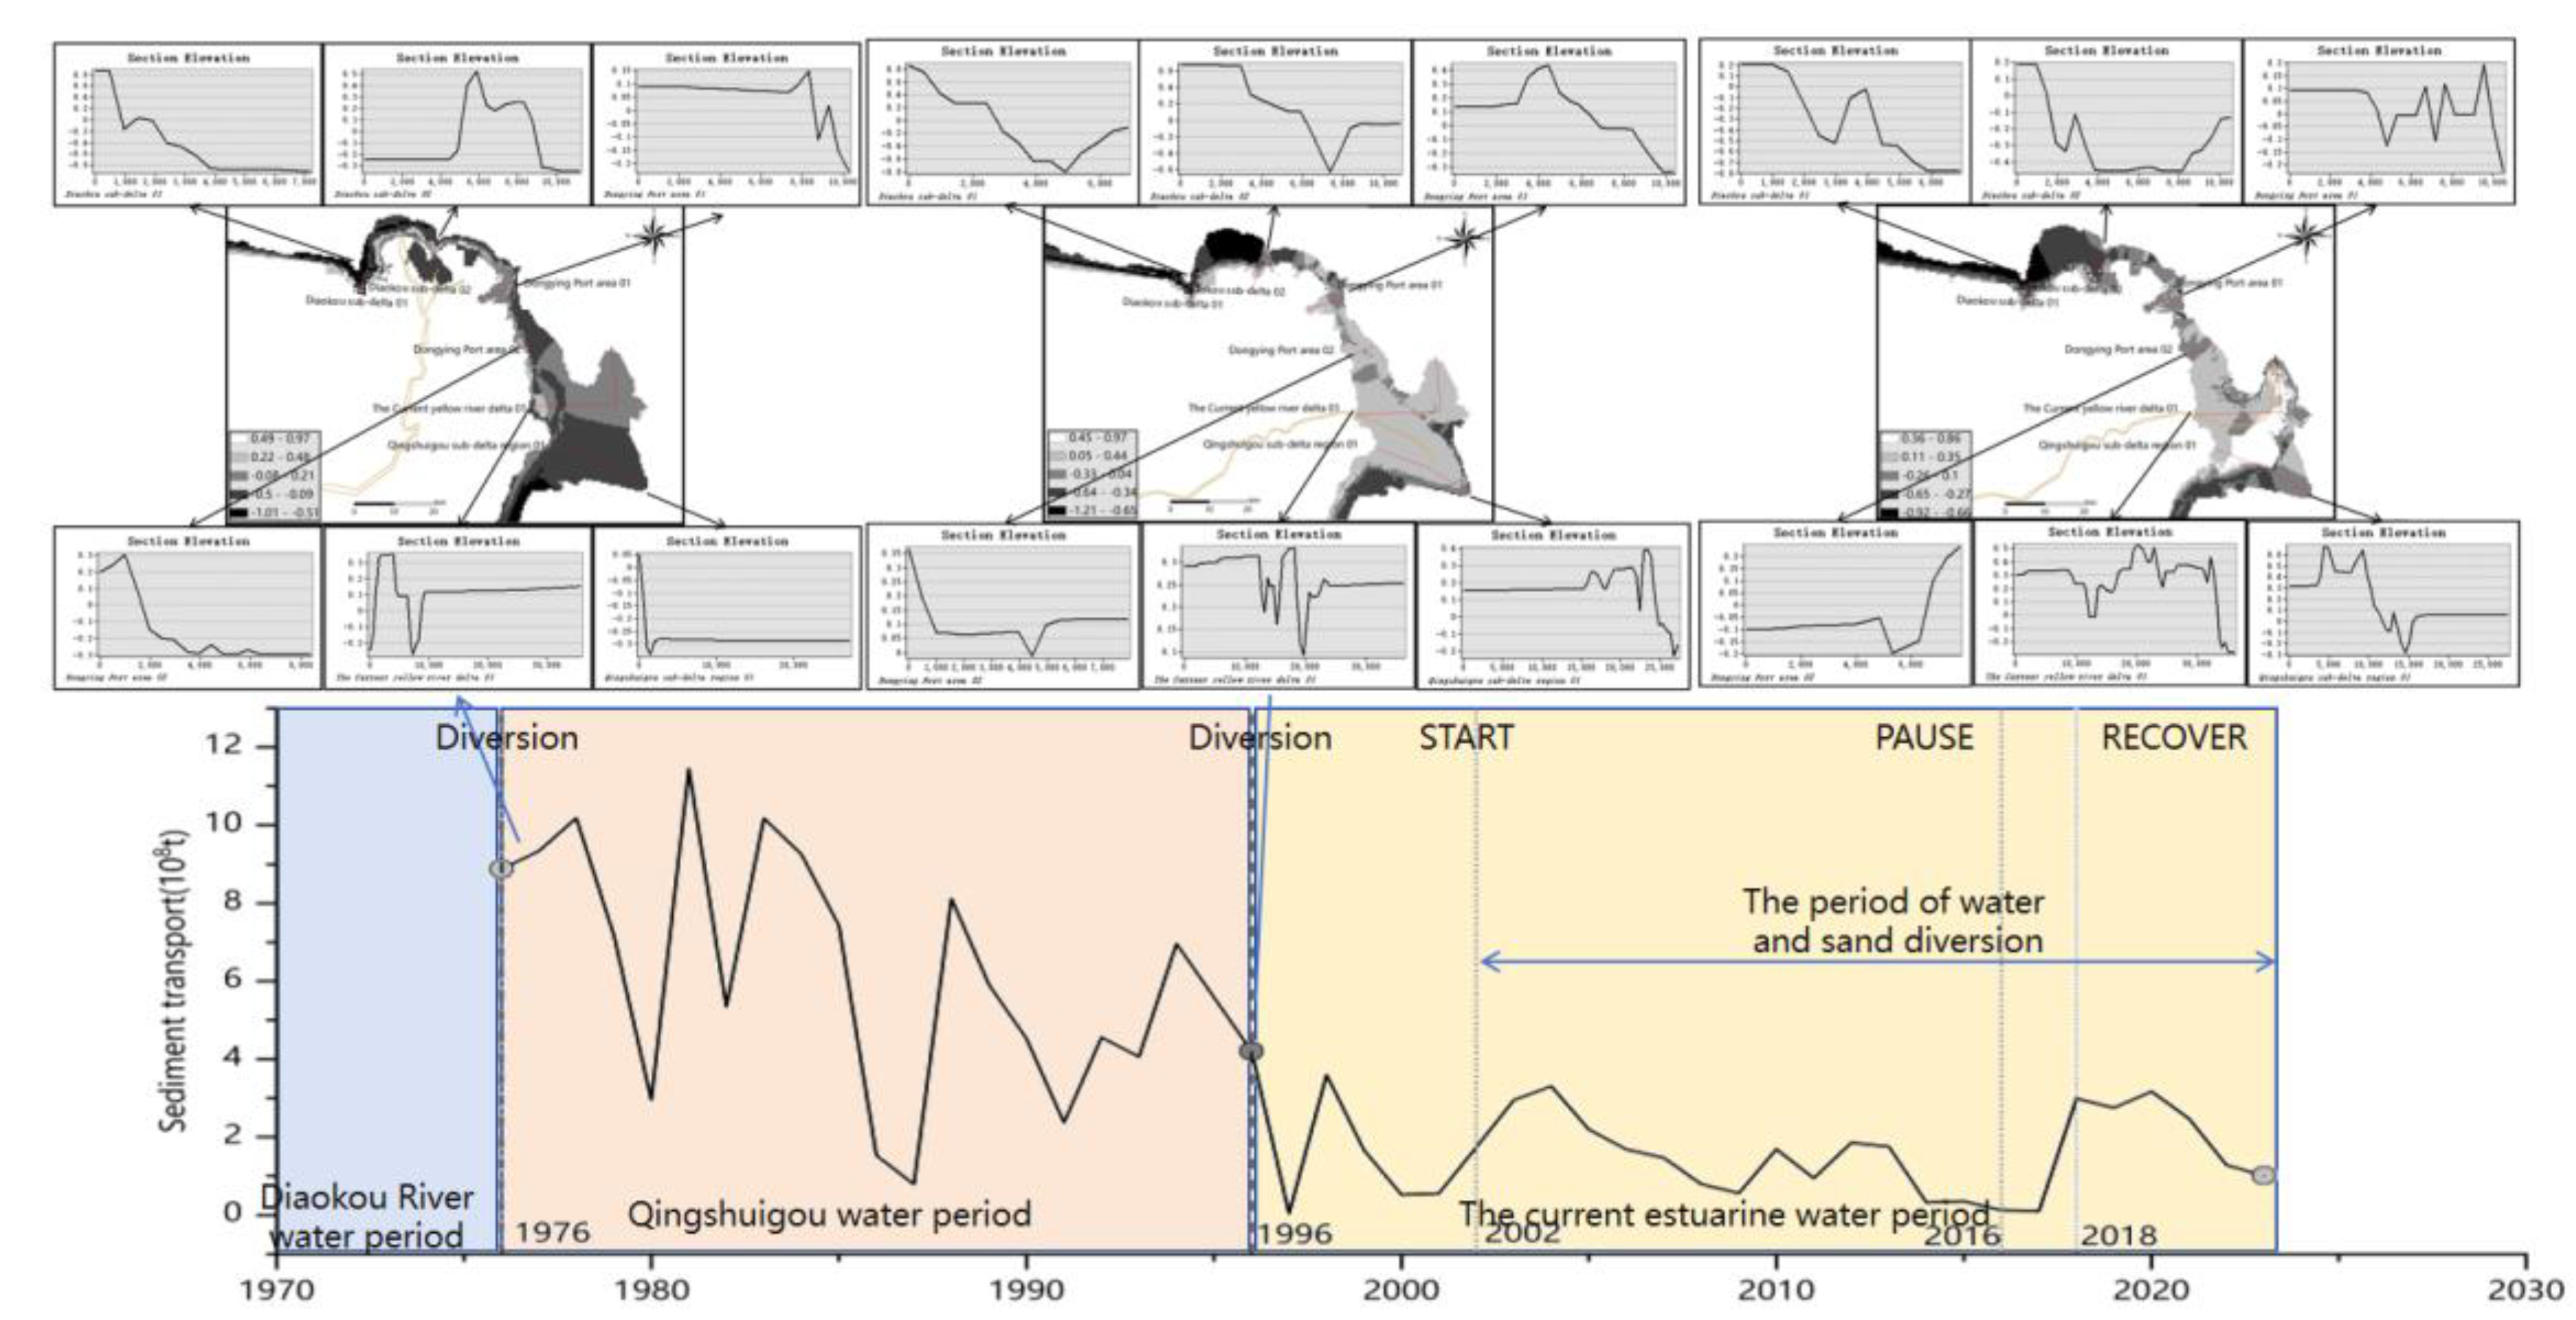
Figure 11.
Stability indicators from 1976 to 1986.
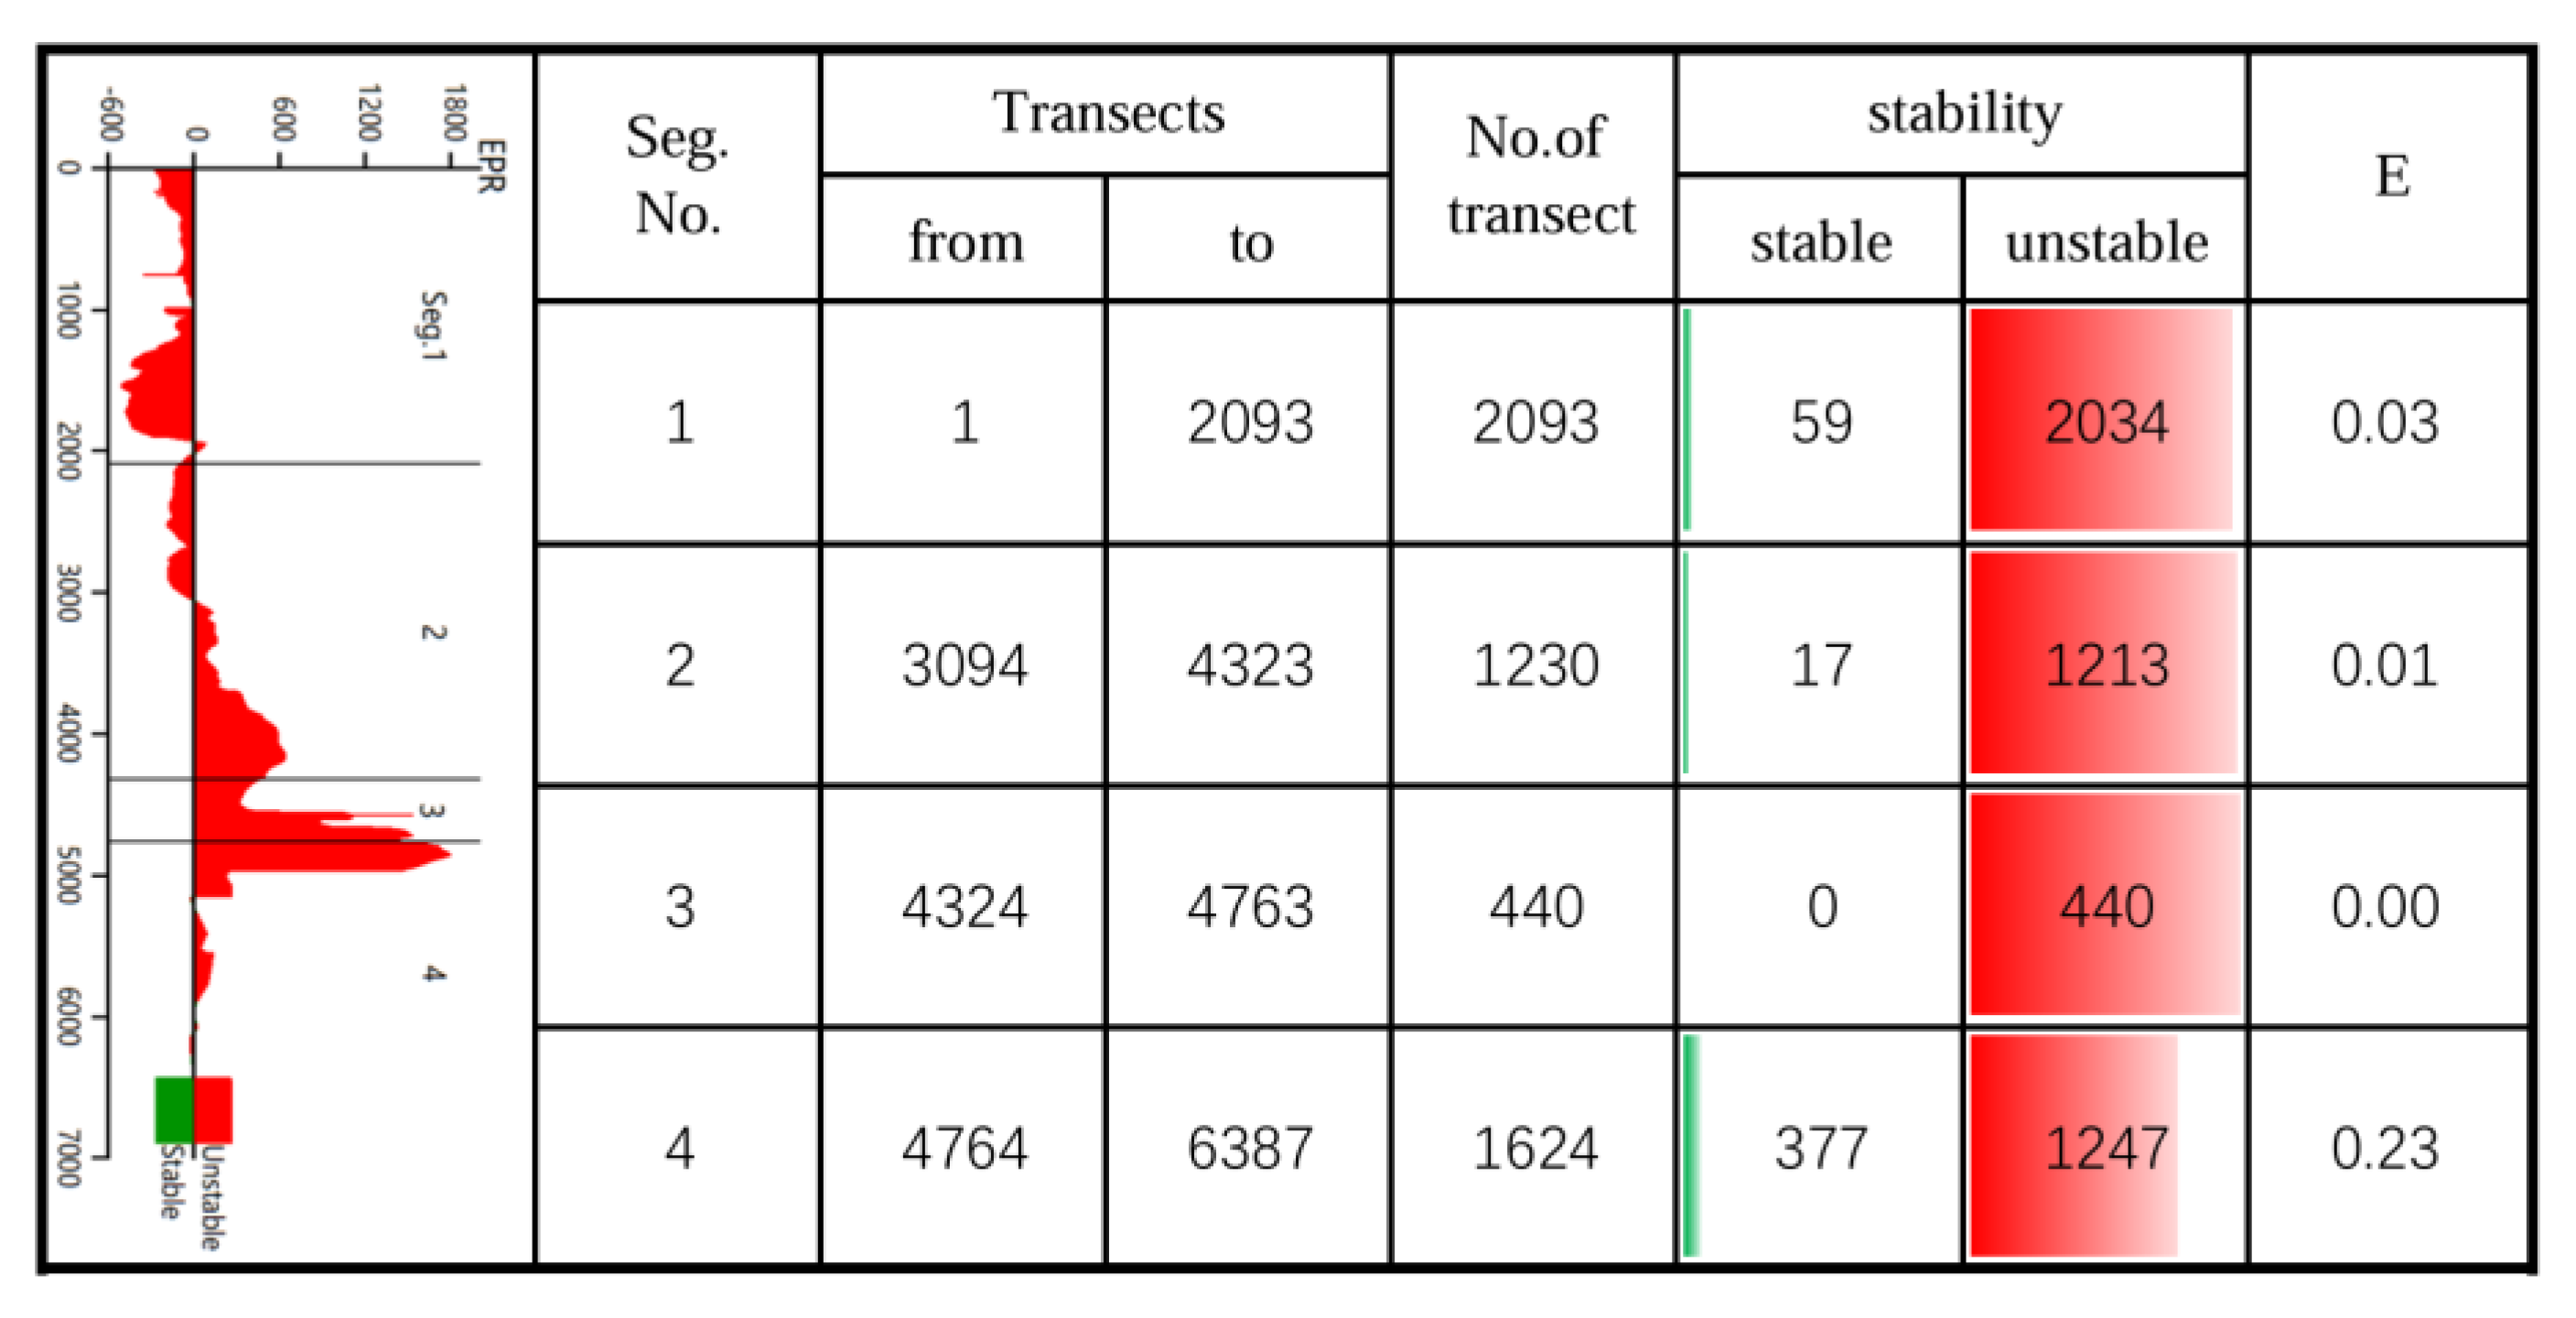
Figure 12.
Stability indicators from 1986 to 2002.
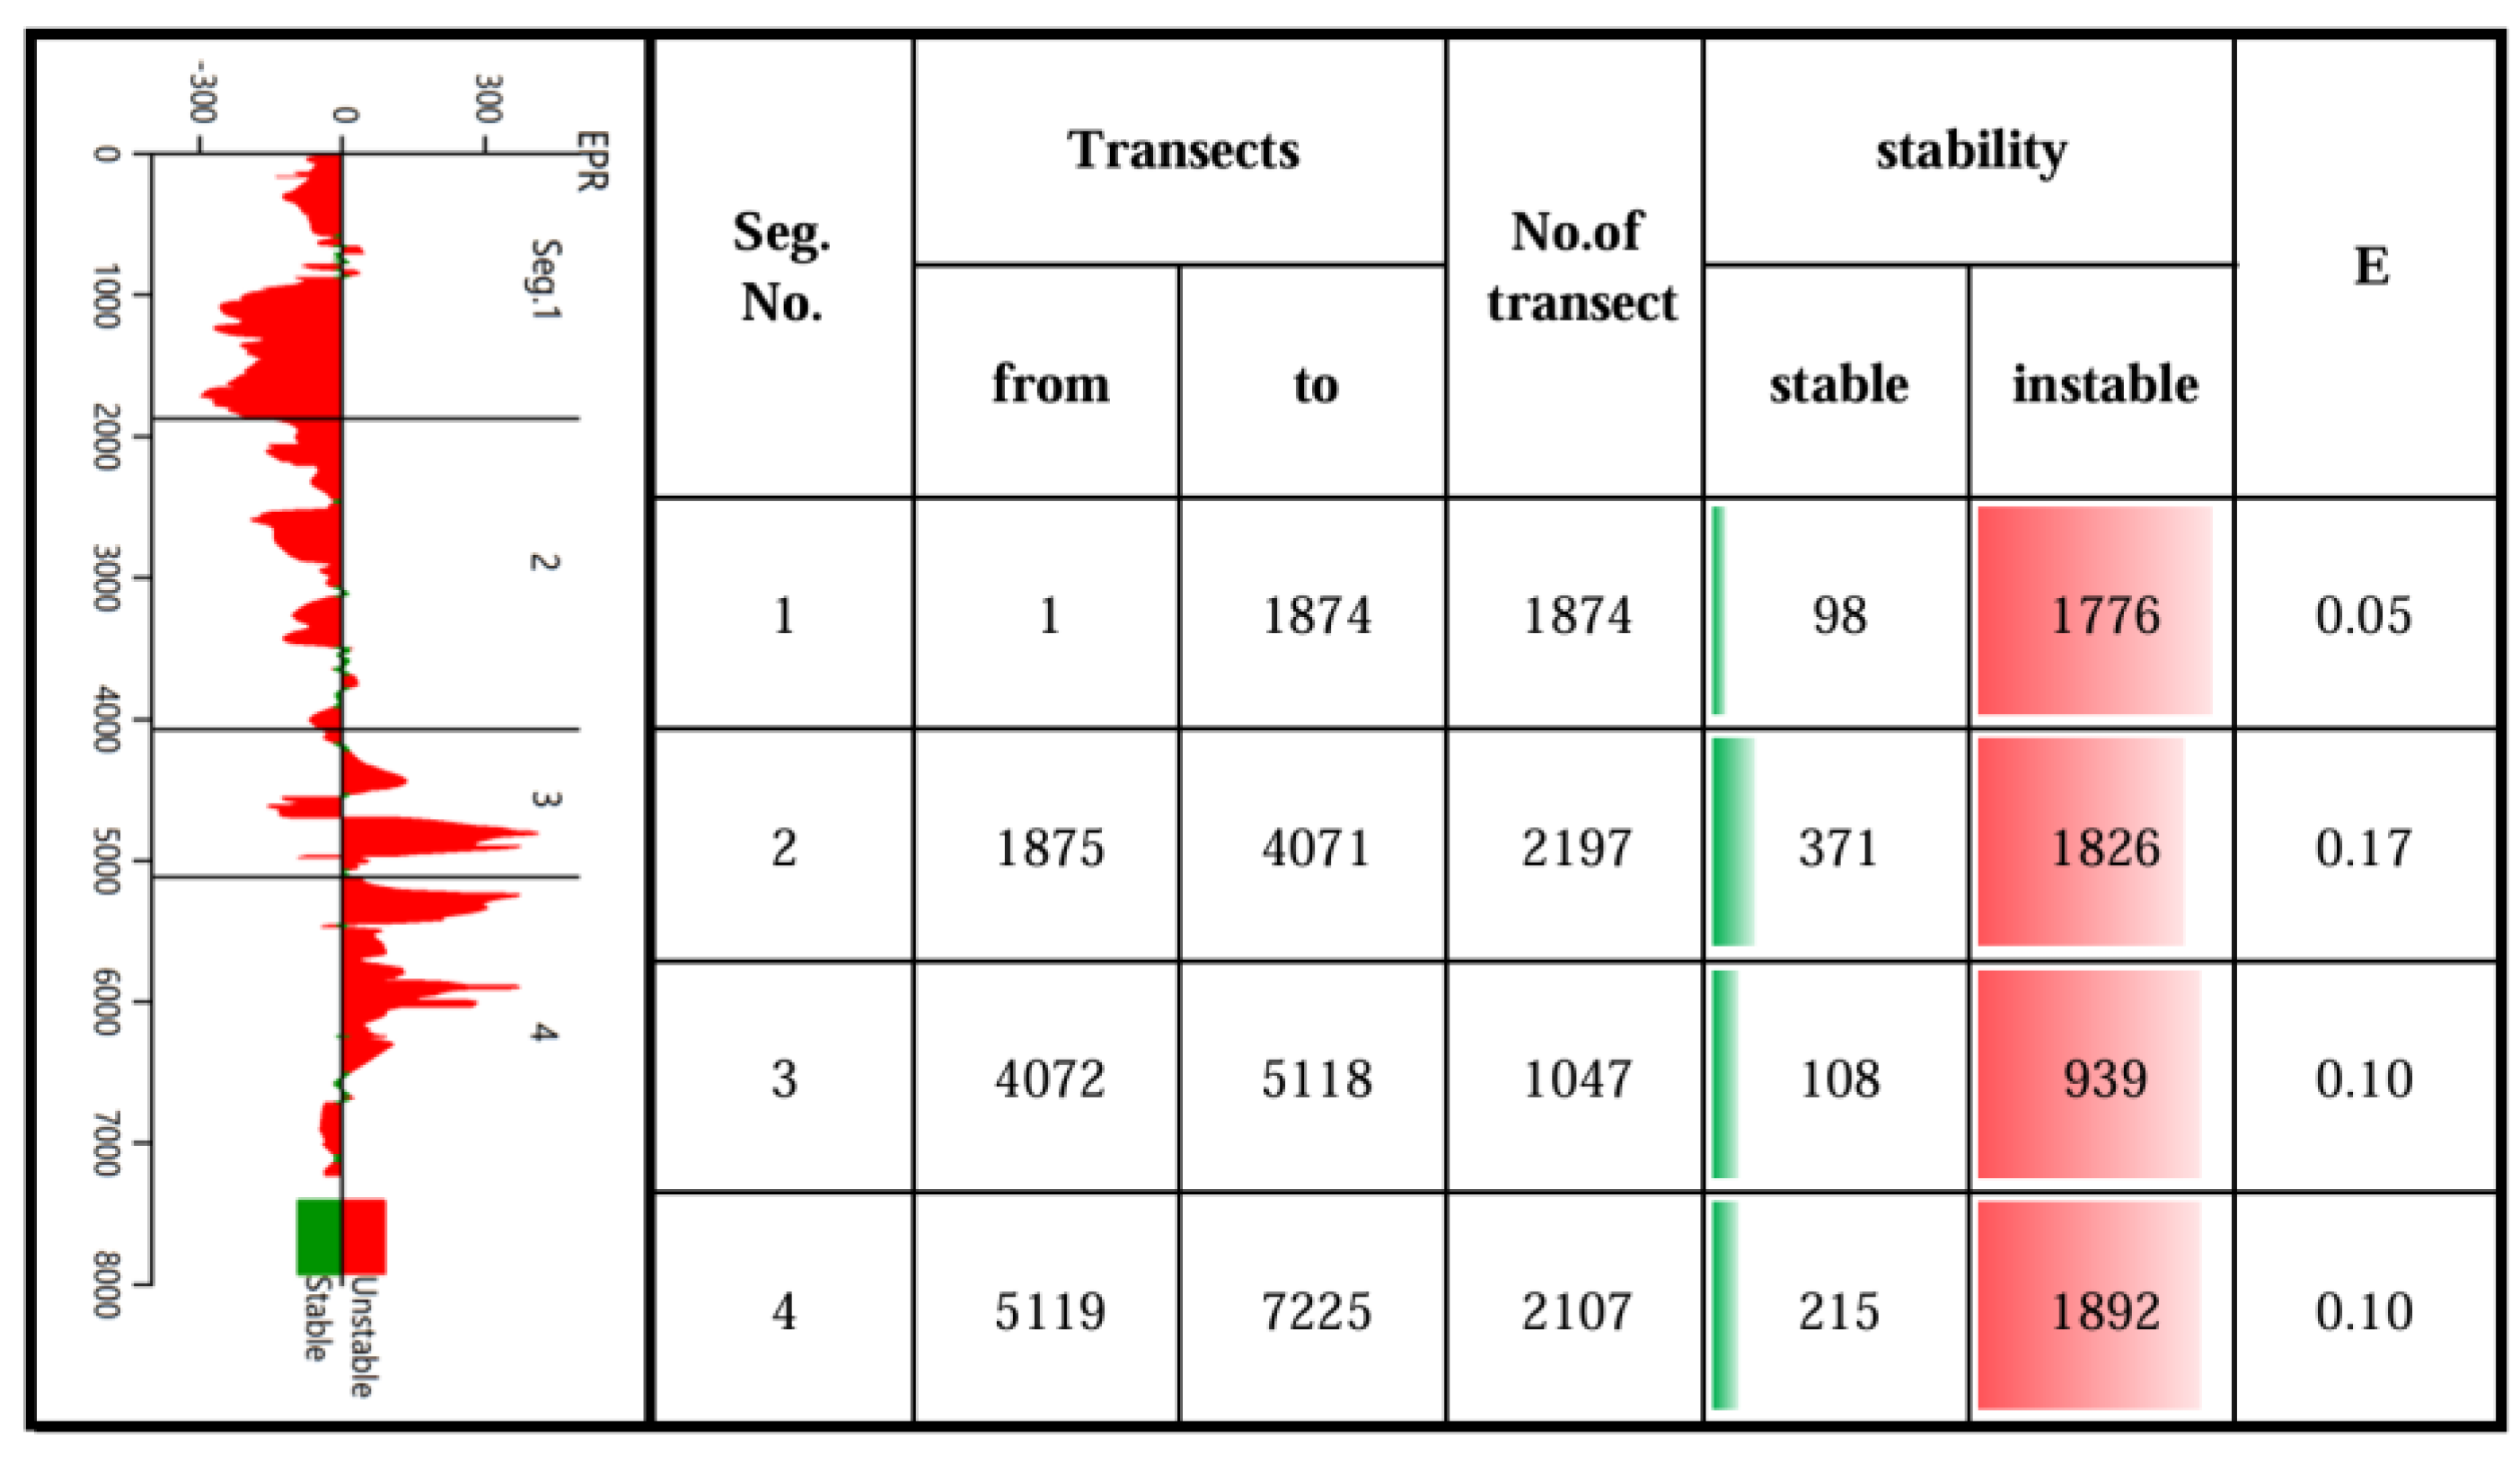
Figure 13.
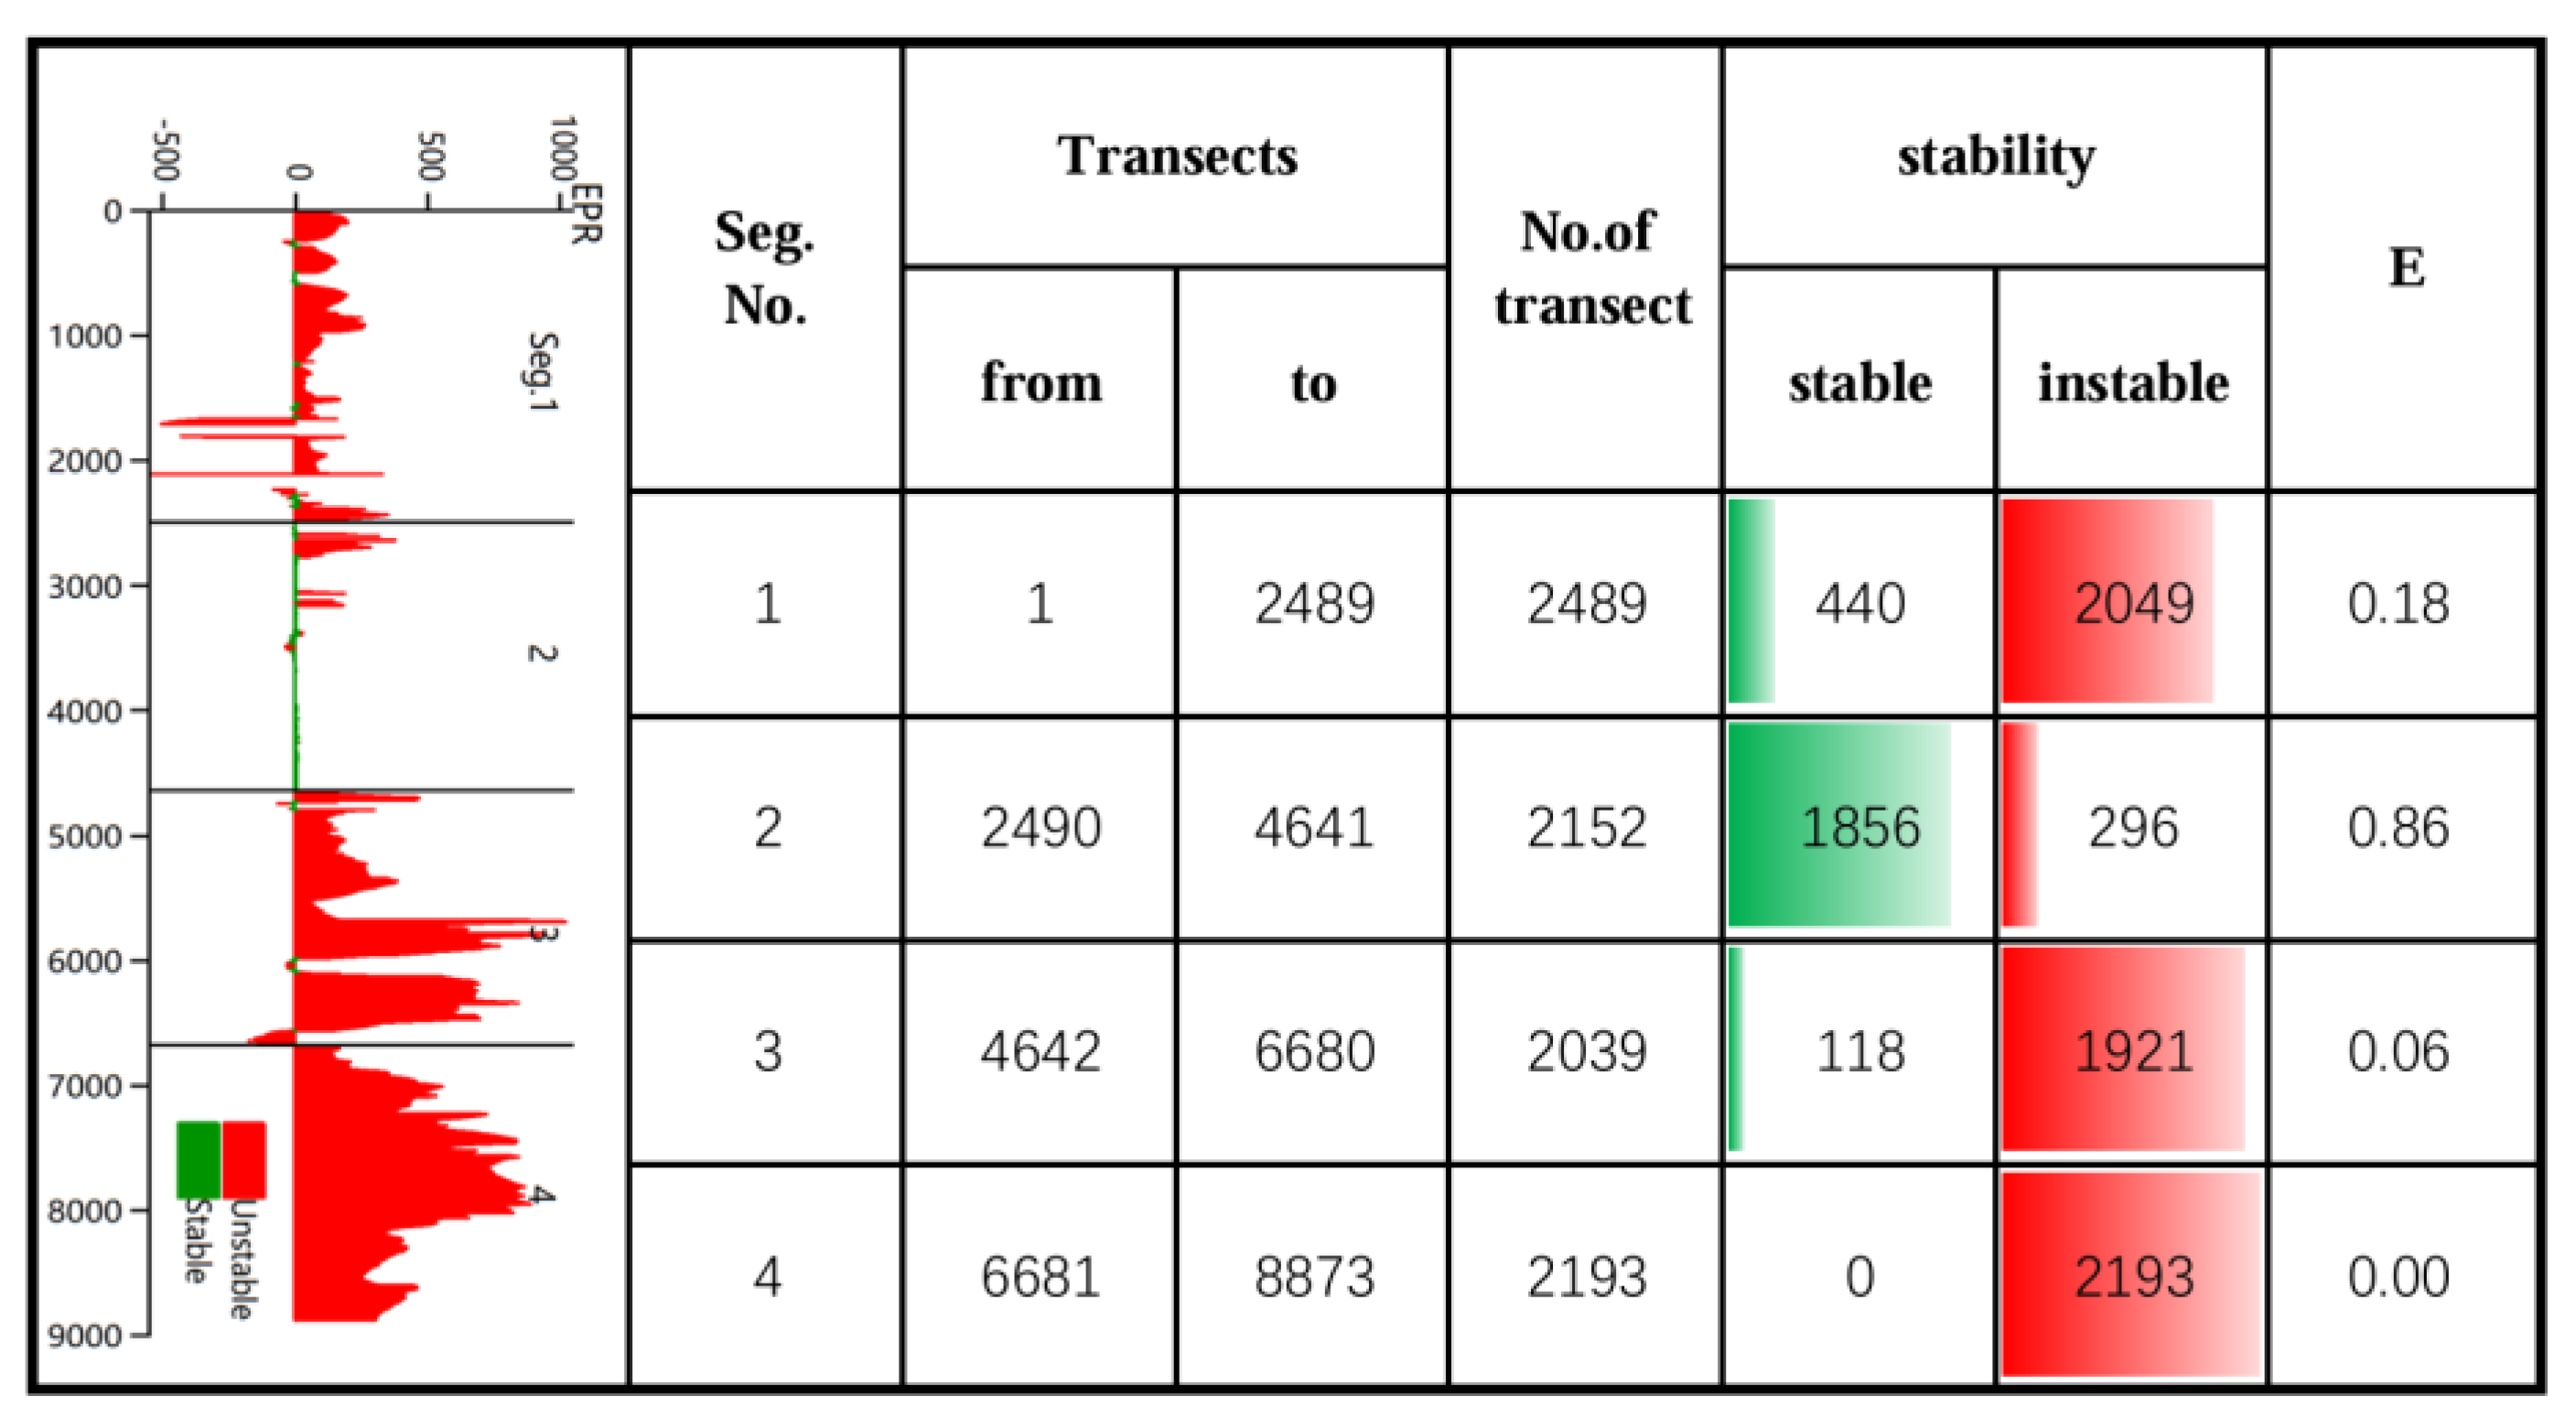
Stability indicators from 2002 to 2016.
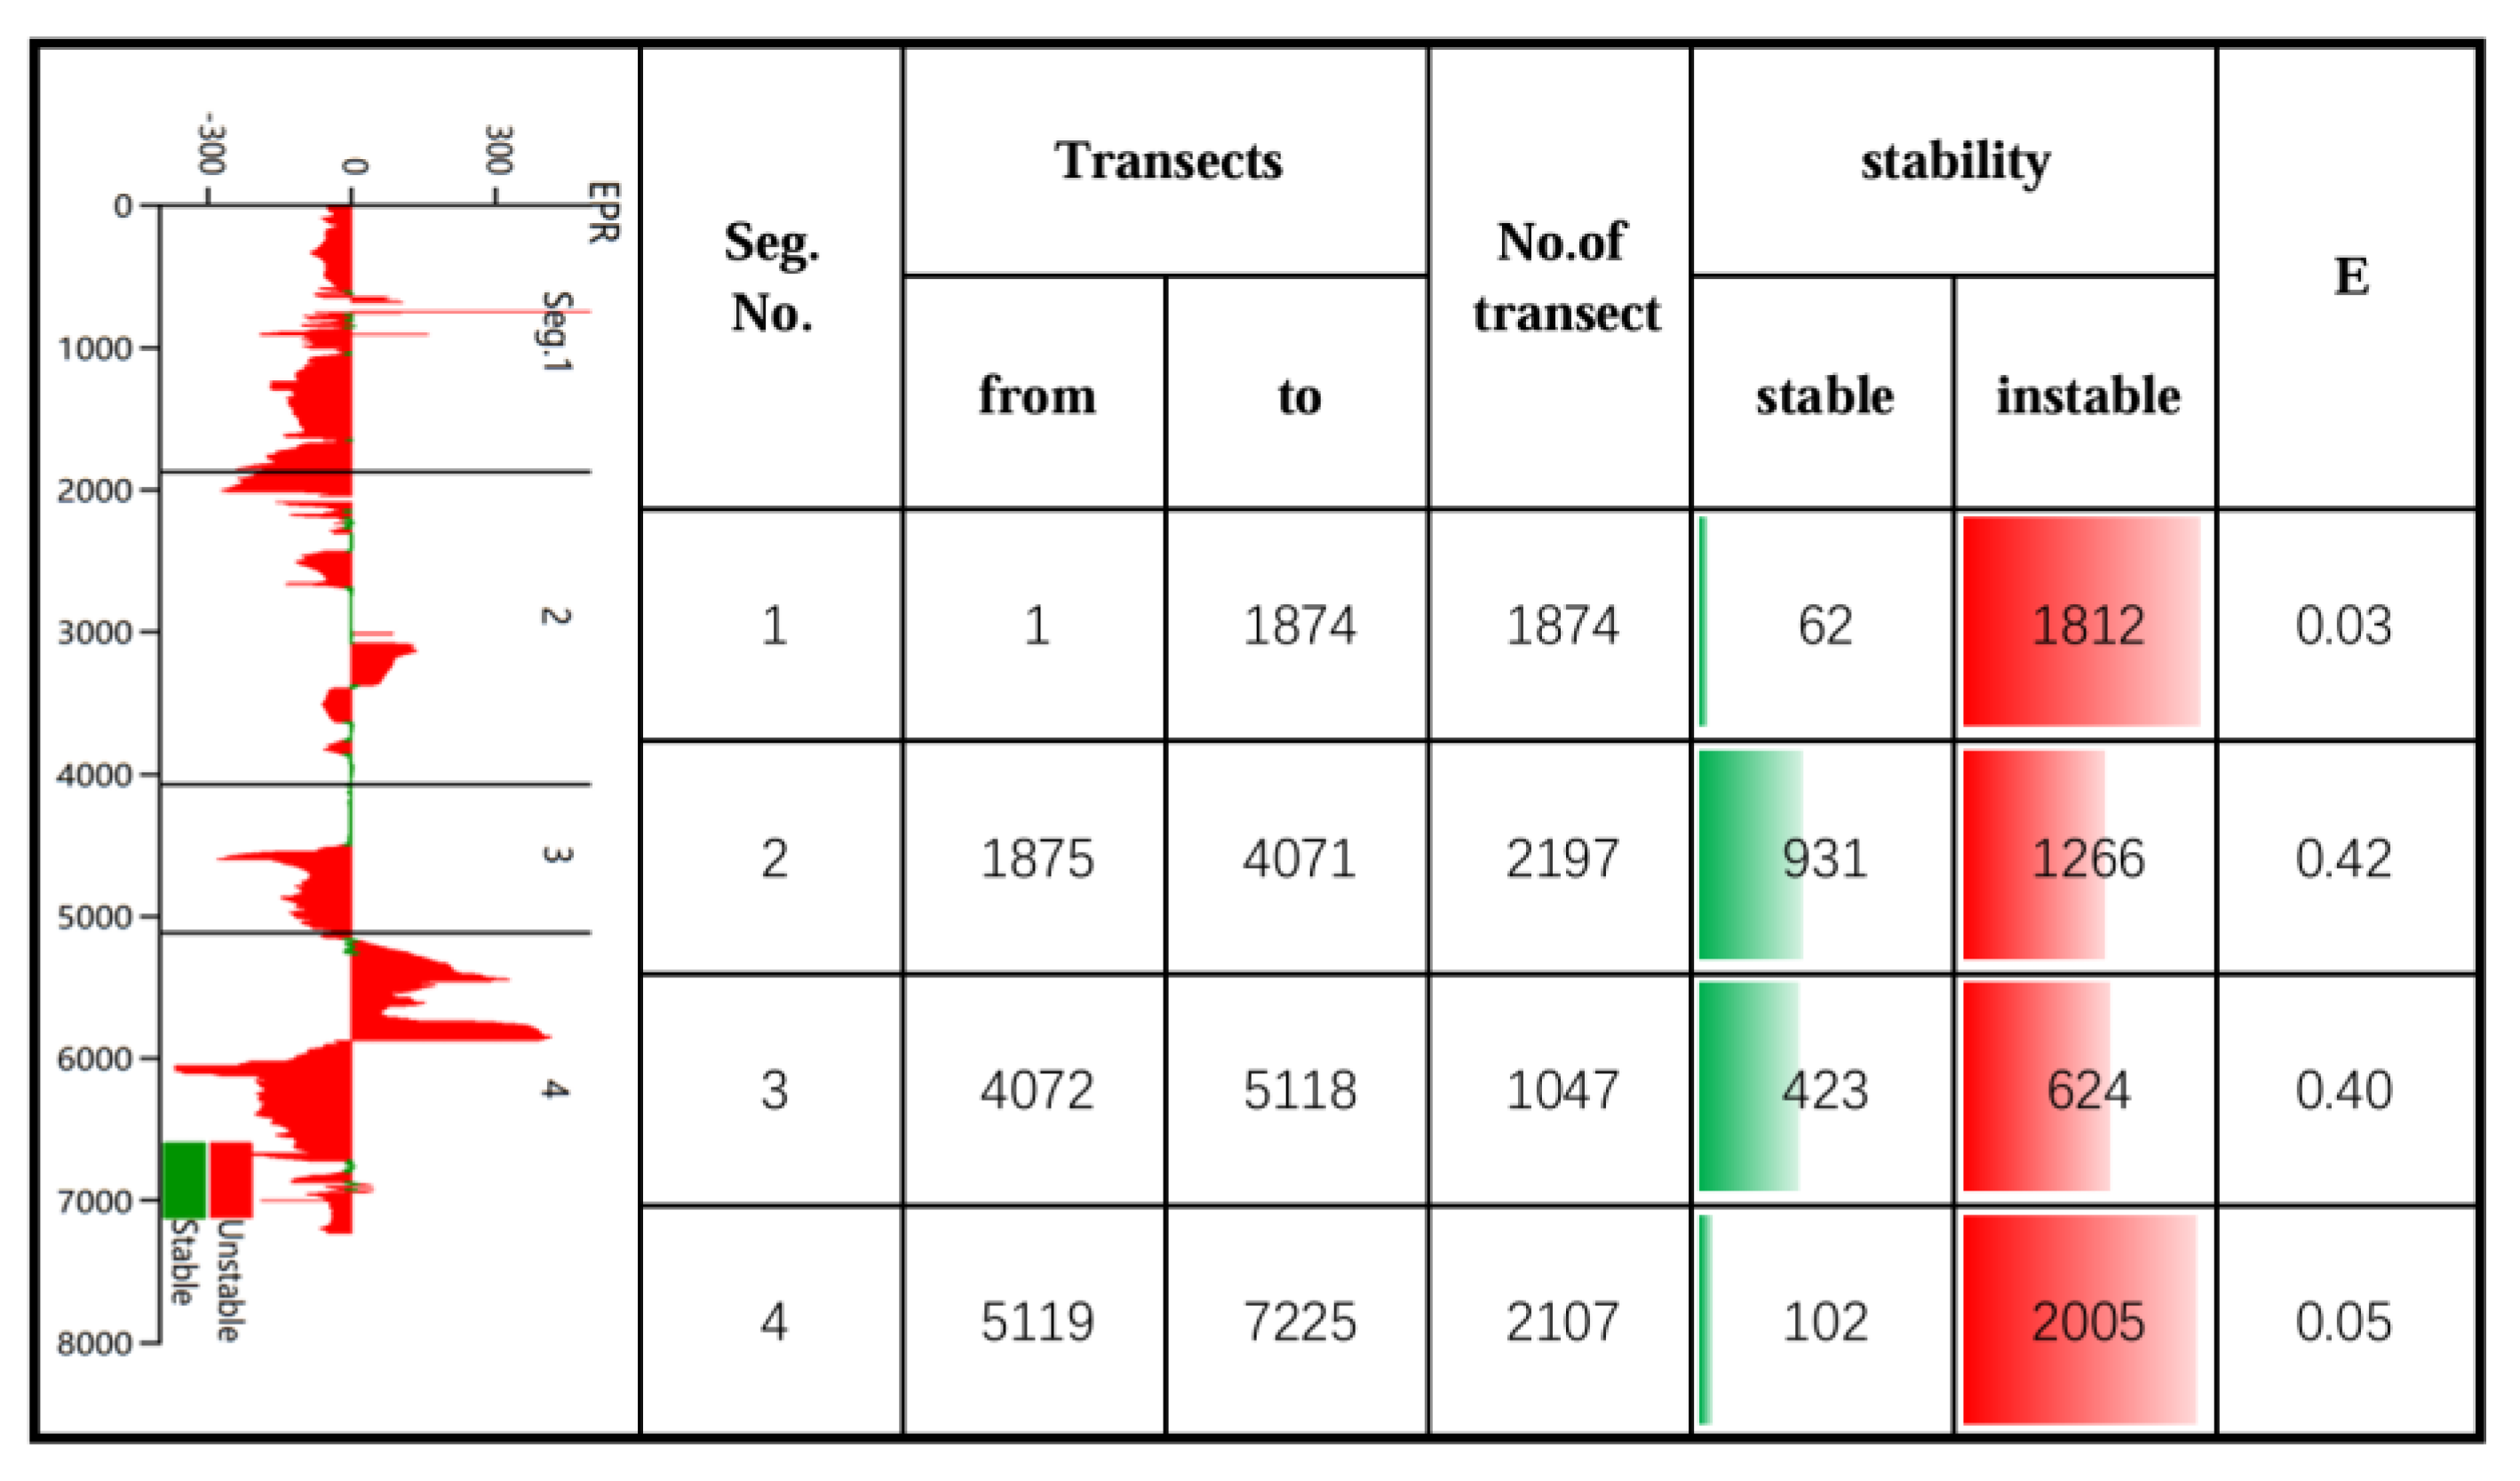
Figure 14.
Stability indicators from 2016 to 2024.
5. Conclusions
- Different study areas
1. Diaokou Subdelta
1976–2002 (Natural Regulation Phase): Dominated by marine erosion, with a maximum shoreline retreat rate of -372.1 m/a.
2002–2016 (Water-Sediment Regulation): Erosion rate reduced to -87.3 m/a due to engineered interventions.
Post-2016: Transitioned to localized weak deposition (mean EPR: 109.5 m/a), achieving dynamic equilibrium despite residual marine influences.
2. Dongying Port and Adjacent Areas
Maintained weak deposition (mean EPR: 11.2 m/a) under artificial levee protection, contrasting with natural sediment-driven accretion in the active river mouth (3.75 km/a post-2016).
3. Qingshuigou Subdelta
1976–1996 (Initial Diversion Phase): Rapid progradation (mean EPR: 527.7 m/a) driven by direct sediment supply.
Post-1996 (Qing 8 Diversion): Severe erosion (maximum EPR: -1761.0 m/a) due to sediment deprivation.
2002–2016 (Regulation Period): Erosion slowed (-181.6 m/a), but localized erosion persisted post-2016 (-187.1 m/a).
4. Active River Mouth
The continuous accretion of coastline length (3.75 km/year post- 2016) due to the uninterrupted sediment supply highlights the advantages of natural sedimentation.
- Key Drivers and Trends
Natural Factors:
Early-phase shoreline progradation relied on fluvial sediment flux (e.g., Qingshuigou’s 1453.9 m/a peak).
Marine dynamics (waves, tides) drove erosion in abandoned lobes (e.g., Diaokou’s -372.1 m/a retreat).
2. Anthropogenic Interventions:
Engineering projects (levees, diversions) modulated erosion-deposition balances (e.g., Diaokou’s 68.55 m/a deposition reduction).
Water-sediment regulation temporarily stabilized erosion but could not fully counteract sediment deprivation long-term.
3. Future Implications:
Over-reliance on engineering may weaken natural resilience.
Integrated strategies (sediment management, ecological restoration) are critical to harmonize human activities and natural processes for sustainable coastal governance.
Author Contributions
Liwen Yan provided the conceptualization. Shuangquan Wu provided the tidal level data. Yuyu Zhang designed and conducted the experiments, analyzed the data, and wrote this paper.
Acknowledgments
All sources of funding of the study should be disclosed. Please clearly indicate grants that you have received in support of your research work. Clearly state if you received funds for covering the costs to publish in open access.
Conflicts of Interest
The authors declare no conflict of interest. The founding sponsors had no role in the design of the study; in the collection, analyses, or interpretation of data; in the writing of the manuscript, and in the decision to publish the results.
References
- XU X, HUANG G, QU Z, et al. Assessing the groundwater dynamics and impacts of water saving in the Hetao Irrigation District, Yellow River basin [J]. Agricultural water management, 2010, 98(2): 301-13.
- AMOROS, C. The concept of habitat diversity between and within ecosystems applied to river side-arm restoration [J]. Environmental management, 2001, 28: 805-17.
- CHEN X, CHEN S, DONG P, et al. Temporal and spatial evolution of the coastal profiles along the Yellow River Delta over last three decades [J]. GeoJournal, 2008, 71: 185-99.
- NING Z, LI D, CHEN C, et al. The importance of structural and functional characteristics of tidal channels to smooth cordgrass invasion in the Yellow River Delta, China: Implications for coastal wetland management [J]. Journal of Environmental Management, 2023, 342: 118297.
- LIPING, Z. The role of wave action on the formation of yellow river delta [J]. Marine Geology & Quaternary Geology, 1997, 17(2): 8(in Chinese).
- WANG X, XIAO X, ZHANG X, et al. Rapid and large changes in coastal wetland structure in China's four major river deltas [J]. Global Change Biology, 2023, 29(8): 2286-300.
- XIE W, WANG X, GUO L, et al. Impacts of a storm on the erosion process of a tidal wetland in the Yellow River Delta [J]. Catena, 2021, 205: 105461.
- WU X, BI N, XU J, et al. Stepwise morphological evolution of the active Yellow River (Huanghe) delta lobe (1976–2013): Dominant roles of riverine discharge and sediment grain size [J]. Geomorphology, 2017, 292: 115-27.
- TIAN S, LI Z, WANG Z, et al. Mineral composition and particle size distribution of river sediment and loess in the middle and lower Yellow River [J]. International Journal of Sediment Research, 2021, 36(3): 392-400.
- ZHAO H, LIN Y, ZHOU J, et al. Simulation of Holocene soil erosion and sediment deposition processes in the Yellow River basin during the Holocene [J]. Catena, 2022, 219: 106600.
- BA Q, WANG B, ZHU L, et al. Rapid change of vegetation cover in the Huanghe (Yellow River) mouth wetland and its biogeomorphological feedbacks [J]. Catena, 2024, 238: 107875.
- PENG J, CHEN S, DONG P. Temporal variation of sediment load in the Yellow River basin, China, and its impacts on the lower reaches and the river delta [J]. Catena, 2010, 83(2-3): 135-47.
- HOU C, YI Y, SONG J, et al. Effect of water-sediment regulation operation on sediment grain size and nutrient content in the lower Yellow River [J]. Journal of Cleaner Production, 2021, 279: 123533.
- WANG KAI-RONG Y S-B, RU YU-YING. Study on Change of Flow and Sediment Entering into the Sea and the Yellow River EstuaryEvolution Since 2000 [J]. Yellow River, 2013, 35(4) (in Chinese).
- KONG D, MIAO C, BORTHWICK A G, et al. Evolution of the Yellow River Delta and its relationship with runoff and sediment load from 1983 to 2011 [J]. Journal of Hydrology, 2015, 520: 157-67.
- WANG H, YANG Z, LI G, et al. Wave climate modeling on the abandoned Huanghe (Yellow River) delta lobe and related deltaic erosion [J]. Journal of Coastal Research, 2006, 22(4): 906-18.
- WU G, WANG K, LIANG B, et al. Modeling the morphological responses of the Yellow River Delta to the water-sediment regulation scheme: The role of impulsive river floods and density-driven flows [J]. Water Resources Research, 2023, 59(7): e2022WR033003.
- FU Y, BELLERBY R G, JI H, et al. Impacts of riverine floods on morphodynamics in the yellow river delta [J]. Water, 2023, 15(8): 1568.
- JI H, CHEN S, PAN S, et al. Fluvial sediment source to sink transfer at the Yellow River Delta: Quantifications, causes, and environmental impacts [J]. Journal of Hydrology, 2022, 608: 127622.
- LI H, HUANG C, LIU Q, et al. Accretion–erosion dynamics of the yellow river delta and the relationships with runoff and sediment from 1976 to 2018 [J]. Water, 2020, 12(11): 2992.
- ZHANG H, LIU X, JIA Y, et al. Rapid consolidation characteristics of Yellow River-derived sediment: Geotechnical characterization and its implications for the deltaic geomorphic evolution [J]. Engineering Geology, 2020, 270: 105578.
- LI C, ZHU L, DAI Z, et al. Study on spatiotemporal evolution of the Yellow River Delta coastline from 1976 to 2020 [J]. Remote Sensing, 2021, 13(23): 4789(in Chinese).
- WANG K, WU G, LIANG B, et al. Deltaic marsh accretion under episodic sediment supply controlled by river regulations and storms: Implications for coastal wetlands restoration in the Yellow River Delta [J]. Journal of Hydrology, 2024, 635: 131221.
- BAI XIAOXIA F Y, WANG HOUJIE. Erosion and deposition evolution of the abandoned Diaokou course of the Yellow River and influential factors [J]. Marine Geology Frontiers, 2023, 39(10): 34-42(in Chinese).
- Hu gang z y, kong xianghuai, wu xiao, wang zhanghua, yuan zhongpeng, cong jingyi. Changes of evolution models of China's large river deltas since Holocene and their responses to anthropogenic activities [J]. Marine Geology & Quaternary Geology, 2021, 41(5): 77-89.
- WANG JINING M Y, ZHANG LIXIA. Remote sensing monitoring and change analysis of Yellow River Estuary coastline in the past 42 years [J]. Remote Sensing for Natural Resources, 2016, (3): 188-93.
- WANG S, FU B, PIAO S, et al. Reduced sediment transport in the Yellow River due to anthropogenic changes [J]. Nature Geoscience, 2016, 9(1): 38-41.
- JI H, CHEN S, PAN S, et al. Morphological variability of the active Yellow River mouth under the new regime of riverine delivery [J]. Journal of Hydrology, 2018, 564: 329-41.
- JIN Y, YANG W, SUN T, et al. Effects of seashore reclamation activities on the health of wetland ecosystems: a case study in the Yellow River Delta, China [J]. Ocean & Coastal Management, 2016, 123: 44-52.
- WANG J, SHI B, YUAN Q, et al. Hydro-geomorphological regime of the lower Yellow river and delta in response to the water–sediment regulation scheme: Process, mechanism and implication [J]. Catena, 2022, 219: 106646.
- LIANQIANG S, JIUFA L, MING Y, et al. Advances in Researches on the odern Yellow River DeltaDevelopment and Evolution [J]. ADVANCESINMARINESCIENCE, 2005, 23(1): 96-104(in Chinese).
- PENG J, MA S, CHEN H, et al. Temporal and spatial evolution of coastline and subaqueous geomorphology in muddy coast of the Yellow River Delta [J]. Journal of Geographical Sciences, 2013, 23: 490-502.
- ZHANG S, ZHANG Y, XU J, et al. In situ observations of hydro-sediment dynamics on the abandoned Diaokou lobe of the Yellow River Delta: Erosion mechanism and rate [J]. Estuarine, Coastal and Shelf Science, 2022, 277: 108065.
- WU X, WANG H, BI N, et al. Evolution of a tide-dominated abandoned channel: A case of the abandoned Qingshuigou course, Yellow River [J]. Marine Geology, 2020, 422: 106116.
- ZHENG S, HAN S, TAN G, et al. Morphological adjustment of the Qingshuigou channel on the Yellow River Delta and factors controlling its avulsion [J]. Catena, 2018, 166: 44-55.
- LI Z, WANG H, NITTROUER J A, et al. Modeling the infilling process of an abandoned fluvial-deltaic distributary channel: An example from the Yellow River delta, China [J]. Geomorphology, 2020, 361: 107204.
- HUI C, SHEN-LIANG; C, CONG-LIANG; X, et al. Coastal evolution and its influencing factors in Gudong nearshore area of the Yellow River Delta [J]. Marine Sciences, 2019, 43(11): 11-8(in Chinese).
- HUANG JING, ZHAO GENGXING. Spatiotemporal change of sediment siltation and erosion dynamics and its influences on water and sediment budgets of the yellow river mouth in the past 20 years based on remote sensing and gis data [J]. Marine Geology, 2021, 37(3) (in Chinese).
- MINGXIANG N, JUN W. Analysis of coastline variations in Dongying section of Yellow River Delta based on Landsat remote sensing image [J]. Water Resources Protection, 2020, 36(4): 26-33 (in Chinese).
- LIBING H, SHENTANG D, XIN Y, et al. Evolution Process and Trend of Current Flow Paths into Sea in the Huanghe Estuary [J]. Transactions of Oceanology and Limnology, 2020, (1): 9 (in Chinese).
- GUOZHONG. T, DEHONG. F, FUQIANG W, et al. Research on the Evolution Characteristics of the Yellow River DeltaCoastline and Its Critical Values of Siltation and Erosion [J]. Journal of North China University of Water Resources and Electrie Power, 2020, 041(006): 40-6 (in Chinese).
- YUAN XINZHI, JLANG HONG, CHEN YUNZHI, et al. Extraction of Water Body Information Using AdaptiveThreshold Value and OTSU Algorithm [J]. Remote Sensing Information, 2016, 31(5): 36-42 (in Chinese).
- PENG Y, CUI B, YIN H, et al. Automatic SAR change detection based on visual saliency and multi-hierarchical fuzzy clustering [J]. IEEE Journal of Selected Topics in Applied Earth Observations and Remote Sensing, 2022, 15: 7755-69.
- QIN Y, JIN X, DU K, et al. Changes in river morphology and influencing factors in the upper Yellow River over the past 25 years [J]. Geomorphology, 2024, 465: 109397.
- WU T, XU Z, CHEN R, et al. Channel activity remote sensing retrieval model: A case study of the lower yellow river [J]. Remote Sensing, 2023, 15(14): 3636.
- LI P, ZHANG Y, LIANG C, et al. High spatiotemporal resolution river networks mapping on catchment scale using satellite remote sensing imagery and DEM data [J]. Geophysical Research Letters, 2024, 51(6): e2023GL107956.
- YANG YANXIONG L X, QIU RUOFENG, YANG WEN,. The Analysis of Shoreline Changes Respond to Artificial lsland Project ofDongjiao Coco Forest Based on DSAS and SMC [J]. Periodical of Ocean University of China, 2017: 162~8 (in Chinese).
- MUJABAR P S, CHANDRASEKAR N. Shoreline change analysis along the coast between Kanyakumari and Tuticorin of India using remote sensing and GIS [J]. Arabian Journal of Geosciences, 2013, 6: 647-64.
- LIU PENG, WANG QING, ZHAN CHAO, et al. Quantitative analysis of coastline change in the yellowriver delta from 1959 to 2002 [J]. oceanologia et limnologia sinica, 2015, 46(3): 585-94(in Chinese).
- ZHANG L, SHI H, XING H, et al. Analysis of the evolution of the Yellow River Delta coastline and the response of the tidal current field [J]. Frontiers in Marine Science, 2023, 10: 1232060.
- ZHU Q, LI P, LI Z, et al. Spatiotemporal changes of coastline over the Yellow River Delta in the previous 40 years with optical and SAR remote sensing [J]. Remote Sensing, 2021, 13(10): 1940.
- XIUJIN; L, RONGRONG; X, RUOFENG; Q, et al. The stability evaluation of lagoon-barrier coastline,Luanhe delta [J]. Marine Environmental Science, 2020, 39(3): 426-31(in Chinese).
- FENGJIAO Z, YIN C, ZHEN F, et al. Research on the stability of river mouth shoreline in the Yellow River Delta from 1996 to 2022 [J]. Marine Science Bulletin, 2024, 43(3) (in Chinese).
- PANG J, Z. The Evolution of the Flow Path of the Yellow River Delta and Its Impact on the Lower Reaches of the Yellow River [J]. Transactions of Oceanology and Limnology, 1994, (03): 1-9(in Chinese).
- MIN T, XINING Z, XIAODONG G, et al. Characteristics of soil moisture variation in different land use types in the hilly region of the Loess Plateau,China [J]. Chinese Journal of Applied Ecology, 2018, 29(3) (in Chinese).
- JUNJIE. W, BING S, YANBIN B. Evolution Characteristics of Runoff and Sediment Fluxes of Yellow River into Bohai Sea in Recent 70 Years [J]. Research of Soil and Water Conservation, 2020, 27(3): 57-62(in Chinese).
- ZHIHUI W, SHANZHEN Y. Comparison and Research on the Different Index Models Used in Water Extraction by Remote Sensing [J]. Science Technology and Engineering, 2007, (4): 534-7(in Chinese).
- DENG X, SONG C, LIU K, et al. Remote sensing estimation of catchment-scale reservoir water impoundment in the upper Yellow River and implications for river discharge alteration [J]. Journal of Hydrology, 2020, 585: 124791.
- ZHANG Y, DU J, GUO L, et al. Long-term detection and spatiotemporal variation analysis of open-surface water bodies in the Yellow River Basin from 1986 to 2020 [J]. Science of the Total Environment, 2022, 845: 157152.
- CROWELL M, LEATHERMAN S P, BUCKLEY M K. Historical shoreline change: error analysis and mapping accuracy [J]. Journal of coastal research, 1991: 839-52.
- BAI X X, FAN Y Y, WANG H J. Scour and Fill Evolution and Its Influencing Factors of the Abandoned Diaokou Channel of the Yellow River [J]. Marine Geology, 2023, 39(10): 34-42(in Chinese).
- XINXIN L, SHENLIANG C, YUTAO L P F, et al. Dynamic evolution and influencing factors of the shoreline of the Huanghe River Estuary from 1996 to 2020 [J]. Marine Science Bulletin, 2022, 41(4): 15(in Chinese).
- TA W, WANG H, JIA X. Suspended sediment transport response to upstream wash-load supply in the sand-bed reach of the Upper Yellow River, China [J]. Journal of Hydrology, 2015, 528: 562-70.
- CARVAJAL C, STEEL R, PETTER A. Sediment supply: The main driver of shelf-margin growth [J]. Earth-Science Reviews, 2009, 96(4): 221-48.
- SEDIGHI F, DARVISHAN A K, ZARE M R. Effect of watershed geomorphological characteristics on sediment redistribution [J]. Geomorphology, 2021, 375: 107559.
- SYVITSKI J, KETTNER A, CORREGGIARI A, et al. Distributary channels and their impact on sediment dispersial [J]. Marine Geology, 2005, 22: 222-3.
- LI X, CHEN H, JIANG X, et al. Impacts of human activities on nutrient transport in the Yellow River: The role of the Water-Sediment Regulation Scheme [J]. Science of the Total Environment, 2017, 592: 161-70.
- WANG J J, SHI B, YUAN Q Y, et al. Hydro-geomorphological regime of the lower Yellow river and delta in response to the water–sediment regulation scheme: Process, mechanism and implication [J]. Catena, 2022, 219: 106646.
- WANG H, WU X, BI N, et al. Impacts of the dam-orientated water-sediment regulation scheme on the lower reaches and delta of the Yellow River (Huanghe): A review [J]. Global and Planetary Change, 2017, 157: 93-113.
Figure 1.
Map of the Course Changes of the Yellow River since 1855[54].
Figure 1.
Map of the Course Changes of the Yellow River since 1855[54].
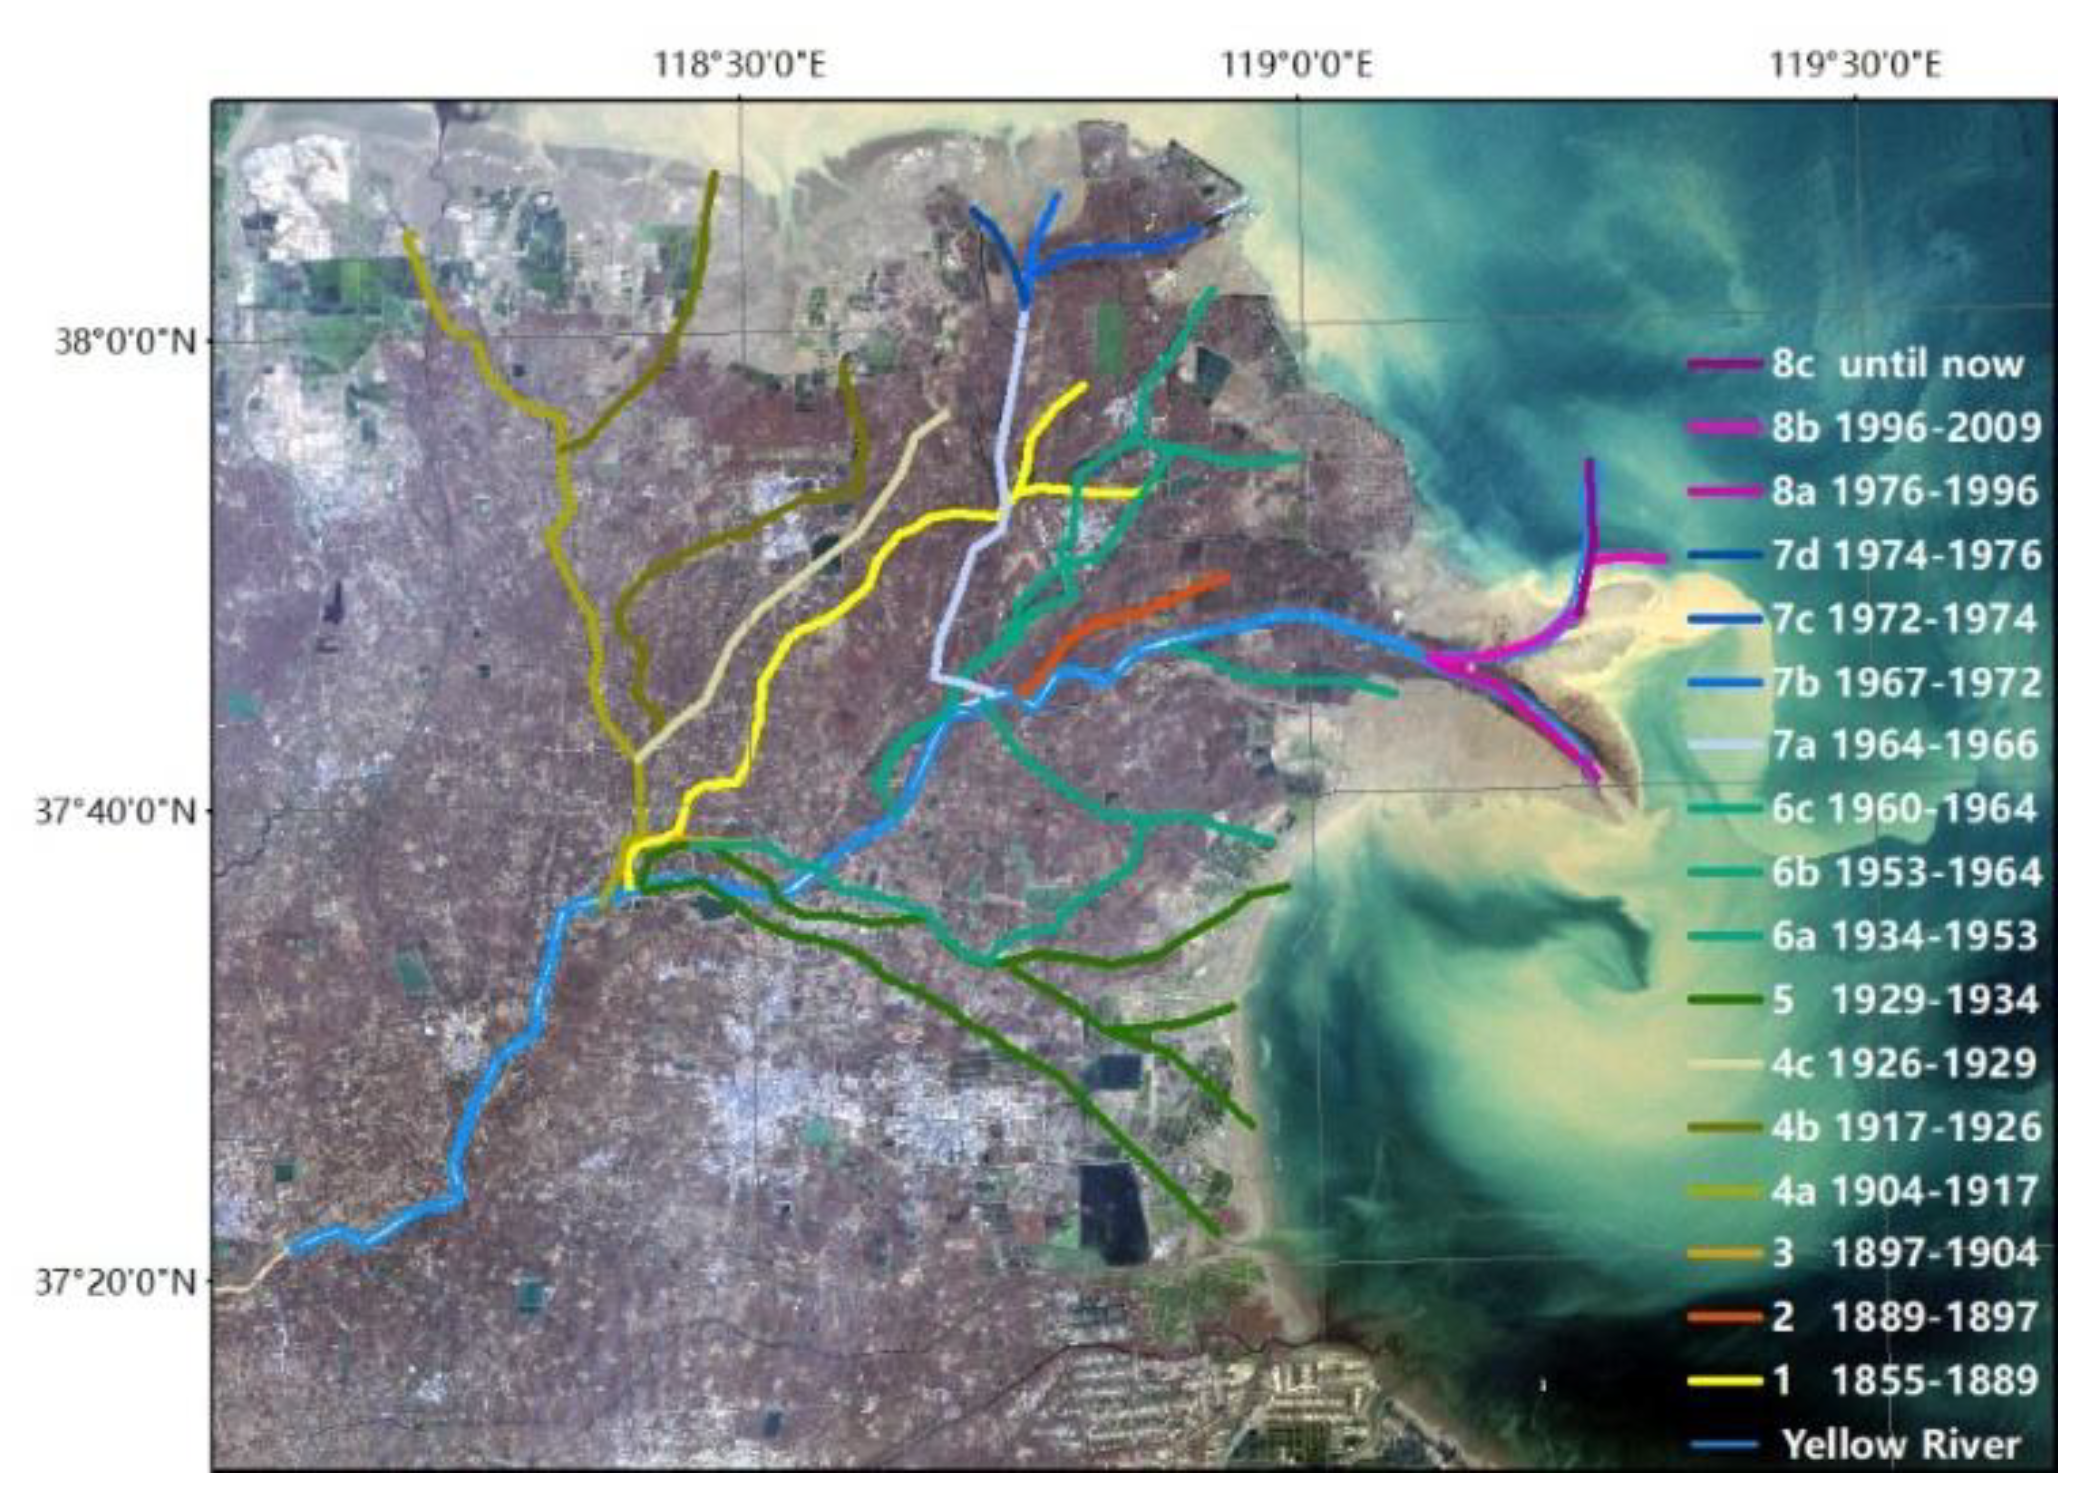
Figure 2.
research region.
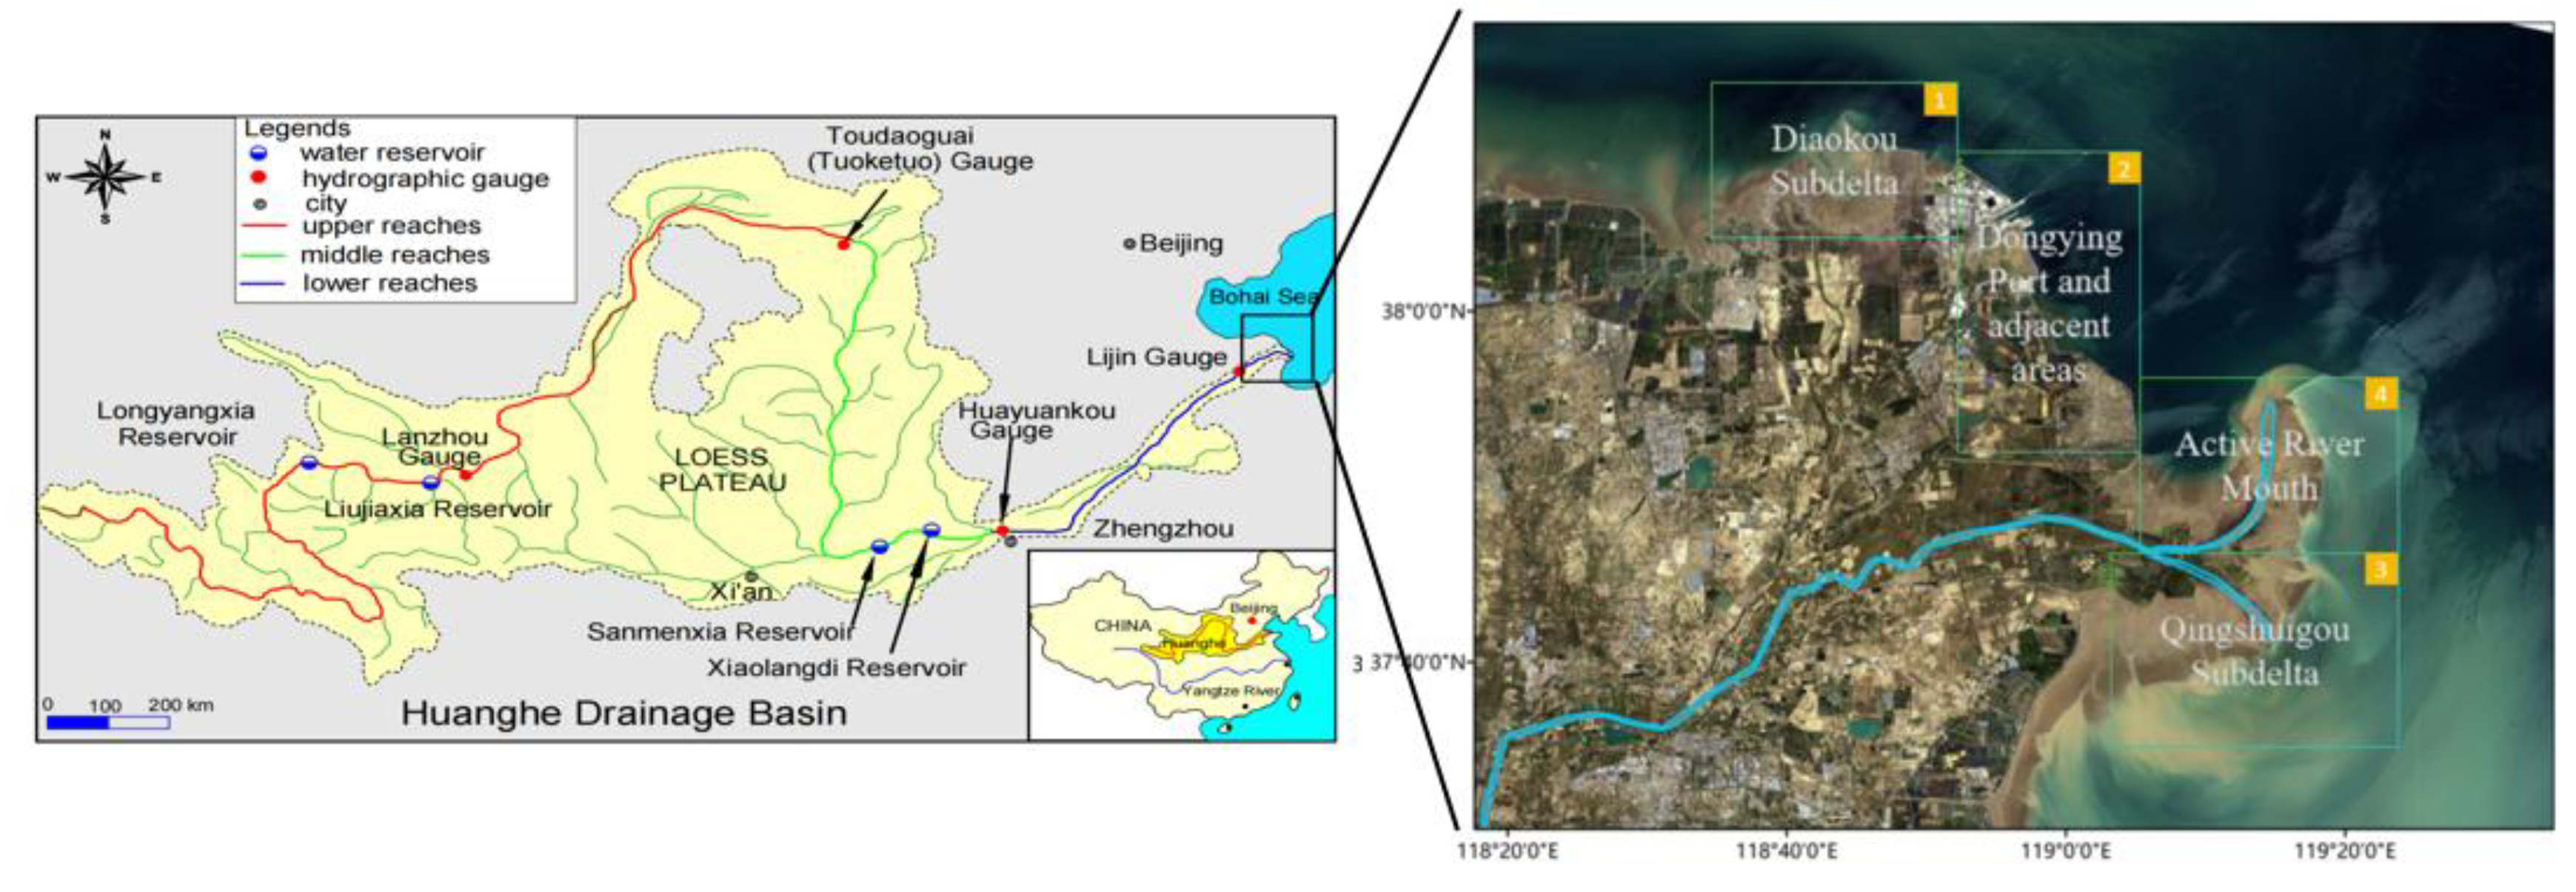
Figure 3.
Remote sensing imagery.
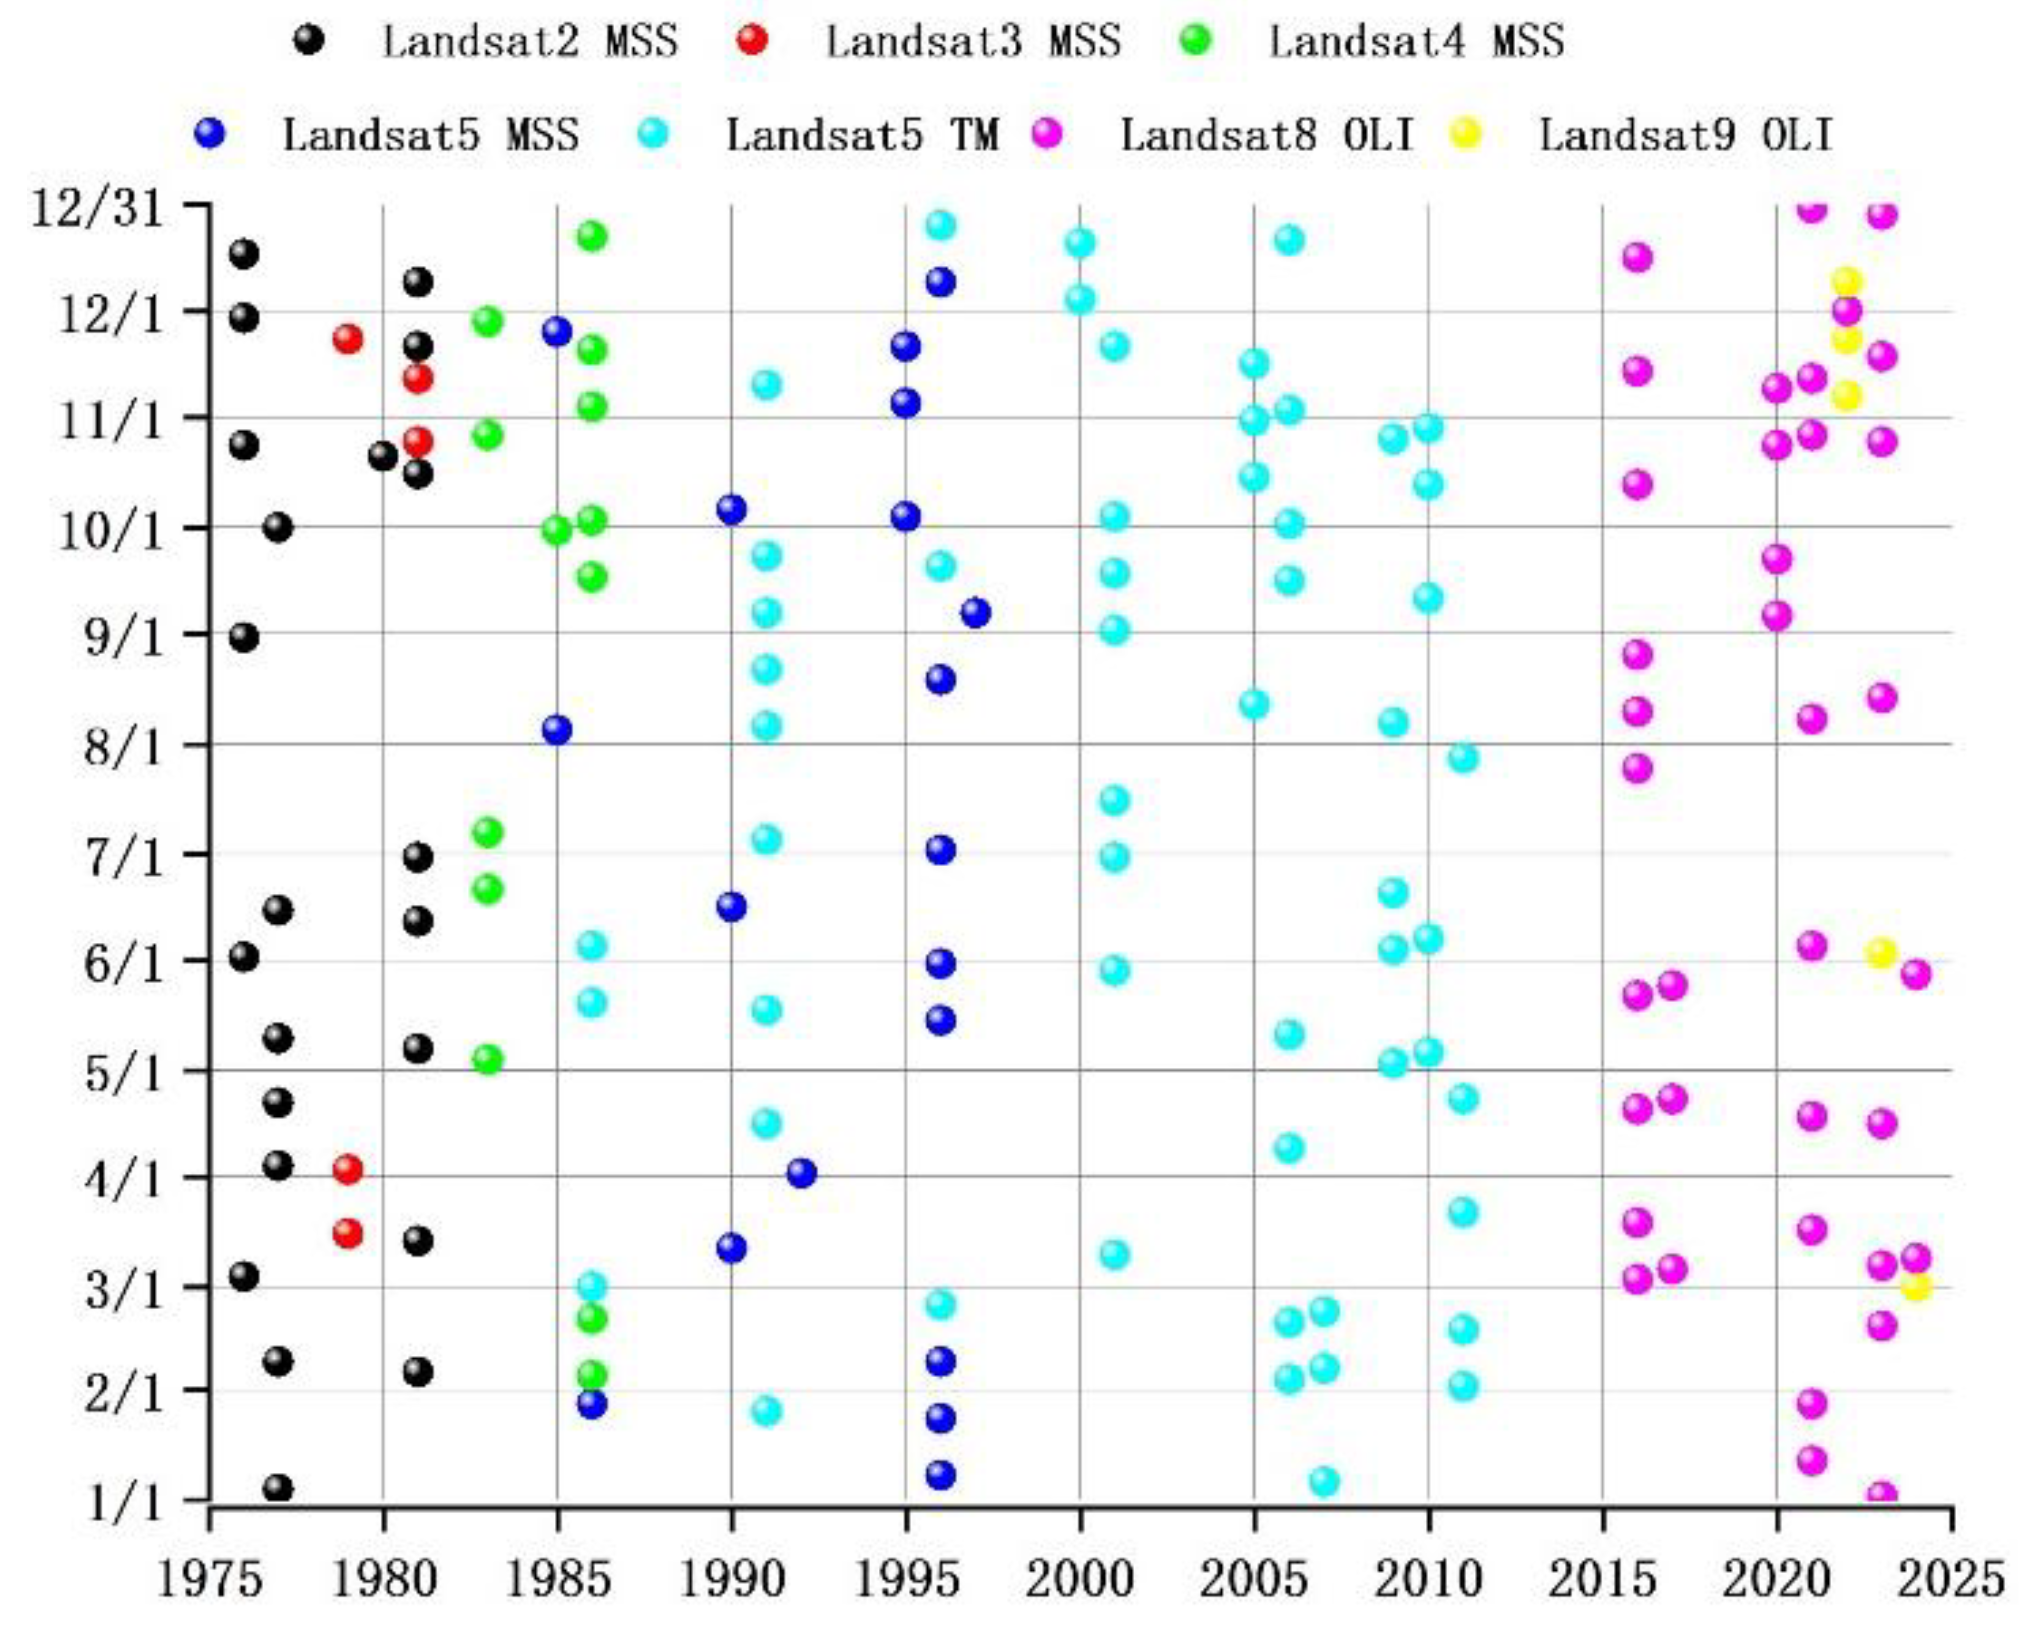
Figure 4.
Water and Sediment fluxes with coastline changes.
Table 1.
Standards for the Classification of deposition Levels.
| Coastal Erosion and Deposition Classification | Average Annual Change Rate of Vertical Extent s/(m·a-1) |
|---|---|
| Severe deposition | s≥15 |
| Strong deposition | 10≤s<15 |
| Relatively strong deposition | 5≤s<10 |
| Slight deposition | 1≤s<5 |
| Stable | -1<s<1 |
| Slight erosion | -5<s≤-1 |
| Relatively strong erosion | -10<s≤-5 |
| Strong erosion | -15<s≤-10 |
| Severe erosion | s≤-15 |
Disclaimer/Publisher’s Note: The statements, opinions and data contained in all publications are solely those of the individual author(s) and contributor(s) and not of MDPI and/or the editor(s). MDPI and/or the editor(s) disclaim responsibility for any injury to people or property resulting from any ideas, methods, instructions or products referred to in the content. |
© 2025 by the authors. Licensee MDPI, Basel, Switzerland. This article is an open access article distributed under the terms and conditions of the Creative Commons Attribution (CC BY) license (http://creativecommons.org/licenses/by/4.0/).
Copyright: This open access article is published under a Creative Commons CC BY 4.0 license, which permit the free download, distribution, and reuse, provided that the author and preprint are cited in any reuse.


