
Submitted:
15 May 2025
Posted:
16 May 2025
You are already at the latest version
Abstract
The subaqueous delta of the Yellow River has been affected by its high sediment concentration, and the water and sediment control measures have changed in recent years. In this paper, Delft 3D software was used to simulate the sediment diffusion in the subaqueous delta of the Yellow River in 2017 so as to explore the influence of the sediment and water transported by the Yellow River on the subaqueous delta without water and sediment regulation. The results reveal the occurrence of a low-high-low suspended sediment concentration distribution from the coastlines to the far shore. The main accumulation areas shifted from the coasts of Bohai Bay and Laizhou Bay in the dry season to the estuary in the wet season. The sediment formed a deposition zone along the coastline, which widened from the estuary outwards, and there was an outer erosion zone under the actions of wind and waves. In 2017, the impact of the sediment inflow into the Yellow River on its subaqueous delta generally resulted in the erosion being greater than the sedimentation, and the erosion/deposition volume in 2017 was -1.28×10⁸ m3, and the estimated critical value of the sediment inflow balance was 2.13×10⁸ tons.
Keywords:
subaqueous delta
; the Yellow River
; Delft 3D
; suspended sediment
; erosion/deposition
1. Introduction
The Yellow River is renowned for its high sediment content, making it one of the most challenging rivers in the world to manage. The huge amount of sediment transport led to the formation of the extensive Yellow River Delta [1]. This delta consists of both terrestrial and subaqueous components [2], and the sedimentation levels at the delta are closely linked to the sediment discharged by the Yellow River into the sea [3,4]. The erosion and sedimentation of the subaqueous delta are influenced by a combination of factors such as water discharge, tides, water depth, and wind waves [5,6]. The water discharge affects the diffusion and deposition of suspended sediment [7]; the tides impact the concentration and transportation direction of the suspended sediment [8]; water depth influences the wave action and sediment thickness [9]; and the wind and the waves it generates affect the resuspension and diffusion of the sediment in the adjacent sea area [10]. The water and sediment discharged by the Yellow River into the sea play a crucial role in shaping the modern Yellow River Delta.
Since the establishment of the People's Republic of China, extensive research and exploration have been conducted on sediment deposition issues in the Yellow River. After decades of innovation, a series of scientific water and sediment regulation methods have been developed [11]. In 2002, a significant milestone was achieved with the launch of the water and sediment regulation project. The water and sediment regulation project is an engineering measure that entails the coordinated operation of reservoirs including the Wanjiazhai Reservoir, Sanmenxia Reservoir, and Xiaolangdi Reservoir, to release water and sediment intensively during specific periods, thereby creating artificial flood peaks. This process utilizes high sediment content water flows to scour the river channels, entraining and transporting the accumulated sediment downstream and toward the river mouth, ultimately achieving sediment reduction in the river channels and sediment flushing into the sea. The water and sediment regulation project has achieved remarkable results in recent decades, effectively reducing sediment deposition in the lower Yellow River channel and achieving optimal allocation of water and sediment resources.
After the implementation of the water and sediment regulation project, the sediment from the Loess Plateau in the middle reaches of the Yellow River was no longer stagnant due to river siltation, and it is now swiftly transported to the lower reaches through the regulated water flow. The sediment originally deposited in the river channel is restarted and eventually deposited in the estuary delta. Since 2002, when the Yellow River Conservancy Commission initiated its water and sediment regulation project, more than 30% of the annual total sediment discharge is attributed to water and sediment regulation efforts [12]. However, in 2017, the reservoirs failed to coordinate in releasing artificial flood peaks and did not form high-sediment flow that scours the downstream river channels [13]. This situation is destined to impact the state of the underwater delta of the Yellow River. Therefore, it is essential to study how influxes from the Yellow River impacted erosion/deposition before these regulations were implemented, which is of great value for revealing the influencing mechanism of water and sediment changes in the Yellow River on the estuary’s geomorphology [14], optimizing water and sediment regulation strategies, maintaining estuarine ecological security, and promoting sustainable environmental development.
In the field of water and sediment research, scholars tend to focus on utilizing remote sensing inversion, remote sensing image processing, and other techniques to explore the spatiotemporal distribution of suspended sediment and the influences of driving factors on its concentration [15,16,17]. In recent years, numerical simulation has been widely applied in sediment dynamics research due to its numerous advantages such as scientific processes and visualization of results [18,19], and it has gradually become an essential method for studying water and sediment in rivers and estuaries [20,21]. Classical hydrodynamic models include the EOCMSED hydrodynamic sediment transport model, the EFDC Explorer 3D environmental fluid dynamics model, the Danish DHI MIKE hydraulic model, and the Dutch Delft 3D hydrodynamic model [22,23,24,25]. Although hydrodynamic numerical simulation has been widely used in the design of water conservancy projects, its application to the erosion and deposition of the Yellow River Delta is limited due to its focus on researching water and sediment movement processes. However, a comprehensive understanding of the current erosion and deposition status of the subaqueous delta requires numerical model simulation. Current studies on the Yellow River Estuary's water and sediment using numerical simulation have mainly considered the influences of regulation. Nevertheless, assessing the impact of the sediment inflow on the subaqueous delta of the Yellow River without regulation is still important for implementing regulation programs.
In this study, we employed numerical simulation methods using Delft 3D software to simulate the suspended sediment concentration (in this article, the suspended sediment concentration refers to the simulated surface suspended sediment concentration), water depth, and erosion/deposition depth of the subaqueous delta in 2017 (a year when water and sediment regulation in the Yellow River was not carried out). In addition, we analyzed and evaluated the impact of the sediments influx from the Yellow River on the subaqueous delta without regulation. In this study, we fully implemented the Three Yellow Rivers system [26] and enriched experimental methods. The research results not only provide numerical references for implementation by the Yellow River Water Conservancy Commission but also offer scientific support for coastal engineering disaster prevention near estuaries. It is helpful to evaluate the impact of sediments from the Yellow River on the ecological environment of the estuary and adjacent sea areas and to provide an important reference for ecological protection and environmental management.
2. Materials and Methods
2.1. Study Area
The Yellow River Delta is located in the northeastern part of Shandong Province, China. It is distributed on the southern coast of Bohai Bay and the western coast of Laizhou Bay. The location of the Yellow River Delta is shown in Figure 1. The Yellow River Delta is a modern estuary delta formed by the large amount of sediments transported by the Yellow River to the Bohai Sea, which has a coastline length of 227 km [27]. The subaqueous delta deposit body formed in the estuary and the nearby sea area [28] forms a semi-ring around the land delta, and the outer edge extends to water depths of 10–22 m, covering the Bohai Bay and Laizhou Bay areas.
The Yellow River Delta is located in the east coastal monsoon area of China, which has a temperate continental monsoon climate, with hot and rainy summers and cold and dry winters. The period from June to August is the wet season, while the period from December to February is the dry season. The Yellow River subaqueous delta area is located in the semi-enclosed Bohai Sea, and the severe waves generated by the wind in the Bohai Sea have a short period and obvious seasonal and interannual changes. The tidal properties of the study area are complex, most of the sea area is characterized by an irregular semi-diurnal tide, and the tide-free area is characterized by a regular diurnal tide, which is solely produced by the mutual cancellation of the tidal waves and reflected tidal waves, and its position will change with the changes in the Yellow River, the delta coast morphology and the submarine topography [29]. The subaqueous delta sediment is composed of sand, silt, and clay and has a high water content, high porosity, and low strength [30]. The nearshore sediment exhibits obvious zonation, and the general trend is that the clay content is lower near the shore and higher away from the shore [31].
2.2. Mathematical Model
The classic hydrodynamic models include the Delft 3D model, EOCMSED model, DHI MIKE model. Due to the shallow water depth in the study area, in this study, the Delft 3D hydrodynamic numerical model, which is suitable for examples of shallow water characteristics, was selected to conduct the numerical simulations and calculations [32]. The model used to conduct the simulation calculations in the Delft 3D software is a three-dimensional hierarchical σ-coordinate shallow water mathematical model, which is numerically solved using the alternating-direction implicit (ADI) method[33]. It can ensure fast and smooth calculation under the premise of conservation of mass, momentum and energy. In addition, Delft 3D has seven modules, including the FLOW and WAVE modules. These modules can be mutually coupled to achieve hydrodynamic simulations under the influences of various dynamic factors. Delft 3D has been widely applied to the simulation of the processes and analysis of the mechanisms of hydrodynamics, sediment transport, and dynamic geomorphology in estuarine and coastal areas[18,34,35].
The wave module adopts SWAN model [36]. The SWAN model can accurately calculate and output the wave characteristic parameters of the study area, such as the wave height and wave period, with the help of input data such as topography and wind field data. It can be better applied to study areas such as shelf marginal seas and shallow estuaries. The SWAN model can be coupled with Delft 3D and exchange data on the set time step to improve the accuracy and efficiency of the simulation. It has been successfully applied to various wave numerical simulations[37,38,39].
2.3. Model Construction
In this study, the Delft 3D model was used to simulate the suspended sediment concentration, water depth, and erosion/deposition depth of the Yellow River subaqueous delta in 2017. Since the water discharged by the Yellow River into the sea affects not only the estuary but also the surrounding area, in order to simulate these areas simultaneously, the Delft 3D model grid covers the estuary, Laizhou Bay, and Bohai Bay. The model simulation period is 1 year, from January 1 to December 31, 2017.
2.3.1. Boundary Conditions and Discretization of the Simulation Area
The study area was selected using OpenEarthTools, and the Grid module within the Delft 3D model was utilized to grid the simulation area (Figure 2). The coastline boundary data for the study area used in this study are based on satellite scanning images, and the terrain data are based on the Earth topography 1 arc-minute global relief model (ETOPO1) global elevation dataset published by the National Geophysical Data Center. The spatial resolution of the dataset is 1 arc minutes, which can provide the seabed topographic feature data for the Bohai Sea required for this study. Since 1 arc minute is approximately equal to 1.8 km, to ensure the accuracy of the data to the greatest extent possible, the study area was divided into 1.0 km × 1.0 km grids. The water depth data used in the study were obtained from OpenEarch. The nearshore water depth data were calibrated using bathymetric data provided by the Yellow River Conservancy Commission. To allow the model to more accurately simulate the actual marine dynamic changes, the open boundary of the model uses the tidal forcing data provided by the tidal prediction solution for the ocean version 8 (TPXO8) global tidal model. The harmonic constants of four major tidal components were selected to reflect the tidal dynamic characteristics of the study area.
2.3.2. Model Parameter Settings
The SED (sediment transport) module in Delft 3D can be coupled with the FLOW module, and the input point of the water and sediment discharge data is added at the estuary position to input the relevant data. Several rivers flow into the Bohai Sea, but more than 90% of the terrestrial sediments originate from the Yellow River; so, in this study, we only considered the water and sediment input from the Yellow River. The key parameters for this study were obtained from the data from Lijin Station (its location is shown in Figure 1), the last observation station before the Yellow River flows into the sea (Table 1). The data for the water discharge and sediment discharge from the Yellow River into its estuary required for the simulation were obtained from the Yellow River Sediment Bulletin published by the Yellow River Water Conservancy Commission. The wind speed and direction data for the study area were provided by the National Meteorological Science Data Center. Additionally, based on a previous similar study [25], the constant values for modeling were set as follows: gravitational acceleration = 9.81 m/s2; water density = 1,025 kg/m3; horizontal turbulent viscosity coefficient of water = 0.4 m2/s; horizontal turbulent diffusion coefficient of water = 0.004 m2/s; air density = 1 kg/m3; bulk density of sediment = 1,970 kg/m3; median grain size of sediment = 0.036 mm [40] and dry density of sediment = 1,600 kg/m3 [41]. The bottom roughness was set as the Manning's roughness [42], with n = 0.03.
The SWAN module and the FLOW module in Delft 3D match the same water depth through the grid and use the wind field data as the SWAN driver file. The time step was set to 1 min, and the interaction time step was set to 0.5 h. Each data output interacts with the FLOW module of Delft 3D, which can ensure that the data output by the two modules match.
3. Simulation Results
The simulation results of the model were verified using field observation data for the Yellow River subaqueous delta. The verification mainly included four aspects: the current velocity, tidal range, suspended sediment concentration, and the seabed morphology. The distribution of the observation sites where the research team collected the measured data for the Yellow River delta is shown in Figure 3.
3.1. Current Velocity Verification
The data collected by the research team at the Yellow River Estuary (119.02E, 37.84N) from December 19, 2016 to January 11, 2017 were utilized as validation data to verify the calculated current velocity results. The variations in the simulated and measured current velocity with time are shown in Figure 4, and the simulated current velocities are largely consistent with the measured current velocities. The measured and simulated current velocities exhibit a significant positive correlation (Pearson's r = 0.69; Figure 5), although there are discrepancies attributed to differences in the wind directions and speeds influencing the wind-driven currents.
3.2. Tidal Range Verification
The validation of the tidal range simulation results was conducted using observation data from coastal stations along Laizhou Bay (119.16E, 37.19N) from August to September 2014 (Figure 6). The variations in the simulated and measured tidal range with time are shown in Figure 6, and the trends of the two are basically the same. The comparison revealed a general consistency between the simulated and measured tidal ranges (Pearson's r = 0.94; Figure 7).
3.3. Suspended Sediment Concentration Verification
The actual suspended sediment concentration measurements on the surface layer collected by the research team on December 15, 2019 were used to validate the simulated suspended sediment concentration results. The result reveals that the simulated values and the observed values exhibited a good fit. There is a significant correlation between these two datasets (Pearson's r = 0.87; Figure 8). However, differences due to variations in the wind speed, wave conditions, and other factors during the study period led to disparities between the measured and simulated suspended sediment concentrations under the combined influence of the marine dynamics.
3.4. Seabed Morphology Verification
The simulated seabed morphology data at the end of 2017 were verified using the measured seabed morphology data released by the National Marine Science Data Center. 350 points were selected in the area ranging from the coast to the offshore of Laizhou Bay. As depicted in Figure 9, a strong correlation was observed between the simulated and measured seabed depth datasets (Pearson's r = 0.78), indicating the reliability of the proposed model.
Based on the validation results for the current velocity, tides, suspended sediment concentration, and seabed depth, it is evident that while there are minor discrepancies in the specific numerical changes of the simulated results of the Delft 3D model and the measured data, a significant correlation exists between the simulated and measured data. It is concluded that the model demonstrates a good simulation capability for sediment transport, and the simulation results can effectively capture the hydrodynamic variation process of the Yellow River subaqueous delta. Therefore, this model can be utilized for qualitative and approximate quantitative studies on erosion and deposition processes influenced by wind waves in the subaqueous delta.
4. Discussion
4.1. Suspended Sediment Concentration
To enable convenient description, we define the area where the suspended sediment concentration exceeds 100 g/m3 as the high value area. The suspended sediment concentration in the Yellow River subaqueous delta generally demonstrates a low-high-low distribution pattern from the coastlines to the offshore areas. Specifically, except for near the estuary areas, low concentrations were observed along the coast of both Bohai Bay and Laizhou Bay; while high concentrations occured in shallow water areas near coastlines, and the values decreased further away from the shore.
The distribution of the suspended sediment concentration during the period from December to February, which is part of the dry season, was highly consistent. Therefore, we selected one typical case for analysis. Taking 0:00 on January 16 as a representative date, the spatial distribution of the suspended sediment concentration during the dry season (Figure 10a) illustrates strip-like patterns of high-value areas along the coasts of Bohai Bay and Laizhou Bay; whereas there were no large-scale high-value areas in the estuary and its surrounding regions due to the limited water discharge and sediment transport during dry season. Additionally, the influence of the continental monsoon climate, which is characterized by strong north/northwest winds and high winter wave heights led to resuspension of the seabed sediments in shallow sea areas within both bays [43]. Consequently, these sediments were transported away by tidal currents resulting in higher concentrations within these regions.
Similarly, the distribution of the suspended sediment concentration from June to August, which is within the wet season, also exhibits a high degree of similarity. Taking 0:00 on July 30 as a representative time, the spatial distribution of the suspended sediment concentration in the Yellow River subaqueous delta during the wet season is illustrated in Figure 10b. During this period, new characteristics of the suspended sediment concentration within the delta were observed. The high concentration areas were primarily concentrated in specific coastal estuaries, and the Yellow River Estuary was the main accumulation zone for suspended sediments. Conversely, there were no distinct high-concentration areas in the sea regions of Bohai Bay and Laizhou Bay. This shift can be attributed to variations in the sediment load input by the Yellow River. During this time, the maximum sediment load entering the sea from the river, accounting for a large proportion of the total sediments, settled and accumulated rapidly in the local area around the estuary. In addition, the tides failed to transport all of the sediments away from their original locations, resulting in significant accumulation within the estuarine area [6,44]. Furthermore, since limited water and sediment regulation measures were implemented in 2017, only a small amount of sediment was transported and dispersed to the shallow water areas of the two bays under the influence of wind and waves.
Representative points (Figure 11) were selected in the vicinity of the estuary (Point A), Bohai Bay (Point B), and Laizhou Bay (Point C) to observe the changes in the simulated suspended sediment concentration in the study area in 2017 (Figure 12). It was found that during winter dry season, the suspended sediment content near estuary areas was generally low, while in the summer wet season, the levels were higher, reaching a peak value of around 500 g/m3. In contrast, Bohai Bay and Laizhou Bay experienced the highest levels of suspended sediments during the winter dry season, with almost negligible amounts present during other periods. The peak values in Bohai Bay exceeded those in Laizhou Bay. More importantly, the value in Bohai Bay exceeded 800 g/m3 compared to the value of ~450 g/m3 in Laizhou Bay. The temporal variations in the suspended sediment concentrations at representative points aligned with the characteristics influenced by the river runoff and wind waves throughout the wet and dry seasons.
4.2. Water Depth and Erosion/Deposition Depth
The water depth distribution map of the Yellow River subaqueous delta is shown in Figure 13. Spatially, the study area exhibited a deep-shallow-deep pattern from the coastlines to the offshore areas, with deeper water closer to the coastline, shallower water in the nearshore areas, and increasing depth with increasing distance from the coast. Comparison of the water depth distributions at the end of the dry and wet seasons revealed that during the dry season (December to February), the water along the coastline of Bohai Bay became shallower, while the nearshore shallow areas became deeper. On the west side of Laizhou Bay, the depth increased nearer to the shore and decreased with increasing distance offshore, and the changes in the estuary were less pronounced. In contrast, during the wet season (June to August), significant shallowing occurred in the estuary and on the west side of Laizhou Bay, while the shallow nearshore waters deepened. Minimal changes were observed in Bohai Bay.
When combined with the analysis of the erosion/deposition depth distribution (Figure 14), it became evident that the sediments discharged by the Yellow River into the sea accumulated along the coastlines, forming deposition zones. Due to the effects of sediment diffusion and tidal erosion, the deposition zones widened northward and southward along the coastlines, extending from the estuary. The erosion zones formed outside the deposition zones under wind wave action; and wider erosion zones were observed on the eastern coasts of Bohai Bay and the western coasts of Laizhou Bay.
During the dry season (December to February), apart from the deposition zones, there was also evidence of deposition from northern sea areas of the estuary to the west side of Laizhou Bay on the outside of the erosion zones; while little deposition occured in the estuary areas. In contrast, during the wet season (June to August), the width of the erosion zone increased between the northern sea areas of the estuary and the west side of Laizhou Bay, and the offshore deposition no longer exhibited an apparent effect within these eroded regions. The deposition intensity increased significantly along coastlines, extending from the estuary to the west side of Laizhou Bay, particularly in the southern parts compared to the northern sections.
In this study, we focused on the water depth and erosion/deposition depth of the shoreline in the normal direction in the study area. It was determined that the maximum erosion depth in the erosion zone was approximately 5 m, and most of the erosion occured in the sea area with water depths of less than 10 m. The maximum deposition thickness in Bohai Bay reached more than 25 m, with peak deposition thicknesses of 18.1 m in the estuary and 14.7 m in Laizhou Bay. The areas with the greatest deposition thicknesses were located in the sea regions within 10 km of the shore. The area with the greatest influence of sedimentation extended from the south side of the estuary to the west side of Laizhou Bay, and the influence range covered up to 11.4 km outside the estuary. Due to factors such as wind and ocean currents, the southward sediment transport from the Yellow River to the sea was greater than the northward transport, resulting in a higher deposition intensity south of the Yellow River subaqueous delta compared to that north of the delta.
4.3. Relationship between the Erosion/Deposition of the Yellow River Subaqueous Delta and the Sediment Flux into the Sea
By multiplying each grid's erosion/deposition depth at a specific time by its corresponding area, we obtained the deposition volume of each grid. Summing up these volumes provided us with the total deposition volume for that particular time period within the study area. Using this method, we calculated the total deposition volume for the study area over 12 months in 2017 (Table 2). Since the Yellow River subaqueous delta includes the estuary area and the areas of two bays, and the amount of sediment in the offshore area was so small that it can be ignored, we suggest that the calculated volume in the study area can approximately represent the volume of the Yellow River subaqueous delta. The calculation results indicate that six of the months exhibited erosion trends, and the remaining six months exhibited deposition trends. The maximum erosion occurred in March, with an estimated value of 1.4915 billion cubic meters; whereas the maximum deposition occurred in February, reaching approximately 923.9 million cubic meters. The overall amount of erosion/deposition during 2017 was calculated to be -128.4 million cubic meters, indicating an overall trend of erosion within the study area during 2017.
Comparison of the variations in the monthly water discharge, sediment discharge, and total deposition volume (Figure 15) revealed that from March to August, the primary factor influencing the erosion/deposition of the Yellow River subaqueous delta was the sediment flux into the sea. During this period, increases in both the water discharge and sediment discharge led to an increase in the deposition volume within the subaqueous delta. Conversely, a decrease in either the water discharge or sediment discharge resulted in reduction of the deposition volume. In contrast, from December to February, wind and waves became dominant factors affecting the erosion of the Yellow River subaqueous delta. The water discharge had a limited impact on the sediments near the Yellow River Estuary, with weak correlations between the erosion of the subaqueous delta and the water discharge and sediment discharge.
The mass is equal to the density multiplied by the volume. The total erosion volume calculated in the previous section is 128.4 million m3. By multiplying this volume by the average sediment density (1,600 kg/m3), we calculated that the value required to fill the gap is 205.392 million tons. Adding the Yellow River's 2017 sea entry sediment discharge (7.720 million tons) reveals that an estimated total sea entry sediment mass of 213.112 million tons is required to maintain balance within the study area. Previous studies based on extensive measured data and satellite remote sensing data [45,46] have examined the relationships between changes in the area of the terrestrial and submarine deltas of the Yellow River with the amount of sediment entering the sea. They estimated that the annual average critical value for maintaining balance between erosion and deposition within the delta is 50–331 million tons [47]. The critical value calculated in this paper is within a reasonable range. In fact, the evolution of the Yellow River Delta has the characteristics of erosion here and deposition there [48]. It should be noted that this balance only corresponds to our study area, and different parts may exhibit distinct behaviors.
It takes 213.112 million tons of sediments to reach the critical value for attaining a balance between erosion and deposition in the study area; however, in fact, the sediments discharged into the sea in 2017 were far below this required value. The insufficient supply of sediments into the sea caused the subaqueous delta of the Yellow River to erode, indicating that water and sediment regulation has a significant impact on the evolution of estuaries and delta geomorphology.
5. Conclusions
In this study, the erosion and deposition conditions of the Yellow River subaqueous delta were simulated using the Delft 3D software. The simulation model results were validated against measured data, providing the characteristic distributions of the water depth, suspended sediment concentration, and erosion/deposition depth within the sea area of the subaqueous delta. We analyzed the influences of the sediment discharge into the sea on the erosion and deposition processes of the subaqueous delta. The main conclusions of this study are summarized below.
(1) The suspended sediment concentration in the Yellow River subaqueous delta generally exhibited a low-high-low distribution pattern from the coastlines to the areas far from shore. During the dry season, the high-concentration areas were strip-shaped and located near the coasts of Bohai Bay and Laizhou Bay, with values exceeding 800 g/m3; while the concentration was generally lower near the estuary and its surrounding areas. In the wet season, the estuary became the main aggregation area, with a peak concentration of around 500 g/m3; and there were no obvious high-concentration areas in either bay.
(2) The sediment flux from the Yellow River deposits along the coastline formed a deposition zone with a maximum thickness greater than 25 m. The area in which the influence of sedimentation was the greatest extended from the south side of the estuary to the west side of Laizhou Bay, and the influence range extended to 11.4 km outside the estuary. Outside this zone, an erosion zone formed under the action of wind waves, with a maximum depth of around 5 m. Wider zones occured on the east coast of Bohai Bay and the west coast of Laizhou Bay.
(3) In 2017, the overall impact of the sediment flux from the Yellow River into its submarine delta exhibited the characteristic of erosion exceeding deposition, and the total annual erosion/deposition volume was estimated to be -128.4 million cubic meters. It is estimated that the entry of a total of approximately 213.1 million tons of sediments into the sea is required to maintain equilibrium between erosion and deposition. Water and sediment regulation has a significant impact on the evolution of the erosion and deposition landforms of the Yellow River subaqueous delta.
The interruption of the water and sediment regulation measures in 2017 had an impact on the sedimentary environment of the estuaries and subaqueous deltas, indicating that at this stage, reservoir regulation is still an important means of alleviating the negative effects of river dam construction and maintaining the stability of estuaries and deltas. The water and sediment regulation project is one of the most important measures for controlling the evolution of the sedimentary environment in the lower reaches of the Yellow River, and its estuary and delta. In the future, to better maintain the geomorphic stability and sustainable development of the delta, the scientific research and optimal management of the water and sediment regulation project should be further deepened. The water and sediment control scheme should be combined with other delta protection engineering measures, such as the Dutch delta protection project[49], wetland and vegetation restoration and other overall planning, and appropriate reference should be made.
Author Contributions
Formal analysis, J.S.; data curation, K.H.; writing—original draft preparation, J.S.; writing—review and editing, B.L.; supervision, X.C.; project administration, T.L.; funding acquisition, B.L. All authors have read and agreed to the published version of the manuscript.
Funding
This research was funded by the “National Natural Science Foundation of China” (42107157); the “Fundamental Research Funds for the Central Universities” (24CX02031A); and the “annual sediment movement characteristics of the seabed boundary layer in Chengdao Oilfield” supported by Shandong Continental Shelf Marine Technology Co. LTD (HX20230616).
Data Availability Statement
The raw data supporting the conclusions of this article will be made available by the authors on request.
Acknowledgments
We thank LetPub (www.letpub.com.cn) for its linguistic assistance during the preparation of this manuscript. Special thanks go to Jin Liao for helping with the completion of the in situ observations and this study.
Conflicts of Interest
The authors declare no conflicts of interest.
References
- Shi, C. Sediment accumulation and dispersal in the Yellow River mouth since 1976. Yellow River 2020, 42, 41-45. [CrossRef]
- Liu, J.; Kong, X.; Saito, Y.; Liu, J.P.; Yang, Z.; Wen, C. Subaqueous deltaic formation of the Old Yellow River (AD 1128-1855) on the western South Yellow Sea. Mar. Geol. 2013, 344, 9-33. [CrossRef]
- Liu, P.; Wang, Q.; Zhan, C.; Wang, X.; Du, G.; Li, X. Quantitative analysis of coastline change in the Yellow River delta from 1959 to 2002. O&L Sinica 2015, 46, 585-594. [CrossRef]
- Han, X.; Chen, S.; Fu, Z.; Fan, Y.; Wang, P. Spatiotemporal evolution of erosion and deposition in the Yellow River submerged delta and its influencing factors. Mar. Sci. Bull. 2020, 39, 567-580.
- Burchard, H.; Schuttelaars, H.M.; Ralston, D.K. Sediment trapping in estuaries. Ann. Rev. Mar. Sci. 2018, 10, 371-395. [CrossRef]
- Chu, Y.; Wu, W.; Li, P.; Chen, S. Temporal and spatial dynamics of suspended sediment and its driving mechanism in the Yellow River Estuary. Haiyang Xuebao 2022, 44, 150-163.
- Zhang, X.; Fichot, C.G.; Baracco, C.; Guo, R.; Neugebauer, S.; Bengtsson, Z.; Ganju, N.; Fagherazzi, S. Determining the drivers of suspended sediment dynamics in tidal marsh-influenced estuaries using high-resolution ocean color remote sensing. Remote Sens. Environ. 2020, 240, 111682. [CrossRef]
- Van Der Wegen M. Numerical modeling of the impact of sea level rise on tidal basin morphodynamics. J. Geophys. Res. Earth Surf. 2013, 118, 447-460. [CrossRef]
- Wu, W.; Li, Y. Study on the inter-annual distribution law of suspended sediment in the Yellow River estuary based on Landsat. Water Resour. Dev. Manag. 2022, 8, 1-6. [CrossRef]
- Sun, H.; Xu, J.; Zhang, S.; Li, G.; Liu, S.; Qiao, L.; Yu, Y.; Liu, X. Field observations of seabed scour dynamics in front of a seawall during winter gales. Front. Mar. Sci. 2022, 9, 1080578. [CrossRef]
- Wang, J. A primary framework on protection of ecological environment and realization of high-quality development for the Yellow River basin. Environ. Prot. 2020, 48, 18-21. [CrossRef]
- Li, Q.; Wang, A.; Wu, X.; Tu, D.; Wang, H. Water and sediment regulation of the Yellow River and its impact on hyperpycnal flow in the estuary. Mar. Geol. Front. 2021, 37, 52-63. [CrossRef]
- Wu, X.; Fan, Y.; Wang, H.; Bi, N.; Yang, Z.; Xu, C. Geomorphological responses of the lower river channel and delta to interruption of reservoir regulation in the Yellow River, 2015-2017. Chinese Sci. Bull. 2021, 66, 3059-3070. [CrossRef]
- Fan, Y.; Dou, S.; Yu, S.; Wang, G.; Wu, Y.; Xie, W. Research progress on hydrology-geomorphology-ecology system evolution and multidimensional regulation in Yellow River Delta. Adv. Water Sci. 2023, 34, 984-998. [CrossRef]
- Yang, C.; Li, Y.; Yang, J.; Shu, S. Remote sensing inversion and regularity analysis of suspended sediment in Pearl River estuary based on machine learning model. Bull. Surv. Mapp. 2023, 9, 117-123. [CrossRef]
- Yao, R.; Cai, L.; Liu, J.; Zhou, M. Gf-1 satellite observations of suspended sediment injection of yellow river estuary, china. Remote Sens. 2020, 12, 3126. [CrossRef]
- Yu, Z.; Zhang, J.; Chen, Z.; Hu, Y.; Shum, C. K.; Ma, C.; Song, Q.; Yuan, X.; Wang, B.; Zhou, B. Spatiotemporal evolutions of the suspended particulate matter in the Yellow River Estuary, Bohai Sea and characterized by Gaofen imagery. Remote Sens. 2023, 15, 4769. [CrossRef]
- Fan, Y.; Chen, S.; Pan, S.; Dou, S. Storm-induced hydrodynamic changes and seabed erosion in the littoral area of Yellow River Delta: A model-guided mechanism study. Cont. Shelf Res. 2020, 205, 10417. [CrossRef]
- Du, Y.; Li, W.; Shen, W.; Li, H. Research on improving the accuracy of suspended sediment numerical simulation by using remote sensing inversion data. J. Waterw. Harb. 2021, 42, 582-587.
- Li, Q.; Wang, Y.; Bai, T. Review on water and sediment regulation of the Yellow River. J. Northwest A&F Univ.(Nat. Sci. Ed.) 2014, 12, 227-234. [CrossRef]
- Li, S.; Tian, J.; Zhan, S.; Wang, C.; Ren, Y.; Wang, T. Advances in research and application on three-dimensional numerical simulation of sediment transport in coastal waters. J. Ludong Univ.(Nat. Sci. Ed.) 2023, 39, 322-327. [CrossRef]
- Wang, X.; Han, S.; Wang, X. Application of ECOMSED model in sedimentation of Bohai Bay. Trans. Oceanol. Limnol. 2018, 6, 9-16. [CrossRef]
- Zăinescu, F.; Vespremeanu-Stroe, A.; Anthony, E.; Tătui, F.; Preoteasa, L.; Mateescu, R. Flood deposition and storm removal of sediments in front of a deltaic wave-influenced river mouth. Mar Geol. 2019, 417, 106015. [CrossRef]
- Huang, L.; Chen, S.; Li, P.;Yang, M.; Liu, Q. Spatiotemporal distribution of suspended sediment in the tail channel of the Huanghe River Delta from 2016 to 2020. Mar. Sci. Bull. 2023, 42, 303-313.
- Li, B.; Liu, J.P.; Jia, Y. Comparison of the causes of erosion–deposition between Yellow River, Yangtze River, and Mekong River subaqueous delta l: Model building. Water 2022, 14, 3028. [CrossRef]
- Li, W.; Kou, H. Thoughts on the construction of digital twin Yellow River in the new stage. China Flood & Drought Manag. 2022, 32, 27-31. [CrossRef]
- Zheng, S.; Han, S.; Tan, G.; Xia, J.; Wu, B.; Wang, K.; Edmonds, D.A. Morphological adjustment of the Qingshuigou channel on the Yellow River Delta and factors controlling its avulsion. Catena 2018, 166, 44-55. [CrossRef]
- Jiang, C.; Pan, S.; Chen, S. Recent morphological changes of the Yellow River (Huanghe) submerged delta: Causes and environmental implications. Geomorphology 2017, 293, 93-107. [CrossRef]
- Pelling, H.E.; Uehara, K.; Green, J.A.M. The impact of rapid coastline changes and sea level rise on the tides in the Bohai Sea, China. J. Geophys. Res. Oceans 2013, 118, 3462-3472. [CrossRef]
- Zeng, L.; Zhan, C.; Wang, Q.; Liu, X.; Wang, L.; Li, X.; Wang, X.; Yu, X.; Zhang, J.; Cui, B. Sediment coarsening in tidal flats and stable coastline of the abandoned southern Yellow River sub-delta in response to fluvial sediment flux decrease during the past decades. Front. Mar. Sci. 2021, 8, 761368. [CrossRef]
- Yuan, P.; Bi, N.; Wu, X.; Zhang, Y.; Wang, H. Surface sediments at the subaqueous Yellow River delta: classification and distribution. Mar. Geol. Quat. Geol. 2016, 36, 49-57. [CrossRef]
- Fan, Y.; Zhang, S.; Du, X.; Wang, G.; Yu, S.; Dou, S.; Chen, S.; Ji, H.; Li, P.; Liu, F. The effects of flow pulses on river plumes in the Yellow River Estuary, in spring. J. Hydroinform. 2023, 25, 36-50. [CrossRef]
- Li, M.; Sun, Z.; Gong, Y.; Hu, Y. Numerical simulation of sand-mud coexisting beach based on Delft-3D. Bull. Sci. Technol. 2019, 35, 109-113. [CrossRef]
- Luan, H.; Ding, P.; Wang, Z.; Ge, J. Process-based morphodynamic modeling of the Yangtze Estuary at a decadal timescale: Controls on estuarine evolution and future trends. Geomorphology 2017, 290, 347-364. [CrossRef]
- Cheng, X.; Zhu, J.; Chen, S. Extensions of the river plume under various Yellow River courses into the Bohai Sea at different times. Estuar. Coast. Shelf Sci. 2021, 249, 107092. [CrossRef]
- Xu, Z.; Dong, X.; Yin, Y. Numerical simulation of waves and wave-induced currents in the vicinity of a detached breakwater based on Delft 3D. J. Waterw. Harb. 2016, 37, 27-34.
- George, D.; Largier, J.; Pasternack, G.; Barnard, P.; Storlazzi, C.; Erikson, L. Modeling sediment bypassing around idealized rocky headlands. J. Mar. Sci. Eng. 2019, 7, 40. [CrossRef]
- Hoque, M.; Perrie, W.; Solomon, S. Application of SWAN model for storm generated wave simulation in the Canadian Beaufort Sea. J. Ocean Eng. Sci. 2020, 5, 19-34. [CrossRef]
- Wang, N.; Chen, Q.; Zhu, L.; Sun, H. Integration of data-driven and physics-based modeling of wind waves in a shallow estuary. Ocean Model. 2022, 172, 101978. [CrossRef]
- Li, B.; Jia, Y.; Zhang, Y.; Shan, H. Study on processes of seabed in the Yellow River Delta. J. Sediment Res. 2020, 45, 16-22. [CrossRef]
- Bi, N.; Shi, Y.; Ge, C.; Ba, Q.; Wu, X.; Wang, H. Impacts of morphological evoltion of the Huanghe River mouth by artificial regulation on deltaic sedimentation. Mar. Geol. Quat. Geol. 2024, 44, 1-14. [CrossRef]
- Park, S.S.; Lee, Y.S. A multiconstituent moving segment model for water quality predictions in steep and shallow streams. Ecol. Modell. 1996, 89, 121-131. [CrossRef]
- Cai X. Retrieve of spatial and temporal distribution of suspended sediment in Bohai Bay based on GF-1 remote sensing satellite. J. Atmos. Environ. Opt. 2020, 15, 134-142.
- Wu, W.; Fu, H. Spatial-temporal distributionof suspended sediment in the Yellow River Estuary based on GF-1 remote sensing satellite. In 2021 ( 9th ) China Water Conservancy Information Technology Forum. Jinan, Shandong, China, 27th May, 2021. [CrossRef]
- Cui, B.; Li, X. Coastline change of the Yellow River estuary and its response to the sediment and runoff (1976-2005). Geomorphology 2011, 127, 32-40. [CrossRef]
- Bi, N.; Wang, H.; Yang, Z. Recent changes in the erosion-accretion patterns of the active Huanghe (Yellow River) delta lobe caused by human activities. Cont. Shelf Res. 2014, 90, 70-78. [CrossRef]
- Chen, S.; Gu, S.; Ji, H.; Xu, C. Processes of the Yellow River Mouth on new water and sediment condition. J. Sediment Res. 2019, 44, 61-67. [CrossRef]
- Zhao, G. Study on the longshore sediment transport and coastal erosion situation in the Modern Yellow River Delta area. Coast. Engin. 2006, 25, 29-38.
- Zegwaard, A.; Zwarteveen, M.; van Halsema, G. Arthur Petersen,Sameness and difference in delta planning. Environ. Sci. Policy. 2019, 94, 237-244. [CrossRef]
Figure 1.
Location of the Yellow River Delta.
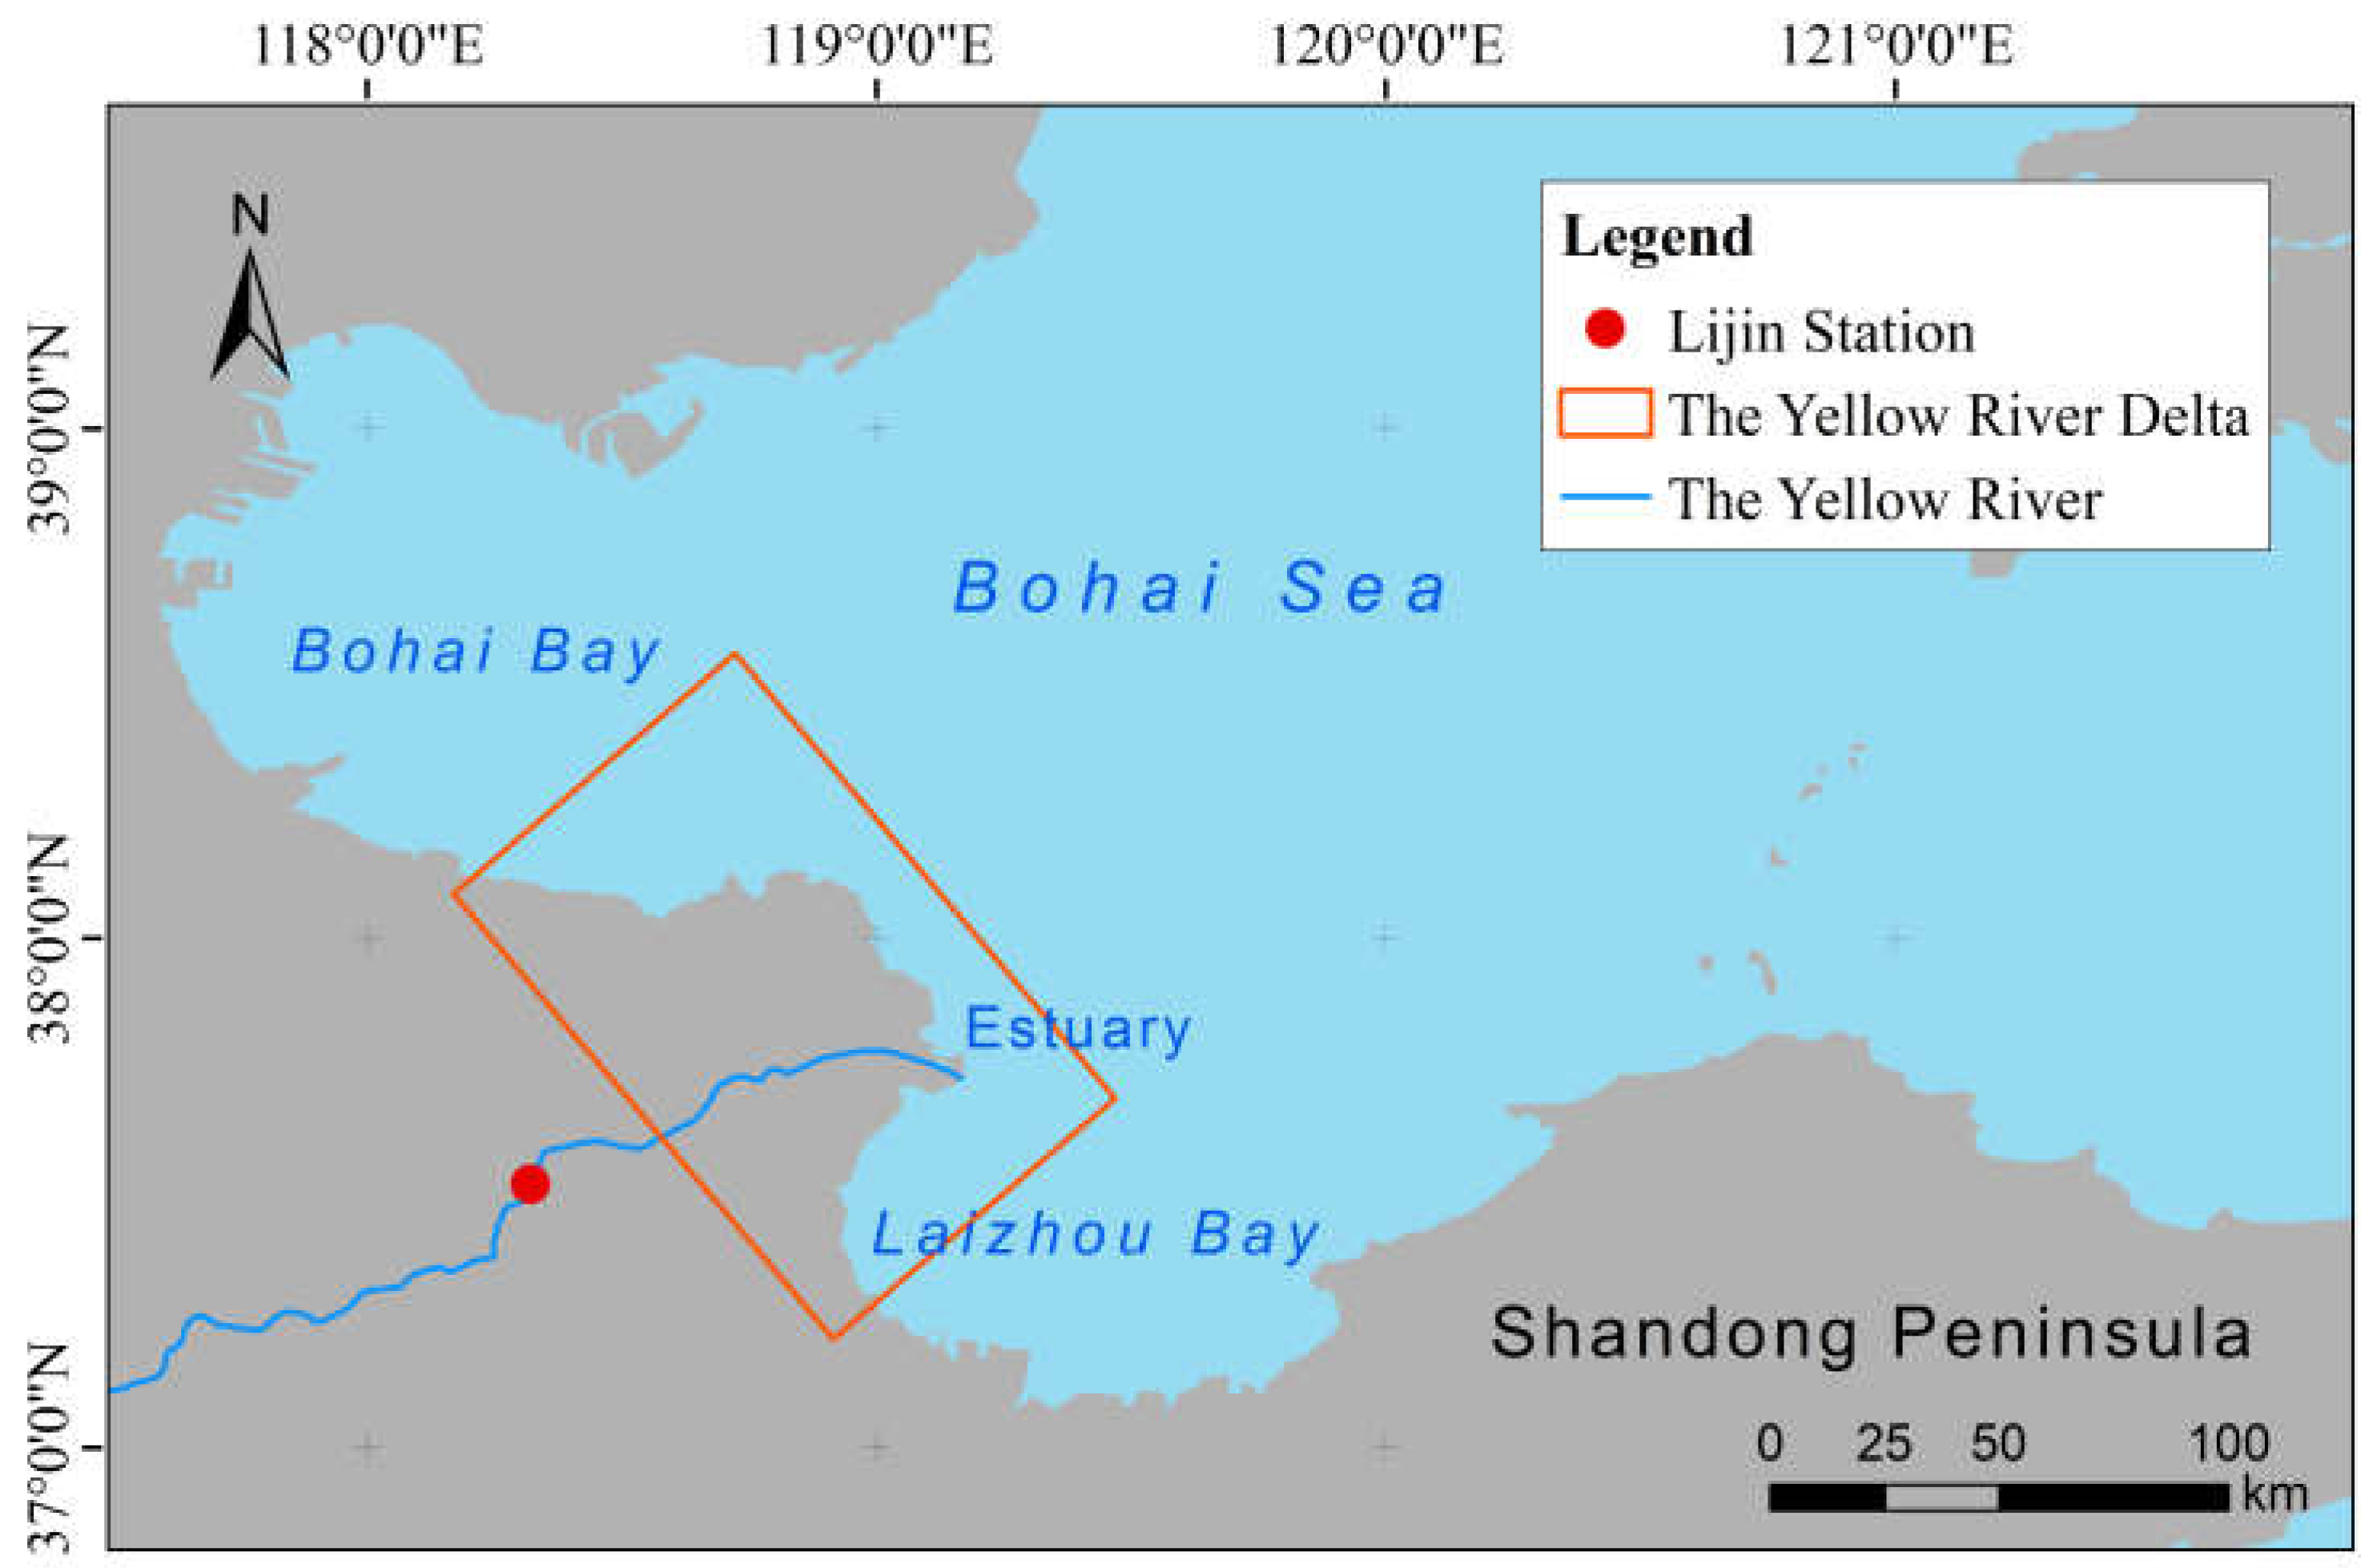
Figure 2.
Grid base map of the study area.
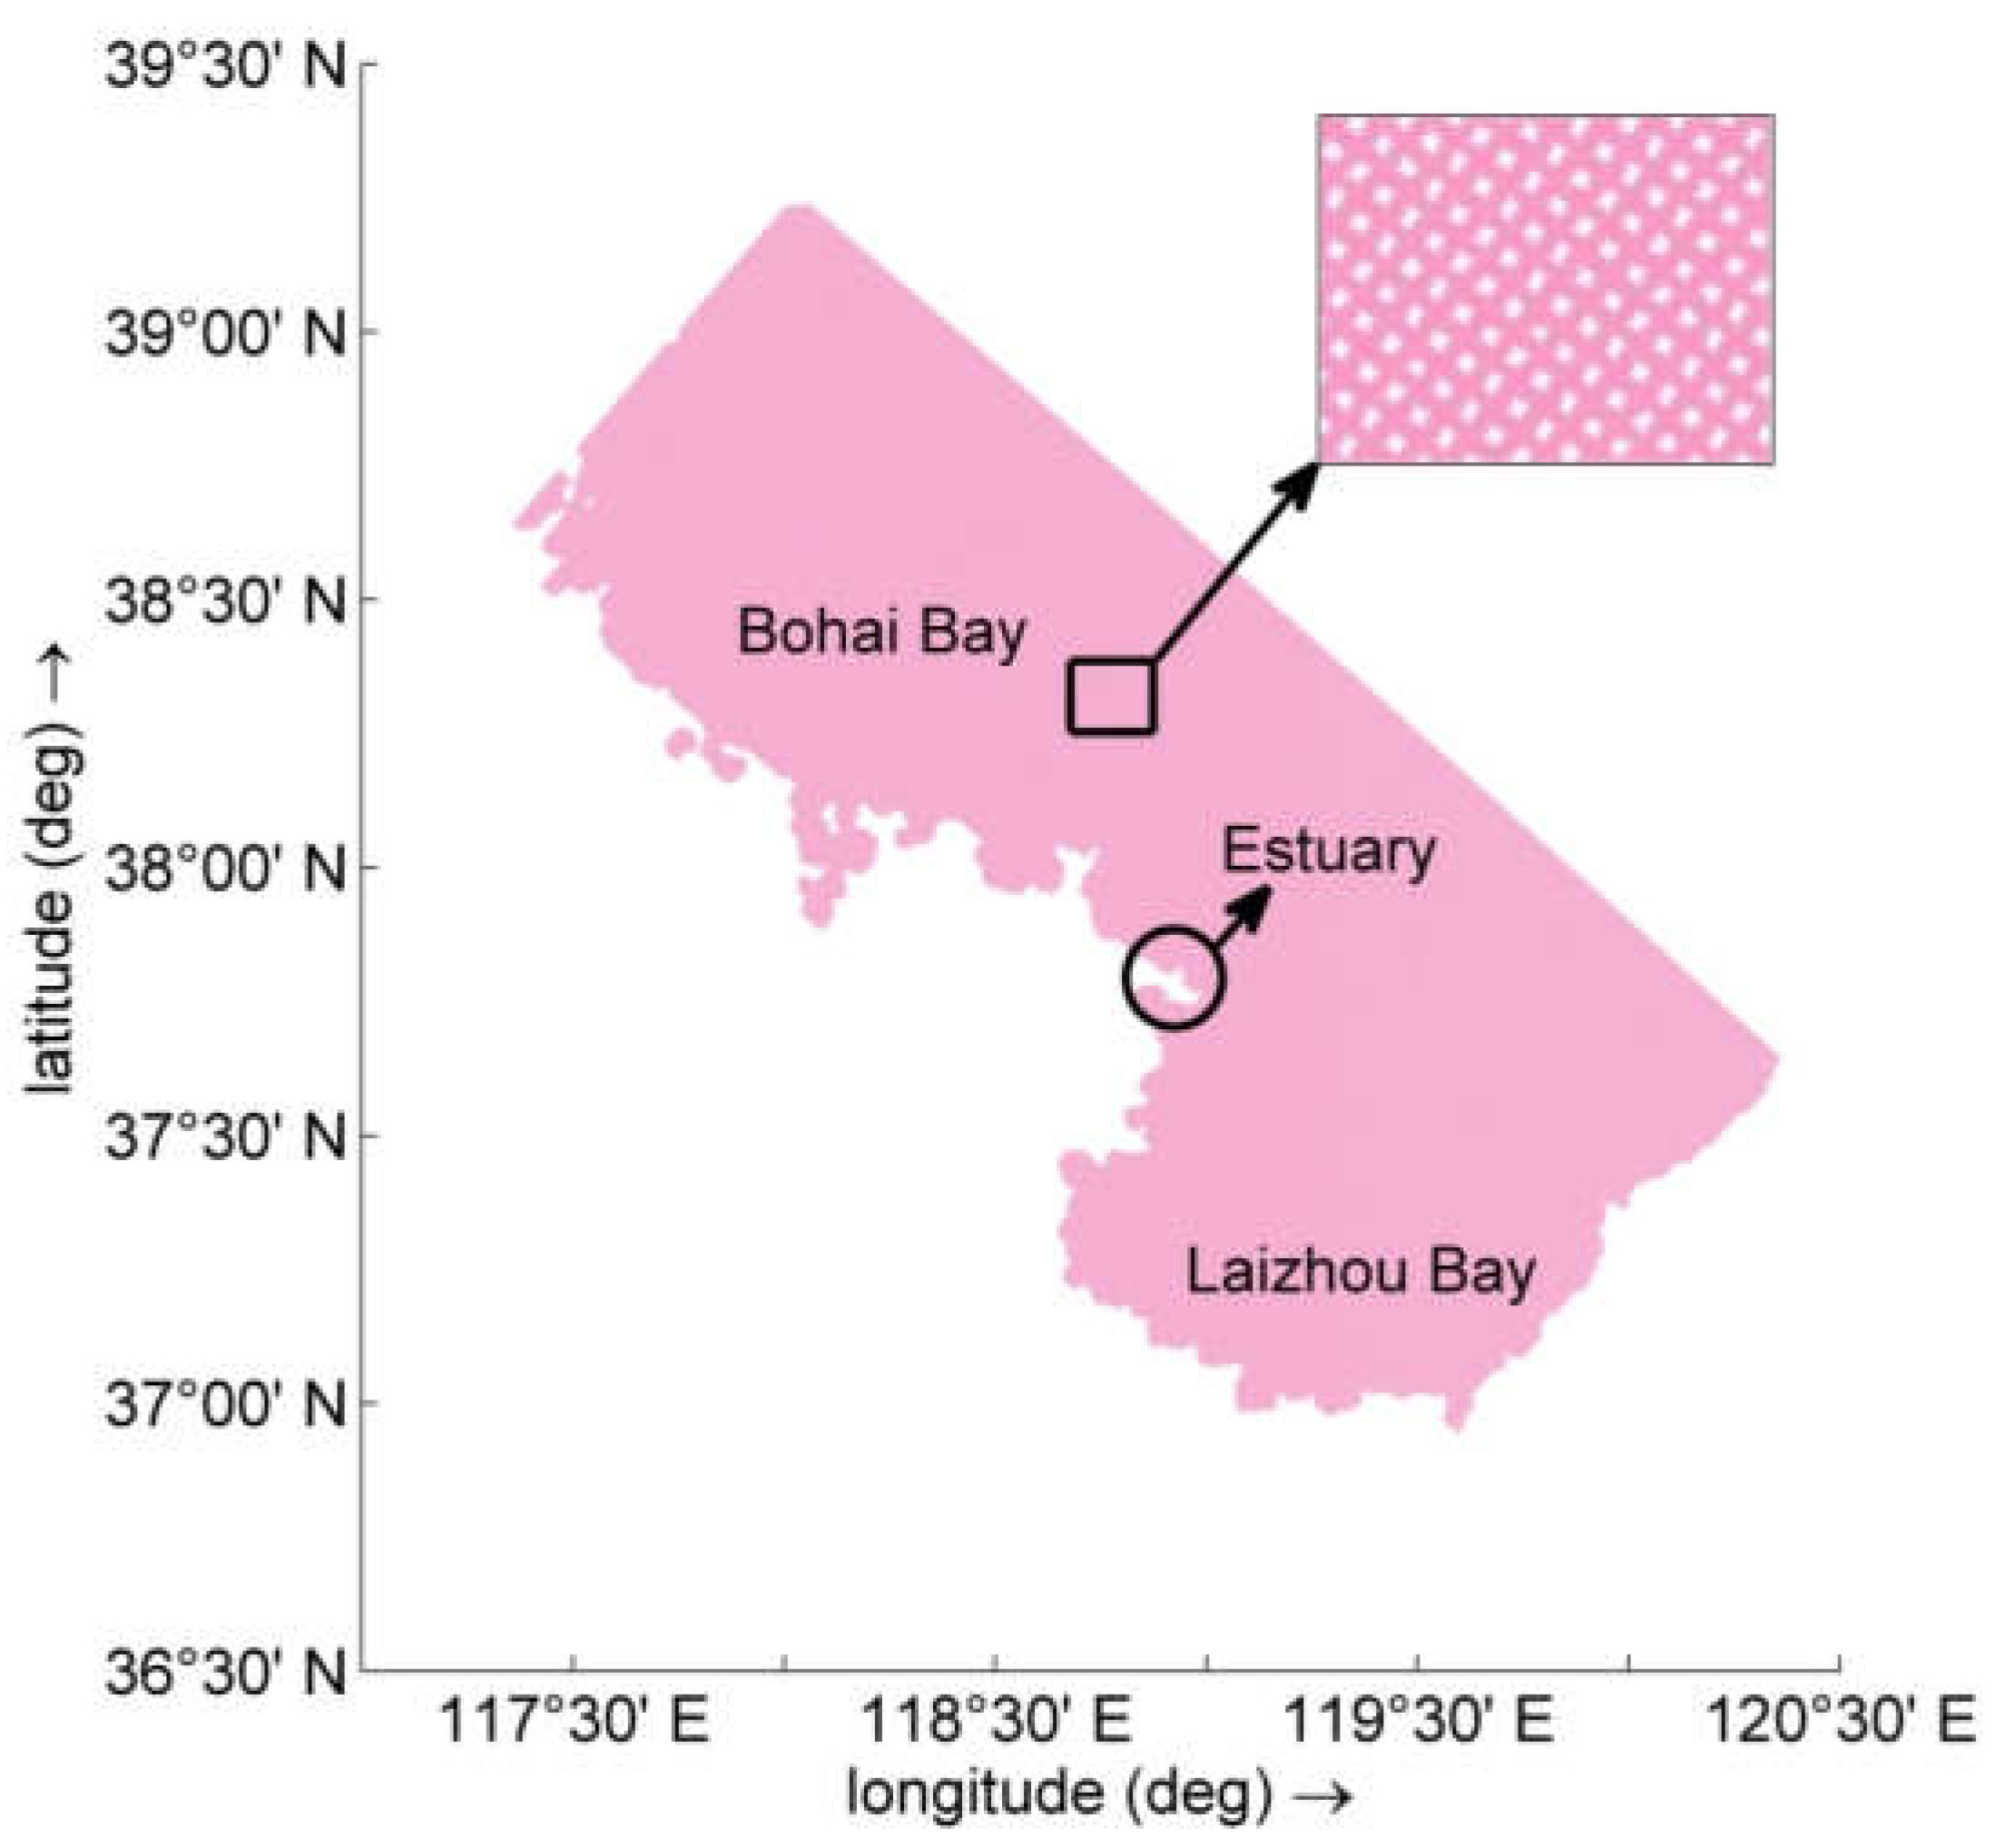
Figure 3.
Distribution of observation sites. ▲indicates the tidal observation site; ■ indicates the current observation site; ● indicates the suspended sediment concentration observation site; and ★ indicates the seabed morphology.
Figure 3.
Distribution of observation sites. ▲indicates the tidal observation site; ■ indicates the current observation site; ● indicates the suspended sediment concentration observation site; and ★ indicates the seabed morphology.
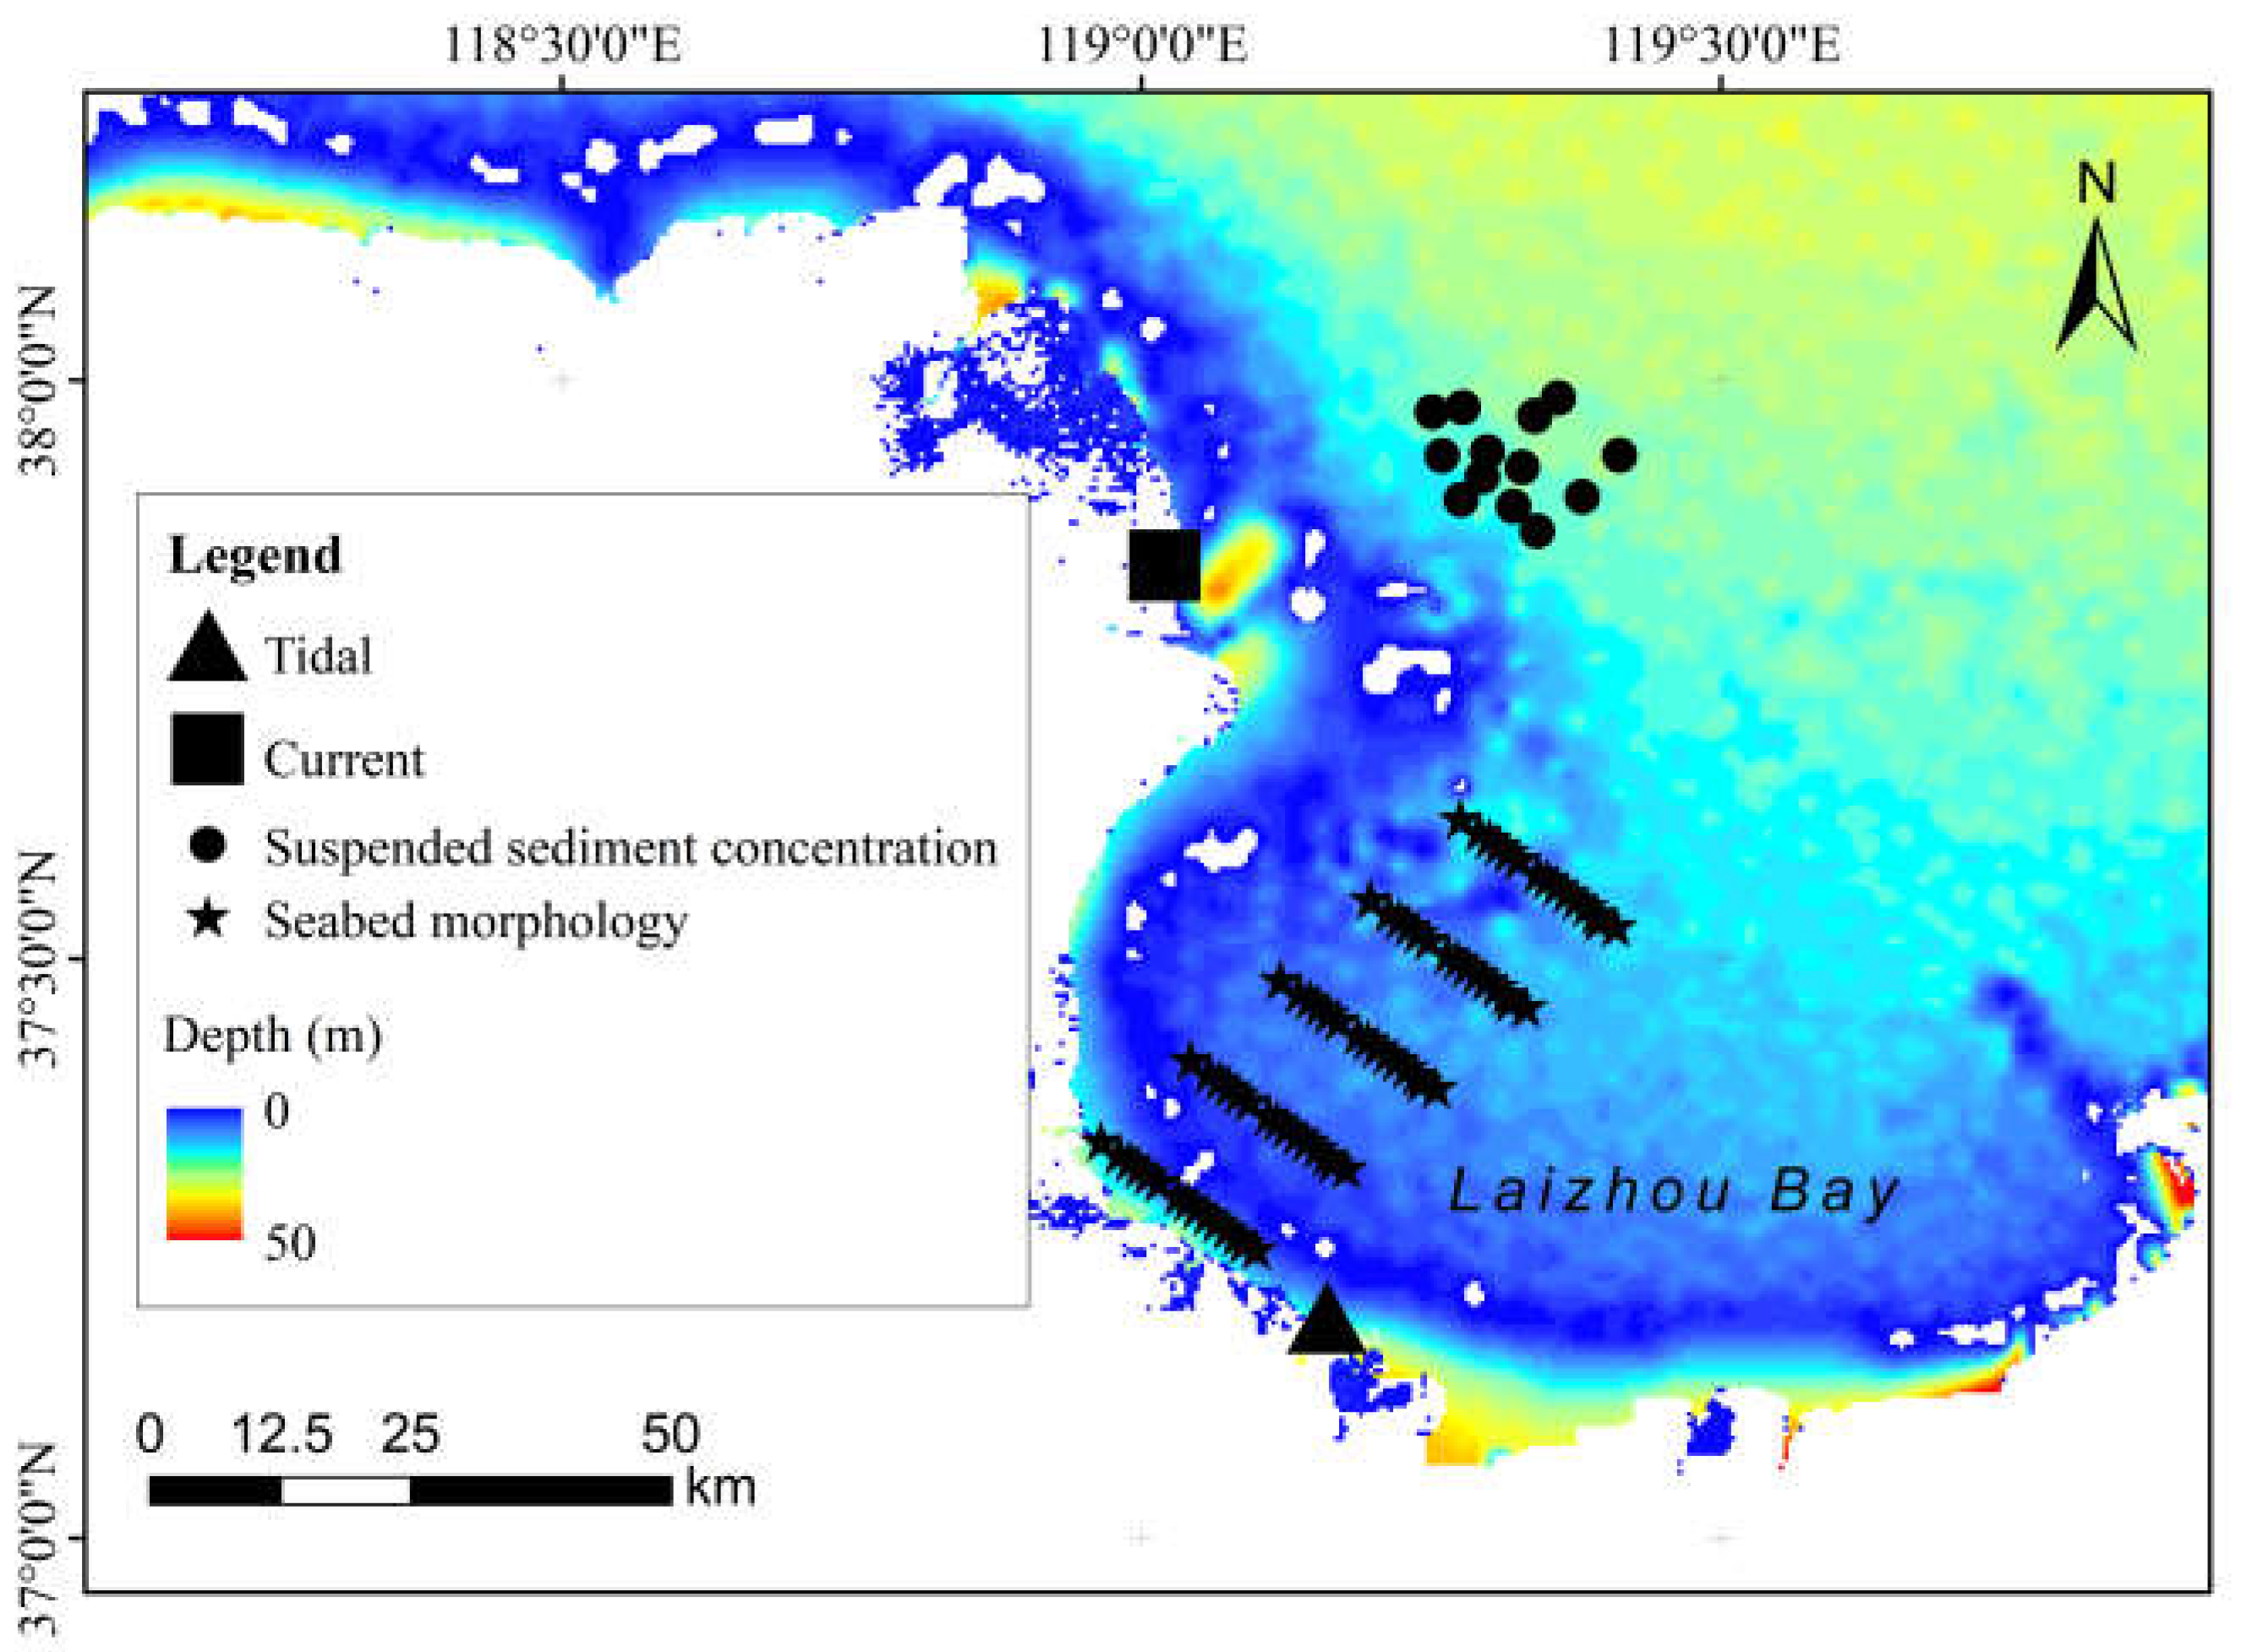
Figure 4.
Changes in measured current velocity and simulated current velocity.
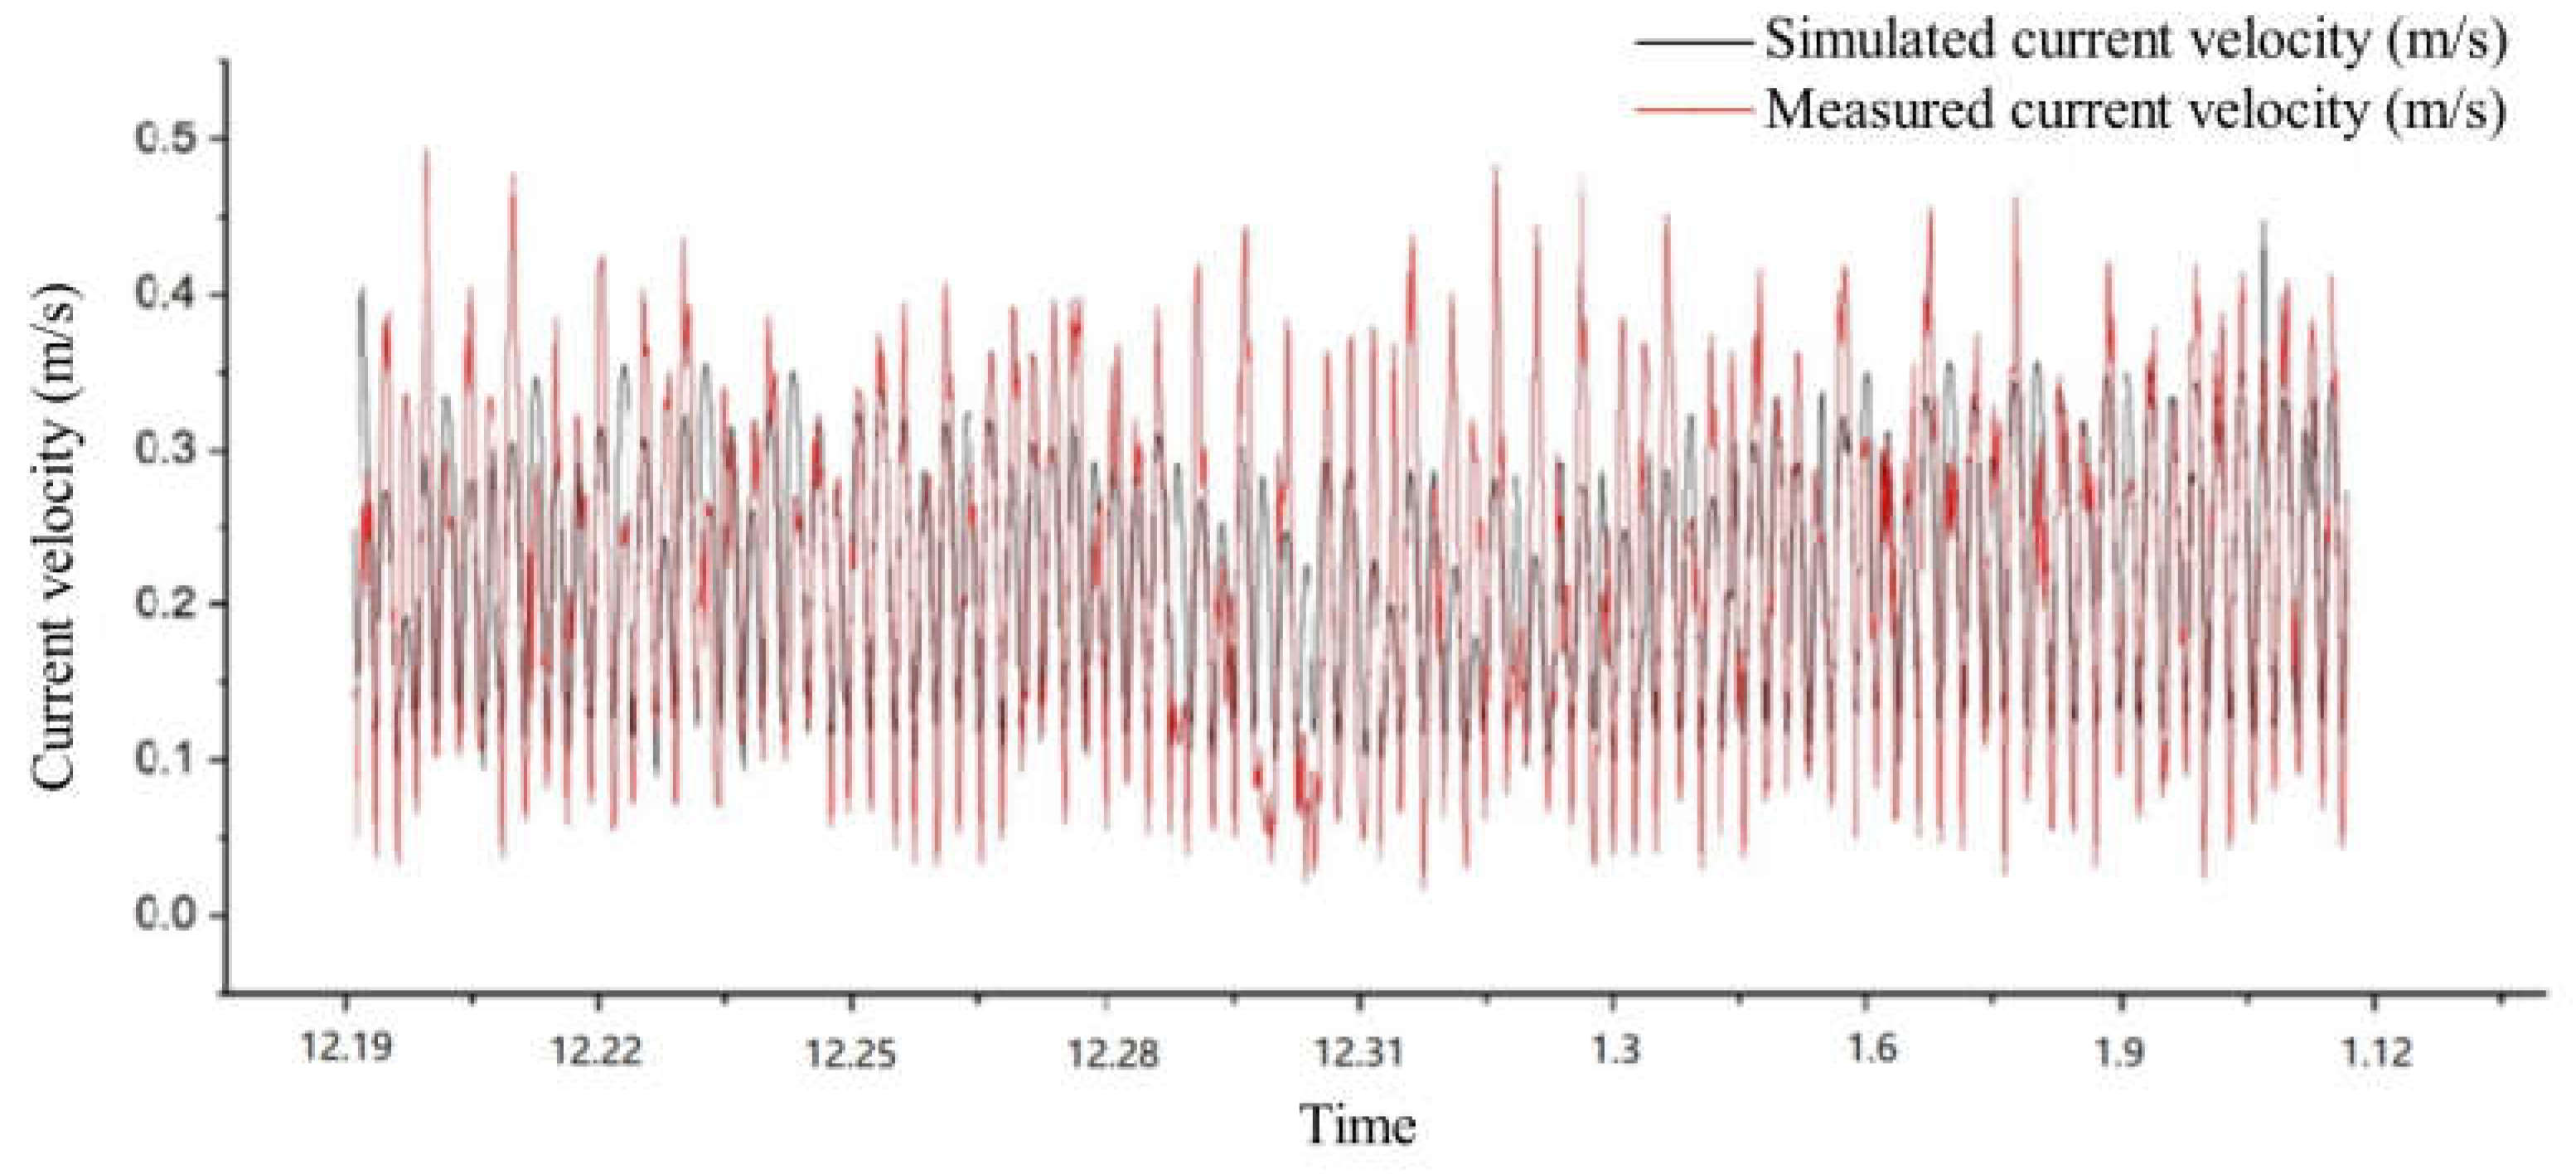
Figure 5.
Correlation between the simulated and measured current velocities (Pearson's r = 0.69).
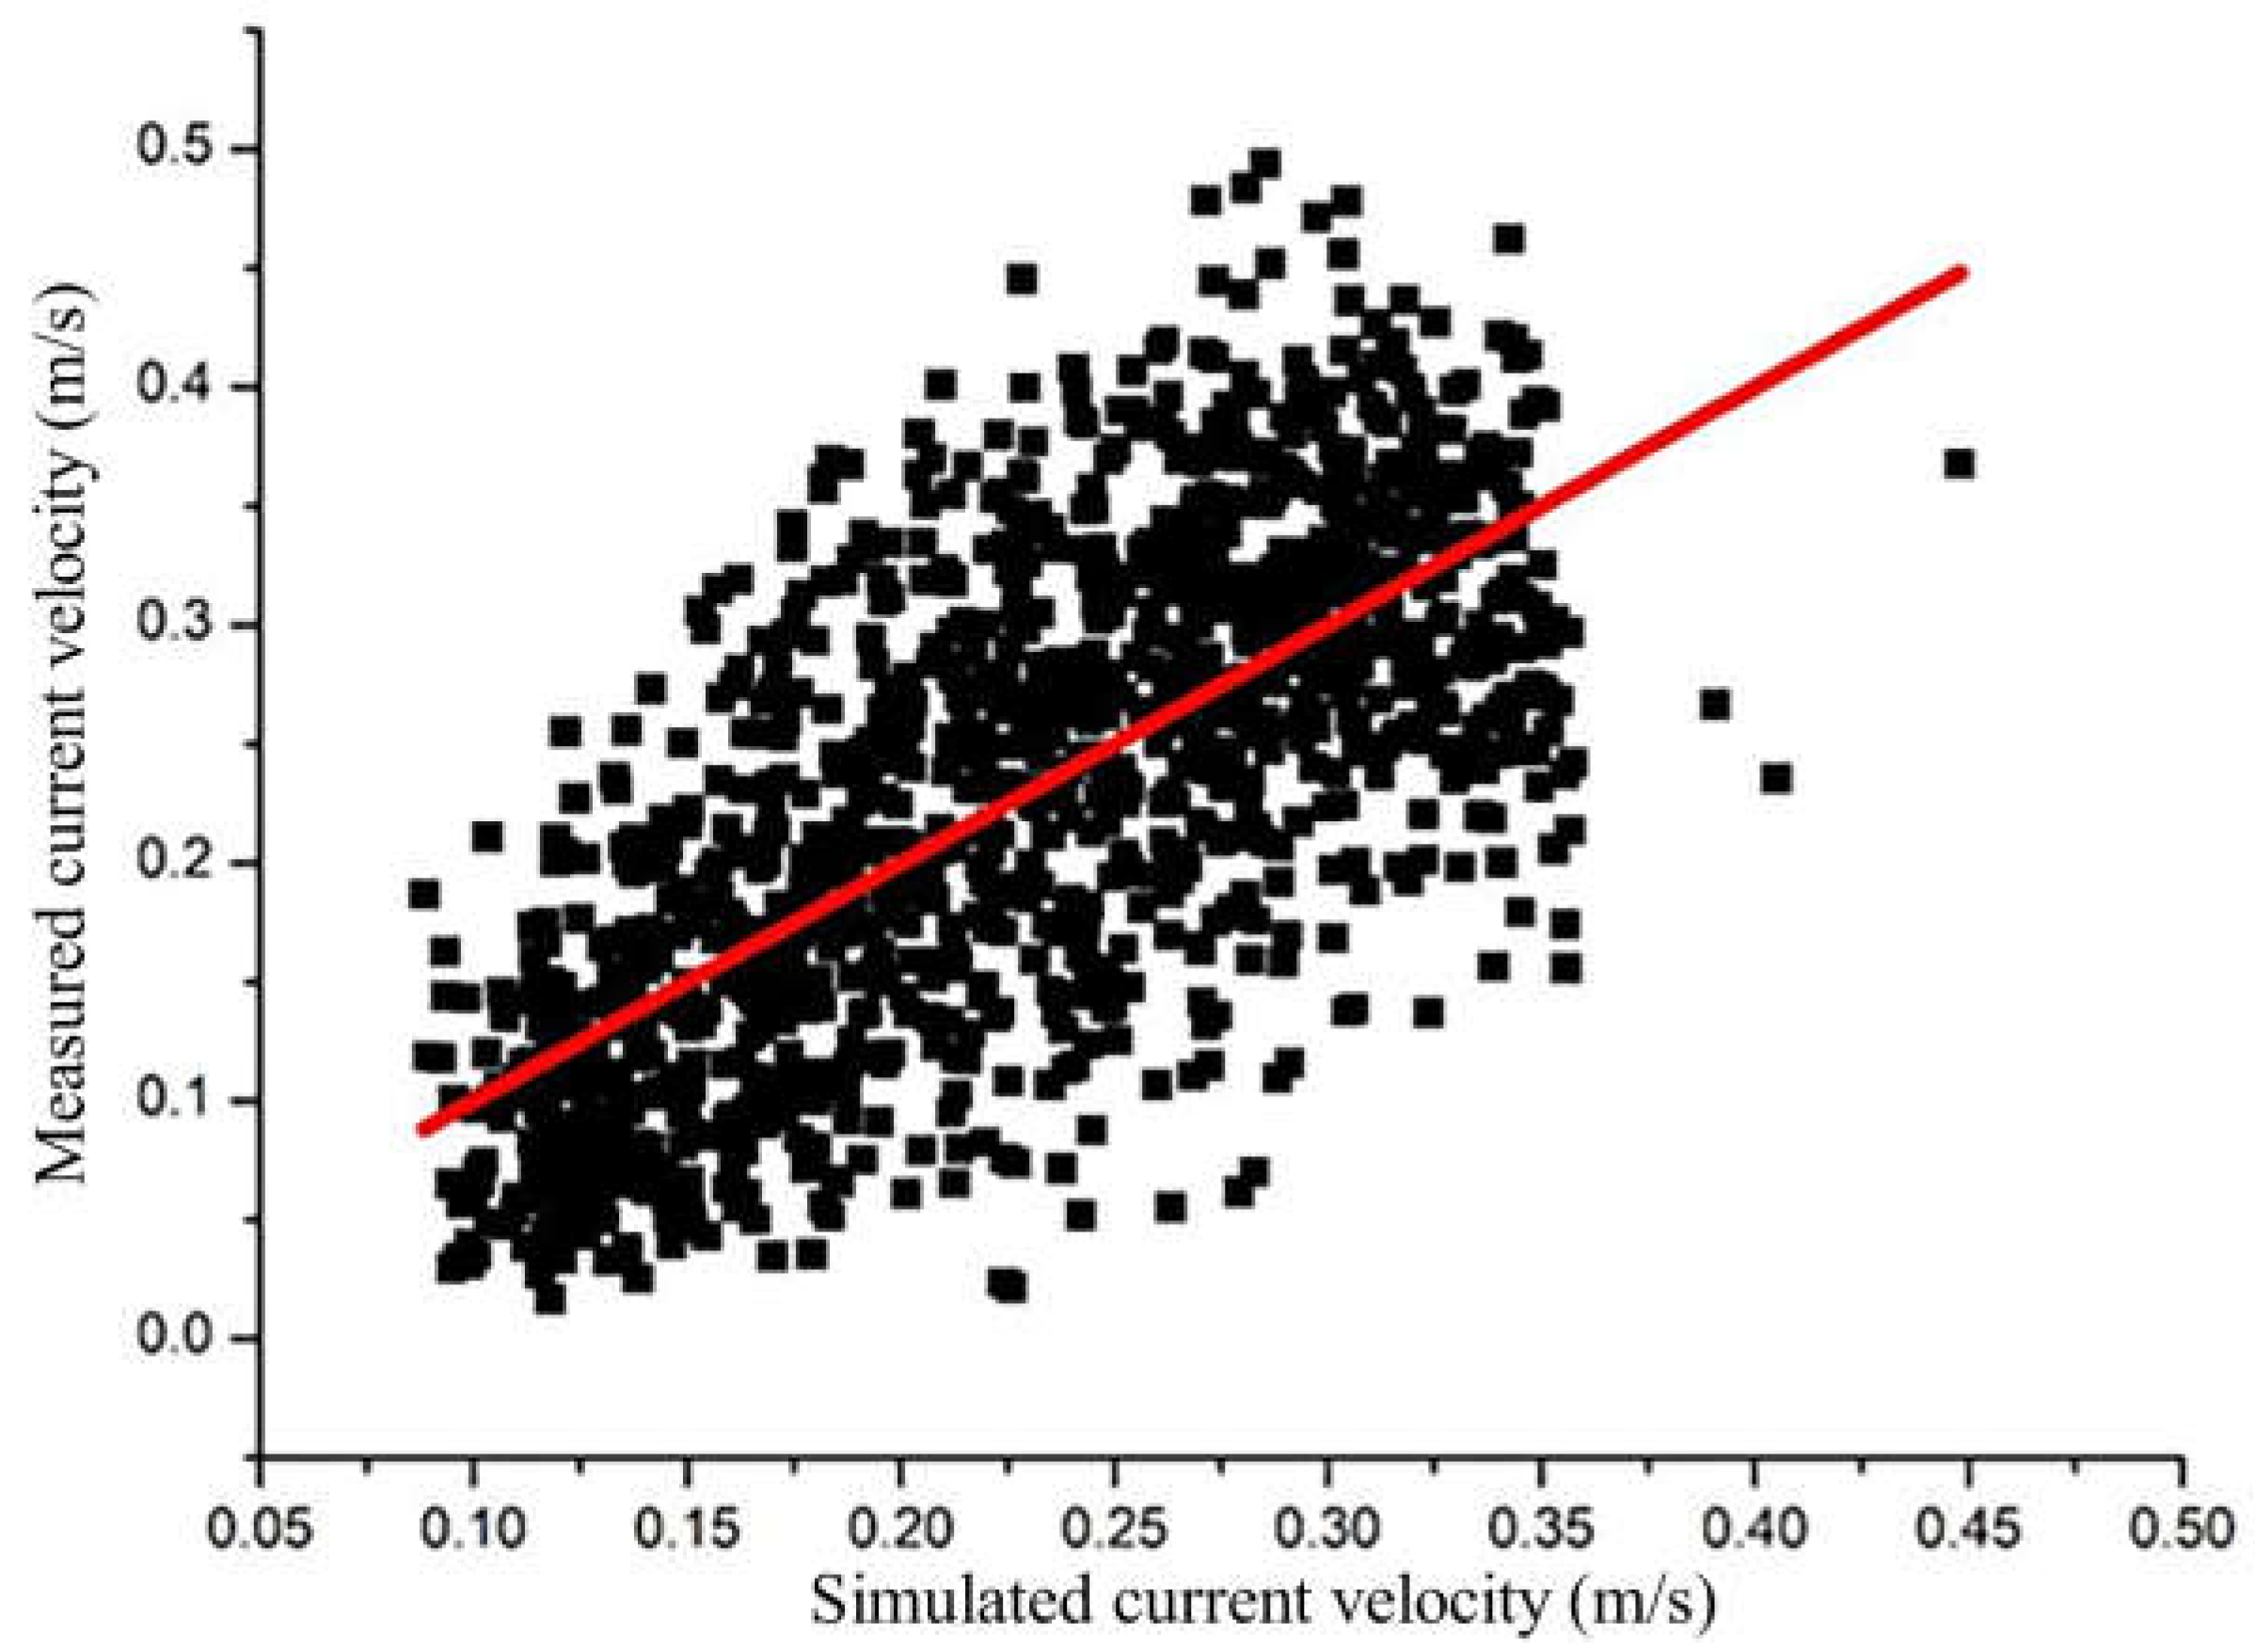
Figure 6.
Changes in the measured tidal range and simulated tidal range.
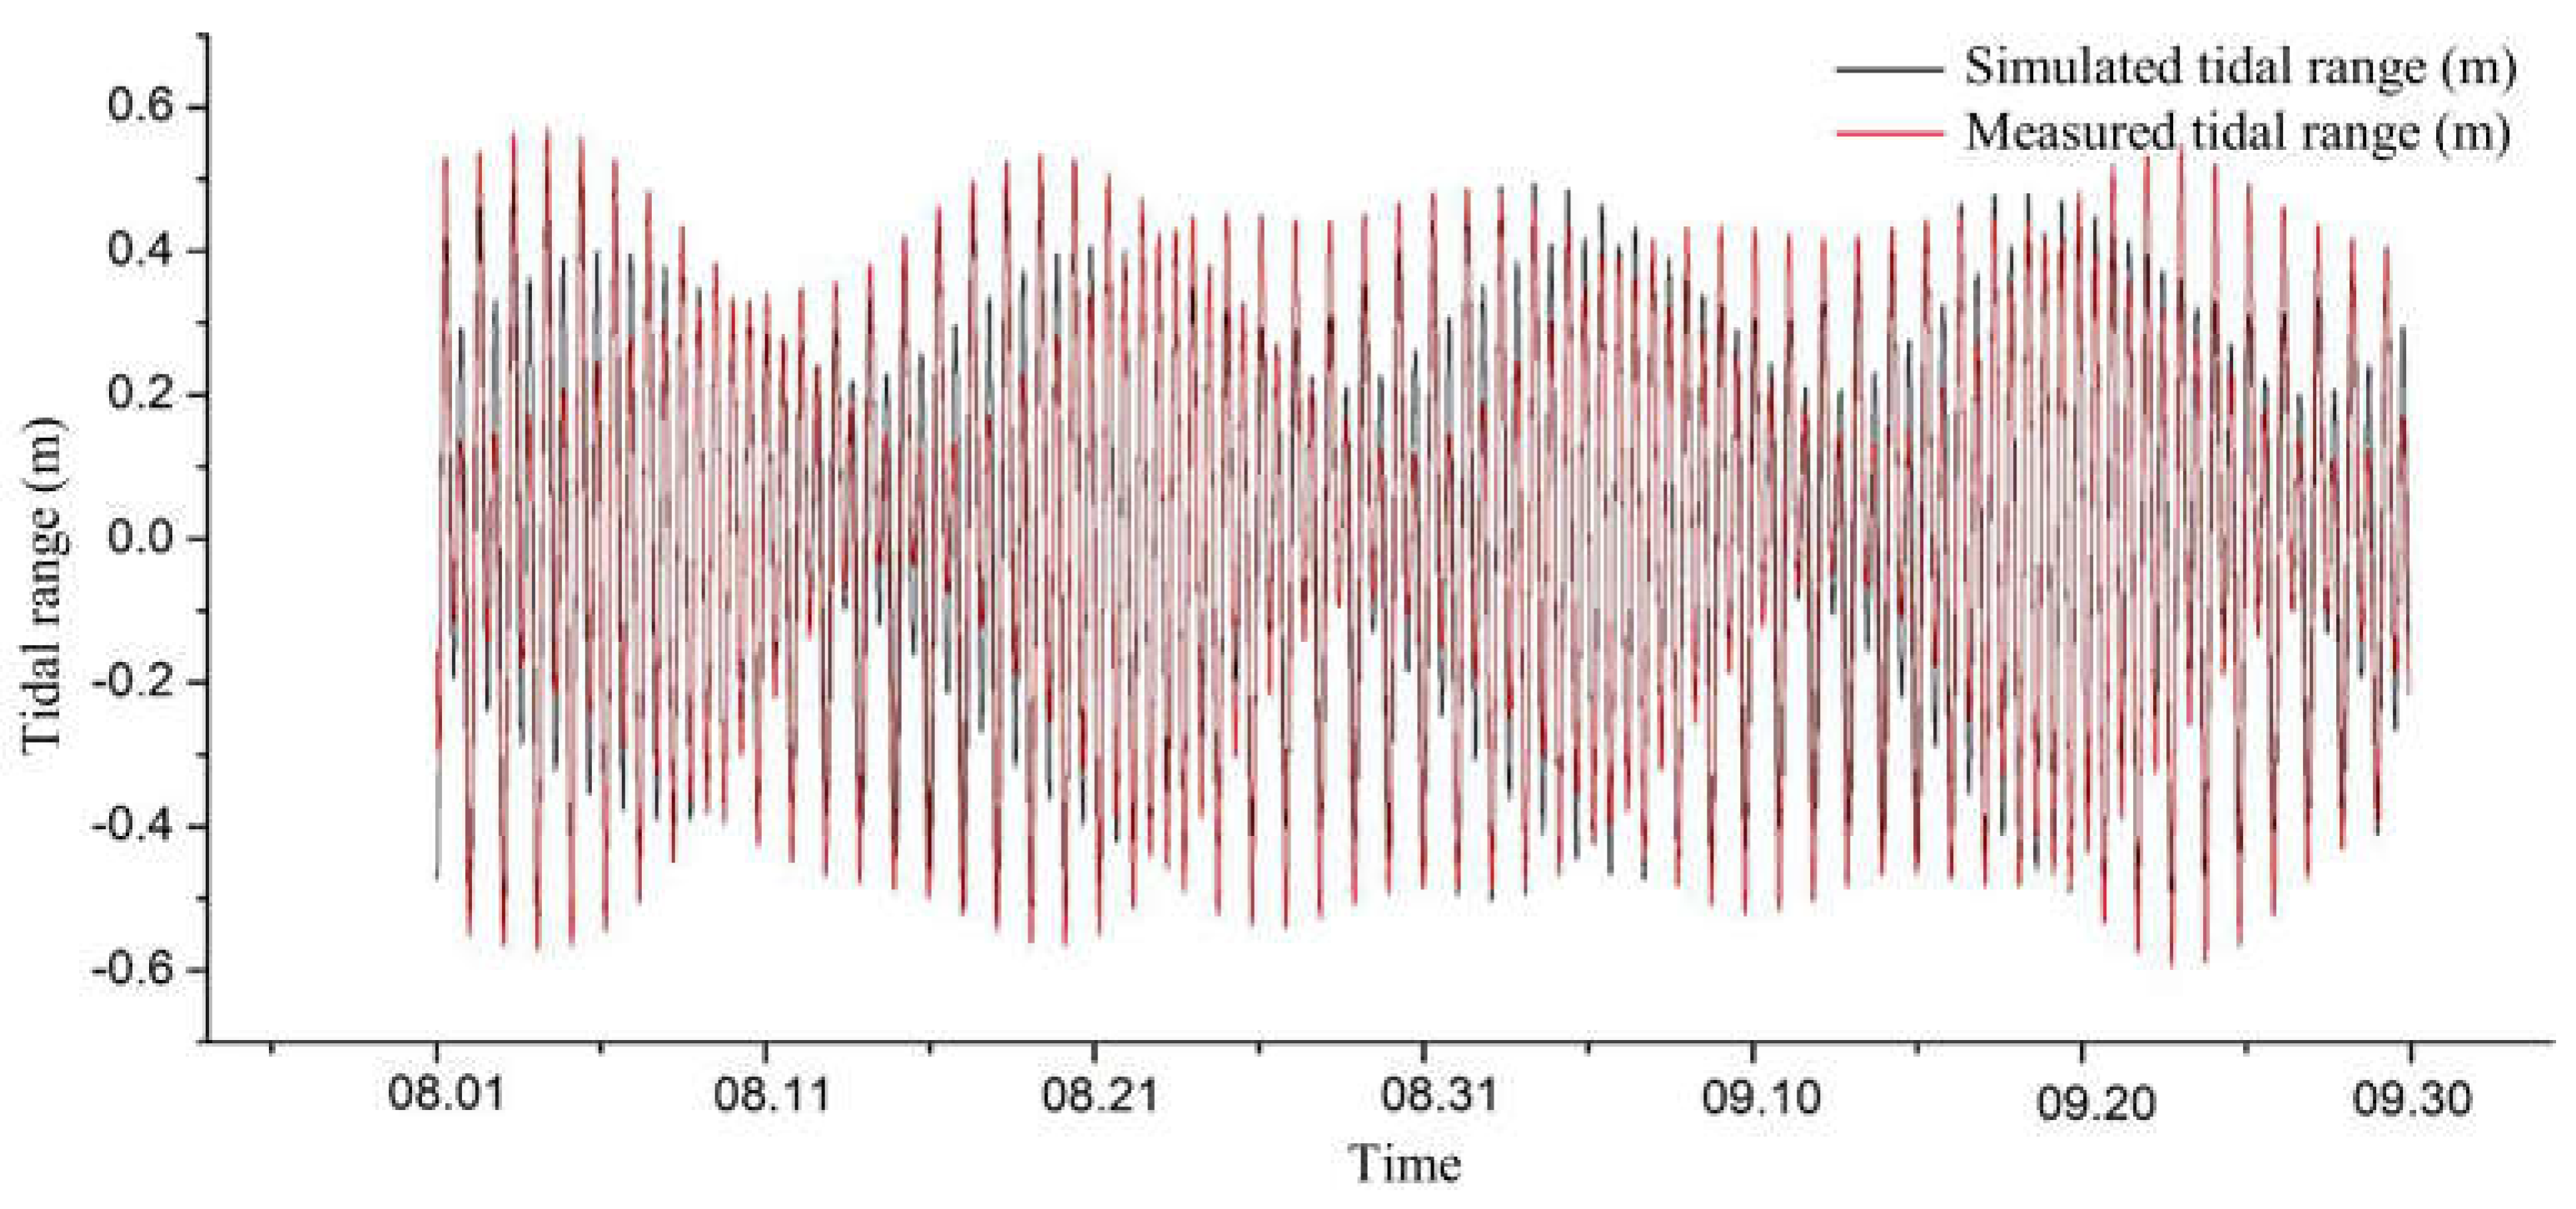
Figure 7.
Correlation between the simulated and measured tidal ranges (Pearson's r = 0.94).
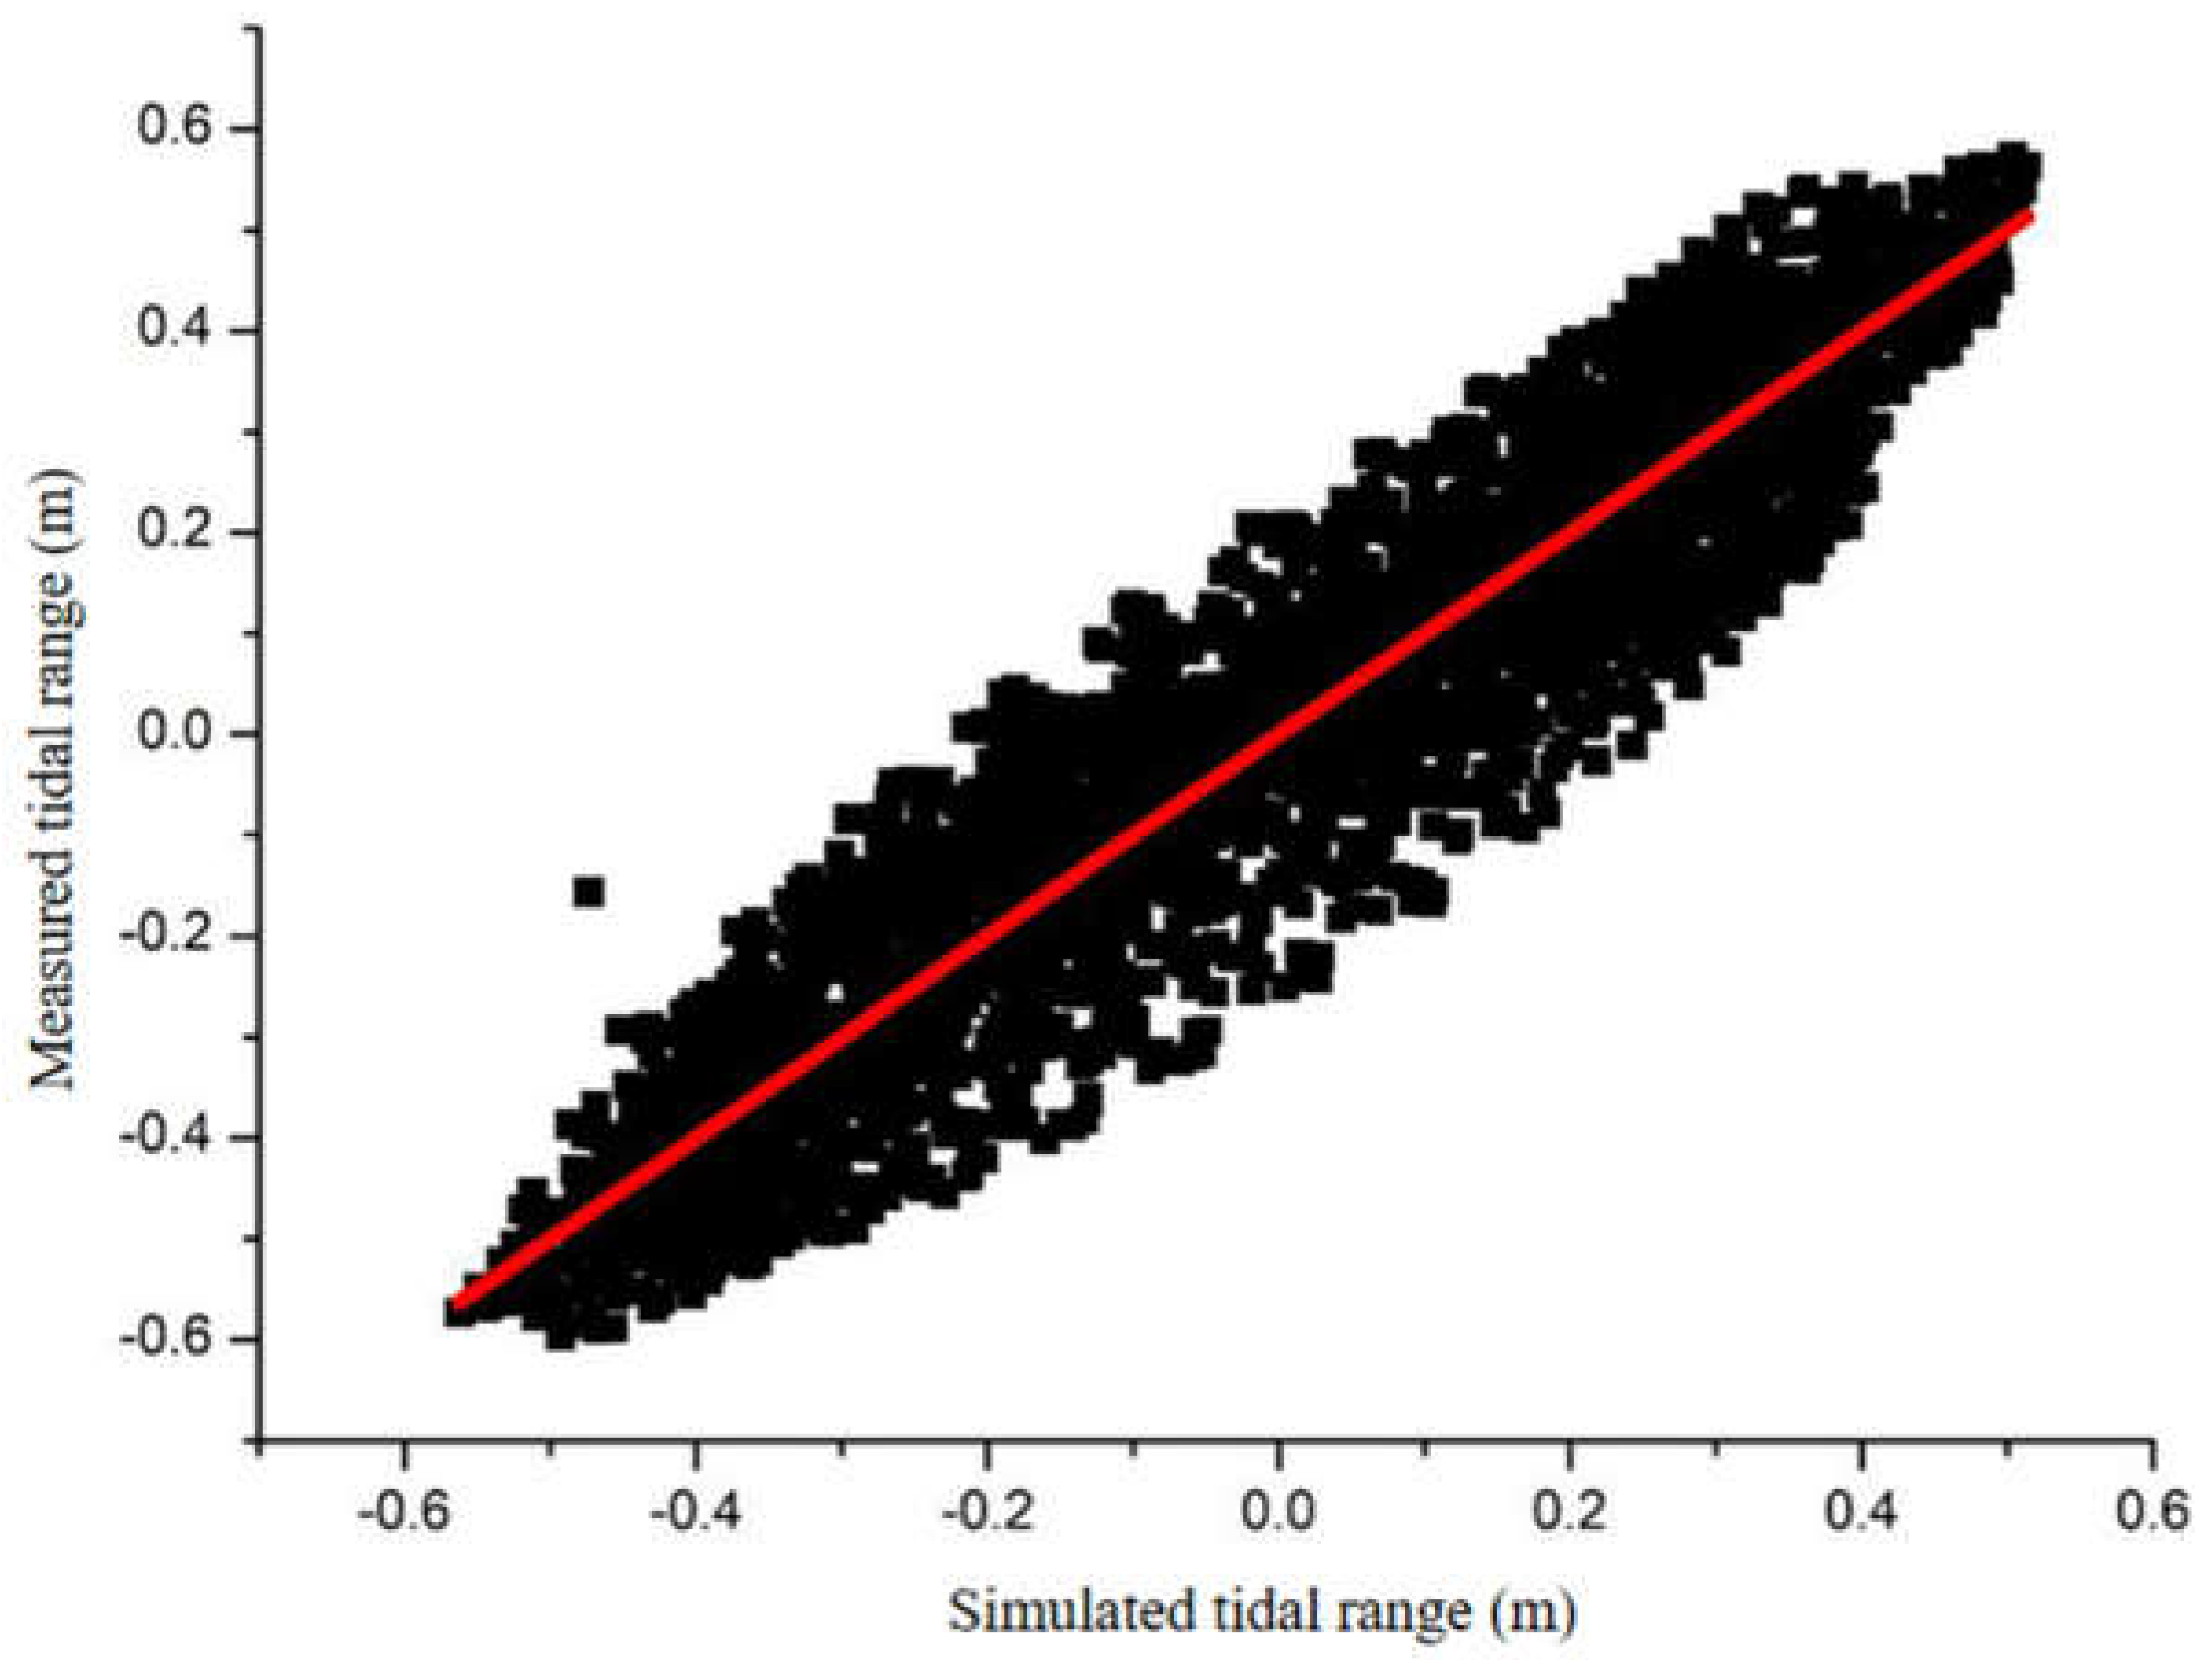
Figure 8.
Correlation between the measured and simulated suspended sediment concentrations (Pearson's r = 0.87).
Figure 8.
Correlation between the measured and simulated suspended sediment concentrations (Pearson's r = 0.87).
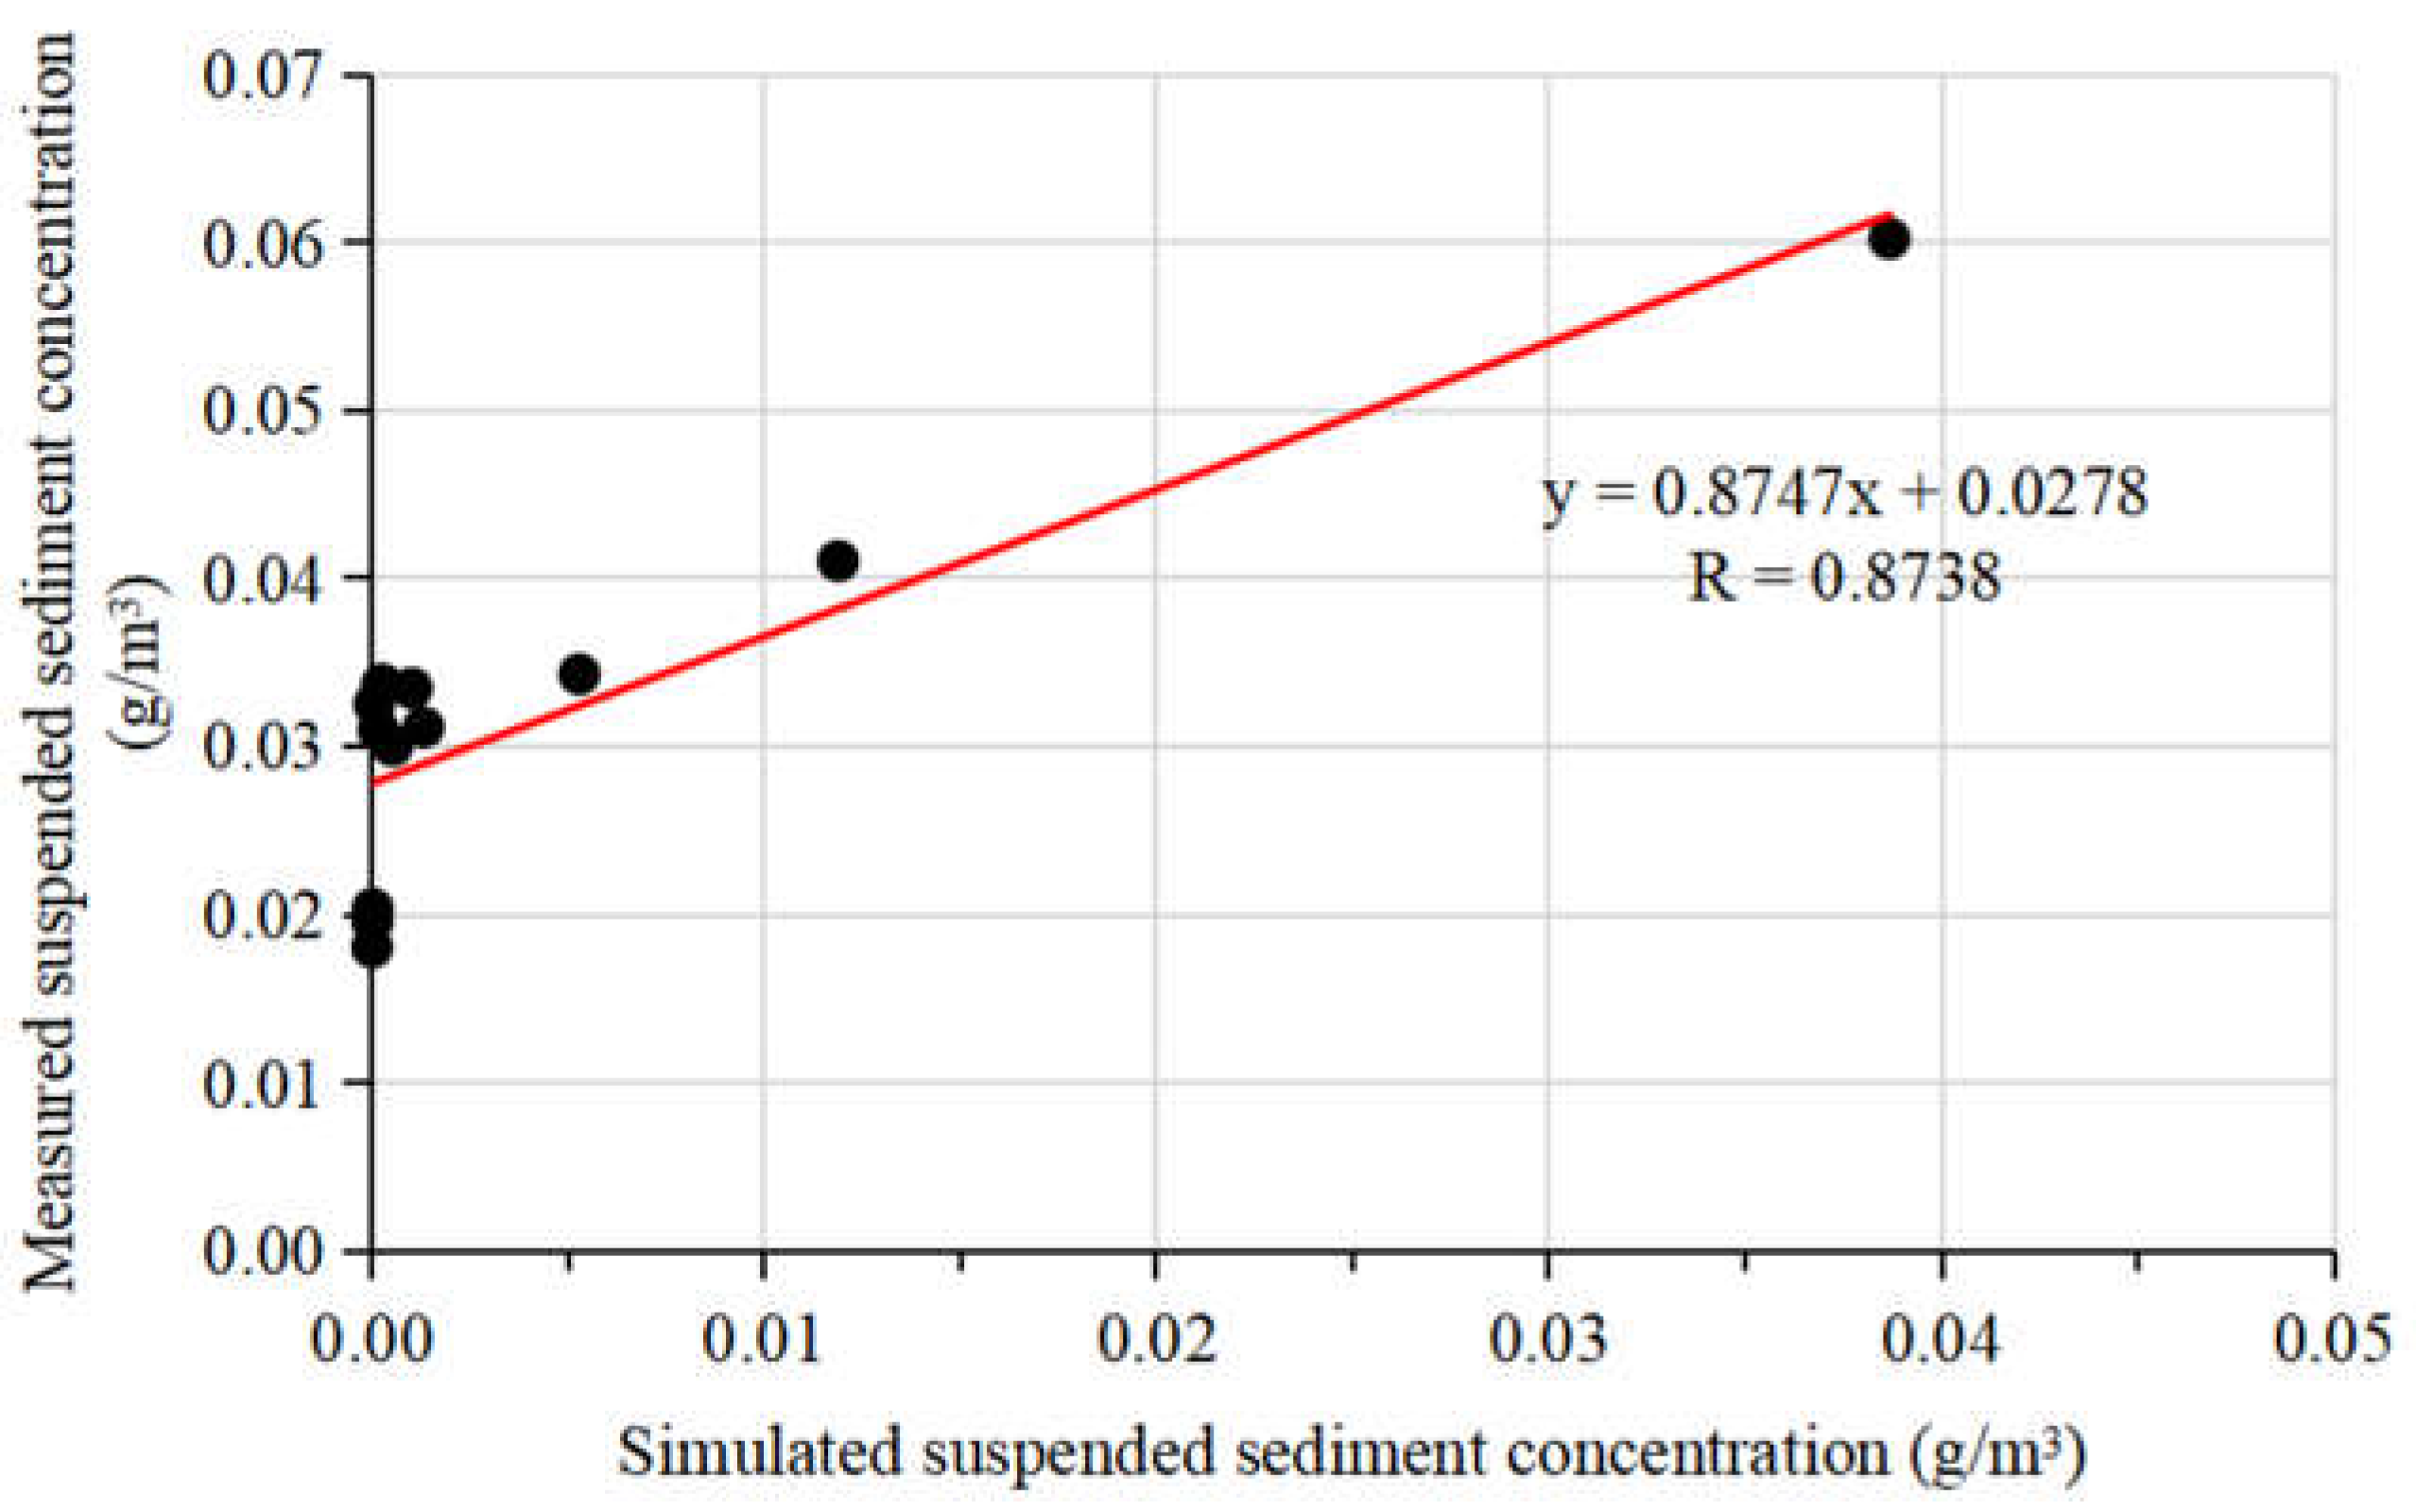
Figure 9.
Correlation between the measured and simulated seabed depths (Pearson's r = 0.78).
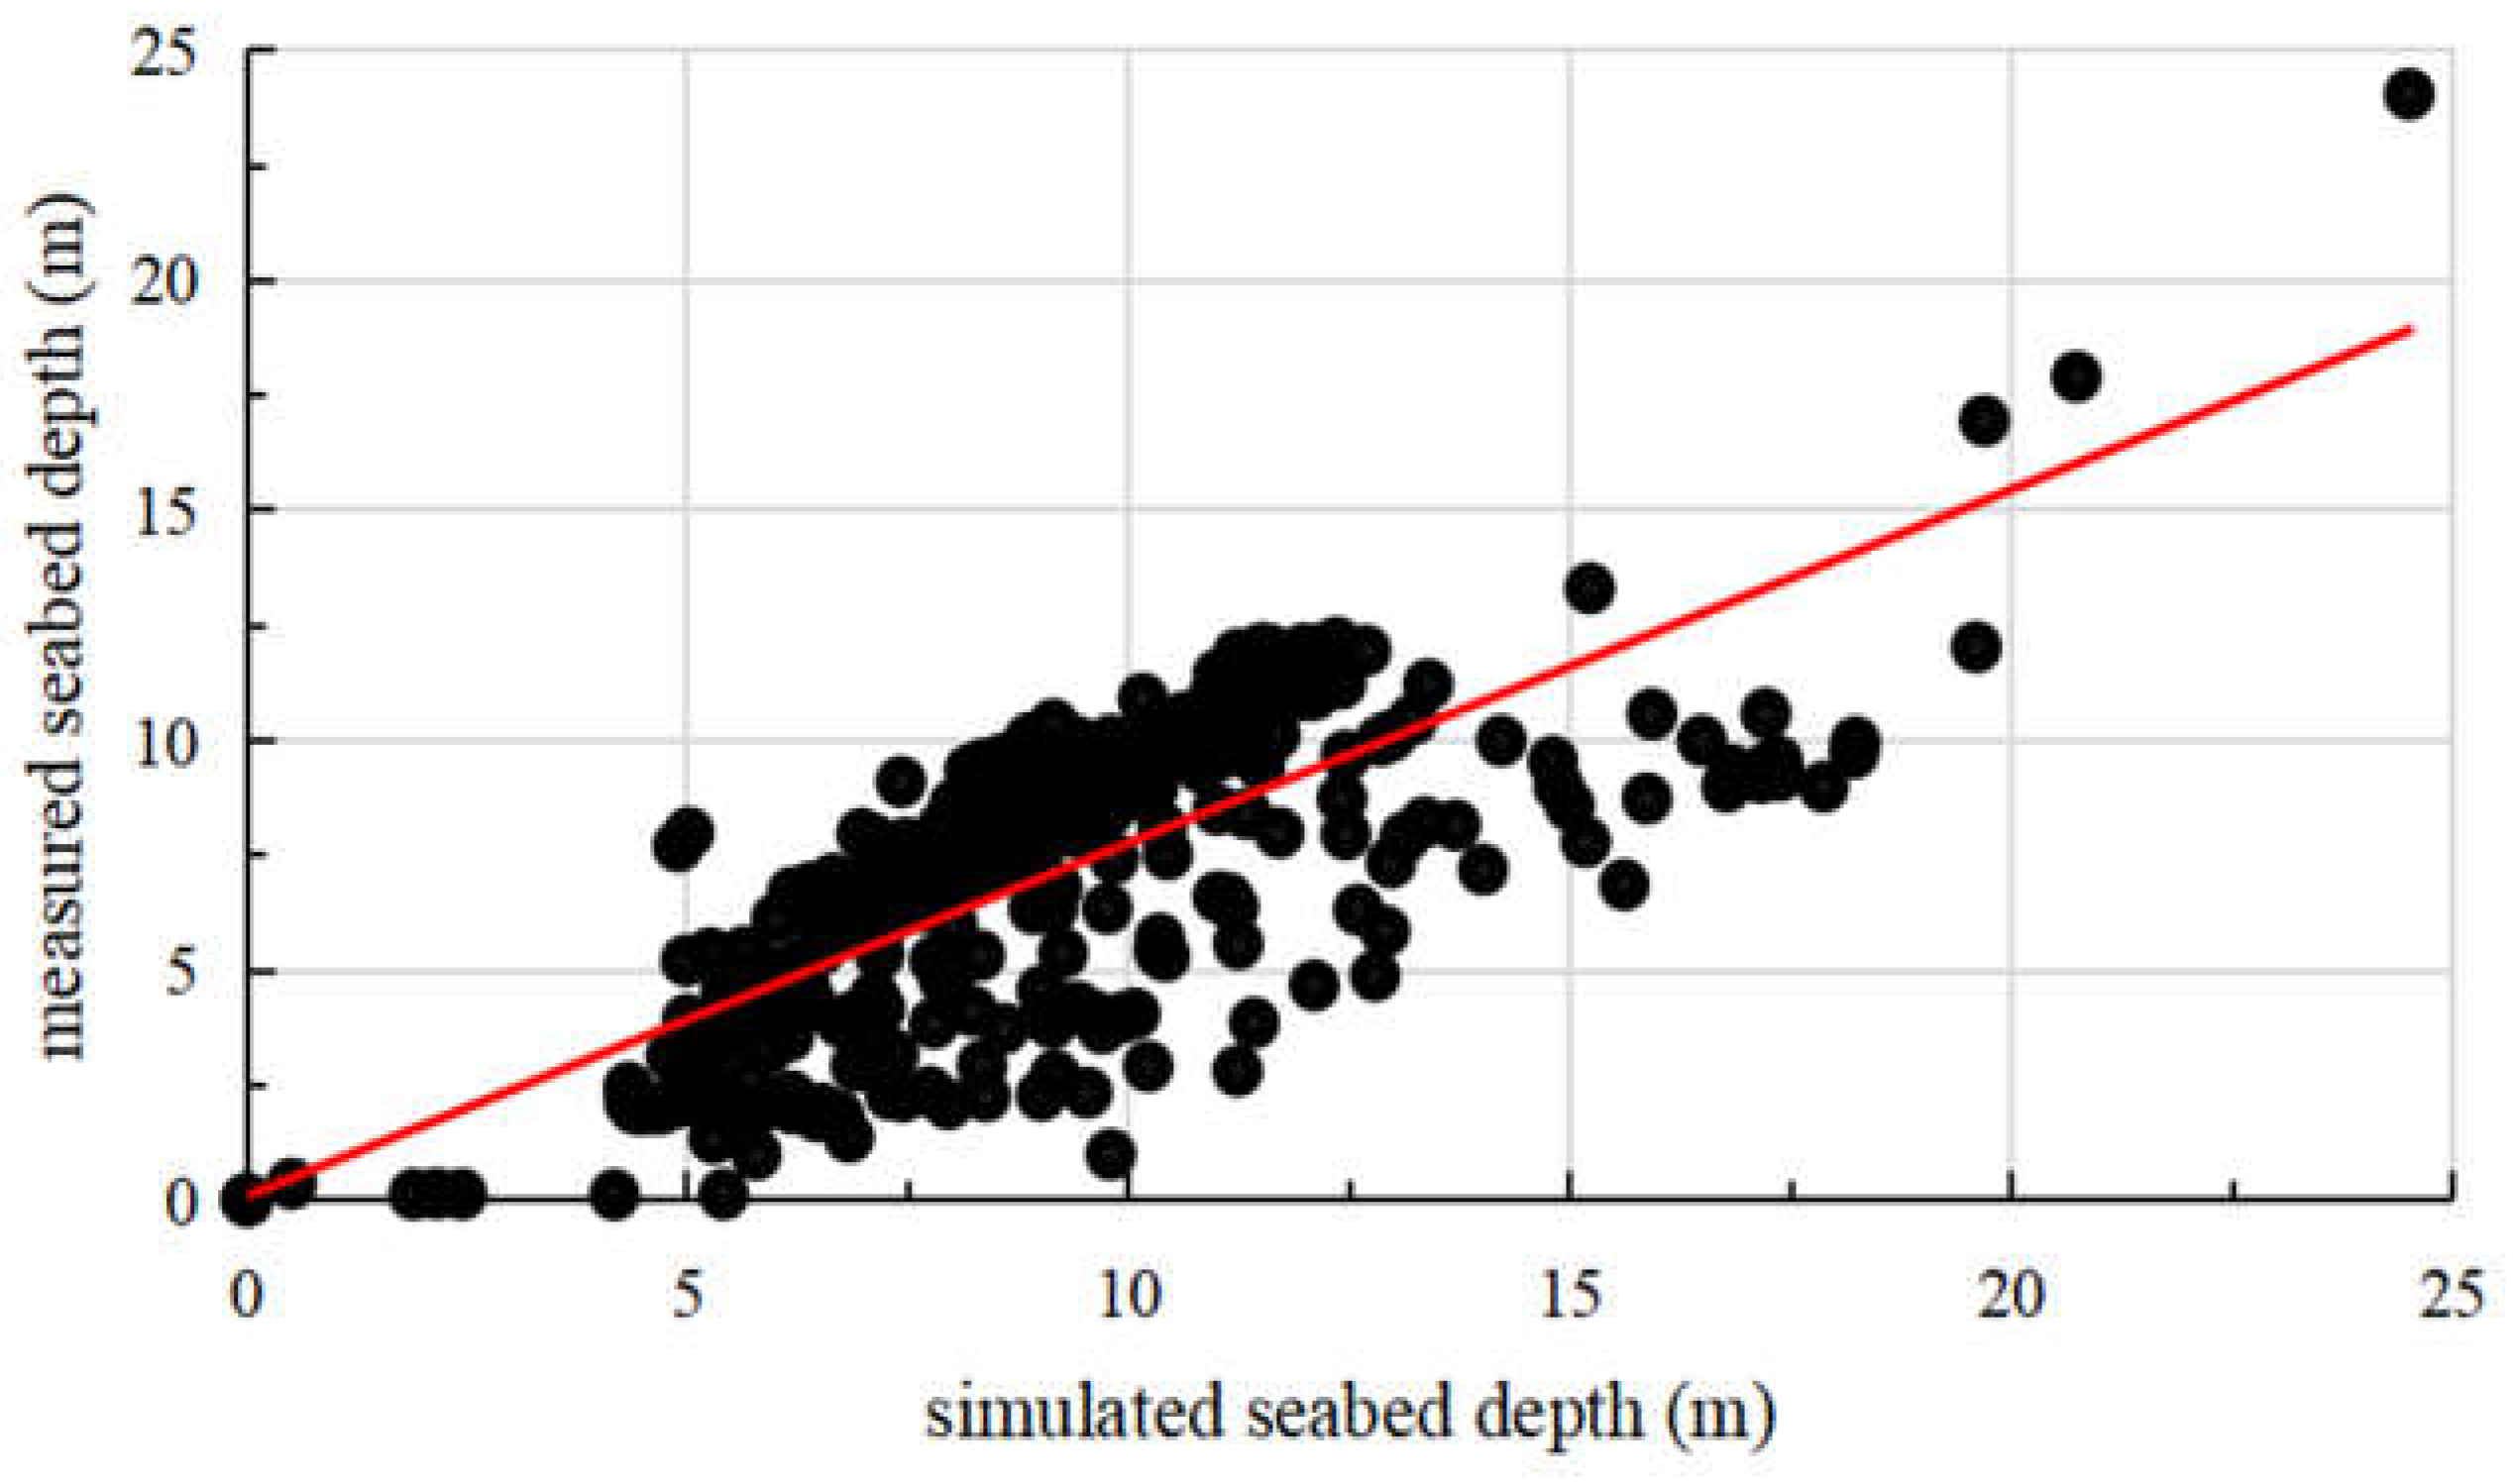
Figure 10.
Spatial distribution of the suspended sediment during the (a) dry season and (b) wet season in 2017 (the dry season is from December to February, and the wet season is from June to August).
Figure 10.
Spatial distribution of the suspended sediment during the (a) dry season and (b) wet season in 2017 (the dry season is from December to February, and the wet season is from June to August).
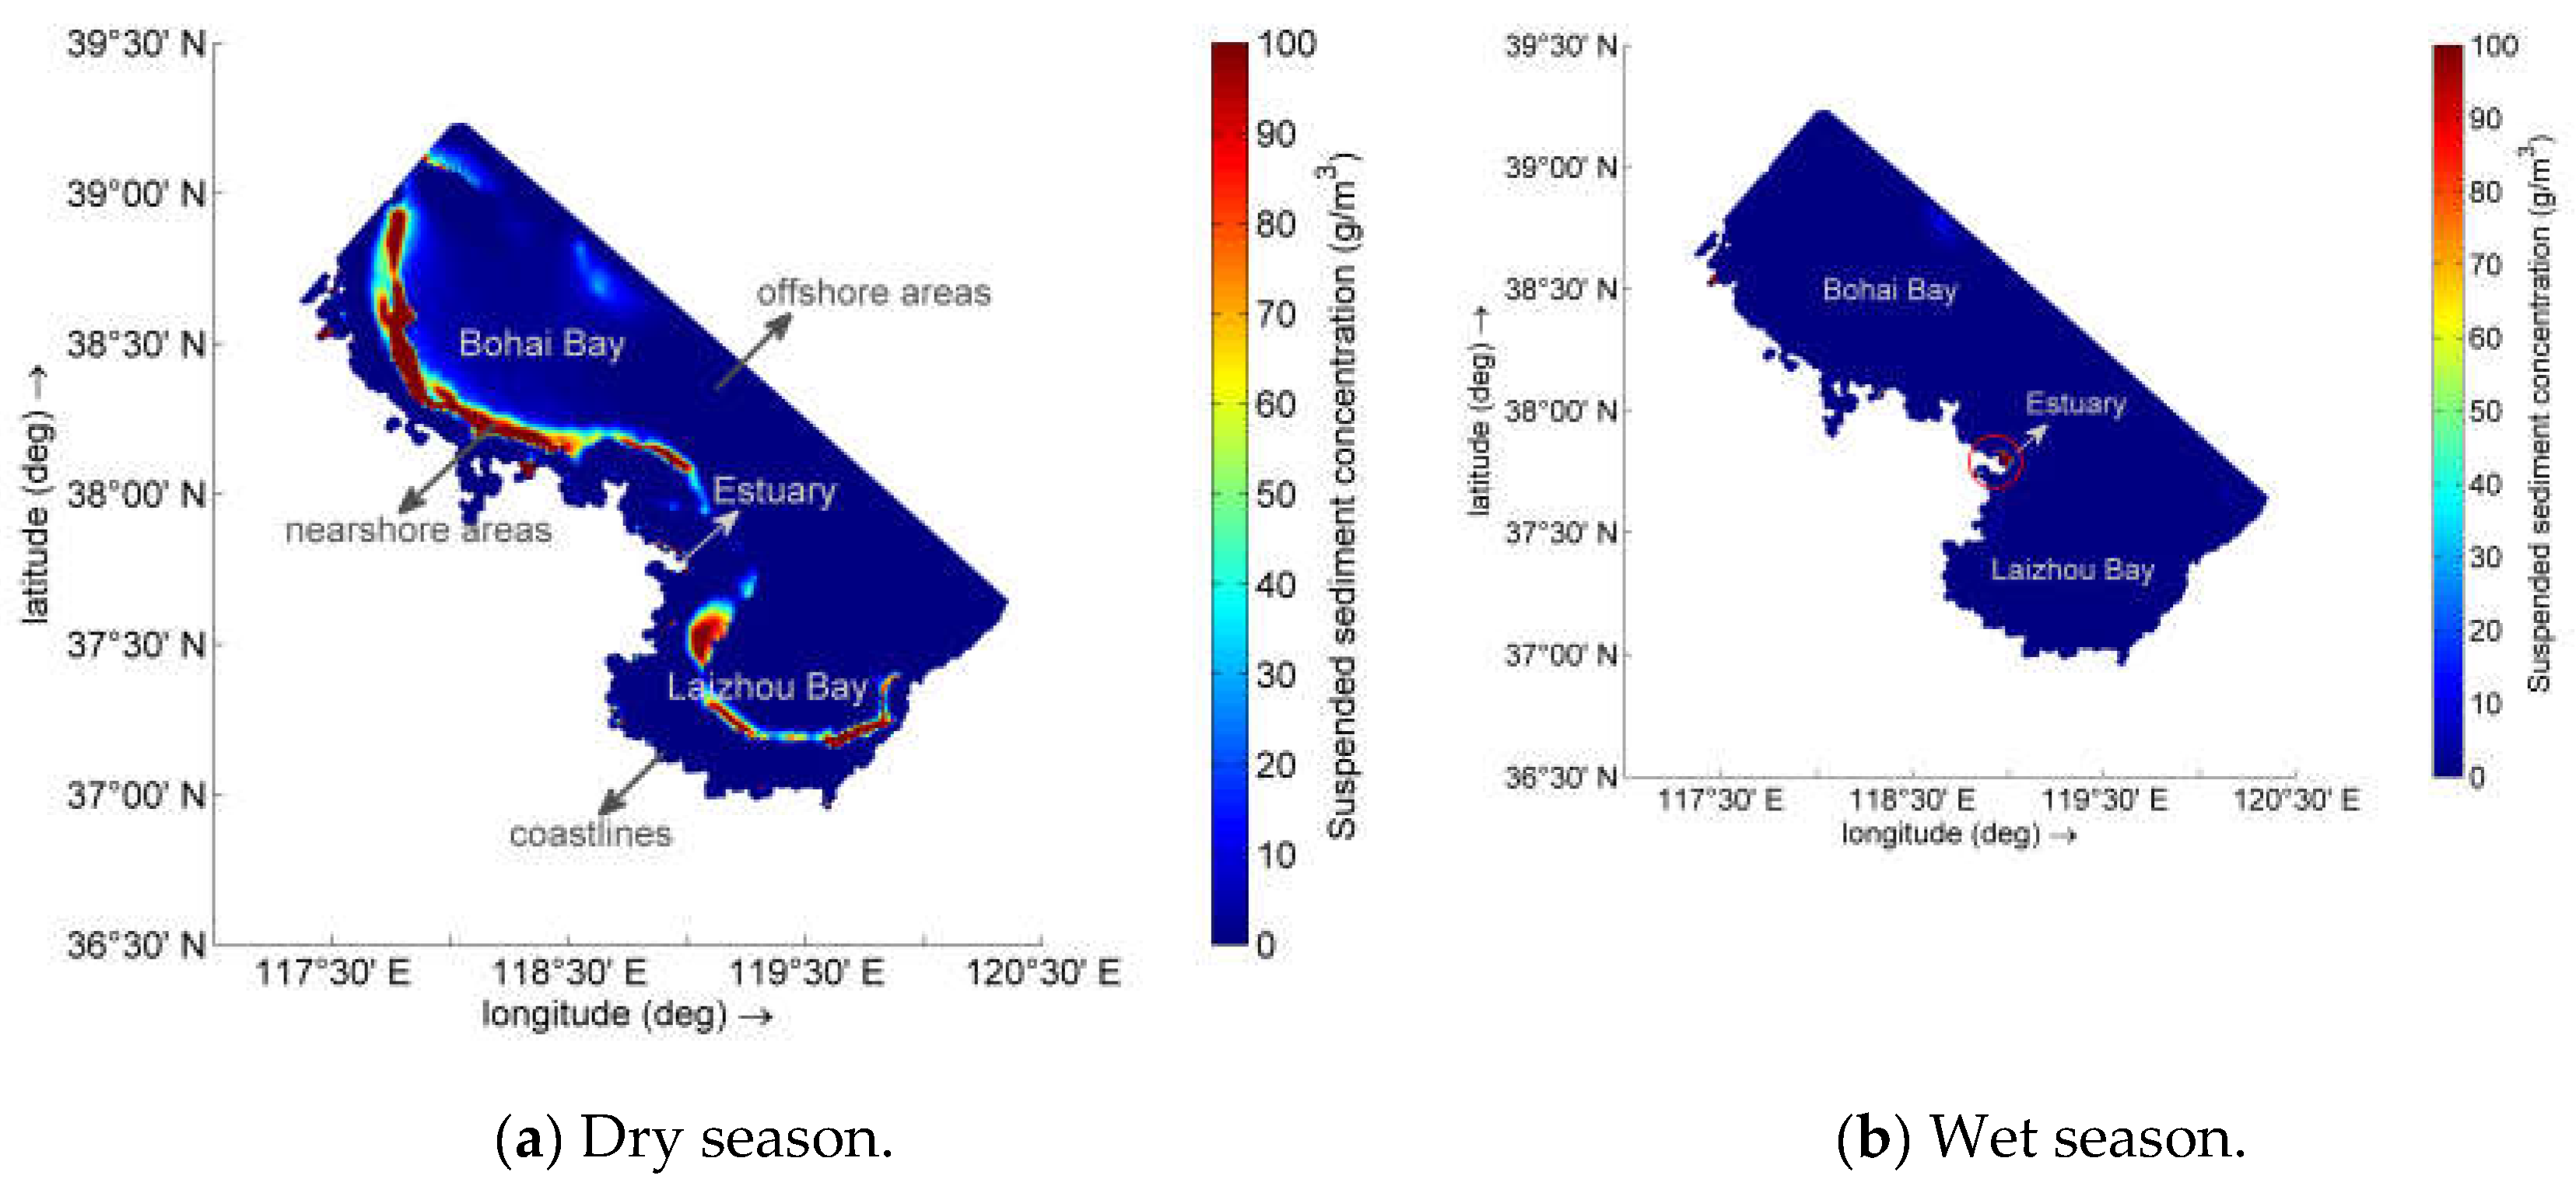
Figure 11.
Location of the representative points. Point A is the point representing the estuary, Point B is the point representing Bohai Bay, and Point C is the point representing Laizhou Bay.
Figure 11.
Location of the representative points. Point A is the point representing the estuary, Point B is the point representing Bohai Bay, and Point C is the point representing Laizhou Bay.
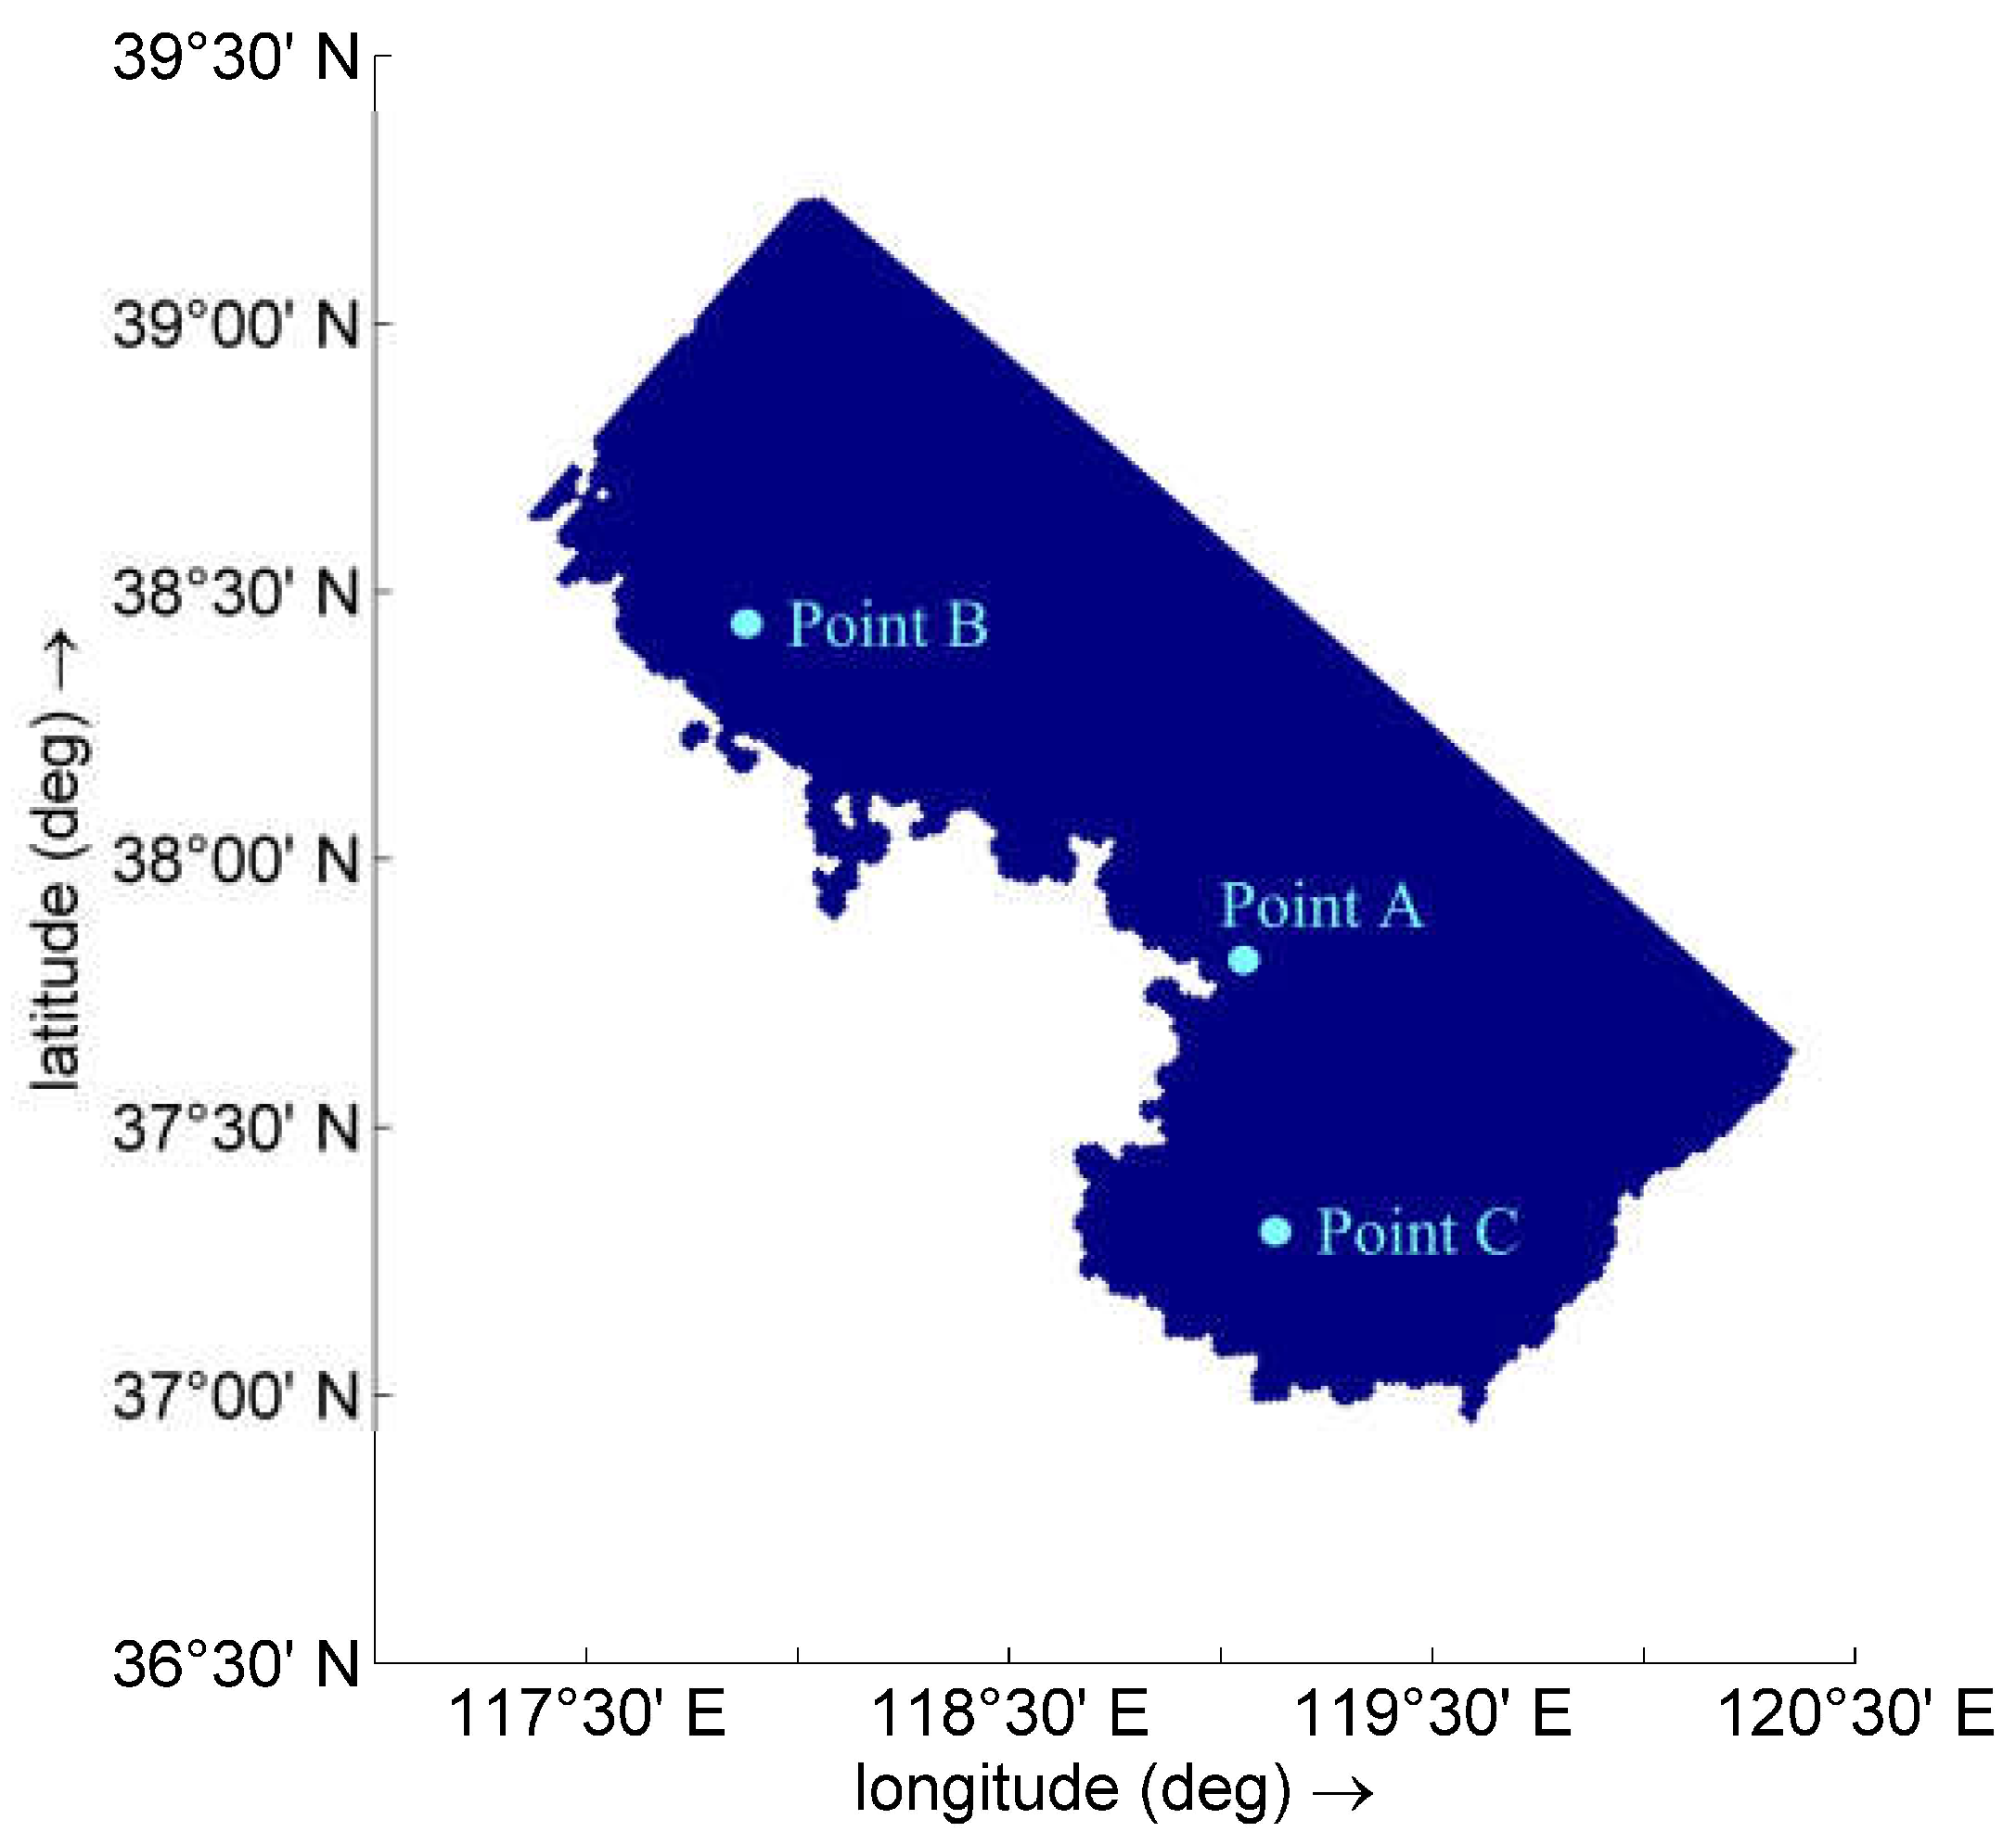
Figure 12.
Changes in the suspended sediment concentration at the representative points in the (a) estuary, (b) Bohai Bay, and (c) Laizhou Bay.
Figure 12.
Changes in the suspended sediment concentration at the representative points in the (a) estuary, (b) Bohai Bay, and (c) Laizhou Bay.
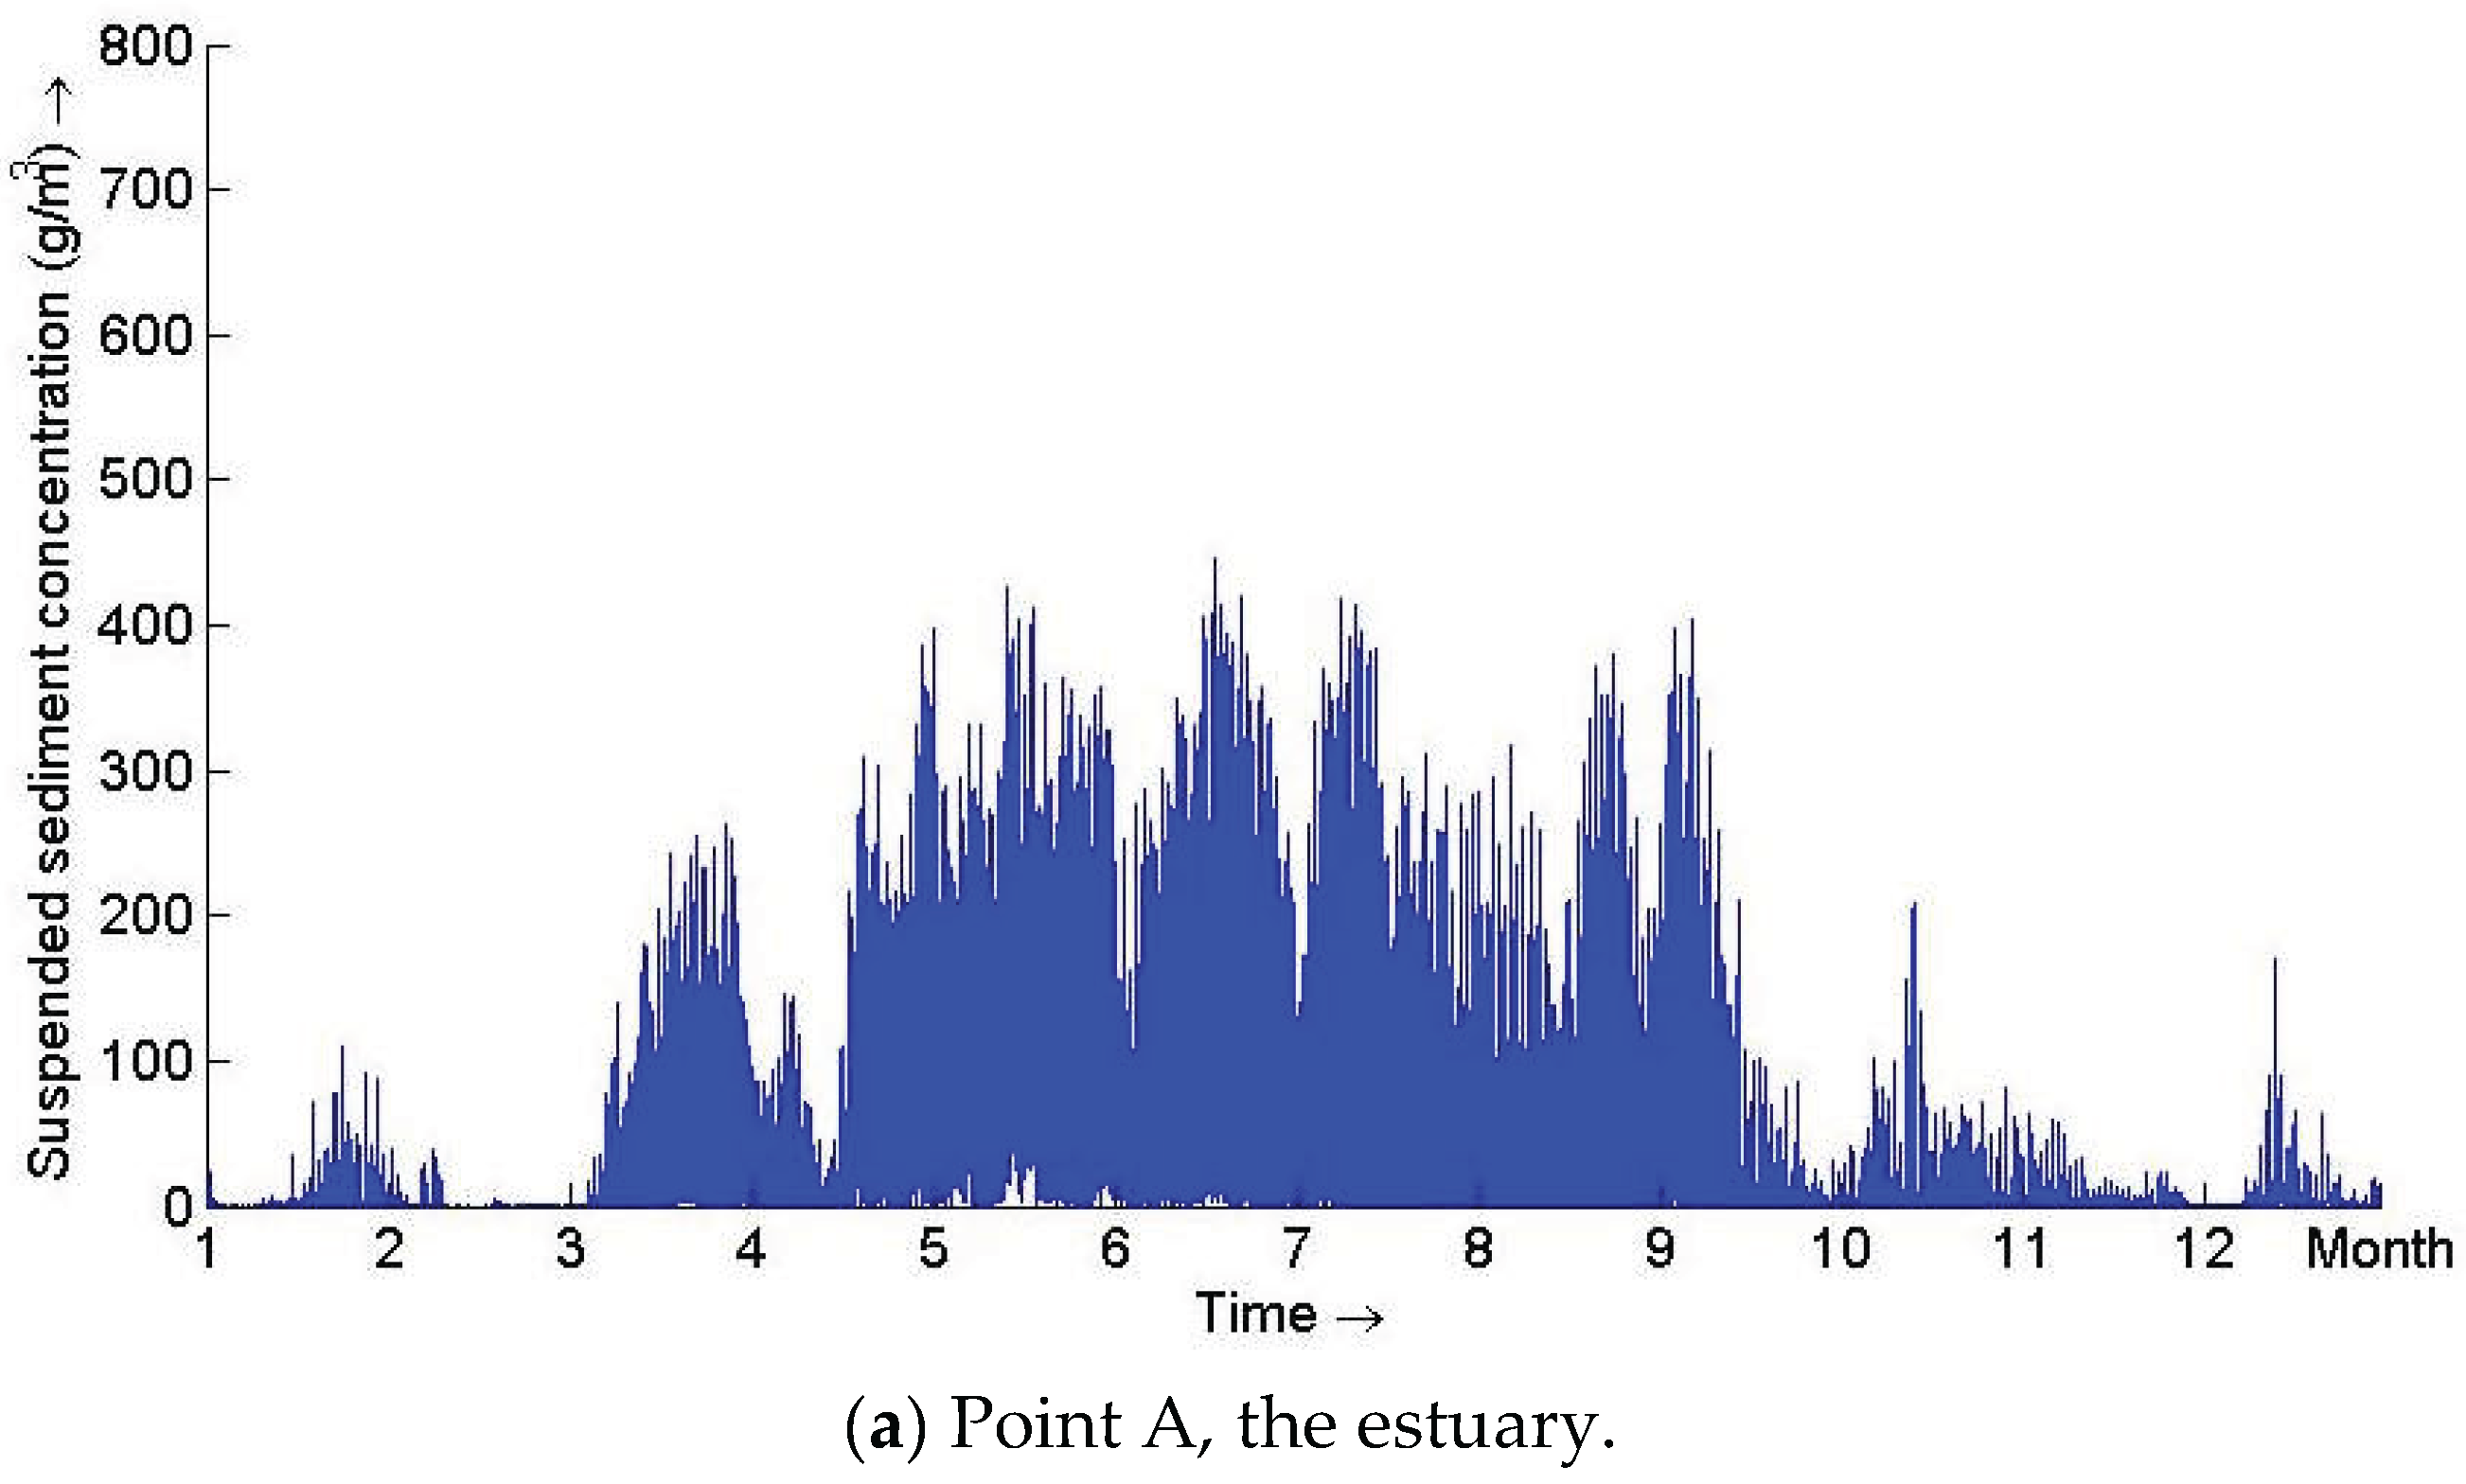
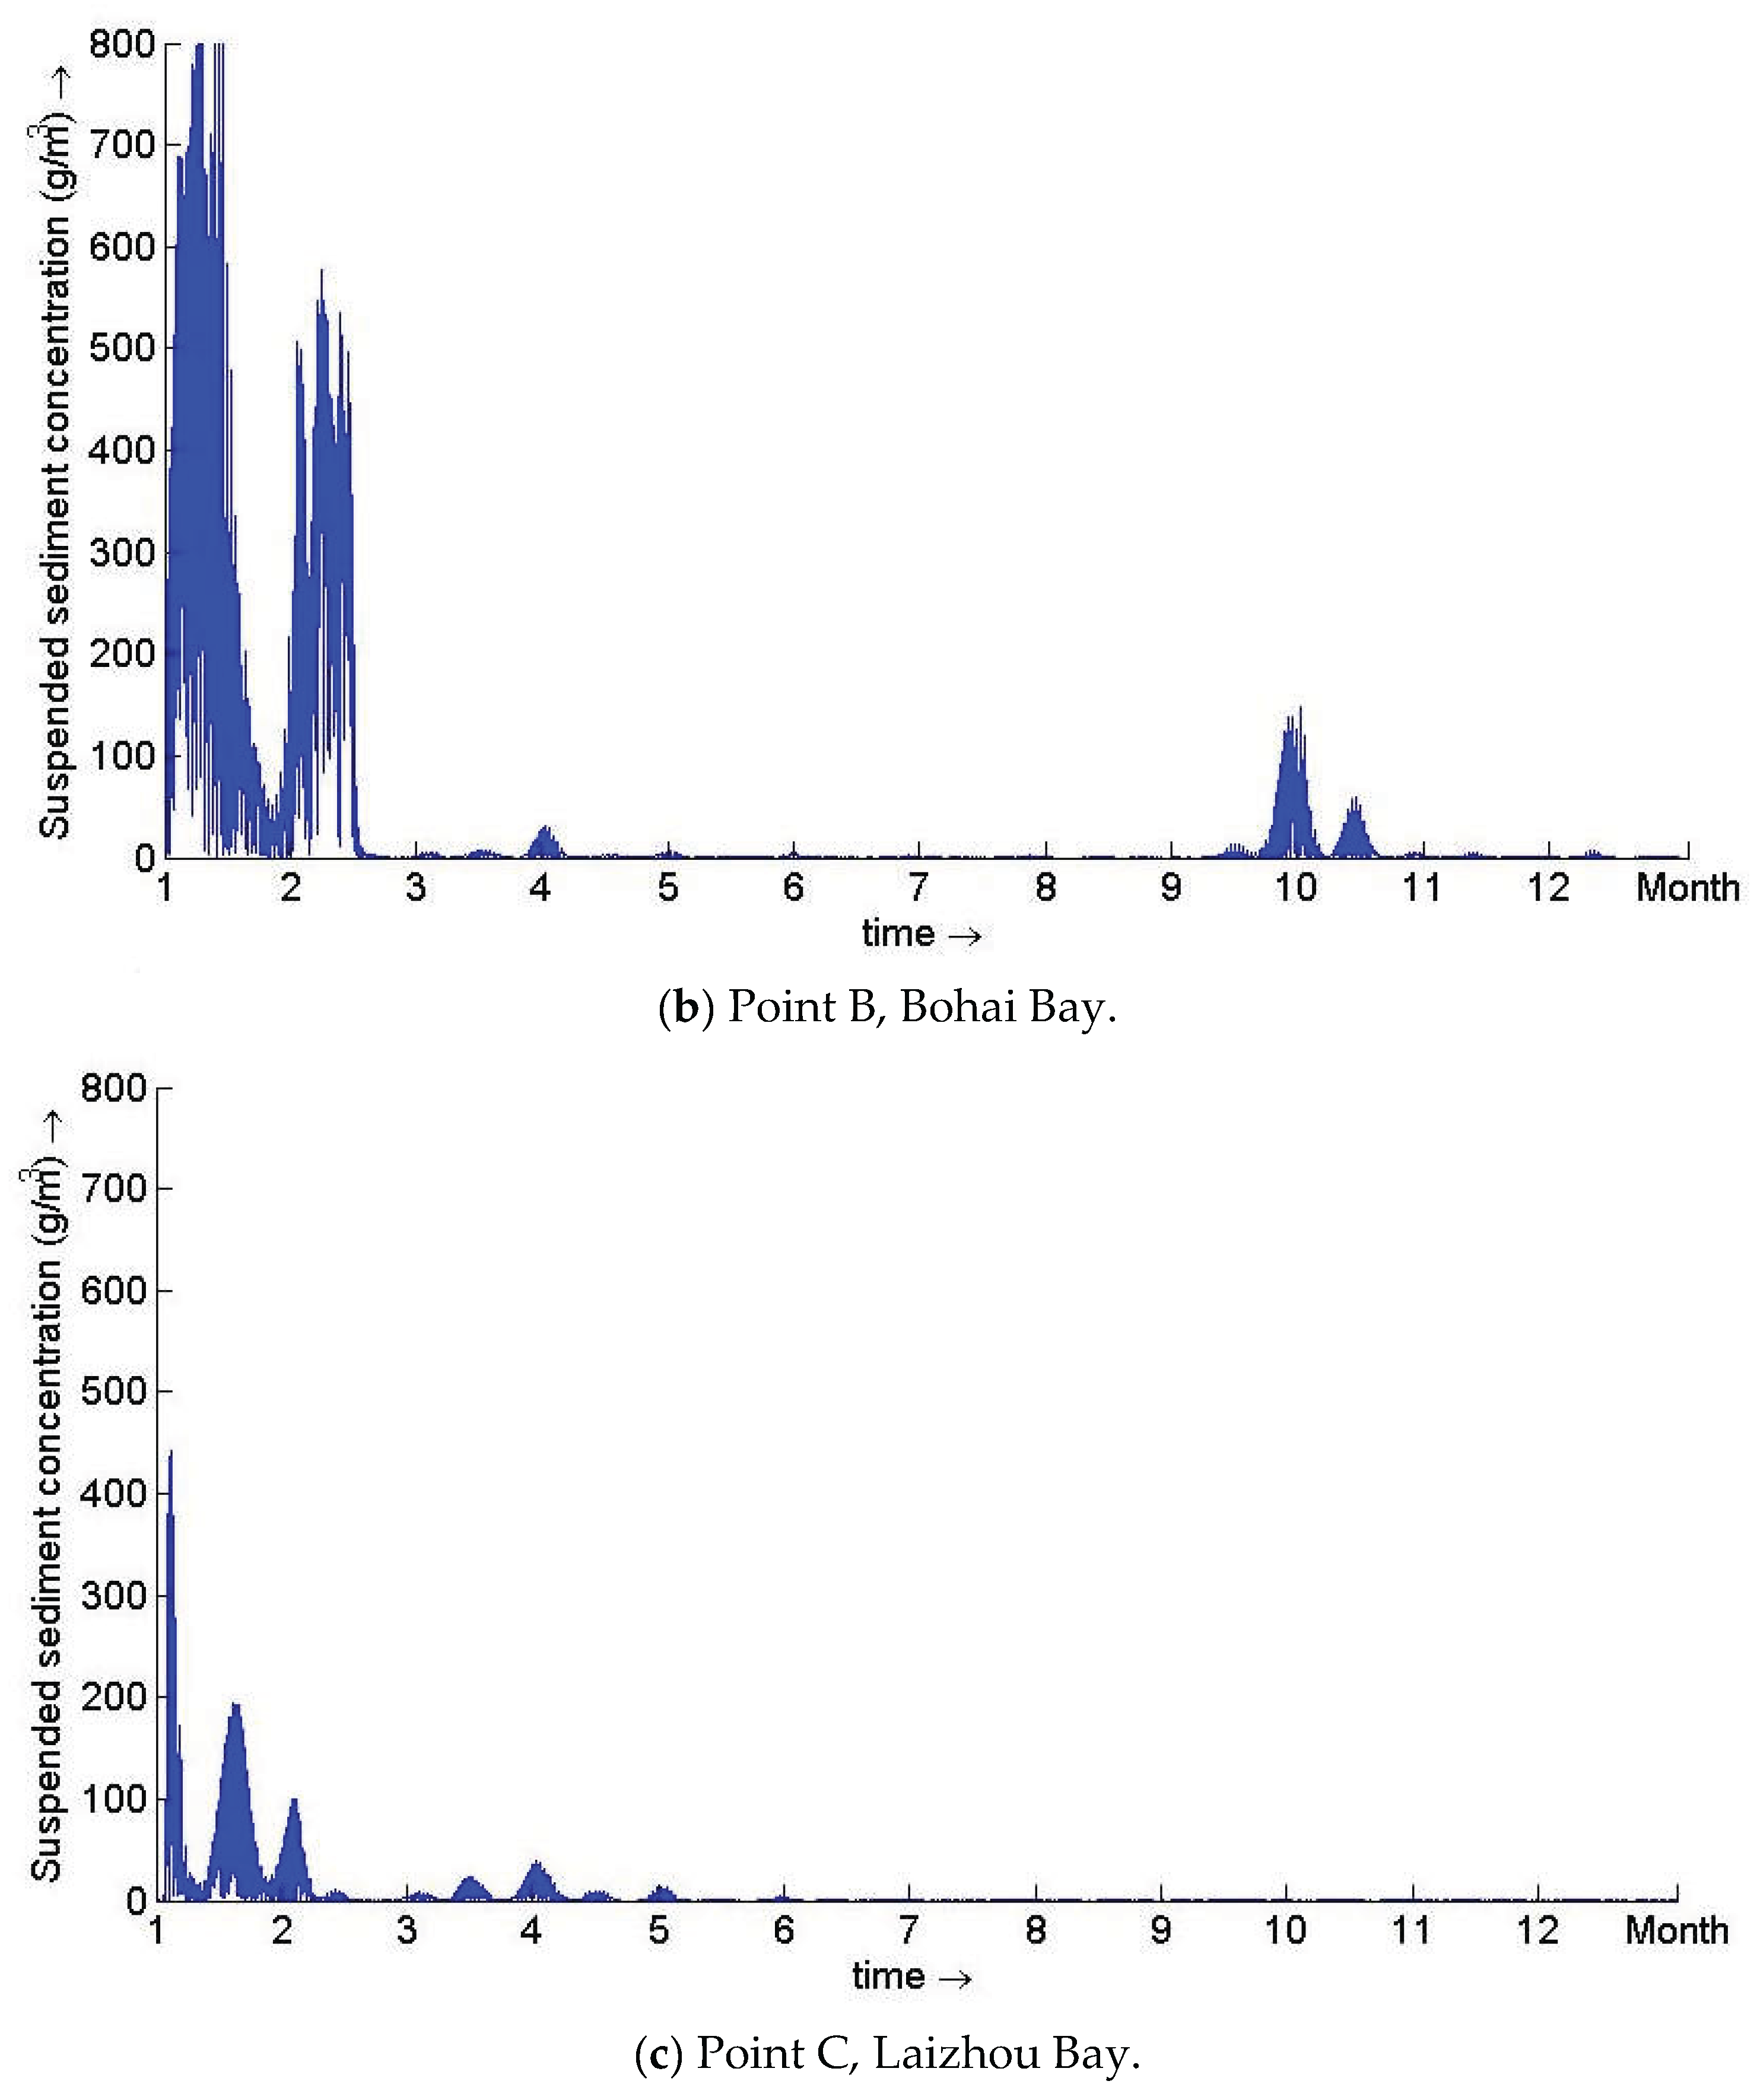
Figure 13.
Water depth distribution of the Yellow River subaqueous delta in the (a) initial state, (b) dry season and (c) wet season in 2017.
Figure 13.
Water depth distribution of the Yellow River subaqueous delta in the (a) initial state, (b) dry season and (c) wet season in 2017.
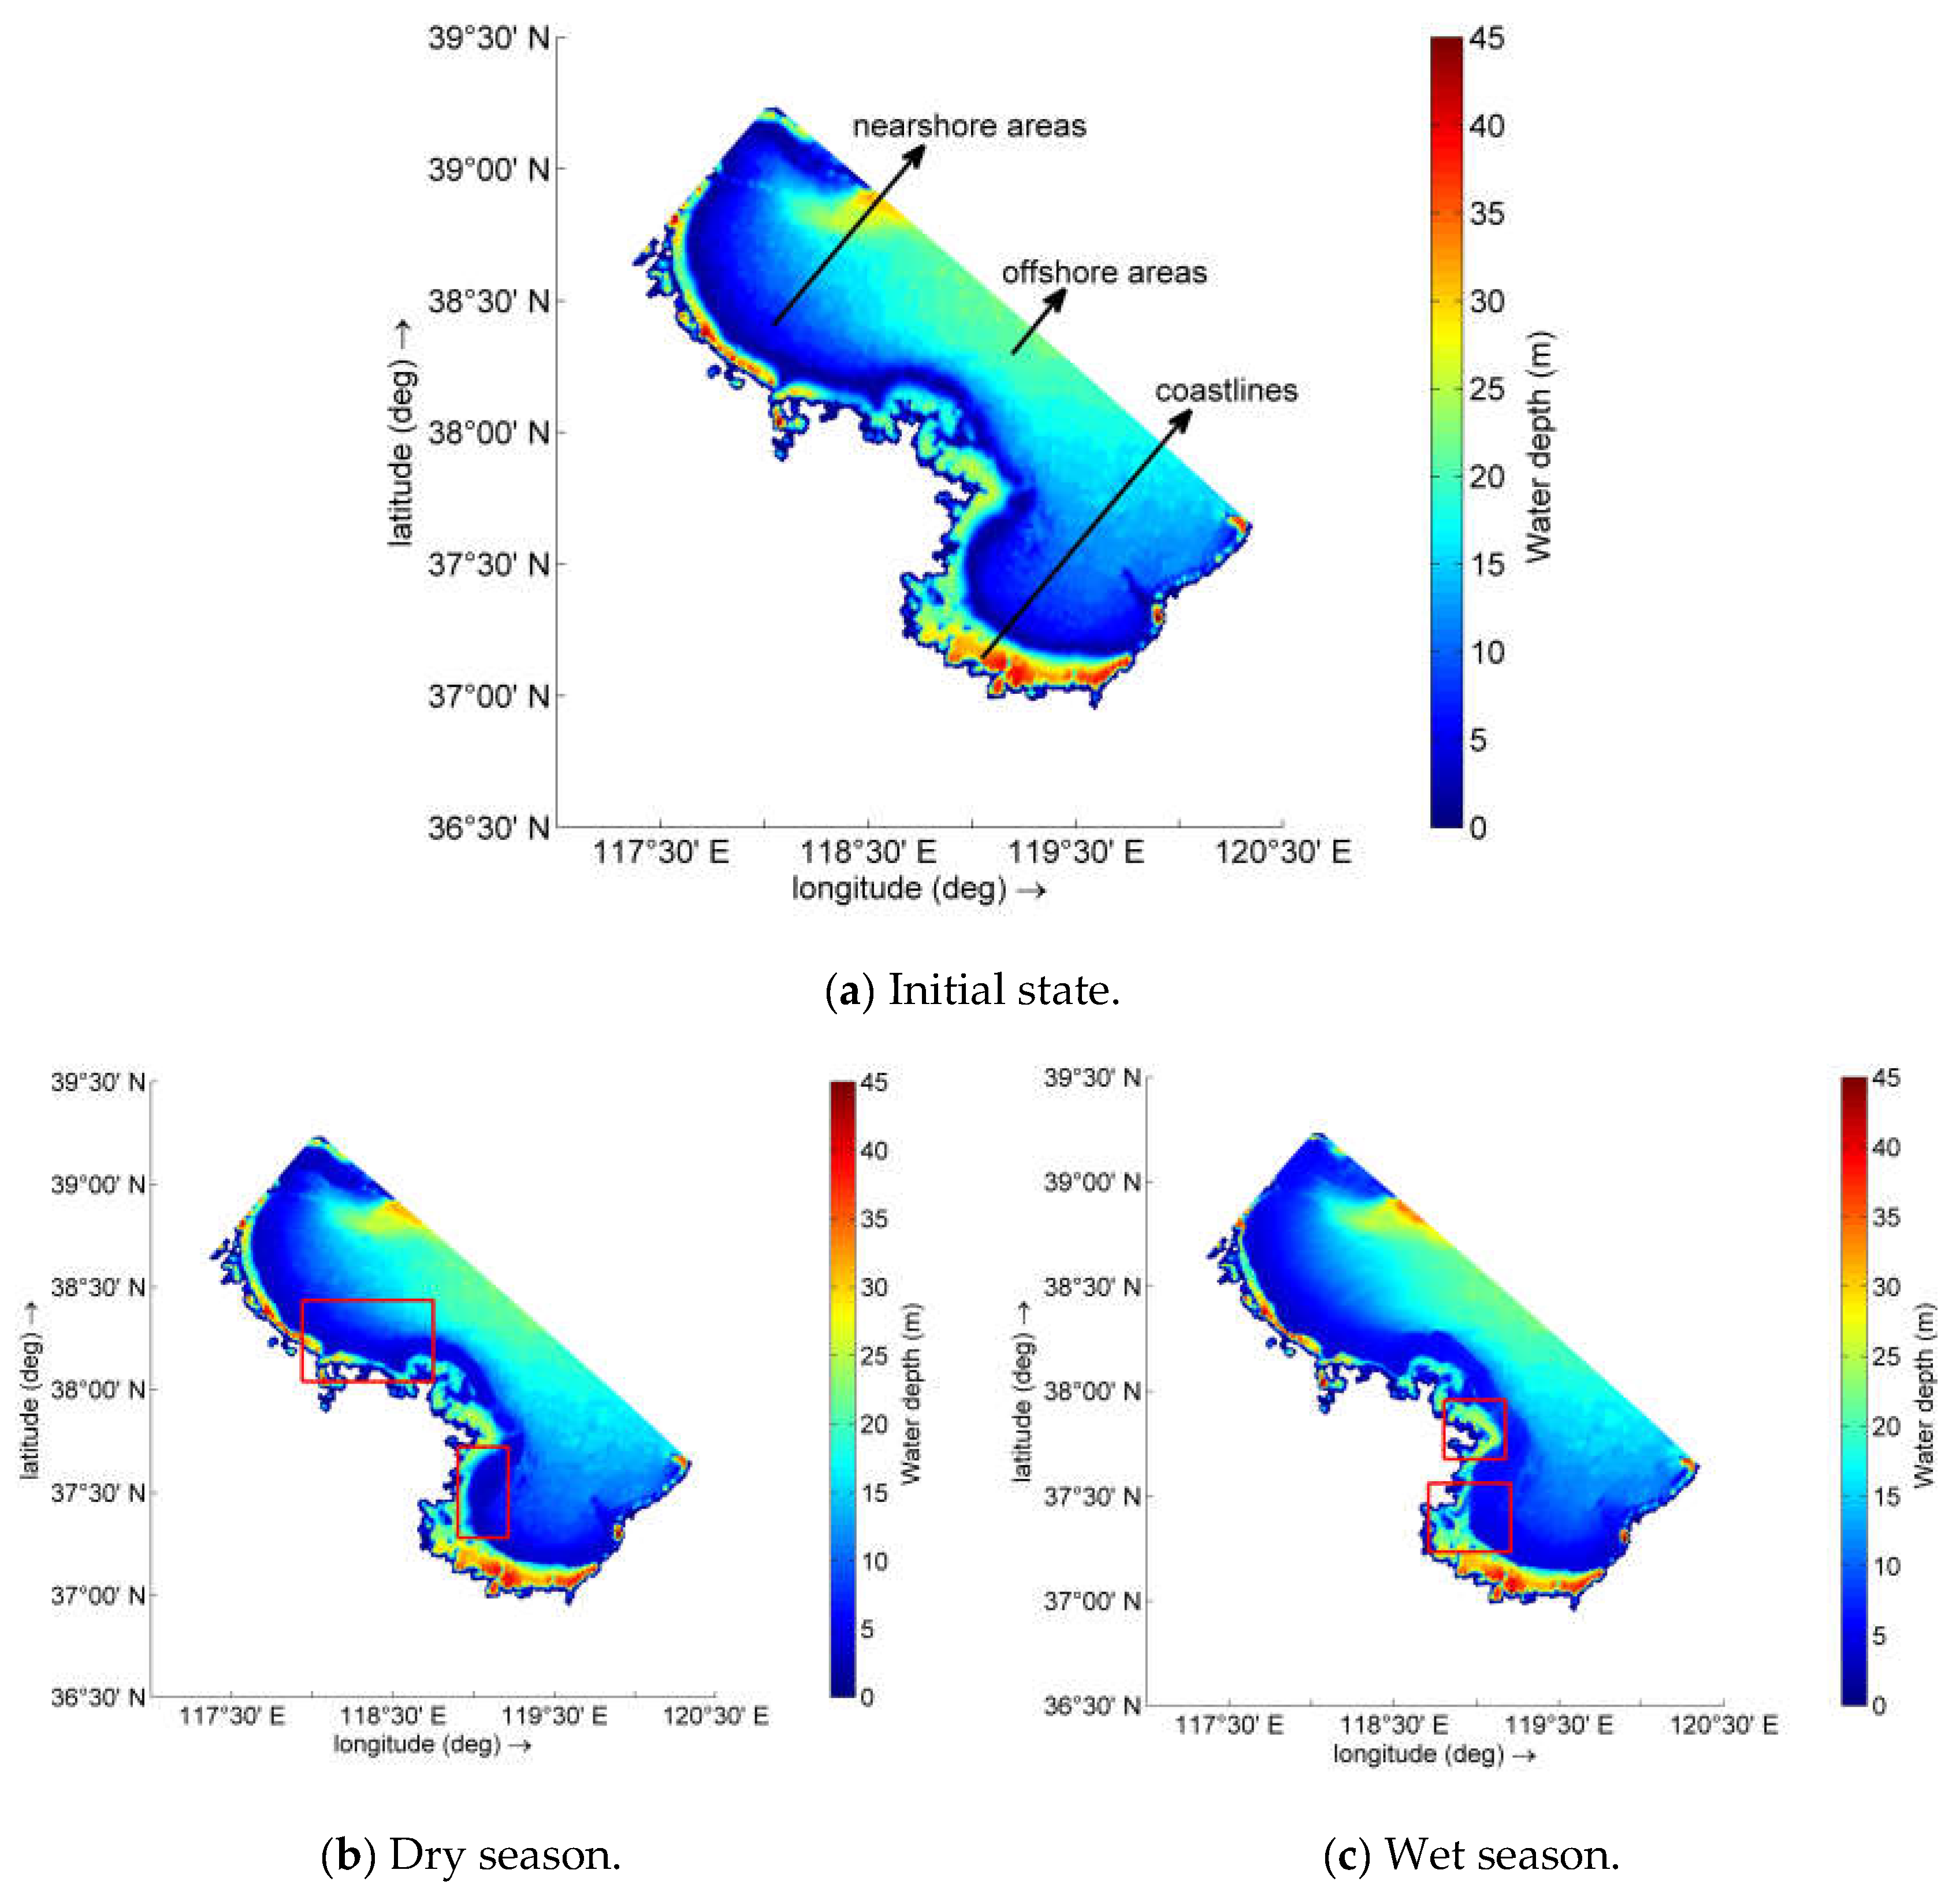
Figure 14.
The Erosion/deposition distribution of the Yellow River subaqueous delta in the (a) dry season and (b) wet season in 2017.
Figure 14.
The Erosion/deposition distribution of the Yellow River subaqueous delta in the (a) dry season and (b) wet season in 2017.
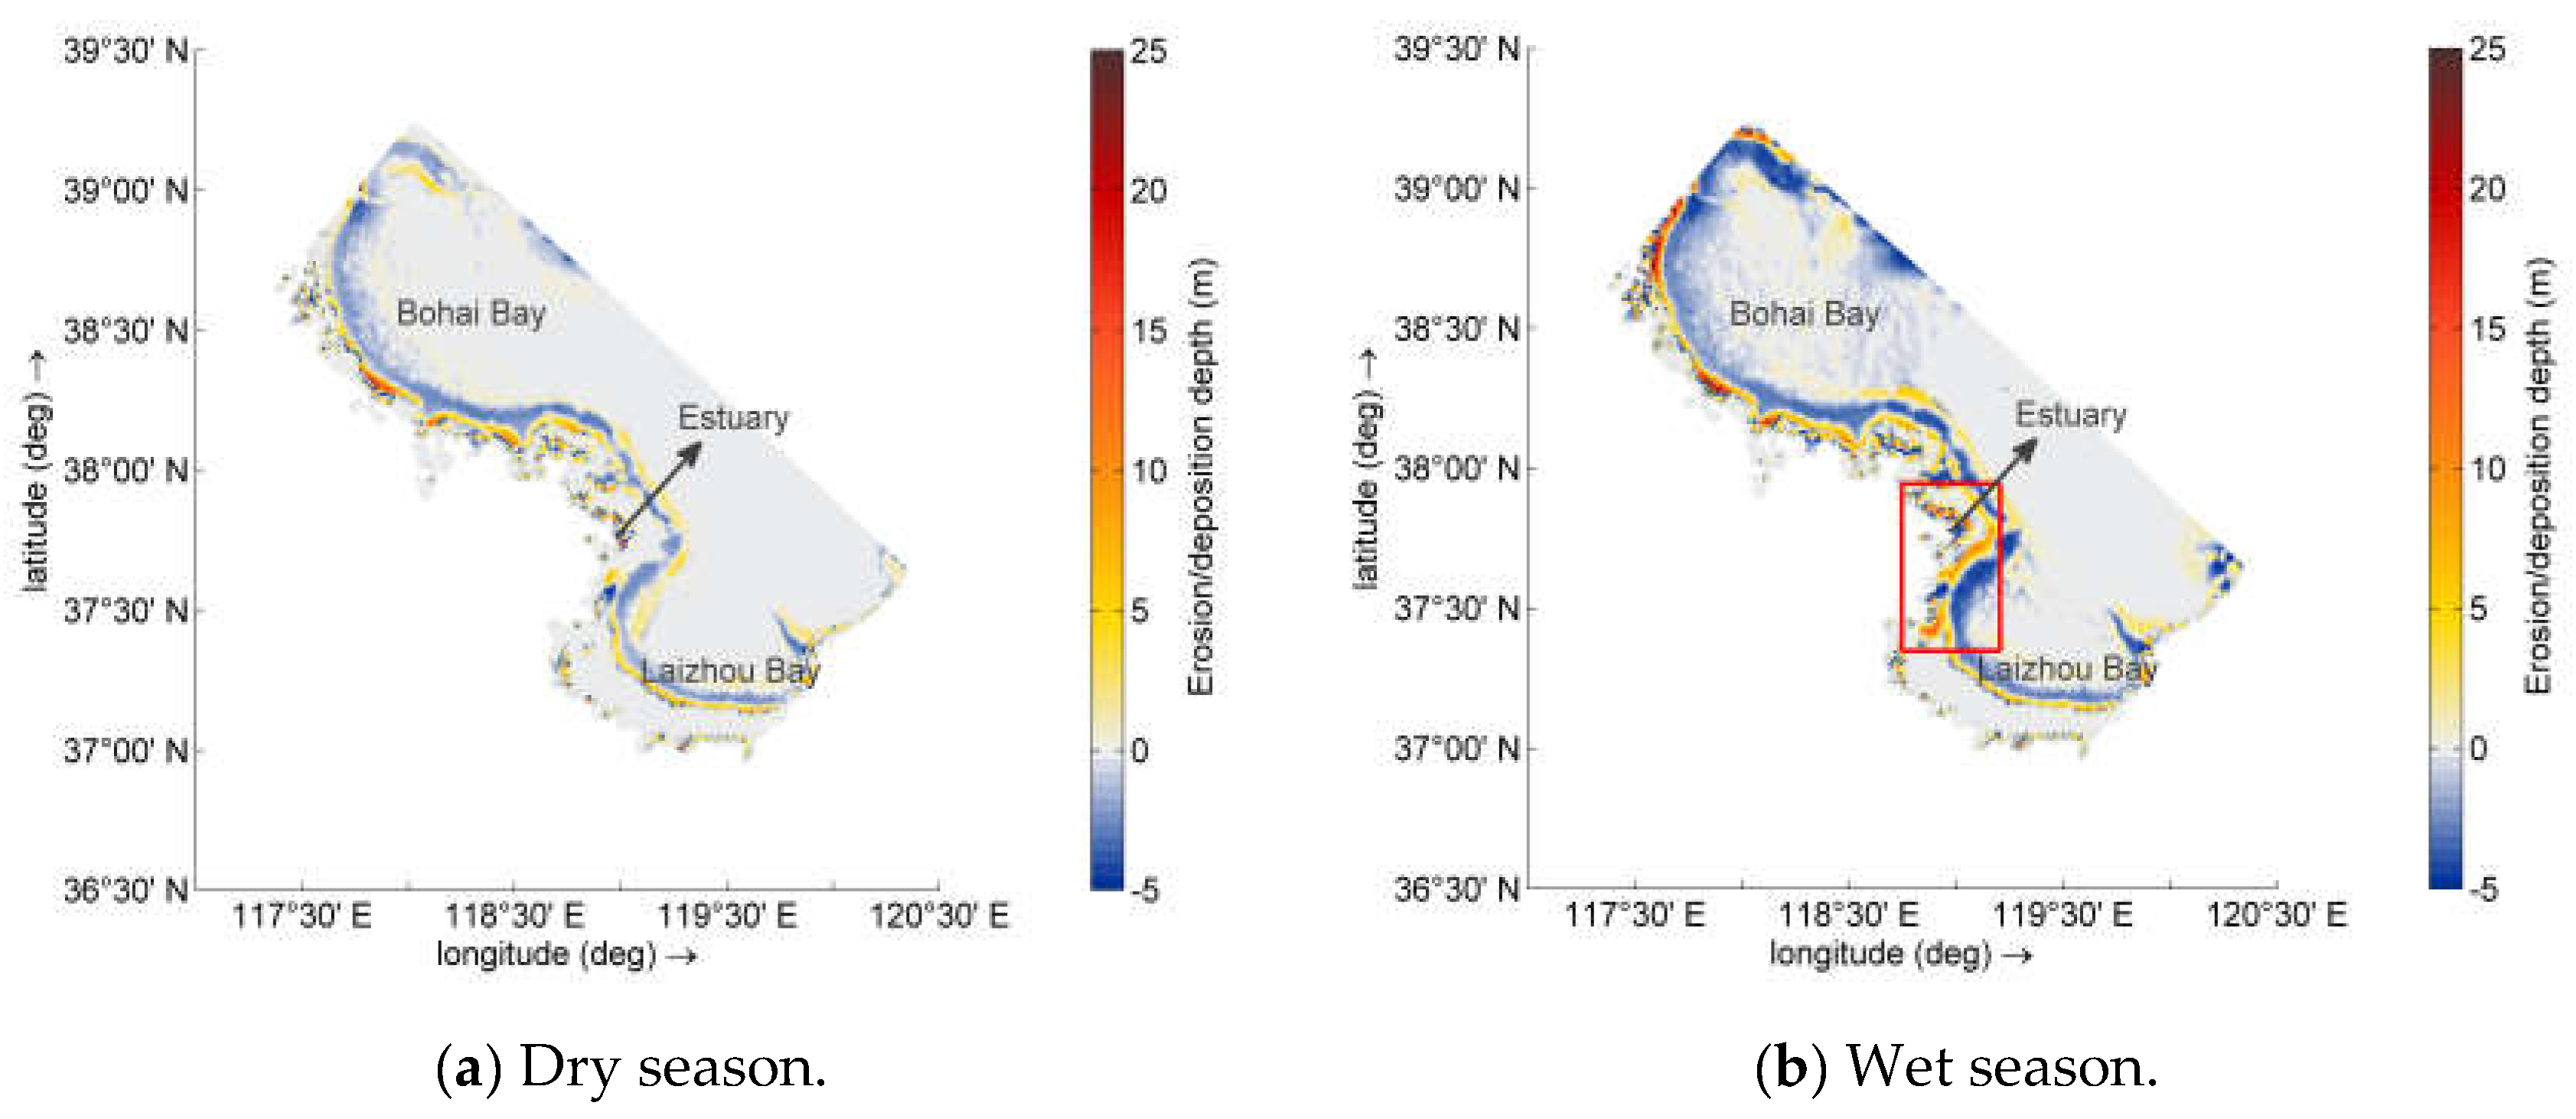
Figure 15.
Changes in the water discharge, sediment discharge, and deposition volume.
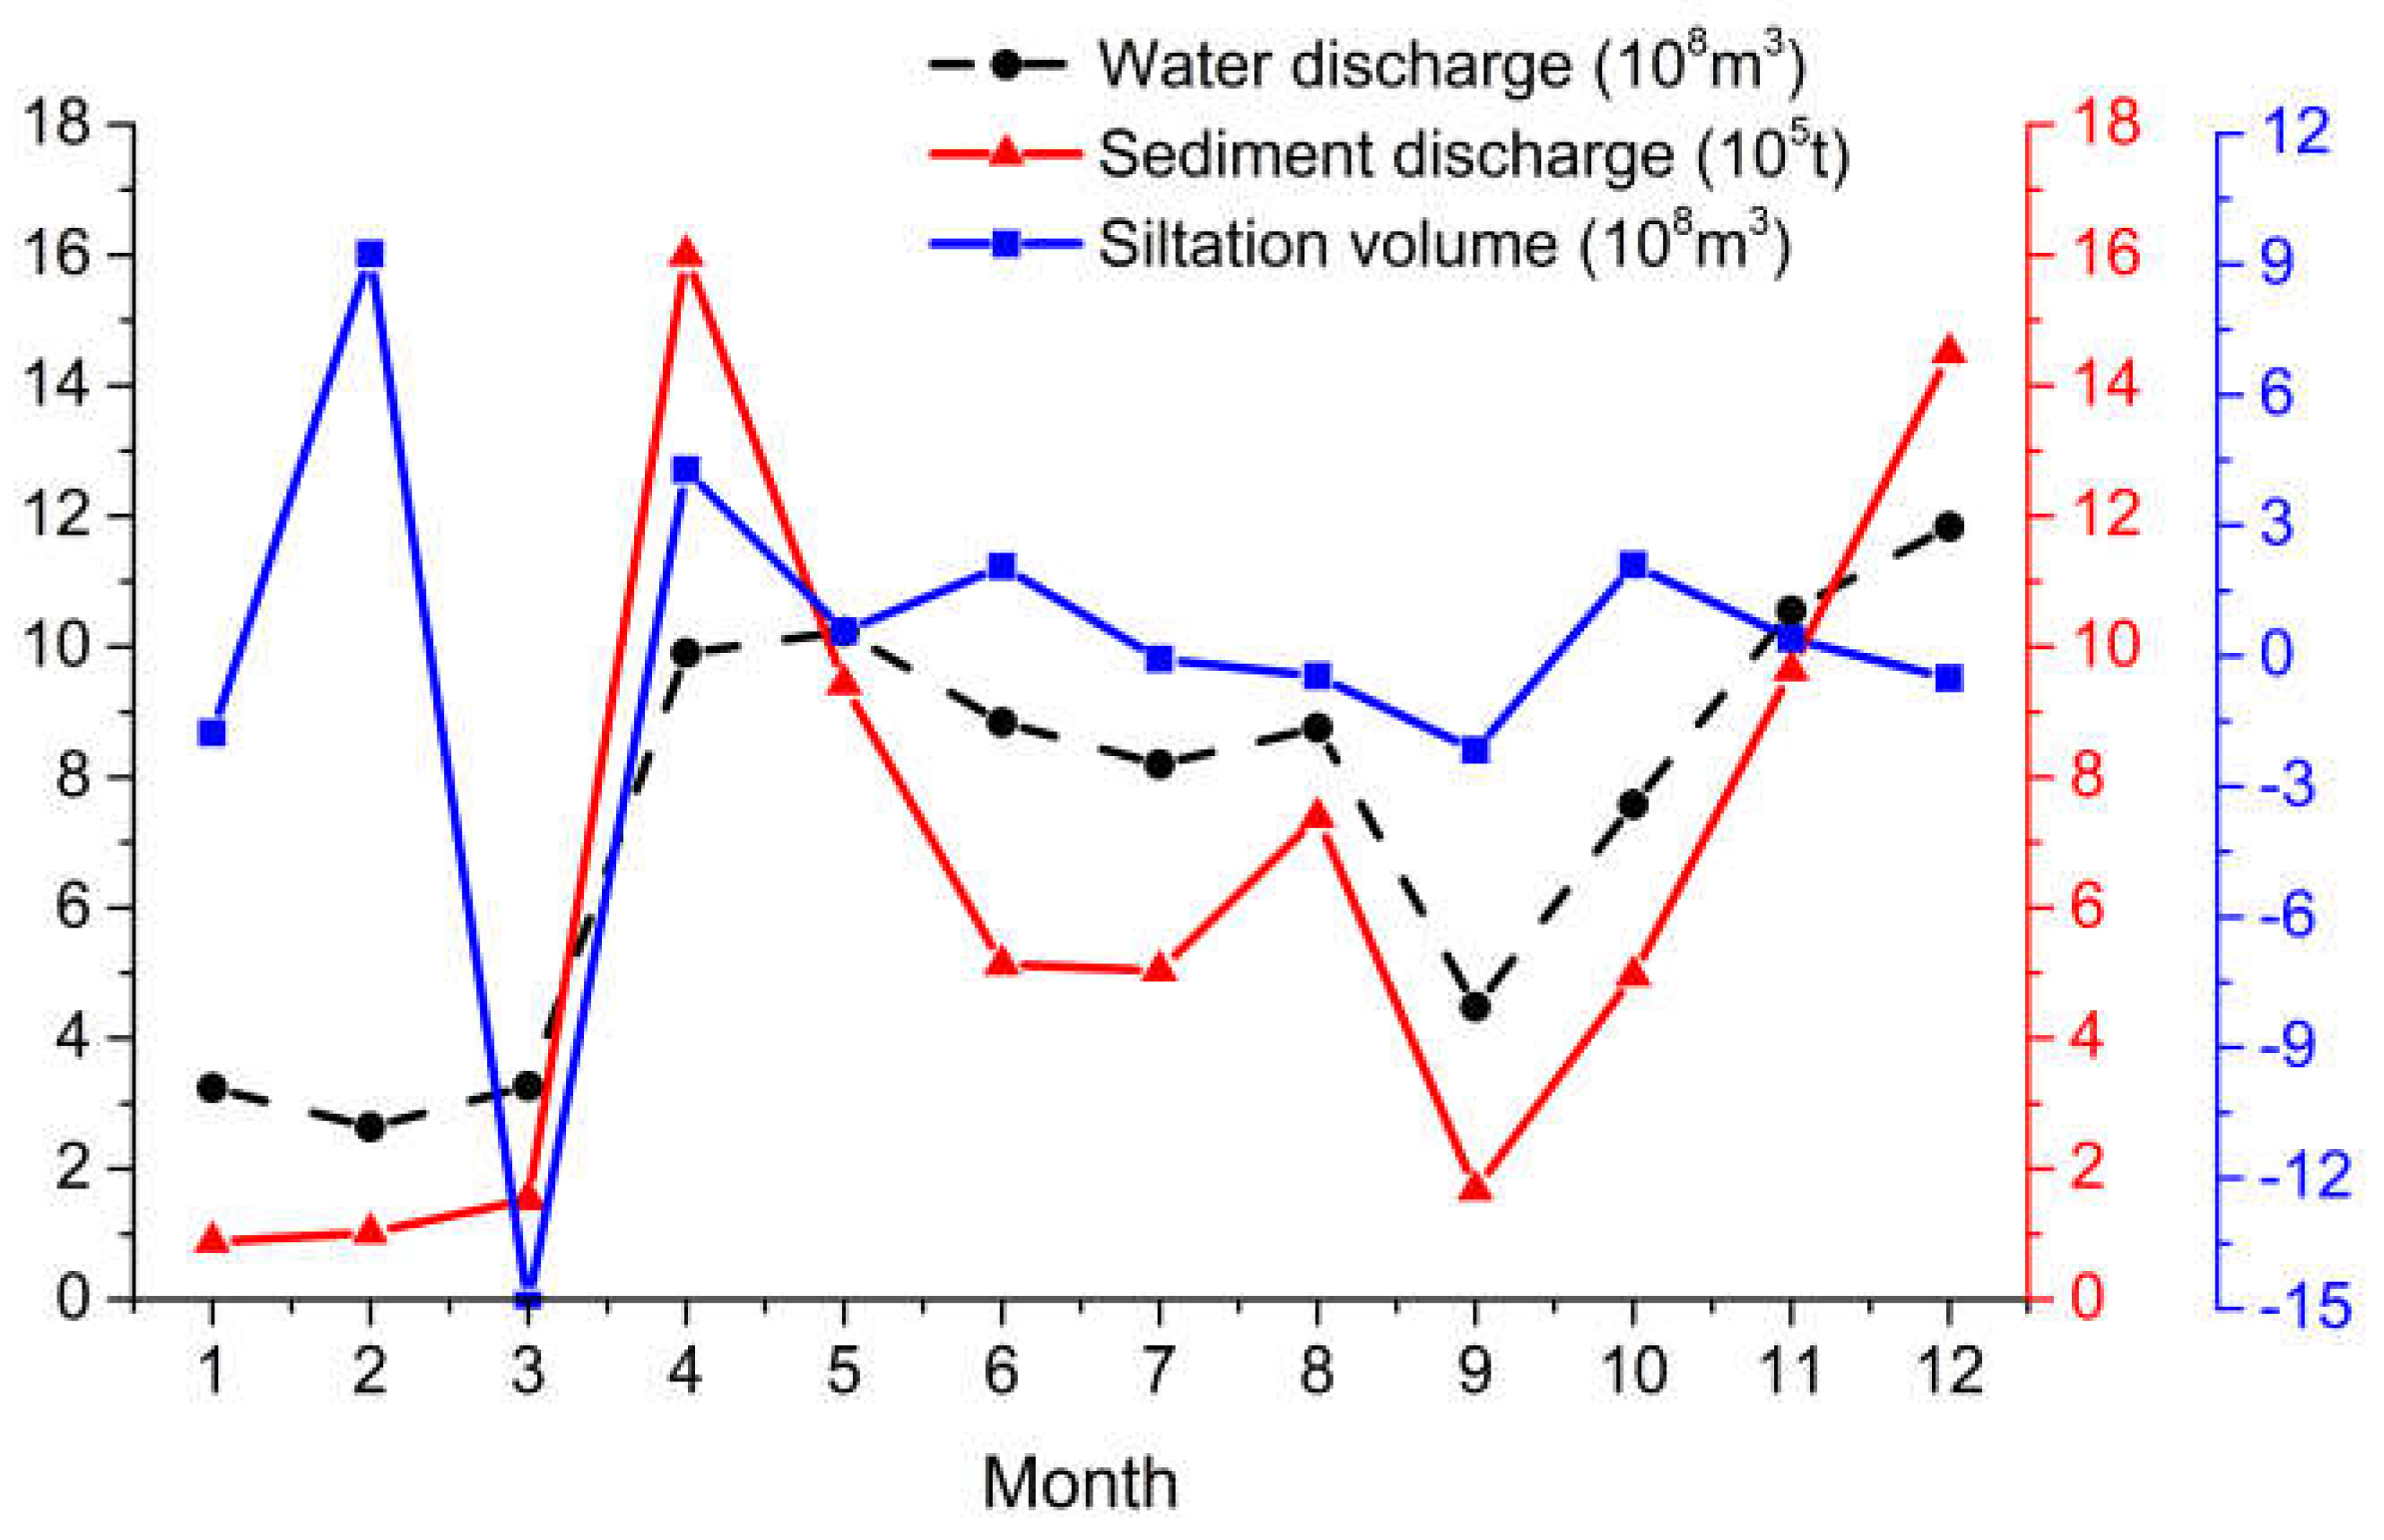

Table 1.
Wind speed, wind direction, water discharge, and sediment discharge in the study area for each month of 2017
Table 1.
Wind speed, wind direction, water discharge, and sediment discharge in the study area for each month of 2017
| Month* | Wind speed (m/s) |
Wind direction (deg) |
Water discharge (108m3) |
Sediment discharge (104t) |
|---|---|---|---|---|
| January | 5.1 | 315 | 3.241 | 8.84 |
| February | 5.2 | 45 | 2.637 | 10.2 |
| March | 5.4 | 180 | 3.268 | 15.3 |
| April | 6.5 | 180 | 9.901 | 160 |
| May | 6.2 | 180 | 10.23 | 94.3 |
| June | 6 | 157.5 | 8.839 | 51.3 |
| July | 5.1 | 180 | 8.196 | 50.4 |
| August | 4.6 | 112.5 | 8.758 | 73.9 |
| September | 4.8 | 180 | 4.484 | 16.8 |
| October | 5.3 | 22.5 | 7.58 | 49.6 |
| November | 5.7 | 337.5 | 10.55 | 96.4 |
| December | 5 | 270 | 11.84 | 145 |
* June to August is the wet season, December to February is the dry season.
Table 2.
The monthly deposition volume in the Yellow River subaqueous delta in 2017
| Month | Deposition Volume (108m3) |
|---|---|
| January | -1.770 |
| February | 9.239 |
| March | -14.915 |
| April | 4.281 |
| May | 0.562 |
| June | 2.057 |
| July | -0.070 |
| August | -0.466 |
| September | -2.170 |
| October | 2.090 |
| November | 0.393 |
| December | -0.513 |
Disclaimer/Publisher’s Note: The statements, opinions and data contained in all publications are solely those of the individual author(s) and contributor(s) and not of MDPI and/or the editor(s). MDPI and/or the editor(s) disclaim responsibility for any injury to people or property resulting from any ideas, methods, instructions or products referred to in the content. |
© 2025 by the authors. Licensee MDPI, Basel, Switzerland. This article is an open access article distributed under the terms and conditions of the Creative Commons Attribution (CC BY) license (http://creativecommons.org/licenses/by/4.0/).
Copyright: This open access article is published under a Creative Commons CC BY 4.0 license, which permit the free download, distribution, and reuse, provided that the author and preprint are cited in any reuse.


