
Submitted:
14 March 2025
Posted:
14 March 2025
You are already at the latest version
Abstract
Nutrition literacy, defined as “the skills to comprehend and implement nutrition information into everyday practice”, is a new area of study. Preschool teachers affect children’s perception of nu-trition and health and contribute to their nutrition literacy skills. This cross-sectional study aimed to assess the level of nutrition literacy (NLS-Gr) of preschool teachers. The research included two stages of cluster sampling in a sample of kindergarten teachers in Greece (Rhodes Island). Nutrition literacy was assessed with NLS-Gr, the Greek version of NLS, and adherence to Mediterranean diet with MEDDIET score. The mean NLS-Gr score was 25.87 (SD±2.2) and is considered adequate. The correct answers range from 65.1% to 100%. Meddiet score was calculated at 33.94 (SD±3.8), and no correlation was found between Meddiet score and NLS-Gr. The NLS-Gr score of kindergarten teachers was adequate, higher than that of previous research on different populations. Yet their adherence to the Mediterranean diet requires improvement and food waste reduction. Educators should be empowered through targeted educational interventions to enhance students' health and nutritional behaviors. Further research could contribute to formulating nutrition strategies and policies in kindergarten.
Keywords:
Nutrition literacy (NLS-Gr)
; MEDDIET score
; preschool teachers
; food practices
1. Introduction
Modern technological advancements and large-scale industrialization have drastically altered agricultural practices, resulting in increased food production, a global trade network, and a surge in processed foods [1]. While this has led to positive outcomes such as an increase in life expectancy, it has also contributed to a decline in dietary quality, becoming a primary factor in the global disease burden. A significant portion of the world's population currently experiences various forms of malnutrition, including undernutrition, micronutrient deficiencies, overweight, obesity, and related non-communicable diseases [2]. In many developing nations, children face a "double burden" of malnutrition, experiencing simultaneously the challenges of undernutrition (such as stunting and wasting) and the increasing prevalence of overweight and obesity. This double burden significantly impacts their health and cognitive abilities [3]. Furthermore, climate change threatens ecosystems, biodiversity, agricultural production, and food security, while population growth intensifies food security challenges [4].
Under these circumstances, in the last decades, new concepts have emerged in research and policy, such as “health literacy” and related terms “nutrition literacy” and “food literacy”[5]. “Nutrition literacy” is defined as “the degree to which individuals can obtain, process, and understand basic nutrition information and nutrition services they need to make appropriate nutritional decisions [6,7]. Furthermore, there is evidence that nutrition literacy is critical for better nutritional habits and overall diet[8,9]. Adherence to a balanced diet is positively associated with higher nutrition and food literacy skills [10]. Other researchers suggest that nutrition literacy predicts adherence to healthy/unhealthy diet patterns [9]. Tools intended for nutrition literacy assessment focus primarily on functional nutrition literacy [11], even though some researchers [12] developed a critical nutrition literacy scale and highlighted the importance of skills beyond basic knowledge, such as effectively communicating about nutrition and taking action within social contexts to overcome barriers to healthy eating. Naigaga et al. [13] emphasize that the two aspects of critical nutrition literacy – “critical evaluation of nutrition information” and “engagement in dietary behavior” are linked at a personal level.
However, there hasn't yet been a consensus among researchers about one generic method of measuring health and nutrition literacy [11,14]. Vamos et al. and Nutbeam [15,16] share a similar perspective, asserting that health literacy skills continuously evolve, enrich, and develop throughout individuals' lives within diverse and rapidly changing environments and contexts. It represents a continuous and lifelong learning process and qualitative education that is essential for achieving health literacy across different groups. Therefore, nutrition literacy is interconnected with social institutions such as schools, families, and the welfare state, aiming at the health promotion of individuals, families, and communities throughout their lifespan [17].
Research on nutrition literacy in Mediterranean countries is limited. Mohsen et al. [22] conducted research on food and nutrition literacy in the Middle East and North Africa, including countries of the Mediterranean (e.g., Lebanon, Morocco, Syria, etc.). In some of these countries, nutrition literacy was assessed. In this research, participants were insufficiently literate in food and nutrition, especially regarding their skills rather than their cognitive domain [18].
In Greece, even though the national dietary guidelines provide a nutritional framework for the Greek population based on age, to our knowledge, there is no official national policy for improving the health and nutrition literacy of the population [19]. Limited studies about nutrition literacy were conducted recently in the Greek population [20,21]. In a study in the Greek population, better parental feeding practices were significantly and positively associated with higher levels of parents’ health and nutrition literacy[22].
Schools, as prominent social institutions, play a crucial role in shaping children's educational and nutritional experiences. Nutrition education in the school context significantly affects the health and well-being of students during their childhood and later stages of life [23]. In school-based programs, teachers have a critical role in implementing educational materials and innovative practices about health and nutrition literacy. Effective nutrition education interventions in school settings are long-lasting and comprehensive and take into account the students' social environment, such as family, other students and classmates, teachers, and the local community [24,25]. Research also suggests that such interventions are effective when they are based on best evidence-based practices and included in the school curricula and everyday activities[26].
In Greece, nutrition policy during the preschool years has many discrepancies in its overall structure. For instance, in public kindergarten, families are responsible for the meals of the preschoolers (preparation, cost, etc.), and teachers are responsible for advocating nutrition education for preschoolers and, consequently, for their parents. A comparative analysis of nutrition education in Greece against other nations like Sweden and the USA exposes notable shortcomings in educational nutritional strategies. Beneficial practices in dietary education for students should be implemented in Greece under particular economic and social circumstances [27].
Empowering preschool teachers to advocate for nutrition education and health promotion initiatives for preschoolers is crucial [28]. They play a pivotal role in implementing nutritional educational materials within the curriculum, regardless of the level of detail provided. Teachers, especially, have a distinct opportunity to design and execute inventive programs to meet students' health and educational requirements. They can offer formal and informal educational experiences focused on healthy eating and lifestyles to prevent obesity [29,30]. Educators should be empowered to promote nutrition education and health promotion programs for students. They are a key factor in implementing educational materials for nutrition included in the curriculum, whether detailed or not [24].
The study aims to assess the level of nutrition literacy of preschool teachers and their adherence to the Mediterranean diet in the context of sustainable kindergarten in Greece. Even though the role of preschool teachers in students’ nutrition education is robust, a gap exists in the literature regarding the impact of empowering teachers as change agents in delivering integrated nutrition knowledge into core subjects. Measuring the teachers’ nutrition literacy could contribute to research development about nutrition policy formulation in kindergarten and prevent nutritional deficiencies and excess weight in young children. To the best of our knowledge, this is the first research conducted in this population group to date, and it could contribute to promoting nutrition education for preschoolers and improving their dietary habits in the context of health-promoting schools.
2. Materials and Methods
2.1. Ethical Aspects
University of the Aegean approved the study protocol with the approval decision 690/18.03.2021. The research complies with the ethical rules and principles of the Ethics and Deontology Committee of the University of the Aegean and according to the University’s Code of Ethics and Deontology of Research. Participants were informed about the study and its purpose via email. Participation in the research was voluntary. The confidentiality of their responses was also emphasized, ensuring their information was used solely for research purposes and protected from unauthorized access.
2.2. Subjects and Criteria for Participation in the Study
The research was conducted during the school year 2021-2022. The data collection commenced in November 2021 and was completed in February 2022. The questionnaire was online and anonymous and included anthropometric measures like height and weight. Preschool teachers self-reported data of anthropometric measurements. BMI was calculated as weight/height2 (kg/m2). Specific criteria of inclusion and exclusion for participation in the study were applied. Kindergarten teachers who served in a public primary school on the island of Rhodes were included in the study. In contrast, kindergarten teachers were excluded if they served in private schools because the nutrition policy diverged, the institutes prepared the school meals, and both preschool teachers and parents had limited control over meal selection. Preschool teachers who weren’t employed in any kindergarten were also excluded. Participants were informed about the questionnaire via email, and the completion was done online. The questionnaire was not distributed on social media to omit answers from non-kindergarten teachers. Additionally, the researcher communicated with the kindergarten principals’ multiple times to ensure better response rates and inform the entire population of kindergarten teachers. The research was conducted when various COVID-19 containment measures were implemented and prohibited the physical presence of researchers in schools.
2.3. Study Design
The present study is cross-sectional. Before officially distributing the survey, a pilot study involving 20 individuals was conducted. The distribution, data collection, and analysis processes were thoroughly tested. A total of 149 kindergarten teachers serving in public schools on the island of Rhodes, out of a total of 228, participated in the research. The sample selection included the two-stage cluster sampling method. This probability sampling method divides the target population into groups, such as regions or schools [31]. This specific type of sampling was carried out in two stages. In the first stage, the clusters (schools) were sampled, and in the second stage, the participants (kindergarten teachers) were selected from each cluster (school). In the present research, kindergartens on the island of Rhodes represent the clusters, and kindergarten teachers participate in each cluster.
2.4. Sample Size
The sample size was initially approached according to Simple Random Sampling. This means that each member of the population of preschool teachers must have the same probability as the rest of the members to be selected in the sample. Specifically, for a Type I error of 5%, a confidence interval of 95%, a population size of 228 preschool teachers on the island of Rhodes, and a response distribution of 50%, it was found that the required sample size is 143 individuals. The above method is integrated into various available online tools, such as https://www.calculator.net/sample-size-calculator.html and http://www.raosoft.com/samplesize.html, and others [32].
The usual sample size estimates assume the independence of observations. Clustering involves designing choices made by the researcher to avoid the phenomenon called contamination. Even in cases where the risk of contamination is possible, randomizing the sample can be a suitable choice in research design aimed at estimating the effect of a factor under real-world conditions [33]. During research design, increasing the number of clusters (kindergartens) may increase the power of the study more than increasing the elements within clusters (teachers). Fixed formulas can be used for sample size, but in order to determine the effective sample size, adjustments should be made using the design effect to find the required sample size [34,35,36]. The intraclass correlation coefficient (ICC) is a measure of correlation within clusters. In studies involving human subjects, it is usually small, but the design effect is magnified by the number of elements within the cluster (m). The smaller the design effect, the greater the efficiency of the sample size [34]. Therefore, the initial sample of 143 kindergarten teachers should be increased by 2.8%. Considering all the above, the research sample should be adjusted using the research's impact and ultimately amount to 147 kindergarten teachers. Additionally, two more questionnaires were added (10% extra), resulting in a final sample size of 149 kindergarten teachers.
2.5. The Questionnaire
Different research tools emerged from the literature review based on the research questions for the implementation of the research. A questionnaire consisting of 65 questions was developed, weighted, and included the MedDietScore tool by Panagiotakos et al. [36] and the NLS-GR tool by Michou et al. [20].
The questionnaire intended for preschool teachers included anthropometric characteristics of the sample (gender, height, weight, age), adherence to the Mediterranean Diet using the MedDietScore tool, level of physical activity, and sedentary lifestyle, which included four questions about physical activity and sedentary behavior on weekdays and weekends and, lastly, nutrition literacy scale the NLS-GR tool. Socioeconomic characteristics of the sample, including educational level, type of employment, and net family income. An additional question for parents asked whether the children lived with one or both parents.
2.5.1. MedDietScore Tool
Regarding the MedDiet score, a tool for measuring adherence to the Mediterranean Diet was developed by Panagiotakos et al. [37] and has been applied to Greek populations [37,38,39,40]. It is considered a valid and scientifically well-recognized tool for assessing adherence to the Mediterranean Diet according to review studies and comparisons of different tools for assessing Mediterranean Diet adherence in healthy adults [41].
2.5.2. NLS-GR Tool
Nutrition Literacy Scale for the Greek population (NLS-Gr) is a tool designed to assess the degree to which adults, parents, and educators are sufficiently informed and able to apply their knowledge to make conscientious decisions regarding their nutrition and health. This tool is the Greek version of the NLS tool [42] and includes 29 questions to assess the nutrition literacy of adults [43]. The reliability of the Greek version of the NLS-Gr is tested and is considered a valid tool for measuring nutrition literacy among healthy adult populations with satisfactory psychometric characteristics [43].
2.5.3. Statistical Analysis
Data analysis was performed using the Statistical Package for the Social Sciences 27.0 (SPSS Inc., Chicago, IL, USA). First, the demographic characteristics of participants were described. Independent Samples t-test and One-way ANOVA, as well as the corresponding non-parametric Mann-Whitney U test and Kruskal-Wallis H test, were used to investigate the relationships between qualitative and quantitative variables. In the case of a statistically significant result in the One-way ANOVA and Kruskal-Wallis tests, repeated tests (post-hoc tests) were applied using the Bonferroni correction. In addition, to investigate the relationship between quantitative and ordinal variables, Spearman's correlation coefficient (rs) was calculated along with 95% confidence intervals (95% CI). Finally, the χ2 test (chi-squared test) and Fisher's exact test (Fisher's exact test) in case of expected counts (expected counts) lower than 5 were applied to investigate correlations between qualitative variables. For all tests, p < 0.05 was considered statistically significant. All tests performed were two-sided. For the presentation of the qualitative variables, frequencies were used along with percentages, n (%), and bar graphs. In the quantitative variables, either the mean value with the standard deviation (mean SD) or the median value with the interquartile range (median Q1-Q3) were analyzed depending on whether the condition of normality was met, as well as boxplots. Normality testing was performed with the Shapiro-Wilk test and appropriate graphs (Histograms and Q-Q plots).
3. Results
3.1. Sample Characteristics
The sample consisted of 96% females (143) and 4% males (6). Most preschool teachers, at a percentage of 43.6%, were aged 44-55 years old, 38.3% were aged 33-43 years old, 17.4% were aged 22-32 years old, and 0.7% were older than 56 years old.

Table 1.
Sample descriptive characteristics for total (n=149).
| Sample characteristics | Participants (n=149) |
| Gender, n (%) | |
| Male | 6 (4.0) |
| Female | 143 (96.0) |
| Age in years, n (%) | |
| 22-32 | 26 (17.4) |
| 33-43 | 57 (38.3) |
| 44-55 | 65 (43.6) |
| >56 | 1 (0.7) |
| Weight in Kg, Median value | 62 (55.0-71.5) |
| Height in m, Mean value (SD) | 1.64 (0.08) |
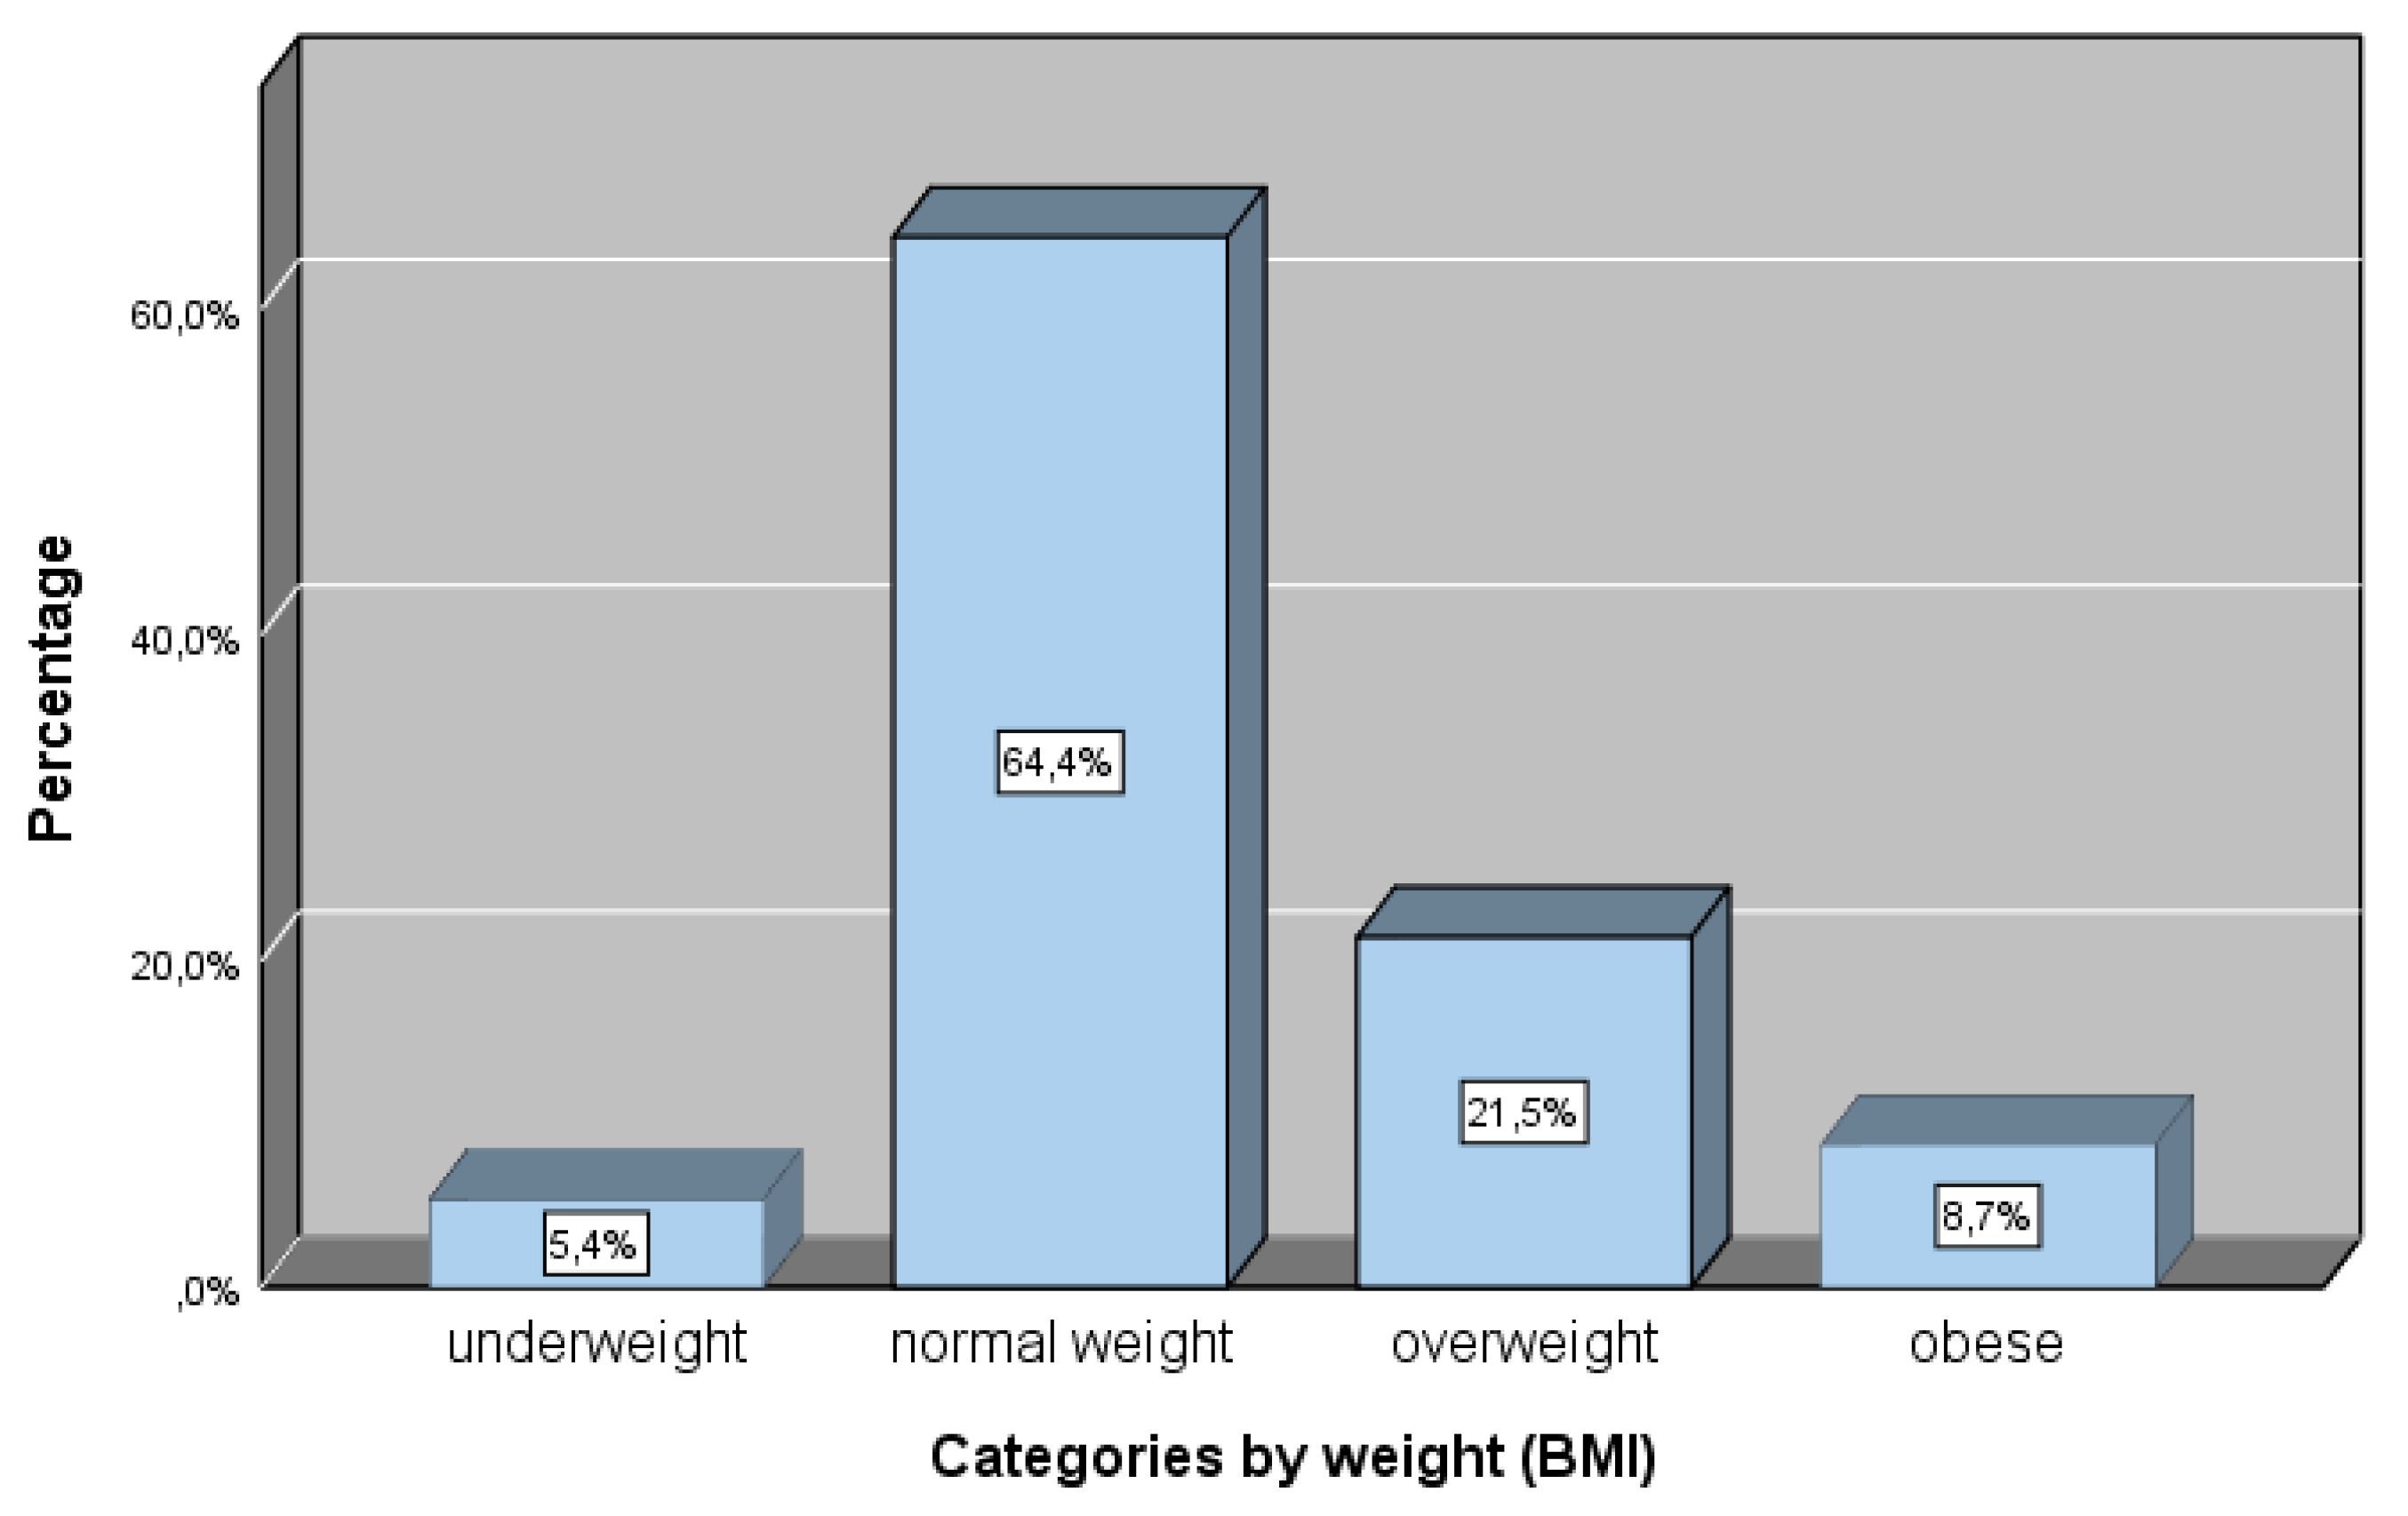
| BMI Kg/m2, Median | 23.34 (20.82-25.74) |
| Body weight, n (%) | |
| Underweight | 8 (5.4) |
| Normal weight | 96 (64.4) |
| Overweight | 32 (21.5) |
| Obese | 13 (8.7) |
| Education, n (%) | |
| B.Sc. Degree | 69 (46.3) |
| M.Sc. Student | 17 (11.4) |
| M.Sc. Degree | 57 (38.3) |
| PhDc | 4 (2.7) |
| PhD | 2 (1.3) |
| Years of teaching experience, n (%) | |
| ≤1 | 12 (8.1) |
| 1-10 | 44 (29.5) |
| 11-15 | 32 (21.5) |
| 16-20 | 29 (19.5) |
| >20 | 32 (21.5) |
| Marital status, n (%) | |
| Single | 31 (20.8) |
| Married | 112 (75.2) |
| Divorced | 6 (4.0) |
| Net Annual family income, n (%) | |
| <10.000 € | 29 (20.0) |
| 10.001-20.000 € | 76 (52.4) |
| 20.001-30.000 € | 27 (18.6) |
| >30.000 € | 13 (9.0) |
Q1-Q3: SD: Standard deviation.
Figure 1.
Distribution of BMI categories (underweight, normal weight, overweight and obese) (%).
3.1. NLS-Gr
The correct answers of kindergarten teachers in the questionnaire about nutrition literacy are shown in Table 2. The percentage of correct answers was high, ranging from 65.1% to 100%. The mean score (mean) of the NLS-GR rating for the sample of kindergarten teachers was 25.87 (SD±2.203) for the total of 29 questions in the tool. The nutrition literacy level in this research is considered adequate. Scores from 0-7 are categorized as inadequate, 8-14 are marginal, and 15-29 are adequate [42].
3.2. NLS-Gr and Association with Education, Professional Experience, Weight Classification and Family Income
Table 3 shows the relationship between nutrition literacy and educational level, years of teaching experience, postgraduate studies, and net annual family income. As presented in this table, only one statistically significant relationship emerged between nutrition literacy and the variable pertaining to annual family income (p-value=0.048). According to the Bonferroni correction, the group earning <10,000 euros is statistically different from the group earning 10,001-20,000 euros (adj. p-value=0.043).
Furthermore, the median value of nutrition literacy is lower for individuals with a net annual family income of <10,000 euros, as the median value of NLS-Gr for this income bracket is 25 (p-value=0.048, p<0.05). In contrast, for incomes of 10,001-20,000 euros, it is 27.
3.3. NLS-Gr and Association with Food Practices and Food Waste
The relationship between nutrition literacy and preschool teachers' perspectives on food rejection, meal planning, organic product consumption, and waste composting is shown in Table 4. A statistically significant correlation was found between nutrition literacy and meal planning. As shown in the table, participants who organize and plan their meals have a higher median NLS score (md=27) compared to those who do not plan meals (md=25.5), and this difference is statistically significant (p=0.017, p<0.05).
3.4. NLS-Gr and Association with Meddiet Score
There was no statistically significant correlation between nutrition literacy, calculated using the NLS-GR tool, and adherence to the Mediterranean Diet, assessed with the MedDiet score tool. As illustrated in the corresponding scatter plot (Figure 2), a cloud of points is observed around the straight line, indicating no correlation between them. Furthermore, examining the relationship between MedDiet score and NLS-GR using the Spearman coefficient (Table 5) did not reveal a statistically significant correlation (p-value=0.202, p>0.05).
3.5. NLS-Gr and Correlation with BMI
Using the Spearman correlation coefficient (rs), no correlation was found between the total score of NLS-Gr and the educational level of kindergarten teachers (rs = 0.03, 95% CI = -0.14, 0.19, p = 0.764) (Table 6)
Additionally, a non-parametric Kruskal-Wallis test was conducted, showing no statistically significant difference in NLS-Gr scores associated with the educational level of kindergarten teachers (p = 0.227, p> 0.05).
3.6. Adherence to Meddiet and Weight Categories
According to the analysis of variance (ANOVA) test, no statistically significant difference was found between the consumption of specific food groups of the Mediterranean Diet (MedDiet score) and the categorization of body weight based on the BMI, as presented in Table 7.
3.7. Correlation of Adherence to Meddiet and Physical Activity
Non-parametric Spearman's correlation coefficient was used to examine associations between MedDiet components (food groups) and physical activity/sedentary behavior. As shown in Table 8, cereal, fruit, and vegetable consumption were significantly correlated with physical activity levels.
Specifically, the question "How often do you consume unprocessed cereals (whole meal bread, whole meal pasta, unprocessed rice, etc.)" was found to be associated with the questions "How many hours/ day do you lead a sedentary lifestyle" and "How many hours do you exercise per day on average" at a statistically significant level. Specifically, as the hours/ of a sedentary lifestyle increase, the consumption of unprocessed cereals in one week also increases (rs=0.9, 95% CI 0.8, 0.9 ). Additionally, as the hours of daily exercise increase on average, the consumption of unprocessed cereals in one week also increases (rs=0.2, 95% CI 0.1, 0.4).
A similar trend was observed in the kindergarten teachers' sample regarding weekly fruit consumption. Specifically, it was found that as the consumption of fruits per week increases, the hours/day of a sedentary lifestyle and the hours of daily exercise on average also increase (rs=0.3; 95% CI (0.1, 0.4) and rs=0.2; 95% CI (0.1, 0.4), respectively). Additionally, it was found that the hours/day of sedentary lifestyle on weekdays are positively associated with their weekly consumption of fresh or boiled vegetables (rs=0.3; 95% CI (0.2, 0.5)). The hours/day of a sedentary lifestyle on weekdays are negatively associated with the consumption of dairy products (rs=-0.2; 95% CI (-0.3, 0.0)). Lastly, the average hours of sedentary lifestyle led by kindergarten teachers on weekdays are negatively associated with frequent olive oil consumption (rs=-0.2; 95% CI (-0.3, -0.02)).
3.8. Food Disposal Practices
According to the teachers’ responses, the leading causes of food rejection are either spoilage before consumption or considering them as leftovers. The table above shows that the highest percentages are observed in these categories. Teachers could choose more than one type of food, as categorized in the questionnaire. Teachers reported that foods they mostly discard because of spoilage include vegetables (55 teachers), milk (48 teachers), and fruits (43 teachers), while less frequently mentioned are chicken (6 teachers) and fish (2 teachers). Foods that teachers stated they mostly reject because they spoil were milk and yogurts (62.5%), cheeses (75%), fruits (67.4%), vegetables (69.1%), soft drinks (76.9%), desserts (52.9%), meat (35.7%), fish (100%), and eggs (60%). In contrast, most teachers claimed that they discarded bread (61.0%), fats and oils (76.5%), chicken (66.7%), legumes (84.6%), rice, and pasta (87.0%) as leftovers.
Table 9.
Food disposal by food categories and causes.
| Food Disposal | ||||
|
Food Categories (n) |
Spoilage Before Consumption | Expired Date Passed | During Cooking | As Leftovers |
| n (%) | n (%) | n (%) | n (%) | |
| Milk-Yogurts (n=48) | 30 (62.5) | 27 (56.3) | 1 (2.1) | 15 (31.3) |
| Cheese(n =12) | 9 (75.0) | 3 (25.0) | 1 (8.3) | 6 (50.0) |
| Fruits(n =43) | 29 (67.4) | 11 (25.6) | 0 (0.0) | 23 (53.5) |
| Vegetables(n =55) | 38 (69.1) | 16 (29.1) | 0 (0.0) | 30 (54.5) |
| Bread (n =41) | 17 (41.5) | 8 (19.5) | 1 (2.4) | 25 (61.0) |
| Fats-Oils (n =17) | 7 (41.2) | 4 (23.5) | 2 (11.8) | 13 (76.5) |
| Soft Drinks (n=13) | 10 (76.9) | 8 (61.5) | 0 (0.0) | 7 (53.8) |
| Desserts (n=17) | 9 (52.9) | 9 (52.9) | 0 (0.0) | 8 (47.1) |
| Meat (n=14) | 5 (35.7) | 4 (28.6) | 2 (14.3) | 11 (78.6) |
| Chicken (n=6) | 4 (66.7) | 3 (50.0) | 1 (16.7) | 4 (66.7) |
| Fish (n=2) | 2 (100.0) | 1 (50.0) | 0 (0.0) | 1 (50.0) |
| Eggs (n=10) | 6 (60.0) | 5 (50.0) | 0 (0.0) | 5 (50.0) |
| Legumes (n=13) | 7 (53.8) | 2 (15.4) | 2 (15.4) | 11 (84.6) |
| Rice-Pasta (n=23) | 7 (30.4) | 1 (4.3) | 1 (4.3) | 20 (87.0) |
4. Discussion
The assessment of nutrition literacy using the NLS-Gr tool showed that the mean score for the sample of 149 kindergarten teachers was adequate for the overall 29 questions of the tool. In a previous study of Diamond [46] with 341 patients in the US the NLS tool was used and reported a mean score on the questionnaire of 23.7 (SD±4.1). Additionally, research [47] with 1281 adults in the Greek population, applying the NLS-Gr for the first time, the Greek version of NLS, reported that the mean score of the sample was 22.11 (SD±5.67). According to Sampaio et al. [44] , in a study with 38 individuals in Brazil, the mean NLS-Gr score was 22.7 (SD±3.9). In general, the NLS score in the present research is adequate and higher than previous studies conducted in Greece or other populations. In all cases, nutrition literacy is considered sufficient, as the score falls into the category of 15-29 [43] .
The participants' high levels of nutrition literacy may be explained by their higher educational level. However, our study found no statistically significant correlation between participants' nutrition literacy and holding a postgraduate or doctoral degree. In previous studies, nutrition literacy was higher in individuals with a higher educational level [25]. Additionally, in a study with 1281 adults in Greece, education was positively associated with nutrition literacy, as educated participants had higher nutrition literacy than non-educated ones [49]. Chronic disease is negatively associated with nutrition literacy, and especially nutrition literacy levels in Greeks with chronic disease could help individuals to manage chronic conditions better, thus reducing the overall burden of chronic diseases [50].
Numerous studies have associated nutrition literacy and socioeconomic status in different populations [45,46,47,48]. Research conducted in the Greek population [52] reported that participants with medium annual income had significantly higher nutrition literacy than participants with low annual income. Our findings are in line with this study, as it was found that participants with annual income had a lower NLS score than those with medium income at a statistically significant level.
Basic nutrition knowledge is positively associated with healthier eating habits Taylor et al. [9] suggest that a more comprehensive understanding about nutrition is a stronger predictor of dietary choices. Inadequate nutrition literacy leads to less desirable nutritional choices, such as adherence to a Western-type diet, in contrast to high nutrition literacy which is associated with better dietary habits, such as those found in the Mediterranean diet. A study of Italian adults showed a strong correlation between higher nutrition literacy and adherence to the Mediterranean diet, suggesting that a deeper understanding of nutrition empowers individuals to make healthier food choices [47]. They found a strong association between nutrition literacy and the Mediterranean diet, and there was a clear connection between a healthy dietary pattern and the nutrition literacy of the population. In contrast, in our study, nutrition literacy (NLS-Gr) was not associated with adherence to the Mediterranean diet. The percentage of correct answers ranged from 65.1% to 100%, and the mean NLS-Gr was adequate, which may explain the lack of a correlation at a statistically significant level between Mediterranean diet adherence and nutrition literacy. Thus, the target population had a higher educational level, contrary to other studies conducted in different populations of various socioeconomic backgrounds.
A literature review reported that nutrition literacy interventions positively influence children's dietary choices and nutrition security. These interventions are most effective when they incorporate technology, use multiple learning modalities, last longer than four weeks, and include face-to-face sessions [48]. Research on teachers' nutrition knowledge at all educational levels is limited [49,50]. The results of a previous study of teachers in Greece [57] were encouraging, because improved nutrition knowledge after implementing an e-learning program was observed.
It should be noted that this research, to the best of our knowledge, is the first study to focus on nutrition literacy, adherence to the Mediterranean diet, and perspectives about the nutrition of a specific population group in Greece with a high educational level, kindergarten teachers, who also affect nutrition and health literacy of young children. Their nutrition literacy skills are crucial for nutrition education, as research shows that interventions to improve food and nutrition literacy can positively affect the food and nutrition skills and dietary patterns and improved diet quality [51]. Kindergarten teachers influence the health of toddlers, either as role models or through the nutritional education of toddlers and the application of age-appropriate educational methods. In the same way, their conscious attitude towards reducing food waste through practices related to sustainable Mediterranean diet can significantly affect the dietary choices of toddlers in conjunction with environmental protection within the sustainability framework. By modeling mindful eating practices, educators can demonstrate how to minimize waste and appreciate the value of food [52]. Furthermore, incorporating nutritional education about the Mediterranean diet, emphasizing unprocessed, seasonal, local products, and explaining its health and environmental benefits, can empower children to make informed food choices that support their well-being and the planet [53].
Nutrition is encompassed in the kindergarten curriculum in Greece, and kindergarten teachers play a significant role in promoting healthy eating in the context of a sustainable school [54]. Kindergarten teachers are responsible for applying nutrition education through various pathways, e.g., school eating routine, pedagogical meals, multidisciplinary approach education, etc. Therefore, research on nutrition literacy among preschool teachers is critical. Teachers serve as mediators in transmitting nutritional knowledge and promoting positive nutrition experiences for preschoolers. Adequate nutrition knowledge is essential to encourage parents and preschoolers to provide high-quality foods in school that meet dietary requirements [29,55].
The National Dietary Guide of Greece [56] is the official manual for nutrition recommendations at all stages of an individual's life. It is addressed to the overall Greek population, emphasizing the Mediterranean diet's nutritional plan and the Greek population's nutritional requirements. Preschool teachers are responsible for children’s nutrition education and, therefore, for searching for appropriate educational material related to nutrition in early childhood. Preschool teachers, except for the National Dietary Guide of Greece [56], also have access to educational material about nutrition within the framework of teaching Skills Labs, educational clubs in school, and health education programs in kindergarten. 'Skills Labs' have been implemented in Greek schools of all levels and have included nutrition and nutrition literacy, targeting students of different ages, starting from preschool (Ministerial Decision F.31/94185/D1, 29-7-2021) [57]. The Institute of Educational Policy in Greece provides relevant educational material online [54]. However, many researchers suggest that when nutrition education is included in the school curriculum, school-based interventions seem more efficacious [58] . A systematic review and meta-analysis study suggests that researchers and government public policies should adopt theory under specific social contexts involving teachers, school staff, family, and environmental choices [59] . In the Greek curriculum in kindergarten, nutrition is mentioned within the context of interdisciplinarity across different fields of knowledge. However, it does not constitute a separate field or subject in the kindergarten curriculum.
The practice of meal planning, as well as understanding the impact of dietary choices on the environment within the framework of sustainability, is encompassed in the concept of "food literacy" rather than "nutrition literacy," as delineated by Krause et al. [60] . Meal planning and management should be promoted using different strategies when it comes to individuals from lower socioeconomic backgrounds compared to those who are economically secure [61] . In our study among kindergarten teachers, meal planning was positively correlated with levels of nutrition literacy, which could be explained by the fact that the concepts of nutrition literacy and food literacy are similar and may even overlap or be included in the broader concept of health literacy [62] .
Studies report a disconnect between consumer awareness of food waste and actual waste reduction behaviors. While Greek consumers demonstrate a significant understanding of food waste issues, Greece still ranks highest in Europe for per capita food waste, exceeding the global average by a substantial margin [63,64,65]. This high level of waste is reflected in kindergarten teachers’ responses in the present study, as they report discarding significant amounts of food, primarily fruits, vegetables, milk, and grains. A systematic review by Aloysius et al. [66] found that consumers' food handling skills and knowledge at a household level are key factors determining how much leftover food is wasted. In our study, fruits and vegetables were the leading food group reported to be discarded because they spoiled before consumption or as leftovers. About 13% of fruit and vegetable waste could be prevented, as fresh produce, bakery items, and dairy are often wasted due to unused time. Research suggests improving household food handling skills, knowledge, and better storage techniques could significantly reduce this waste [67]. Interventions targeting consumer behavior and emphasizing practical skills are crucial for translating awareness into actionable change [63,67,68].
According to the responses of kindergarten teachers, the main causes of food rejection are either spoilage before consumption or leftovers. Theodoridis et al. [64] analyzed different types of consumers regarding food waste and revealed a significant level of food waste awareness among Greek consumers. Furthermore, according to a recent study by the United Nations Organization on food waste [69] , Greece is reported to have the highest food waste in Europe [63,65] . In the present study, most teachers report discarding vegetables, milk, fruits, and grains. In the US at the consumer level, three food groups comprised 68% of the total food loss: meat (including poultry and fish), vegetables, and dairy products [70] . A systematic review conducted by Aloysius et al. [71] found that consumers' food handling skills and knowledge at a household level are key factors determining how much leftover food is wasted. De Laurentiis et al. [72] report that in the EU, it is estimated that 44% and 47% of the total food waste at household level was fruits and vegetables. Other researchers suggest that vegetable and fruit waste accounts for over 50% of European food waste [73] . In our study, fruits and vegetables were the main food group reported to be discarded, either because they spoiled before consumption or as leftovers. About 13% of fruit and vegetable waste could be prevented, as fresh produce, bakery items, and dairy are often wasted due to not being used in time [72]. Improving food storage and handling techniques can reduce waste of perishable items such as dairy, meat, fruits, and vegetables. Environmentally conscious teachers can educate students about proper food storage and handling. This is key to minimizing food waste and promoting responsible consumption and healthy eating habits. Teachers through observation and experiential learning using technology or not, could educate children about fruit and vegetable spoilage. Cooperation with local organizations or farmers' markets can give students real-world insights into food production, preservation, healthy dietary habits, and reducing waste.
Sociocultural characteristics affect dietary choices in kindergarten, and the Mediterranean diet is the dietary pattern in line with the customs and traditions of the Greek population. Reduced food waste is linked to the appropriate use of resources and foods and their transformation and processing through traditional techniques [74] . For instance, using stale bread in cooking, making rusks that last longer, salting fish, and many other examples of such customs. Mediterranean diet involves skills, practices, and traditions about food, harvesting, and processing [75] . Maintaining sustainable dietary practices in line with the Mediterranean diet can be achieved through education for sustainable development, with preschool teachers playing a crucial role as mediators of children's nutrition education.
5. Limitations
The study has several limitations. First, weight and height data were self-reported. While self-reporting is a standard method for collecting anthropometric data, it is generally less accurate than measurements taken by trained professionals. Self-reported data tends to underestimate BMI, particularly at higher BMI levels. The self-report method of collecting anthropometric data is considered reliable, but with lower accuracy and a tendency for underestimation as BMI increases might occur [76] .
Considering that Greece was under COVID-19 pandemic restrictions, collecting self-reported data was the most feasible method available. Another limitation is that it is a cross-sectional study, and temporal sequence and causal association between exposure and outcome cannot be established. Thus, the results should be further confirmed by a larger sample repeatedly to confirm the study trends.
6. Conclusions
In this study, Greek preschool teachers were found to be adequately nutrition literate, but their nutritional habits regarding the Mediterranean diet need improvement. High nutrition literacy scores aren’t related to high adherence to the Mediterranean diet, and the factors that affect their dietary choices should be studied in further research. Preschool teachers are considered role models for their students, and they impart their nutritional knowledge to their students, consequently, their involvement in nutrition education should be promoted. They should be empowered through educational interventions to promote students' health and nutritional behaviors through their respective interventions.
Supplementary Materials
No supplementary data.
Author Contributions
Conceptualization: Charistoula Chatzinikola and Vasileios Papavasileiou ; Data curation, Charistoula Chatzinikola, Vasileios Papavasileiou , Nikolaos Andreadakis and Antonios Koutelidakis; Formal analysis, Charistoula Chatzinikola, Vasileios Papavasileiou and Nikolaos Andreadakis; Funding acquisition, Vasileios Papavasileiou ; Investigation, Charistoula Chatzinikola, Nikolaos Andreadakis and Antonios Koutelidakis; Methodology, Charistoula Chatzinikola, Vasileios Papavasileiou and Antonios Koutelidakis; Project administration, Vasileios Papavasileiou ; Resources, Charistoula Chatzinikola and Nikolaos Andreadakis; Software, Charistoula Chatzinikola; Supervision, Vasileios Papavasileiou ; Validation, Nikolaos Andreadakis and Antonios Koutelidakis; Visualization, Nikolaos Andreadakis and Antonios Koutelidakis; Writing – original draft, Charistoula Chatzinikola; Writing – review & editing, Vasileios Papavasileiou and Antonios Koutelidakis. All authors have read and agreed to the published version of the manuscript.”.
Funding
This research received no external funding.
Institutional Review Board Statement
The study was conducted in accordance with the Declaration of Helsinki and approved by the Institutional Review Board of University of the Aegean’s ethics and deontology committee (690/18.03.2021).
Informed Consent Statement
Informed consent was obtained from all subjects involved in the study.
Data Availability Statement
The data are available after demand from the authors.
Acknowledgments
We thank all the volunteers who participated in this study.
Conflicts of Interest
The authors declare no conflicts of interest.
References
- Stewart, D.; Kennedy, A.; Pavel, A. Beyond Nutrition and Agriculture Policy: Collaborating for a Food Policy. Br. J. Nutr. 2014, 112 Suppl 2, S65–74. [Google Scholar] [CrossRef]
- Swinburn, B.A.; Kraak, V.I.; Allender, S.; Atkins, V.J.; Baker, P.I.; Bogard, J.R.; Brinsden, H.; Calvillo, A.; De Schutter, O.; Devarajan, R.; et al. The Global Syndemic of Obesity, Undernutrition, and Climate Change: The Lancet Commission Report. Lancet Lond. Engl. 2019, 393, 791–846. [Google Scholar] [CrossRef]
- Worldwide Trends in Underweight and Obesity from 1990 to 2022: A Pooled Analysis of 3663 Population-Representative Studies with 222 Million Children, Adolescents, and Adults. Lancet Lond. Engl. 2024, 403, 1027–1050. [CrossRef]
- Change (IPCC), I.P. on C. Summary for Policymakers. In Climate Change and Land: IPCC Special Report on Climate Change, Desertification, Land Degradation, Sustainable Land Management, Food Security, and Greenhouse Gas Fluxes in Terrestrial Ecosystems; Cambridge University Press, 2022; pp. 1–36.
- Ad Hoc Committee on Health Literacy for the Council on Scientific Affairs, American Medical Association Health Literacy: Report of the Council on Scientific Affairs. JAMA 1999, 281, 552–557. [CrossRef]
- Health Literacy: A Prescription to End Confusion; Washington (DC); Nielsen-Bohlman, L., Panzer, A.M., Kindig, D.A., Eds.; 2004; ISBN 0-309-52926-3. [Google Scholar]
- Silk, K.J.; Sherry, J.; Winn, B.; Keesecker, N.; Horodynski, M.A.; Sayir, A. Increasing Nutrition Literacy: Testing the Effectiveness of Print, Web Site, and Game Modalities. J. Nutr. Educ. Behav. 2008, 40, 3–10. [Google Scholar] [CrossRef] [PubMed]
- Zoellner, J.; You, W.; Connell, C.; Smith-Ray, R.L.; Allen, K.; Tucker, K.L.; Davy, B.M.; Estabrooks, P. Health Literacy Is Associated with Healthy Eating Index Scores and Sugar-Sweetened Beverage Intake: Findings from the Rural Lower Mississippi Delta. J. Am. Diet. Assoc. 2011, 111, 1012–1020. [Google Scholar] [CrossRef]
- Taylor, M.K.; Sullivan, D.K.; Ellerbeck, E.F.; Gajewski, B.J.; Gibbs, H.D. Nutrition Literacy Predicts Adherence to Healthy/Unhealthy Diet Patterns in Adults with a Nutrition-Related Chronic Condition. Public Health Nutr. 2019, 22, 2157–2169. [Google Scholar] [CrossRef]
- Scazzocchio, B.; Varì, R.; d’Amore, A.; Chiarotti, F.; Del Papa, S.; Silenzi, A.; Gimigliano, A.; Giovannini, C.; Masella, R. Promoting Health and Food Literacy through Nutrition Education at Schools: The Italian Experience with MaestraNatura Program. Nutrients 2021, 13. [Google Scholar] [CrossRef]
- Carbone, E.T.; Zoellner, J.M. Nutrition and Health Literacy: A Systematic Review to Inform Nutrition Research and Practice. J. Acad. Nutr. Diet. 2012, 112, 254–265. [Google Scholar] [CrossRef]
- Guttersrud, O.; Dalane, J.Ø.; Pettersen, S. Improving Measurement in Nutrition Literacy Research Using Rasch Modelling: Examining Construct Validity of Stage-Specific “critical Nutrition Literacy” Scales. Public Health Nutr. 2014, 17, 877–883. [Google Scholar] [CrossRef]
- Naigaga, D.A.; Pettersen, K.S.; Henjum, S.; Guttersrud, Ø. Relating Aspects of Adolescents’ Critical Nutrition Literacy at the Personal Level. Nutrire 2021, 47, 1. [Google Scholar] [CrossRef]
- Liu, H.; Xu, X.; Liu, D.; Rao, Y.; Reis, C.; Sharma, M.; Yuan, J.; Chen, Y.; Zhao, Y. Nutrition-Related Knowledge, Attitudes, and Practices (KAP) among Kindergarten Teachers in Chongqing, China: A Cross-Sectional Survey. Int. J. Environ. Res. Public. Health 2018, 15. [Google Scholar] [CrossRef]
- Vamos, S.; Okan, O.; Sentell, T.; Rootman, I. Making a Case for “Education for Health Literacy”: An International Perspective. Int. J. Environ. Res. Public. Health 2020, 17. [Google Scholar] [CrossRef]
- Nutbeam, D. Health Education and Health Promotion Revisited. Health Educ. J. 2019, 78, 705–709. [Google Scholar] [CrossRef]
- Vamos, S.; Rootman, I. Health Literacy as a Lens for Understanding Non-Communicable Diseases and Health Promotion. In Global Handbook on Noncommunicable Diseases and Health Promotion. In Global Handbook on Noncommunicable Diseases and Health Promotion; McQueen, D.V., Ed.; Springer New York: New York, NY, 2013; ISBN 978-1-4614-7594-1. [Google Scholar]
- Mohsen, H.; Sacre, Y.; Hanna-Wakim, L.; Hoteit, M. Nutrition and Food Literacy in the MENA Region: A Review to Inform Nutrition Research and Policy Makers. Int. J. Environ. Res. Public. Health 2022, 19. [Google Scholar] [CrossRef] [PubMed]
- Chatzinikola, C.; Papavasileiou, V. Health Literacy, Nutrition Literacy, and Food Literacy in the Context of the Social and Cultural Dimension of Sustainability. In Biodiversity, social and cultural diversity; Athens, 2021. [Google Scholar]
- Mourouti, N.; Michou, M.; Lionis, C.; Kalagia, P.; Ioannidis, A.G.; Kaloidas, M.; Costarelli, V. An Educational Intervention to Improve Health and Nutrition Literacy in Hypertensive Patients in Greece. J. Educ. Health Promot. 2023, 12. [Google Scholar]
- Michou, M.; Panagiotakos, D.B.; Lionis, C.; Costarelli, V. Health and Nutrition Literacy in Adults: Links with Lifestyle Factors and Obesity. Mediterr. J. Nutr. Metab. 2020, 13, 361–370. [Google Scholar] [CrossRef]
- Costarelli, V.; Michou, M.; Panagiotakos, D.B.; Lionis, C. Parental Health Literacy and Nutrition Literacy Affect Child Feeding Practices: A Cross-Sectional Study. Nutr. Health 2022, 28, 59–68. [Google Scholar] [CrossRef]
- Nelson, M.; Breda, J. School Food Research: Building the Evidence Base for Policy. Public Health Nutr. 2013, 16, 958–967. [Google Scholar] [CrossRef]
- Hawkins, M.; Watts, E.; Belson, S.I.; Snelling, A. Design and Implementation of a 5-Year School-Based Nutrition Education Intervention. J. Nutr. Educ. Behav. 2020, 52, 421–428. [Google Scholar] [CrossRef]
- Singhal, J.; Herd, C.; Adab, P.; Pallan, M. Effectiveness of School-Based Interventions to Prevent Obesity among Children Aged 4 to 12 Years Old in Middle-Income Countries: A Systematic Review and Meta-Analysis. Obes. Rev. 2021, 22, e13105. [Google Scholar] [CrossRef]
- Manios, Y.; Moschandreas, J.; Hatzis, C.; Kafatos, A. Evaluation of a Health and Nutrition Education Program in Primary School Children of Crete over a Three-Year Period. Prev. Med. 1999, 28, 149–159. [Google Scholar] [CrossRef] [PubMed]
- Chatzinikola, C.; Papavasileiou, V. Educational Policy of Nutrition in Preschool Age: Comparative Analysis of Greece, USA and Sweden.; Patra, November 1 2019.
- Hawkins, M.; Watts, E.; Belson, S.I.; Snelling, A. Design and Implementation of a 5-Year School-Based Nutrition Education Intervention. J. Nutr. Educ. Behav. 2020, 52, 421–428. [Google Scholar] [CrossRef] [PubMed]
- Snelling, A.; Ernst, J.; irvine belson, S. Teachers as Role Models in Solving Childhood Obesity. J. Pediatr. Biochem. 2016, 03, 055–060. [Google Scholar] [CrossRef]
- Snelling, A.; Hawkins, M.; McClave, R.; Irvine Belson, S. The Role of Teachers in Addressing Childhood Obesity: A School-Based Approach. Nutrients 2023, 15. [Google Scholar] [CrossRef]
- Elfil, M.; Negida, A. Sampling Methods in Clinical Research; an Educational Review. Emerg. Tehran Iran 2017, 5, e52. [Google Scholar]
- Sudershan, A.; Mahajan, K.; Panjaliya, R.K.; Dhar, M.K.; Kumar, P. Algorithm for Sample Availability Prediction in a Hospital-Based Epidemiological Study Spreadsheet-Based Sample Availability Calculator. Sci. Rep. 2022, 12, 1860. [Google Scholar] [CrossRef]
- Hemming, K.; Taljaard, M.; Moerbeek, M.; Forbes, A. Contamination: How Much Can an Individually Randomized Trial Tolerate? Stat. Med. 2021, 40, 3329–3351. [Google Scholar] [CrossRef]
- Killip, S.; Mahfoud, Z.; Pearce, K. What Is an Intracluster Correlation Coefficient? Crucial Concepts for Primary Care Researchers. Ann. Fam. Med. 2004, 2, 204–208. [Google Scholar] [CrossRef]
- Noordzij, M.; Tripepi, G.; Dekker, F.W.; Zoccali, C.; Tanck, M.W.; Jager, K.J. Sample Size Calculations: Basic Principles and Common Pitfalls. Nephrol. Dial. Transplant. Off. Publ. Eur. Dial. Transpl. Assoc. - Eur. Ren. Assoc. 2010, 25, 1388–1393. [Google Scholar] [CrossRef]
- Rutterford, C.; Copas, A.; Eldridge, S. Methods for Sample Size Determination in Cluster Randomized Trials. Int. J. Epidemiol. 2015, 44, 1051–1067. [Google Scholar] [CrossRef] [PubMed]
- Panagiotakos, D.B.; Pitsavos, C.; Stefanadis, C. Dietary Patterns: A Mediterranean Diet Score and Its Relation to Clinical and Biological Markers of Cardiovascular Disease Risk. Nutr. Metab. Cardiovasc. Dis. NMCD 2006, 16, 559–568. [Google Scholar] [CrossRef] [PubMed]
- Magriplis, E.; Panagiotakos, D.; Mitsopoulou, A.-V.; Karageorgou, D.; Bakogianni, I.; Dimakopoulos, I.; Micha, R.; Michas, G.; Chourdakis, M.; Chrousos, G.P.; et al. Prevalence of Hyperlipidaemia in Adults and Its Relation to the Mediterranean Diet: The Hellenic National Nutrition and Health Survey (HNNHS). Eur. J. Prev. Cardiol. 2019, 26, 1957–1967. [Google Scholar] [CrossRef] [PubMed]
- Panagiotakos, D.; Kalogeropoulos, N.; Pitsavos, C.; Roussinou, G.; Palliou, K.; Chrysohoou, C.; Stefanadis, C. Validation of the MedDietScore via the Determination of Plasma Fatty Acids. Int. J. Food Sci. Nutr. 2009, 60 Suppl 5, 168–180. [Google Scholar] [CrossRef]
- Panagiotakos, D.B.; Pitsavos, C.; Arvaniti, F.; Stefanadis, C. Adherence to the Mediterranean Food Pattern Predicts the Prevalence of Hypertension, Hypercholesterolemia, Diabetes and Obesity, among Healthy Adults; the Accuracy of the MedDietScore. Prev. Med. 2007, 44, 335–340. [Google Scholar] [CrossRef]
- Zaragoza-Martí, A.; Cabañero-Martínez, M.; Hurtado-Sánchez, J.; Laguna-Pérez, A.; Ferrer-Cascales, R. Evaluation of Mediterranean Diet Adherence Scores: A Systematic Review. BMJ Open 2018, 8, e019033. [Google Scholar] [CrossRef]
- Diamond, J.J. Development of a Reliable and Construct Valid Measure of Nutritional Literacy in Adults. Nutr. J. 2007, 6, 5. [Google Scholar] [CrossRef]
- Michou, M.; Panagiotakos, D.B.; Mamalaki, E.; Yannakoulia, M.; Costarelli, V. Development and Validation of the Greek Version of the Comprehensive Parental Feeding Questionnaire. Mediterr. J. Nutr. Metab. 2019, 12, 211–221. [Google Scholar] [CrossRef]
- Sampaio, H.; Ferreira Carioca, A.A.; Sabry, S.D.; Sabry, M.O.D.; Pinto, F.; Ellery, T. Assessment of Nutrition Literacy by Two Diagnostic Methods in a Brazilian Sample. Nutr. Clin. Diet. Hosp. 2014, 34, 50–55. [Google Scholar] [CrossRef]
- Michou, M.; Costarelli, D.; Panagiotakos, D. Socioeconomic Inequalities in Relation to Health and Nutrition Literacy in Greece. Int. J. Food Sci. Nutr. (in press). 2019. [Google Scholar] [CrossRef]
- Michou, M.; Panagiotakos, D.; Lionis, C.; Petelos, E.; Costarelli, V. Health & Nutrition Literacy Levels in Greek Adults with Chronic Disease. WHO Reg. Publ. Eur. Ser. Public Health Panorama, in press. 2019. [Google Scholar]
- Aureli, V.; Rossi, L. Nutrition Knowledge as a Driver of Adherence to the Mediterranean Diet in Italy. Front. Nutr. 2022, 9, 804865. [Google Scholar] [CrossRef]
- Velpini, B.; Vaccaro, G.; Vettori, V.; Lorini, C.; Bonaccorsi, G. What Is the Impact of Nutrition Literacy Interventions on Children’s Food Habits and Nutrition Security? A Scoping Review of the Literature. Int. J. Environ. Res. Public. Health 2022, 19. [Google Scholar] [CrossRef]
- Liu, H.; Xu, X.; Liu, D.; Rao, Y.; Reis, C.; Sharma, M.; Yuan, J.; Chen, Y.; Zhao, Y. Nutrition-Related Knowledge, Attitudes, and Practices (KAP) among Kindergarten Teachers in Chongqing, China: A Cross-Sectional Survey. Int. J. Environ. Res. Public. Health 2018, 15. [Google Scholar] [CrossRef]
- Katsagoni, C.N.; Apostolou, A.; Georgoulis, M.; Psarra, G.; Bathrellou, E.; Filippou, C.; Panagiotakos, D.B.; Sidossis, L.S. Schoolteachers’ Nutrition Knowledge, Beliefs, and Attitudes Before and After an E-Learning Program. J. Nutr. Educ. Behav. 2019, 51, 1088–1098. [Google Scholar] [CrossRef]
- Cullerton, K.; Vidgen, H.A.; Gallegos, D. A Review of Food Literacy Interventions Targeting Disadvantaged Young People.; 2012.
- Kawasaki, Y.; Akamatsu, R. Appreciation for Food, an Important Concept in Mindful Eating: Association with Home and School Education, Attitude, Behavior, and Health Status in Japanese Elementary School Children. Glob. Health Promot. 2020, 27, 140–149. [Google Scholar] [CrossRef] [PubMed]
- Lorca-Camara, V.; Bosque-Prous, M.; Bes-Rastrollo, M.; O’Callaghan-Gordo, C.; Bach-Faig, A. Environmental and Health Sustainability of the Mediterranean Diet: A Systematic Review. Adv. Nutr. Bethesda Md 2024, 15, 100322. [Google Scholar] [CrossRef]
- IEP NEW SCHOOL (21st Century School) – New Curriculum Subproject 1, Development of Compulsory Education Curricula", Scientific Field: Early School Age, Kindergarten Curriculum: Athens 2014.
- Snelling, A.; Hawkins, M.; McClave, R.; Irvine Belson, S. The Role of Teachers in Addressing Childhood Obesity: A School-Based Approach. Nutrients 2023, 15. [Google Scholar] [CrossRef]
- Project Scientific Supervisor: Athina Linou National Dietary Guide for Infants, Children, and Adolescents; Prolepsis – Institute of Preventive, Environmental and Occupational Medicine, 2014.
- Ministerial Decision F.31/94185/D1, 29-7-2021, Skill Labs in Primary Education, in Government Gazette, 3791/Β/13-8-2021.
- Amahmid, O.; Guamri, Y.; Rakibi, Y.; Mohamed, Y.; Bouchra, R.; Rassou, K.; Boukaoui, S.; Izerg, O.; Belghyti, D. Nutrition Education in School Curriculum: Impact on Adolescents’ Attitudes and Dietary Behaviours. Int. J. Health Promot. Educ. 2019, 1–17. [Google Scholar] [CrossRef]
- Medeiros, G.C.B.S. de; Azevedo, K.P.M. de; Garcia, D.; Oliveira Segundo, V.H.; Mata, Á.N. de S.; Fernandes, A.K.P.; Santos, R.P.D.; Trindade, D.D.B. de B.; Moreno, I.M.; Guillén Martínez, D.; et al. Effect of School-Based Food and Nutrition Education Interventions on the Food Consumption of Adolescents: A Systematic Review and Meta-Analysis. Int. J. Environ. Res. Public. Health 2022, 19. [Google Scholar] [CrossRef]
- Krause, C.; Sommerhalder, K.; Beer-Borst, S.; Abel, T. Just a Subtle Difference? Findings from a Systematic Review on Definitions of Nutrition Literacy and Food Literacy. Health Promot. Int. 2018, 33, 378–389. [Google Scholar] [CrossRef] [PubMed]
- Vidgen, H.A.; Gallegos, D. Defining Food Literacy and Its Components. Appetite 2014, 76, 50–59. [Google Scholar] [CrossRef]
- Krause, C.; Sommerhalder, K.; Beer-Borst, S.; Abel, T. Just a Subtle Difference? Findings from a Systematic Review on Definitions of Nutrition Literacy and Food Literacy. Health Promot. Int. 2018, 33, 378–389. [Google Scholar] [CrossRef] [PubMed]
- Abeliotis, K.; Lasaridi, K.; Costarelli, V.; Chroni, C. The Implications of Food Waste Generation on Climate Change: The Case of Greece. Sustain. Prod. Consum. 2015, 3, 8–14. [Google Scholar] [CrossRef]
- Theodoridis, P.; Zacharatos, T.; Boukouvala, V. Consumer Behaviour and Household Food Waste in Greece. Br. Food J. 2024, 126, 965–994. [Google Scholar] [CrossRef]
- United Nations Environment Programme Food Waste Index Report 2021; Nairobi, 2021.
- Aloysius, N.; Ananda, J.; Mitsis, A.; Pearson, D. Why People Are Bad at Leftover Food Management? A Systematic Literature Review and a Framework to Analyze Household Leftover Food Waste Generation Behavior. Appetite 2023, 186, 106577. [Google Scholar] [CrossRef]
- Ponis, S.T.; Papanikolaou, P.-A.; Katimertzoglou, P.; Ntalla, A.C.; A.C., *!!! REPLACE !!!*; Xenos Konstantinos, I. Household Food Waste in Greece: A Questionnaire Survey. J. Clean. Prod. 2017, 149, 1268–1277. [Google Scholar] [CrossRef]
- Liz Martins, M.; Rodrigues, S.S.P.; Cunha, L.M.; Rocha, A. Factors Influencing Food Waste during Lunch of Fourth-Grade School Children. Waste Manag. 2020, 113, 439–446. [Google Scholar] [CrossRef]
- United Nations Environment Programme Food Waste Index Report 2021. 2021.
- Buzby, J.; Wells, H.; Hyman, J. The Estimated Amount, Value, and Calories of Postharvest Food Losses at the Retail and Consumer Levels in the United States. SSRN Electron. J. 2014. [Google Scholar] [CrossRef]
- Aloysius, N.; Ananda, J.; Mitsis, A.; Pearson, D. Why People Are Bad at Leftover Food Management? A Systematic Literature Review and a Framework to Analyze Household Leftover Food Waste Generation Behavior. Appetite 2023, 186, 106577. [Google Scholar] [CrossRef]
- De Laurentiis, V.; Corrado, S.; Sala, S. Quantifying Household Waste of Fresh Fruit and Vegetables in the EU. Waste Manag. 2018, 77, 238–251. [Google Scholar] [CrossRef] [PubMed]
- Jeswani, H.K.; Figueroa-Torres, G.; Azapagic, A. The Extent of Food Waste Generation in the UK and Its Environmental Impacts. Sustain. Prod. Consum. 2021, 26, 532–547. [Google Scholar] [CrossRef]
- Hachem, F.; Capone, R.; Yannakoulia, M.; Dernini, S.; Hwalla, N.; Kalaitzidis, C. The Mediterranean Diet: A Sustainable Consumption Pattern. In Zero waste in the Mediterranean Natural Resources, Food and Knowledge; Paris, 2016. [Google Scholar]
- UNESCO Representative List of the Intangible Cultural Heritage of Humanity; Baku, 2013.
- Allison, C.; Colby, S.; Opoku-Acheampong, A.; Kidd, T.; Kattelmann, K.; Olfert, M.D.; Zhou, W. Accuracy of Self-Reported BMI Using Objective Measurement in High School Students. J. Nutr. Sci. 2020, 9, e35. [Google Scholar] [CrossRef] [PubMed]
Figure 2.
Scatter plot associating NLS-Gr and MedDiet score.
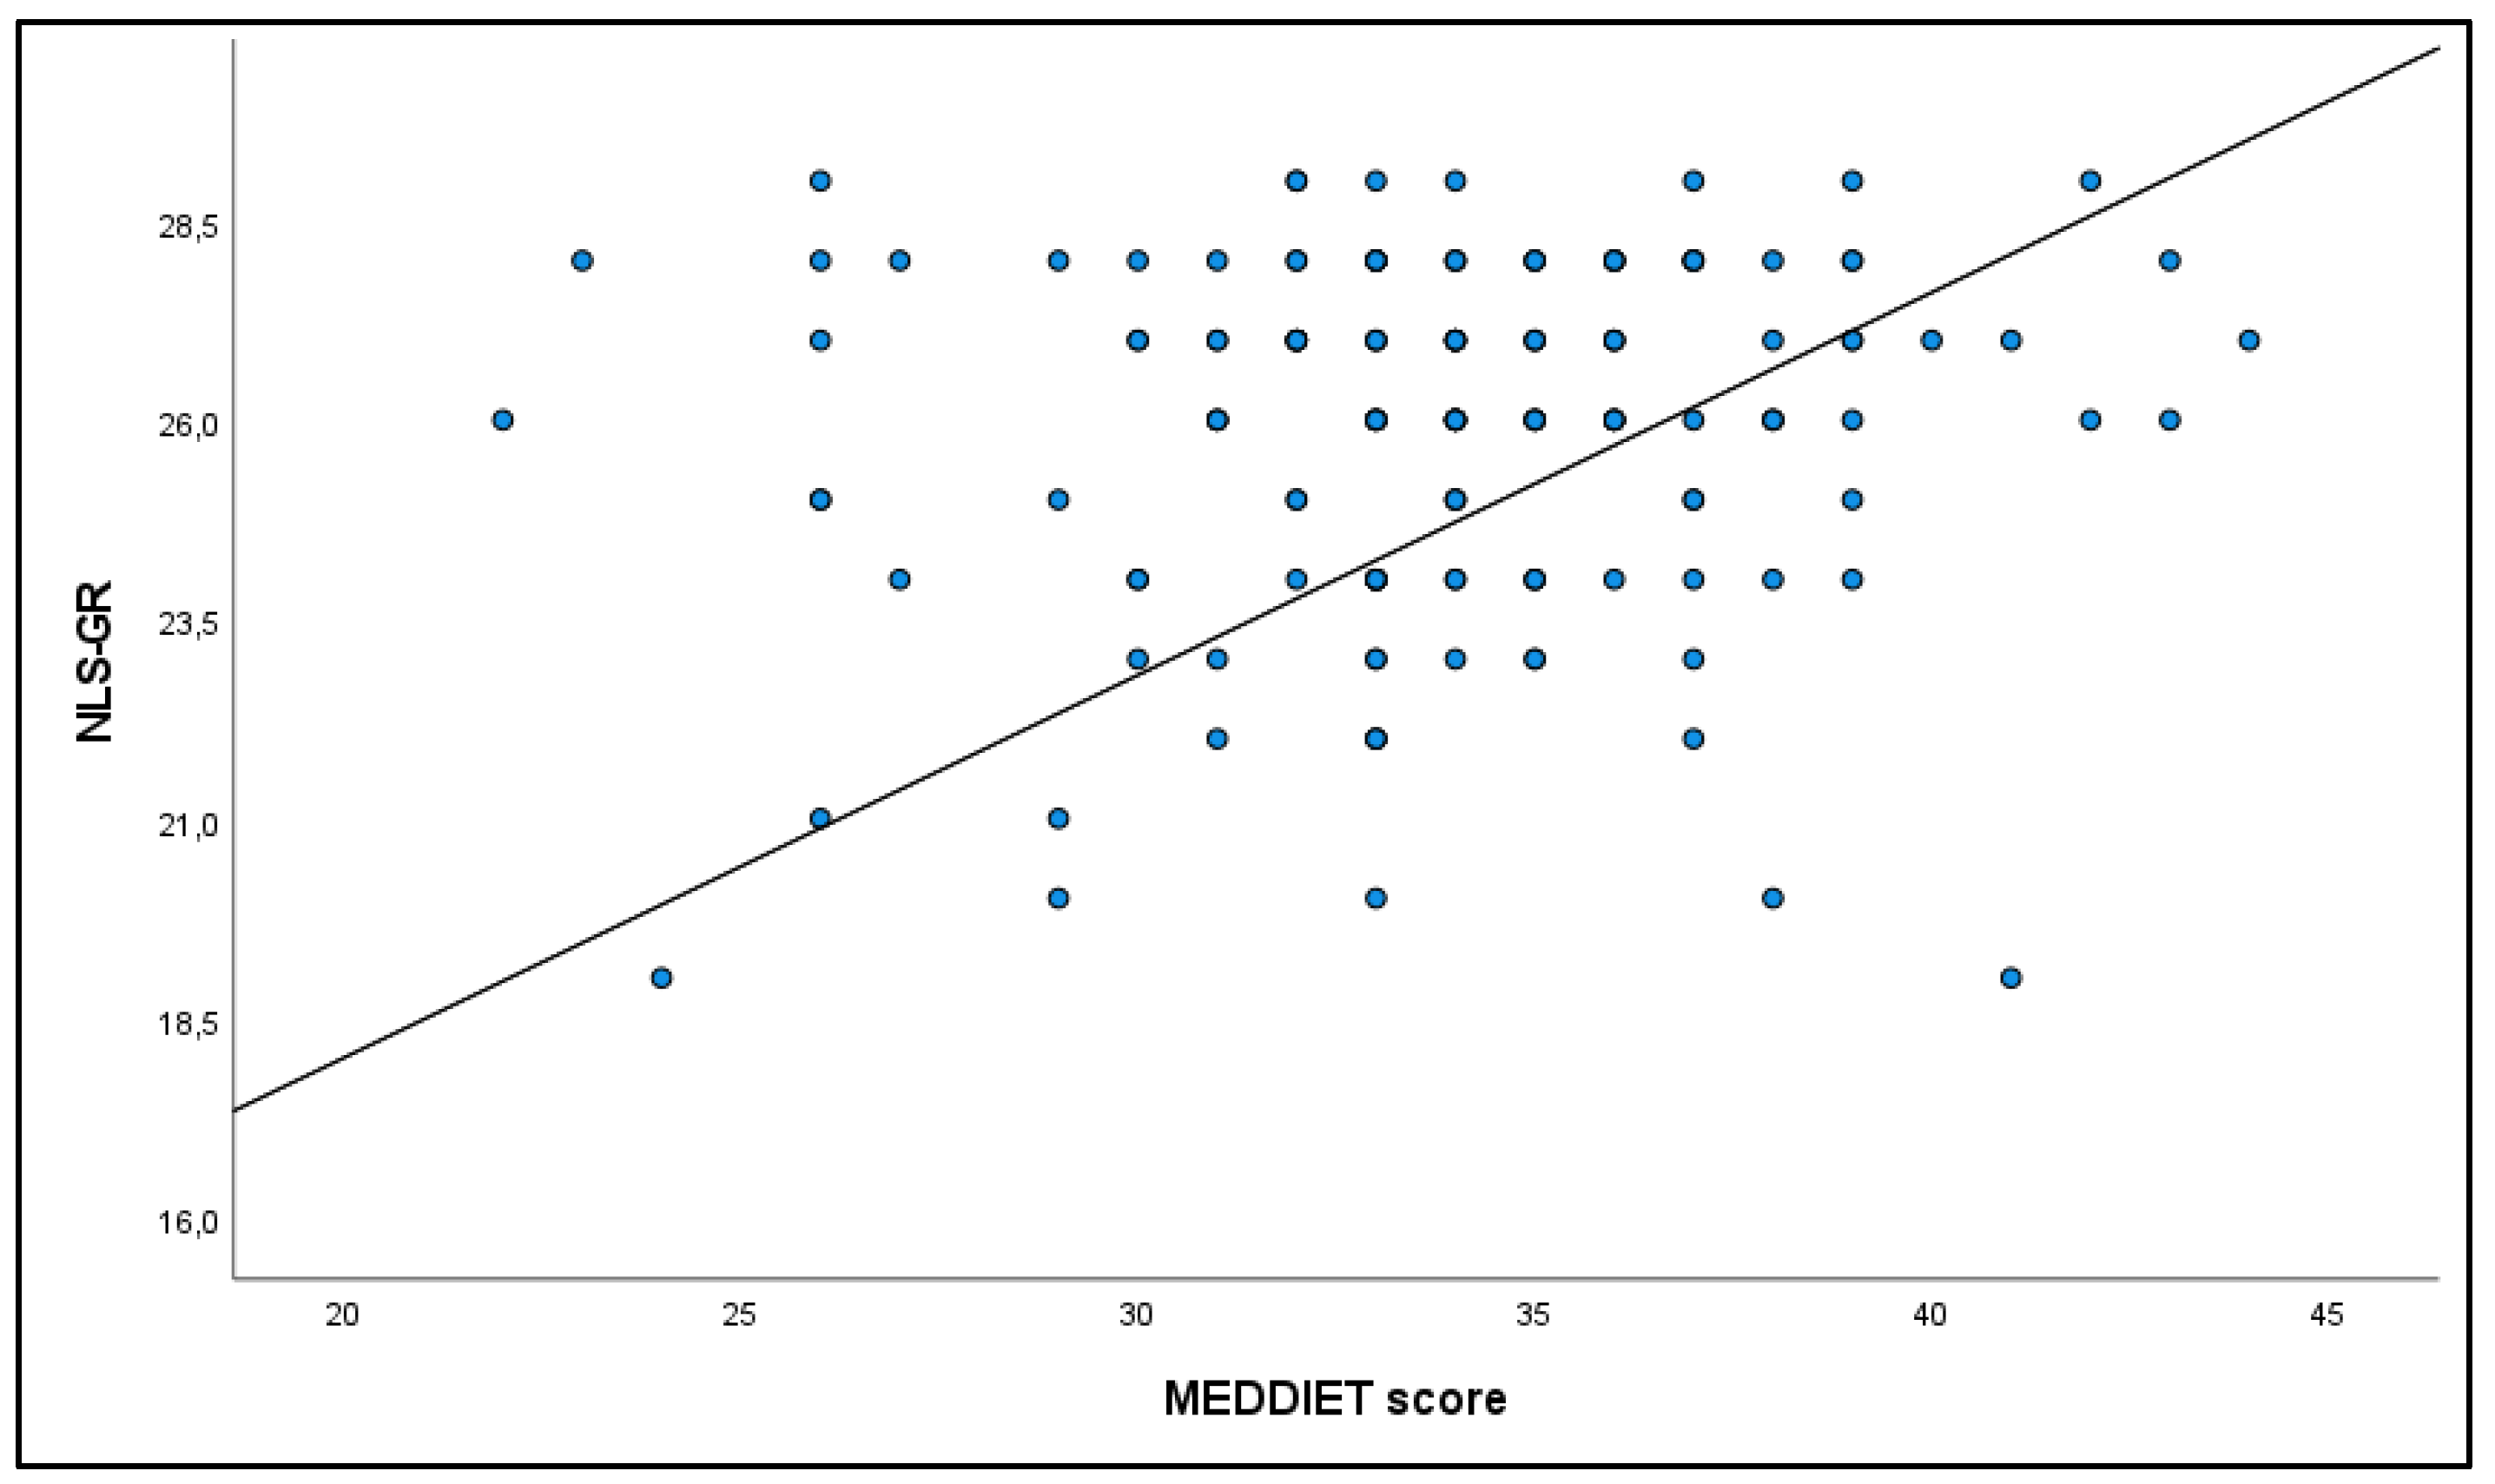
Table 2.
Items of the Greek NLS by percentage answered correctly.
| Correct answers of the Greek NLS by percentage | N (%) |
| Healthy eating is really supposed to help our hearts. | 146 (98.0) |
| However, no single food can supply all the nutrients we need. | 114 (76.5) |
| Eating a variety of foods ensures you get all the nutrients needed for good health. | 145 (97.3) |
| Grains, fruits, and vegetables are food groups that form the basis of a healthy diet. | 98 (65.8) |
| For a healthy diet, we are advised to eat five servings of fruits | 137 (91.9) |
| and vegetables each day. | 143 (96.0) |
| Foods like butter have a lot of saturated fat, which can increase cholesterol. | 145 (97.3) |
| We also know that cholesterol can be affected by foods high in trans fatty acids. | 125 (83.9) |
| Experts often say to avoid foods high in trans fatty acids | 147 (98.7) |
| because they are fattening. | 147 (98.7) |
| Obesity increases the risk of diseases such as diabetes. | 146 (98.0) |
| Fiber is the part of plant-based foods that your body does not digest and absorb. | 142 (95.3) |
| Whole grains provide more fiber than processed grains. | 133 (89.3) |
| A good diet should contain approximately 25–30 grams of fiber a day. | 131 (87.9) |
| Calcium is essential for bone health | 149 (100.0) |
| As you age, your bones may get thinner as minerals are lost. | 106 (71.1) |
| Even in older people, vitamin D is needed to keep bones healthy. | 148 (99.3) |
| Foods with added sugars are sometimes called foods with empty calories. | 97 (65.1) |
| To prevent illness from bacteria | 124 (83.2) |
| keep eggs in the refrigerator. | 147 (98.7) |
| Farmers who grow organic foods don’t use conventional methods. | 137 (91.9) |
| They control weeds by techniques such as crop rotation rather than pesticides. | 135 (90.6) |
| For this and other reasons, organic food costs more than conventional food. | 118 (79.2) |
| A 180-calorie serving with 10 grams of fat has 50% of its calories from fat. | 148 (99.3) |
| A 140-pound (64 kg) woman needs about 51 grams of protein daily. | 143 (96.0) |
| Using fat-free mayonnaise on a sandwich can reduce the grams of fat. | 107 (71.8) |
| My doctor told me that “fat-free” is not the same as calorie-free. | 138 (92.6) |
| She also told me to make the size of my portions smaller | 132 (88.6) |
| to help control my weight. | 127 (85.2) |
Table 3.
Correlation between NLS-Gr score with income, professional experience, level of education.
| Nutrition literacy /NLS-Gr | ||
| Median (Q1-Q3) | p-value | |
| Educational level | 0.925 | |
| University Degree (BSc) | 26 (24-28) | |
| Postgraduate Student | 26 (24-27) | |
| Postgraduate Degree Holder | 26 (24-27) | |
| PhD Candidate & Doctorate Holder | 26.5 (24.5-28) | |
| Years of Teaching Experience | ||
| ≤1 | 25.5 (24-27) | 0.192 |
| 1-10 | 26 (24-27) | |
| 11-15 | 27 (26-27) | |
| 16-20 | 27 (24.5-28) | |
| >20 | 26 (25.3-28) | |
| Classification Based on BMI, N (%) | ||
| Underweight | 24.5 (24-27) | 0.227 |
| Normal Weight | 26.0 (24.3-27) | |
| Overweight | 27 (25.3-28) | |
| Obese | 26 (24-27) | |
| Net Annual Family Income | ||
| <10.000 € | 25 (23.5-27) | 0.048* |
| 10.001-20.000 € | 27 (25-28) | |
| 20.001-30.000 € | 26 (24-28) | |
| >30.000 € | 26 (26-27.5) |
*Statistical significance p<0.05.
Table 4.
Correlation between NLS-Gr score with food choices and food waste.
| Nutrition literacy/NLS-Gr | ||
| Median (Q1-Q3) | p-value | |
| Meal Planning | 0.017* | |
| No | 25.5 (24-27) | |
| Yes | 27 (25-28) | |
| Shopping List | 0.976 | |
| No | 26.5 (24.0-27.8) | |
| Yes | 26 (24-28) | |
| Storage of fruits and vegetables in the refrigerator | 0.438 | |
| No | 25.5 (24.0-27.3) | |
| Yes | 26 (24-28) | |
| Food disposal | 0.167 | |
| never or almost never | 27 (25-28) | |
| rarely (a few times a year) | 26 (24-27) | |
| sometimes (a few times a month) | 27 (24-28) | |
| often (a few times a week) | 26 (23.3-27.0) | |
| always (daily) - | - | |
| Organic food consumption | 0.525 | |
| No | 26 (24.0-27.5) | |
| Yes | 26.5 (24-28) | |
| Composting food waste | 0.359 | |
| No | 26 (24-28) | |
| Yes | 26 (23.5-27.0) |
* p-value<0.05.
Table 5.
Correlation between NLS-Gr score and Meddiet score.
| rs | p-value* | |
| Spearman’s correlation coefficient | 0.1 (-0.1, 0.3) | 0.202 |
* p-value<0.05.
Table 6.
Nutrition Literacy (NLS-Gr) of Kindergarten Teachers by Educational Level.
| Spearman | rs (95% CI) | p-value |
| BMI – NLS-Gr | 0.03 (-0.1, 0.2) | 0.764 |
Table 7.
Nutrition Literacy (NLS-Gr) of Kindergarten Teachers and Body Weight Categories.
|
NLS-Gr, median (Q1-Q3) |
Underweight | Normal | Overweight | Obese | p-value* |
| 24.5 (24-27) | 26 (24.3-27.0) | 27 (25.3-28) | 26 (24-27) | 0.227 |
* p-value<0.05.
Table 8.
Meddiet score association with physical activity/sedentary lifestyle.
| Physical activity & Sedentary lifestyle | |||
|
MedDiet score, Frequency of consumption/week rs (95% CI) p-value |
Sedentary lifestyle (hours, weekdays) | Sedentary lifestyle (hours weekends) | Average exercise /per day |
| whole grains | 0.9 (0.8,0.9) <0.001 |
0.0 (-0.1,0.2) 0.639 |
0.2 (0.1,0.4) 0.009 |
|
potatoes |
0.0 (-0.1,0.2) 0.780 |
0.0 (-0.2,0.2) 0.798 |
0 (-0.2,0.2) 0.933 |
|
fruits |
0.3 (0.1,0.4) 0.002 |
-0.1 (-0.3,0.1) 0.171 |
0.2 (0.1,0.4) 0.009 |
|
vegetables |
0.3 (0.2,0.5) <0.001 |
-0.1 (-0.3,0.1) 0.313 |
0.1 (0.0,0.3) 0.087 |
|
legumes |
0.1 (0.0,0.3) 0.093 |
0.0 (-0.2,0.2) 0.861 |
0.1 (0.0,0.3) 0.105 |
|
fish and seafood |
0.1 (-0.1,0.3) 0.181 |
-0.1 (-0.3,0.0) 0.083 |
0.2 (0.0,0.3) 0.067 |
|
red meat and meat products |
0.2 (0.0,0.3) 0.064 |
-0.1 (-0.2,0.1) 0.502 |
0.2 (0.0,0.3) 0.055 |
|
poultry |
0.0 (-0.1,0.2) 0.655 |
0.0 (-0.1,0.2) 0.597 |
-0.1 (-0.3,0.1) 0.210 |
|
diary full fat |
-0.2 (-0.3,0.0) 0.026 |
-0.2 (-0.3,0.0) 0.068 |
-0.2 (-0.3,0.0) 0.078 |
|
olive oil |
-0.2 (-0.3, -0.02) 0.025 |
0.1 (-0.1,0.2) 0.307 |
0.0 (-0.2,0.2) 0.868 |
|
alcohol |
-0.1(-0.3,0.1) 0.291 |
0.0 (-0.2,0.1) 0.679 |
-0.2 (-0.3,0.0) 0.057 |
Disclaimer/Publisher’s Note: The statements, opinions and data contained in all publications are solely those of the individual author(s) and contributor(s) and not of MDPI and/or the editor(s). MDPI and/or the editor(s) disclaim responsibility for any injury to people or property resulting from any ideas, methods, instructions or products referred to in the content. |
© 2025 by the authors. Licensee MDPI, Basel, Switzerland. This article is an open access article distributed under the terms and conditions of the Creative Commons Attribution (CC BY) license (http://creativecommons.org/licenses/by/4.0/).
Copyright: This open access article is published under a Creative Commons CC BY 4.0 license, which permit the free download, distribution, and reuse, provided that the author and preprint are cited in any reuse.


