
Submitted:
13 March 2025
Posted:
14 March 2025
You are already at the latest version
Abstract
This study focuses on the development and characterization of biodegradable polymer composite materials with a polypropylene (PP) matrix and hybrid fillers. The fillers incorporated into these composites consisted of a blend of fibers and particles derived from natural, biodegradable materials, such as flax fibers (FF) and wood flour (WF) particles. The compositions of polymer material were expressed as PP/FF/WF weight ratios of 100/0/0, 70/5/25, and 70/10/20. The polymer materials were prepared using conventional plastic processing methods like extrusion to produce composite mixtures, followed by melt injection to manufacture the samples needed for characterization. The structural characterization of the polymer materials was conducted using optical microscopy and X-ray diffraction (XRD) analyses, while thermal, mechanical, and dielectric properties were also evaluated. Additionally, their biodegradation behavior under mould exposure was assessed over six months. The results were analyzed comparatively, and the optimal composition was identified as the polymer composite containing the highest flax fiber content, namely PP + 10% flax fiber + 20% wood flour.
Keywords:
polypropylene
; wood flour
; flax fibers
; hybrid fillers
; biodegradable polymer composites
1. Introduction
A new approach to polymer composite materials is the hybrid filler, consisting of at least two types of fillers, either both in particle form or fibers, or a combination of particles and fibers. Hybrid composites exhibit superior physical, mechanical, and thermal properties compared to composites with a single type of filler due to the optimization and synergy between the two types of fillers. Additionally, they offer economic advantages, as some fillers can be very expensive [1,2,3,4,5,6]. These hybrid polymer composites have potential applications in furniture manufacturing, various automotive industry components, construction elements, and other commercial applications [1], due to their excellent recoverability and biodegradability properties.
Hybrid polymer composites with natural fiber fillers have gained significant attention as a more sustainable alternative to polymer composites with single fillers [6]. However, a major challenge in manufacturing these composites is the incompatibility between hydrophilic natural fibers (due to hydroxyl groups in cellulose) and the hydrophobic polymer matrix [7]. This incompatibility results in weak interfacial adhesion and reduced mechanical strength, which is a major disadvantage of these composites [8]. To address this incompatibility, chemical, physical, biological, and nanotechnology-based fiber treatment methods have been explored to enhance filler adhesion to the polymer matrix. Various researchers have studied filler adhesion by treating polypropylene-based composites with fiber fillers using alkali treatments [9], as well as through other advanced methods and studies [10,11].
The compatibilization process introduces a third component that acts as a coupling agent, eliminating incompatibility by improving adhesion between the filler and the matrix. The Palsule process [12] addresses this incompatibility by using a functionalized polymer that reacts with the hydroxyl groups present in natural fibers. The processes researched by Palsule are based on polyethylene functionalized with glycidyl methacrylate and polyethylene functionalized with maleic anhydride by grafting [13,14,15,16,17]. These polymer materials have cutting-edge applications across various industries, particularly in the automotive sector [18,19,20].
In this study, polypropylene/flax fiber/wood flour polymer composites were obtained and characterized to determine the optimal formulation in terms of performance, in accordance with the chosen application.
Polypropylene was chosen as the polymer matrix for these composites due to its superior ignition resistance and lower density, which allows for the incorporation of various types of fillers. Flax, a flowering plant from the Linaceae family, is highly versatile, requires minimal care, and can be cultivated in temperate climates, reaching maturity in approximately 100 days [19]. The plant has remarkable applications across multiple industries, including food, pharmaceuticals, textiles, and, in recent years, the production of various biodegradable composites [21]. Materials filled with flax fibers have been used by the automotive industry due to their advantages in terms of strength and low densities, which lead to fuel consumption savings. Another major advantage of using natural fibers in the composition of polymer composite materials for the automotive industry is that, upon impact, they break rather than splinter, as is the case with composites reinforced with glass fibers [22,23,24].
Following structural, thermal, mechanical, and dielectric characterizations, along with assessing the biodegradation behavior under mould exposure over six months, the optimal polymer composite was selected as the one with the highest flax fiber content, specifically PP + 10% flax fiber + 20% wood flour.
2. Materials and Methods
2.1. Materials
The raw materials used for the production of polymer composites are as follows:
- polypropylene homopolymer PP J700 TEHNOLEN supplied by MONOFIL SRL, Piatra Neamț, Romania. The characteristics of the PP used are presented in Table 1.
- wood powder, obtained from industrial waste, specifically beech, poplar, and pine wood residues. These waste materials were dried at 40°C, ground, and sieved to achieve a particle size of up to 200 μm;
- flax fibers (MONOFIL SRL, Piatra Neamț, Romania) with an outer diameter of about 10-30 μm, a density of 1.4 ± 0.1 g/cm³, a modulus of elasticity of 60 ± 3 GPa, a tensile strength of 1.2 ± 0.2 GPa, and an elongation at fracture of 2.5 ± 0.5%.

Table 1.
Main properties of the PP J700 TEHNOLEN polymer.
| Properties | Value | Unit | Determination method |
| Melt flow index (230°C, 2.16 kg) | 9.96 | g/10 min | SR EN ISO 1133-1:2022 B [25] |
| Density (23°C) | 0.905 | g/cm3 | SR EN ISO 1183-1:2019 [26] |
| Vicat softening temperature – load 50 N |
163 | °C | SR EN ISO 306:2023 [27] |
| Tensile flow strength | 39.5 | MPa | SR EN ISO 527-1:2020 [28] SR EN ISO 527-2:2012 [29] |
| Tensile breaking strength | 25.6 | MPa | |
| Tensile elongation at break | 10.52 | % | |
| Tensile modulus of elasticity | 1923.73 | MPa | |
| Maximum flexural stress | 53 | MPa | SR EN ISO 14125:2000/AC:2003 [30] |
| Flexural modulus | 1782.3 | MPa | SR EN ISO 178:2019 [31] |
2.2. Methods and Equipment
2.2.1. Obtaining Polymer Composite Materials
The polymer composite materials were obtained in two stages: first, composite pellets were produced by extrusion using a twin screw extruder of EC52 type (Useon Technology Ltd., Jurong, China) with an L/D ratio of 40, a screw diameter of 51.4 mm, the maximum screw speed of 600 rpm, the main motor power of 55 kW, and nine heating zones. The processing temperatures on the extruder ranged between 220°C and 240°C. After extrusion, the composites were cooled in a water bath, forming the composite strand, which was then pelletized into cylindrical form with a diameter × height of 3 mm × 3 mm and dried for 2-4 hours at 80°C in a Memmert UNE 500 oven (Schwabach, Germany) with air circulation. For obtaining the required test specimens, an injection molding machine of MI TP 100/50 type (SC IMATEX, Târgu Mureş, Romania) was used, with a screw diameter of 35 mm, a melting capacity of 96 cm³, an injection pressure of 100-120 MPa, and 4 heating zones (three on the barrel and one on the injection nozzle).
The materials studied in this paper are presented in Table 2.
2.2.2. Characterization Methods
2.2.2.1. Optical Microscopy
The aspects regarding the structure of the polymer materials studied were highlighted using images obtained with a Carl Zeiss NU 2 optical microscope (Jena, Germany), at a magnification of 200× for the material M1 (PP) and 500× for the composite materials M1 and M2.
2.2.2.2. X-Ray Diffraction (XRD) Analysis
For the XRD analysis, a Bruker-AXS D8 ADVANCE X-ray diffractometer (Karlsruhe, Germany) was used, featuring a copper (Cu)-anode X-ray tube with Cu Kα radiation (wavelength of 1.5406 Å), applied voltage/current intensity of 40 kV/40 mA, nickel (Ni) Kβ filter, step size of 0.04°, measurement time per point of 2 seconds, and a 2θ measurement range of 2°–60°.
2.2.2.3. Thermal Analysis
Thermal analysis with coupled techniques (TG-DTA-DSC) was performed using a Netzsch STA 409 PC Luxx simultaneous thermal analyzer (Gerätebau GmbH, Germany). The recording conditions were as follows: temperature range of 25°C → 700°C, static air atmosphere, heating rate of 10 K/min, and Pt-Rh crucible.
2.2.2.4. Density
The density was determined using Archimedes' principle with a Mettler Toledo XS204 analytical balance (Greifensee, Switzerland) and a density kit, according to standard SR EN ISO 1183-1:2019 [26]. The measurements were performed in triplicate, in water, at a temperature of 22°C, and the arithmetic mean and standard deviation (SD) values were reported.
2.2.2.5. Mechanical Tests
Vickers microhardness determination was performed using a microhardness tester, FM 700 Ahotec, Germany, with a Vickers diamond indenter. All the indentations were performed with a force of 0.05 kgf and dwell time of 10 seconds. Ten measurements were taken for each sample, according to standard SR EN ISO 6507-1:2023, method A [32]. The minimum and maximum hardness values were removed, and from the remaining eight measurements, the arithmetic mean and standard deviation (SD) values were reported.
Determination of the flexural strength by three-point bending was conducted on a Zwick TR FR 005 TN (Germany) mechanical testing machine, with three specimens of each type of polymer material (PP and composite), using a nominal force of 5 kN and a crosshead speed of 1 mm/min in accordance with SR EN ISO 178:2019 standard [31].
2.2.2.6. Dielectric Tests
The dielectric characteristics analyzed were volume resistivity (ρv) and surface resistivity (ρs). The tests were conducted on five disc-shaped samples of each type, in accordance with standards IEC 62631-3-1:2023 [33] and IEC 62631-3-2:2023 [34] using a Keithley 6517A electrometer (Cleveland, Ohio, USA), a A8009 measurement cell, a circular electrode system with a guard electrode setup, and a Dell laptop with Electrical Zoom software for data acquisition. The test voltage was 100 V, and the measurement time of 1 minute. The conditioning of the test samples before testing was performed for 24 hours at 90°C using a Memmert UNE 500 oven (Schwabach, Germany). Before the determination, the samples were short-circuited for 2 minutes. The environmental conditions during testing were: temperature of 22±3°C and relative humidity of 50±15%. A Caloris Monit-T/UR digital device (Bucharest, Romania) was used for measuring temperature and humidity.
2.2.2.7. Deterioration Tests due to the Action of Fungi
Determining the deterioration of polymer materials due to the action of fungi was performed on square-shaped samples with sides of about 6–8 mm and thicknesses of 0.75 mm. The samples studied were placed in an incubator, for a duration of 6 months, within a temperature range of 28–32°C and a humidity level of 90–95% [35]. Method B was chosen for testing according to standard SR EN ISO 846:2019 [36]. The test medium was Czapek-Dox medium with glucose as carbon source. The tested fungal strains were: Aspergillus niger, Aspergillus flavus, Aspergillus terreus, Aspergillus amstelodami, Penicillium ochro-chloron, Penicillium funiculosum, Paecilomyces variotii, Chaetomium globosum, Myrothecium verrucaria, Scopulariopsis brevicaulis, Stachybotrys atra, and Trichoderma viride.
Images of the polymer samples after biodegradation were captured using a 4× objective on the Nikon SMZ 1000 stereomicroscope with a magnification of 50×, along with a digital camera (included) Nikon D60x with a 60× macro lens.
3. Results
3.1. Optical Microscopy
The optical microscope images of the polymer materials studied are presented in Figure 1.
For the material M1 (Figure 1, (a)), surface scratches are observed due to the prior polishing of the sample subjected to analysis. The material is homogeneous, does not contain any fillers, since represents only the base PP polymer.
For the M2 and M3 polymer composites (Figure 1, (b), and (c)), the hybrid fillers are visible embedded in the polypropylene structure, showing an orange peel-like appearance. This appearance is due to the uneven shape of the fillers. It is also noted the presence of polyhedron-shape flax fibers as reported in the literature [37,38]. Elemental flax fibers feature a polygonal cross-section with smooth-edged corners and stratified walls enclosing a central hollow space known as the lumen [38].
The dark-colored spots in (Figure 1, (b), and (c)) are represented by the natural mixture of flax fibers and wood flour. The dark color of these spots, as well as that of the entire composites, is determined by the carbon black, which was added to reduce electrostatic charging. This material is homogeneous in continuity.
3.2. XRD Analysis
The diffraction patterns resulting from the X-ray diffraction analysis of the polymer materials studied are presented in Figure 2.
As a result of the XRD analysis, it was observed that:
- All the developed polymer materials contain crystalline phases characteristic of PP, including gamma-isotactic polypropylene (PDF reference card no. 00-0451807) and syndiotatic polypropylene (PDF reference card no. 00-049-2204).
- The PP polymer exhibits the highest peak intensities, whereas both polymer composites show lower peak intensities due to texturing effect introduced by the fillers (wood flour and flax fiber).
- Among the polymer composite materials with hybrid fillers, the M3 composite was found to have the highest proportion of ordered (crystalline) phases.
- All the polymer materials crystallize in an orthorhombic system, with crystallite sizes of 20.8 nm (M1), 19.2 nm (M2), and 23.2 nm (M3). The addition of natural fillers did not alter the structure of the PP polymer matrix.
3.3. Thermal Analysis
The temperature-dependent mass change (TG), the corresponding mass change rate (DTG), and the heat flow rate (DSC) curves, obtained from the thermal analysis of PP and polymer composites in static air, are presented in Figure 3.
In Figure 3, it can be observed that the polymer materials present similar thermograms. Upon inspecting these thermograms, it is noted that during the progressive heating of a polymer material, the following processes occur:
- Process I - Water loss occurs in the M2 and M3 polymer composite materials.
- Process II - Melting (Tmin DSC) occurs in all the analyzed polymer materials. It is noted that the M2 and M3 composites have a melting point close to that of polypropylene (M1). The minor differences between these melting points are attributed to the fillers used and probably the inhomogeneity of the samples.
- Process III – Thermal oxidation with the formation of solid products. During thermal oxidation, polymer materials react with oxygen, leading to the formation of hydroperoxides (-OOH) as primary degradation products [39]. The initial temperature of the first oxidation process (TIN) with the formation of solid hydroperoxides indicates the stability of the materials to oxidation. The stability to thermal oxidation increases as the initial temperature (TIN) of the process with the formation of solid hydroperoxides rises. The thermal stability increased with higher TIN in the following order: M1 < M3 < M2. However, it remained similar for both polymer composites.
- Process IV – Thermal oxidation with the decomposition driven by radicals and volatile oxidation occurs in all the analyzed polymer materials above the temperature of 434°C. This process is detected as exothermic peaks due to combustion-like reactions [39,40]. The presence of natural hybrid fillers did not increase the thermal decomposition temperature of the PP component from both polymer composites.
Table 3 presents a comparative summary of some information obtained from the thermal analysis (TG, DTG and DSC) of these polymer materials.
3.4. Density
The experimental results obtained from the density determination, conducted using Archimedes’ method with water as the liquid medium, are summarized in Table 4.
The measurement of density is important for polymer composites with lignocellulosic flax fiber and wood flour due to the hydrophilic nature of the natural fillers [7,41].
The M1 polymer (PP) has a density of 0.879 ± 0.040 g/cm³ (Table 4), which is close to the theoretical density (0.905 g/cm³) due to the hydrophobic nature of PP [7]. Polyolefins, such as polypropylene, exhibit subunitary densities, and, in general, when reinforced with lignocellulosic materials, their density is increased. The density of lignocellulosic materials is higher than that of polyolefins [7]. Additionally, fillers of lignocellulosic nature absorb water, swell, and contribute to an increase in density.
In this study, the addition of 5% flax fiber + 25% wood flour fillers to the PP polymer matrix in the M2 composite results in an 7.5% increase in density. However, when 10% flax fiber + 25% wood flour fillers are used, the density increases by 3.0% in the M3 composite. This finding is attributed to the presence of natural fillers, which, regardless of their type and concentration, lead to an increase in density in polymer composites. By comparing the densities of the M2 and M3 composites, a 4.1% decrease in density is observed for the M3 composite. This leads to the conclusion that, in order to obtain polymer composite materials with reduced water absorption, a lower amount of wood flour and a higher proportion of flax fibers should be used.
3.5. Mechanical Tests
The mechanical tests consisted of determining the Vickers microhardness and the flexural strength. The experimental results obtained are presented in Table 5.
From the perspective of Vickers microhardness (Table 5), it is observed that the addition of 5% flax fiber + 25% wood flour (M2) to the polypropylene matrix results in a decrease in microhardness by approximately 6.2%. However, using 10% flax fiber + 20% wood flour (M3) leads to an increase in Vickers hardness by about 16.7%.
The results (Table 5) highlight the variation in flexural strength relative to the PP polymer matrix as follows:
- The addition of 5% flax fiber + 25% wood flour to the PP polymer matrix in the M2 composite leads to a decrease in flexural strength (Rm) by approximately 30.5%.
- The addition of 10% flax fiber + 20% wood flour to the PP polymer matrix in the M3 composite results in an increase in flexural strength compared to the M2 composite by about 14.1% and a decrease compared to the M1 material by approximately 20.7%.
It is observed that replacing 5% of the wood flour with flax fibers in the polymer composite (M3) causes an increase in both Vickers hardness and flexural strength (Rm).
The addition of 30% natural hybrid fillers resulted in a decrease in flexural strength, possibly due to the polarity of wood flour and flax fiber in contrast to the nonpolar nature of the PP polymer matrix [42]. The deterioration of the mechanical properties of the PP polymer with the incorporation of lignocellulosic flax fiber and wood flour has also been reported in other studies [41,42,43]. However, when an optimal content, specific morphology, and appropriate size of natural fillers (both particles and fibers) are used, along with suitable compatibilizers in the correct proportion, an improvement in the mechanical properties of polymer composites can be achieved [44,45,46].
3.6. Dielectric Tests
The dielectric properties such as volume resistivity (ρv) and surface resistivity (ρs) of the polymer materials M1 – M3 are presented in Table 6.
Based on dielectric test results (Table 6), it can be stated that the tested polymer composite materials fall into the category of insulating materials [47,48].
Regarding volume resistivity (ρv), it is observed that the introduction of flax fibers and wood flour as fillers leads to a decrease compared to the PP polymer matrix (M1), as follows: for the M2 composite, it decreases by approximately 63.4%, and for the M3 composite, it decreases by approximately 67.9%.
In contrast, surface resistivity (ρs) increases with the addition of hybrid fillers to the PP polymer matrix, as follows: for the M2 composite, it increases by approximately 65.1%, and for the M3 composite, it increases by approximately 138.3%.
Thus, it can be observed that the M1 polymer material (PP) exhibits the highest volume resistivity (ρv) and the lowest surface resistivity (ρs). These results are consistent with findings from other studies [49]. Bledzki et al. [49] reported a decrease in volume resistivity with the addition of 30 wt.% flax fiber in a PP matrix compared to the control PP polymer. This suggests an increase in conductivity upon the introduction of lignocellulosic fibers in PP, attributed to the presence of polar groups that facilitate current flow when a voltage is applied. In contrast, the surface resistivity of polymer composites increases with higher flax fiber content.
In the case of the polymer composite materials (M2 and M3) studied in this work, only a 30 wt.% loading with natural hybrid fillers (wood flour and flax fiber) was reached in the M2 and M3 composites, and the resistivity values (Table 6) vary with the increase in flax fibers and decrease in wood flour.
3.7. Deterioration Tests due to the Action of Fungi
Deterioration tests of polymer materials due to the action of fungi were carried out on samples with a thickness of 0.75 mm and a biodegradation period of 6 months, with analyses being performed at 45 days, 90 days, and 180 days.
The experimental results obtained from the study of the materials’ behavior under mould exposure are presented in Table 7 and Table 8 and indicate the following aspects:
- The highest weight loss was recorded for the M3 composite (6.91%), followed by M2 (4.73%) and M1 (0.69%) after 3 months. In general, for the samples with the highest and lowest weight losses, these results correlate with the degree of mould coverage.
- After 180 days (6 months) of exposure in the biodegradation environment, the weight loss for the M3 composite was found to be 12.58%, while for the M2 composite the weight loss value was measured at 7.58%.
- The lowest weight loss was exhibited by the M1 polymer material (PP), which varied in a narrow range (0.61 - 0.81%) after 1.5 months, and 6 months, respectively.
In both polymer composites, sporodochia of Myrothecium verrucaria, known for its biodeterioration potential in textiles (flax fibers), were observed. The grade of 5 for both polymer composites indicates full fungal coverage (Table 7).
From the results shown in Table 8, it can be observed that the M3 composite exhibits the highest weight loss (12.58%) after 6 months, indicating that it is the most degraded.
The stereomicroscope images of the polymer composite materials M2 and M3 deteriorated due to mould exposure after 6 months are shown in Figure 4.
The susceptibility of the M2 and M3 polymer composite materials to fungi depends on the type of natural fillers, as well as the content, size, and morphology of flax fibers and wood flour particles within the PP polymer matrix. Moreover, it is known that fungal growth and colony spread are facilitated when the surface of natural fillers is not fully covered by the PP polymer matrix [50].
Further research is needed to functionalize the natural fillers to enhance their compatibility and uniform distribution within the PP polymer matrix.
4. Conclusions
In this work, two polymer composite materials were obtained and characterized, with a polymer matrix made of polypropylene (PP) and natural hybrid fillers consisting of flax fiber (FF) and wood flour (WF). The weight concentrations in which the polymer materials were obtained, expressed in the form PP/FF/WF, were: 100/0/0, 70/5/25, and 70/10/20. The characterization of these polymer materials involved:
- Optical microscopy and X-ray diffraction analyses highlighted that the M3 composite material with hybrid fillers is the most homogeneous and has the largest portions of ordered phases. All polymer materials crystallize in an orthorhombic system with crystallite sizes of 20.8 nm (M1), 19.2 nm (M2), and 23.2 nm (M3). The addition of natural fillers did not alter the structure of the PP polymer.
- Thermal analyses identified thermograms similar to four processes: water loss (I), which occurs in the M2 and M3 composite materials, melting (II), which identifies the melting point close to the PP matrix, and thermal oxidation with the formation of solid products (III) and decomposition driven by radicals and volatile oxidation (IV). For the investigated series, the thermal stability order is: M1 < M3 < M2. However, it remained similar for both polymer composites.
- Mechanical tests showed that incorporating 5% flax fiber and 25% wood flour reinforcement into a PP matrix reduces Vickers hardness and bending strength (Rm). However, increasing the flax fiber content to 10% and reducing the wood flour to 20% enhances these properties in the M3 composite compared to the M2 composite.
- Density measurements indicate that incorporating hybrid natural fillers increases the density of the M2 and M3 composites. The highest density was observed in M2, which contains the most wood flour, while M3, with the highest flax fiber content, had a lower density than M2 but remained higher than that of the PP polymer (M1).
- Dielectric tests indicated that the volume resistivity decreases with the introduction of a hybrid filler, while the surface resistivity increases with its introduction.
- Deterioration tests due to the action of fungi were conducted over 6 months, after which the polymer materials can be classified based on degradation rate (weight loss) as follows: M3 > M2 > M1.
Based on the conducted analyses, the optimal variant for the chosen application was selected as the composite with the highest concentration of flax fibers, namely PP + 10% flax fiber + 20% wood flour, coded as M3.
Further research is needed to functionalize the natural fillers to enhance their compatibility and uniform distribution within the PP polymer matrix.
Author Contributions
Conceptualization, A.R.C.; methodology and investigation of PP and fillers, A.R.C. and D.C., methodology and investigation - density, I.I.; methodology and investigation - Vickers hardness tests, D.P.; methodology and investigation - XRD analysis, B.G.S.; methodology and investigation - optical microscopy, D.P. and V.E.M.; methodology and investigation – dielectric tests, A.R.C., resources, A.R.C.; data curation, A.R.C., M.V.L., I.I., D.P., B.G.S. V.E.M. and D.C., writing—original draft preparation, A.R.C., M.V.L. and R.C.C.; writing—review and editing, A.R.C., M.V.L. and R.C.C.; visualization and supervision, A.R.C., M.V.L. and R.C.C.; project administration, A.R.C., funding acquisition, A.R.C.
Funding
This research was supported by the Romanian Ministry of Research, Innovation and Digitalization, project number PN23140201-42N/2023. The APC was funded by MDPI through a 100% discount voucher.
Institutional Review Board Statement
Not applicable.
Data Availability Statement
The data presented in this study are available on reasonable request from the main author (A.R.C.) and corresponding author (M.V.L.).
Acknowledgments
We acknowledge the support of our colleagues from INCDIE ICPE-CA Bucharest, Romania, Dr. Chem. Petru Budrugeac for conducting thermal analysis, biologist Nicoleta Burunția for performing antifungal tests, and technician Dorina Vlad for providing technical support in conducting three-point bending tests.
Conflicts of Interest
The authors declare no conflicts of interest. The funders had no role in the design of the study; in the collection, analyses, or interpretation of data; in the writing of the manuscript; or in the decision to publish the results.
References
- Suriani, M.J.; Ilyas, R.A.; Zuhri, M.Y.M.; Khalina, A.; Sultan, M.T.H.; Sapuan, S.M.; Ruzaidi, C.M.; Wan, F.N.; Zulkifli, F.; Harussani, M.M.; Azman, M.A.; Radzi, F.S.M.; Sharma, S. Critical Review of Natural Fiber Reinforced Hybrid Composites: Processing, Properties, Applications and Cost. Polymers 2021, 13 (20), 3514. [CrossRef]
- Seydibeyoğlu, M.Ö.; Dogru, A.; Wang, J.; Rencheck, M.; Han, Y.; Wang, L.; Seydibeyoğlu, E.A.; Zhao, X.; Ong, K.; Shatkin, J.A.; Shams Es-haghi, S.; Bhandari, S.; Ozcan, S.; Gardner, D.J. Review on Hybrid Reinforced Polymer Matrix Composites with Nanocellulose, Nanomaterials, and Other Fibers. Polymers 2023, 15 (4), 984. [CrossRef]
- Maurya, A.K.; Manik, G. Advances towards Development of Industrially Relevant Short Natural Fiber Reinforced and Hybridized Polypropylene Composites for Various Industrial Applications: A Review. J. Polym. Res. 2023, 30 (1), 47. [CrossRef]
- Prem Kumar, R.; Muthukrishnan, M.; Felix Sahayaraj, A. Effect of Hybridization on Natural Fiber Reinforced Polymer Composite Materials – A Review. Polym. Compos. 2023, 44 (8), 4459–4479. [CrossRef]
- Ismail, S.O.; Akpan, E.; Dhakal, H.N. Review on Natural Plant Fibres and Their Hybrid Composites for Structural Applications: Recent Trends and Future Perspectives. Compos. C: Open Access 2022, 9, 100322. [CrossRef]
- Neto, J.; Queiroz, H.; Aguiar, R.; Lima, R.; Cavalcanti, D.; Doina Banea, M. A Review of Recent Advances in Hybrid Natural Fiber Reinforced Polymer Composites. J. Renew. Mater. 2022, 10 (3), 561–589. [CrossRef]
- Çavuş, V. Selected Properties of Mahogany Wood Flour Filled Polypropylene Composites: The Effect of Maleic Anhydride-Grafted Polypropylene (MAPP). BioRes 2020, 15 (2), 2227–2236. [CrossRef]
- Thakur, V.K.; Thakur, M.K. Processing and Characterization of Natural Cellulose Fibers/Thermoset Polymer Composites. Carbohydr. Polym. 2014, 109, 102–117. [CrossRef]
- Sharma, A.; Venkatesh, R.; Chaturvedi, R.; Kumar, R.; Vivekananda, P.K.K.; Mohanavel, V.; Soudagar, M.E.M.; Al Obaid, S.; Salmen, S.H. Polypropylene Matrix Embedded with Curaua Fiber through Hot Compression Processing: Characteristics Study. J. Polym. Res. 2024, 31 (9), 260. [CrossRef]
- Rahman, M.M.; Maniruzzaman, M.; Yeasmin, M.S. A State-of-the-Art Review Focusing on the Significant Techniques for Naturally Available Fibers as Reinforcement in Sustainable Bio-Composites: Extraction, Processing, Purification, Modification, as Well as Characterization Study. Results Eng. 2023, 20, 101511. [CrossRef]
- Aravindh, M.; Sathish, S.; Ranga Raj, R.; Karthick, A.; Mohanavel, V.; Patil, P.P.; Muhibbullah, M.; Osman, S.M. A Review on the Effect of Various Chemical Treatments on the Mechanical Properties of Renewable Fiber-Reinforced Composites. Adv. Mater. Sci. Eng. 2022, 2022, 1–24. [CrossRef]
- Pathan, S.; Dinesh; Biswas, K.; Palsule, S. Recycled Wood Fiber Reinforced Chemically Functionalized Polyethylene (VLDPE) Composites by Palsule Process. J. Nat. Fibers 2022, 19 (17), 15519–15530. [CrossRef]
- Dinesh; Palsule, S. Bagasse Fiber Reinforced Functionalized Ethylene Propylene Rubber Composites by Palsule Process. J. Nat. Fibers 2021, 18 (11), 1637–1649. [CrossRef]
- Kumar, P.; Palsule, S. Bamboo Fiber Reinforced Chemically Functionalized Acrylonitrile Butadiene Styrene Composites by Palsule Process. J. Nat. Fibers 2023, 20 (1), 2150741. [CrossRef]
- Tamta, N.; Palsule, S. Kenaf Fiber Reinforced Chemically Functionalized Styrene-Acrylonitrile Composites. J. Thermoplas. Compos. Mater. 2024, 37 (1), 5–27. [CrossRef]
- Verma, H.; Palsule, S. Bagasse Fiber Reinforced Chemically Functionalized Polystyrene Composites. J. Thermoplas. Compos. Mater. 2024, 37 (1), 251–275. [CrossRef]
- Andrzejewski, J.; Barczewski, M.; Czarnecka-Komorowska, D.; Rydzkowski, T.; Gawdzińska, K.; Thakur, V.K. Manufacturing and Characterization of Sustainable and Recyclable Wood-Polypropylene Biocomposites: Multiprocessing-Properties-Structure Relationships. Ind. Crops Prod. 2024, 207, 117710. [CrossRef]
- Caramitu, A.R.; Ciobanu, R.C.; Ion, I.; Marin, M.; Lungulescu, E.-M.; Marinescu, V.; Aflori, M.; Bors, A.M. Composites from Recycled Polypropylene and Carboxymethylcellulose with Potential Uses in the Interior Design of Vehicles. Polymers 2024, 16 (15), 2188. [CrossRef]
- Le Duigou, A.; Davies, P.; Baley, C. Environmental Impact Analysis of the Production of Flax Fibres to Be Used as Composite Material Reinforcement. J. Biobased Mat. Bioenergy 2011, 5 (1), 153–165. [CrossRef]
- Patel, R.V.; Yadav, A.; Winczek, J. Physical, Mechanical, and Thermal Properties of Natural Fiber-Reinforced Epoxy Composites for Construction and Automotive Applications. Appl. Sci. 2023, 13 (8), 5126. [CrossRef]
- Goyal, A.; Sharma, V.; Upadhyay, N.; Gill, S.; Sihag, M. Flax and Flaxseed Oil: An Ancient Medicine & Modern Functional Food. J. Food Sci. Technol. 2014, 51 (9), 1633–1653. [CrossRef]
- Romhány, G.; Karger-Kocsis, J.; Czigány, T. Tensile Fracture and Failure Behavior of Technical Flax Fibers. J. Appl. Polym. Sci. 2003, 90 (13), 3638–3645. [CrossRef]
- Charlet, K.; Beakou, A. Interfaces within Flax Fibre Bundle: Experimental Characterization and Numerical Modelling. J. Compos. Mater. 2014, 48 (26), 3263–3269. [CrossRef]
- Mattrand, C.; Béakou, A.; Charlet, K. Numerical Modeling of the Flax Fiber Morphology Variability. Compos. - A: Appl. Sci. Manuf. 2014, 63, 10–20. [CrossRef]
- SR EN ISO 1133-1:2022, Plastics - Determination of the Melt Mass-Flow Rate (MFR) and Melt Volume-Flow Rate (MVR) of Thermoplastics. Part 1: Standard Method.
- SR EN ISO 1183-1:2019, Plastics - Methods for Determining the Density of Non-Cellular Plastics. Part 1: Immersion Method, Liquid Pycnometer Method and Titration Method.
- SR EN ISO 306:2023, Plastics -Thermoplastic Materials. Determination of Vicat Softening Temperature (VST).
- SR EN ISO 527-1:2020, Plastics. Determination of Tensile Properties Part 1: General Principles.
- SR EN ISO 527-2:2012, Plastics. Determination of Tensile Properties Part 2: Test Conditions for Moulding and Extrusion Plastics.
- SR EN ISO 14125:2000/AC:2003, Fibre-Reinforced Plastic Composites. Determination of Flexural Properties.
- SR EN ISO 178:2019, Plastics. Determination of Flexural Properties.
- SR EN ISO 6507-1:2023, Metallic Materials - Vickers Hardness Test. Part 1: Test Method.
- IEC 62631-3-1:2023, Dielectric and Resistive Properties of Solid Insulating Materials. Part 3-1: Determination of Resistive Properties (DC Methods) - Volume Resistance and Volume Resistivity - General Method.
- IEC 62631-3-2:2023, Dielectric and Resistive Properties of Solid Insulating Materials. Part 3-2: Determination of Resistive Properties (DC Methods) - Surface Resistance and Surface Resistivity.
- SR EN 60068-2-10:2006/A1:2019, Environmental Testing. Part 2-10: Tests - Test J and Guidance: Mould Growth.
- SR EN ISO 846:2019, Plastics – Evaluation of the Action of Microorganisms.
- Romhány, G.; Karger-Kocsis, J.; Czigány, T. Tensile Fracture and Failure Behavior of Technical Flax Fibers. J. Appl. Polym. Sci. 2003, 90 (13), 3638–3645. [CrossRef]
- Parodo, G.; Sorrentino, L.; Turchetta, S.; Moffa, G. Manufacturing of Sustainable Composite Materials: The Challenge of Flax Fiber and Polypropylene. Materials 2024, 17 (19), 4768. [CrossRef]
- Gijsman, P. Review on the Thermo-Oxidative Degradation of Polymers during Processing and in Service. e-Polymers 2008, 8 (1). [CrossRef]
- Mentes, D.; Nagy, G.; Szabó, T.J.; Hornyák-Mester, E.; Fiser, B.; Viskolcz, B.; Póliska, C. Combustion Behaviour of Plastic Waste – A Case Study of PP, HDPE, PET, and Mixed PES-EL. J. Clean. Prod. 2023, 402, 136850. [CrossRef]
- Elfaleh, I.; Abbassi, F.; Habibi, M.; Ahmad, F.; Guedri, M.; Nasri, M.; Garnier, C. A Comprehensive Review of Natural Fibers and Their Composites: An Eco-Friendly Alternative to Conventional Materials. Results Eng. 2023, 19, 101271. [CrossRef]
- Bakar, M.B.A.; Ishak, Z.A.M.; Taib, R.M.; Rozman, H.D.; Jani, S.M. Flammability and Mechanical Properties of Wood Flour-filled Polypropylene Composites. J. Appl. Polym. Sci. 2010, 116 (5), 2714–2722. [CrossRef]
- Nuñez, A.J.; Sturm, P.C.; Kenny, J.M.; Aranguren, M.I.; Marcovich, N.E.; Reboredo, M.M. Mechanical Characterization of Polypropylene–Wood Flour Composites. J. Appl. Polym. Sci. 2003, 88 (6), 1420–1428. [CrossRef]
- Stark, N.; Rowlands, R. Effects of Wood Fiber Characteristics on Mechanical Properties of Wood/Polypropylene Composites. Wood Fiber Sci. 2003, 35, 167–174.
- Gozdecki, C.; Wilczynski, A.; Kociszewski, M.; Tomaszewska, J.; Zajchowski, S. Mechanical Properties of Wood-Polypropylene Composites with Industrial Wood Particles of Different Sizes. Wood Fiber Sci. 2012, 44, 14–21.
- Arbelaiz, A.; Fernández, B.; Cantero, G.; Llano-Ponte, R.; Valea, A.; Mondragon, I. Mechanical Properties of Flax Fibre/Polypropylene Composites. Influence of Fibre/Matrix Modification and Glass Fibre Hybridization. Compos. - A: Appl. Sci. Manuf. 2005, 36 (12), 1637–1644. [CrossRef]
- Moser, A.; Feuchter, M. Mechanical Properties of Composites Used in High-Voltage Applications. Polymers 2016, 8 (7), 260. [CrossRef]
- Haque, S.M.; Ardila-Rey, J.A.; Umar, Y.; Mas’ud, A.A.; Muhammad-Sukki, F.; Jume, B.H.; Rahman, H.; Bani, N.A. Application and Suitability of Polymeric Materials as Insulators in Electrical Equipment. Energies 2021, 14 (10), 2758. [CrossRef]
- Bledzki, A.K.; Lucka, M.; Al Mamun, A.; Michalski, J. Biological and Electrical Resistance of Acetylated Flax Fibre Reinforced Polypropylene Composites. BioRes 2008, 4 (1), 111–125. [CrossRef]
- Włodarczyk-Fligier, A.; Polok-Rubiniec, M. Studies of Resistance of PP/Natural Filler Polymer Composites to Decomposition Caused by Fungi. Materials 2021, 14 (6), 1368. [CrossRef]
Figure 1.
Optical microscope images (magnification 200×, respectively 500×) of the polymer materials: (a) M1, (b) M2, and (c) M3.
Figure 1.
Optical microscope images (magnification 200×, respectively 500×) of the polymer materials: (a) M1, (b) M2, and (c) M3.
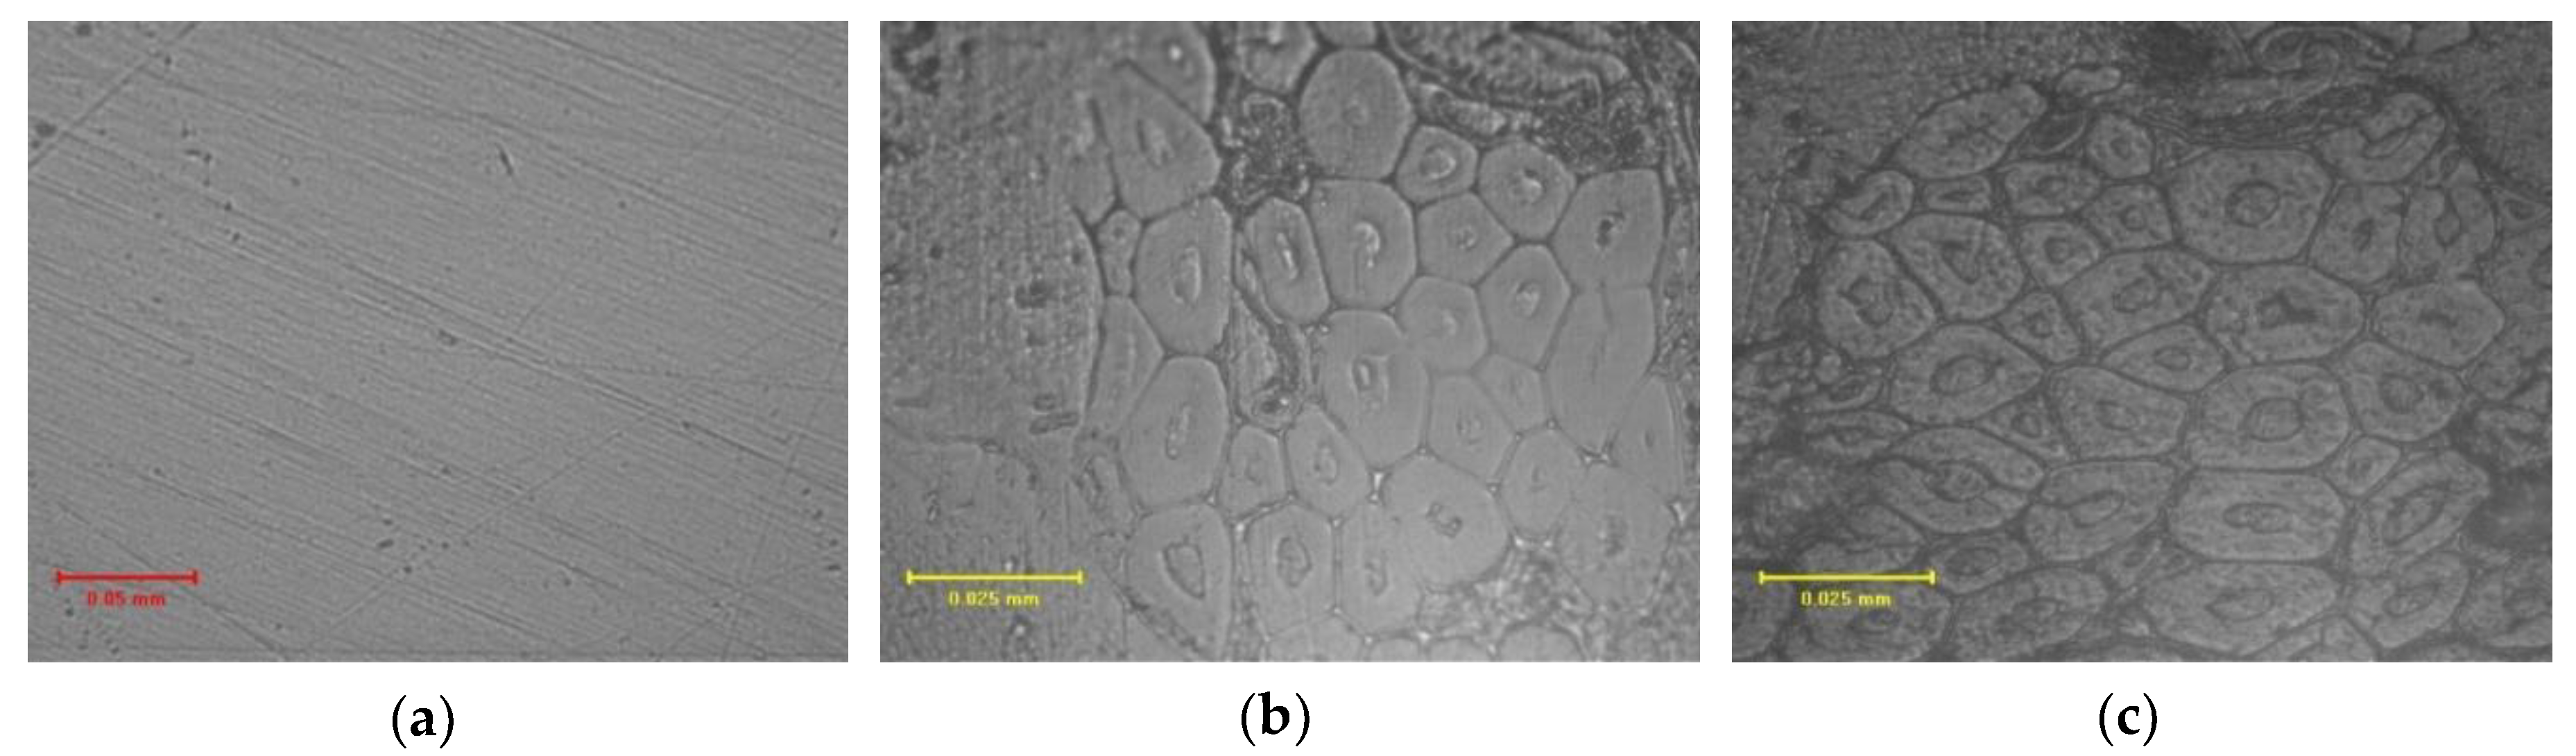
Figure 2.
Diffraction patterns of the polymer materials: (a) M1, (b) M2, and (c) M3.
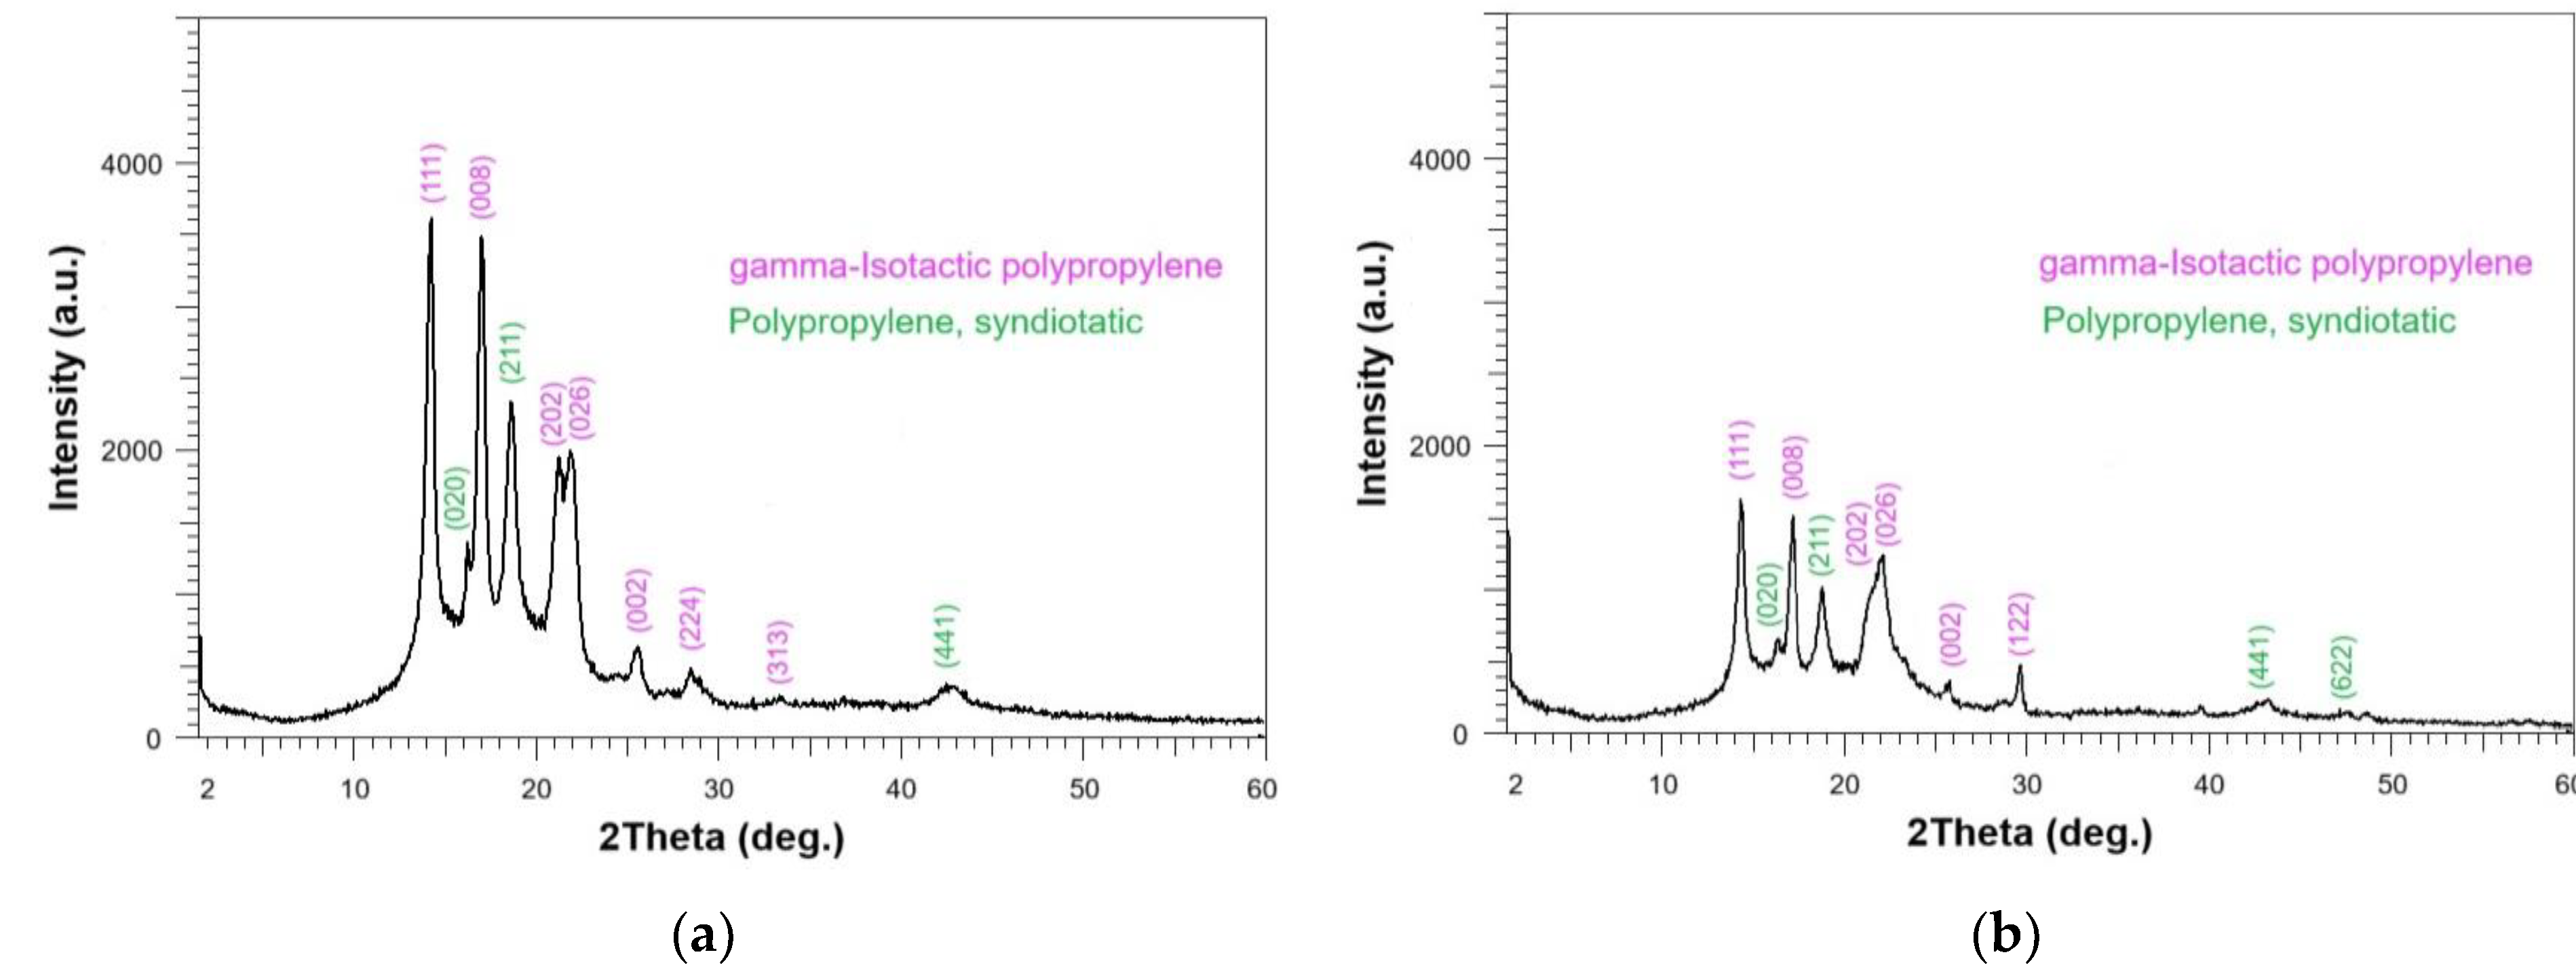
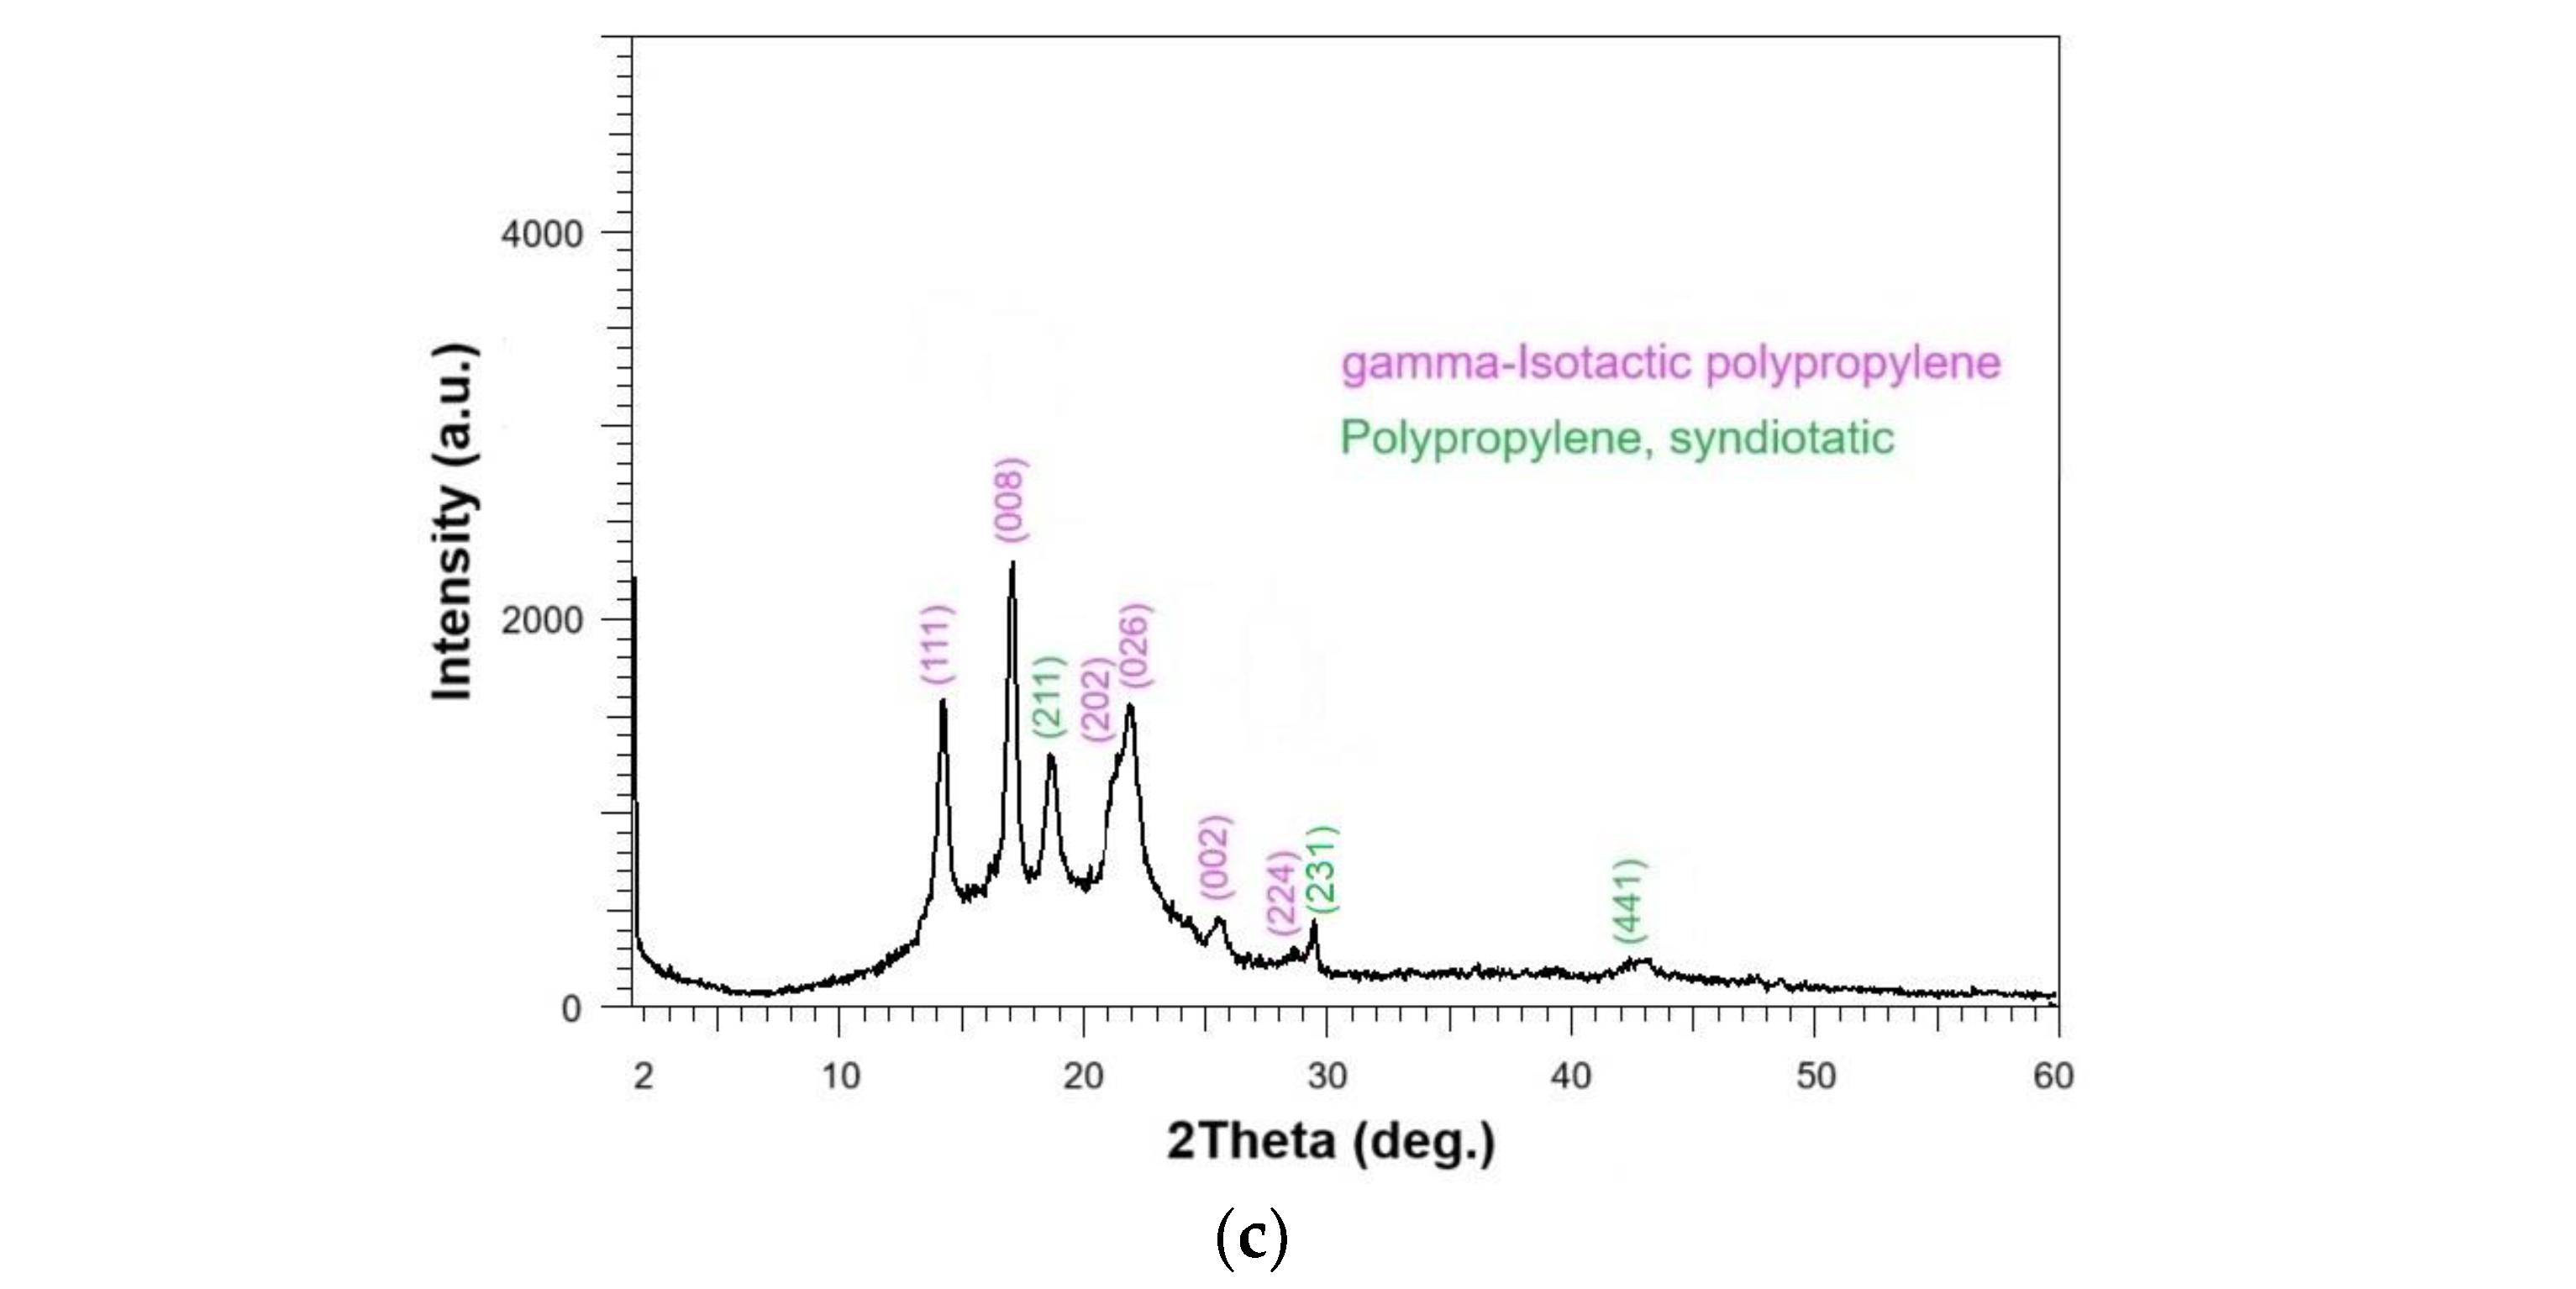
Figure 3.
TG, DTG and DSC curves of the polymer materials: (a) M1, (b) M2, and (c) M3.
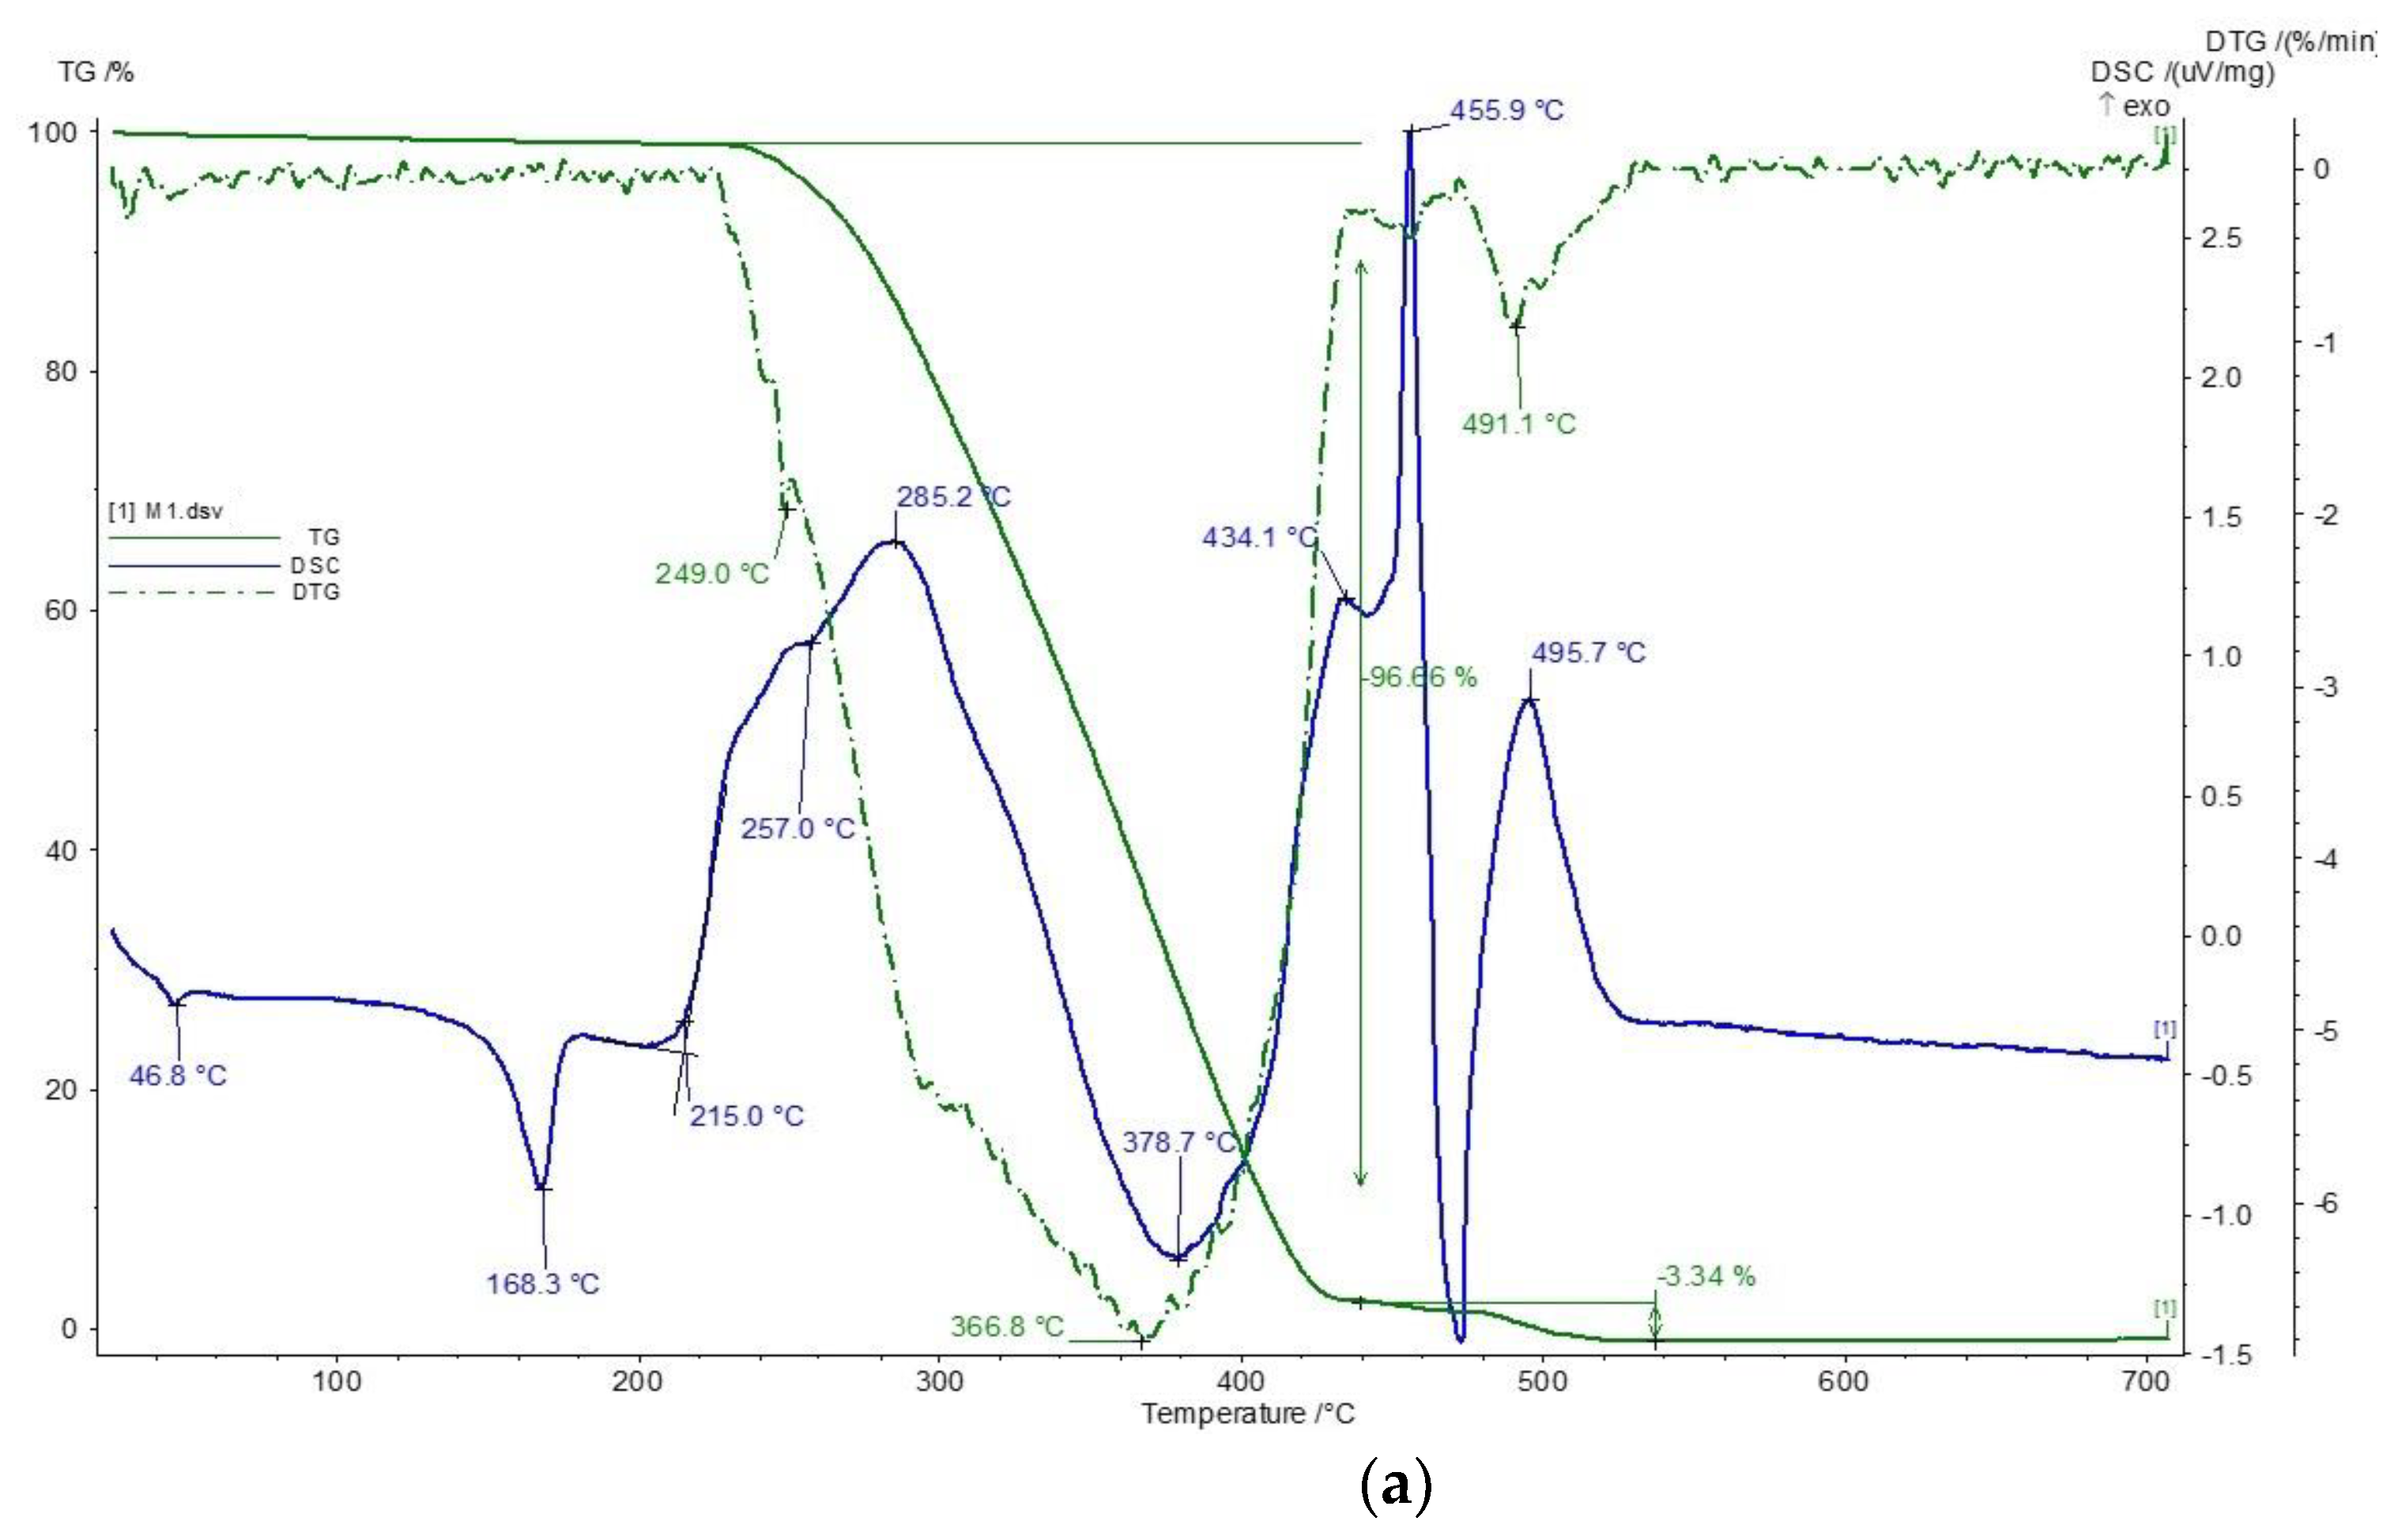
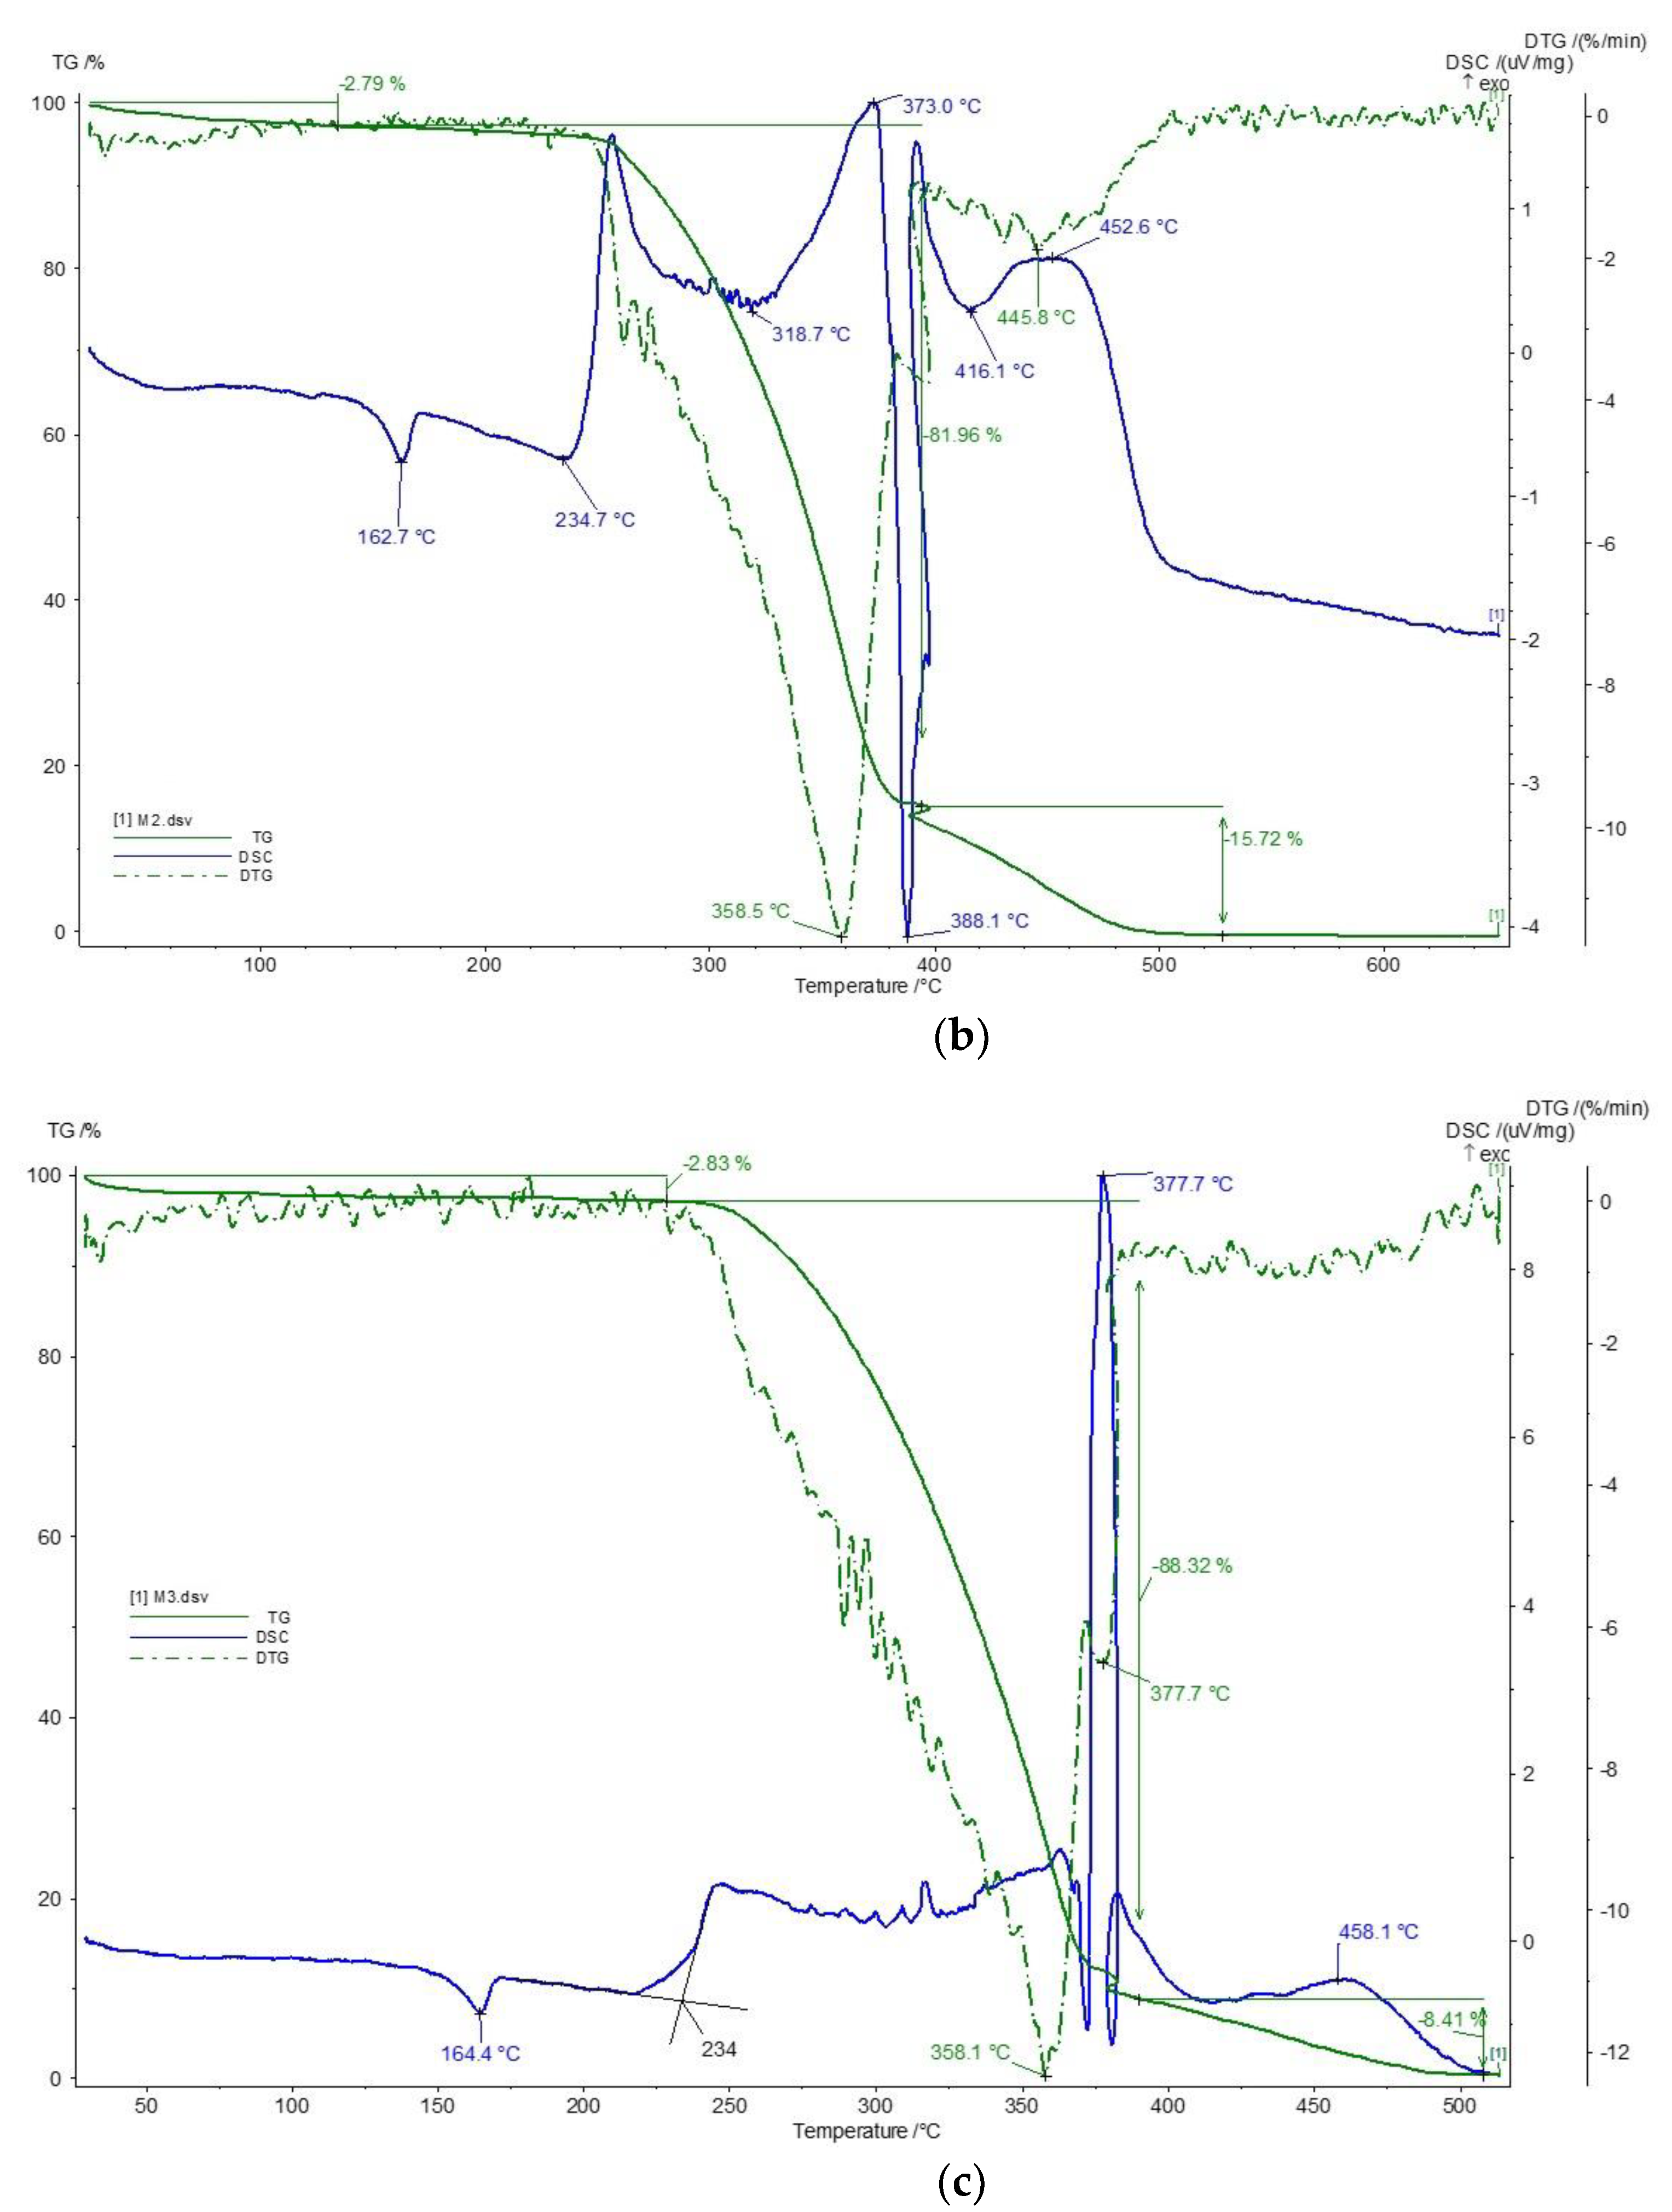
Figure 4.
Stereomicroscope images (magnification 50×) of polymer composite materials deteriorated due to mould exposure after 6 months: (a) M2 composite showing sporodochia of Myrothecium verrucaria, along with cracks, and (b) M3 composite showing Myrothecium verrucaria and Chaetomium globosum, along with cracks.
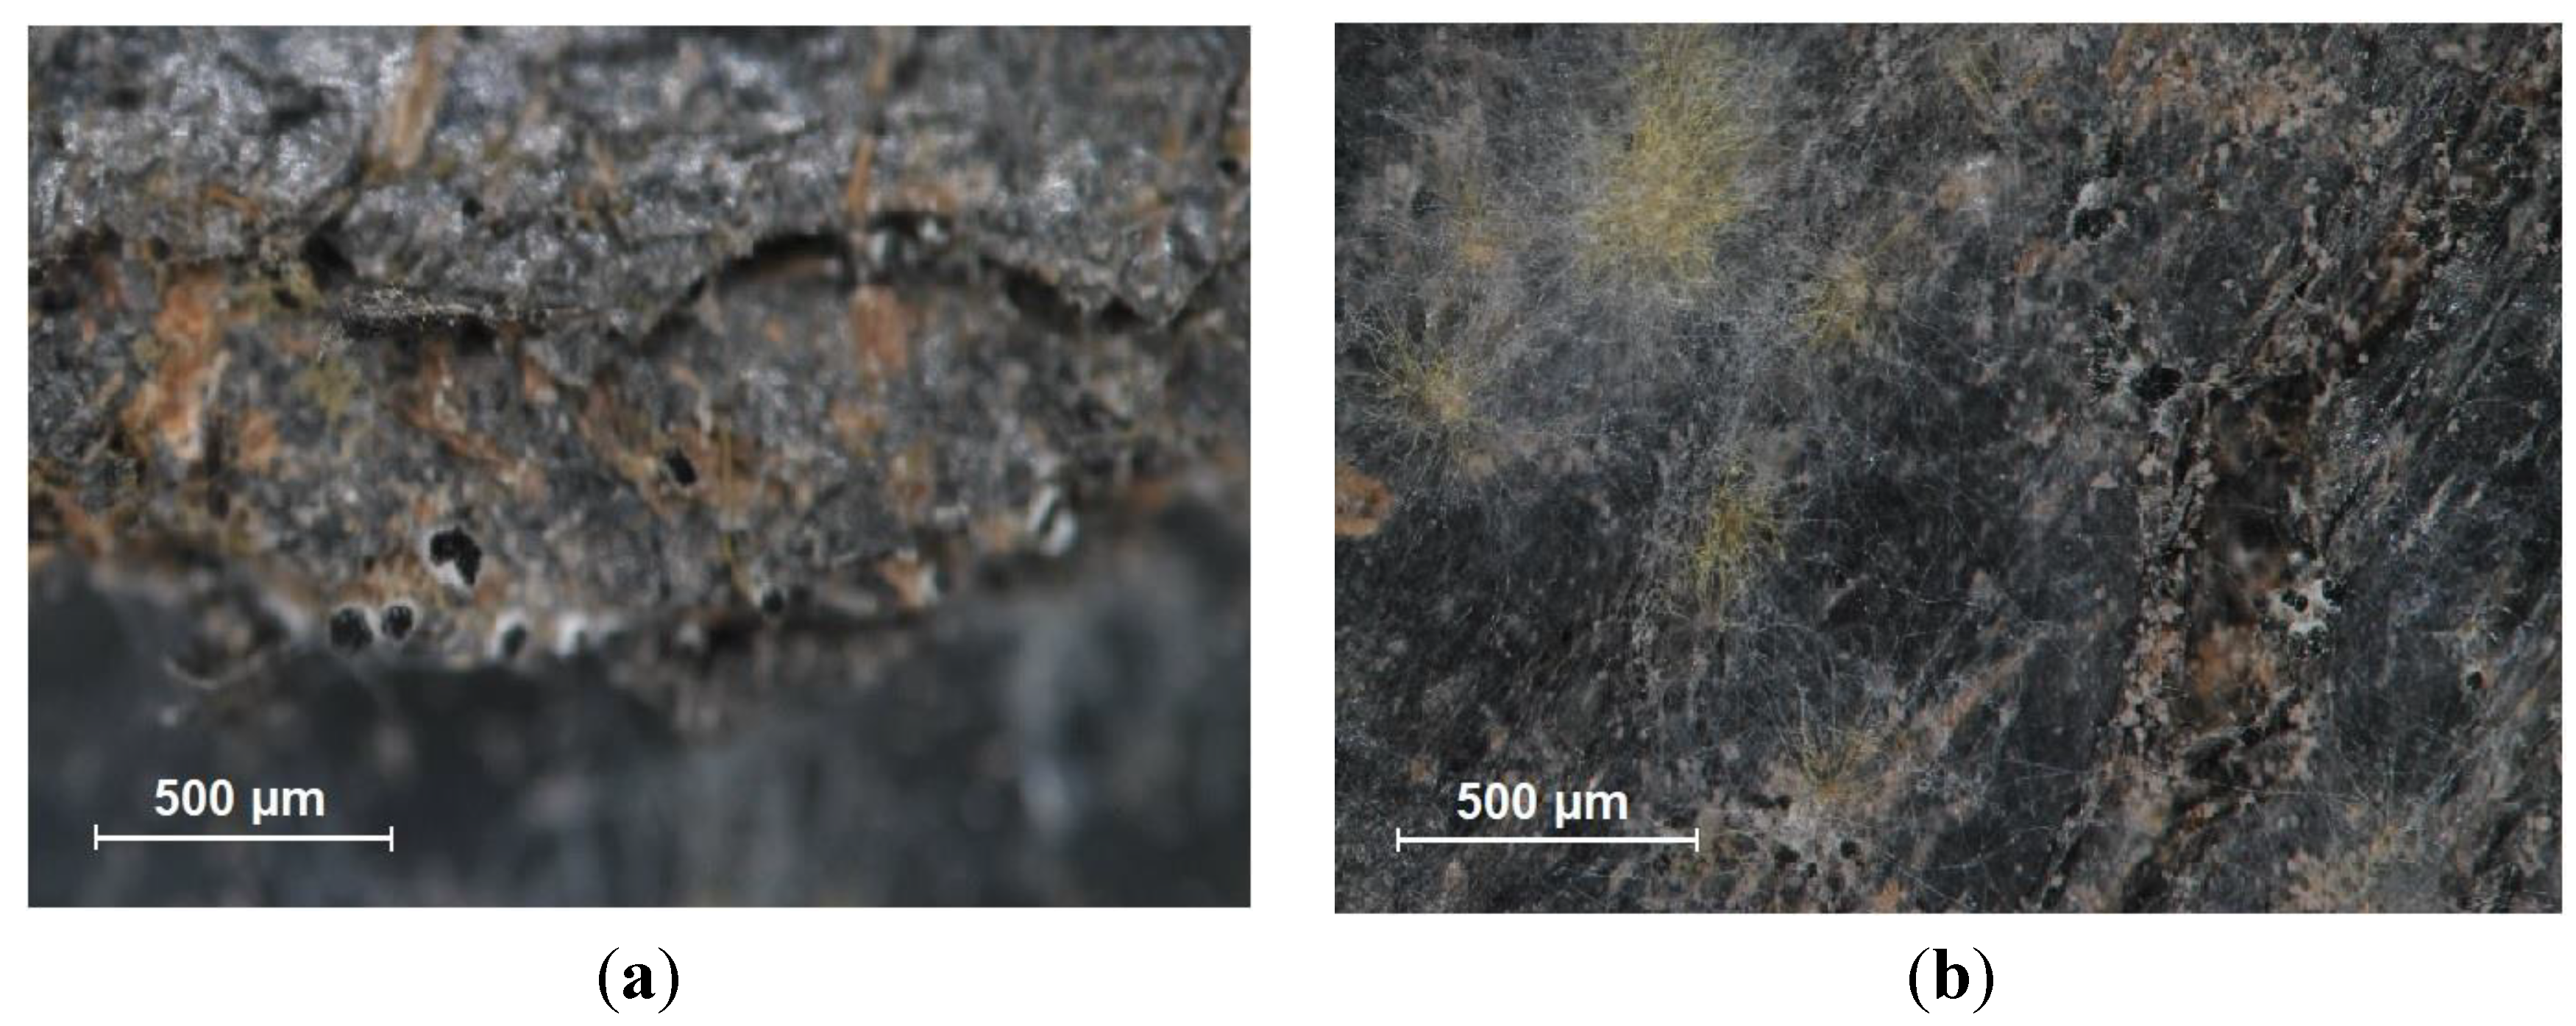
Table 2.
Codification and composition of the prepared polymer materials based on PP and fillers.
| Material type | Sample code |
PP/flax fiber/wood flour (wt.%) |
|---|---|---|
| PP | M1 | 100/0/0 |
| PP + 5% flax fiber + 25% wood flour | M2 | 70/5/25 |
| PP + 10% flax fiber + 20% wood flour | M3 | 70/10/20 |
Table 3.
Results obtained from the thermal analysis (TG, DTG and DSC) of the M1 - M3 polymer materials.
Table 3.
Results obtained from the thermal analysis (TG, DTG and DSC) of the M1 - M3 polymer materials.
| Sample code |
Process I Water loss |
Process II Melting |
Process III Oxidation |
Process III Thermal oxidation |
Process IV Thermal oxidation |
Δm total (%) |
||||||
|---|---|---|---|---|---|---|---|---|---|---|---|---|
| Tmin DSC (°C) |
TDTG (°C) |
Δm (%) |
Tmin DSC (°C) |
TIN (°C) |
Tmax DSC (°C) |
TDTG (°C) |
Δm (%) |
Tmax DSC (°C) |
TDTG (°C) |
Δm (%) |
||
| M1 | 46.8 | - | - | 168.3 | 215.0 | 257.0 285.2 |
249.0 | 96.66 | 434.1 455.9 495.7 |
491.1 | 3.34 | 100.00 |
| M2 | - | - | 2.79 | 162.7 | 234.7 | 373.0 445.8 452.6 |
358.5 | 81.96 | 452.6 | 445.8 | 15.72 | 100.47 |
| M3 | - | - | 2.83 | 164.4 | 234.0 | 377.7 | 358.1 | 88.32 | 458.1 | - | 8.41 | 99.55 |
Table 4.
Density of the M1 - M3 polymer materials.
| Sample code | Density (g/cm3) |
|---|---|
| M1 | 0.879 ± 0.040 |
| M2 | 0.945 ± 0.046 |
| M3 | 0.906 ± 0.050 |
Table 5.
Mechanical properties of the M1 - M3 polymer materials.
| Sample code | Vickers hardness HV 0.05 |
Flexural strength Rm (N/mm2) |
|---|---|---|
| M1 | 6.90 ± 0.11 | 112.97 ± 1.58 |
| M2 | 6.47 ± 0.29 | 78.52 ± 1.28 |
| M3 | 7.55 ± 0.59 | 89.60 ± 1.52 |
Table 6.
Dielectric properties of the M1 – M3 polymer materials.
| Sample code |
Volume resistivity, ρv (Ω·m) |
Measurement uncertainty for ρv (Ω·m) |
Surface resistivity, ρs (Ω) |
Measurement uncertainty for ρs (Ω) |
|---|---|---|---|---|
| M1 | 4.67 × 10¹⁴ | 1.41 × 10¹⁴ | 4.70 × 10¹⁵ | 0.98 × 10¹⁵ |
| M2 | 1.71 × 10¹⁴ | 0.77 × 10¹⁴ | 7.76 × 10¹⁵ | 4.26 × 10¹⁵ |
| M3 | 1.50 × 10¹⁴ | 0.49 × 10¹⁴ | 11.20 × 10¹⁵ | 5.76 × 10¹⁵ |
Table 7.
Results obtained for the M1 – M3 polymer materials subjected to deterioration under mould exposure according to [36].
Table 7.
Results obtained for the M1 – M3 polymer materials subjected to deterioration under mould exposure according to [36].
| Sample code |
Grades: 0 - 5 (according to method B of [36]) | Observations | ||
|---|---|---|---|---|
| 45 days | 90 days | 180 days | ||
| M1 | 01, 01, 01-1, 01-1 | 1, 1-2, 1-2, 2 | 1, 1, 1, 1-2 | Myrothecium verrucaria, Trichoderma viride, Aspergillus flavus, Paecilomyces variotii |
| M2 | 3, 3-4, 4, 4-5 | 3, 3, 3-4, 3-4 | 4-5, 4-5, 5, 5 | Sporodochia of Myrothecium verrucaria, Trichoderma viride, Paecilomyces variotii, and Chaetomium globosum, along with cracks |
| M3 | 1-2, 2-3, 3, 3-4 | 3-4, 3-4, 4, 4-5 | 5, 5, 5, 5 | Sporodochia of Myrothecium verrucaria, and Chaetomium globosum, along with cracks |
Table 8.
Weight loss of the M1 – M3 polymer materials subjected to deterioration under mould exposure according to [36].
Table 8.
Weight loss of the M1 – M3 polymer materials subjected to deterioration under mould exposure according to [36].
| Sample code |
Weight loss (%) | ||
|---|---|---|---|
| 45 days | 90 days | 180 days | |
| M1 | 0.61 | 0.69 | 0.81 |
| M2 | 2.89 | 4.73 | 7.58 |
| M3 | 4.82 | 6.91 | 12.58 |
Disclaimer/Publisher’s Note: The statements, opinions and data contained in all publications are solely those of the individual author(s) and contributor(s) and not of MDPI and/or the editor(s). MDPI and/or the editor(s) disclaim responsibility for any injury to people or property resulting from any ideas, methods, instructions or products referred to in the content. |
© 2025 by the authors. Licensee MDPI, Basel, Switzerland. This article is an open access article distributed under the terms and conditions of the Creative Commons Attribution (CC BY) license (http://creativecommons.org/licenses/by/4.0/).
Copyright: This open access article is published under a Creative Commons CC BY 4.0 license, which permit the free download, distribution, and reuse, provided that the author and preprint are cited in any reuse.


