
Submitted:
13 March 2025
Posted:
14 March 2025
You are already at the latest version
Abstract
The Liangzi Lake, a typical shallow lake in the middle reaches of the Yangtze River, is important for water resource and biodiversity conservation. With the development of urbanization, anthropogenic activities have posed serious threats to the water quality and biodiversity of Liangzi Lake. To assess the aquatic ecosystem health of Liangzi Lake, the structure, environmental response, and interactions of plankton were investigated in 2022 and 2023. Results indicated that water temperature was a pivotal factor regulating plankton dynamics, while plankton assemblage patterns were predominantly shaped by phytoplankton species, which was Bacillariophyta in spring and Chlorophyta in summer. In terms of phytoplankton, dissolved oxygen, and N:P ratio significantly affects cyanobacteria distribution, and a high biomass and abundance of them in summer highlighted the potential risk of harmful algal blooms. In contrast to phytoplankton, zooplankton exhibited enhanced resilience to changes of the surrounding environment. Rotifera was the dominant group in summer in terms of both abundance and biomass. Most core genera of plankton were jointly identified by eDNA metabarcoding and microscopical analysis, and eDNA metabarcoding has advantages in revealing a higher diversity. However, some taxa among rotifers, such as Liliferotrocha, were only identified using the microscopical analysis. Therefore, a combination of both methods is recommended to better understand the structuring mechanisms of plankton assemblages in lake ecosystems.
Keywords:
Phyto-zooplankton interaction
; Plankton assemblage
; Biodiversity
; Cyanobacteria
; Lake ecosystem
1. Introduction
Plankton are essential components in aquatic ecosystems, playing vital roles in energy flow and material cycling [1,2]. The high genetic diversity and adaptation ability of plankton make them widely distributed in various aquatic environment [1,3]. Among plankton, phytoplankton are crucial contributors to primary production, and zooplankton serve as trophic links between primary producers and higher trophic level aquatic organisms [4,5]. The biodiversity of plankton has non-negligible effects on the stability of food webs, trophic network functioning, and water environmental quality [6]. However, growing evidence reveals that the biodiversity of plankton is easily affected by environmental and climatic changes, and even anthropogenic activities [7,8]. For example, the outbreak of algal blooms in aquatic ecosystems has been widely reported [9,10,11]. Therefore, assessing the status and drivers of plankton diversity is vital to reveal the potential environmental problems of aquatic ecosystems.
In recent years, the environmental DNA (eDNA) metabarcoding technique has emerged to monitor the biodiversity of plankton [3,11,12]. Compared to the conventional microscopical method, eDNA metabarcoding can effectively identify species with similar morphological characteristics, such as copepods at the larval stage [8,13]. However, limitations and effectiveness of eDNA metabarcoding still exist in many cases. For example, it is inefficient for revealing cyanobacteria and fish taxa [14]. To date, few studies have compared the biodiversity of both phytoplankton and zooplankton using these two methods in actual aquatic habitats [8].
Liangzi Lake, the second-largest freshwater lake in Hubei province, is located in the middle and lower reaches of the Yangtze River. It is a typical grass-type lake with extensive populations of aquatic macrophytes such as Potamogeton crispus, Bythophyton indicum, Egeria densa, and Elodea nuttallii [15]. Due to its high water quality and rich biological resources, Liangzi Lake is considered to be a “fossil lake” and “species gene pool” [16]. Over the past few decades, Liangzi Lake has been overburdened with tourism and the main production modes are aquaculture and natural fisheries. Due to the anthropogenic effects, a series of environmental problems have arisen. For instance, the decline in aquatic biodiversity, and the degradation of aquatic macrophytes [15]. What’s worse, the risk of cyanobacteria blooms has increased in recent years [17]. Therefore, risk assessment and management toward plankton is necessary in Liangzi Lake. Therefore, the objectives of this study are: (1) to assess the structure, environmental response, and interactions of plankton in Liangzi Lake; (2) to compare the biodiversity of plankton using microscopical analysis and eDNA metabarcoding.
2. Materials and Methods
2.1. Sampling and Laboratory Analysis
Liangzi Lake (114°32′~114°43′E, 30°01′~30°16′N) is situated south of Ezhou City, adjacent to Wuhan City. With an average water depth of 4 m, and the lake spans approximately 339 km2 within a 2085 km2 basin characterized by southern highlands and northern lowlands [18]. Using Liangzi island town, located in the center of Liangzi Lake, as a boundary, Liangzi Lake can be divided into East Lake, the Qianjiang Lakes, West Lake, and Niushan Lake. Notably, West Lake primarily supports aquaculture while East Lake maintains natural fisheries. Four sampling campaigns were conducted during March and June of 2022 and 2023 across key locations (Figure 1). Among these sampling sites, L7 is located at the only outlet of Liangzi Lake, and L10 is located at the estuary of Gaoqiao River, the largest inflowing river of Liangzi Lake. Filed measurements of water temperature (WT), pH, and dissolved oxygen (DO) were obtained using a multiparameter controller (Milti3430, WTW, Germany), and transparency (SD) was measured by a Secchi disk. Surface water samples (0 ~ 0.5 m depth) was collected with an organic glass hydrophore and temporarily stored in polyethylene plastic bottles with different volumes for further analysis of water nutrients, chlorophyll a (Chl.a), and plankton. 20 L of surface water was filtered through a NO. 13 zooplankton net and concentrated in 100 mL polyethylene bottles for further analysis of Cladocera, Copepoda, nauplii, and larger Rotifera, and then 4 mL of a 40% formaldehyde solution was added.
After transporting the water samples to the laboratory, the samples for chl.a analyses were filtered through 0.7 µm GF/F filters and stored at - 20°C until analysis. 1 L of water sample for phytoplankton, protozoa, and smaller rotifers analyses were fixed with 1.5% (v/v) Lugol’s iodine. After sedimentation for 48 h, the supernatant was carefully siphoned off with a 2 mm diameter pipette. The remaining sample was then concentrated to 30 mL. Subsequently, all samples were transported to the Analysis and Testing Center, Institute of Hydrobiology, Chinese Academy of Sciences, for microscopic identification. The concentrated samples were shaken well, and 0.1 mL was transfered to the 0.1 mL counter box for species-level cell counts under a perioptometry. Protozoa and smaller rotifers were counted from the phytoplankton samples, with counts performed using 0.1 mL and 1 mL whole piece from the concentrated 30 mL sample, respectively [19]. Currently accepted names of phytoplankton species were based on the AlgaeBase [20]. Cladocera and Copepoda were counted from zooplankton samples, with counts performed using a 1 mL counter box. The average values of a triplicate experiment were taken to calculate the density and biomass of the plankton samples. Taxonomic identification of qualitative samples was conducted at species level based on “Atlas of Freshwater Microorganisms” and “Atlas of Freshwater Organisms in China” [19].
The measurements of total nitrogen (TN), total phosphorus (TP), and permanganate index (CODMn) were conducted based on the Chinese national standard methods of China HJ636-2012, GB11893-1989, and GB11892-89 as described in our previous study [21,22].
In June 2023, surface water sample was also filtered through 0.22 μm filter membranes to collect the eDNA for the analysis of the compositions of plankton in Liangzi Lake. All the filter membranes were temporarily stored at -80 ℃ before further analysis.
2.2. DNA Extraction, and Sequencing Analysis
The total DNA of plankton samples was extracted using the E.Z.N.A. soil DNA kit (OMEGA) based on the manufacturer’s protocol. After the quality assessment, the qualified DNA was used for further sequencing analysis. According to the previous studies, the primers A23SrVF2 (CARAAAGACCCTATGMAGCT) and A23SrVR2 (TCAGCCTGTTATCCCTAG) were selected to amplify the 23S rRNA gene region of phytoplankton [23]. The primers V8F (ATAACAGGTCTGTGATGCCCT) and 1510R (CCTTCYGCAGGTTCA-CCTAC) were used to amplify the 18S rRNA gene region of zooplankton. Subsequently, the PCR products were purified, quantified, pooled, and sequenced on an Illumina MiSeq platform (Illumina, San Diego, USA) at Majorbio Bio-Pharm Technology Co. Ltd., Shanghai, China. All the progress was conducted following our previous study [24]. The raw data were first annotated against the Nucleotide Sequence Database (NT, v20210917) and then some irrelevant sequences (e.g., bacteria, plant, and fungus sequences) were removed. The filtered sequences were further used to analyze the planktonic community. The sequence raw datasets have been deposited in the NCBI Sequence Read Archive with the Bio-Project accession number PRJNA1114416.
2.3. Calculation Methods
Integrated Nutritional Index (TLI)
TLI is used to assess the nutritional state of the lake. The calculation of TLI is based on the principle of “Methods for the assessment of surface water environmental quality of China” (https://www.mee.gov.cn/gkml/hbb/bgt/201104/W020110401583735386081.pdf).
where TLI(i) is the trophic status index of parameter i, Wi is the relative weight of the nutritional status index of parameter i.
Taking chlorophyll a (chl.a) as the reference parameter, the relevant weights for the normalization of the parameter i are calculated as follows:
where rij is the correlation coefficient between the parameter i and the reference parameter, n is the number of evaluation parameters. rij of some parameters is described as follows: rij2 (chla) = 1, rij2 (TP) = 0.7056, rij2 (TN) = 0.6724, rij2 (SD) = 0.6889, rij2 (CODMn) = 0.6889.
The formula for calculating the nutritional status index of each item is:
TLI(Chl.a) =10(2.5+1.086lnChl.a)
TLI(TP) = 10(9.436 + 1.624lnTP)
TLI(TN) = 10(5.453 + 1.694lnTN)
TLI(SD) = 10(5.118 - 1.94lnSD)
TLI(CODMn) = 10(0.109 + 2.66lnCODMn)
If TLI < 30, the lake is in the state of oligotrophy; 30 ≤ TLI ≤ 50, mesotrophy; 50 < TLI ≤ 60, light eutrophication; 60 < TLI ≤ 70, moderate eutrophication; 70 <TLI, severe eutrophication.
2.4. Statistical Analysis
The sequencing data was analyzed and visualized using the online Majorbio Cloud Platform [25]. The data about water quality, and diversity indices were analyzed using one-way ANOVA analysis, followed by Duncan’s multiple comparison tests. Data were presented as mean ± standard deviations (SD), and the letters mean the significant difference in the index between different groups. Redundancy analysis (RDA) and correlation analysis were used to analyze the relationship between environmental factors and planktonic groups using the R package “Vegan” and “Corrplot”, respectively. Figures were visible by GraphPad Prism 8, Origin2022, and R 4.03 software [26]. The sampling map in this study was generated by ArcGIS 10.3. Partial least squares path modeling (PLS-PM) was performed in SmartPLS version 4 software using the PLS-SEM algorithm. In addition, the taxa (relative abundance ≥ 1%) were considered as core taxa, and only the core taxa were performed with correlation analysis and visualized in network analysis by Gephi (Spearman’s |r| > 0.6 and BH-adjusted P < 0.05).
3. Results
3.1. Environmental Characteristics
Nutrients such as TP showed no noticeable variations across the four sampling campaigns (Figure 2), while TN exhibited significant seasonal differences. Water temperatures ranged from 14.4 to 24.9 ℃ in spring, and from 26.8 to 31.7 ℃ in summer. The concentration of Chl.a was significantly higher in summer compared to spring (ANOVA, P = 0.002). The TLI of the water sample is approximately 50, a criterion for light eutrophication, with no significant seasonal difference (ANOVA, P = 0.345). During the four sampling campaigns, CODMn, TN, and N:P ratio was significantly higher in summer 2023, while DO was significantly lower at the same time.
3.2. Biomass of Planktonic Communities
In spring 2022 and 2023, Bacillariophyta dominated the phytoplankton biomass, followed by Chlorophyta (Figure 3). The highest phytoplankton biomass was found in the sampling sites (L6 ~ L9) located in East Lake. In the summer of 2022 and 2023, cyanobacteria became the predominant group, accounting for 49.8% and 61.2% of the total biomass, respectively. Compared to spring, the phytoplankton biomass was significantly higher in summer. For zooplankton (Figure 3b), no obvious variations were observed between spring and summer. Cladocera and Copepoda, belonging to Crustacea, were the dominant groups and accounted for 23.2 ~ 96.6% of the total biomass. In spring 2023, Rotifera contributed the highest proportion of biomass.
3.3. Abundance of Planktonic Communities
In the four sampling campaigns, Bacillariophyta and cyanobacteria were the predominant groups in spring (Figure S1), accounting for 32.0 ~ 92.2% of the total abundance, and the relative abundance of these two groups was higher at sampling sites located in East Lake and around Liangzi island town (L5 ~ L9, with an average of 78.83%). The absolute abundance of phytoplankton in summer exceeded 108 cells/L, 1 to 2 orders of magnitude higher than that in spring (Figure S3a). Cyanobacteria was the only predominant group, accounting for 88.8% and 88.2% of the total abundance in summer 2022 and 2023, respectively (Figure S3b). In contrast to the total biomass, Ciliata and Rotifera were always the predominant groups in Liangzi Lake (Figure S2, S3c-d), and in the spring 2023 accounted for 98.5% of the total abundance.
3.4. Environmental Drivers of Planktonic Communities
For phytoplankton at the species level, the diversity (Figure 4a) and evenness (Figure S4) were significantly higher in spring. In terms of zooplankton, the diversity, and evenness were significantly lower in summer 2022 and spring 2023 (Figure 4b and S5). At the genus level, Aulacoseira was the dominant genus in the spring 2022 and 2023, but the rest dominant genera in these two sampling times varied greatly (Figure 4c). In summer, Raphidiopsis, Leptolyngbya, and Pseudanabena were the top three genera and accounted for more than 62.0% of the phytoplankton. The dominant genera of zooplankton in spring 2022 were Tintinnopsis, Strobilidium, and Conochilus, and in spring 2023 were Epistylis and Strobilidium (Figure 4d). In summer, the dominant genera were Tintinnopsis, Liliferotrocha, Difflugia, and Trichocerca. RDA analysis further confirmed that the core genera of plankton in summer showed high similarity (Figure 4e,f), while in spring, an obvious distinction was revealed. Among these measured environmental factors, WT and DO significantly affect the distribution of core genera of plankton in Liangzi Lake.
Correlation analysis revealed that WT significantly positively correlated with the abundance of cyanobacteria (P < 0.001), phytoplankton (P < 0.001), Copepoda (P < 0.001), Rotifera (P < 0.001) and zooplankton (P < 0.01) (Figure 5a). In addition, TP significantly negatively correlated with the abundance of phytoplankton (P < 0.05) and cyanobacteria (P < 0.01). Whereas, a high N:P ratio is beneficial for the growth of phytoplankton and cyanobacteria in that lake ecosystem (P < 0.05). As for these planktonic groups, phytoplanktonic groups have significant positive effects on the growth of Rotifera (e.g., cyanobacteria and Rotifera, P < 0.001). PLS path modeling further demonstrated that WT, DO, and CODMn exhibited positive effects on the abundances of phytoplankton, cyanobacteria, zooplankton, and Rotifera (Figure 5b). The effects of environmental factors on them based on these standardized total effects followed the order: Rotifera (λ = 0.719) > cyanobacteria (λ = 0.697) ≈ phytoplankton (λ = 0.682) > chl.a (λ = 0.607) > zooplankton (λ = 0.486).
3.5. Planktonic Co-Existence Patterns
As shown in Figure 5a, the abundance of zooplankton, particularly Rotifera and Copepoda, exhibited significant positive correlations with phytoplankton abundance. To better understand the temporal dynamics of plankton in Liangzi Lake, network analysis was performed with core taxa at module level, due to taxa within the same module are more likely to co-existence [5]. Phytoplankton and zooplankton networks exhibited distinct patterns during different sampling campaigns (Figure 6a). In detail, phytoplankton networks were divided into four dominant modules, and the proportion of dominant modules was higher in summer (98.8% and 95.3%), and the relationships among taxa were tighter in that season, while the proportion of dominant modules in summer 2022 was relatively lower. Further analysis of planktonic co-existence patterns revealed that complex interactions occurred between phytoplankton and zooplankton, and the distribution patterns of dominant modules are similar to those that occurred in phytoplankton. In spring, taxa belonged to Bacillariophyta (phytoplankton), Protozoa, and Rotifera (zooplankton) predominated the dominant modules with highest number of nodes (Figure 6b), while in summer, the predominated taxa in the dominant modules were Chlorophyta and Rotifera.
3.6. Comparison of eDNA Metabarcoding and Microscopical Analysis
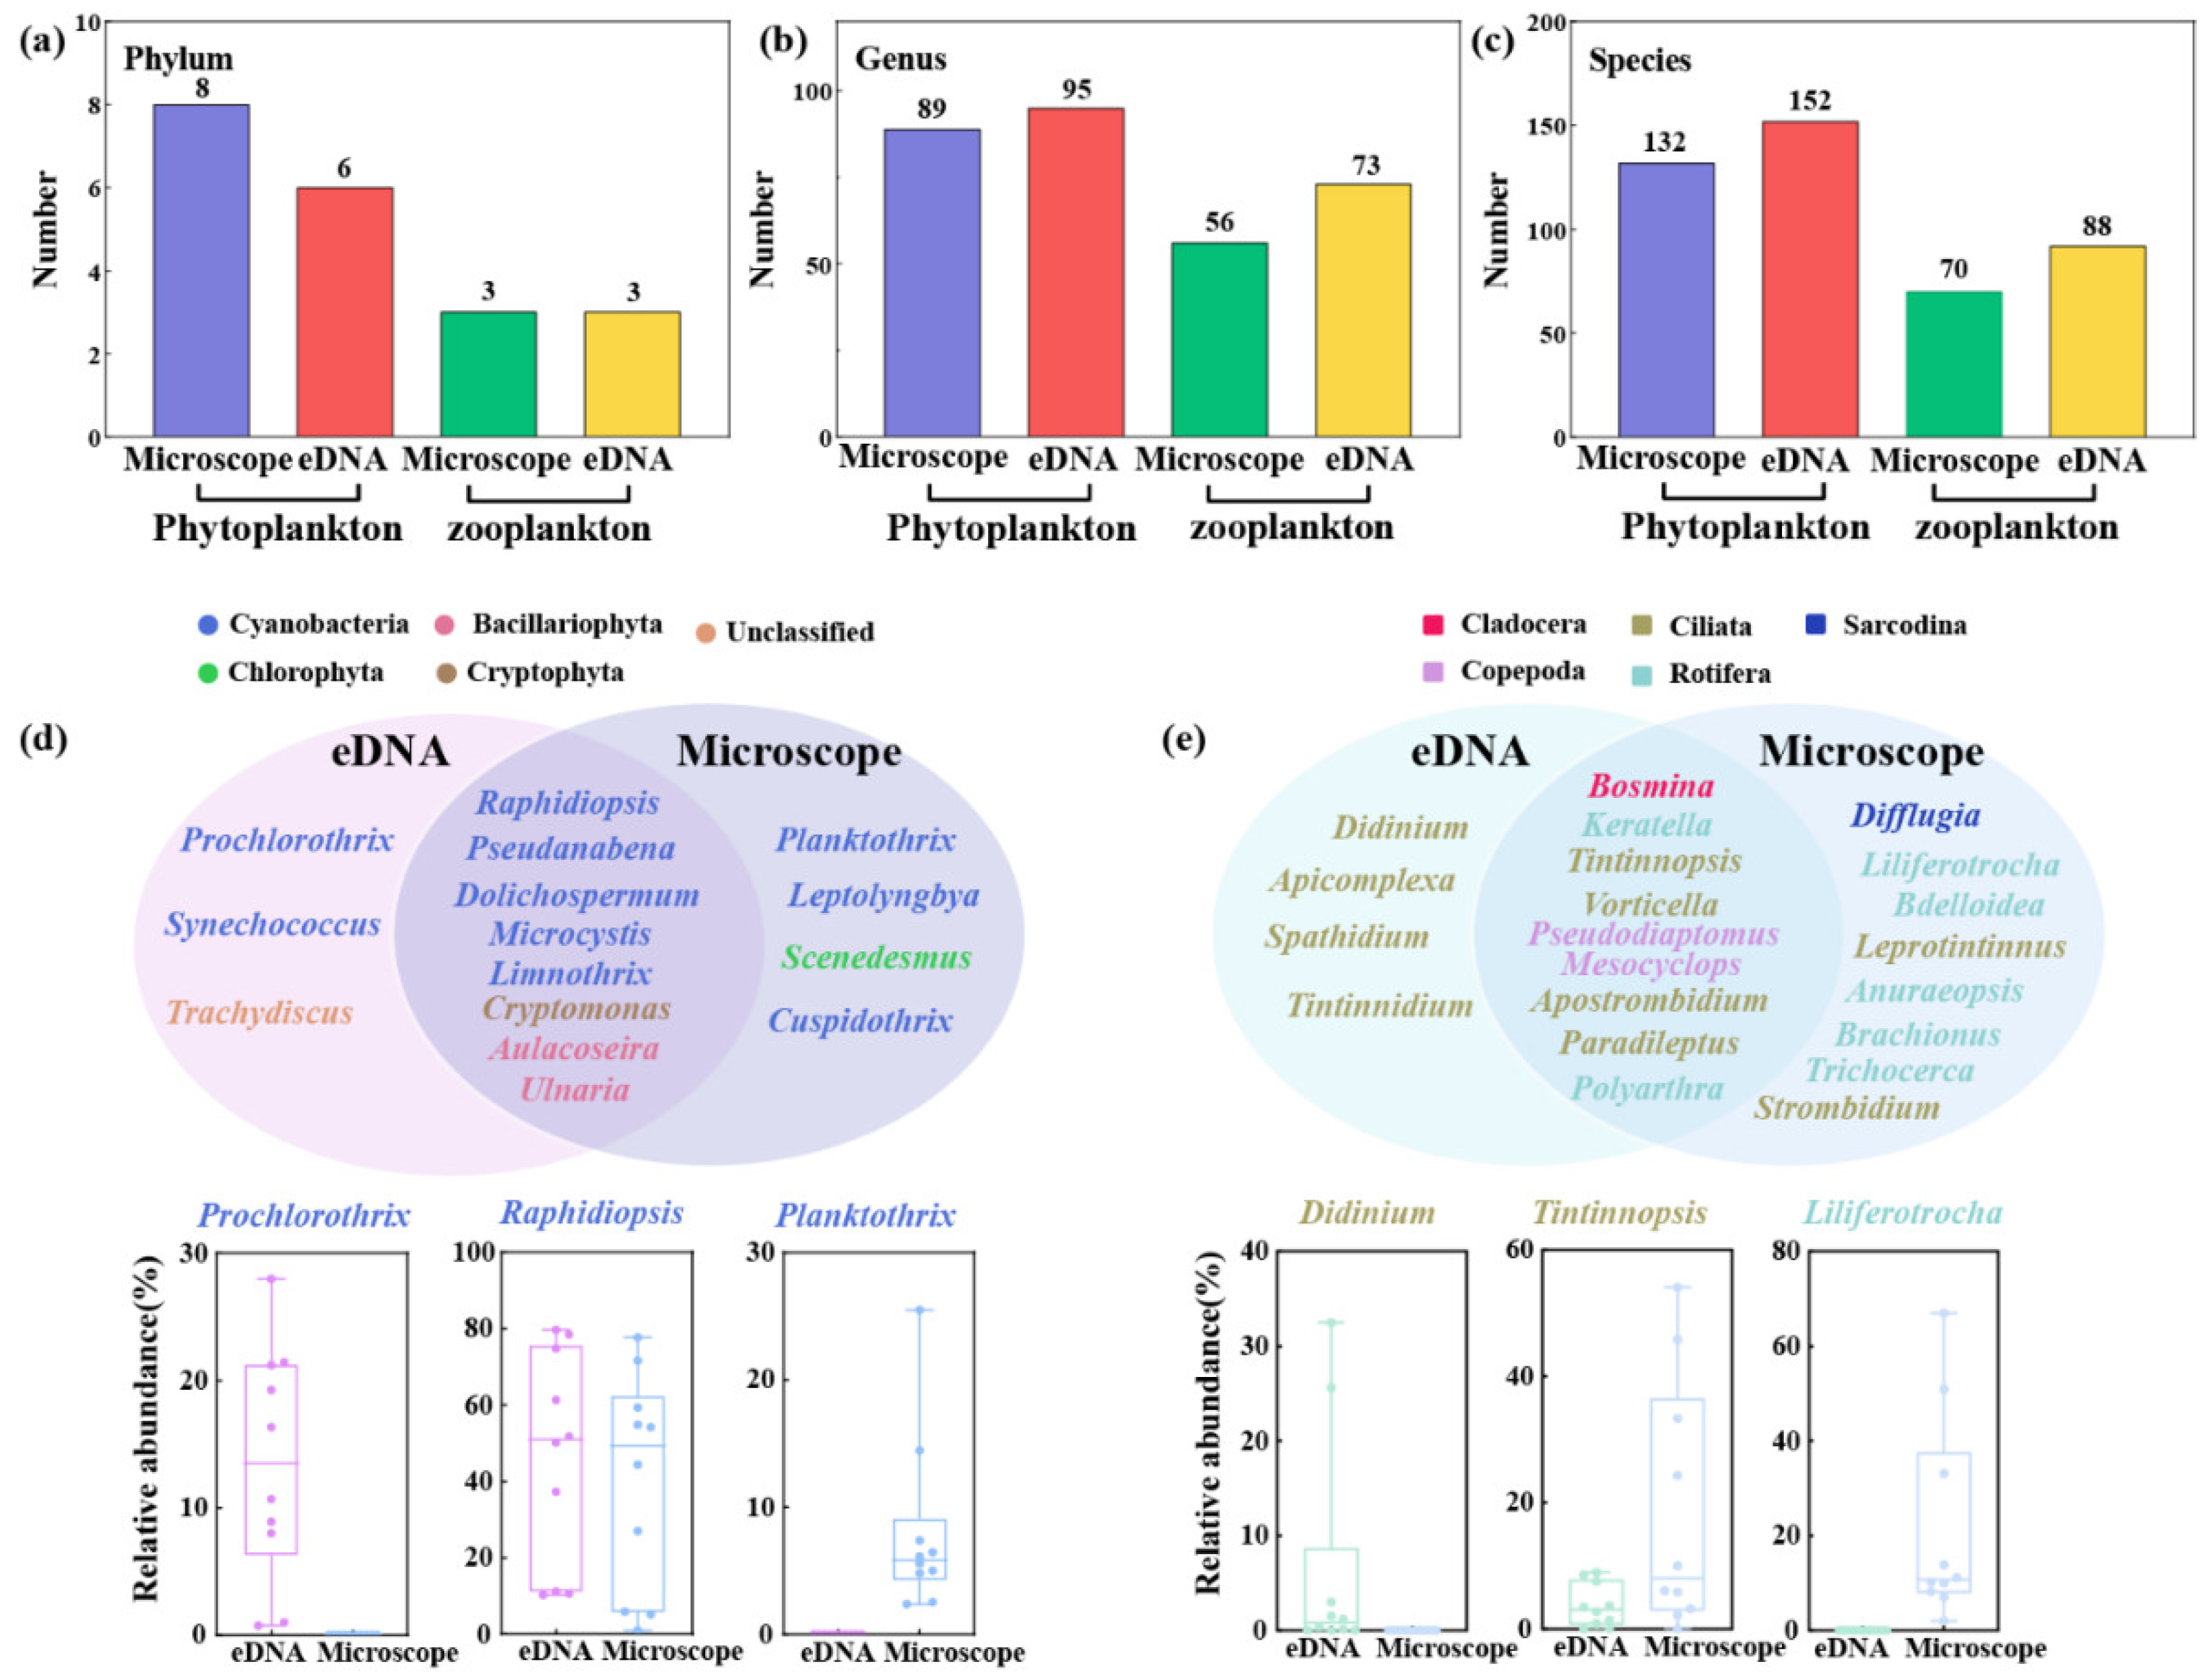
In this study, 8 phyla, 89 genera, and 132 species of phytoplankton were identified by microscopical analysis, and 6 phyla, 95 genera, and 152 species were identified by eDNA metabarcoding (Figure 7a–c). Phyla cyanobacteria, Bacillariophyta, Chlorophyta, Euglenophyta, and Cryptophyta were jointly identified by these two methods. As for zooplankton, more taxa at genera, and species levels were identified using eDNA metabarcoding. However, the number of identified core genera was higher using microscopical analysis (Figure 7d,e). In terms of phytoplankton, most of the jointly identified genera belonged to cyanobacteria, and Raphidiopsis was the predominant genus (40.1% and 46.5%). For zooplankton, the unique core genera identified using eDNA metabarcoding mainly belonged to Ciliata, whereas the unique core genera identified by the microscopical analysis mainly belonged to Rotifera.
4. Discussion
The biomass of phytoplankton in Liangzi Lake was significantly higher in summer than in spring, while zooplankton biomass exhibited no significant difference between both seasons (Figure S3), highlighting the different lifecycle of phytoplankton and zooplankton. The reason for this difference is that Liangzi Lake is a typical light eutrophic lake (TLI ≈ 50) (Figure 2). According to the modified plankton ecology group (PEG) model described by Sommer, Adrian [27], the biomass of phytoplankton in eutrophic waters would reach a peak in summer due to the sufficient nutrients. In contrast, the proliferous of inedible phytoplankton [28], and the predation of filtering-feeding fish such as Culter alburnus [29] may further limit the growth of zooplankton.
4.1. Temporal Dynamics and Environmental Response of Planktonic Communities
As a result of adaptation to environmental variations, the composition of phytoplankton in Liangzi Lake changed dramatically from spring to summer. Seasonal dynamics of plankton have been also observed in other freshwater systems [19,30]. In terms of phytoplankton, the abundances of them were significantly higher in summer, this is because the WT of Liangzi Lake in summer ranged from 26.8 to 31.7 ℃, which fell within the optimal temperature ranges for the growth of most organisms [31]. In Liangzi Lake, Bacillariophyta and cyanobacteria were dominated in spring and summer, respectively (Figure S3). Compared with other species, Bacillariophyta is competent to suffer harsh environmental conditions and thus dominant in low-temperature waters [32]. When it comes to summer, the rising temperature gives cyanobacteria competitive advantages over other species [33], leading to the bloom of cyanobacteria (Figure 3) [34,35]. Similar temporal dynamics of phytoplankton was also reported in Yongli Lake [36]. Particularly, the biomass and proportion (approximately 88% of the total abundance) of cyanobacteria in Liangzi Lake are significantly higher than in other eutrophic lakes such as Erhai Lake [37] and Hongze Lake [38], indicating the potential risk of cyanobacteria bloom in Liangzi Lake. In addition to WT, P limitation, and nutrient stoichiometry (N:P) are other important determinants that regulate the lifecycle of phytoplankton, especially cyanobacteria [39]. Our result showed that P limitation and high N:P ratios enhanced the community competition of cyanobacteria (Figure 5a), a similar phenomenon was also observed in a gravel-bed urban river [40]. Due to the low concentration of nutrients in the summer 2022 (Figure 2), the proportions of nitrogen-fixing cyanobacteria such as Leptolyngbya and Pseudanabena [41] were at high levels. In addition, phytoplankton with unicellular or filamentous shapes are efficient in nutrient use, which also contributed to the dominance of these species in nutrient-limited conditions [42].
As for zooplankton, though the Cladocera and Copepoda account for a high proportion of the total biomass in spring and summer (Figure 3), the dominant group in spring was Ciliata (Protozoa) in terms of abundance (Figure S3). This is because the body sizes of most zooplankton belonging to Ciliata are smaller than Cladocera and Copepoda. In addition, the result also indicates that the zooplankton in the eutrophic lake was usually dominated by small- and medium-sized species. Similar phenomena were also revealed in previous studies that small zooplankton taxa are dominated in aquatic environments [43,44]. Similarly to phytoplankton, WT was the most important determinant that drives the succession of zooplankton (Figure 4f and 5). With the increase of WT in summer, Rotifera becomes the dominant group due to their high reproductive rate and environmental adaptability at high-temperature conditions [45,46,47]. The results of RDA and correlation analyses also showed that chl.a, and DO have significant effects on the distribution of zooplankton. As mentioned in a previous study, low dissolved oxygen in summer synergically enhanced the advantages of rotifers [48]. In addition, rotifers are less affected by planktivorous fishes, which may also further increase their abundance in Liangzi Lake [49].
4.2. Interactions of Planktonic Communities
Results of network analysis implied that the stability and complexity of phytoplankton were higher in summer (Figure 6a), indicating that the increased WT tightened their biological interactions [5,50]. The high proportion of dominant modules in summer further suggested a higher niche differentiation degree, which indicated that co-occurring phytoplankton could use different strategies to utilize the available resources from the surrounding environment to avoid competition and maintain their advantages in eutrophic lakes [3,51]. Therefore, it is no wonder that phytoplankton in summer was only dominated by a few species such as Raphidiopsis, leading to low diversity and evenness of phytoplankton (Figure 4c and S4). The high abundance of cyanobacteria and low phytoplanktonic diversity were also previously found in eutrophic shallow lakes [33,52]. Although high WT led to the increased abundance of zooplankton in summer, the biological interaction among zooplankton was inactive (Figure 6a). As revealed in previous studies, phytoplankton is more sensitive to the rise of WT and results in rapid growth rates, while zooplankton can’t track the changes in primary production under increased WT [53].
As for the relationship between phytoplankton and zooplankton, the core taxa within the dominant modules in spring belonged to various groups, such as Bacillariophyta, Euglenophyta, Protozoa, Rotifera, and Cladocera (Figure 6b), while in summer, the core taxa within the dominant modules mainly belonged to Chlorophyta and Rotifera. It seems that the main relationship maintained among phytoplankton and zooplankton was changed from competition to predation. As described in a previous study, niche differentiation played a more important role in the community assembly of plankton especially in spring [19]. Therefore, there is no doubt that the temperature bottom-up shapes the phytoplankton to construct the phyto-zooplankton interaction [50]. In addition, the tightened interaction among phytoplankton and zooplankton in summer indicated a higher resistance of planktonic communities to environmental disturbances.
4.3. Difference Between Morphological Analysis and eDNA Metabarcoding
In terms of the plankton that exist in aquatic ecosystems, some species, especially small-sized ones, are difficult to distinguish through morphological characteristics [54,55], and the ignored identification via microscopical analysis would result in a low diversity of plankton [14]. In this study, more species were identified using eDNA metabarcoding compared to microscopical analysis (Figure 7a~c), implying that eDNA metabarcoding has advantages in revealing higher diversity of plankton [3,8,12]. The relative abundance of most unique species identified by eDNA metabarcoding is lower than 1%, which highlighted its high detection sensitivity [56]. Therefore, eDNA metabarcoding is competent to be acted as a useful tool to assess plankton biodiversity.
However, some limitations still existed for this method. Indeed, the biggest barrier to the application of eDNA metabarcoding is that the annotated databases don’t contain reference sequences for all of the plankton, resulting in the questionable identification of some species [57]. Substantial intraspecific variability of plankton also affected the accurate annotation of some species. In this study, 54 and 78 OTUs of phytoplankton and zooplankton failed to be annotated and classified as “unclassified”. This may explain why some species identified by microscopical analysis are missed via eDNA metabarcoding (Figure 7d and e). For example, Liliferotrocha subtilis was detected in the water samples with high detected frequency (100%) and abundance (21.4%) via microscopical analysis, eDNA metabarcoding failed to identify this species due to the lacked corresponding barcode sequence in the NCBI GenBank [46]. A previous study conducted by Liu et al., (2022) revealed that Asteroplanus karianus and Coscinodiscus asteromphalus, both belong to Bacillariophyta, were not detected in Jiaozhou Bay due to the deficiency of reference sequences [58]. In addition, some decaying biological matters could be also identified by eDNA metabarcoding, which may further affect the understanding of the “true” plankton community [59]. Song and Liang (2023) previously used 18S and COI primer pairs to identify the composition of zooplankton and demonstrated that the choice of primer pairs has significant effects on the identification of zooplankton [8].
In the process of microscopical analysis, the larvae, small-sized species, other uncountable species, and similar morphological species cannot be accurately identified or assigned to appropriate taxonomic levels [58]. In addition, the body sizes of zooplankton varied greatly among different groups, commonly from a few micrometers to a few millimeters. According to previous studies [8,46], the calculation of species abundance in eDNA metabarcoding was based on DNA contents, but in microscopical analysis, the calculation of species abundance was based on cell numbers. Therefore, the increased differences in body sizes would decrease the community similarity between the two methods due to algorithmic differences. As a result, the composition of zooplankton was identified by the two methods with lower similarity (Figure 4d and 7e). In our study, small-sized copepods such as Pseudodiaptomus (accounting for 34.8% of the total abundance in eDNA metabarcoding) were identified with low abundances (< 1%) by microscopical analysis. Despite it has some non-negligible disadvantages, microscopical analysis was more suitable for evaluating the response of plankton to environmental stress. As described in a previous study, compared with eDNA metabarcoding, morphological analysis can identify more significant variations across treatments in terms of the number of species and relative abundance [46]. Therefore, though the low matching degree still exists between the two methods, and it is difficult to unify the results of the two methods, the combination of the two methods is suggested to better understand the structuring mechanisms of plankton assemblages.
5. Conclusions
Our study analyzed the structure, environmental response, and interactions of plankton in an typical lake in the middle reaches of the Yangtze River and assessed the difference between eDNA metabarcoding and microscopical analysis in identifying plankton. Plankton composition exhibited strong temporal variations, with water temperature emerging as a critical driver. Phytoplankton especially cyanobacteria in summer was with high biomass and abundance, resulting in a high potential risk of cyanobacteria blooms. Zooplankton is insensitive to changes in surrounding environments when compared with phytoplankton. Rotifera was the dominant group in terms of both abundance and biomass in summer. Network analysis further revealed that the temperature bottom-up shapes the phytoplankton to construct the phyto-zooplankton interaction. Though eDNA metabarcoding has advantages in identifying the composition of plankton compared to microscopical analysis, supplementary taxa detected by microscopical analysis highlight the benefits of combining both approaches for a comprehensive understanding of plankton occurrence and distribution in water ecosystems.
Supplementary Materials
The following supporting information can be downloaded at the website of this paper posted on Preprints.org, Figure S1: The absolute (a) and relative (b) abundances of phytoplankton at different sampling points (L1 ~ L10) in different seasons (Spr22, Sum22, Spr23, and Sum23); Figure S2: The absolute (a) and relative (b) abundances of zooplankton at different sampling points (L1 ~ L10) in different seasons (Spr22, Sum22, Spr23, and Sum23); Figure S3: The absolute (a) and relative (b) abundances of phytoplankton in different seasons at the phylum level; the absolute (c) and relative (d) abundances of zooplankton in different seasons; Figure S4: The Pielou index of the phytoplankton community, and the Pielou index of the Zooplankton community. All indices were calculated at the species level. The data were presented as mean ± standard deviations (SD).
Author Contributions
Borui Zou, and Hongjuan Hu: conceptualization, software, validation, formal analysis, investigation, and writing-original draft, B.Z. and H.H.; conceptualization, methodology, resources, W.W., X.L., X.C., W.Z. and H.Z.; validation, formal analysis, investigation, writing-review, and editing, J.J.; funding acquisition, conceptualization, resources, and writing-review and editing, C.W.
Funding
This research was funded by the National Natural Science Foundation of China (51909012) and National Key Research and Development Program of China (2023YFC3304300).
Data Availability Statement
The data used in this study are available on request.
Conflicts of Interest
The authors declare no conflicts of interest.
References
- Choo, S.; Kwak, M.T.; Cho, Y.K.; Yoon, Y.H.; Soh, H.Y. Effects of water masses on the zooplankton community structure in the northern East China Sea during the East Asian Summer Monsoon in 2020. Ecol. Indic. 2023, 154, 110847. [Google Scholar] [CrossRef]
- Seymour, J.R.; Amin, S.A.; Raina, J.B.; Stocker, R. Zooming in on the phycosphere: the ecological interface for phytoplankton-bacteria relationships. Nat. Microbiol. 2017, 2, 17065. [Google Scholar] [CrossRef]
- Zeng, L.; Wen, J.; Huang, B.; Yang, Y.; Huang, Z.; Zeng, F.; Fang, H.; Du, H. Environmental DNA metabarcoding reveals the effect of environmental selection on phytoplankton community structure along a subtropical river. Environ. Res. 2024, 243, 117708. [Google Scholar] [CrossRef] [PubMed]
- Park, T.; Lee, G.; Shin, J.; Park, J.-h.; Choi, B.; Kim, D.-K.; Cha, Y. Changes in zooplankton community in response to a shift from lentic to lotic conditions in a regulated river. Ecol. Inform. 2023, 77, 102236. [Google Scholar] [CrossRef]
- Ding, X.; Liu, J.; Liu, W.; Dai, S.; Ke, Z.; Guo, J.; Lai, Y.; Tan, Y. Phytoplankton Communities Miniaturization Driven by Extreme Weather in Subtropical Estuary under Climate Changes. Water Res. 2023, 245, 120588. [Google Scholar] [CrossRef]
- Fu, X.; Shi, W.; Liu, Z.; Wang, X.; Zhang, G.; Sun, J. Impact of environmental variables on the distribution of phytoplankton communities in the Southern Yellow Sea. Environ. Res. 2024, 243, 117862. [Google Scholar] [CrossRef]
- Liu, Z.; Yang, A.; Liu, J.; Xing, C.; Huang, S.; Huo, Y.; Yang, Z.; Huang, J.; Liu, W. Turnover of phytoplankton and zooplankton communities driven by human-induced disturbances and climate changes in a small urban coastal wetland. Ecol. Indic. 2023, 157, 111271. [Google Scholar] [CrossRef]
- Song, J.; Liang, D. Community structure of zooplankton and its response to aquatic environmental changes based on eDNA metabarcoding. J. Hydrol. 2023, 622, 129692. [Google Scholar] [CrossRef]
- Liao, N.; Chen, Z.; Zhang, L.; Chen, M.; Zhang, Y.; Li, J.; Wang, H. Study on the spatiotemporal distribution of algal blooms and its influencing factors in young reservoirs based on remote sensing interpretation. J. Environ. Manage. 2024, 354, 120333. [Google Scholar] [CrossRef]
- Hu, Q.; Chen, Y.; Xia, R.; Liu, X.; Jia, R.; Zhang, K.; Li, X.; Yan, C.; Wang, Y.; Yin, Y.; et al. Weakened hydrological oscillation period increased the frequency of river algal blooms. Water Res. 2024, 255, 121496. [Google Scholar] [CrossRef]
- Wang, N.; Mark, N.; Launer, N.; Hirtler, A.; Weston, C.; Cleckner, L.; Faehndrich, C.; LaGorga, L.; Xia, L.; Pyrek, D.; et al. Harmful algal blooms in Cayuga lake, NY: From microbiome analysis to eDNA monitoring. J. Environ. Manage. 2024, 354, 120128. [Google Scholar] [CrossRef]
- Meng, J.; Xu, F.; Yang, H.; Li, X.; Zhao, P. Exploring microbiome and plankton responses and interactions in the mangrove ecosystem through eDNA and network analysis. Sci. Total. Environ. 2024, 930, 172581. [Google Scholar] [CrossRef]
- Djurhuus, A.; Pitz, K.; Sawaya, N.A.; Rojas-Márquez, J.; Michaud, B.; Montes, E.; Muller-Karger, F.; Breitbart, M. Evaluation of marine zooplankton community structure through environmental DNA metabarcoding. Limnol. Oceanogr. 2018, 16, 209–221. [Google Scholar] [CrossRef] [PubMed]
- Ji, C.W.; Oh, H.J.; Chang, K.H.; Park, Y.S.; Kwak, I.S. A Comparative Analyzing of Zooplankton Community Diversity in Surface Layer Water of Reservoir Via eDNA Metabarcoding and Microscopy. Diversity 2022, 14. [Google Scholar] [CrossRef]
- Ge, Y.; Zhang, Q.; Dong, X.; Yang, X. Revealing anthropogenic effects on lakes and wetlands: Pollen-based environmental changes of Liangzi Lake, China over the last 150 years. Catena 2021, 207, 105605. [Google Scholar] [CrossRef]
- Meng, X.; Zhang, W.; Shan, B. Distribution of nitrogen and phosphorus and estimation of nutrient fluxes in the water and sediments of Liangzi Lake, China. Environ. Sci. Pollut. Res. Int. 2020, 27, 7096–7104. [Google Scholar] [CrossRef] [PubMed]
- Chen, N.; Wang, S.; Zhang, X.; Yang, S. A risk assessment method for remote sensing of cyanobacterial blooms in inland waters. Sci. Total. Environ. 2020, 740, 140012. [Google Scholar] [CrossRef]
- Wang, C.; Zhu, Y.; Wang, L.; Wu, W. Assessment on Ecosystem Health in the Liangzi Lake. Environ. Sci. Technol. (In Chinese). 2015, 38, 398–404. [Google Scholar]
- Yi, M.; Li, L.; Li, H.; Liu, C.; Deng, Y.; Wu, Z.; Li, Y. Spatiotemporal variations of plankton communities in different water bodies of the Yellow River: Structural characteristics, biogeographic patterns, environmental responses, and community assembly. J. Hydrol. 2024, 640, 131702. [Google Scholar] [CrossRef]
- Guiry, M.D.; Guiry, G.M.; AlgaeBase. World-wide electronic publication, University of Galway. Available online: https://www.algaebase.org (accessed on 5 December 2024).
- Jia, J.; Xi, X.; Li, X.; Hu, H.; Chen, K.; Wu, C. Characteristics of microbial communities and antibiotic resistance genes in typical rivers of the western Qinghai Lake basin. Water Bio. Sec. 2024, 100249. [Google Scholar] [CrossRef]
- Jia, J.; Guan, Y.; Cheng, M.; Chen, H.; He, J.; Wang, S.; Wang, Z. Occurrence and distribution of antibiotics and antibiotic resistance genes in Ba River, China. Environ. Sci. Technol. 2018, 642, 1136–1144. [Google Scholar] [CrossRef]
- Wu, S.; Dong, Y.; Stoeck, T.; Wang, S.; Fan, H.; Wang, Y.; Zhuang, X. Geographic characteristics and environmental variables determine the diversities and assembly of the algal communities in interconnected river-lake system. Water Res. 2023, 233, 119792. [Google Scholar] [CrossRef]
- Jia, J.; Cheng, M.; Xue, X.; Guan, Y.; Wang, Z. Characterization of tetracycline effects on microbial community, antibiotic resistance genes and antibiotic resistance of Aeromonas spp. in gut of goldfish Carassius auratus Linnaeus. Ecotoxicol. Environ. Saf. 2020, 191, 110182. [Google Scholar] [CrossRef] [PubMed]
- Ren, Y.; Yu, G.; Shi, C.; Liu, L.; Guo, Q.; Han, C.; Zhang, D.; Zhang, L.; Liu, B.; Gao, H.; et al. Majorbio Cloud: A one-stop, comprehensive bioinformatic platform for multiomics analyses. iMeta 2022, 1, e12. [Google Scholar] [CrossRef] [PubMed]
- Team, R.D.C.J.C. R: A Language and Environment for Statistical Computing. R Foundation for Statistical Computing:Vienna, Austria. 2009, 14, 12–21. [Google Scholar]
- Sommer, U.; Adrian, R.; De Senerpont Domis, L.; Elser, J.J.; Gaedke, U.; Ibelings, B.; Jeppesen, E.; Lürling, M.; Molinero, J.C.; Mooij, W.M.; et al. Beyond the Plankton Ecology Group (PEG) Model: Mechanisms Driving Plankton Succession. Annu. Rev. Ecol. Evol. Syst. 2012, 43, 429–448. [Google Scholar] [CrossRef]
- dos Santos Severiano, J.; dos Santos Almeida-Melo, V.L.; Bittencourt-Oliveira, M.d.C.; Chia, M.A.; do Nascimento Moura, A. Effects of increased zooplankton biomass on phytoplankton and cyanotoxins: A tropical mesocosm study. Harmful algae 2018, 71, 10–18. [Google Scholar] [CrossRef]
- Shi, J.; Wang, D.; Wang, J.; Sheng, J.; Peng, K.; Hu, B.; Zeng, L.; Xiao, M.; Hong, Y. Comparative analysis of the complete mitochondrial genomes of three geographical topmouth culter (Culter alburnus) groups and implications for their phylogenetics. Biosci. Biotech. Bioch. 2017, 81, 482–490. [Google Scholar] [CrossRef]
- Liu, H.; Cheng, W.; Xiong, P.; Li, H.; Liu, Z.; Ai, J.; Yuan, D.; Wan, F.; Wan, Y.; Zou, H.; et al. Temporal variation of plankton and zoobenthos communities in a freshwater reservoir: Structure feature, construction mechanism, associated symbiosis and environmental response. Ecol. Indic. 2023, 154, 110774. [Google Scholar] [CrossRef]
- Zhou, S.Y.; Lie, Z.; Liu, X.; Zhu, Y.G.; Peñuelas, J.; Neilson, R.; Su, X.; Liu, Z.; Chu, G.; Meng, Z.; et al. Distinct patterns of soil bacterial and fungal community assemblages in subtropical forest ecosystems under warming. Global change biol. 2023, 29, 1501–1513. [Google Scholar] [CrossRef]
- Xu, S.; Xiao, Y.; Xu, Y.; Su, L.; Cai, Y.; Qi, Z.; Liu, Y.; Chen, Z.; Lakshmikandan, M. Effects of seasonal variations and environmental factors on phytoplankton community structure and abundance in Beibu Gulf, China. Ocean Coast Manage. 2024, 248, 106982. [Google Scholar] [CrossRef]
- T-Krasznai, E.; Török, P.; Borics, G.; Lukács, Á.; Kókai, Z.; Lerf, V.; Görgényi, J.; B-Béres, V. Functional dynamics of phytoplankton assemblages in hypertrophic lakes: Functional- and species diversity is highly resistant to cyanobacterial blooms. Ecol. Indic. 2022, 145, 109583. [Google Scholar] [CrossRef]
- Karpowicz, M.; Kornijów, R.; Ejsmont-Karabin, J.; Nawrocka, L.; Kobos, J.; Jakubowska, A.; Grzonkowski, K. Seasonal dynamics of phytoplankton and zooplankton communities in the estuarine Elblag Bay (Vistula Lagoon, southern Baltic) dominated by floating-leaved plants. Ecohydrol. Hydrobiol. (In press). 2024. [Google Scholar] [CrossRef]
- Paerl, H.W.; Paul, V.J. Climate change: Links to global expansion of harmful cyanobacteria. Water Res. 2012, 46, 1349–1363. [Google Scholar] [CrossRef]
- Wu, Y.; Peng, C.; Li, G.; He, F.; Huang, L.; Sun, X.; Wu, S. Integrated evaluation of the impact of water diversion on water quality index and phytoplankton assemblages of eutrophic lake: A case study of Yilong Lake. J. Environ. Manage. 2024, 357, 120707. [Google Scholar] [CrossRef] [PubMed]
- Cao, J.; Hou, Z.Y.; Li, Z.K.; Zheng, B.H.; Chu, Z.S. Spatiotemporal dynamics of phytoplankton biomass and community succession for driving factors in a meso-eutrophic lake. J. Environ. Manage. 2023, 345, 118693. [Google Scholar] [CrossRef]
- Shi, J.; Ni, L.; Liu, J.; Xu, C.; Zhang, J.; Chen, X. Spatiotemporal distribution of phytoplankton community structure and its relationship with environmental factors in Hongze Lake, China. Urban Clim. 2023, 52, 101746. [Google Scholar] [CrossRef]
- Jabir, T.; Vipindas, P.V.; Jesmi, Y.; Valliyodan, S.; Parambath, P.M.; Singh, A.; Abdulla, M.H. Nutrient stoichiometry (N:P) controls nitrogen fixation and distribution of diazotrophs in a tropical eutrophic estuary. Mar. Pollut. Bull. 2020, 151, 110799. [Google Scholar] [CrossRef]
- Zhao, F.; Xu, H.; Kang, L.; Zhao, X. Spatial and seasonal change in algal community structure and its interaction with nutrient dynamics in a gravel-bed urban river. J. Hazard Mater. 2022, 425, 127775. [Google Scholar] [CrossRef]
- Bustos-Díaz, E.D.; Barona-Gómez, F.; Cibrián-Jaramillo, A. Chapter 2 - Cyanobacteria in Nitrogen-Fixing Symbioses. In Cyanobacteria; Mishra, A.K., Tiwari, D.N., Rai, A.N., Eds.; Academic Press, 2019; pp. 29–42. [Google Scholar]
- Carneiro, F.M.; Santos, A.M.C.; Medina, N.G.; De Marco Júnior, P.; Hortal, J. Drivers of phytoplankton diversity in tropical artificial ponds. Perspect. Ecol. Conser. 2024, 22, 167–176. [Google Scholar] [CrossRef]
- Tao, T.; Wang, H.; Na, X.; Liu, Y.; Zhang, N.; Lu, X.; Fan, Y. Temperate urban wetland plankton community stability driven by environmental variables, biodiversity, and resource use efficiency: A case of Hulanhe Wetland. Front. Ecol. Evol. 2023, 11. [Google Scholar] [CrossRef]
- Wang, L.; Chen, J.; Su, H.J.; Ma, X.F.; Wu, Z.X.; Shen, H.; Yu, J.; Liu, J.R.; Wu, Y.; Ding, G.Y.; et al. Is Zooplankton Body Size an Indicator of Water Quality in (Sub)tropical Reservoirs in China? Ecosystems 2022, 25, 308–319. [Google Scholar] [CrossRef]
- Shen, J.; Qin, G.; Yu, R.; Zhao, Y.; Yang, J.; An, S.; Liu, R.; Leng, X.; Wan, Y. Urbanization has changed the distribution pattern of zooplankton species diversity and the structure of functional groups. Ecol. Indic. 2021, 120, 106944. [Google Scholar] [CrossRef]
- Chen, Y.; Wang, H.; Gong, Y.; Zhang, P.; Zhang, H.; Wang, T.; Xie, J.; Xu, J.; Wang, H.; Kong, X. Benefits of combined environmental DNA and microscopy for diversity monitoring in rotifer community: A mesocosm experiment. Ecol. Indic. 2023, 155, 110930. [Google Scholar] [CrossRef]
- Marshall, C.C.; Watkins, J.M.; Connolly, J.K.; Boynton, P.V.; Schaefer, S.L.; Currie, W.J.S.; Rudstam, L.G. Patterns and drivers of seasonal succession and vertical distribution in the rotifer community of Lake Ontario in 2018. J. Great Lakes Res. 2024, 50, 102283. [Google Scholar] [CrossRef]
- Nwinyimagu, A.J.; Eyo, J.E.; Okogwu, O.I. Seasonal variation in abundance and diversity of zooplankton in Asu River, Ebonyi state, Nigeria. Acta Ecologica Sinica 2021, 41, 591–596. [Google Scholar] [CrossRef]
- Shao, Z.; Xie, P.; Zhuge, Y. Long-term changes of planktonic rotifers in a subtropical Chinese lake dominated by filter-feeding fishes. Freshwater Biol. 2001, 46, 973–986. [Google Scholar] [CrossRef]
- Zhang, Z.; Li, H.; Shen, W.; Du, X.; Li, S.; Wei, Z.; Zhang, Z.; Feng, K.; Deng, Y. The large-scale spatial patterns of ecological networks between phytoplankton and zooplankton in coastal marine ecosystems. Sci. Total. Environ. 2022, 827, 154285. [Google Scholar] [CrossRef]
- Shuwang, X.; Zhang, G.; Li, D.; Wen, Y.; Zhang, G.; Sun, J. Spatial and temporal changes in the assembly mechanism and co-occurrence network of the chromophytic phytoplankton communities in coastal ecosystems under anthropogenic influences. Sci. Total. Environ. 2023, 877, 162831. [Google Scholar] [CrossRef]
- Bockwoldt, K.A.; Nodine, E.R.; Mihuc, T.B.; Shambaugh, A.D.; Stockwell, J.D. Reduced phytoplankton and zooplankton diversity associated with increased cyanobacteria in Lake Champlain, USA. J. Contemp. Water Res. Educ. 2017, 160, 100–118. [Google Scholar] [CrossRef]
- Marrec, P.; McNair, H.; Franzè, G.; Morison, F.; Strock, J.P.; Menden-Deuer, S. Seasonal variability in planktonic food web structure and function of the Northeast U.S. Shelf. Limnol. Oceanogr. 2021, 66, 1440–1458. [Google Scholar] [CrossRef]
- Bohmann, K.; Evans, A.; Gilbert, M.T.P.; Carvalho, G.R.; Creer, S.; Knapp, M.; Yu, D.W.; de Bruyn, M. Environmental DNA for wildlife biology and biodiversity monitoring. Trends Ecol. Evol. 2014, 29, 358–367. [Google Scholar] [CrossRef] [PubMed]
- Ruppert, K.M.; Kline, R.J.; Rahman, M.S. Past, present, and future perspectives of environmental DNA (eDNA) metabarcoding: A systematic review in methods, monitoring, and applications of global eDNA. Glob. Ecol. Conserv. 2019, 17, e00547. [Google Scholar] [CrossRef]
- Deiner, K.; Fronhofer, E.A.; Mächler, E.; Walser, J.C.; Altermatt, F. Environmental DNA reveals that rivers are conveyer belts of biodiversity information. Nat. Commun. 2016, 7, 12544. [Google Scholar] [CrossRef]
- Harvey, J.B.J.; Johnson, S.B.; Fisher, J.L.; Peterson, W.T.; Vrijenhoek, R.C. Comparison of morphological and next generation DNA sequencing methods for assessing zooplankton assemblages. J. Exp. Mar. Biol. Ecol. 2017, 487, 113–126. [Google Scholar] [CrossRef]
- Liu, S.; Cui, Z.; Zhao, Y.; Chen, N. Composition and spatial-temporal dynamics of phytoplankton community shaped by environmental selection and interactions in the Jiaozhou Bay. Water Res. 2022, 218, 118488. [Google Scholar] [CrossRef]
- Cowart, D.A.; Murphy, K.R.; Cheng, C.H.C. Metagenomic sequencing of environmental DNA reveals marine faunal assemblages from the West Antarctic Peninsula. Marine Genomics 2018, 37, 148–160. [Google Scholar] [CrossRef]
Figure 1.
Map of Liangzi Lake with the sampling sites (L1 ~ L10).
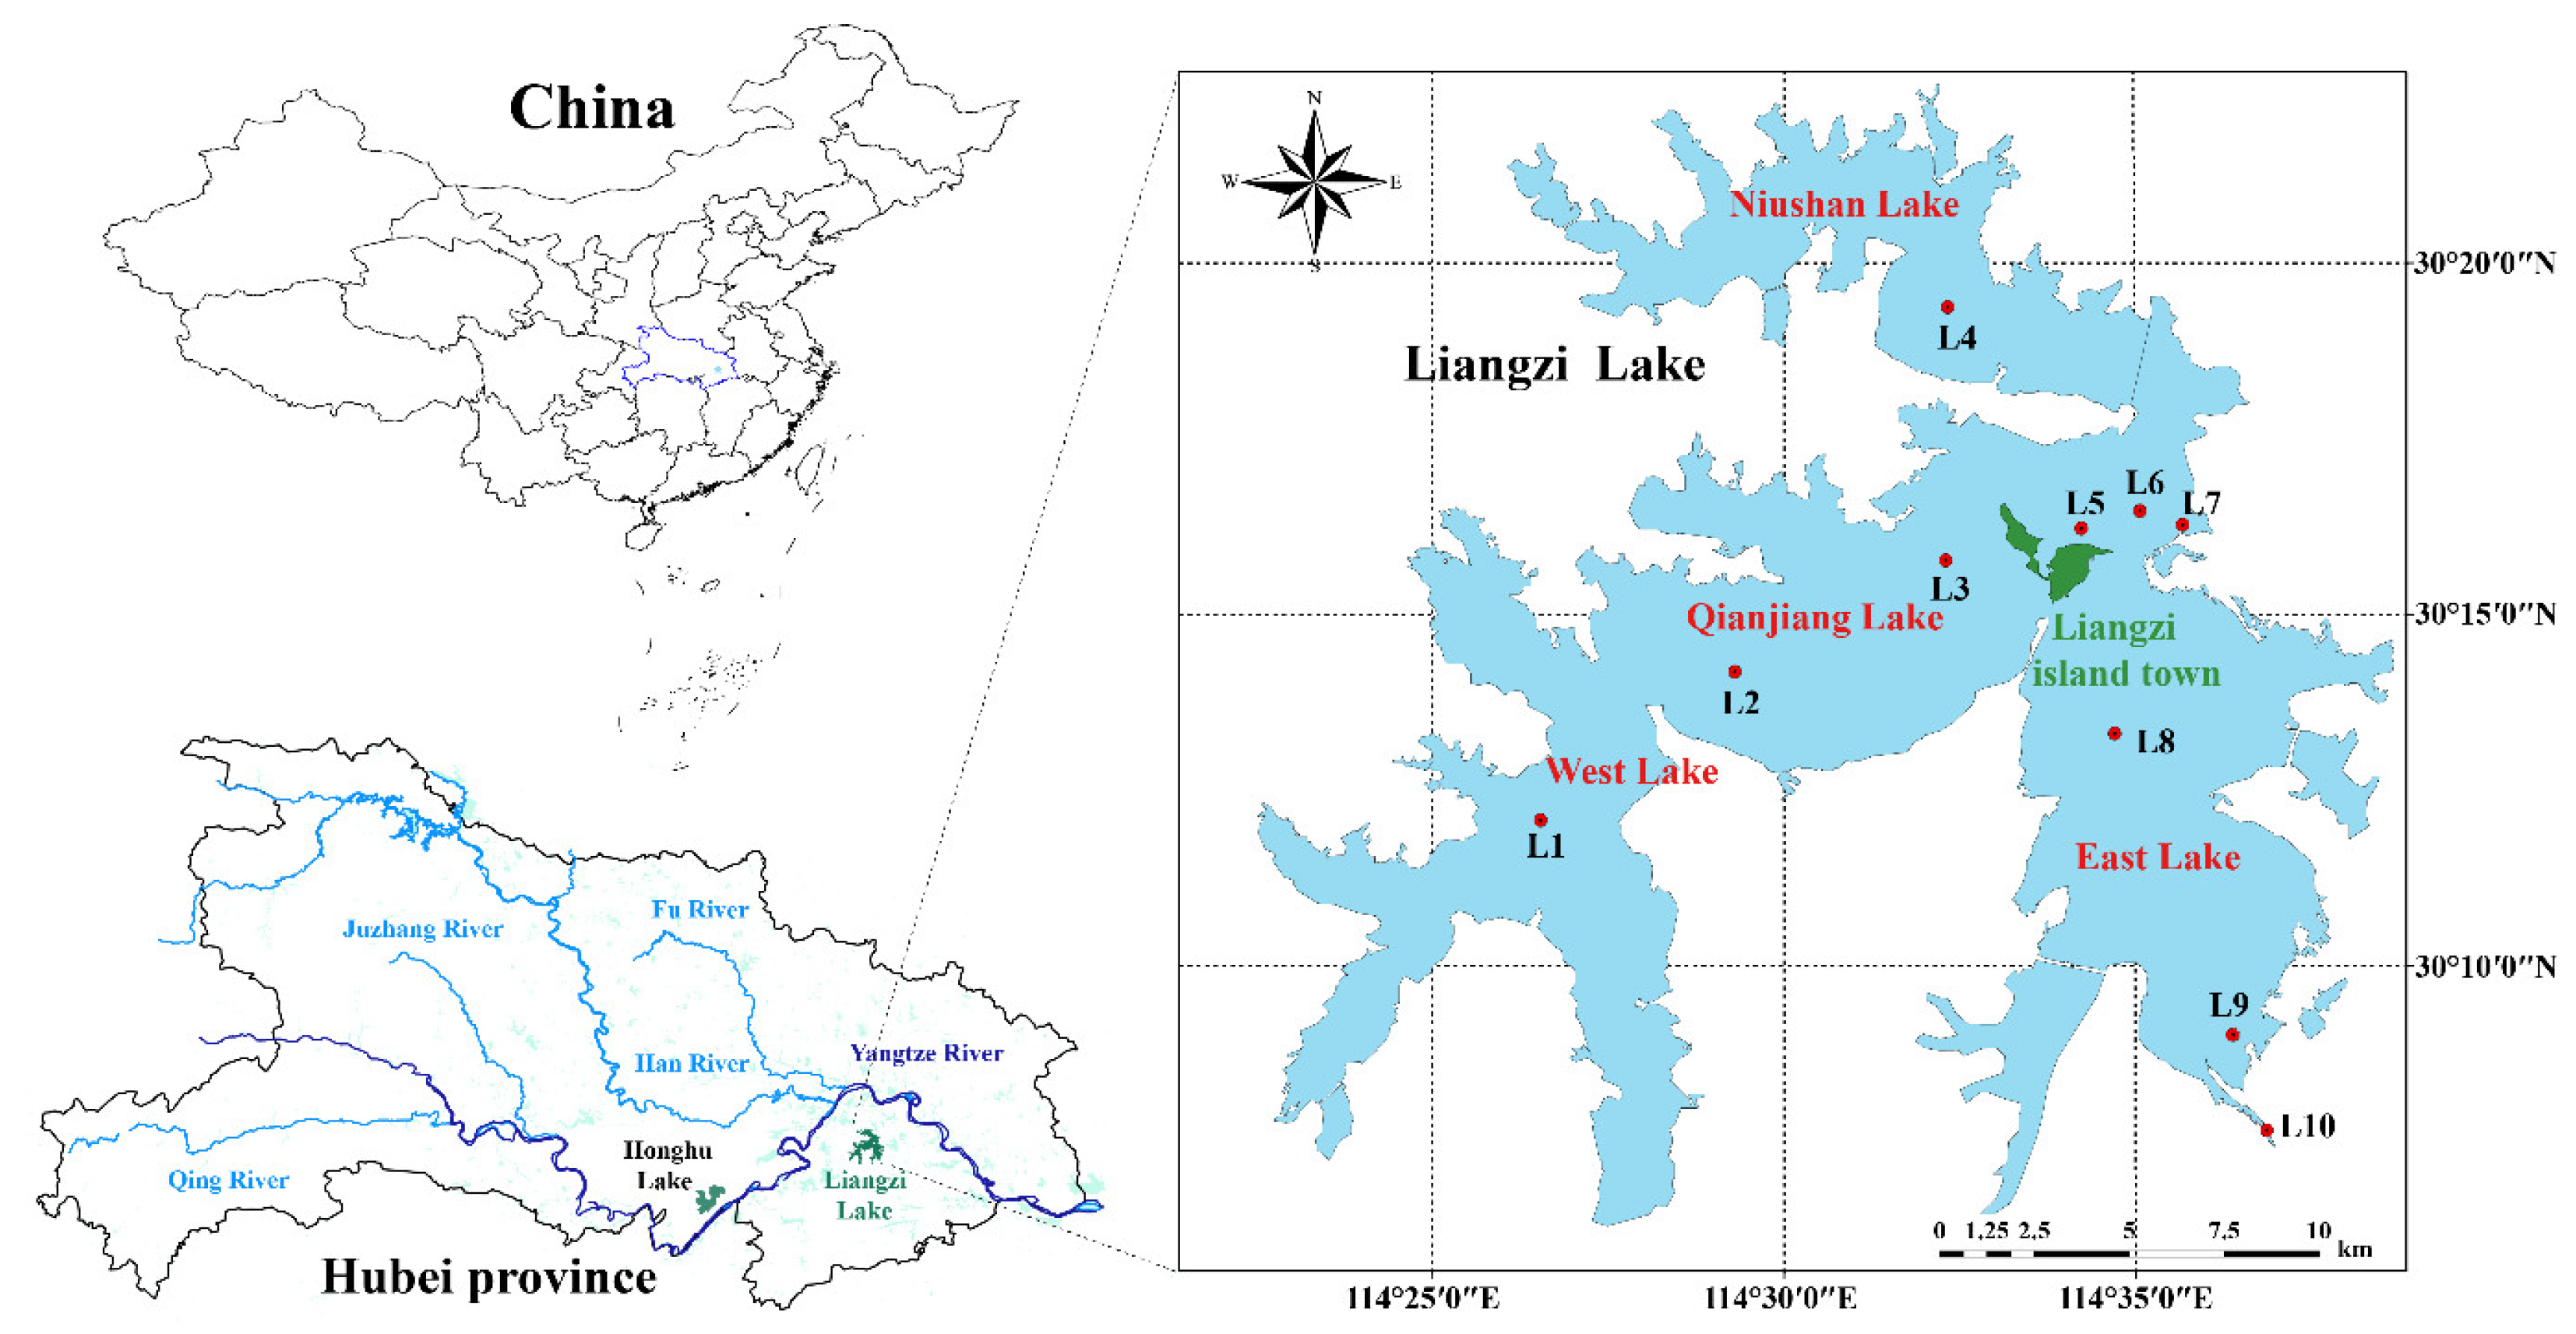
Figure 2.
The physical and chemical characteristics of water in Liangzi Lake. The different lowercase letters (a, b, and c) indicate statistically significant differences. Data were presented as Mean ± SD.
Figure 2.
The physical and chemical characteristics of water in Liangzi Lake. The different lowercase letters (a, b, and c) indicate statistically significant differences. Data were presented as Mean ± SD.
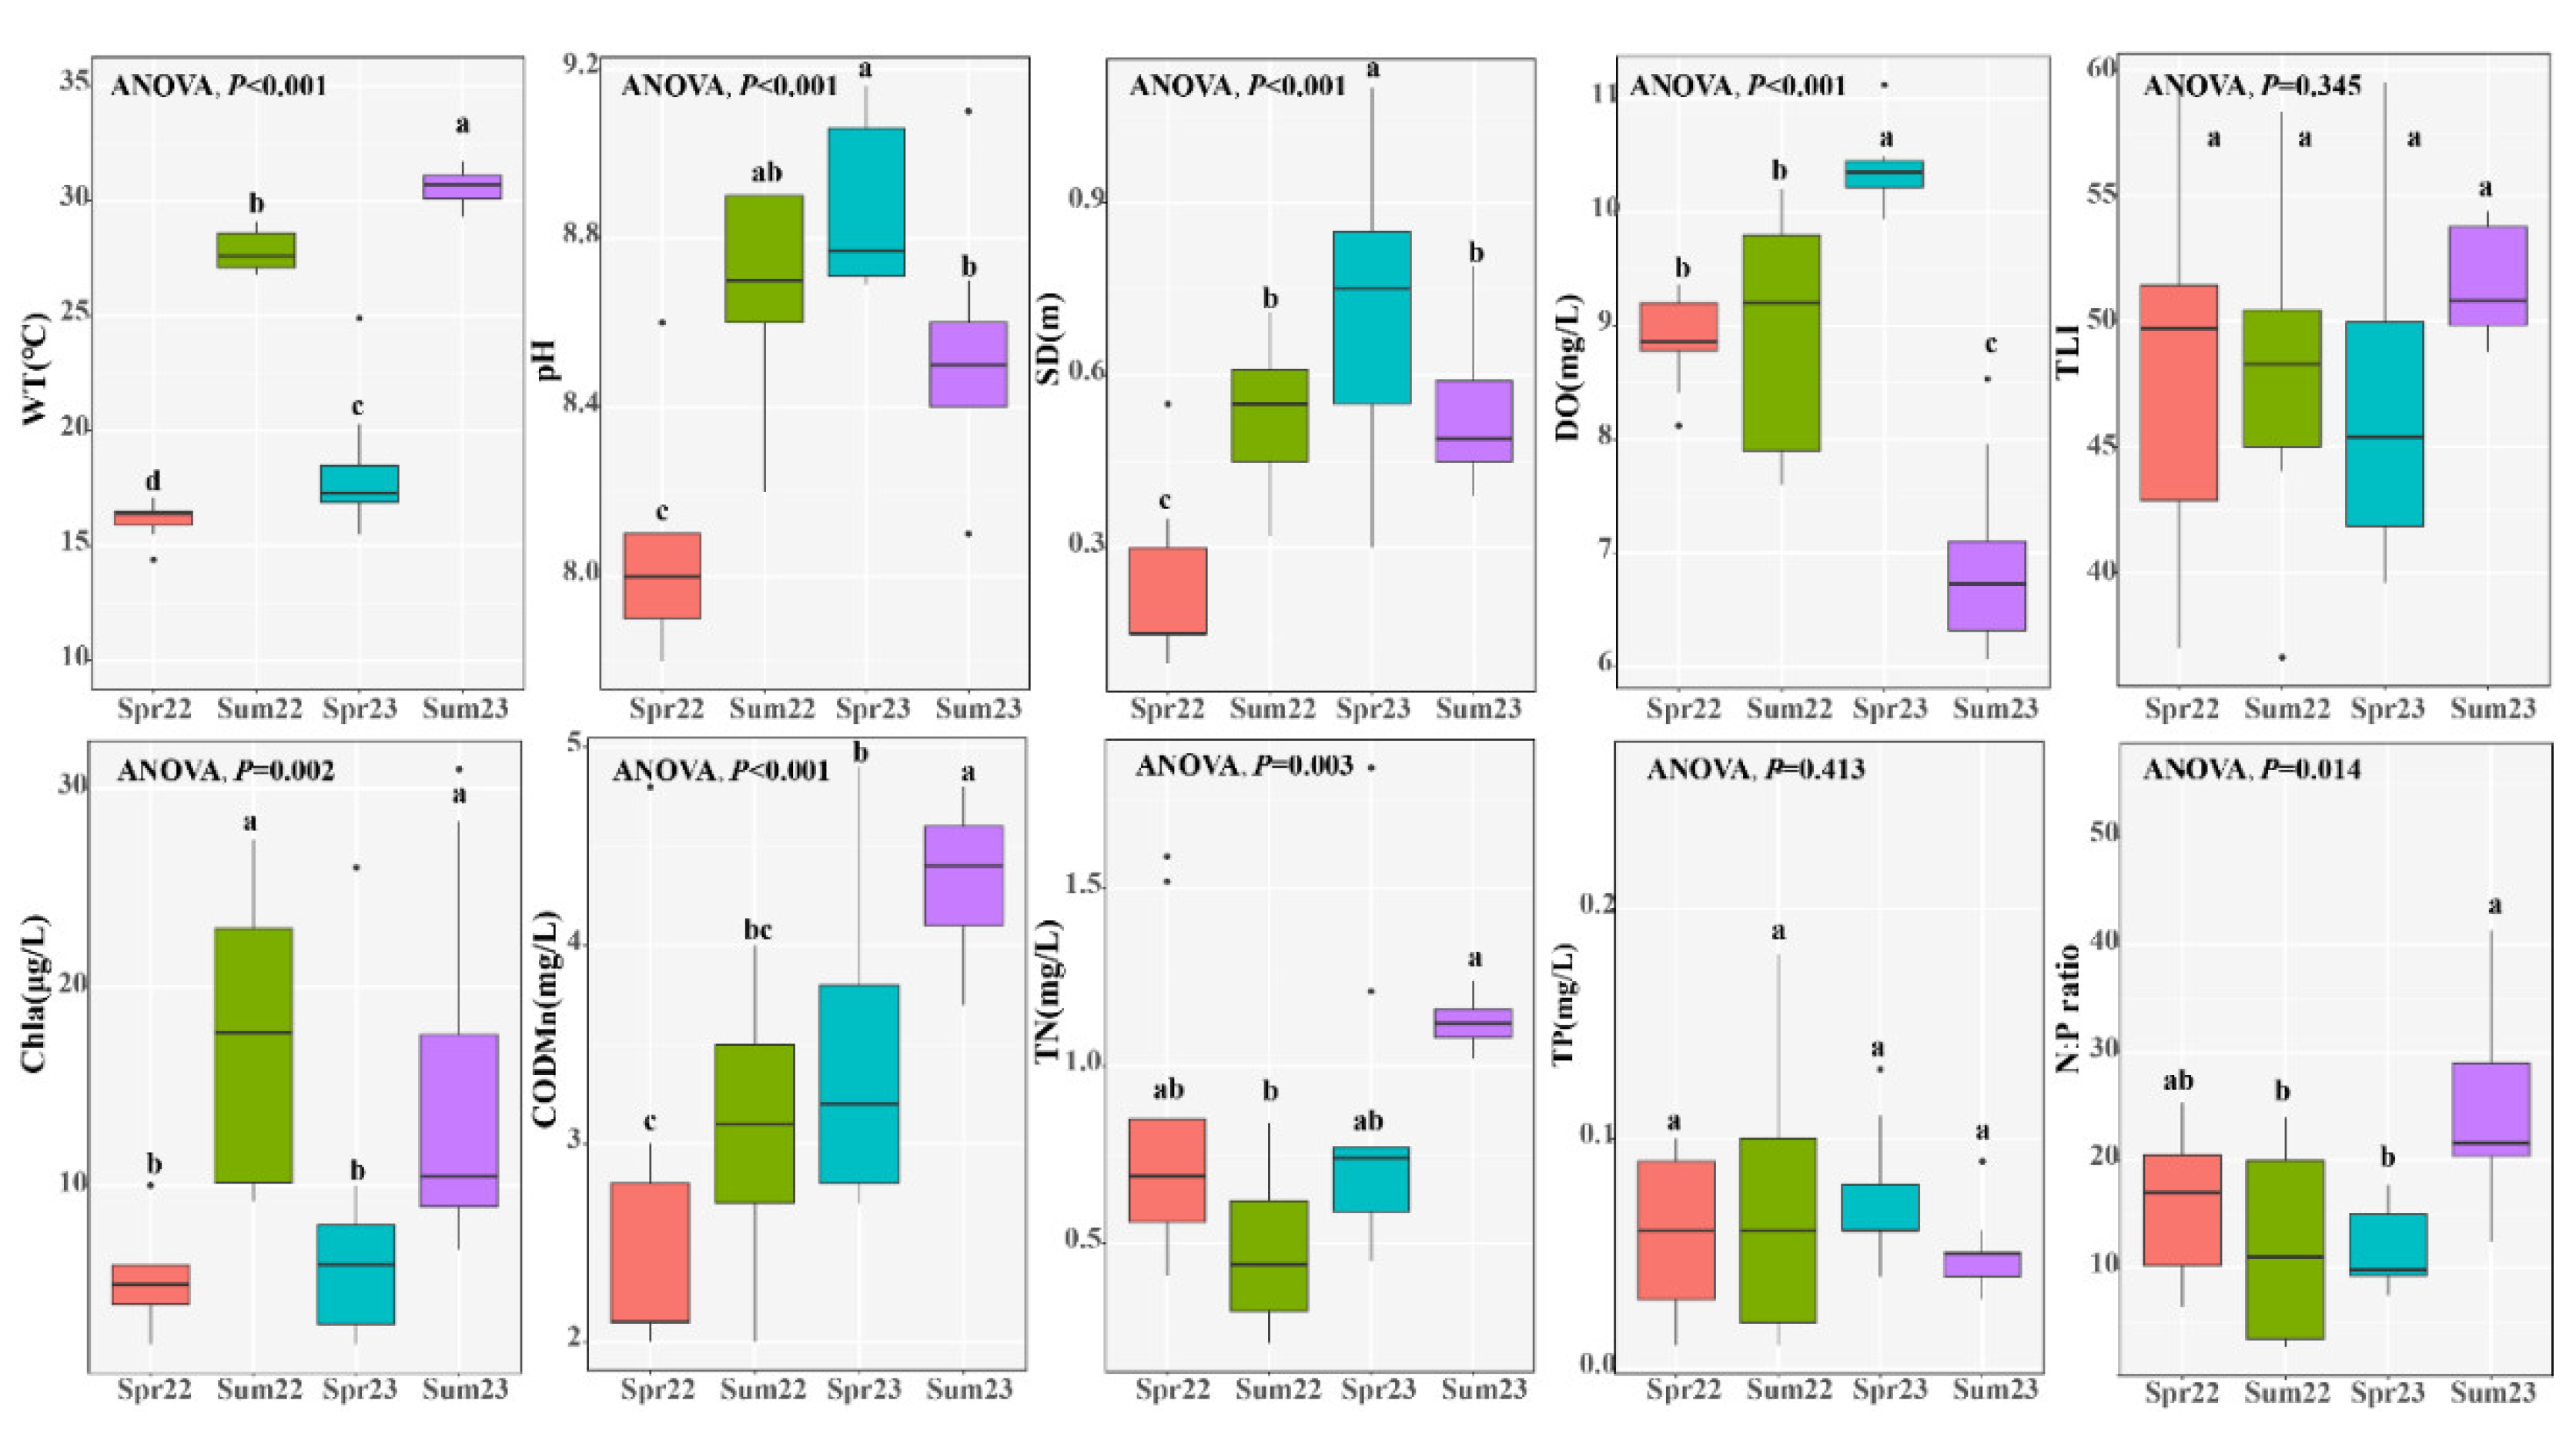
Figure 3.
The biomass of phytoplankton (a) and zooplankton (b) at ten sites in March (spring) and June (summer) 2022 and 2023. Spr22: spring 2022; Sum22: summer 2022; Spr23: spring 2023; Sum23: summer 2023.
Figure 3.
The biomass of phytoplankton (a) and zooplankton (b) at ten sites in March (spring) and June (summer) 2022 and 2023. Spr22: spring 2022; Sum22: summer 2022; Spr23: spring 2023; Sum23: summer 2023.
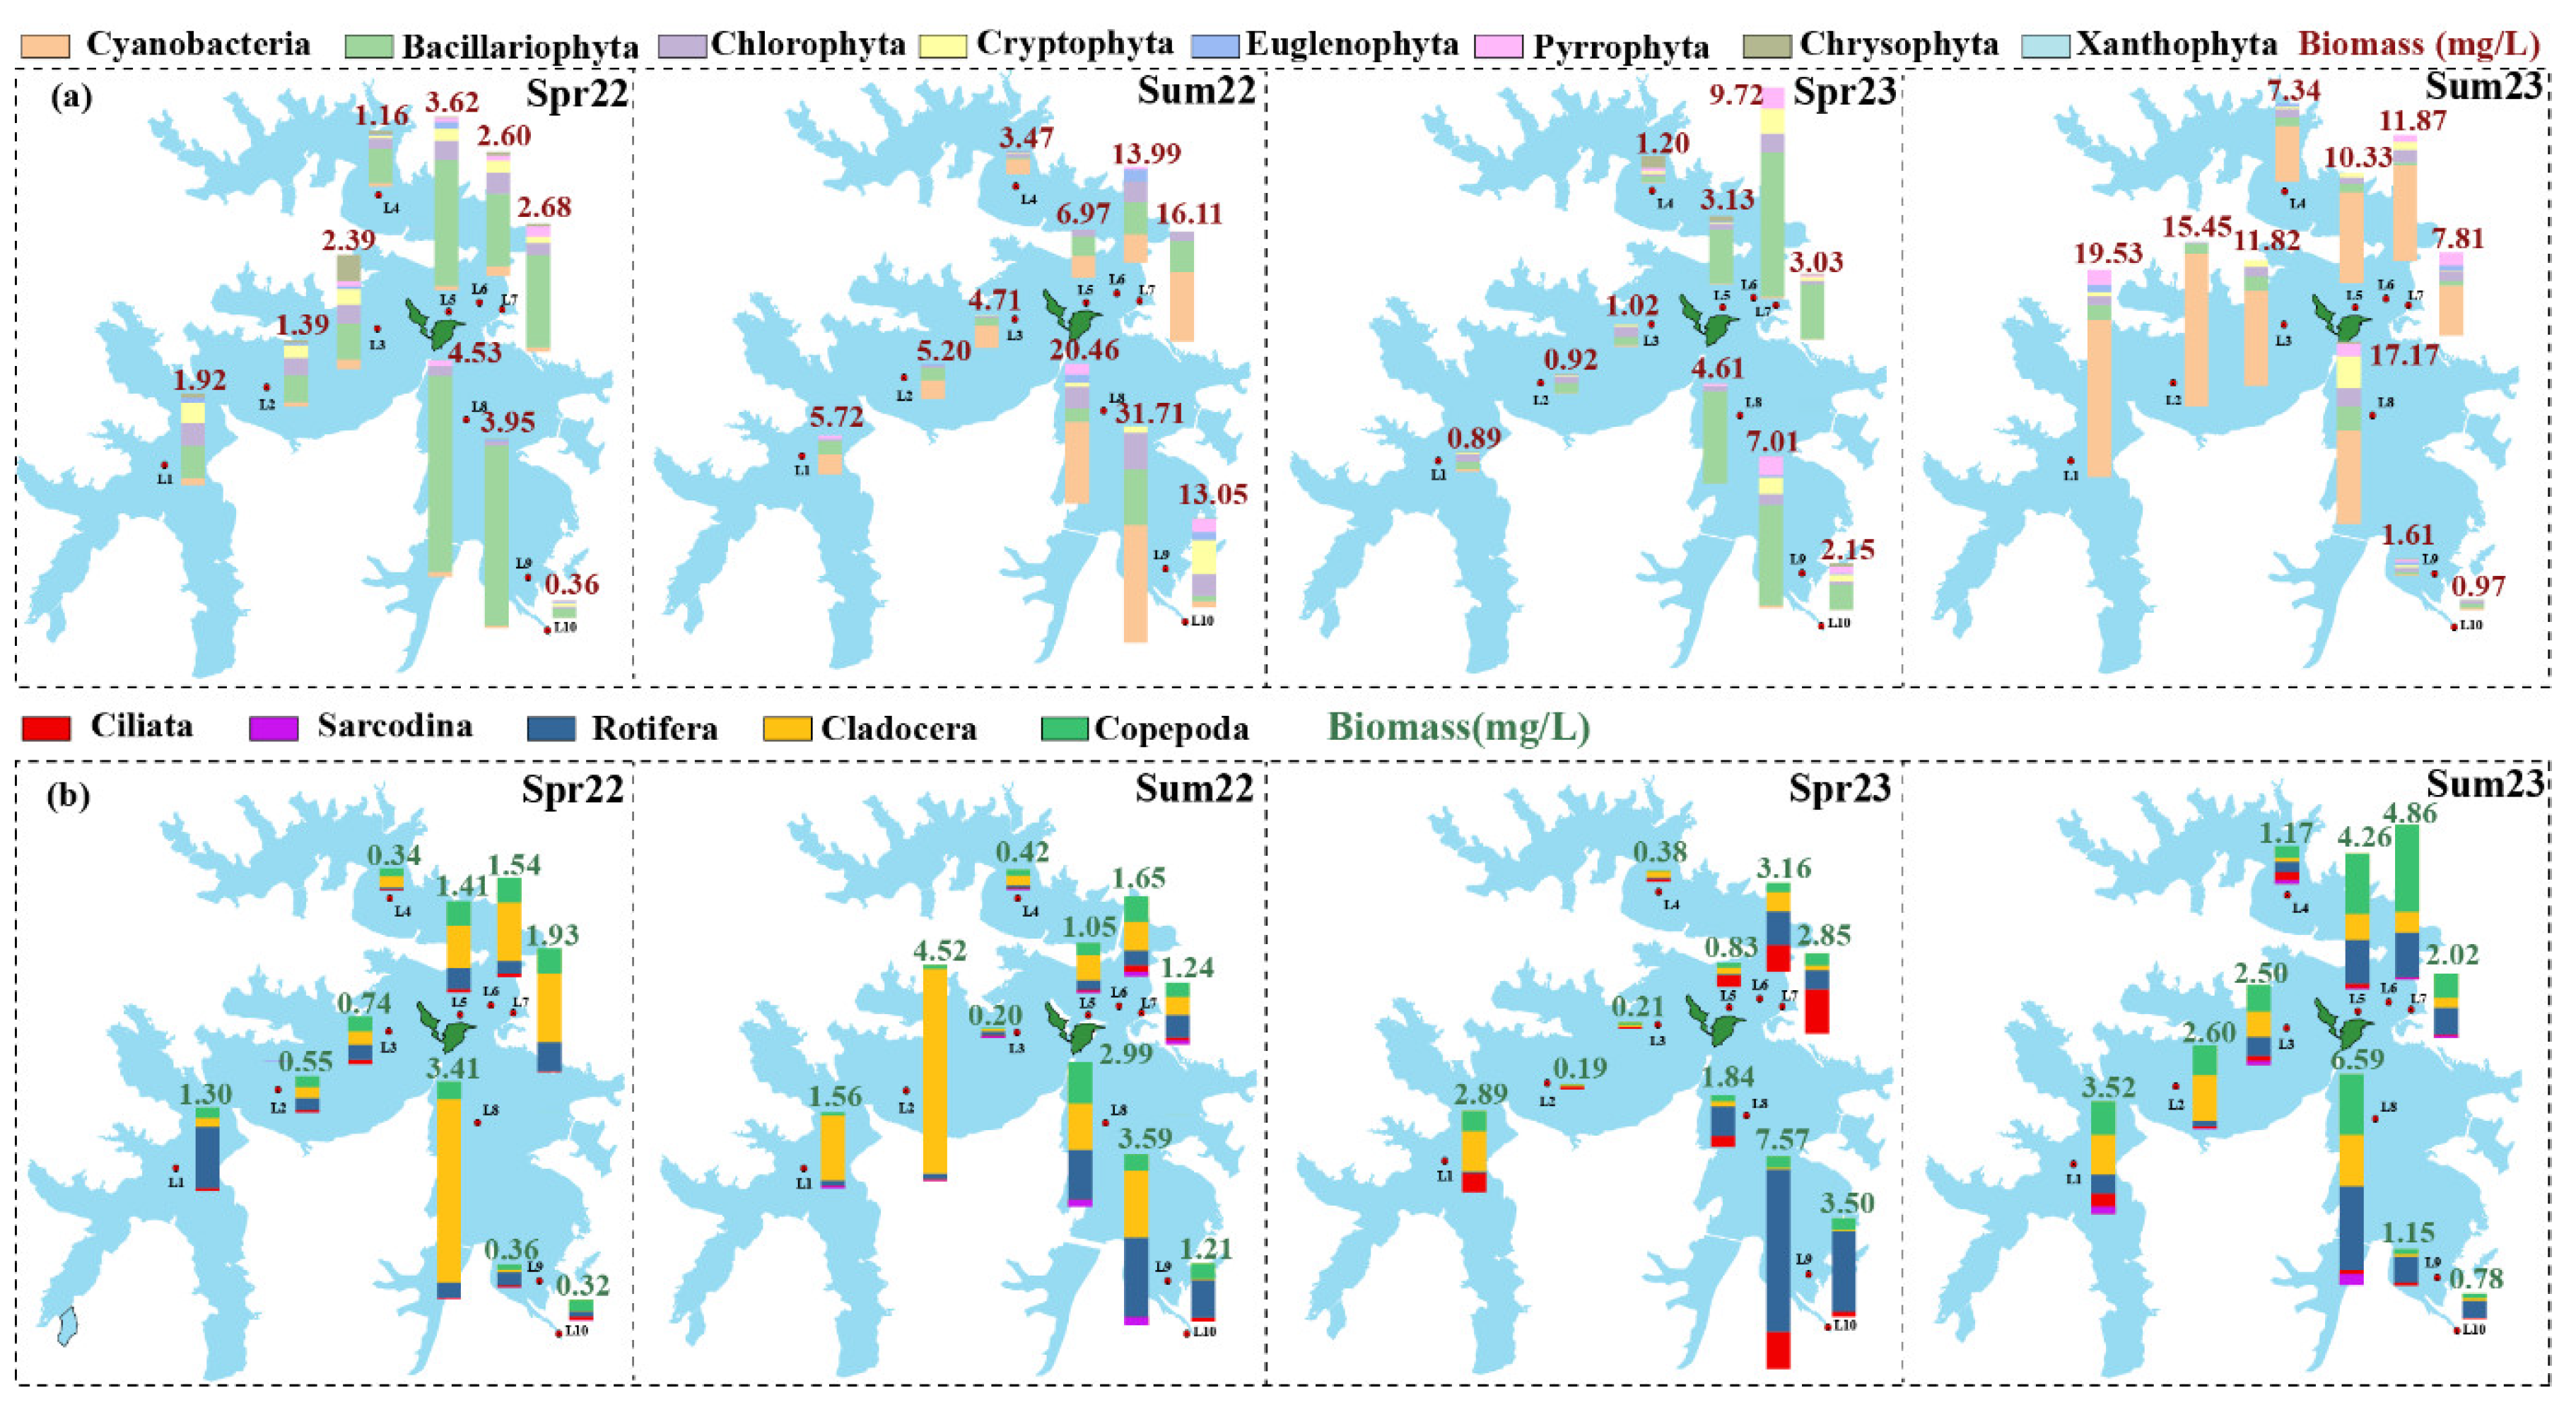
Figure 4.
The Shannon index of phytoplankton (a) and zooplankton (b) communities, The different lowercase letters (a and b) indicate statistically significant differences. Data were presented as Mean ± SD.; the relative abundance of core genera of phytoplankton (c) and zooplankton (d) communities in different groups. Those whose relative abundance is greater than 1% in at least one group are identified as core genera, and the rest are classified as others; Redundancy analysis (RDA) of core genera of phytoplankton (e) and zooplankton (f) communities. The lowercase letters represent the significance of the difference between different groups.
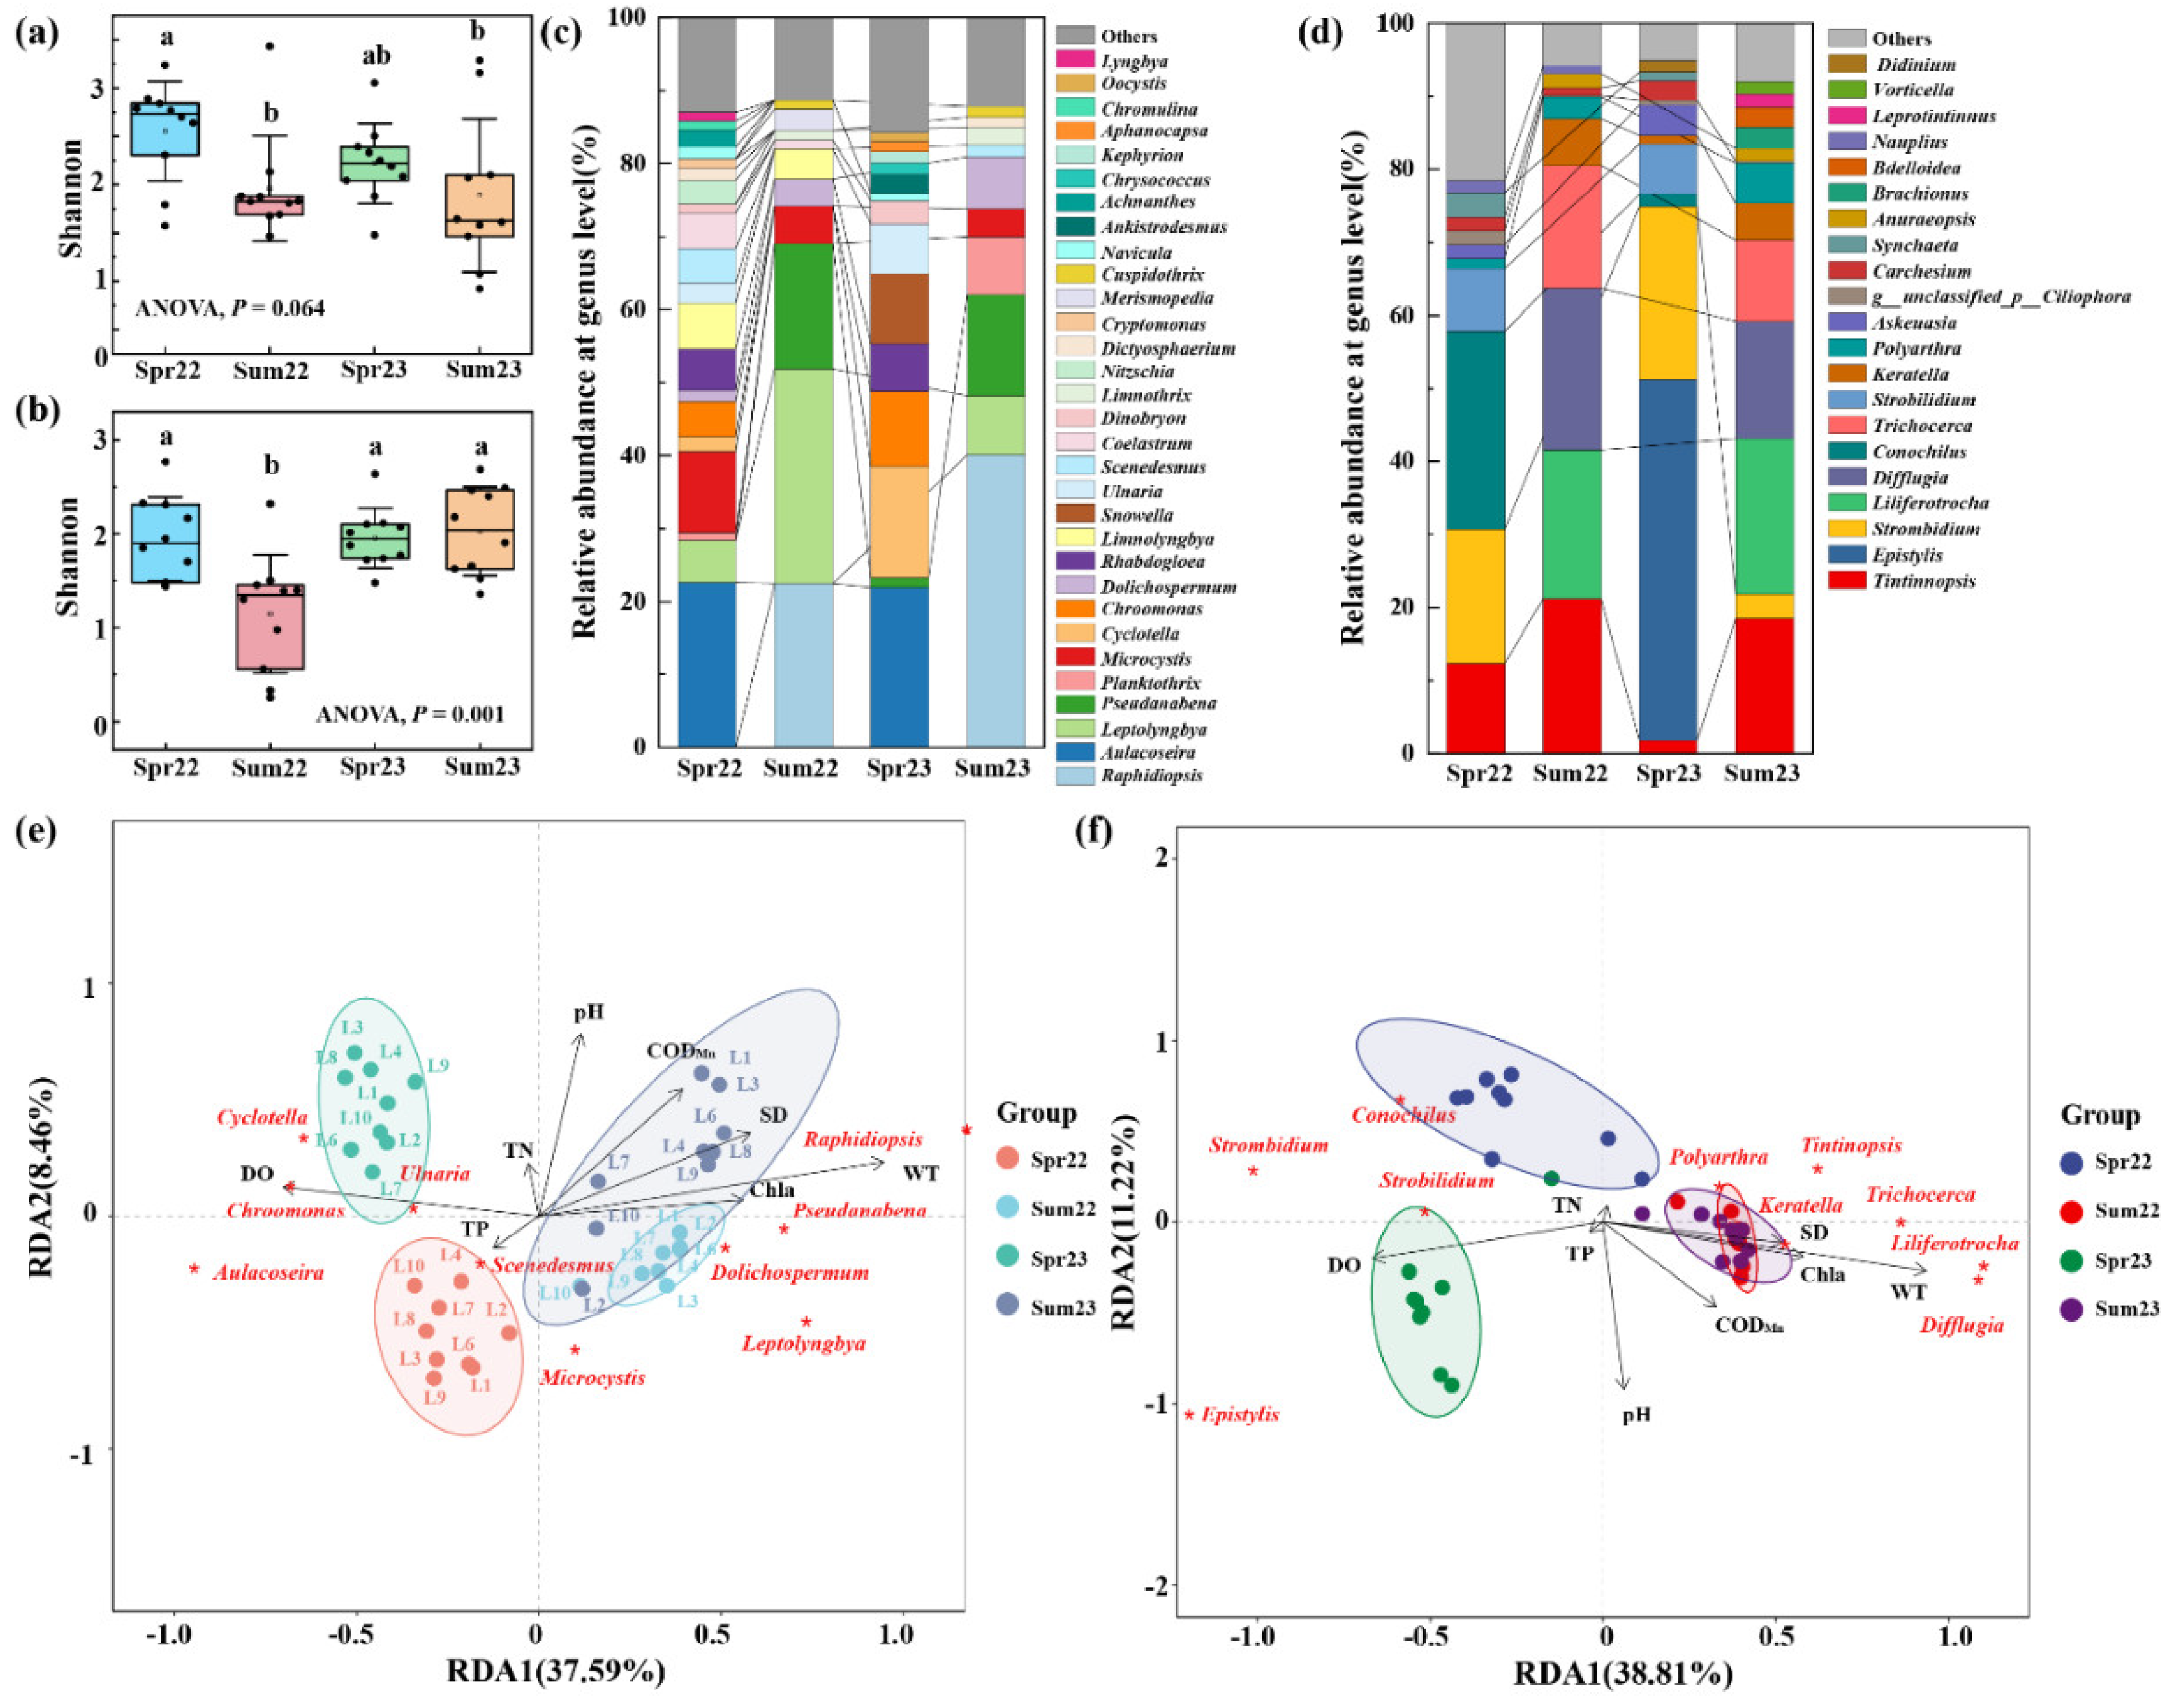
Figure 5.
(a) The relationship between planktonic groups and environmental factors. The data of cyanobacteria, phytoplankton (including cyanobacteria), protozoa, Cladocera, Copepoda, Rotifera, and zooplankton (including Rotifera) presented in this figure were transformed with a log 10 scale (Spearman); (b) The final path of partial least squares (PLS) path modeling visualized the direct and indirect effects of environmental factors (WT, DO, and CODMn) on the abundance of phytoplankton, cyanobacteria, zooplankton, and Rotifera. The histogram shows the total effects of environmental factors on phytoplankton, cyanobacteria, zooplankton, Rotifera, and chl.a. The red and blue lines represent positive and negative correlations, respectively. * means “P < 0.05”, ** means “P < 0.01”, and *** means “P < 0.001”.
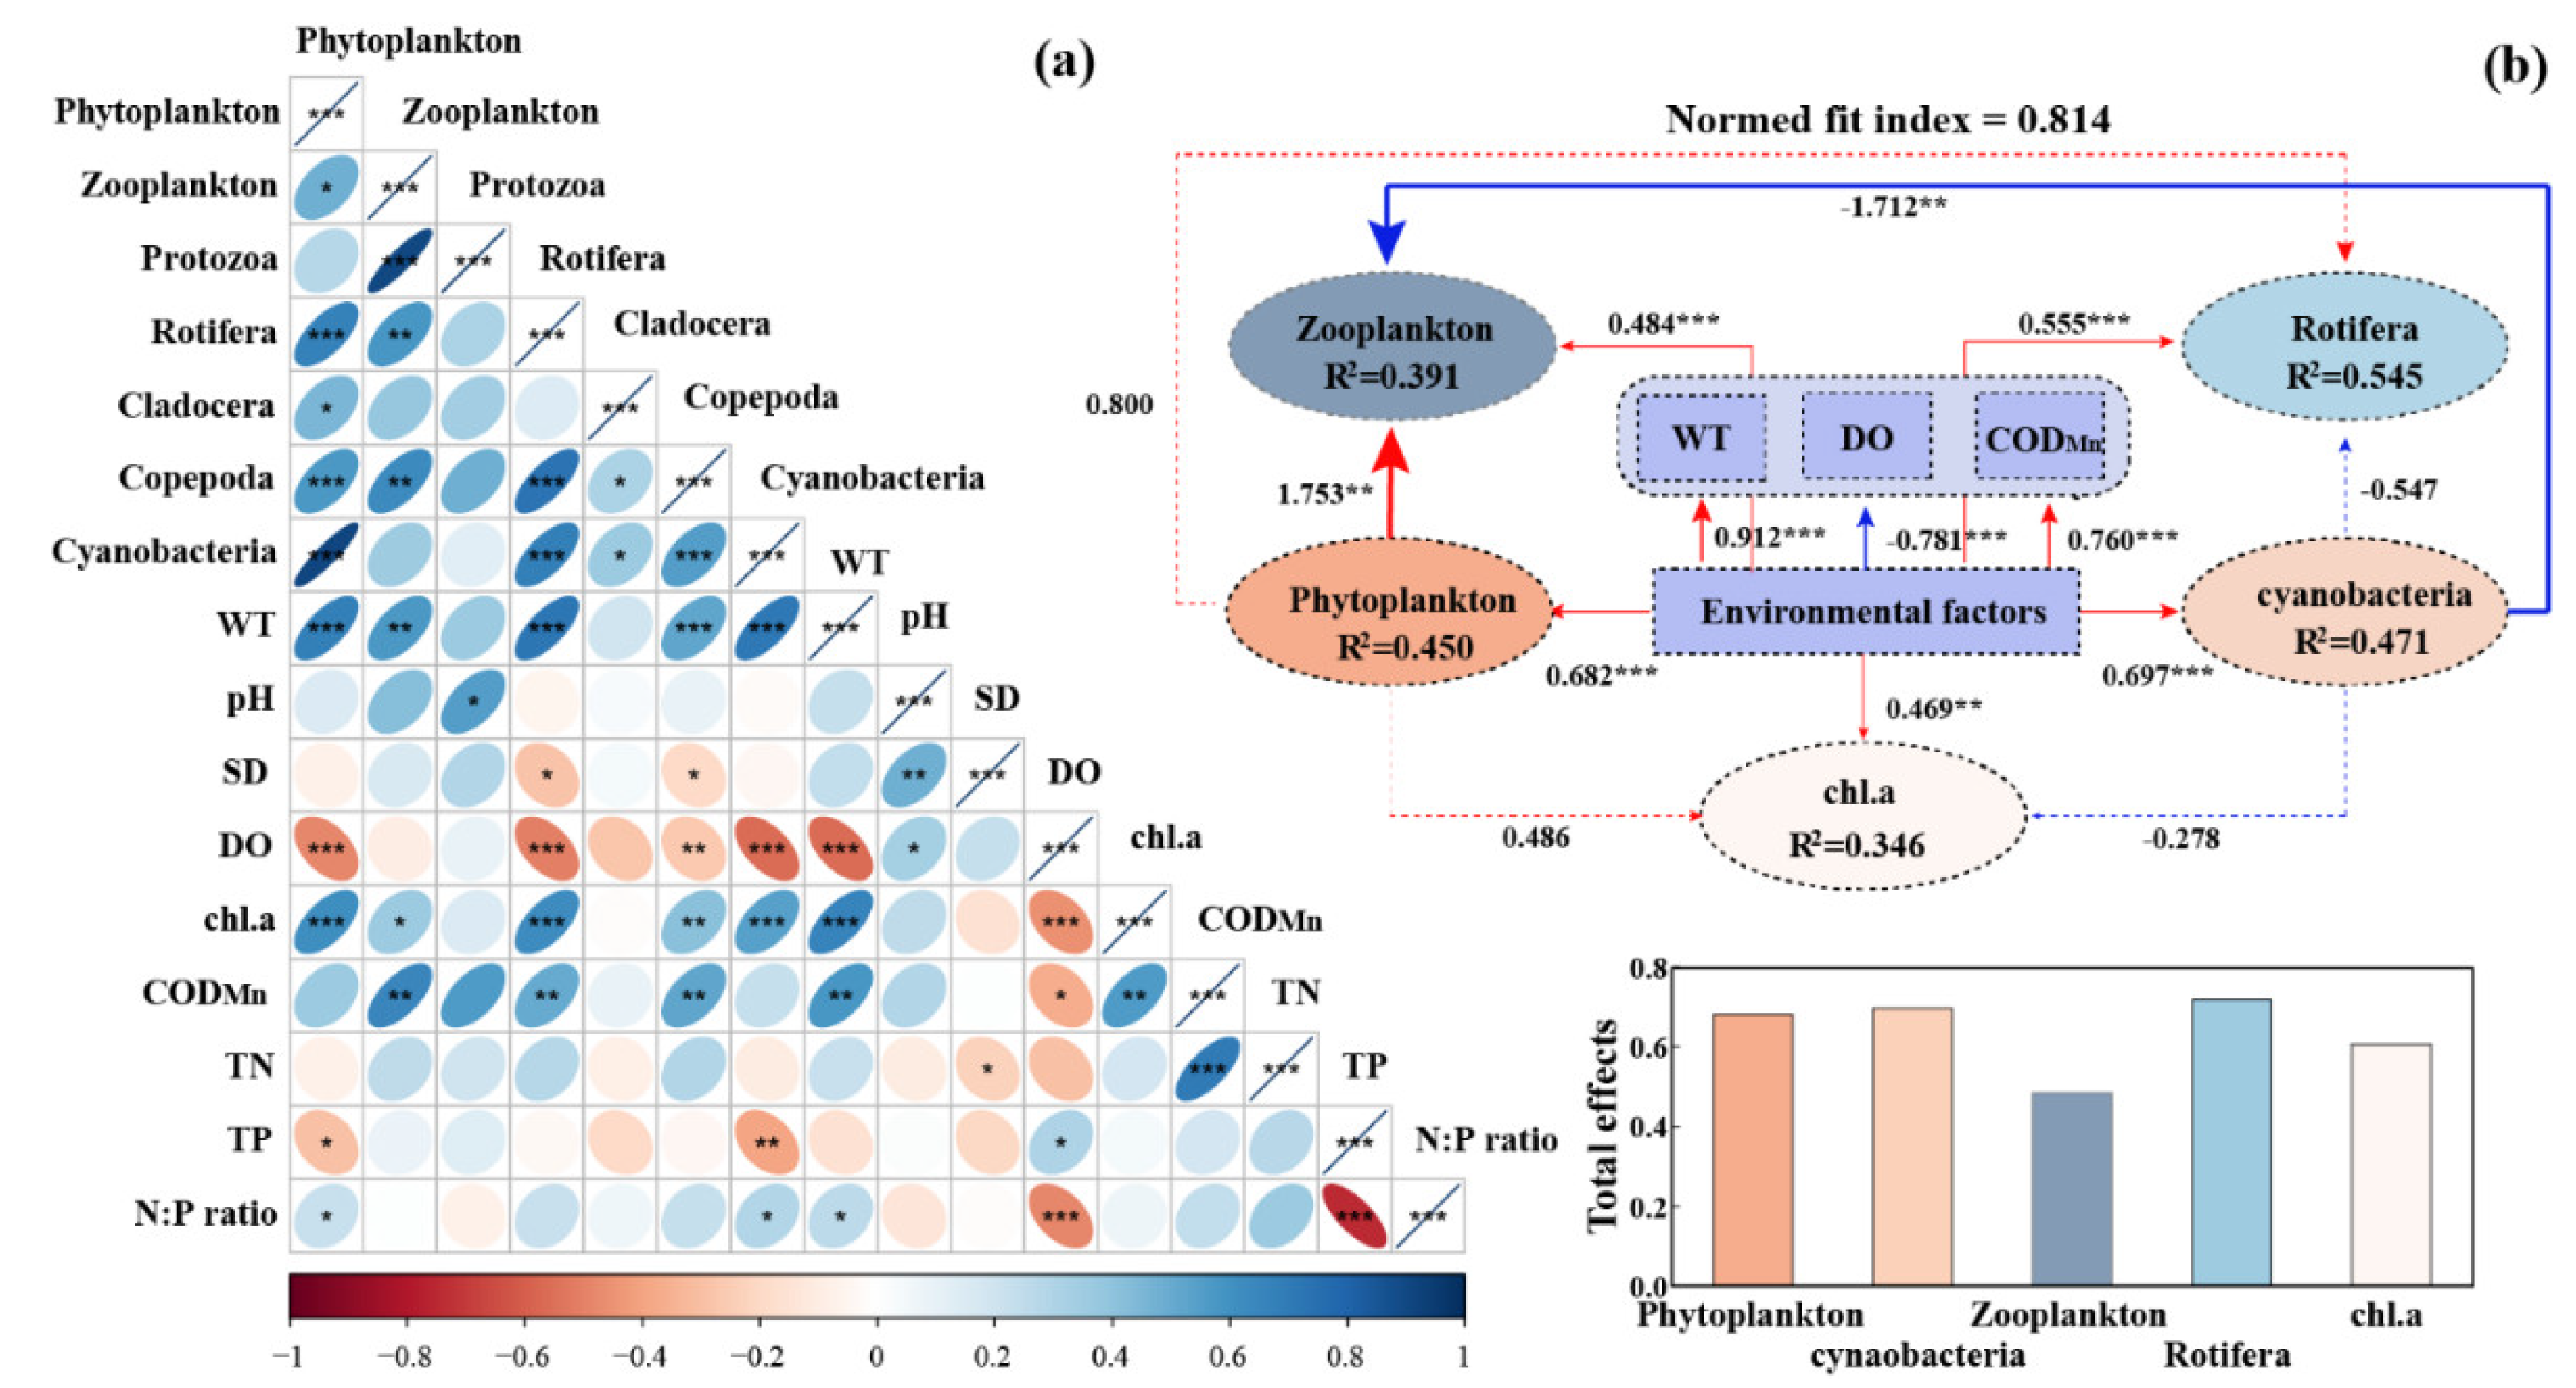
Figure 6.
Planktonic species networks constructed based on Spearman’s rank correlations between the core taxa in each season. Nodes are colored by modularity (a) and Phylum level (b), respectively. The size of each node is proportional to the degree. The circles in the right panels indicate the relative abundance of each module in corresponding networks, and the size of each circle is proportional to the relative abundance.
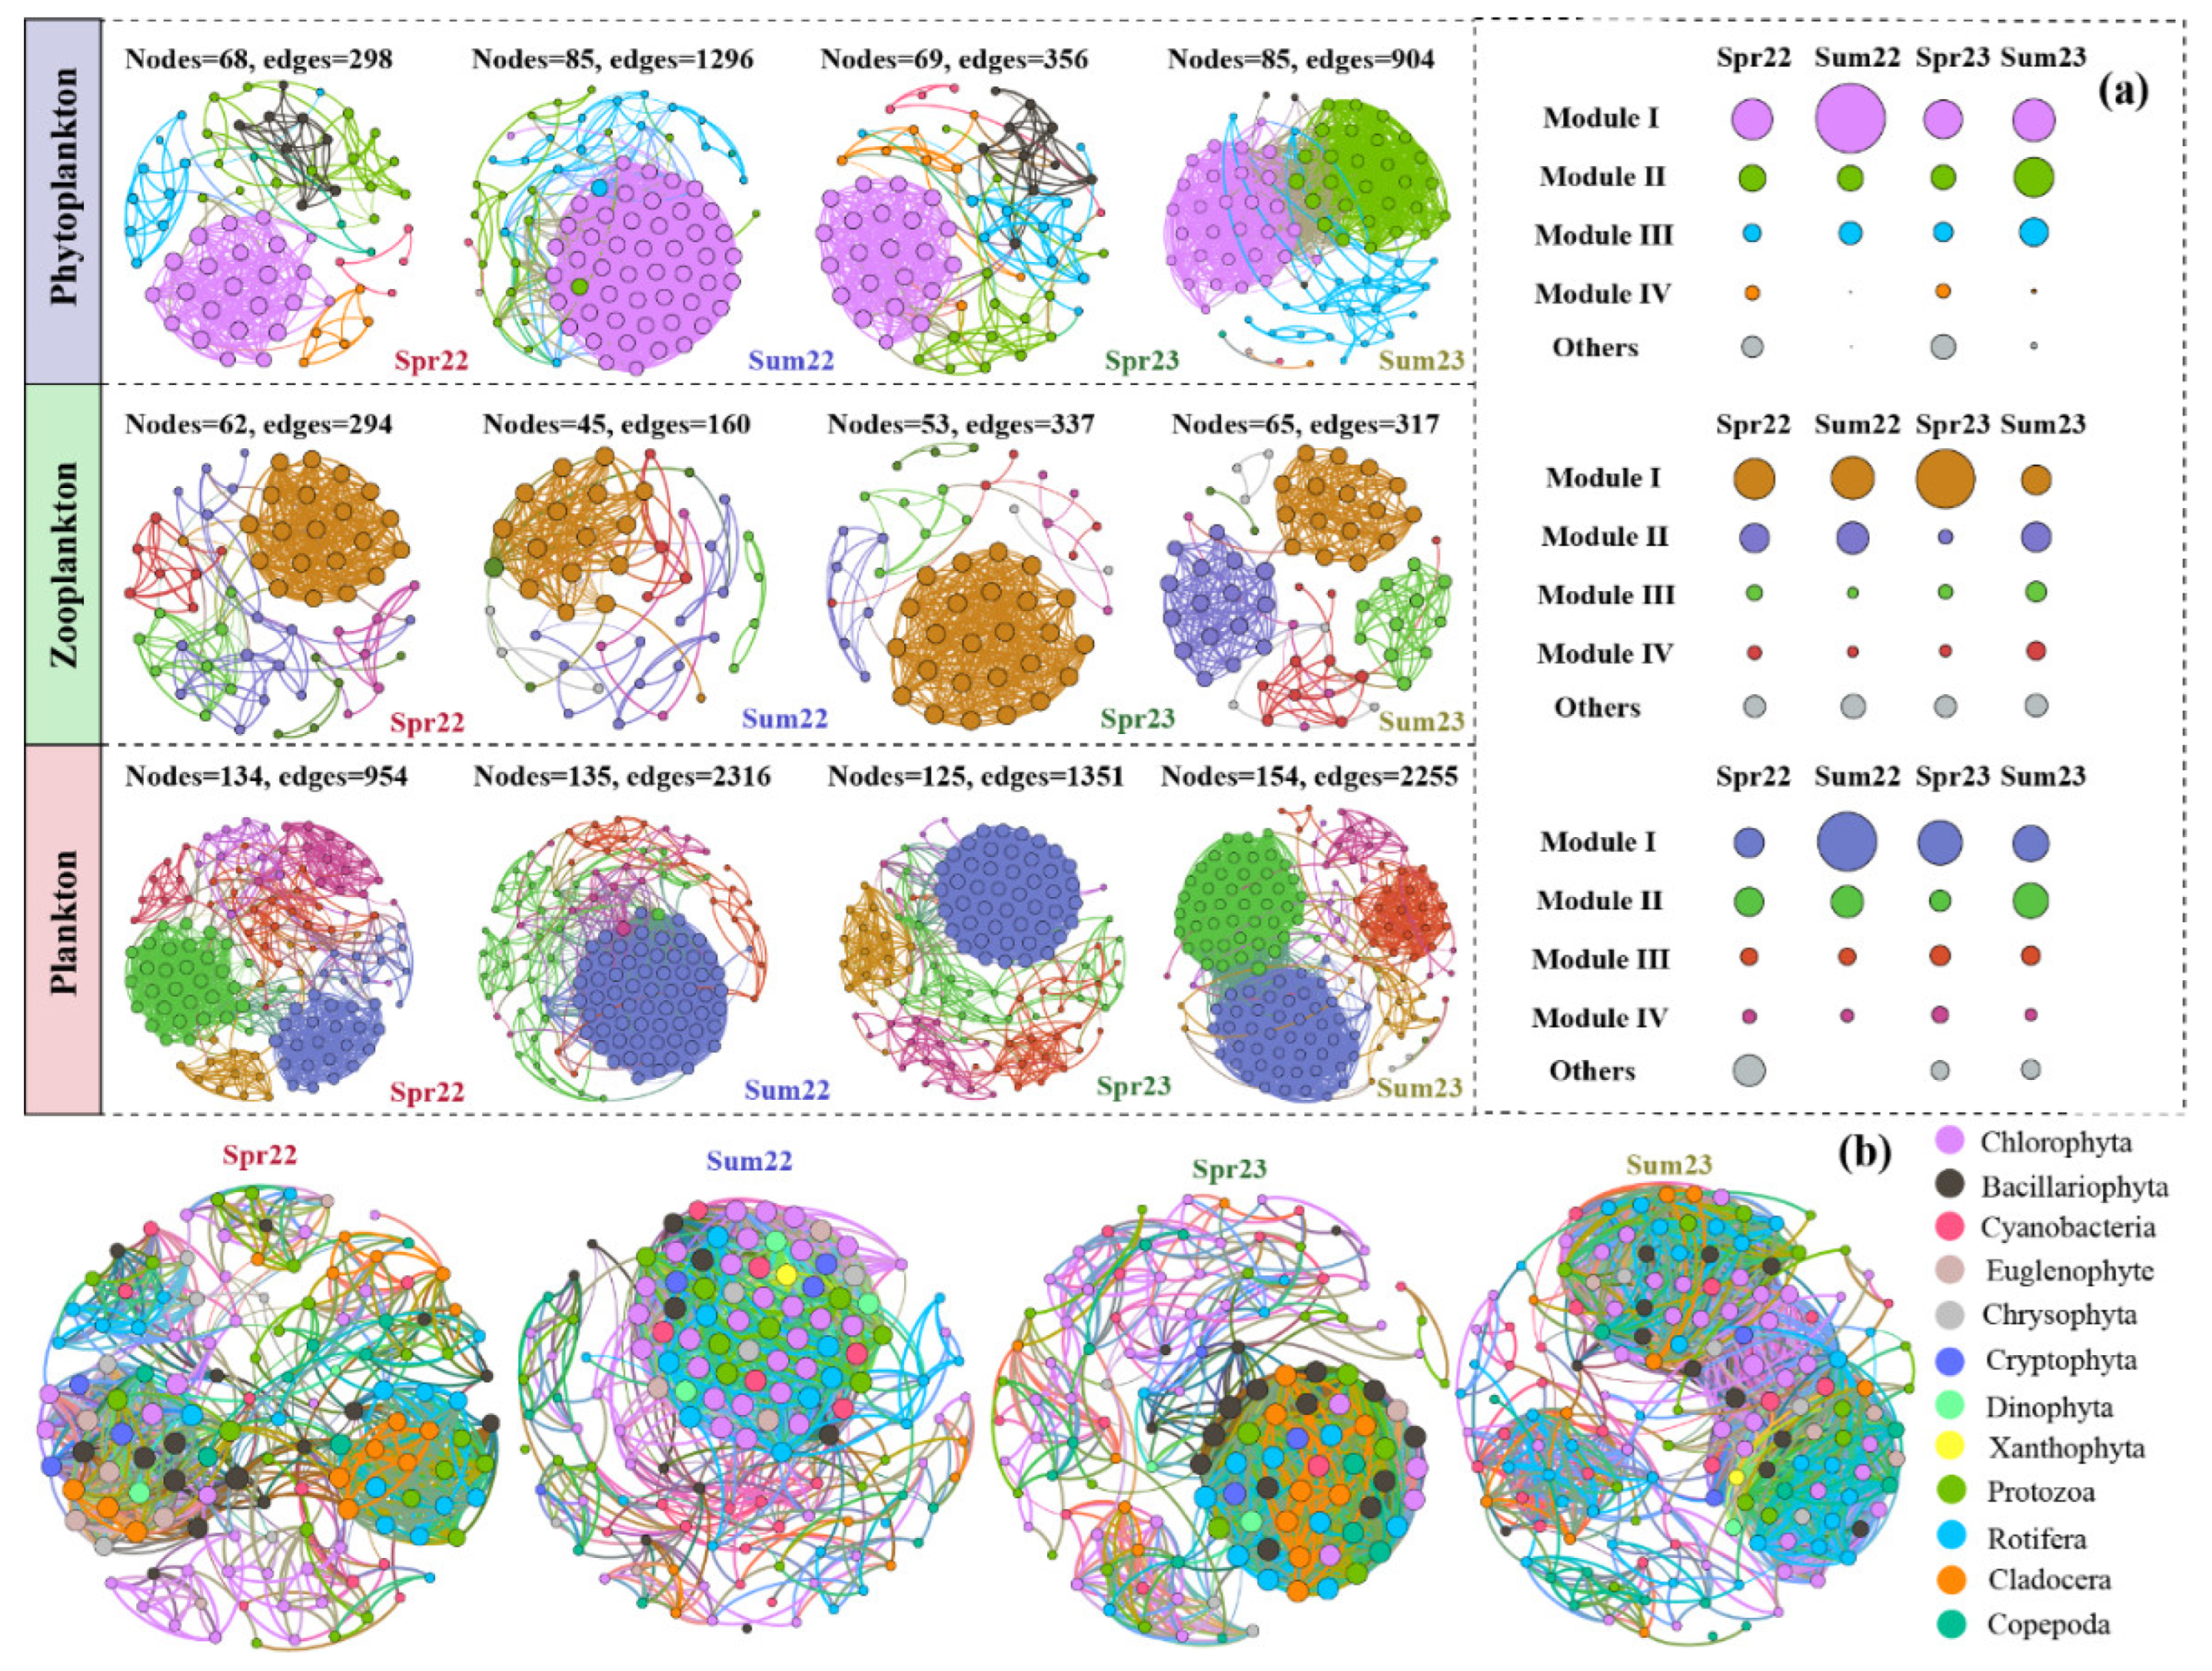
Figure 7.
The number of taxa at phylum (a), genus (b), and species (c) levels using microscopical analysis and eDNA metabarcoding; Venn diagrams showing the list of shared and unique species in phytoplankton (d) and zooplankton (e) communities using two methods.
Figure 7.
The number of taxa at phylum (a), genus (b), and species (c) levels using microscopical analysis and eDNA metabarcoding; Venn diagrams showing the list of shared and unique species in phytoplankton (d) and zooplankton (e) communities using two methods.
Disclaimer/Publisher’s Note: The statements, opinions and data contained in all publications are solely those of the individual author(s) and contributor(s) and not of MDPI and/or the editor(s). MDPI and/or the editor(s) disclaim responsibility for any injury to people or property resulting from any ideas, methods, instructions or products referred to in the content. |
© 2025 by the authors. Licensee MDPI, Basel, Switzerland. This article is an open access article distributed under the terms and conditions of the Creative Commons Attribution (CC BY) license (https://creativecommons.org/licenses/by/4.0/).
Copyright: This open access article is published under a Creative Commons CC BY 4.0 license, which permit the free download, distribution, and reuse, provided that the author and preprint are cited in any reuse.


