
Submitted:
13 March 2025
Posted:
14 March 2025
You are already at the latest version
Abstract
Telerehabilitation, a specialized domain within telemedicine, supports remote physical rehabilitation and progress monitoring. Wearable sensors can improve this service by providing reliable monitoring of movement parameters, offering objective information into patients’ rehabilitation sessions. This study presents the development and validation of a telerehabilitation system including low-cost wearable inertial measurement units (IMUs) to analyze rehabilitation exercises. Eleven medically stable elders (9 females, 2 males; age: 72.6 ± 5.0 years; height: 1.66 ± 0.09 m; mass: 67.8 ± 9.8 kg) performed 12 rehabilitation upper\lower limb and trunk exercises. Movement analysis was conducted using a prototypical IMU sensor and commercially available IMU as a reference. Each exercise was automatically segmented into single repetitions, from which various parameters descriptive of movement capacity were computed. Bland-Altman analysis was performed to evaluate measurement agreement and consistency between the systems across all parameters. Results indicate acceptable measurement agreement for key rehabilitation metrics, including movement quantity, accelerations intensity, and movement smoothness. However, other metrics reveal technical limitations requiring refinement prior to clinical implementation. Balancing the reliability of measurement and the accessibility of telerehabilitation system remains a crucial factor for the successful implementation of this service.
Keywords:
telemedicine
; movement quality
; movement intensity
; physical exercises
; inertial sensors
; IoT
1. Introduction
An important resource for contemporary healthcare systems is telemedicine and its various subsections. Grown during the COVID-19 pandemic, telemedicine is a health service that has evolved through telecommunication and electronic information technologies, enabling remote communication between patients and health professionals. It includes a range of services, such as teleconsultation, which provides online consultations with patients; telemonitoring, which offers remote monitoring; and telerehabilitation, which facilitates remote physical and psychiatric rehabilitation [1,2]. Telerehabilitation services can achieve outcomes comparable to conventional rehabilitation methods, reducing muscle weakness, maintaining high levels of physical activity, and enhancing both functional capacity and the physical aspects of quality of life [2,3,4,5]. Another advantage of telerehabilitation is its ability to eliminate various barriers that can hinder patient compliance, such as the need to travel to a medical center or the effort associated with scheduling in-person appointments [5]. By allowing patients to engage their therapy from the comfort of their homes, these services not only promote more convenient and comfortable rehabilitation treatment but also significantly decrease hospitalization costs [6].
Previously, many tele-rehabilitation services relied on monitoring exercise programs through video calls, often lacking the ability to monitor movement and vital parameters [7]. To address this limitation, there is a growing trend towards the adoption of wearable sensors that can provide various biofeedback, thereby enhancing safety and effectiveness of telerehabilitation experiences. The use of wearable sensors has been becoming more and more popular among people with various health conditions, such as neurological, cardiac, and orthopedic diseases [8,9]. Physiological biofeedback is provided for monitor cardiac activity in patients with cardiovascular diseases, using electrocardiograms (ECGs) or sensors to measure oxygen saturation levels (SpO2) [10]. Biomechanical biofeedback, employed for patients with orthopedic and neurological rehabilitation needs, allows analyzing aspects such as posture control, muscle activation, and movement [10]. A comprehensive evaluation of the patient's movements is crucial for effective telerehabilitation systems.
Within this category, Inertial Measurement Unit (IMU) sensors are currently widespread [10,11,12,13,14] and gained positive feedback by clinicians regarding their application for monitoring rehabilitation movements [15]. In particular, clinicians appreciated the easy-to-use nature of this technology, and their ability to analyze and provide a report in a short period of time [15]. Due to their low cost, IMU sensors represent a promising solution for motion monitoring in telerehabilitation programs, making their adoption more accessible and feasible on a large scale.
Besides the basic repetition count, this technology can integrate video observation with information on the quality of the gestures performed, which cannot be fully captured through video alone during rehabilitation exercises. IMUs enable the measurement of key biomechanical parameters, such as range of motion and movement fluidity [11], providing therapists with more informative data about patient performance, enabling them to develop personalized rehabilitation interventions tailored to the patient's functional capacities.
To increase the effectiveness and diffusion of telerehabilitation, it is crucial to develop comprehensive platforms that can support every stage of the process, from initial assessments to treatment and follow-up [16]. In this perspective, telerehabilitation infrastructures that integrate IMUs as a monitoring instrument for motor rehabilitation exercises are under development [17,18]. The main challenge remains developing affordable technology for the individual user, ensuring a balance between cost and practical benefits. Affordability of any platform shall be sided by the flexibility to adapt to the individual needs of patients, maximizing the potential to promote improved health, greater adherence to motor rehabilitation programs and, ultimately, significant quality of life enhancement for people who might otherwise face barriers in accessing appropriate care.
In this context, the project "teleREHabilitation for respiratory and motor reACTivation exercises” (REHACT) aims to develop a telerehabilitation infrastructure based on low-cost IMUs to facilitate physical rehabilitation. At the core of this system are low-cost IMUs for movement characterization, providing clinicians with objective performance indicators of the rehabilitation process [19]. The entire infrastructure is designed to be user-friendly and accessible, aligning with the principles of the “Internet of Things” (IoT), where “I” signifies the interconnections among devices, and “T” refers to the tools utilized in the service [20]. As part of this initiative, this work aims to validate prototype IMU use during rehabilitation exercises in comparison to reference IMUs typically used in laboratory settings. Product validation is conducted on elderly healthy participants within a controlled laboratory environment, corresponding to Technology Readiness Level 4 (TRL4) [21].
2. Materials and Methods
2.1. REHACT Motor Rehabilitation Protocol
The “REHACT” motor rehabilitation protocol includes a total of twelve rehabilitation exercises, selected based on guidelines from the perspective of physical therapists [22,23]. Specifically, exercises were selected to strengthen and improve the mobility of the lower limbs, upper limbs and trunk muscles. To target these muscle groups and following these guidelines [22,23], criteria for selection privileged exercises easy to be instrumented and that do not put the patient's health at risk. For example, the so called “open chain” exercises [22,23] were chosen due to the possibility to monitor them using a few number of sensors, as opposed to more complex movements that would need a larger set up. To make the protocol adaptable to individual functional capacity, the exercises are performed in various positions: lying down, seated with back support, seated without back support, and standing with support. As shown in Figure 1, the resulting protocol includes:
- For the lower limbs: knee extension lying down (KE1), knee extension sitting with a back support (KE2), knee extension without back support (KE3), half squat supported on a table (SQ);
- For the upper limbs: shoulder flexion lying down (SF1), shoulder flexion sitting with a back support (SF2), shoulder flexion without back support (SF3), wall push-up (PS);
- For the trunk: Bird Dog exercise [24] using only the legs (BD1), Bird Dog using only the arms (BD2), lateral flexion of the column (LF), rotation of the column (RO).
To monitor the REHACT protocol, three sensors are required [19]: one placed on the lumbar region, and two positioned on the legs or arms depending on the specific exercise. The lumbar prototypical IMU is positioned at the lower back, secured with an elastic belt, except during exercises performed while lying down. (Figure 2c). For exercises targeting lower limbs, the prototypes are attached to the participant's tibias laterally above the malleolus and secured with elastic straps (Figure 2b). For the upper limb exercises, the prototypes are attached just above the wrists (Figure 2d).
2.2. REHACT sensors and infrastructure
The REHACT infrastructure includes IMUs, which serve as data acquisition and transmission units, a mobile application, responsible for synchronizing and aligning the signals from the different IMUs ensuring accurate processing for motor gesture characterization, and an online database to store data collected via prototypes through the application. Only authorised users can access to the database for data analysis.
Each prototypical sensor is equipped with a 9-axis IMU (LSM9DS1, STMicroelectronics, Switzerland), which provides a full-scale range of ±4g for the accelerometer, ±2000 deg/s for the gyroscope and ±16 Gauss for the magnetometer, with a sampling frequency between 30-35 sample/s. Each sensor case measures 7 x 4.5 x 1.5 cm. A microcontroller board (Arduino Nano 33 BLE, Arduino S.r.l, Italy) is responsible for managing the operation of the sensors. This microcontroller facilitates the connection to a mobile application, developed using MIT App Inventor (© 2012-2024 Massachusetts Institute of Technology), that represents the transmission unit for the data collected during the exercises. The mobile application securely stores data collected in a database (Firebase, Google, USA). Each user accesses the database through a unique identifier consisting of a username and password, which allows the data to be written and accessed. In addition, the database is accessible only to those with that identifier. Currently, for data analysis, the data are extracted from the database and analyzed using MATLAB (MathWorks Inc, USA) and Google Colaboratory (Google, USA).
To ensure effective synchronization of the transmitted data, a software-based timing system was developed, designing a virtual clock to synchronize and coordinate the clocks of all IMUs before data transmission to the app and subsequently to the database. Through an iterative optimization process, different synchronization and coordination configurations were tested, achieving a data rate of 32 samples per second for each sensor. This value was deemed adequate to monitor the REHACT rehabilitation protocol.
A key target in the development of the infrastructure is ensuring an optimal cost-benefit ratio. The developed sensor has an extremely low production cost (about 30 euros per unit). Even including the overall development costs, it is expected that the technology could be deployed at an affordable price for the individual user. This aspect would benefit the infrastructure, promoting its large-scale distribution to a large number of people performing telerehabilitation.
2.3. Movement Characterization
Movement rehabilitation exercises were characterized in terms of their quantity, intensity, and quality using the sensors.
Data pre-processing was conducted to, first, low-pass filtering the signal, with an optimal cutoff frequency identified for each signal as in [25]. Data series were then segmented into cycles, identifying start and end points of each repetition with a threshold selected at 30% of maximum peak acceleration values (Figure 3). Peaks related to the different exercises were detected along the axis where the movement of the analyzed exercise was most evident. (e.g. antero-posterior direction, y-axis, for upper and lower limb exercises). using the “find peaks” function (MATLAB, R2021, MathWorks Inc, USA). Fine tuning of the “find peaks” function resulted in the following settings: “minimum peak width” = 0.2, “minimum peak prominence” = 0.1-0.2 and “minimum distance between peaks” = 30-50 samples (MATLAB, R2021, MathWorks Inc, USA).
The following features were selected as metrics to assess quantity, intensity, and quality of movements for individual repetitions or for each set of repetitions:
Quantity (QT), commonly utilized in traditional rehabilitation, includes fundamental aspects such as the number and duration of the repetitions:
- REP: number of repetitions made by the participant for each set;
- TIME: duration, for each repetition;
Intensity (I) of the movements, is associated to overall physical activity levels and described by parameters derived from the acceleration of body segments [11,12]:
- Acceleration Peak (, , ): acceleration peaks on the different axes (X, Y, Z), for each repetition;
- Angular velocity Peak (, , ): angular velocity peaks about the different axes (X, Y, Z), for each repetition;
- Movement Intensity (MI): Euclidean norm of the linear triaxial acceleration () of the wearable sensor, as measured in g[11,12,30], calculated over the entire series and not individual repetitions as in previous studies quantifying exercise intensity in clinical applications using wearable inertial sensors [12,26,27].
- Movement intensity variation (MIV): difference in the MI values calculated for the two series.
Quality of movements (QL), refers to the ability to perform actions in a controlled and optimal manner [28]. Joint range of motion, as suggested by [28], along with the smoothness and stability of gestures, as indicated by [12], were assess using the following parameters:
- Dynamic Time Warping (DTW): assesses movement stability [11,27]. DTW was used to compare acceleration signals from successive repetitions of the same set, with the DTW distance for each consecutive pair serving as an indicator of stability. A lower DTW distance value can be interpreted as a better ability to maintain control of the joint movement while performing the exercise [12];
- Peak range of Motion (PKROM): assesses the ability to perform the movement [28], as the maximal value of the Range of Motion (ROM) computed using the Madgwick orientation algorithm [31], for each repetition. The beta coefficients were determined for both sensors as those minimizing the differences in orientation between sensors, based on the magnetometer calibration data (β prototype = 0.6, β reference = 0.1).
2.4. Validation Study
The validity of the set of prototypical IMUs in monitoring quantitatively the quantity, intensity and quality of the REHACT rehabilitation protocol exercises was assessed. Validation was performed, in terms of agreement and consistency, in comparison to a standard reference commercially available IMUs, previously validated against a motion capture system [32] (OPAL, APDM, USA). The reference IMUs operate at a sampling frequency of 128 samples/s and have full-scale ranges of ±2000 deg/s for the gyroscope, ±6g for the accelerometer and ±6 Gauss for the magnetometer. The reference IMUs were placed over the prototypes, fixing them with an additional elastic band. The study, approved by the University Research Committee (CAR code 158/2023), was conducted in accordance with the Helsinki Declaration as revised in 2024. Written informed consent was obtained from the participants of the study: 11 medically stable elderly (9 females and 2 males; age=72.6 ± 5.0 years; height = 1.66 ± 0.09 m; mass = 68 ± 10 kg). Each participant had a Barthel Functional Index [26] score of 5, indicating their ability to function independently, and they had not experienced any falls in the past year [27]. Each participant performed the selected trunk, lower and upper limb exercises for 2 sets of 8 repetitions each, with a recovery interval of 1 minute between each set to avoid fatigue. The participants were asked to rate their perception of exertion (RPE) during the exercises using the Borg CR-10 Scale [28]. They were also asked to evaluate their comfort level while wearing the sensors using a Visual Analog Scale (VAS). This comprehensive approach allowed the thoroughly assessment of both functional capabilities and subjective experiences of the participants during the validation process.
2.5. Statistical Analysis
Given the metrological analogy of the prototypical and reference IMUs which prevented assessing accuracy, their comparison was performed in terms of agreement (BIAS = mean reference - prototype difference) and limits of agreement (LoA = mean ± standard deviation of the differences) between systems. A Bland and Altman (BA) analysis [33] was performed for each parameter. The outliers were first removed, and a possible heteroscedasticity of the data was verified via Kendall’s Tau test [34], by comparing the distribution of the averages with the absolute differences of the reference against prototype values [35]. If τ<0.1, data are considered homoscedastic; conversely, if τ≥0.1, data are considered heteroscedastic. The 95% confidence intervals (CI) of BIAS and LoA, reported in Appendix, were calculated as reported by [36]: t-value, number of samples in test set (n), and standard error for the BIAS (seBIAS) used of CI calculations.
3. Results
The proposed exercises required minimal exertion from the participants, as indicated by the low RPE values (Table 1). The subjects experienced a high level of comfort when wearing the IMUs during the execution of rehabilitative exercises, as described by VAS values (Table 1).
A total of 176 repetitions were performed for each exercise. The automated algorithm, applied to both the prototype and the reference sensor, identified the same number of repetitions.
Table 2 presents the parameters values obtained from the reference IMU for the tested healthy elderly individuals.
The difference between reference and prototypical IMUs sensors is demonstrated through radar plots (Figure 4, Figure 5 and Figure 6), based on the BA analysis. In these radar plots, percentage values of prototype parameters are reported relative to the reference value, along with the bias and LoA between the two instruments. Quality parameter DTW was consistently heteroscedastic (Table A5) and was consequently excluded from Figure 4, Figure 5 and Figure 6. More details on the other BA parameters are reported in the Appendix A (Table A1, Table A2, Table A3, Table A4 and Table A5).
4. Discussion
The implementation of low-cost IMUs for motor exercise monitoring represents a useful step towards accessible telerehabilitation solutions, within the REHACT project and in general. The systematic evaluation of the prototype sensors against established commercial systems, across multiple parameters, highlights both the limitations and potential of these cost-effective monitoring solutions in the perspective of their clinical viability.
The usability assessment testifies the potential for practical implementation in medically stable participants with a full functional capacity (Barthel index score 5). Despite notable subject variability, possibly related to different physical fitness levels, participants reported minimal exertion (RPE: 0.8-2.1) during the REHACT rehabilitation protocol. Users reported high comfort levels with the prototype devices (VAS: 7.85-9.09), despite using simple elastic strap attachments (Table 1).
Consistency of the prototype and its agreement with reference sensors are commented in the perspective of highlighting which parameter types can be used in an applicative setting:
- Quantity parameters exhibited robust validity for conventional rehabilitation parameters (repetition count and execution time) (Figure 4, Figure 5 and Figure 6), demonstrating homoscedastic behavior across all evaluated exercises (τ < 0.1) (Table A1). The system validity is further substantiated by the use of the same algorithm for repetition identification in both reference and prototype sensors. This consistency is a basic prerequisite for reliable monitoring physical therapy exercises.
- Movement Intensity parameters showed varying degrees of consistency and of agreement (Figure 4, Figure 5 and Figure 6). Open chain exercises (KE1, KE2, KE3, SF1, SF2, SF3) had a better performance in terms of both bias and LoA with respect to closed chain ones (SQ, PS, BD1, BD2, LF, RT). While peak acceleration measurements (, , ) and derived parameters (MI, MIV) demonstrated good consistency and agreement, angular velocity measurements (, , ) showed substantial variability and disagreement, although mitigated in the RAV parameter, highlighting the need for hardware improvement.
- Quality parameters had different behaviors: DTW had a heteroscedastic behavior which led to its exclusion and calls for a refinement in the stability assessment; PKROM had high LoA in most of the exercises, presenting a limited applicability for trunk movements and acceptable levels of consistency and variability in KE2, KE3 and SF1 exercises. The error in orientation estimation certainly suffer from the abovementioned differences amongst angular velocities, not excluding other sources of error.
This laboratory assessment confirms the prototype's potential for evaluating certain movement parameters during a rehabilitation protocol. Besides repetition count and execution time, Movement Intensity parameters related to acceleration [11,12,26], and Quality index LDLJ [12] can be trusted. High values of MI indicate phases of rapid accelerations and decelerations, previously resulting in values close to 1 for lower limb exercises performed by a young population [12]. Our sample presented lower values, particularly for lower limb and trunk exercises (Table 2). MI values can be used as a monitoring tool, since values close to 0, i.e. a very low intensity, are desirable for rehabilitation exercises that require great control of the joint and attention on the part of the subject. High LDLJ values denote reduced smoothness, while those closer to zero reflect more smooth movements. In stroke patients, this metric typically ranges from -3 to -10 for upper limb exercises [30]. In the current study, medically stable elderly showed values between -1.4 and -1.9 (Table 2), providing reference values for fluidity of movements of this population.
The prototypes' capability to measure these movement parameters offers valuable insights for structured rehabilitation protocols. With an estimated production cost of approximately 30 euros per sensor and total infrastructure costs around 100 euros, the system could represent an affordable solution for remotely monitoring rehabilitation exercises, particularly beneficial for individual users.
However, several limitations must be acknowledged. Firstly, the study population consists of medically stable participants, which limits generalizability of the results to clinical populations. Secondly, although reference sensors are validated against gold standard instruments, fixation-related errors could influence the comparison between the two systems [32].
Future research should focus on evaluating the sensitivity of these parameters to detect individual changes in motor performance, allowing more precise assessment of improvement and potential deterioration in motor skills. Further construct validity studies with clinical populations will be critical to establish the validity of the system in therapeutic settings. In addition, dedicated metrological testing could help to refine the accuracy of parameters, while improvements in sensor attachment methods and hardware capabilities could address current limitations in motion range detection and stability assessment. Further validation checks should be carried out after implementing these modifications.
5. Conclusions
The REHACT project has the objective of developing an accessible telerehabilitation system based on low-cost Inertial Measurement Units (IMUs). Despite some technical limitations, prototypical IMUs exhibited agreement and consistency for some key rehabilitation parameters, encouraging their use in clinical applications. The prototype shows potential in key aspects, including the assessment of gesture smoothness, intensity measurements, and its significant cost advantages over commercial systems. The integration of these movement parameters into telerehabilitation platforms has the potential to enhance remote monitoring capabilities and provide more personalized patient’s progress feedback. This approach represents a step towards improving telerehabilitation services, with the aim to increase treatment accessibility and, ultimately, enhance patient quality of life.
Author Contributions
Conceptualization, F.C. and V.C.; methodology, F.C. and V.C.; software, F.C.; validation, F.C., E.D. and L.L.; formal analysis, F.C.; investigation, F.C., E.D. and L.L.; data curation, F.C.; writing—original draft preparation, F.C. and V.C.; writing—review and editing, F.C. and V.C.; visualization, F.C. and V.C.; supervision, V.C.; project administration, E.D., L.L. and V.C.; funding acquisition, V.C.
Funding
This research project "teleREHabilitation for respiratory and motor reACTivation exercises” (REHACT) was funded by the Italian National Institute of Social Security (INPS), Call: Industry 4.0, 2020-21.
Data Availability Statement
The raw data supporting the conclusions of this article will be available by the authors, without undue reservation in the following folder: (https://drive.google.com/file/d/1wPAKpKk3_StSXwxAbq_ISRznlT-5cKFe/view?usp=drive_link)
Conflicts of Interest
The authors declare the following conflict of interests: Emanuele D’Angelantonio and Leandro Lucangeli are employed in Technoscience producing the prototype assessed in the study. The company funded their PhD research, but was not involved in the study design, data collection, analysis, or manuscript preparation. All these aspects were handled by Valentina Camomilla and Federico Caramia who do not have any conflict of interest associated with this publication.
Abbreviations
The following abbreviations are used in this manuscript:
| ECG | Electrocardiogram |
| SpO2 | Oxygen saturation levels |
| IMU | Inertial Measurement Unit |
| IoT | Internet of Things |
| TRL | Technology Readiness Level |
| KE1 | Knee extension lying down |
| KE2 | Knee extension sitting with back support |
| KE3 | Knee extension sitting without back support |
| SQ | Half squat in support |
| SF1 | Shoulder flexion lying down |
| SF2 | Shoulder flexion sitting with back support |
| SF3 | Shoulder flexion sitting without back support |
| PS | Wall push up |
| BD1 | Bird Dog using legs |
| BD2 | Bird Dog using arms |
| LF | Trunk lateral flexion |
| RT | Trunk Rotation |
| QT | “quantity” movement parameter |
| REP | Number of repetitions |
| TIME | Time to perform repetition |
| I | “intensity” movement parameter |
| Peak of acceleration x-axis | |
| Peak of acceleration y-axis | |
| Peak of acceleration z-axis | |
| Peak of angular velocity x-axis | |
| Peak of angular velocity y-axis | |
| Peak of angular velocity z-axis | |
| MI | Movement intensity |
| MIV | Movement intensity variability |
| RAV | Range of angular velocity |
| QL | “quality” movement parameter |
| LDLJ | Log dimensionless jerk |
| DTW | Dynamic time warping |
| ROM | Range of motion |
| PKROM | Maximum value of range of motion |
| RPE | Rate of perception exertion |
| VAS | Visual analog scale |
| BIAS | Difference between the mean reference and the |
| LoA | Limit of agreement |
| BA | Bland and Altman analysi |
| CI | Confidence intervals |
| seBIAS | standard error for the BIAS |
Appendix A
Bland and Altman Parameters
Bland and Altman's analysis conducted on the two sensors, Table A1, Table A2 and Table A3 show the parameter values of Bias, LoA, %CI Bias, %Ci LoA, Kendall's τ, Samples, t-value, se Bias.

Table A1.
Bland and Altman analysis for quantity parameters in terms of: Bias, LoA (all expressed in the measurement units indicated for each parameter), %CI Bias, %CI LoA and τ, Samples, t-value, se Bias. Data is reported for all exercises. Lower limb exercises: KE1: knee extension lying down. KE2: knee extension sitting with a back support. KE3: knee extension without back support. SQ: half squat supported on a table. Upper limb exercises: SF1: shoulder flexion lying down. SF2: shoulder flexion sitting with back support. SF3: shoulder flexion without back support. PS: wall push-up. Trunk exercises: BD1: “Bird and Dog” using only the legs. BD2: “Bird and Dog” using only the arms. LF: lateral flexion of the column. RO: rotation of the column.
| Exercises | Parameter | Bias | LoA | CI% Bias | CI% LoA | Kendal’s τ | Samples | t-value | se Bias | |
|---|---|---|---|---|---|---|---|---|---|---|
| KE1 | REP | 0 | 0 | 0% | 0% | \ | 351 | 0 | 0 | |
| TIME [s] | 0.02 | 0.32 | 1% | 3% | 0.01 | 338 | 1.96 | 0 | ||
| KE2 | REP | 0 | 0 | 0% | 0% | \ | 352 | 0 | 0 | |
| TIME [s] | 0.02 | 0.17 | 0% | 1% | 0.01 | 350 | 1.96 | 0 | ||
| KE3 | REP | 0 | 0 | 0% | 0% | \ | 352 | 0 | 0 | |
| TIME [s] | 0.02 | 0.10 | 0% | 1% | 0.01 | 350 | 1.96 | 0 | ||
| SQ | REP | 0 | 0 | 0% | 0% | \ | 352 | 0 | 0 | |
| TIME [s] | 0.02 | 0.25 | 10% | 2% | 0.06 | 278 | 1.96 | 0 | ||
| SF1 | REP | 0 | 0 | 0% | 0% | \ | 352 | 0 | 0 | |
| TIME [s] | -0.05 | 0.26 | 1% | 2% | 0.01 | 312 | 1.96 | 0 | ||
| SF2 | REP | 0 | 0 | 0% | 0% | \ | 351 | 0 | 0 | |
| TIME [s] | -0.04 | 0.17 | 0% | 1% | 0.05 | 340 | 1.96 | 0 | ||
| SF3 | REP | 0 | 0 | 0% | 0% | \ | 351 | 0 | 0 | |
| TIME [s] | -0.05 | 0.41 | 2% | 3% | 0.01 | 346 | 1.96 | 0.01 | ||
| PS | REP | 0 | 0 | 0% | 0% | \ | 351 | 0 | 0 | |
| TIME [s] | -0.02 | 0.27 | 1% | 2% | 0.01 | 286 | 1.96 | 0 | ||
| BD1 | REP | 0 | 0 | 0% | 0% | \ | 256 | 0 | 0 | |
| TIME [s] | -0.01 | 0.63 | 4% | 7% | 0.09 | 251 | 1.96 | 0.02 | ||
| BD2 | REP | 0 | 0 | 0% | 0% | \ | 256 | 0 | 0 | |
| TIME [s] | -0.01 | 0.35 | 2% | 4% | 0.07 | 239 | 1.97 | 0.01 | ||
| LF | REP | 0 | 0 | 0% | 0% | \ | 152 | 0 | 0 | |
| TIME [s] | -0.03 | 0.61 | 11% | 20% | 0.07 | 148 | 1.97 | 0.05 | ||
| RT | REP | 0 | 0 | 0% | 0% | \ | 152 | 0 | 0 | |
| TIME [s] | -0.03 | 1.40 | 11% | 2% | 0.07 | 148 | 1.97 | 0.05 |
Table A2.
Statistical analysis for the intensity parameters in terms of: Bias, LoA (all expressed in the measurement units indicated for each parameter), %CI Bias, %CI LoA and τ, Samples, t-value, se Bias. Data is reported for the lower limb exercises: KE1: knee extension lying down. KE2: knee extension sitting with a back support. KE3: knee extension without back support. SQ: half squat supported on a table.
| Exercises | Parameter | Bias | LoA | CI% Bias | CI% LoA | Kendal’s τ | Samples | t-value | se Bias | |
|---|---|---|---|---|---|---|---|---|---|---|
| KE1 | [g] | 0.01 | 0.16 | 0% | 1% | 0.01 | 342 | 1.96 | 0 | |
| [g] | 0.02 | 0.12 | 0% | 1% | 0.05 | 343 | 1.96 | 0 | ||
| [g] | 0.01 | 0.11 | 0% | 1% | 0.01 | 335 | 1.96 | 0 | ||
| [deg/s] | -5.4 | 14.7 | 0.8 | 13% | 0.06 | 335 | 1.96 | 0.4 | ||
| [deg/s] | -5.9 | 21.0 | 1.19 | 20% | 0.03 | 312 | 1.96 | 0.6 | ||
| [deg/s] | -16.9 | 24.7 | 1.32 | 22% | 0.04 | 349 | 1.96 | 0.6 | ||
| MI [g] | 0 | 0.04 | 0% | 1% | 0.05 | 43 | 2.01 | 0 | ||
| MIV [g] | 0 | 0.06 | 1% | 1% | 0.06 | 44 | 2.01 | 0 | ||
| RAV [rad/s] | 0.06 | 0.03 | 0% | 0% | 0.05 | 347 | 1.96 | 0 | ||
| KE2 | [g] | 0.02 | 0.15 | 0% | 1% | 0.08 | 352 | 1.96 | 0 | |
| [g] | 0.01 | 0.12 | 0% | 1% | 0.01 | 345 | 1.96 | 0 | ||
| [g] | 0.01 | 0.09 | 0% | 0% | 0.02 | 331 | 1.96 | 0 | ||
| [deg/s] | -6.9 | 14.6 | 79% | 13% | 0.08 | 340 | 1.96 | 0.4 | ||
| [deg/s] | -7.7 | 20.1 | 11% | 19% | 0.07 | 320 | 1.96 | 0.5 | ||
| [deg/s] | -18.6 | 26.3 | 14% | 23% | 0.01 | 350 | 1.96 | 0.7 | ||
| MI [g] | 0 | 0.02 | 0% | 0% | 0.03 | 44 | 2.01 | 0 | ||
| MIV [g] | 0 | 0.01 | 0% | 0% | 0.03 | 43 | 2.01 | 0 | ||
| RAV [rad/s] | 0.07 | 0.05 | 0% | 0% | 0.05 | 352 | 1.96 | 0 | ||
| KE3 | [g] | 0.04 | 0.11 | 0% | 0% | 0.02 | 352 | 1.96 | 0 | |
| [g] | 0.01 | 0.12 | 0% | 0% | 0.02 | 350 | 1.96 | 0 | ||
| [g] | 0.01 | 0.10 | 0% | 0% | 0.02 | 350 | 1.96 | 0 | ||
| [deg/s] | -7.0 | 13.6 | 59% | 11% | 0.08 | 340 | 1.96 | 0.5 | ||
| [deg/s] | -7.1 | 18.1 | 10% | 16% | 0.05 | 341 | 1.96 | 0.3 | ||
| [deg/s] | -13.6 | 24.5 | 14% | 23% | 0.01 | 350 | 1.96 | 0.2 | ||
| MI [g] | 0 | 0.02 | 0% | 0% | 0.03 | 44 | 2.01 | 0 | ||
| MIV [g] | 0 | 0.01 | 0% | 0% | 0.03 | 43 | 2.01 | 0 | ||
| RAV [rad/s] | 0.06 | 0.04 | 0% | 0% | 0.01 | 352 | 1.96 | 0 | ||
| SQ | [g] | 0.01 | 0.06 | 0% | 0% | 0.03 | 321 | 1.96 | 0 | |
| [g] | 0.01 | 0.07 | 0% | 0% | 0.02 | 315 | 1.96 | 0 | ||
| [g] | 0 | 0.05 | 0% | 0% | 0.08 | 309 | 1.96 | 0 | ||
| [deg/s] | 0.18 | 4.7 | 26% | 46% | 0.02 | 313 | 1.96 | 0.13 | ||
| [deg/s] | -2.2 | 6.0 | 34% | 59% | 0.02 | 306 | 1.96 | 0.17 | ||
| [deg/s] | -5.8 | 15.2 | 9% | 14% | 0.02 | 320 | 1.96 | 0.43 | ||
| MI [g] | 0 | 0.01 | 0% | 0% | 0.01 | 40 | 2.02 | 0 | ||
| MIV [g] | 0 | 0 | 0% | 0% | 0.01 | 38 | 2.02 | 0 | ||
| RAV [rad/s] | 0.02 | 0.03 | 0% | 0% | 0.01 | 321 | 1.96 | 0 |
Table A3.
Statistical analysis for the intensity parameters in terms of: Bias, LoA (all expressed in the measurement units indicated for each parameter), %CI Bias, %CI LoA and τ, Samples, t-value, se Bias. Data is reported for the upper limb exercises: SF1: shoulder flexion lying down. SF2: shoulder flexion sitting with back support. SF3: shoulder flexion sitting without back support. PS: wall push up *Heteroscedastic parameters.
| Exercises | Parameter | Bias | LoA | CI % Bias | CI% LoA | Kendal’s τ | Samples | t-value | se Bias | |
|---|---|---|---|---|---|---|---|---|---|---|
| SF1 | [g] | -0.02 | 0.09 | 0% | 0% | 0.01 | 336 | 1.96 | 0 | |
| [g] | -0.01 | 0.28 | 1% | 2% | 0.01 | 346 | 1.96 | 0 | ||
| [g] | -0.02 | 0.18 | 1% | 1% | 0.04 | 343 | 1.96 | 0 | ||
| [deg/s] | -9.0 | 25.5 | 14% | 24% | 0.02 | 330 | 1.96 | 0.7 | ||
| [deg/s] | -25.2 | 17.5 | 9% | 16% | 0.02 | 347 | 1.96 | 0.47 | ||
| [deg/s] | -6.2 | 23.0 | 13% | 22% | 0.02 | 304 | 1.96 | 0.67 | ||
| MI [g] | 0.02 | 0.06 | 1% | 1% | 0.01 | 40 | 2.02 | 0 | ||
| MIV [g] | -0.02 | 0.05 | 0% | 1% | 0.08 | 44 | 2.01 | 0 | ||
| RAV [rad/s] | -0.07 | 0.05 | 0% | 0% | 0.01 | 350 | 1.96 | 0 | ||
| SF2 | [g] | -0.03 | 0.10 | 0% | 1% | 0.01 | 338 | 1.96 | 0 | |
| [g] | 0.03 | 0.17 | 0% | 1% | 0.01 | 345 | 1.96 | 0 | ||
| [g] | -0.01 | 0.14 | 0% | 1% | 0.06 | 338 | 1.96 | 0 | ||
| [deg/s] | -8.8 | 23.2 | 12% | 21% | 0.02 | 353 | 1.96 | 0.63 | ||
| [deg/s] | -30.7 | 24.6 | 13% | 22% | 0.04 | 353 | 1.96 | 0.66 | ||
| [deg/s] | -6.6 | 22.0 | 12% | 20% | 0.02 | 333 | 1.96 | 0.61 | ||
| MI [g] | 0.01 | 0.04 | 0% | 1% | 0.05 | 42 | 2.01 | 0 | ||
| MIV [g] | 0 | 0.02 | 0% | 0% | 0.02 | 39 | 2.02 | 0 | ||
| RAV [rad/s] | -0.07 | 0.04 | 0% | 0% | 0.05 | 354 | 1.96 | 0 | ||
| SF3 | [g] | -0.03 | 0.16 | 0% | 1% | 0.01 | 338 | 1.96 | 0 | |
| [g] | 0.01 | 0.17 | 0% | 1% | 0.08 | 345 | 1.96 | 0 | ||
| [g] | -0.02 | 0.15 | 0% | 1% | 0.01 | 338 | 1.96 | 0 | ||
| [deg/s] | -10.2 | 25.2 | 13% | 24% | 0.02 | 353 | 1.96 | 0.63 | ||
| [deg/s] | -30.4 | 20.4 | 10% | 18% | 0.04 | 353 | 1.96 | 0.66 | ||
| [deg/s] | -5.26 | 23.1 | 12% | 22% | 0.02 | 333 | 1.96 | 0.61 | ||
| MI [g] | 0.02 | 0.05 | 0% | 1% | 0.04 | 42 | 2.01 | 0 | ||
| MIV [g] | -0.01 | 0.03 | 0% | 0% | 0.01 | 39 | 2.02 | 0 | ||
| RAV [rad/s] | -0.09 | 0.08 | 0% | 0% | 0.6* | 354 | 1.96 | 0 | ||
| PS | [g] | -0.01 | 0.08 | 0% | 0% | 0.04 | 303 | 1.96 | 0 | |
| [g] | 0 | 0.05 | 0% | 0% | 0.01 | 300 | 1.96 | 0 | ||
| [g] | 0 | 0.04 | 0% | 0% | 0.03 | 289 | 1.96 | 0 | ||
| [deg/s] | -1.3 | 6.6 | 39% | 68% | 0.01 | 278 | 1.96 | 0.2 | ||
| [deg/s] | -4.4 | 10.7 | 62% | 107% | 0.04 | 302 | 1.96 | 0.3 | ||
| [deg/s] | -5.1 | 8.7 | 50% | 87% | 0.01 | 301 | 1.96 | 0.25 | ||
| MI [g] | 0 | 0.02 | 0% | 0% | 0.08 | 38 | 2.02 | 0 | ||
| MIV [g] | 0 | 0.01 | 0% | 0% | 0.01 | 38 | 2.02 | 0 | ||
| RAV [rad/s] | -0.02 | 0.04 | 0% | 0% | 0.01 | 300 | 1.96 | 0 |
Table A4.
Statistical analysis for the intensity parameters in terms of: Bias, LoA (all expressed in the measurement units indicated for each parameter), %CI Bias, %CI LoA and τ, Samples, t-value, se Bias. Data is reported for the upper limb exercises: BD1: Bird Dog exercise using only the legs. BD2: Bird Dog exercise using only the arm. LF: Lateral flexion. RT: Trunk rotation. *Heteroscedastic parameters.
| Exercises | Parameter | Bias | LoA | CI % Bias | CI% LoA | Kendal’s τ | Samples | t-value | se Bias | |
|---|---|---|---|---|---|---|---|---|---|---|
| BD1 | [g] | 0 | 0.04 | 0% | 0% | 0.01 | 233 | 1.97 | 0 | |
| [g] | 0 | 0.1 | 0% | 1% | 0.08 | 255 | 1.96 | 0 | ||
| [g] | 0 | 0.04 | 0% | 0% | 0.01 | 238 | 1.97 | 0 | ||
| [deg/s] | -3.9 | 12.4 | 78% | 135% | 0.03 | 255 | 1.96 | 0.39 | ||
| [deg/s] | 0 | 3.4 | 21% | 37% | 0.02 | 237 | 1.97 | 0.11 | ||
| [deg/s] | -1 | 6.3 | 40% | 69% | 0.01 | 245 | 1.96 | 0.2 | ||
| MI [g] | 0 | 0.03 | 0% | 1% | 0.01 | 19 | 2.1 | 0 | ||
| MIV [g] | 0 | 0 | 0% | 0% | 0.02 | 18 | 2.1 | 0 | ||
| RAV [rad/s] | -0.01 | 0.02 | 0% | 0% | 0.02 | 241 | 1.96 | 0 | ||
| BD2 | [g] | 0 | 0.03 | 0% | 0% | 0.01 | 0 | 240 | 1.96 | |
| [g] | 0 | 0.03 | 0% | 0% | 0.01 | 0 | 179 | 1.97 | ||
| [g] | 0 | 0.05 | 0% | 0% | 0.02 | 0.01 | 208 | 1.97 | ||
| [deg/s] | -0.3 | 3.7 | 24% | 43% | 0.02 | 0.39 | 224 | 1.97 | ||
| [deg/s] | -1.9 | 3.4 | 22% | 38% | 0.04 | 0.37 | 231 | 1.97 | ||
| [deg/s] | -0.9 | 2.8 | 19% | 33% | 0.03 | 0.06 | 209 | 1.97 | ||
| MI [g] | 0 | 0.01 | 0% | 0% | 0.03 | 0.15 | 18 | 2.1 | ||
| MIV [g] | 0 | 0 | 0% | 0% | 0.03 | 0.07 | 16 | 2.1 | ||
| RAV [rad/s] | 0 | 0 | 0% | 0% | 0.04 | 0.3 | 221 | 1.97 | ||
| LF | [g] | 0 | 0,01 | 0% | 0% | 0,03 | 151 | 1,97 | 0 | |
| [g] | 0 | 0,03 | 0% | 0% | 0,09 | 151 | 1,97 | 0 | ||
| [g] | 0 | 0.03 | 0% | 0% | 0.02 | 150 | 1.97 | 0 | ||
| [deg/s] | -13.5 | 19.4 | 15% | 27% | .06 | 152 | 1.97 | 0.8 | ||
| [deg/s] | -0.0 | 5.2 | 43% | 75% | 0.01 | 143 | 1.97 | 0.22 | ||
| [deg/s] | -8.6 | 14.6 | 11% | 20% | 0.5* | 152 | 1.97 | 0.6 | ||
| MI [g] | 0 | 0 | 0% | 0% | 0.03 | 18 | 2.1 | 0 | ||
| MIV [g] | 0 | 0 | 0% | 0% | 0.01 | 19 | 2.1 | 0 | ||
| RAV [rad/s] | -0.09 | 0.08 | 0% | 0% | 0.6* | 354 | 1.96 | 0 | ||
| RT | [g] | -0.03 | 1.40 | 0% | 0% | 0.03 | 151 | 1.97 | 0 | |
| [g] | 0 | 0.01 | 0% | 0% | 0.09 | 151 | 1.97 | 0 | ||
| [g] | 0 | 0.03 | 0% | 0% | 0.02 | 150 | 1.97 | 0 | ||
| [deg/s] | 0 | 0.0 | 115% | 274% | 0.06 | 152 | 1.97 | 0.8 | ||
| [deg/s] | -13.5 | 19.4 | 43% | 75% | 0.01 | 143 | 1.97 | 0.22 | ||
| [deg/s] | -0.0 | 5.2 | 119% | 206% | 0.5* | 152 | 1.97 | 0.6 | ||
| MI [g] | -8.61 | 14.56 | 0% | 0% | 0.03 | 18 | 2.1 | 0 | ||
| MIV [g] | 0 | 0 | 0% | 0% | 0.01 | 19 | 2.1 | 0 | ||
| RAV [rad/s] | -0.03 | 0.03 | 0% | 0% | 0.02 | 151 | 1.97 | 0 |
Table A5.
Statistical analysis for the quality parameters in terms of: Bias, LoA (all expressed in the measurement units indicated for each parameter), %CI Bias, %CI LoA and τ, Samples, t-value, se Bias. Data is reported for the lower limb exercises: KE1: knee extension lying down. KE2: knee extension sitting with a back support. KE3: knee extension without back support. SQ: half squat supported on a table; upper limb exercises: SF1: shoulder flexion lying down. SF2: shoulder flexion sitting with back support. SF3: shoulder flexion without back support. PS: wall push-up; and trunk exercises: BD1: “Bird and Dog” using only the legs. BD2: “Bird and Dog” using only the arms. LF: lateral flexion of the column. RO: rotation of the column. *Heteroscedastic parameters.
| Exercises | Parameter | Bias | LoA | CI % Bias | CI% LoA | Kendal’s τ | Samples | t-value | se Bias | |
| KE1 | LDLJ [a.u.] | 0.06 | 0.32 | 1% | 3% | 0.01 | 350 | 1.96 | 0 | |
| PKROM [deg] | 0.7 | 41.9 | 23% | 40% | 0.05 | 270 | 1.96 | 0.09 | ||
| DTW [m/s2] | -1.9 | 3.1 | 2% | 3% | 0.06 | 342 | 1.96 | 1.15 | ||
| KE2 | LDLJ [a.u.] | 0.00 | 0.48 | 2% | 4% | 0.03 | 335 | 1.96 | 0.01 | |
| PKROM [deg] | -8.9 | 15.9 | 9% | 15% | 0.01 | 343 | 1.96 | 0.43 | ||
| DTW [m/s2] | -2.5 | 5.0 | 30% | 53% | 0.06 | 267 | 1.96 | 0.15 | ||
| KE3 | LDLJ [a.u.] | 0.00 | 0.42 | 1% | 2% | 0.01 | 345 | 1.96 | 0.01 | |
| PKROM [deg] | -8.9 | 11.9 | 6% | 13% | 0.01 | 343 | 1.96 | 0.43 | ||
| DTW [m/s2] | -2.0 | 4.8 | 30% | 50% | 0.03 | 267 | 1.96 | 0.15 | ||
| SQ | LDLJ [a.u.] | 0 | 0.27 | 1% | 2% | 0.01 | 291 | 1.96 | 0 | |
| PKROM [deg] | 20.9 | 21.8 | 12% | 21% | 0.7* | 322 | 1.96 | 0.62 | ||
| DTW [m/s2] | -1.7 | 2.6 | 20% | 30% | 0.6* | 256 | 1.96 | 0.08 | ||
| SF1 | LDLJ [a.u.] | 0.03 | 0.15 | 0% | 1% | 0.08 | 348 | 1.96 | 0 | |
| PKROM [deg] | 4.7 | 20.4 | 13% | 23% | 0.0 | 241 | 1.96 | 0.67 | ||
| DTW [m/s2] | -4.3 | 6.5 | 40% | 70% | 0.7* | 282 | 1.96 | 0.19 | ||
| SF2 | LDLJ [a.u.] | 0.08 | 0.21 | 1% | 1% | 0.01 | 341 | 1.96 | 0 | |
| PKROM [deg] | -4.0 | 34.9 | 19% | 33% | 0.0 | 342 | 1.96 | 0.96 | ||
| DTW [m/s2] | -3.5 | 4.8 | 30% | 50% | 0.7* | 284 | 1.96 | 0.14 | ||
| SF3 | LDLJ [a.u.] | 0.08 | 0.41 | 2% | 3% | 0.08 | 346 | 1.96 | 0.01 | |
| PKROM [deg] | -5.4 | 30.1 | 160% | 290% | 0.0 | 335 | 1.96 | 0.83 | ||
| DTW [m/s2] | -3.1 | 5.6 | 30% | 60% | 0.6* | 256 | 1.96 | 0.17 | ||
| PS | LDLJ [a.u.] | 0.03 | 0.31 | 1% | 3% | 0.07 | 272 | 1.96 | 0 | |
| PKROM [deg] | 43.6 | 79.6 | 470% | 82% | 0.6* | 286 | 1.96 | 2.4 | ||
| DTW [m/s2] | -2.6 | 3.8 | 20% | 40% | 0.8* | 239 | 1.97 | 0.15 | ||
| BD1 | LDLJ [a.u.] | 0.12 | 1.29 | 8% | 14% | 0.01 | 228 | 1.97 | 0.04 | |
| PKROM [deg] | -5.8 | 33.4 | 216% | 374% | 0.03 | 241 | 1.96 | 1.09 | ||
| DTW [m/s2] | -2.3 | 4.2 | 29% | 50% | 0.7* | 203 | 1.97 | 0.14 | ||
| BD2 | LDLJ [a.u.] | 0.11 | 0.92 | 6% | 10% | 0.03 | 233 | 1.97 | 0.03 | |
| PKROM [deg] | 2.3 | 25.0 | 166% | 288% | 0.03 | 228 | 1.97 | 0.84 | ||
| DTW [m/s2] | -1.0 | 1.5 | 11% | 19% | 0.7* | 194 | 1.97 | 0.05 | ||
| LF | LDLJ [a.u.] | 0.08 | 0.5 | 4% | 7% | 0.06 | 150 | 1.97 | 0.02 | |
| PKROM [deg] | -9.8 | 60.7 | 506% | 877% | 0.02 | 146 | 1.97 | 2.56 | ||
| DTW [m/s2] | -2.3 | 4.2 | 41% | 72% | 0.8* | 104 | 1.98 | 0.21 | ||
| RT | LDLJ [a.u.] | 0.29 | 1.15 | 9% | 16% | 0.07 | 143 | 1.97 | 0.04 | |
| PKROM [deg] | 0.1 | 70.0 | 58% | 1014% | 0.02 | 145 | 1.97 | 2.96 | ||
| DTW [m/s2] | -2.3 | 3.13 | 28% | 49% | 0.7* | 121 | 1.97 | 0.14 |
References
- A. Haleem, M. Javaid, R. P. Singh, R. Suman, (2021). Telemedicine for healthcare: Capabilities, features, barriers, and applications. Sens Int., 2:100117. [Online]. [CrossRef]
- N. Jirasakulsuk, P. Saengpromma, & S. Khruakhorn, (2022). Real-time telerehabilitation in older adults with musculoskeletal conditions: systematic review and meta-analysis. JMIR rehabilitation and assistive technologies, 9(3), e36028. [Online]. https://rehab.jmir.org/2022/3/e36028.
- Viera, A. Pinto, B. M. Pereira Garcia, R. A. Caserta Eid, C. Gomes Mól, R. Kenji Nawa, (2022). Telerehabilitation improves physical function and reduces dyspnoea in people with COVID-19 and post-COVID-19 conditions: a systematic review. Journal of Physiotherapy, 68, 90–98. [Online]. [CrossRef]
- S. Lundell, A. Holmner, B. Rehn, A. Nyberg, K. Wadell, (2015). Telehealthcare in COPD: A systematic review and meta-analysis on physical outcomes and dyspnea, RespiratoryMedicine, 109, 11e26. [Online]. [CrossRef]
- S. Ibeggazene, R. Turner, D. Rosario, L. Bourke, (2021). Remote interventions to improve exercise behaviour in sedentary people living with and beyond cancer: a systematic review and meta-analysis. BMC Cancer, 21:308. [Online]. [CrossRef]
- Berton, U.G. Candela, V. Fioravanti, L. Giannone, S. Arcangeli, V Denaro, (2020). Virtual reality, augmented reality, gamification, and telerehabilitation: psychological impact on orthopedic patients’ rehabilitation. Journal of clinical medicine, 9(8), 2567. [Online]. [CrossRef]
- G. Kingston, M.A. Gray, G. Williams, (2010). A critical review of the evidence on the use of videotapes or DVD to promote patient compliance with home programmes. Disability and Rehabilitation: Assistive Technology, 5(3), 153–163. [Online]. [CrossRef]
- T. G. Stavropoulos, A. Papastergiou, L. Mpaltadoros, S. Nikolopoulos, I. Kompatsiaris, (2020). IoT Wearable sensors and devices in elderly care: a literature review. Sensors, 20, 2826. [CrossRef]
- L. Lu, J. Zhang, Y. Xie, F. Gao, S. Xu, X. Wu, Z. Ye, (2020). Wearable health devices in health care: narrative systematic review. JMIR mHealth and uHealth, 8(11), e18907. [CrossRef]
- M. Giggins, U. McCarthy Persson, B. Caulfield, (2013). Biofeedback in rehabilitation, Journal of NeuroEngineering and Rehabilitation, 10:60. http://www.jneuroengrehab.com/content/10/1/60.
- S. Tedesco, A. Urru, J. Peckitt, B. O’Flynn, (2017). Inertial sensors-based lower-limb rehabilitation assessment: a comprehensive evaluation of gait, kinematic and statistical metrics. International Journal on Advances in Life Sciences, 9(1 & 2). http://www.iariajournals.org/life_sciences/.
- D. S. Komaris, G. Tarfali, B. O’Flynn, S. Tedesco, (2022). Unsupervised IMU-based evaluation of at-home exercise programmes: a feasibility study. BMC Sports Science, Medicine and Rehabilitation, 14:28. [CrossRef]
- P. Picerno, M. Iosa, C. D’Souza, M. G. Benedetti, S. Paolucci, G. Morone, (2021). Wearable inertial sensors for human movement analysis: a five-year update, Expert Rev Med Devices, 18(sup1):79-94. Epub 2021 Oct 12. [CrossRef]
- F. Porciuncula, A. V. Roto, D. Kumar, I. Davis, C. J. Walsh, L. N. Awad, (2018). Wearable Movement Sensors for Rehabilitation: A Focused Review of Technological and Clinical Advances. PM&R, 10(9 Sup2):S220-S232. [CrossRef]
- F. Routhier et al., Clinicians’ perspectives on inertial measurement units in clinical practice. PLoS ONE, 15(11): e0241922. [CrossRef]
- F. Saaei S. G. Klappa, (2021). Rethinking telerehabilitation: attitudes of physical therapists and patients. J Patient Exp. 28:8:23743735211034335. eCollection 2021. [CrossRef]
- Silva-Batista, J. L. Wilhelm, K.T. Scanlan, M. Stoja, P. Carlson-Kuhta, S. Chen, W. Liu, T. N. de la Huerta, F. B. Horak, M. Mancini, L. A. King, (2023). Balance telerehabilitation and wearable technology for people with Parkinson’s disease (TelePD trial). BMC Neurology, 23(1), 368. [CrossRef]
- M. Capecci, R. Cima, F. A. Barbini, A. Mantoan, F. Sernissi, S. Lai, R. Fava, L. Tagliapietra, L. Ascari, R. N. Izzo, M. E. Leombruni, P. Casoli, M. Hibel, & M. G. Ceravolo, (2023). Telerehabilitation with ARC intellicare to cope with motor and respiratory disabilities: results about the process, usability, and clinical effect of the “Ricominciare” Pilot Study. Sensors, 23(16), 7238. [CrossRef]
- F. Caramia, E. D'Angelantonio, F. De Angelis, L. Lucangeli, I. Campanini, A. Pallotti, V. Camomilla, (2022). Design of a care pathway in telerehabilitation on respiratory exercise and physical reactivation of patients suffering from respiratory diseases or COVID-19, 17th International Symposium of 3-D Analysis of Human Movement (3D-AHM 2022).
- L. Atzori, A. Iera, G. Morabito, (2010). The Internet of Things: A survey. Computer Networks, 54(15): 2787–2805. [CrossRef]
- Bruno, G. Lobo, B. V. Covino, A. Donarelli, V. Marchetti, A. S. Panni, F. Molinari (2020, September). Technology readiness revisited: a proposal for extending the scope of impact assessment of European public services. In Proceedings of the 13th international conference on theory and practice of electronic governance (pp. 369-380).
- M. Izquierdo, R. A. Merchant, J. E. Morley, S. D. Anker, I. Aprahamian, H.Arai, ... M.F. Singh, (2021). International Exercise Recommendations in Older Adults (ICFSR): Expert Consensus Guidelines. The Journal of nutrition, health and aging, 25(7), 824-853. [CrossRef]
- Nikitas, D. Kikidis, A. Bibas, M. Pavlou, Z. Zachou, D. E. Bamiou, (2022). Recommendations for physical activity in the elderly population: A scoping review of guidelines., J Frailty Sarcopenia Falls, 1;7(1):18-28. [CrossRef]
- Graham, (2009). Exercise: Bird Dog. Strength and Conditioning Journal, 31(6):93-94. [CrossRef]
- A. Winter, Signal Processing. In Biomechanics and Motor Control of Human Movement, 2009, pp. 14–44. [CrossRef]
- C. Strohrmann, R. Labruyère, C. N. Gerber, H. J. van Hedel, B. Arnrich, G. Tröster, (2013). Monitoring motor capacity changes of children during rehabilitation using body-worn sensors. Journal of NeuroEngineering and Rehabilitation, 10(1):83. [CrossRef]
- S. Jiang, B. Zhang, D. Wei, (2011). The elderly fall risk assessment and prediction based on gait analysis. 2011 IEEE 11th international conference on computer and information technology, Paphos, Cyprus, 2011, pp. 176-180. [CrossRef]
- V. Venek, S. Kranzinger, H. Schwameder, T. Stöggl, (2022). Human movement quality assessment using sensor technologies in recreational and professional sports: a scoping review. Sensors, 22, 4786. [CrossRef]
- N. Hogan D. Sternad, (2009). Sensitivity of smoothness measures to movement duration, amplitude, and arrests, J Mot Behav, 41(6):529-34. [CrossRef]
- Melendez-Calderon, C. Shirota & S. Balasubramanian (2021). Estimating movement smoothness from inertial measurement units. Front Bioeng Biotechnol, 8:558771. [CrossRef]
- S. O. H. Madgwick, A. J. L. Harrison, R. Vaidyanathan, Estimation of IMU and MARG orientation using a gradient descent algorithm, (2011). IEEE International Conference on Rehabilitation Robotics, Zurich, Switzerland, pp. 1-7. [CrossRef]
- Adamowicz, R. D. Gurchiek, J. Ferri, A. T. Ursiny, N. Fiorentino, R. S. McGinnis, (2019). Validation of novel relative orientation and inertial sensor-to-segment alignment algorithms for estimating 3D hip joint angles, Sensors, 19(23):5143. [CrossRef]
- J. M. Bland D. G. Altman, Statistics Notes: Measurement error proportional to the mean, BMJ, vol. 313, fasc. 7049, p. 106, lug. 1996. [CrossRef]
- Kendall, M. G. (1938). A new measure of rank correlation. Biometrika, 30(1-2), 81-93.
- M.-A. Brehm, V. A. Scholtes, A. J. Dallmeijer, J. W. Twisk, J. Harlaar, (2012). The importance of addressing heteroscedasticity in the reliability analysis of ratio-scaled variables: an example based on walking energy-cost measurements, Developmental Medicine & Child Neurology, 54(3):267–273. [CrossRef]
- Giavarina, (2015). Understanding Bland Altman analysis, Biochem Med (Zagreb), 25:141-151. [CrossRef]
Figure 1.
REHACT motor rehabilitation protocol. Lower limb exercises: KE1: knee extension lying down. KE2: knee extension sitting with a back support. KE3: knee extension without back support. SQ: half squat supported on a table. Upper limb exercises: SF1: shoulder flexion lying down. SF2: shoulder flexion sitting with back support. SF3: shoulder flexion without back support. PS: wall push-up. Trunk exercises: BD1: Bird Dog using only the legs. BD2: Bird Dog using only the arms. LF: lateral flexion of the column. RO: rotation of the column.
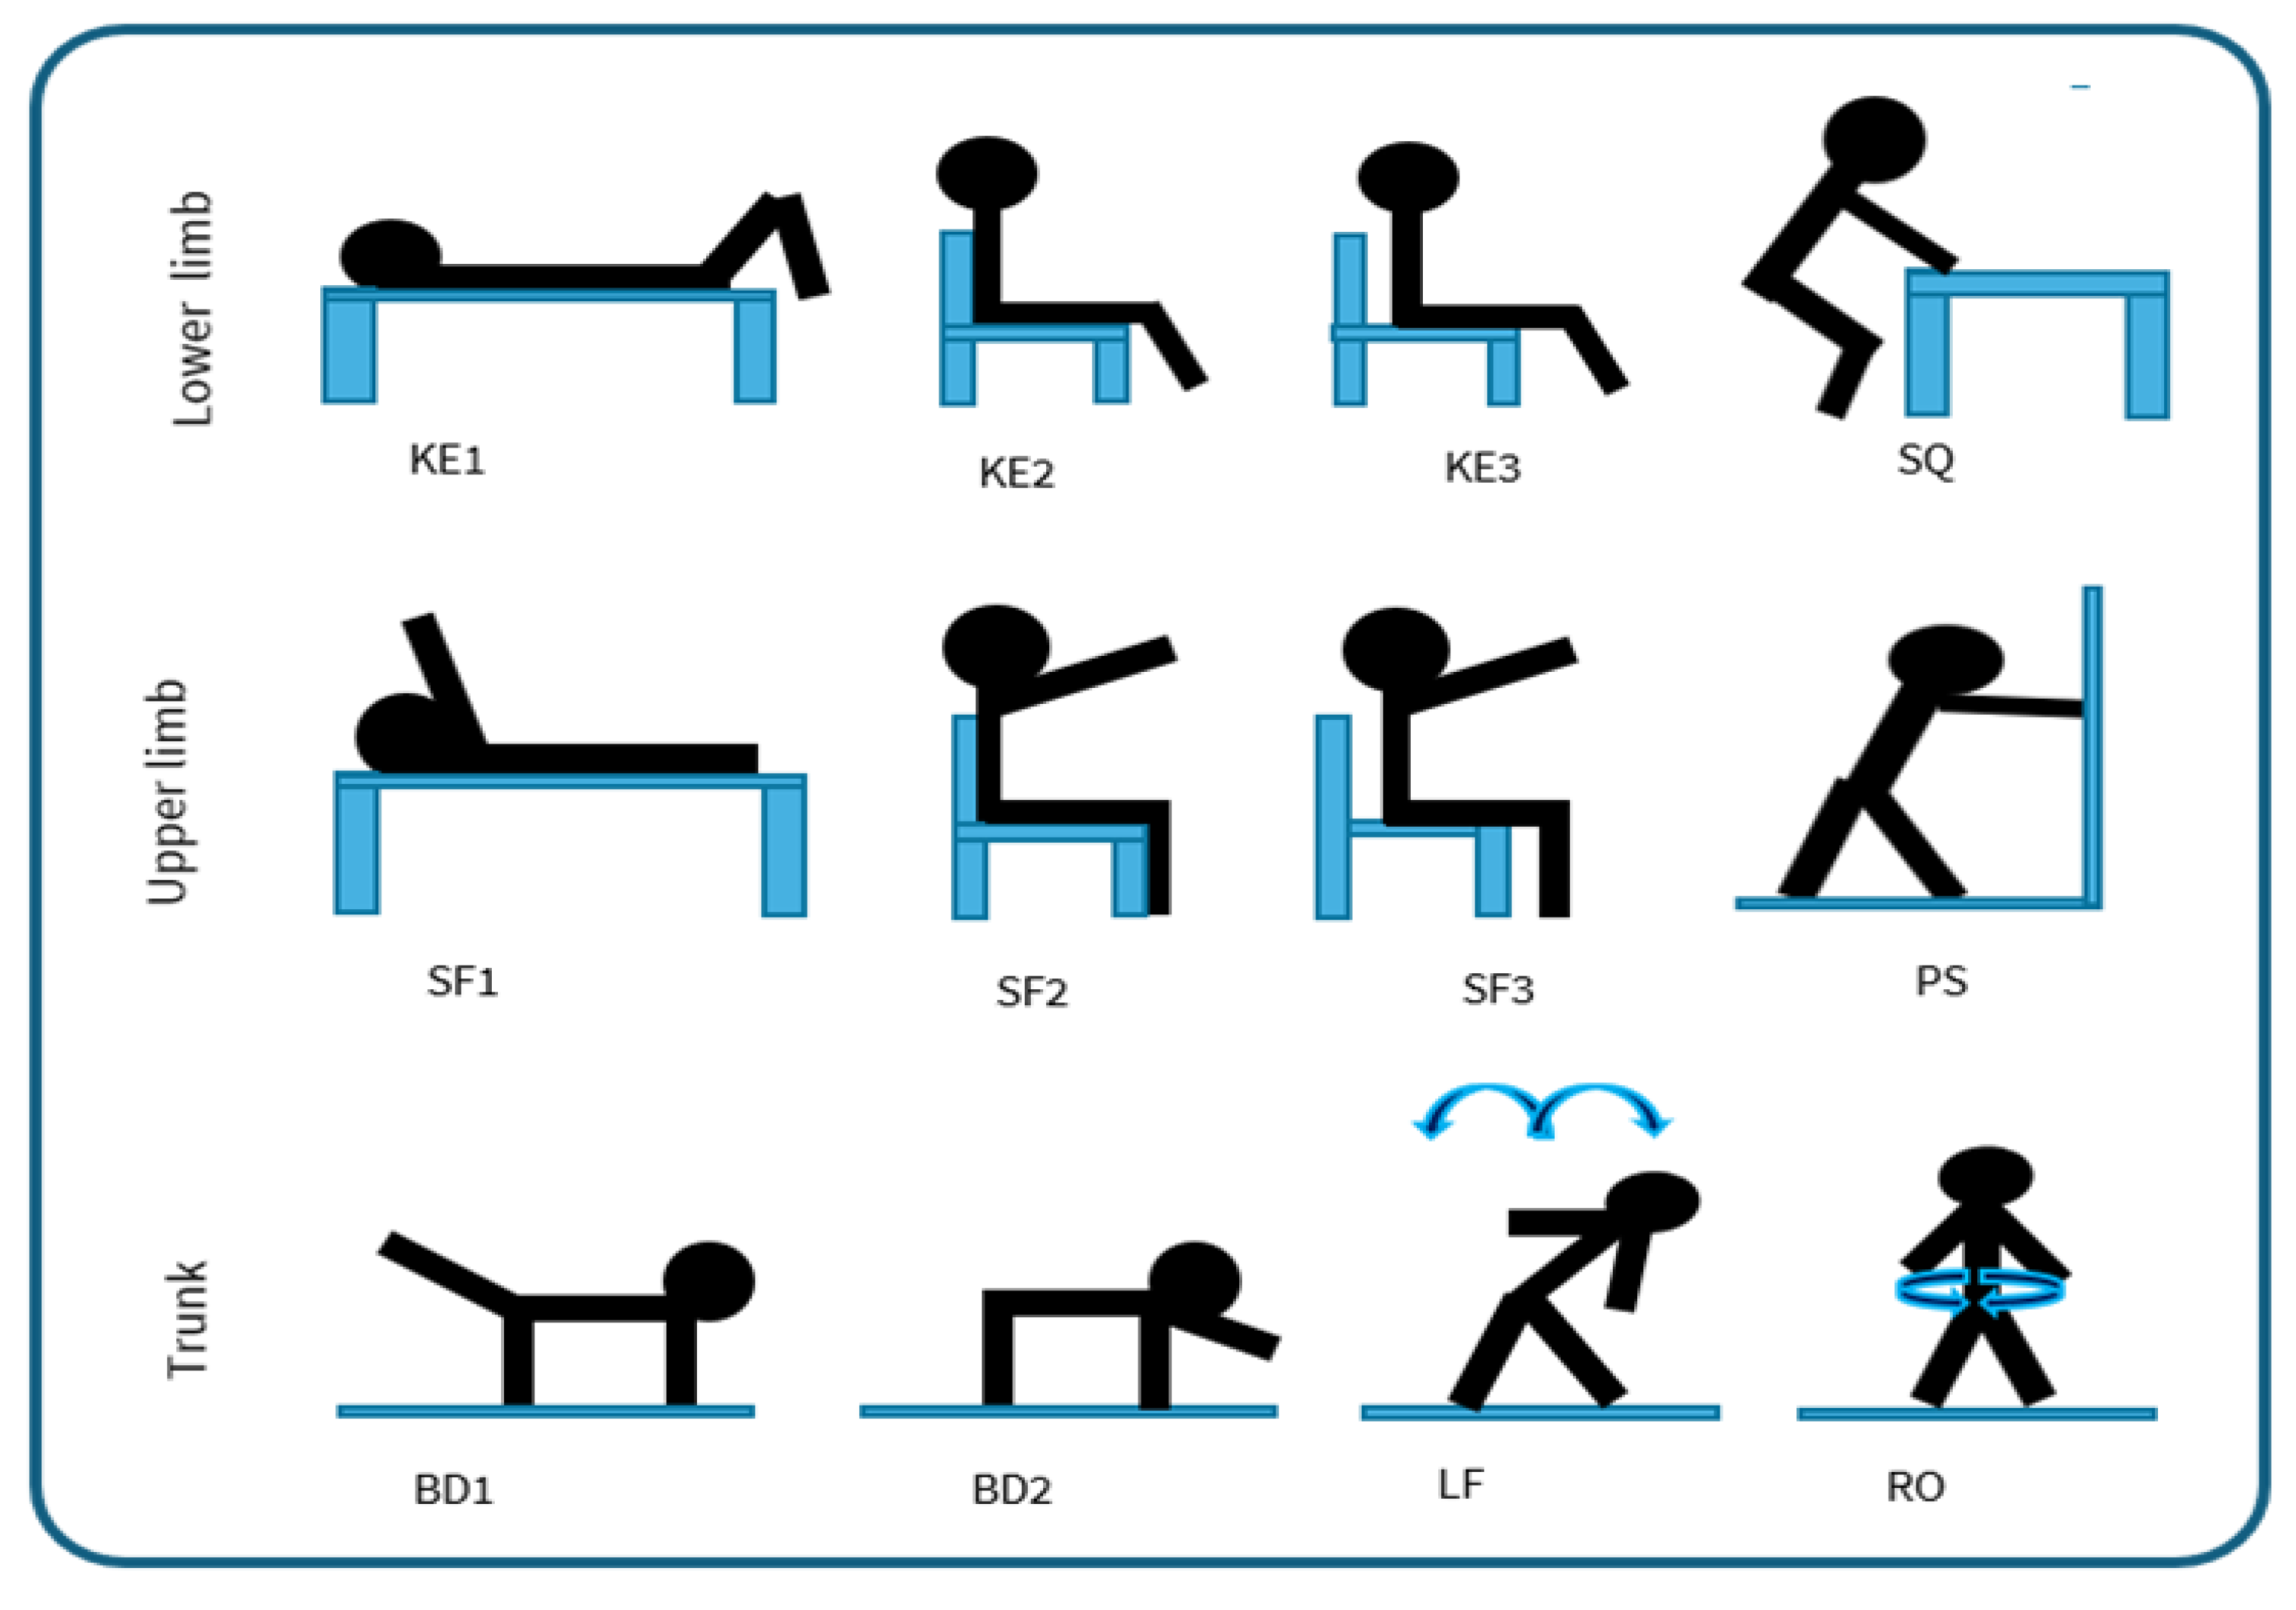
Figure 2.
a) prototypical IMU, b) positioning for the lower limb exercises, c) positioning for trunk exercises, d) positioning for upper limb exercises.
Figure 2.
a) prototypical IMU, b) positioning for the lower limb exercises, c) positioning for trunk exercises, d) positioning for upper limb exercises.
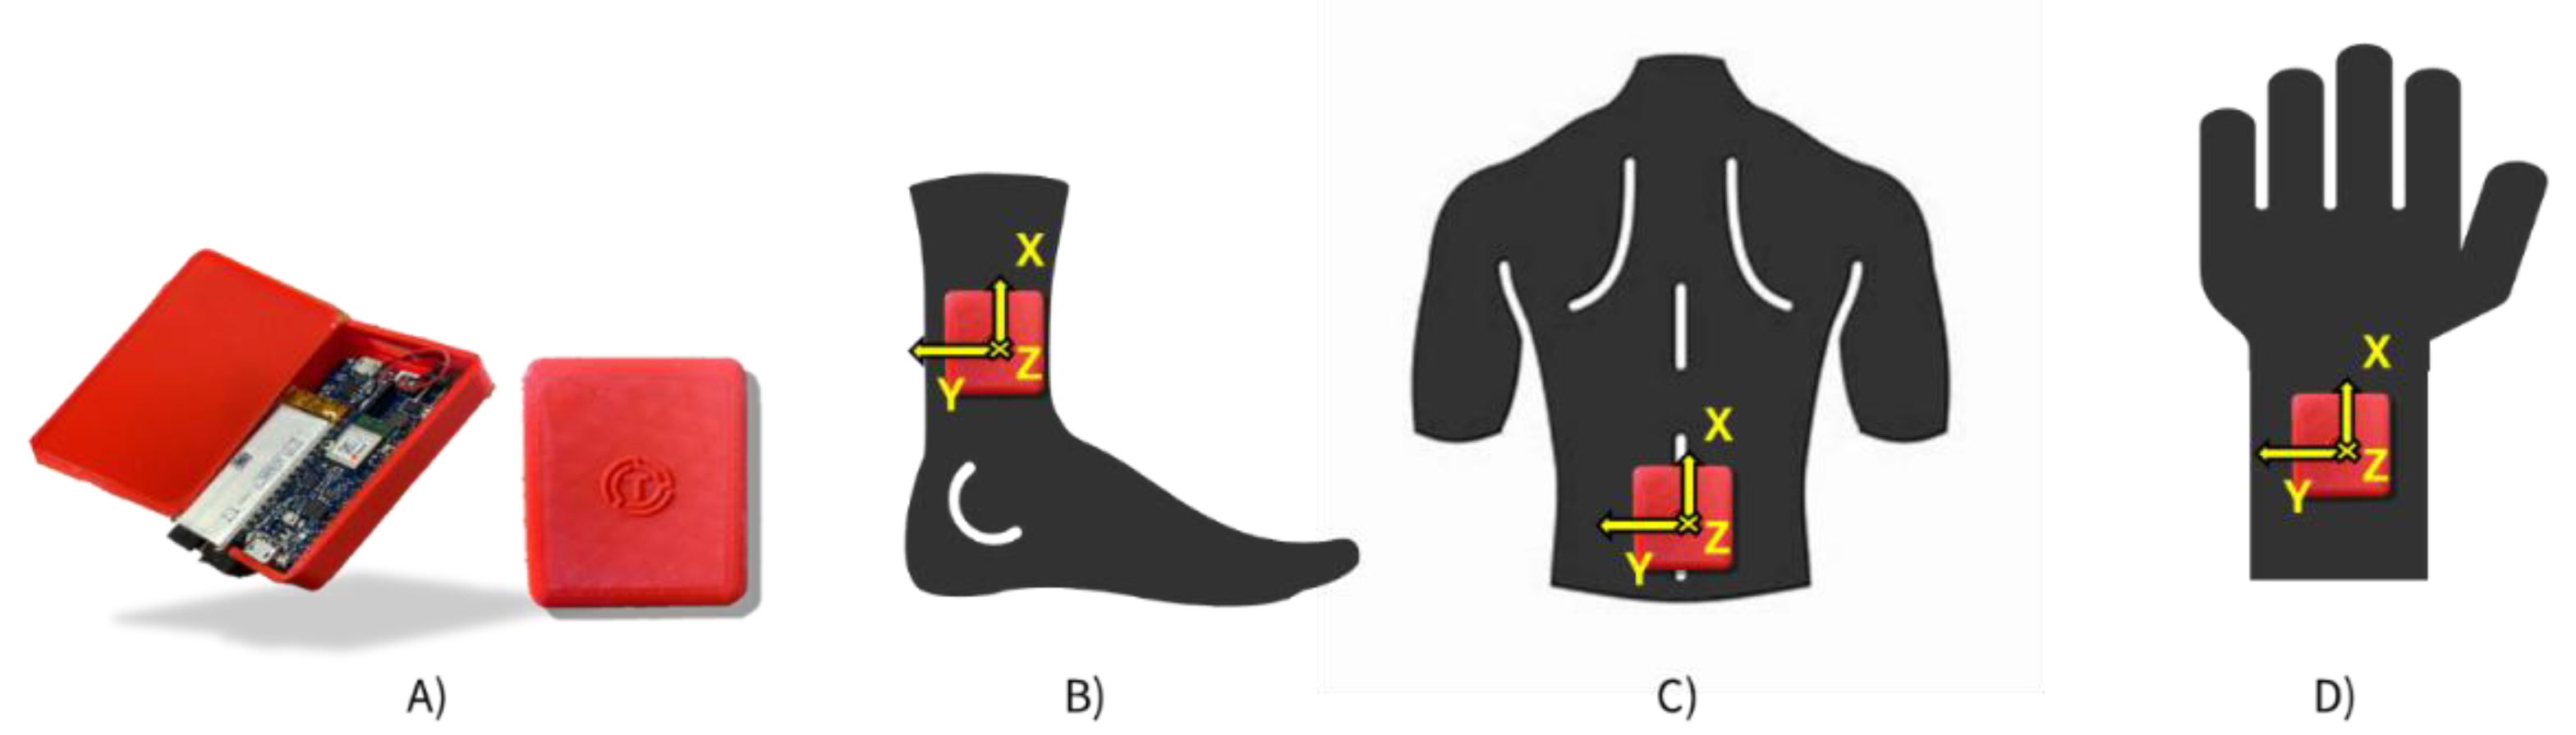
Figure 3.
Example of repetitions identification on prototype’s data. The principal axis (in this case the X-axis), as segmented in single repetitions (vertical red dashed lines). In green, the used threshold.
Figure 3.
Example of repetitions identification on prototype’s data. The principal axis (in this case the X-axis), as segmented in single repetitions (vertical red dashed lines). In green, the used threshold.
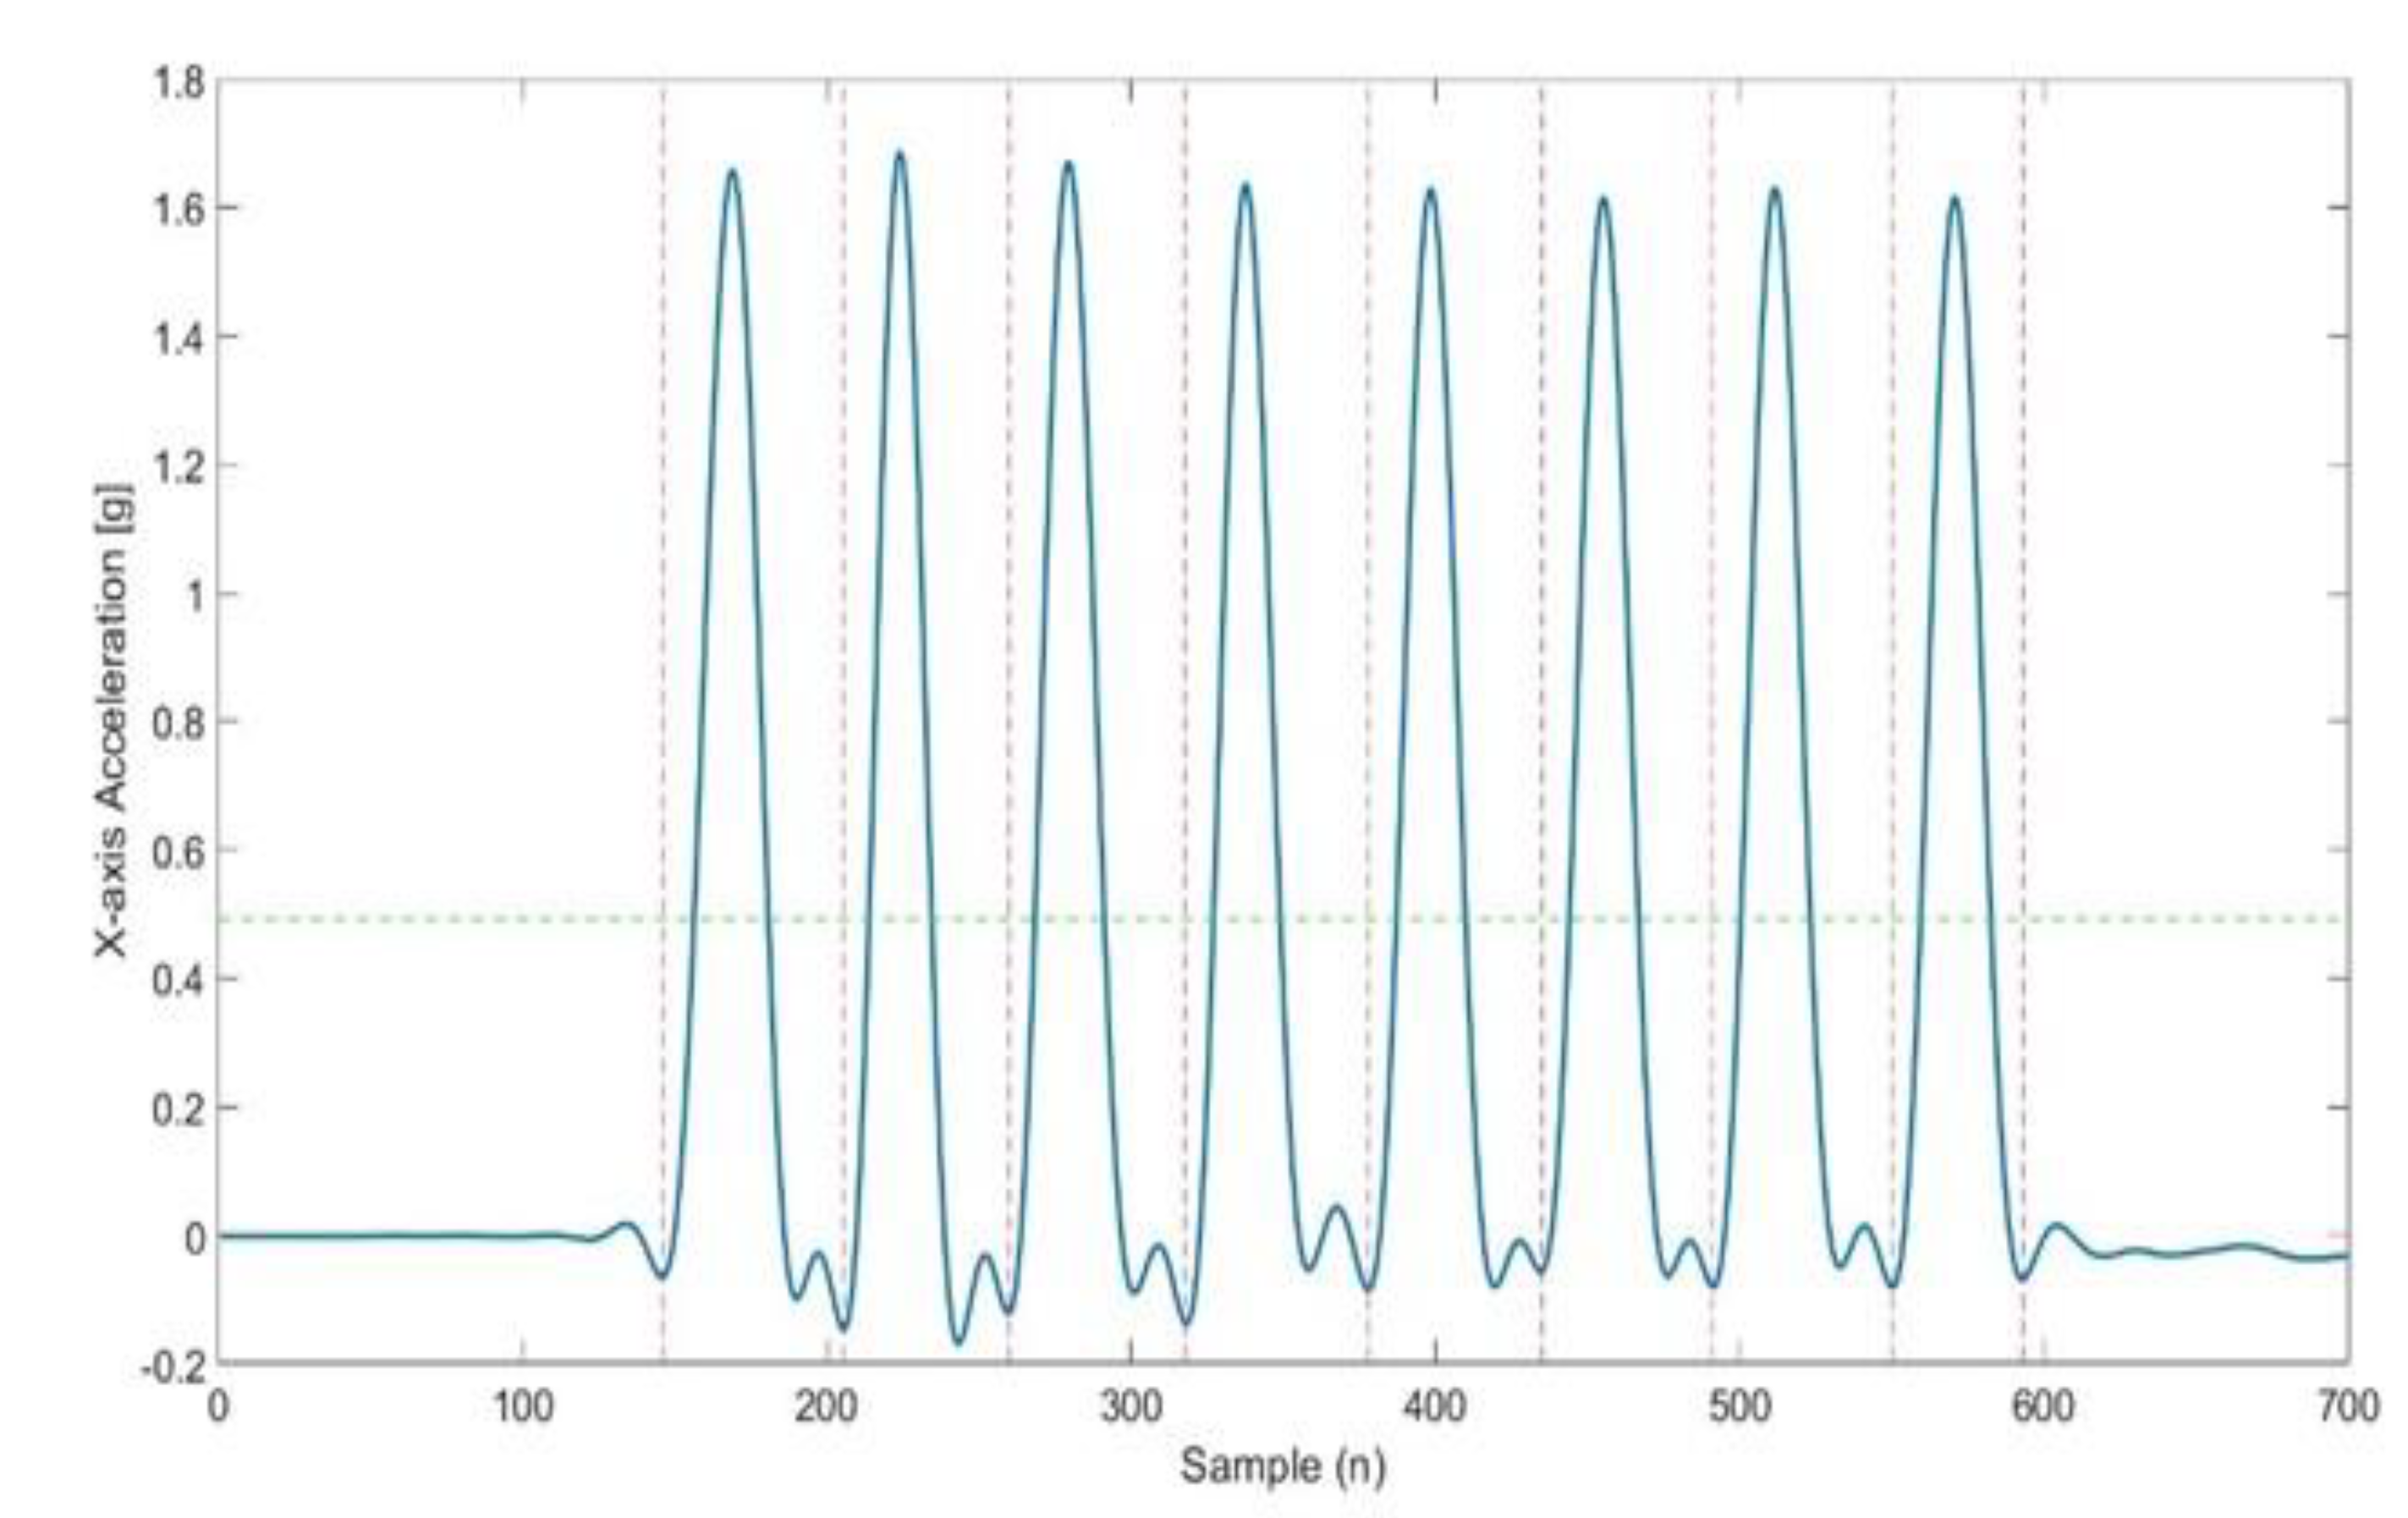
Figure 4.
Percentage values of prototype parameters (Red line) are reported compared to the reference values (100% line reported in Blue). The black dot represents the bias between the 2 instruments, and the dotted line highlights the limit of agreement (LoA). Values on each radar are relative to Intensity and Quality parameters: peak acceleration measurements (, , ),peak angular velocity (, , ), movement intensity and movement intensity variability (MI, MIV), range of angular velocity (RAV), log dimensionless jerk (LDLJ) and maximum value of range of motion (PKROM). Radars are provided for the following exercises: KE1: knee extension lying down. KE2: knee extension sitting with back support. KE3: knee extension without back support. SQ: half squat in support.
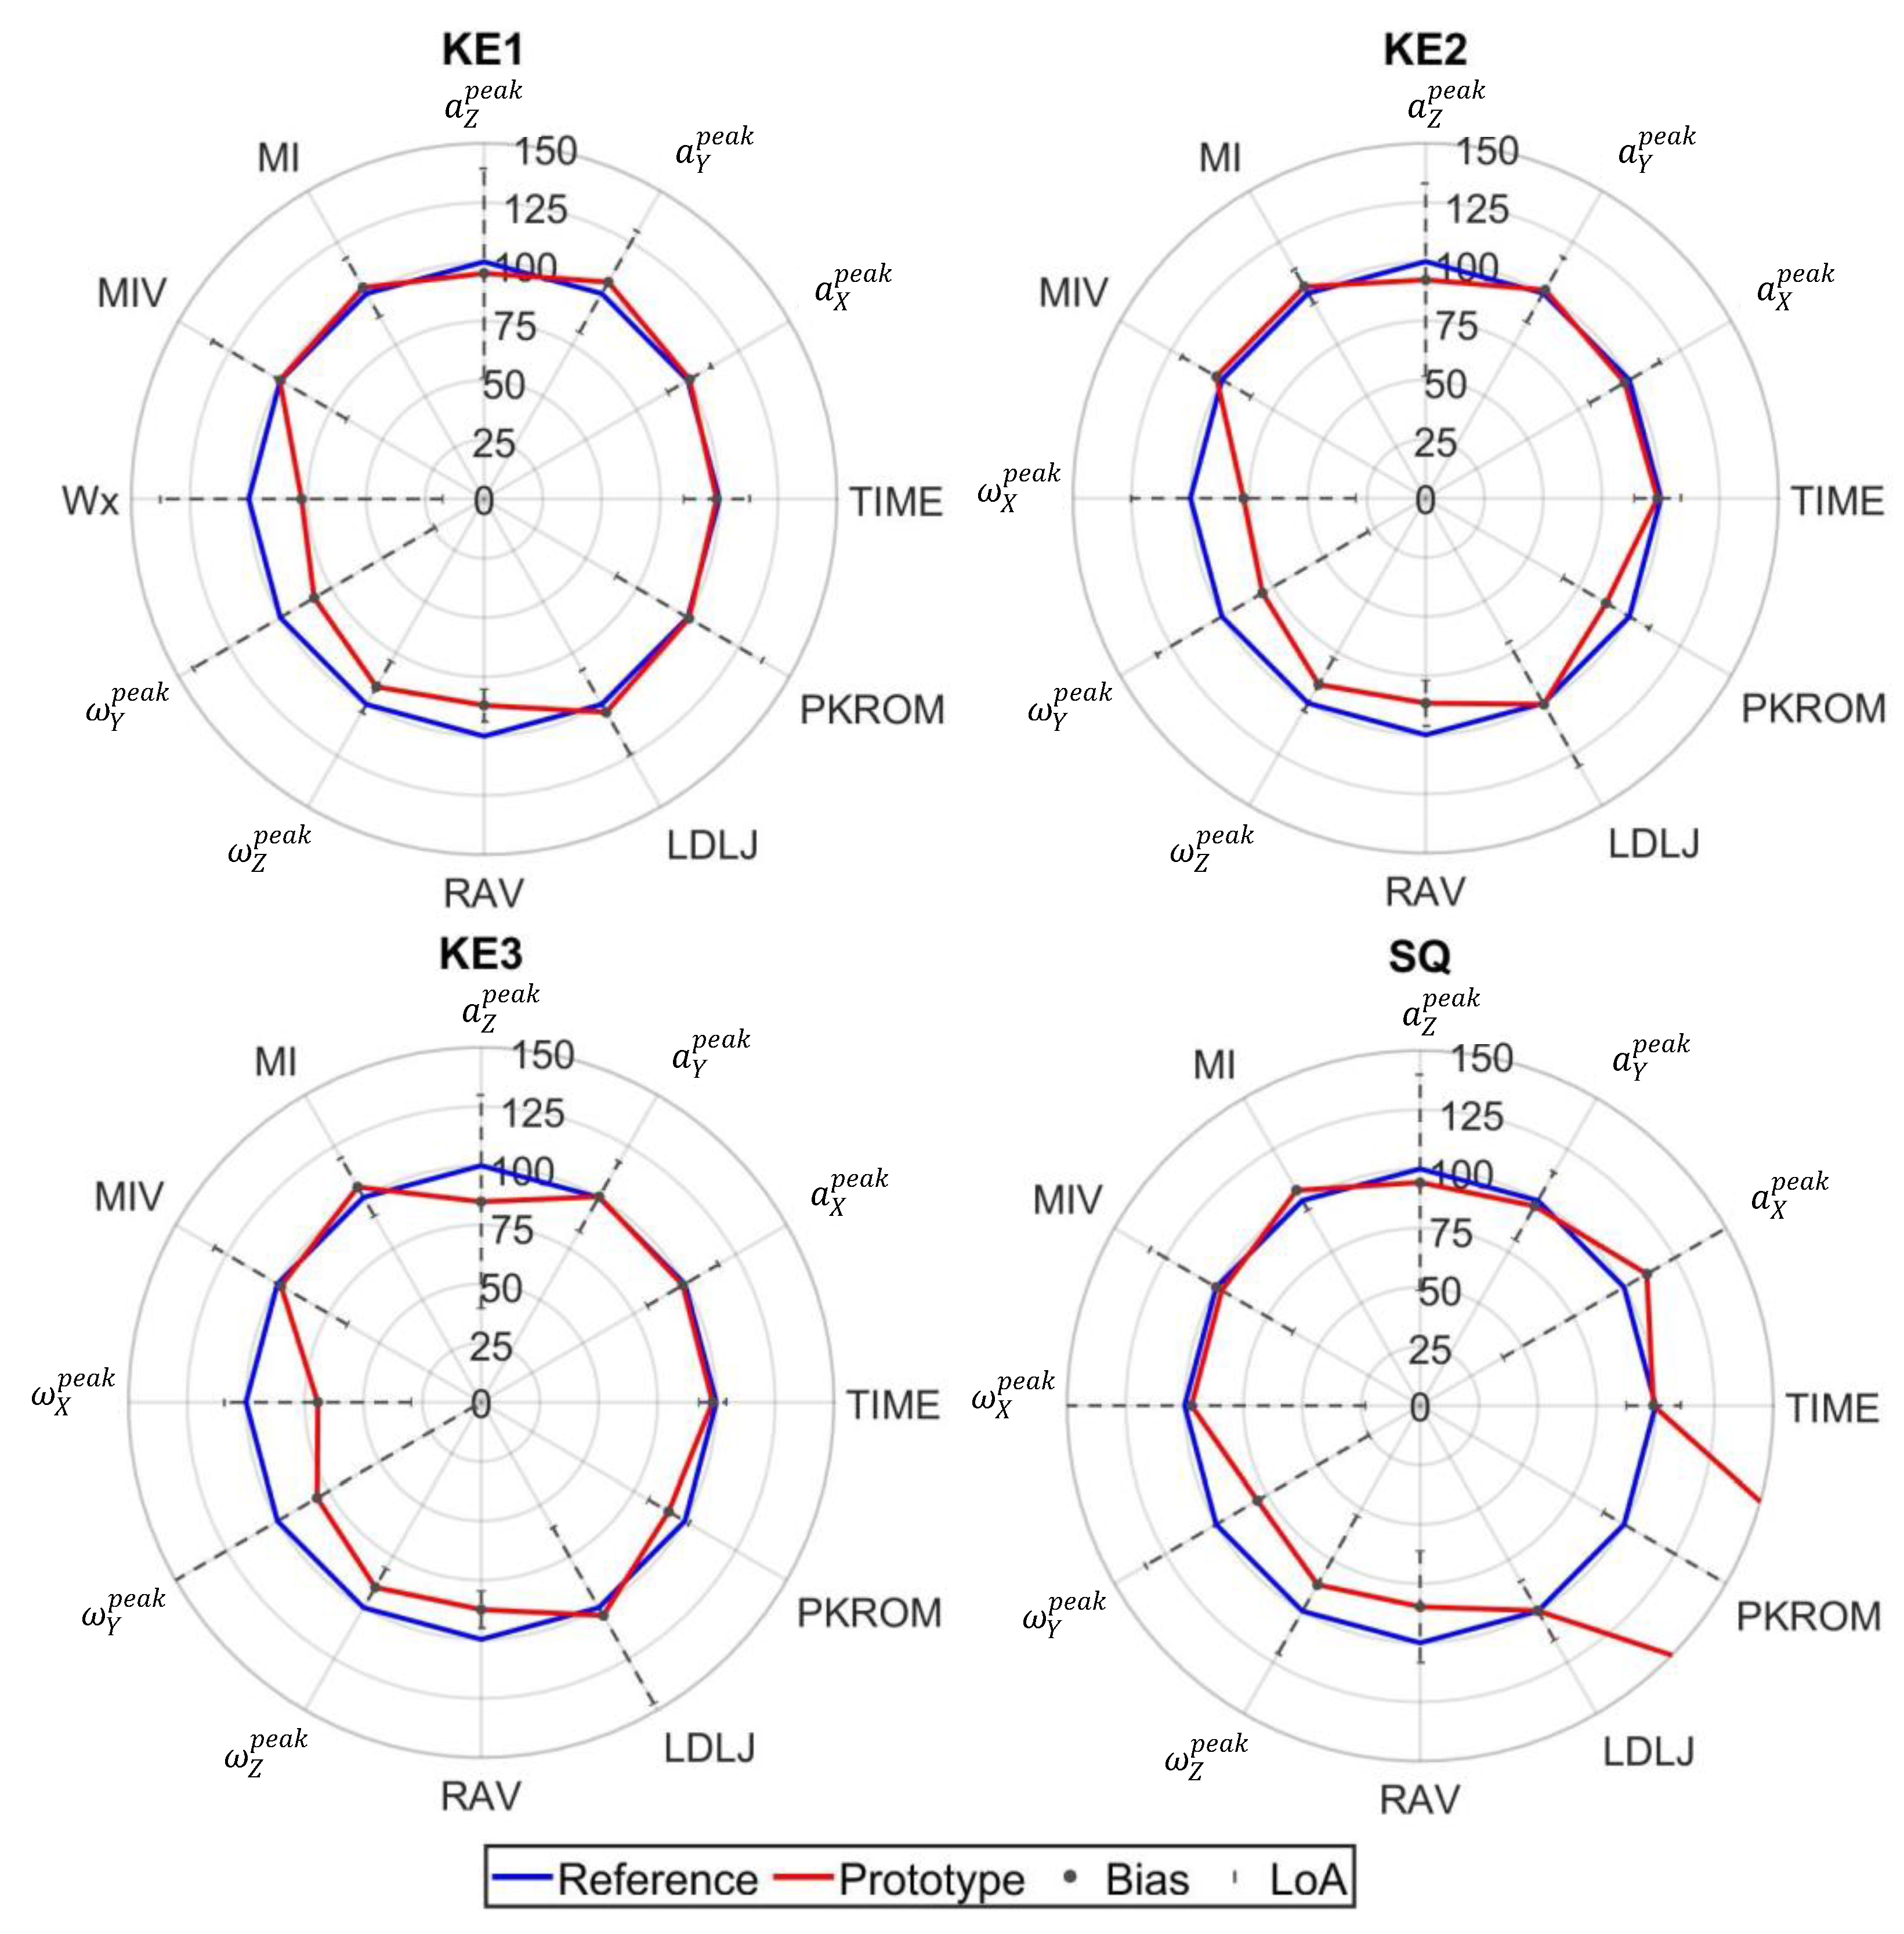
Figure 5.
Percentage values of prototype parameters (Red line) are reported compared to the reference values (100% line reported in Blue). The black dot represents the bias between the 2 instruments, and the dotted line highlights the limit of agreement (LoA). Values on each radar are relative to Intensity and Quality parameters: peak acceleration measurements (, , ),peak angular velocity (, , ), movement intensity and movement intensity variability (MI, MIV), range of angular velocity (RAV), log dimensionless jerk (LDLJ) and maximum value of range of motion (PKROM). Radars are provided for the following exercises: SF1: shoulder flexion lying down. SF2: shoulder flexion sitting with back support. SF3: shoulder flexion without back support. PS: wall push-up.
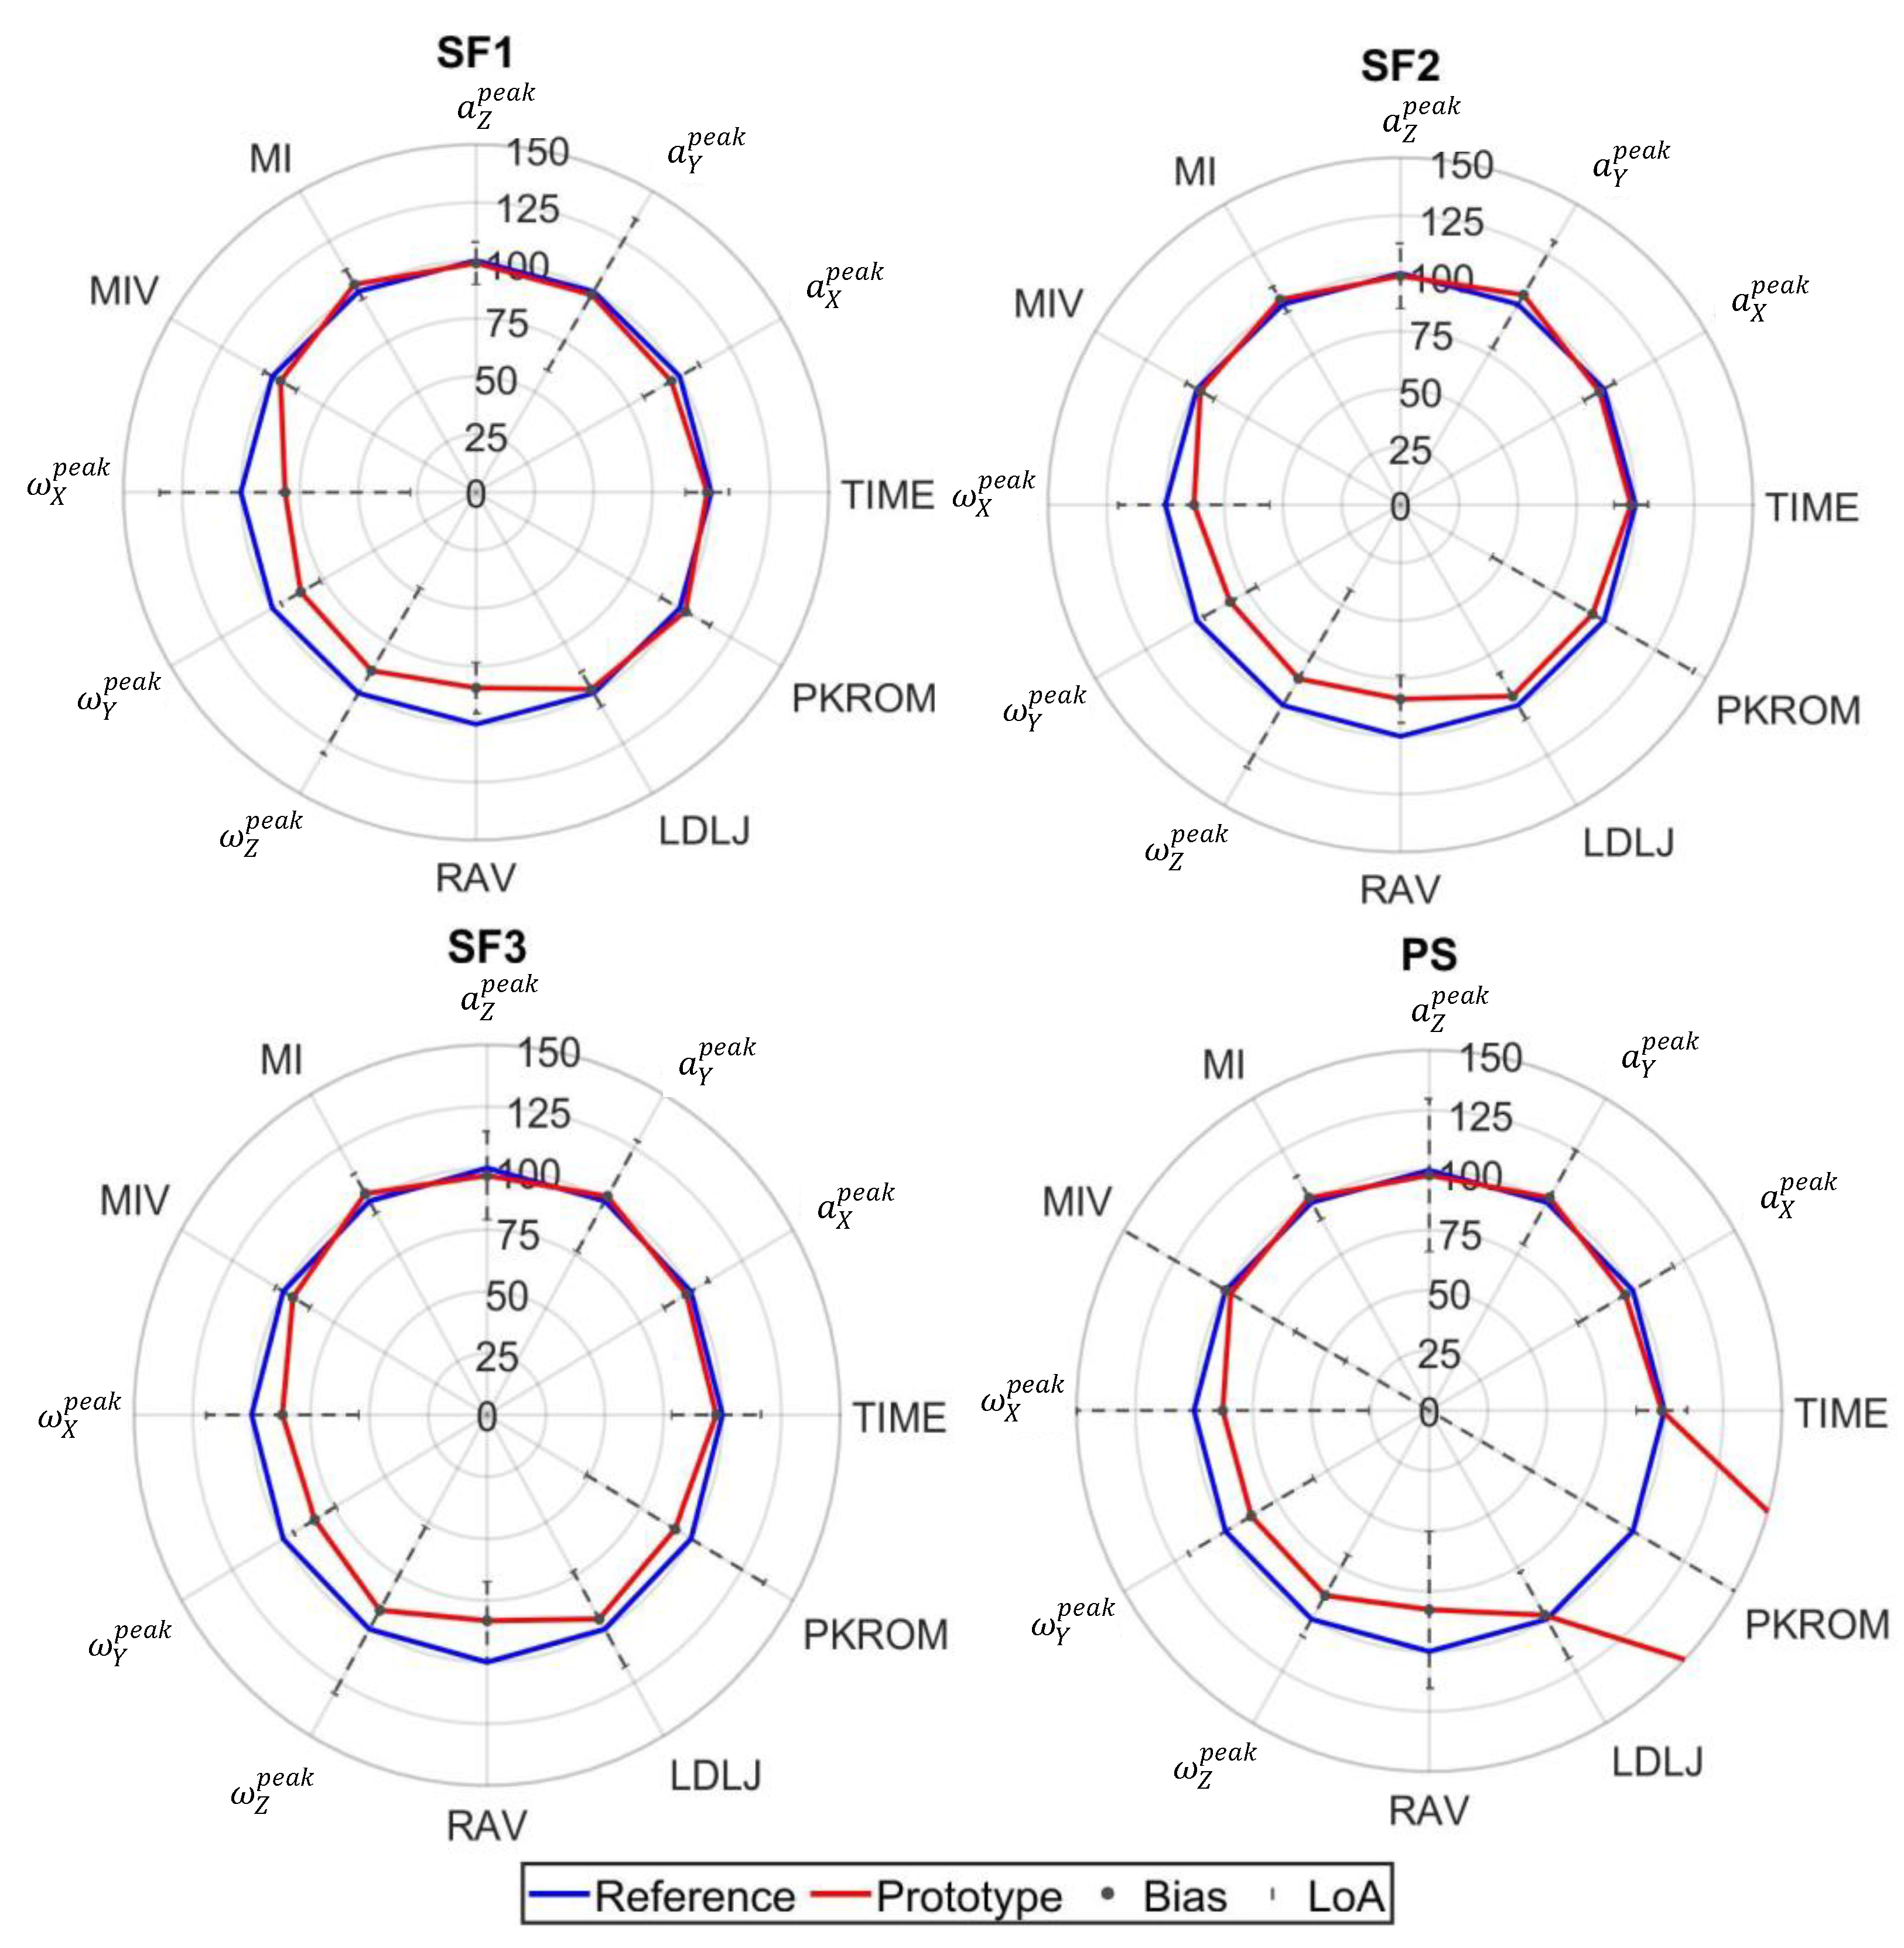
Figure 6.
Percentage values of prototype parameters (Red line) are reported compared to the reference values (100% line reported in Blue). The black dot represents the bias between the 2 instruments, and the dotted line highlights the limit of agreement (LoA). Values on each radar are relative to Intensity and Quality parameters: peak acceleration measurements (, , ),peak angular velocity (, , ), movement intensity and movement intensity variability (MI, MIV), range of angular velocity (RAV), log dimensionless jerk (LDLJ) and maximum value of range of motion (PKROM). Radars are provided for the following exercises: BD1: “Bird Dog” using only the legs. BD2: “Bird Dog” using only the arms. LF: lateral flexion of the column. RO: rotation of the column.
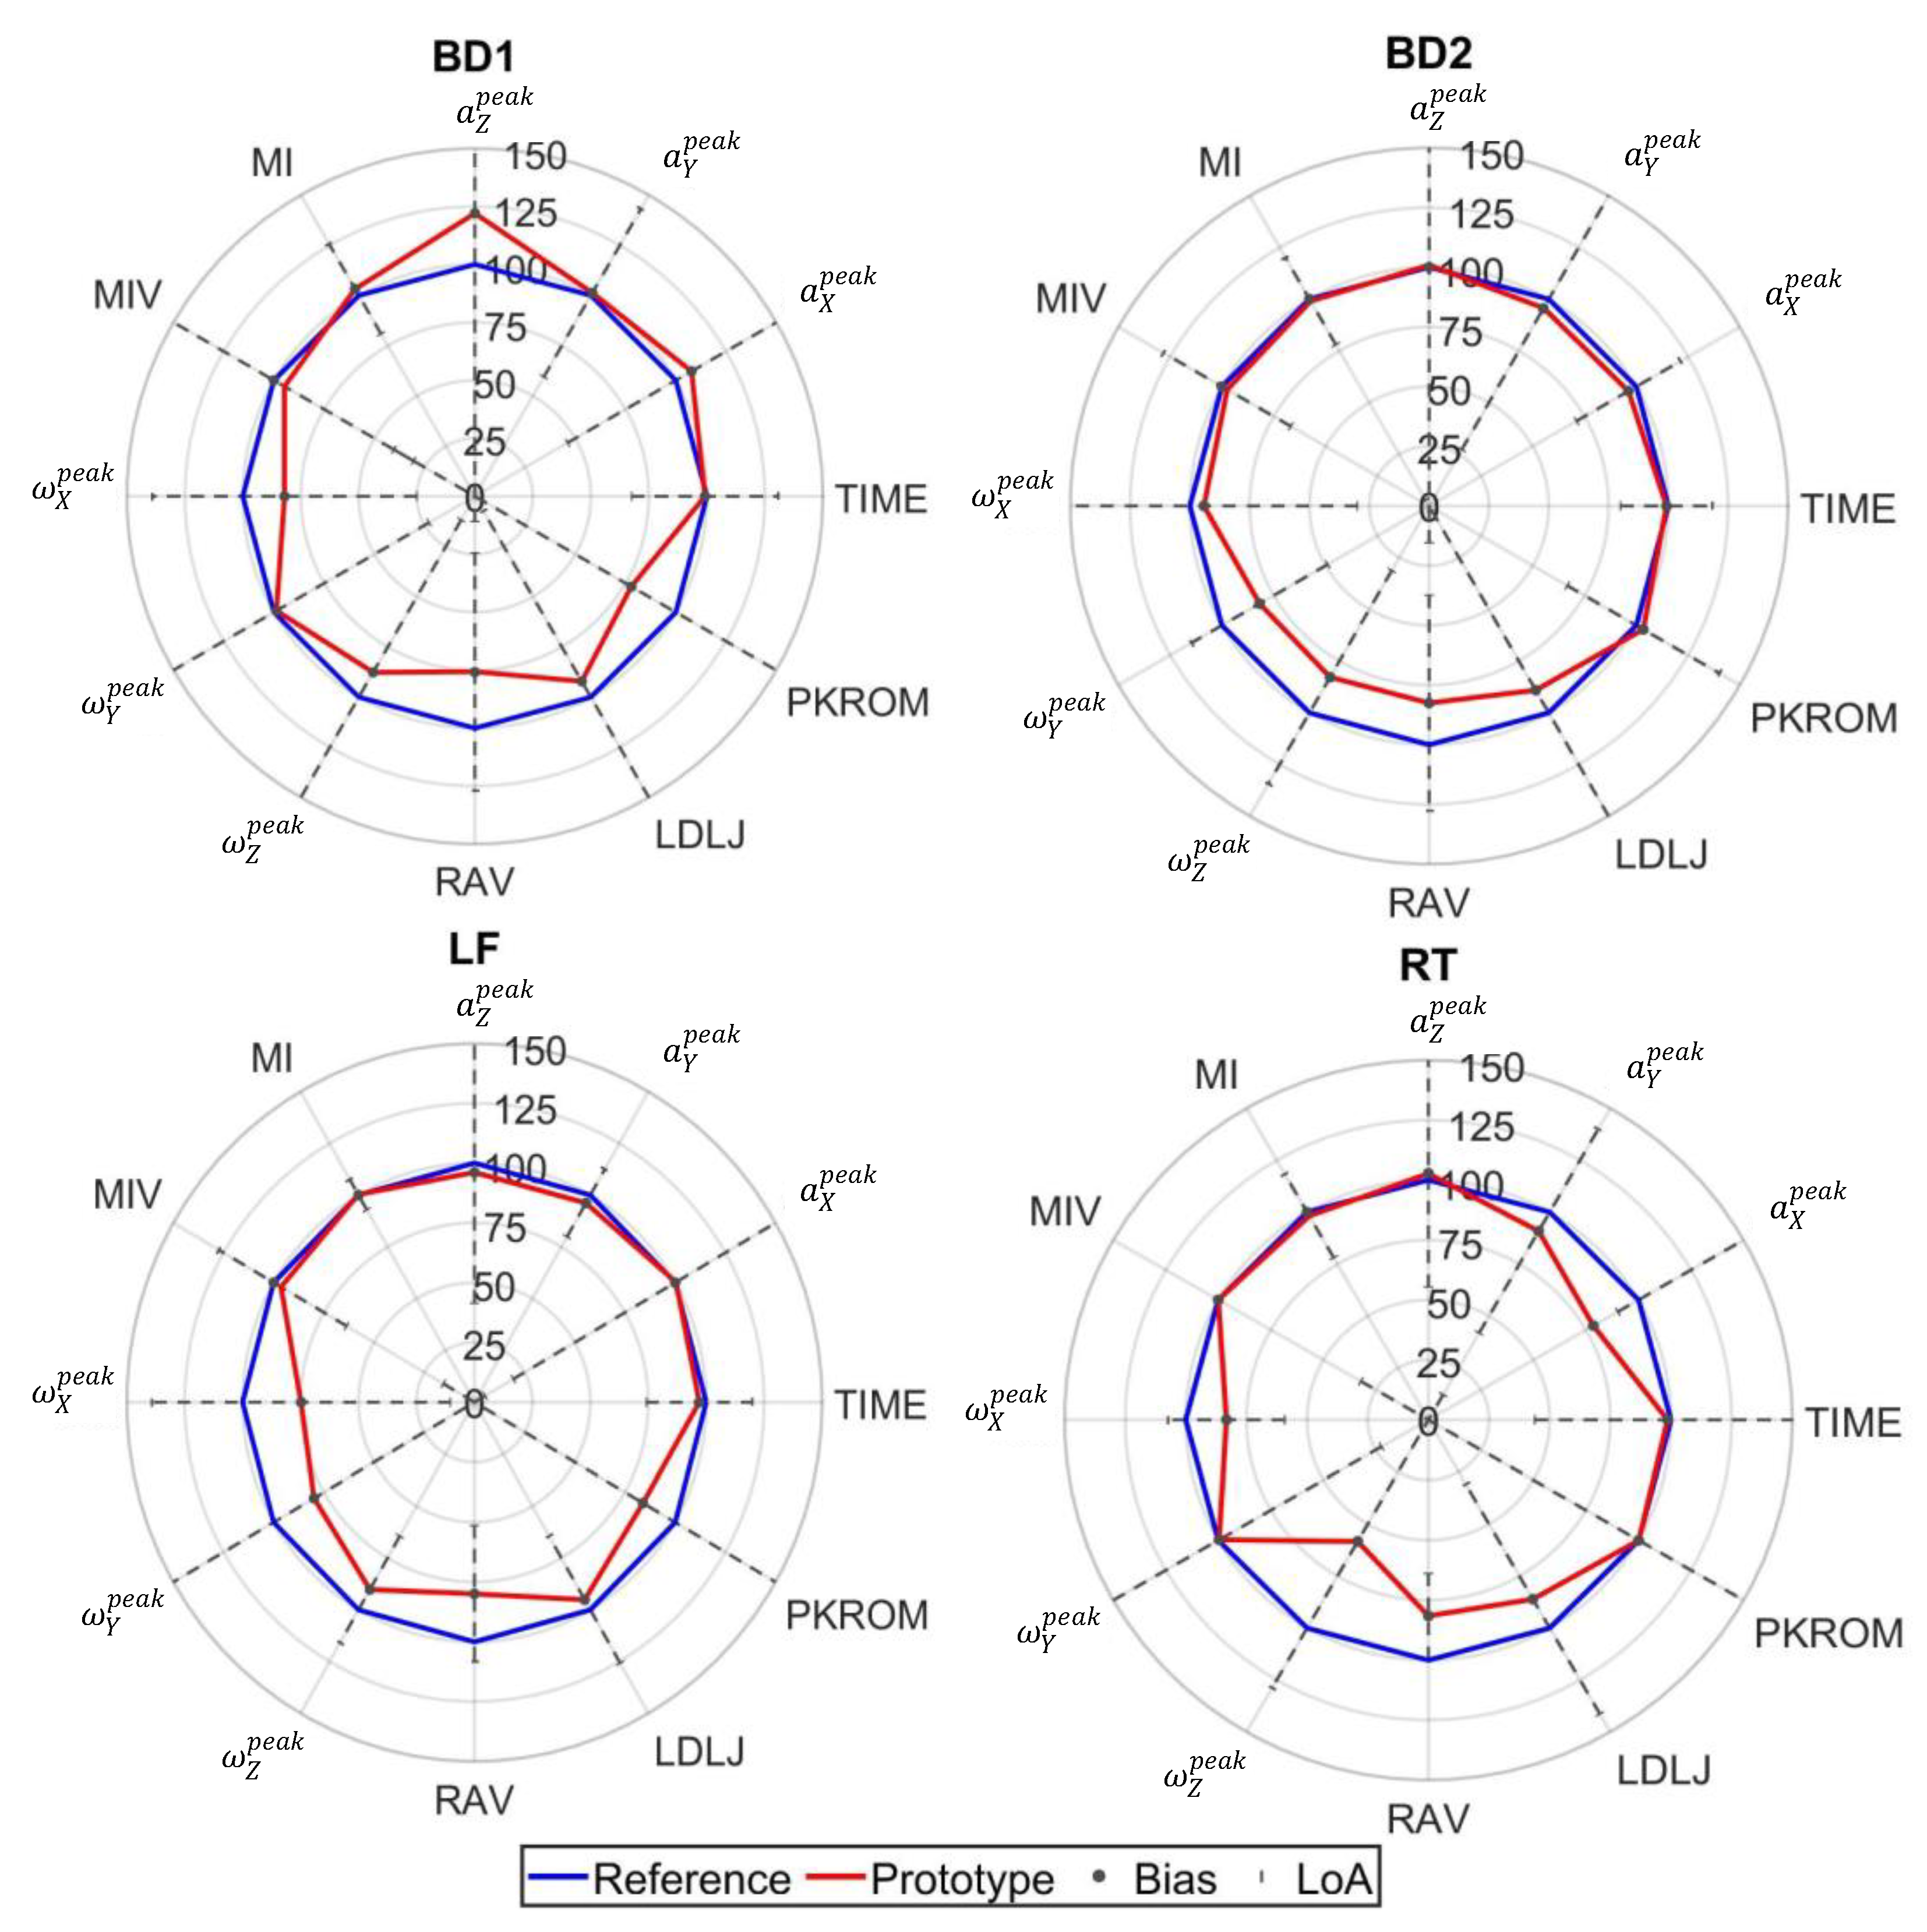
Table 1.
VAS and RPE results reported for all exercises grouped in categories. Lower limb exercises: KE1: knee extension lying down. KE2: knee extension sitting with a back support. KE3: knee extension without back support. SQ: half squat supported on a table. Upper limb exercises: SF1: shoulder flexion lying down. SF2: shoulder flexion sitting with back support. SF3: shoulder flexion without back support. Trunk exercises: PS: wall push-up. BD1: “Bird and Dog” using only the legs. BD2: “Bird and Dog” using only the arms. LF: lateral flexion of the column. RO: rotation of the column. RPE values are expressed in arbitrary units, VAS ones on a scale 0-10.
| Category | Exercises | RPE [a.u.] | VAS [0-10] |
|---|---|---|---|
| Lower limb | KE1 | 1.4±1.5 | 9.1±1.2 |
| KE2 | 1.3±1.1 | 9.1±1.2 | |
| KE3 | 0.8±1.0 | 9.1±1.2 | |
| SQ | 0.9±1.0 | 9.1±1.2 | |
| Upper limb | SF1 | 1.2±1.6 | 8.7±1.5 |
| SF2 | 1.5±1.6 | 8.7±1.5 | |
| SF3 | 1.8±1.8 | 8.7±1.5 | |
| PS | 1.4±1.1 | 8.7±1.5 | |
| Trunk | BD1 | 1.4±1.5 | 9.1±1.2 |
| BD2 | 2.1±2.8 | 7.9±3.1 | |
| LF | 1.1±1.2 | 8.8±1.4 | |
| RT | 1.8±1.8 | 8.7±1.6 |
Table 2.
Parameter values (man and standard deviation) as assessed using the reference IMUs are reported for all exercises grouped in categories. Lower limb exercises: KE1: knee extension lying down. KE2: knee extension sitting with a back support. KE3: knee extension without back support. SQ: half squat supported on a table. Upper limb exercises: SF1: shoulder flexion lying down. SF2: shoulder flexion sitting with back support. SF3: shoulder flexion without back support. Trunk exercises: PS: wall push-up. BD1: “Bird and Dog” using only the legs. BD2: “Bird and Dog” using only the arms. LF: lateral flexion of the column. RO: rotation of the column.
| Category | Exercises | Quantity | Intensity | Quality | ||||||||||||
|---|---|---|---|---|---|---|---|---|---|---|---|---|---|---|---|---|
| REP |
TIME [s] |
[g] |
[g] |
[g] |
[deg/s] |
[deg/s] |
[deg/s] |
MI [g] |
MIV [g] |
RAV [rad/s] |
LDLJ [a.u.] |
PKROM [deg] |
DTW [m/s2] |
|||
| Lower limb | KE1 | Mean | 8 | 2.3 | 1.6 | 0.5 | 0.3 | 26.0 | 43.4 | 197.7 | 0.3 | 0.2 | 0.5 | -1.6 | 117.4 | 4.6 |
| Std | 0 | 0.5 | 0.2 | 0.1 | 0.2 | 13.1 | 27.6 | 27.9 | 0 | 0 | 0.1 | 0.2 | 14.4 | 2.2 | ||
| KE2 | Mean | 8 | 1.8 | 0.9 | 0.8 | 0.2 | 32.2 | 48.9 | 205.2 | 0.3 | 0.1 | 0.6 | -1.5 | 75.2 | 7.5 | |
| Std | 0 | 0.5 | 0.2 | 0.1 | 0.1 | 18.4 | 37.8 | 41.5 | 0 | 0 | 0.1 | 0.6 | 13.5 | 3.4 | ||
| KE3 | Mean | 8 | 1.6 | 0.8 | 0.7 | 0.2 | 32.5 | 42.1 | 197.3 | 0.2 | 0.1 | 0.4 | -1.5 | 73.2 | 6.6 | |
| Std | 0 | 0.4 | 0.2 | 0.1 | 0 | 10.2 | 30.1 | 44.8 | 0 | 0 | 0.1 | 0.7 | 10.3 | 3.6 | ||
| SQ | Mean | 8 | 2.3 | 0.1 | 0.4 | 0.1 | 6.6 | 11.9 | 45.3 | 0.2 | 0 | 0.1 | -1.9 | 9.2 | 3.2 | |
| Std | 0 | 0.6 | 0.1 | 0.1 | 0.1 | 3.9 | 7.7 | 12.3 | 0 | 0 | 0 | 0.2 | 3.5 | 2.8 | ||
| Upper limb | SF1 | Mean | 8 | 3.2 | 0.7 | 0.8 | 2.0 | 52.6 | 181.0 | 69.4 | 0.8 | 0.6 | 0.5 | -1.8 | 153.9 | 8.2 |
| Std | 0 | 1.1 | 0.2 | 0.4 | 0.4 | 26.8 | 39.9 | 41.7 | 0.1 | 0.1 | 0.1 | 0.2 | 28.1 | 5.5 | ||
| SF2 | Mean | 8 | 2.5 | 1.4 | 0.7 | 1.1 | 72.3 | 188.0 | 54.9 | 0.7 | 0.4 | 0.5 | -1.9 | 69.1 | 6.8 | |
| Std | 0 | 0.6 | 0.3 | 0.2 | 0.4 | 27.3 | 36.6 | 28.3 | 0.1 | 0.1 | 0.1 | 0.3 | 11.1 | 4.8 | ||
| SF3 | Mean | 8 | 2.2 | 1.5 | 0.7 | 0.9 | 82.7 | 195.9 | 68.4 | 0.6 | 0.3 | 0.5 | -1.9 | 66.9 | 7.2 | |
| Std | 0 | 0.6 | 0.2 | 0.3 | 0.4 | 36.8 | 45.2 | 40.0 | 0.1 | 0 | 0.1 | 0.4 | 13.3 | 6.0 | ||
| PS | Mean | 8 | 2.6 | 0.4 | 0.2 | 0.2 | 12.4 | 35.7 | 44.4 | 0.2 | 0 | 0.1 | -1.4 | 22.3 | 4.8 | |
| Std | 0 | 0.5 | 0.2 | 0.1 | 0.1 | 9.3 | 18.5 | 10.6 | 0.1 | 0 | 0 | 0.6 | 12.3 | 4.6 | ||
| Trunk | BD1 | Mean | 8 | 2.0 | 0.1 | 0.2 | 0 | 21.8 | 5.7 | 8.7 | 0.1 | 0 | 0.1 | -1.3 | 29.4 | 4.9 |
| Std | 0 | 0.5 | 0.1 | 0.1 | 0 | 10.8 | 3.5 | 3.7 | 0.1 | 0 | 0 | 1.0 | 17.2 | 5.4 | ||
| BD2 | Mean | 8 | 1.9 | 0.1 | 0.1 | 0.1 | 6.4 | 10.9 | 6.5 | 0.1 | 0 | 0 | -0.9 | 65.7 | 2.1 | |
| Std | 0 | 0.5 | 0.1 | 0.1 | 0.1 | 4.5 | 6.6 | 4.1 | 0 | 0 | 0 | 0.9 | 17.5 | 2.2 | ||
| LF | Mean | 8 | 2.8 | 0 | 0.2 | 0.1 | 10.9 | 5.7 | 15.4 | 0.1 | 0 | 0 | -1.6 | 63.5 | 10.0 | |
| Std | 0 | 0.8 | 0 | 0.1 | 0 | 5.9 | 3.8 | 8.5 | 0 | 0 | 0 | 0.5 | 26.4 | 6.7 | ||
| RT | Mean | 8 | 2.6 | 0 | 0.1 | 0.1 | 80.5 | 7.0 | 20.7 | 0.1 | 0 | 0.2 | -2.0 | 52.9 | 3.5 | |
| Std | 0 | 0.7 | 0 | 0 | 0 | 19.3 | 3.3 | 11.3 | 0 | 0 | 0 | 0.7 | 22.1 | 2.3 | ||
Disclaimer/Publisher’s Note: The statements, opinions and data contained in all publications are solely those of the individual author(s) and contributor(s) and not of MDPI and/or the editor(s). MDPI and/or the editor(s) disclaim responsibility for any injury to people or property resulting from any ideas, methods, instructions or products referred to in the content. |
© 2025 by the authors. Licensee MDPI, Basel, Switzerland. This article is an open access article distributed under the terms and conditions of the Creative Commons Attribution (CC BY) license (http://creativecommons.org/licenses/by/4.0/).
Copyright: This open access article is published under a Creative Commons CC BY 4.0 license, which permit the free download, distribution, and reuse, provided that the author and preprint are cited in any reuse.


