
Submitted:
12 March 2025
Posted:
14 March 2025
You are already at the latest version
Abstract
This work investigates the water exit problems of slender cylinders under various con-ditions by experiment. The experimental platform is designed with a high-speed pho-tography. 13 experimental cases with varying head shapes, length-to-diameter ratios, ejection velocities, and elastic moduli was conducted to capture water-exit character-istics. The investigation identified ejection velocity as the predominant parameter governing cavity morphology and stability, with higher velocities correlating to in-creased cavity dimensions and reduced drag coefficients. Conical head shape resulted in superior drag reduction characteristics, forming a typical cigar-shaped cavity with clear and regular boundaries. Additionally, an increased length-to-diameter ratio sub-stantially improved drag reduction performance. Material elastic moduli proved cru-cial for water-exit stability, as cylinders with lower moduli experienced severe bending deformation and even trajectory changes, while higher moduli cylinders maintained their form with minimal deformation. This study illuminates the physical mechanisms of slender body water-exit under multi-factor coupling conditions, providing experi-mental evidence and theoretical guidance for cross-media vehicle design and under-water equipment optimization.
Keywords:
slender cylinder
; water-exit characteristics
; cavity dynamics
; high-speed photography
; fluid-structure coupling
1. Introduction
Water-exit phenomena occupy an important position in fluid mechanics and ocean engineering research, with extensive engineering applications in aerospace, naval architecture, underwater vehicles, and other fields. As a typical multi-phase cross-media problem, water-exit phenomena occur not only in nature, such as marine animals leaping out of water and birds catching prey, but also widely in engineering applications, including underwater unmanned vehicles, ship bulbous bows, and ocean platforms [1,2]. During the water-exit process, due to the interaction between the body surface and the gas-liquid interface, complex flow phenomena such as cavitation, vortices, and gas-liquid separation occur, which significantly impact the pressure distribution, drag, and exit attitude of the body[3,4].
In contrast to the comprehensive body of literature on water entry phenomena, investigations into water-exit dynamics remain comparatively limited. Von Karman [5] first conducted theoretical analysis on the water impact problem of seaplanes, pioneering the study of water-exit problems. In recent years, with the widespread application of cross-media equiments, research on water-exit has increased, mainly focusing on theoretical research, numerical simulation, and experimental studies.
Regarding theoretical investigations, Korobkin et al. (2017) [6] elucidated the theoretical foundations of rigid flat plate water-exit phenomena, demonstrating that when such a plate interfaces with a horizontal water surface and undergoes constant acceleration in the vertical direction, the resultant flow field in proximity to the plate edges exhibits both non-linear behavior and self-similar characteristics. Shams et al. (2017) [7] established a semi-analytical model to estimate the hydrodynamic loads in the wedge water elastic impact from entry to exit phases. Nevertheless, theoretical analyses remain predominantly confined to fundamental scenarios, with substantial challenges persisting in the theoretical treatment of complex phenomena including splashing mechanics, free surface disruption, and vortex shedding dynamics during water-exit events.
In terms of numerical simulation, Johan (2011) [8] introduced the weakly compressible smoothed particle hydrodynamics (WCSPH) method by integrating a floating object model to study fluid-object interactions, demonstrating its effectiveness in predicting hydrodynamic forces, fluid motion, and object movement in classical water entry and exit scenarios. Moshari et al. (2014) [9] implemented the Volume of Fluid (VOF) methodology to numerically characterize non-linear free surface deformations during the water-exit trajectory of a neutrally buoyant circular cylinder. Ni et al. (2015) [10] used the boundary element method to simulate the entire water-exit process of a fully submerged rigid body, investigating the effect of Froude number and the body shape on its horizontal and vertical dimension ratio. Haohao et al. (2019) [11] used the lattice Boltzmann method to conduct a three-dimensional numerical study of sphere water-exit with different vertical velocities. Zhang et al. (2022) [12] and Guo et al. (2023) [13] employed VOF multiphase flow interface-capturing technology and overset mesh technique to numerically calculate the gas-liquid-gas multiphase flow interactions during high-speed cylinder water-exit. Although numerical simulation can obtain more comprehensive flow field information, accurately capturing large free surface deformations and gas-liquid interface breaking still remains significant challenges.
Experimental research can provide more intuitive and reliable data, despite its high implementation difficulty and cost. Greenhow and Lin (1983) [14] studied the water-exit process of a neutrally buoyant cylinder, observing the free surface elevation and ultimate breaking "waterfall breaking" phenomenon. Wu et al. (2017) [15] designed water-exit experimental equipment and conducted forced water-exit and constant velocity water-exit experiments on half-submerged and fully-submerged spheres, systematically investigating the free surface deformation and its dynamic changes during the water-exit process. They[16] also studied the entire process of free water-exit and re-entry of lightweight spheres, finding that the jet formed during water-exit is caused by local high-pressure areas resulting from water quickly converging to the empty space above the body. Lu et al. (2019) [17] conducted experimental research on the water-exit process of revolution bodies, studying the mutual interference during the water-exit process of underwater revolution bodies. Zhang et al. (2021)[18] conducted experiments on axisymmetric vehicle water-exit in floating ice environments, investigating the impact of floating ice on the water-exit dynamics of axisymmetric vehicles. Yun et al. (2024) [3] conducted a systematic experimental study on the hydrodynamic characteristics of cylinder water-exit through a novel research method, comparatively analyzing the force coefficients under different influencing factors during the cylinder water-exit process.
Reviewing existing research, water-exit studies have mainly focused on basic geometric shapes such as spheres and simple cylinders, with relatively fewer studies on the water-exit characteristics of complex geometric shapes (such as different head shapes and length-to-diameter ratios of slender bodies). Furthermore, existing research mainly focuses on macroscopic phenomena such as waterfall breaking, exit height, and trajectory, with limited research on cavity formation and evolution mechanisms, material property influences, and other mechanisms during water-exit. Based on the equipment[17], this work systematically study the water-exit behavior of slender bodies in 13 cases under different conditions. The effects of ejection velocity, head shape, length-to-diameter ratio, and material elastic moduli on water-exit characteristics is first analyzed, revealing their interaction mechanisms. Then the fluid-structure coupling effects during the elastic material slender body water-exit process is further studied, providing theoretical guidance for vehicle structure design. The remainder of this paper is organized as follows: In Sec. 2, the
experimental setup and cylinder models are introduced. In Sec. 3, the details of the experimental results are listed and discussed. Concluding remarks are given in Sec. 4.
2. Experimental Setup and Methods
2.1. Experiment Platform
The experimental apparatus[17] comprised a steel open-top tank with dimensions of 2.8m×1.6 m×2.5 m. Two pieces of organic glass with size of 2.5 m ×1m are installed on the front and rear walls of the tank. The front glass serves as an observation window, while high-power LED light arrays are installed outside the rear glass to enhance background brightness and improve observation quality. Figure 1 shows the schematic diagram of experimental platform and Figure 2 then presents the launch platform. As shown in Figure 3, the specific size can be seen in the two-dimensional diagram.
At the beginning, the projectile is sealed in the launch tube with a rubber cap. The bottom of the launch tube is connected to a storage tank through an electromagnetic valve. The storage tank is pressurized by an air compressor, and the charging pressure is monitored in real-time by a pressure sensor installed on the gas line branch. When the set pressure is reached, the air compressor stops working, and the charging valve is closed, maintaining a constant pressure in the storage tank. After the launch switch is activated, the one-way valve opens, and high-pressure gas propels the projectile out of the tube. The one-way valve also prevents water from entering the gas line after launch.
The experimental apparatus was controlled via a C++ program interfaced with an open-source microcontroller (Arduino UNO development board), facilitating automated underwater launch operations. After the launch switch is turned on, the high-speed camera begins to collect data. The high-speed camera operates at a frame rate of 5000 fps to ensure capture of transient phenomena during the water-exit process.
2.2. Slender Body Model Description
To investigate the effects of head shape, length-to-diameter ratio, and material properties on slender body water-exit, six different slender bodies were designed, with parameters shown in Table 1. All slender bodies were manufactured using three-dimensional printing technology to ensure geometric accuracy and consistency. The head shapes included conical, spherical, short truncated cone, and long truncated cone, with diameter D=30mm and length-to-diameter ratios of 5:1, 6:1, and 7:1.
Additionally, to study the effect of material elastic properties on water-exit behavior, three spherical-headed slender bodies with different elastic moduli were designed, with parameters shown in Table 2. The side view of all bodies can be seen in Figure 4.
The ejection velocity (5-18 m/s) of the slender body can be controlled by adjusting the storage tank pressure (0.2-0.7MPa). The experimental conditions encompassed combinations of four variables: ejection velocities, head shapes, length-to-diameter ratios, and elastic moduli, systematically exploring the influence of these factors on slender body water-exit characteristics.
3. Experimental Results and Discussion
This section systematically analyzes the experimental results of slender body water-exit under different conditions based on experimental observations, focusing on the influence of different ejection velocities, head shapes, length-to-diameter ratios, and elastic moduli on water-exit behavior. Through quantitative analysis of displacement, velocity changes, cavity morphology evolution, and structural deformation, the dynamic characteristics and physical mechanisms of the object during water-exit are revealed. Experimental image data were processed and analyzed using ImageJ software.
3.1. Characteristics of Slender Body Water-Exit with Different Ejection Velocities
By adjusting the storage tank pressure, the ejection velocity of the slender body can be regulated accordingly. This subsection uses the conical-headed slender body as the research subject and conducted systematic experiments at three different pressure values (0.2, 0.4, and 0.7 MPa), with experimental conditions for 3 cases shown in Table 3. The cavitation number σ is defined as:, where is the far-field pressure, the liquid saturated vapor pressure, is the liquid density, and is the flow velocity. Lower cavitation numbers indicate more pronounced cavitation phenomena.
3.1.1. Analysis of Cavity Evolution Mechanism During Water-Exit Process
Figure 5 presents sequential high-speed photographic imagery depicting the complete water-exit process of a conical-headed cylindrical specimen at an ejection velocity of . Cavity evolution during slender body water-exit can be categorized into four distinct phases: formation, development, stabilization, and collapse, each corresponding to specific fluid dynamic mechanisms.
When time ranges from 0 to 3ms, the cavitation evolution is in formation stage. At t=3ms, initial shoulder cavitation forms after the slender body exits the tube. Due to the high-speed relative motion between the head shape and the fluid, a local low-pressure area forms at the slender body's shoulder, triggering cavitation when the pressure falls below the liquid saturated vapor pressure. A small amount of high-pressure gas can be observed escaping from the gap between the launch tube and the slender body, causing turbulence at the cavity edge. The cavity formation mechanism in this stage conforms to classical boundary layer separation theory—the fluid cannot remain attached to the body surface, separates at the shoulder, forming a low-pressure region, and subsequently induces cavitation.
When time ranges from 12 to 33ms, the cavitation evolution is in cavity development stage. The slender body continues to rise, and the cavity develops downward along the body surface, forming a closed supercavity. At t=23ms, the escaping high-pressure gas forms a characteristic inverted funnel-shaped cavity at the launch tube exit under the combined action of gas pressure and water pressure, resulting from the interaction between high-speed jets and the surrounding water. During this stage, the cavity volume continuously increases, the internal pressure remains low, and the boundaries are clear. The fluid static pressure gradient leads to streamlined cavity boundaries.
When time ranges from 33 to 60.6ms, the cavitation evolution is in cavity development stage cavity stability stage. As the slender body continues to rise, two key phenomena can be observed: first, return flow liquid appears inside the cavity due to the pressure gradient at the interface between the cavity bottom and the slender body, causing local fluid to move upward; second, partial gas detachment forms turbulent regions, creating a gas-liquid mixed state inside the cavity. At t=53ms, the return flow effect is further enhanced, and gas detachment occurs in both the cavity and the slender body bottom cavity.
When time ranges from 60.6 to 88ms, the cavitation evolution is in cavity development stage cavity stability stage cavity collapse stage. When the slender body top contacts the water surface (t=60.6ms), the free surface static pressure drops sharply, and the cavity begins to collapse irregularly. The right side of the cavity boundary shows significant inward concavity, indicating a local high-pressure region. Simultaneously, gas clusters detached from the cavity accumulate at the bottom cavity position, while gas clusters detached from the bottom cavity appear in the slender body wake with a lag effect. At t=73ms, the slender body partially exits the water, the cavity completely collapses, forming multiple irregular gas-liquid mixing regions. Subsequently, the bottom cavity contracts and forms an upward rebound flow that impacts the slender body bottom, causing a sudden velocity increase, consistent with the "pop-up effect" observed by Truscott et al[19].
3.1.2. Velocity Evolution Characteristics and Dynamic Analysis
Figure 6 shows the velocity evolution curves of the slender body during water-exit at three different ejection velocities (, , ). The experimental data clearly show that, the slender body water-exit consistently experiences a four-stage velocity evolution pattern: "acceleration-deceleration-acceleration-deceleration". This phenomenon can be explained by a multi-stage dynamic model.
At initial acceleration stage, the slender body accelerates from a stationary state under the action of high-pressure gas, subject to the combined effect of thrust, buoyancy, gravity, and drag. The dynamic equation can be expressed as:
where is the slender body mass, is the velocity, is time and is buoyancy. refers to the initial stage high-pressure gas thrust, which decreases exponentially with gas pressure. indicates drag force, which is inversely proportional to the square of velocity, expressed as , where is the drag coefficient, is the fluid density, and is the cross-sectional area.
At deceleration stage, after completely exiting from the tube, the thrust disappears, and the slender body decelerates under the action of buoyancy, drag and gravity. The dynamic equation simplifies to:
At secondary acceleration stage, when the slender body contacts the water surface, the velocity curve shows a significant jump. This phenomenon can be attributed to the impact of the cavity collapse on the bottom of the slender body[19]. The impact force can be expressed as:
where is the fluid density, is the impact area, and is the rebound jet velocity. This impact force acts on the bottom of the slender body, providing additional short-term thrust causing acceleration.
At final deceleration stage, after completely exiting from the water, the slender body moves in air, decelerating under the influence of gravity and air resistance .
Through quantitative analysis of the velocity curves during the deceleration stage, we calculated the drag coefficients for different conditions, as shown in Table 4.
Analysis revealed an inverse correlation between ejection velocity and drag coefficient, demonstrating that cavity-induced drag reduction becomes increasingly pronounced under elevated velocity conditions within the investigated experimental domain.
3.1.3. Analysis of Cavity Morphology and Cavitation Mechanisms
Figure 7 shows the experimental images of conical-headed slender body water-exit at three different ejection velocities. It can be clearly observed that as velocity increases, cavity characteristics change significantly, which is directly related to the reduction in cavitation number.
In Case 1 (7.24 m/s), the cavity is relatively small and unstable, mainly distributed near the shoulder of the slender body, showing local cavitation phenomena. At this moment, the cavitation number σ = 3.775, much higher than the critical cavitation number (approximately 0.1), indicating that the flow field is dominated by partial cavitation. As the ejection velocity increases to 13.04 m/s (Case 2), the cavitation number drops to 1.164, forming a supercavity covering most of the slender body surface. When the velocity further increases to 17.93 m/s (Case 3), the cavitation number drops to 0.616, producing a larger supercavity completely enveloping the slender body, with both cavity length and diameter significantly increased.
Figure 8 and Figure 9 provide quantitative characterization of cavity length and diameter evolution under the three experimental conditions investigated. The figures indicate that cavity size have a non-linear positive correlation with ejection velocity. At , the maximum cavity length reaches 8.13D (D is the diameter of slender body), and the maximum diameter is about 1.99D; while at , these are only 5.98D and 2.02D, respectively.
At the same time, cavity morphology stability also exhibits significant velocity-dependent characteristics: at lower velocity (), the cavity boundary is smooth and regular; at medium velocity (), small-scale fluctuations begin to appear; at higher velocity (), obvious irregular morphology and boundary pulsation are present.
A series of phenomena illuminate the complex fluid dynamic mechanisms governing the water-exit process. Particularly noteworthy is that during t = 40-50ms, although the cavity is relatively stable in the length direction, obvious pulsation characteristics in the cavity diameter direction were observed during the experiment. From the perspective of theoretical analysis, this pulsation can be attributed to the pressure fluctuation effect described in Rayleigh-Plesset [20,21,22,23] cavity dynamics theory—when fluid pressure decreases, cavity volume increases; when fluid pressure increases, cavity volume decreases. Meanwhile, local instabilities on the cavity surface also lead to the formation and shedding of small-scale vortex structures, further enhancing the pulsating behavior of the cavity.
Above all, ejection velocity modulates cavity characteristics during slender body water-exit through its direct influence on the cavitation number. With the increasing velocity, the cavity dimensions increase accordingly and dynamic characteristics develop in a direction favorable for drag reduction. However, the stability of cavity deteriorates leading to irregular breakage and gas-liquid mixing, which poses challenges for stability control in practical engineering applications.
The velocity-dependent characteristic has important guiding significance for optimizing water-exit conditions and improving water-exit stability.
3.2. Characteristics of Slender Body Water-Exit with Different Head Shapes
To systematically study the influence of head shape on slender body water-exit characteristics, four typical head shapes (conical, spherical, short truncated cone, and long truncated cone) were designed, with geometric dimensions shown in Figure 4. The experimental conditions are shown in Table 5. By controlling the same ejection pressure (0.7 MPa), the initial kinetic energy basically remained consistent.
Figure 10 shows the velocity evolution curves of four different head shape slender bodies under the same pressure (0.7 MPa) during the water-exit process. It indicates that the deceleration trends are basically consistent for all head shapes, but there are significant differences in drag coefficients (Table 6). The results directly reflect differences in the drag reduction performance of different head shapes, with the conical head having the lowest drag coefficient.
From the perspective of fluid dynamic principles, influences the drag reduction performance was influenced by head shapes through two mechanisms, i.e. streamline degree[24,25] and cavitation induction capability[26]. The former determines the fluid separation point position and separated flow intensity. The latter affects the initiation conditions and stability of cavity formation. The conical head, with its gradual geometric profile, allows fluid to separate with minimal disturbance, while its sharp leading edge effectively induces cavitation, thus demonstrating the best drag reduction characteristics. The spherical head, although overall smooth, has greater curvature at its vertex, causing earlier fluid separation, resulting in the second-best drag reduction effect. The truncated cone heads, with blunter leading edges, move the fluid separation point forward and increase separated flow intensity, producing greater drag.
Figure 11 shows experimental images of different head shape slender bodies during water-exit, clearly demonstrating the profound influence of head shape on cavity morphology. The conical and spherical head slender bodies formed complete and relatively stable supercavities with clear boundaries and continuous gas phase inside; while the long truncated cone and short truncated cone heads exhibited cavity collapse phenomena, with the rigid body surrounded by irregular gas-liquid mixtures. This difference can be explained through cavitation initiation theory[27]-the fluid separation characteristics of conical and spherical heads create low-pressure regions near the separation points. When the local pressure drops below the saturated vapor pressure, stable cavitation is triggered. Due to geometric discontinuities, the truncated cone heads cause more violent but irregular fluid separation, forming unstable cavities prone to breakage.
Particularly noteworthy is that the cavity induced by the conical head is most uniform, exhibiting typical cigar-shaped supercavity characteristics, highly consistent with the morphology predicted by potential flow theory[28,29]. The cavity formed by the spherical head is slightly ellipsoidal, with the maximum diameter position further back. By contrast, the two truncated cone heads produce more irregular cavities, accompanied by obvious collapse and regeneration phenomena. This difference originates from the different influence patterns of head shape curvature distribution on separated fluid—the linear changing curvature distribution of the conical head produces relatively consistent fluid separation conditions, while the discontinuous curvature of the truncated cone heads creates locally unstable regions in the flow field.
3.3. Characteristics of Slender Body Water-Exit with Different Length-to-Diameter Ratios
To systematically study the influence of length-to-diameter ratio on slender body water-exit characteristics, the long truncated cone head slender bodies with length-to-diameter ratios of 7:1, 6:1, and 5:1 were selected to explore the impact of geometric proportion changes on water-exit dynamic characteristics. The experimental conditions for each case are shown in Table 7.
Figure 12 shows the experimental images of long truncated cone slender bodies with three length-to-diameter ratios (7:1, 6:1, 5:1) during water-exit. Cavity formation can be observed in all conditions. Due to differences in slender body geometric dimensions, the cavity coverage areas show clear distinctions. As the length-to-diameter ratio decreases, the proportion of the slender body covered by cavities increases. Comparing the 5:1 and 7:1 length-to-diameter ratio slender bodies, the former is almost completely surrounded by cavities, while the latter has only about 60% of its surface area covered by cavities.
Figure 13 shows the velocity evolution curves of three slender bodies with different length-to-diameter ratios (5:1, 6:1, 7:1) during water-exit. The overall trends are basically consistent, with drag coefficients during deceleration of 0.27, 0.27, and 0.18 respectively, indicating that larger length-to-diameter ratios are beneficial for drag reduction.
From the perspective of fluid dynamics, length-to-diameter ratio influences drag reduction performance through two mechanisms, i.e. the ratio of frontal area to wetted surface area and the tail flow separation characteristics. As length-to-diameter ratio increases, the ratio of frontal area to wetted surface area decreases, increasing the proportion of friction drag in total drag while decreasing the proportion of pressure drag. Considering that friction drag is typically smaller than pressure drag, the overall drag coefficient therefore decreases. At the same time, slender bodies with larger length-to-diameter ratios have more gradual tail contraction angles, moving the fluid separation point backward, reducing wake region size, and thereby lowering pressure drag.
Comprehensive analysis shows that the larger length-to-diameter ratio (7:1) demonstrates clear advantages in drag reduction characteristics and cavity dynamics. This finding has important guiding significance for underwater vehicle and cross-media equipment design. However, the increase of length-to-diameter ratio also brings limitations in structural strength, internal space utilization, and other aspects, so optimized design considering multiple factors is needed in engineering practice.
3.4. Characteristics of Slender Body Water-Exit with Different Elastic Moduli
During the slender body water-exit process, the interaction between structure and fluid may cause obvious deformation. In the aforementioned conditions, slender bodies made of high-toughness resin can be considered as rigid bodies, with no significant deformation observed. However, in practical engineering, fluid-structure coupling effects may cause bending, vibration, or even structural failure. To observe the influence of material elastic properties on water-exit behavior, slender bodies with different elastic moduli were designed for experiments, with experimental conditions shown in Table 8.
Figure 14 shows the water-exit process of the spherical-headed slender body with the lowest elastic moduli (227.36 MPa). At t=12.6ms, the slender body is partially out of the tube, and significant bending can be observed at the head, with a bending angle of approximately 15°. At the moment of tube exit, the static fluid in front of the slender body is compressed. The impact force in the opposite direction of the movement on the moving slender body, causes the head bend due to lateral shear force. As the slender body continues to rise (t=20ms, 27.2ms), due to the rightward bending of the head, the subsequent motion trajectory deviates toward the bending direction, and the deformation is further exacerbated. At t=36.6ms, the slender body's bending angle exceeds 90°, the projectile head orientation begins to point downward, and the slender body's movement direction turns downward, unable to exit from the water successfully.
Figure 15 shows the water-exit process of the spherical-headed slender body with medium elastic moduli (253.02 MPa). Similar to Case 11, at t=22ms, the head bends to the right under fluid action, but due to the increased elastic moduli, the degree of bending is reduced, with an angle of about 3°. As the movement continues (t=50ms), the degree of bending increases, and the trajectory deviates in the bending direction. At t=28ms, the head begins to straighten, guiding the slender body toward the water surface. At t=35ms, the head maintains a vertical upward orientation, while the tail bending decreases to about 5°, showing a recovery trend. At t=47ms, the slender body completely returns to a vertical state and continues to guide the upward movement.
Figure 16 shows the water-exit process of the spherical-headed slender body with the highest elastic moduli (279.14 MPa). Due to the increased stiffness, no obvious bending deformation is observed throughout the entire water-exit process, and its motion characteristics are similar to those of the rigid slender bodies described earlier, maintaining a stable upward trajectory.
Comparing the water-exit behavior of slender bodies with three different elastic moduli, a significant influence of material properties on water-exit stability can be clearly observed. The slender body with an elastic moduli of 227.36 MPa undergoes severe deformation under fluid impact, leading to trajectory deviation and ultimately failing to exit from the water. By contrast, the slender body with an elastic moduli of 253.02 MPa also initially produces deformation but can partially recover and complete the water-exit process, exhibiting relatively complex oscillation behavior. Furthermore, the slender body with an elastic moduli of 279.14 MPa shows almost no deformation, maintaining a stable trajectory.
From the perspective of structural dynamics, the deformation modes of the slender body are closely related to its natural frequencies and damping characteristics. Materials with lower elastic moduli not only have larger initial deformations but also weaker shape recovery capabilities, easily producing sustained deformation under fluid dynamic loads; while materials with higher elastic moduli have stronger shape maintenance ability, capable of resisting deformation caused by fluid impact.
In addition, deformation directly affects the flow field around the slender body and cavity morphology. In Case 11, due to the severe bending of the slender body, the cavity morphology is highly irregular, making it difficult to form a stable closed cavity; while in Cases 12 and 13, the cavity morphology is relatively regular and fully developed, similar to the cavity characteristics of rigid slender bodies.
In summary, material elastic properties have a critical influence on slender body water-exit behavior. In practical applications, it is necessary to select materials with appropriate stiffness according to the water-exit speed and conditions, ensuring that the structure can both resist fluid impact and maintain necessary buffering capability.
4. Conclusions
Through implementation of systematic experimental protocols, this investigation has elucidated the dynamic characteristics of slender cylindrical bodies during water-exit under diverse parametric conditions, thereby revealing the underlying physical mechanisms through which ejection velocity, head shapes, length-to-diameter ratio, and elastic moduli influence water-exit dynamics.
The results reveal that ejection velocity significantly affects cavity characteristics, with higher velocities producing longer cavities and substantially reduced drag coefficients. Additionally, head shape geometry proves critical to performance, with conical heads demonstrating superior drag reduction compared to spherical and truncated cone designs. Furthermore, increasing the length-to-diameter ratio improves hydrodynamic efficiency by altering flow separation characteristics and reducing wake region size. Material elasticity emerges as a determinant factor in water-exit stability, where insufficient structural rigidity can lead to severe deformation under fluid loads, compromising trajectory integrity. Collectively, these insights enhance our understanding of water-exit flow physics while providing robust experimental data for underwater launch systems and cross-media vehicle optimization.
The findings presented herein not only advance the fundamental understanding of water-exit flow physics but also provide comprehensive experimental data and theoretical frameworks. Future research could further explore the combination of high-precision numerical simulation and theoretical modeling to construct a comprehensive predictive model for water-exit dynamics, and drag reduction control technology applications in cross-media vehicles, such as active flow control, surface morphology optimization, etc.
Author Contributions
Investigation, H.Z.; data curation, H.Z.; writing—original draft preparation,
H.Z.; writing—review and editing, H.Z. , D.W., Y.L.and Y.Z.; visualization, H.Z.; supervision, H.Q. and Y.Z.; project administration, Y.Z.; funding acquisition, Y.Z. and H.Q. All authors have read and agreed to the published version of the manuscript.
Funding
This research was funded by the national natural science foundation of China (Grant Nos. 12302383, 92152201, 52375559), the National Natural Science Foundation of Shannxi Province (Grant No. 2023-JC-QN-0052), the Postdoctoral Science Foundation (Grant No. 2023M734284), and the Youth Talent Support of Shaanxi Province (Grant No. 20230519).
Institutional Review Board Statement
Not applicable.
Informed Consent Statement
Not applicable.
Data Availability Statement
Not applicable.
Acknowledgments
The authors declare no conflicts of interest.
Conflicts of Interest
The authors declare no conflicts of interest.
References
- Ashraf, I.; Dorbolo, S. Effect of the surface dimples on the exit dynamics of a sphere at a constant velocity. Appl. Ocean Res. 2024, 147. [Google Scholar] [CrossRef]
- Ashraf, I.; Dorbolo, S. Exit dynamics of a square cylinder. Ocean Eng. 2024, 297. [Google Scholar] [CrossRef]
- Yun, H.; Liu, Q.; Zeng, Z.; Lian, L. Experimental study on water-exit of cylinder. Ocean Eng. 2023, 293. [Google Scholar] [CrossRef]
- Zheng, H.; Qiang, H.; Zhu, Y.; Zhang, C. Overview of Theory, Simulation, and Experiment of the Water Exit Problem. J. Mar. Sci. Eng. 2024, 12, 1764. [Google Scholar] [CrossRef]
- Karman, T. V. The impact of seaplane floats during landing. Tech. Rep. Arch. Image Libr. 1929. [Google Scholar]
- Korobkin, A.; Khabakhpasheva, T.; Maki, K.J. Hydrodynamic forces in water exit problems. J. Fluids Struct. 2017, 69, 16–33. [Google Scholar] [CrossRef]
- Shams, A.; Zhao, S.; Porfiri, M. Hydroelastic slamming of flexible wedges: Modeling and experiments from water entry to exit. Phys. Fluids 2017, 29. [Google Scholar] [CrossRef]
- Johan, V.; Qingping, Z.; Dominic, E.R. Modeling Floating Object Entry and Exit Using Smoothed Particle Hydrodynamics. J. Waterw. Port Coast. Ocean. Eng. 2011, 137, 213–224. [Google Scholar]
- Moshari, S.; Nikseresht, A.H.; Mehryar, R. Numerical analysis of two and three dimensional buoyancy driven water-exit of a circular cylinder. Int. J. Nav. Arch. Ocean Eng. 2014, 6, 219–235. [Google Scholar] [CrossRef]
- Ni, B.; Zhang, A.; Wu, G. Simulation of complete water exit of a fully-submerged body. J. Fluids Struct. 2015, 58, 79–98. [Google Scholar] [CrossRef]
- Haohao, H.; Yanping, S.; Jianyang, Y.; Fu, C.; Tian, L. Numerical analysis of water exit for a sphere with constant velocity using the lattice Boltzmann method. Appl. Ocean Res. 2019, 84, 163–178. [Google Scholar] [CrossRef]
- Xing-Yu, Z.; Xu-Jian, L.; Xu-Dong, F. Numerical Study on the Vertical Water Exit of A Cylinder with Cavity. China Ocean. Eng. 2022. [Google Scholar]
- Guo, Z.; Zhao, Y.; Zhang, X.; Lyu, X. On the cavity flow of a cylinder exiting water obliquely. Ocean Eng. 2023, 281. [Google Scholar] [CrossRef]
- Greenhow, M.; Lin, W. M. Nonlinear-Free Surface Effects: Experiments and Theory[J]. 1983.
- Wu, Q.; Ni, B.; Bai, X.; Cui, B.; Sun, S. Experimental study on large deformation of free surface during water exit of a sphere. Ocean Eng. 2017, 140, 369–376. [Google Scholar] [CrossRef]
- Wu, Q.; Ni, B.; Xue, Y.; Zhang, A. Experimental and numerical study of free water exit and re-entry of a fully submerged buoyant spheroid. Appl. Ocean Res. 2018, 76, 110–124. [Google Scholar] [CrossRef]
- Jiaxing, L.; Cong, W.; Yingjie, W.; et al. Experimental Research on Cavity Evolution Pattern and Trajectory Characteristics in the Water-exit Process of Salvoed Revolving Bodies. Acta Armamentarii 2019. [Google Scholar]
- Zhang, G.; You, C.; Wei, H.; Sun, T.; Yang, B. Experimental study on the effects of brash ice on the water-exit dynamics of an underwater vehicle. Appl. Ocean Res. 2021, 117. [Google Scholar] [CrossRef]
- Truscott, T.T.; Epps, B.P.; Munns, R.H. Water exit dynamics of buoyant spheres. Phys. Rev. Fluids 2016, 1, 074501. [Google Scholar] [CrossRef]
- Strutt, J. W. Scientific Papers: 423. On the Pressure developed in a Liquid during the Collapse of a Spherical Cavity. 2009.
- Plesset, M. S. The dynamics of cavitation bubbles. J. Appl. Mech 1949. [Google Scholar]
- Blake, J.R.; Gibson, D.C. Cavitation Bubbles Near Boundaries. Annu. Rev. Fluid Mech. 1987, 19, 99–123. [Google Scholar] [CrossRef]
- Arndt, R. E. A. Cavitation in vortical flows. Annu. Rev. Fluid Mech. 2003, 34, 143–175. [Google Scholar]
- Wichterle, K.; Vee, M. Fundamentals of the fluid mechanics[M]. 2020.
- Hoerner, S. F. Fluid Dynamic Drag: Vancouver[J].[2025-03-11].
- Brennen, C. E.Cavitation and Bubble Dynamics[J].Oxford University Press, 1995.
- Knapp, R.T.; Daily, J.W.; Hammitt, F.G. Cavitation; McGraw Hill Book CO: New York, NY, USA, 1970. [Google Scholar]
- Logvinovich, G. V. Hydrodynamics of free-boundary flows. Translated from Russian by D. Lederman[J].[2025-03-11].
- Tulin, M. P. Supercavitating flows-small perturbation theory[J].Journal of Ship Research, 1963(3):16-37.
Figure 1.
Schematic Diagram of Experimental Platform.
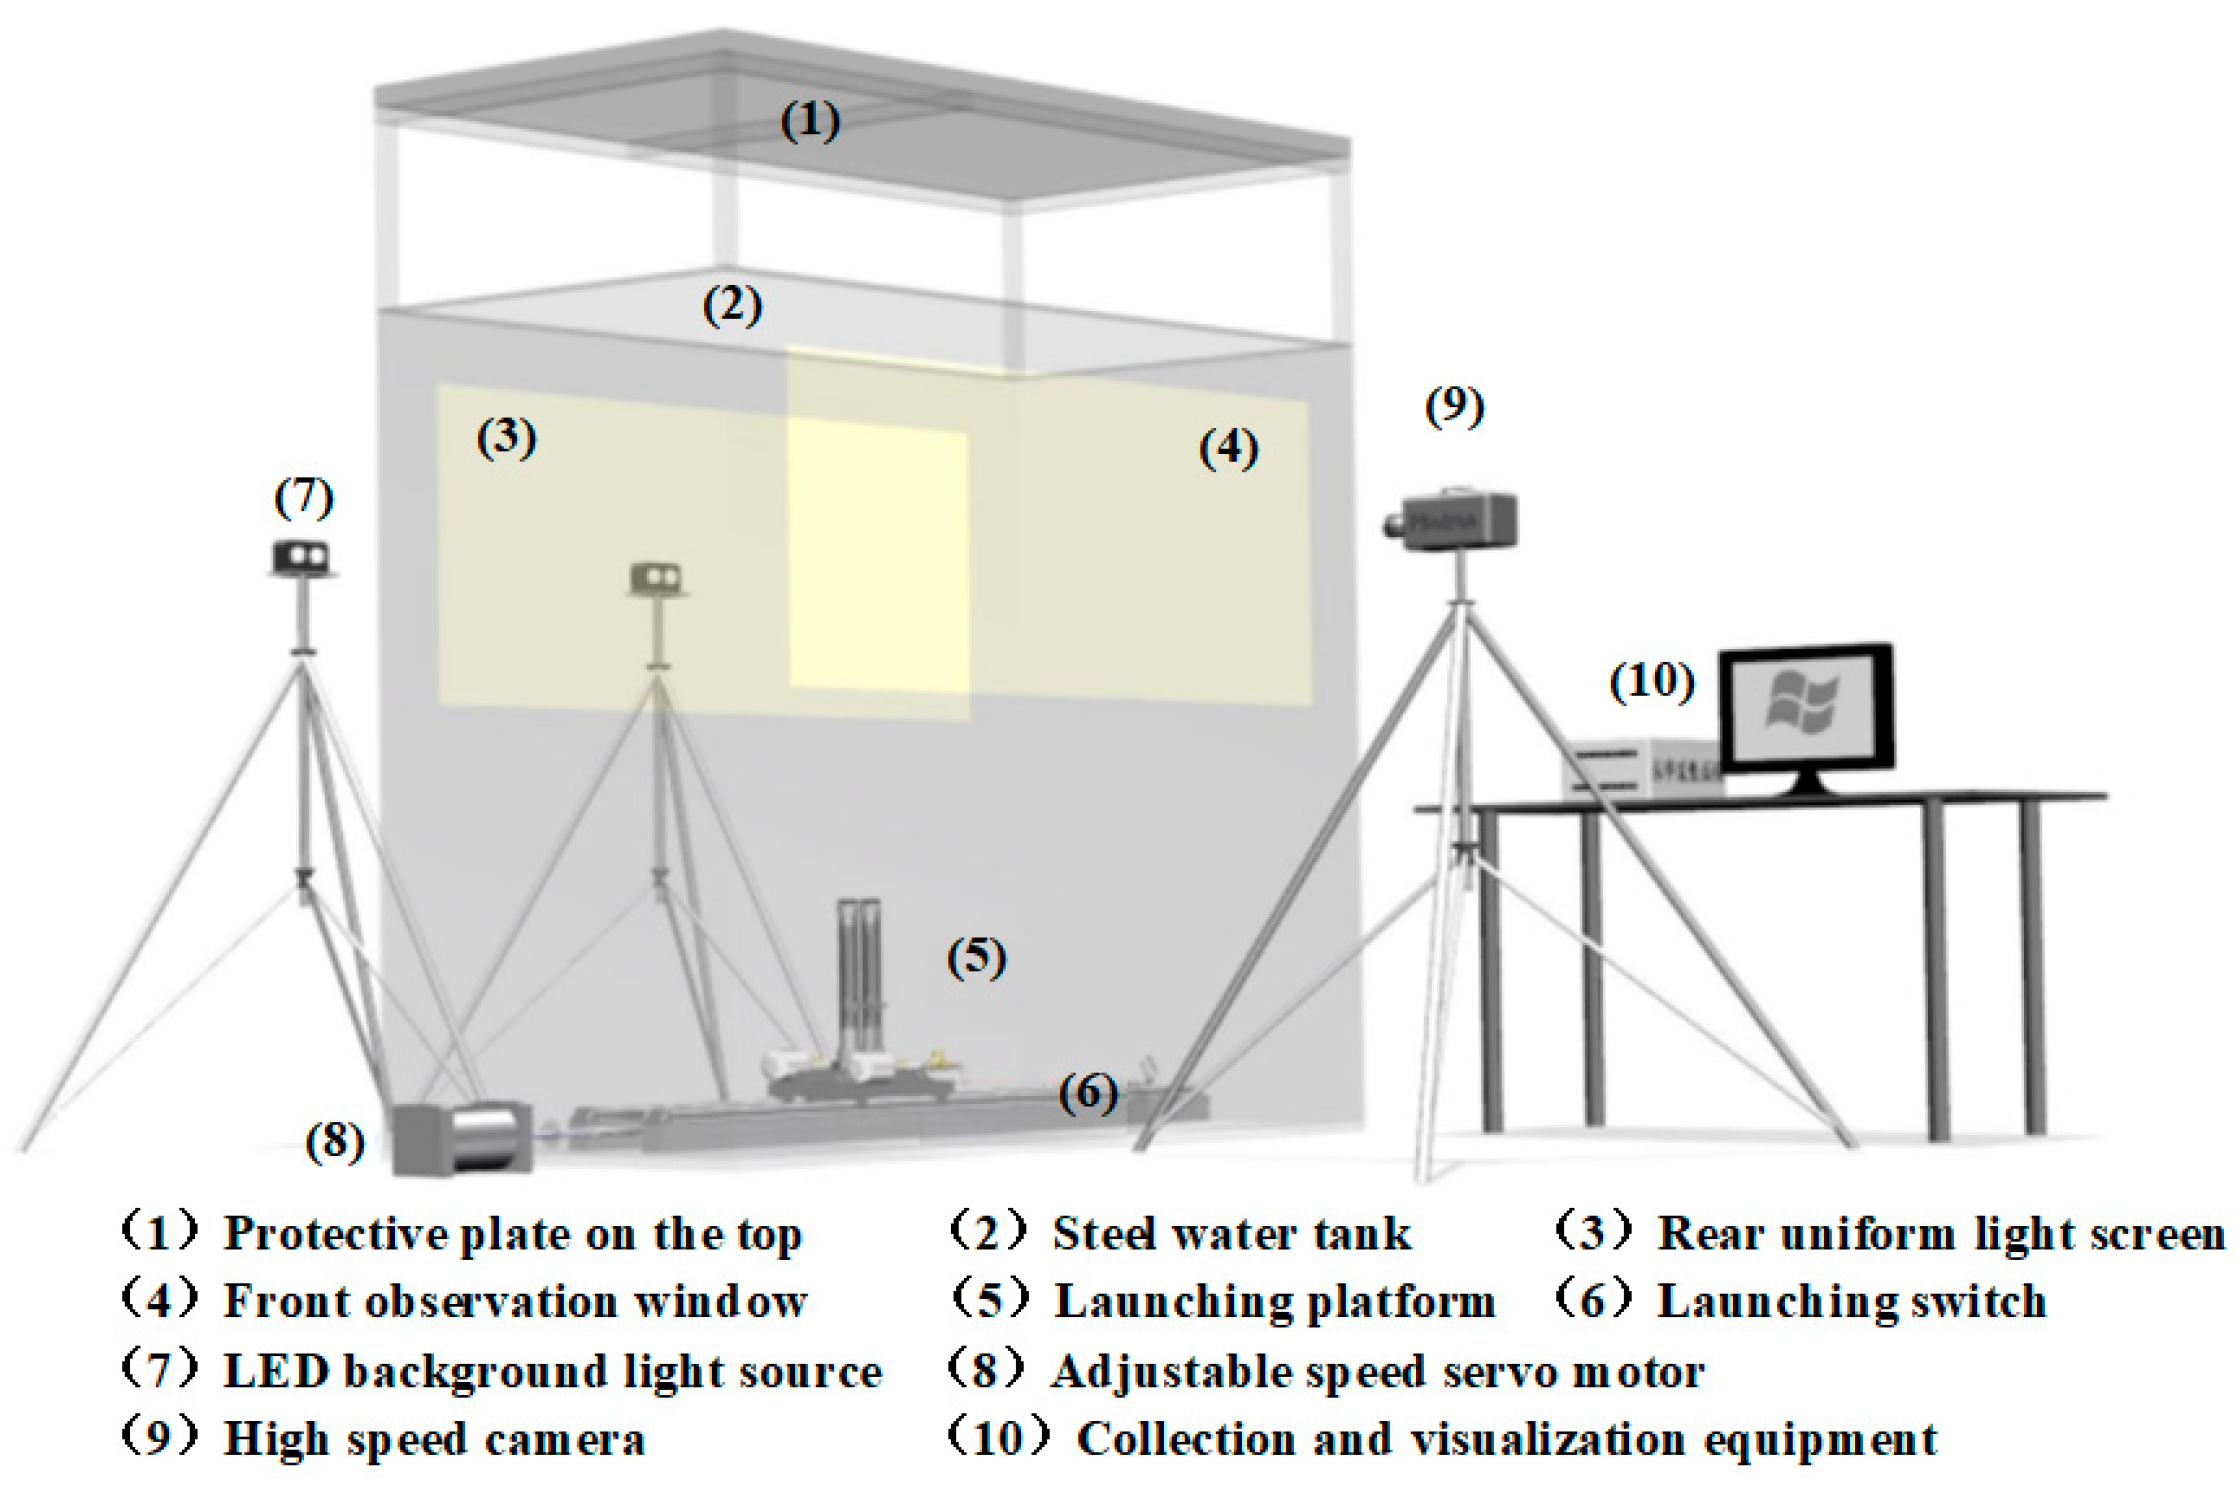
Figure 2.
Schematic Diagram of the Launch Platform.
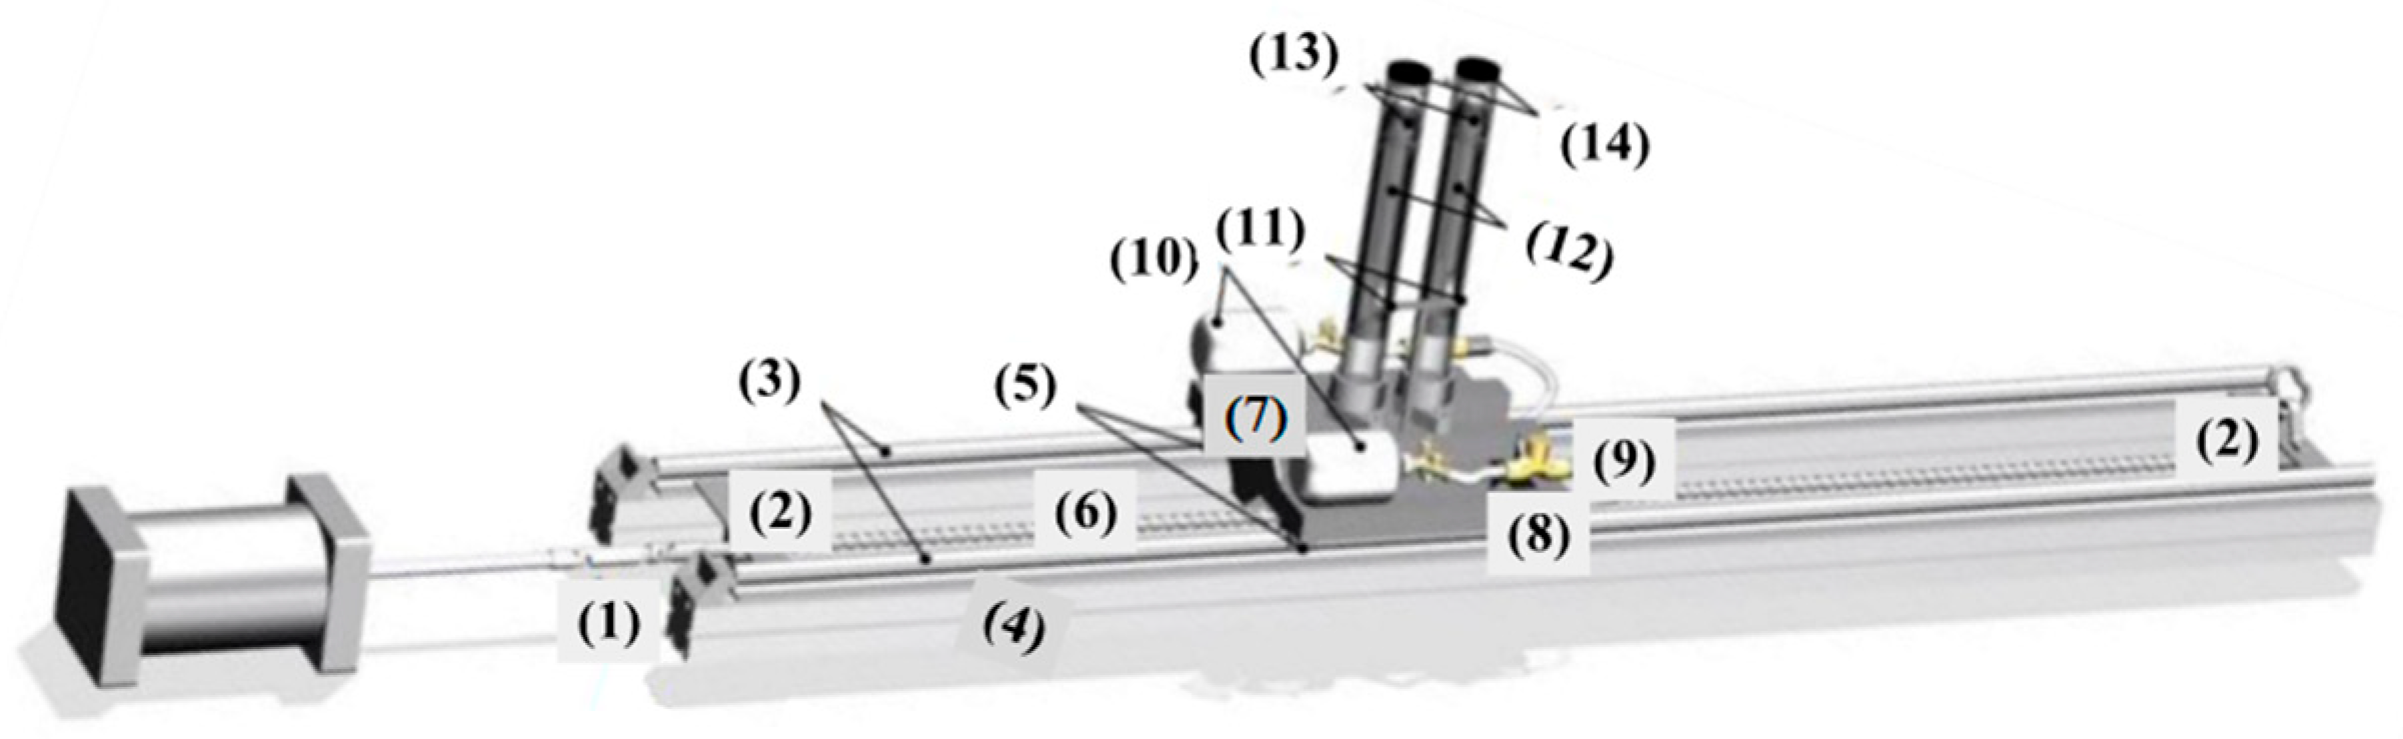
Figure 3.
Two-dimensional Schematic Diagram of Experimental Platform.
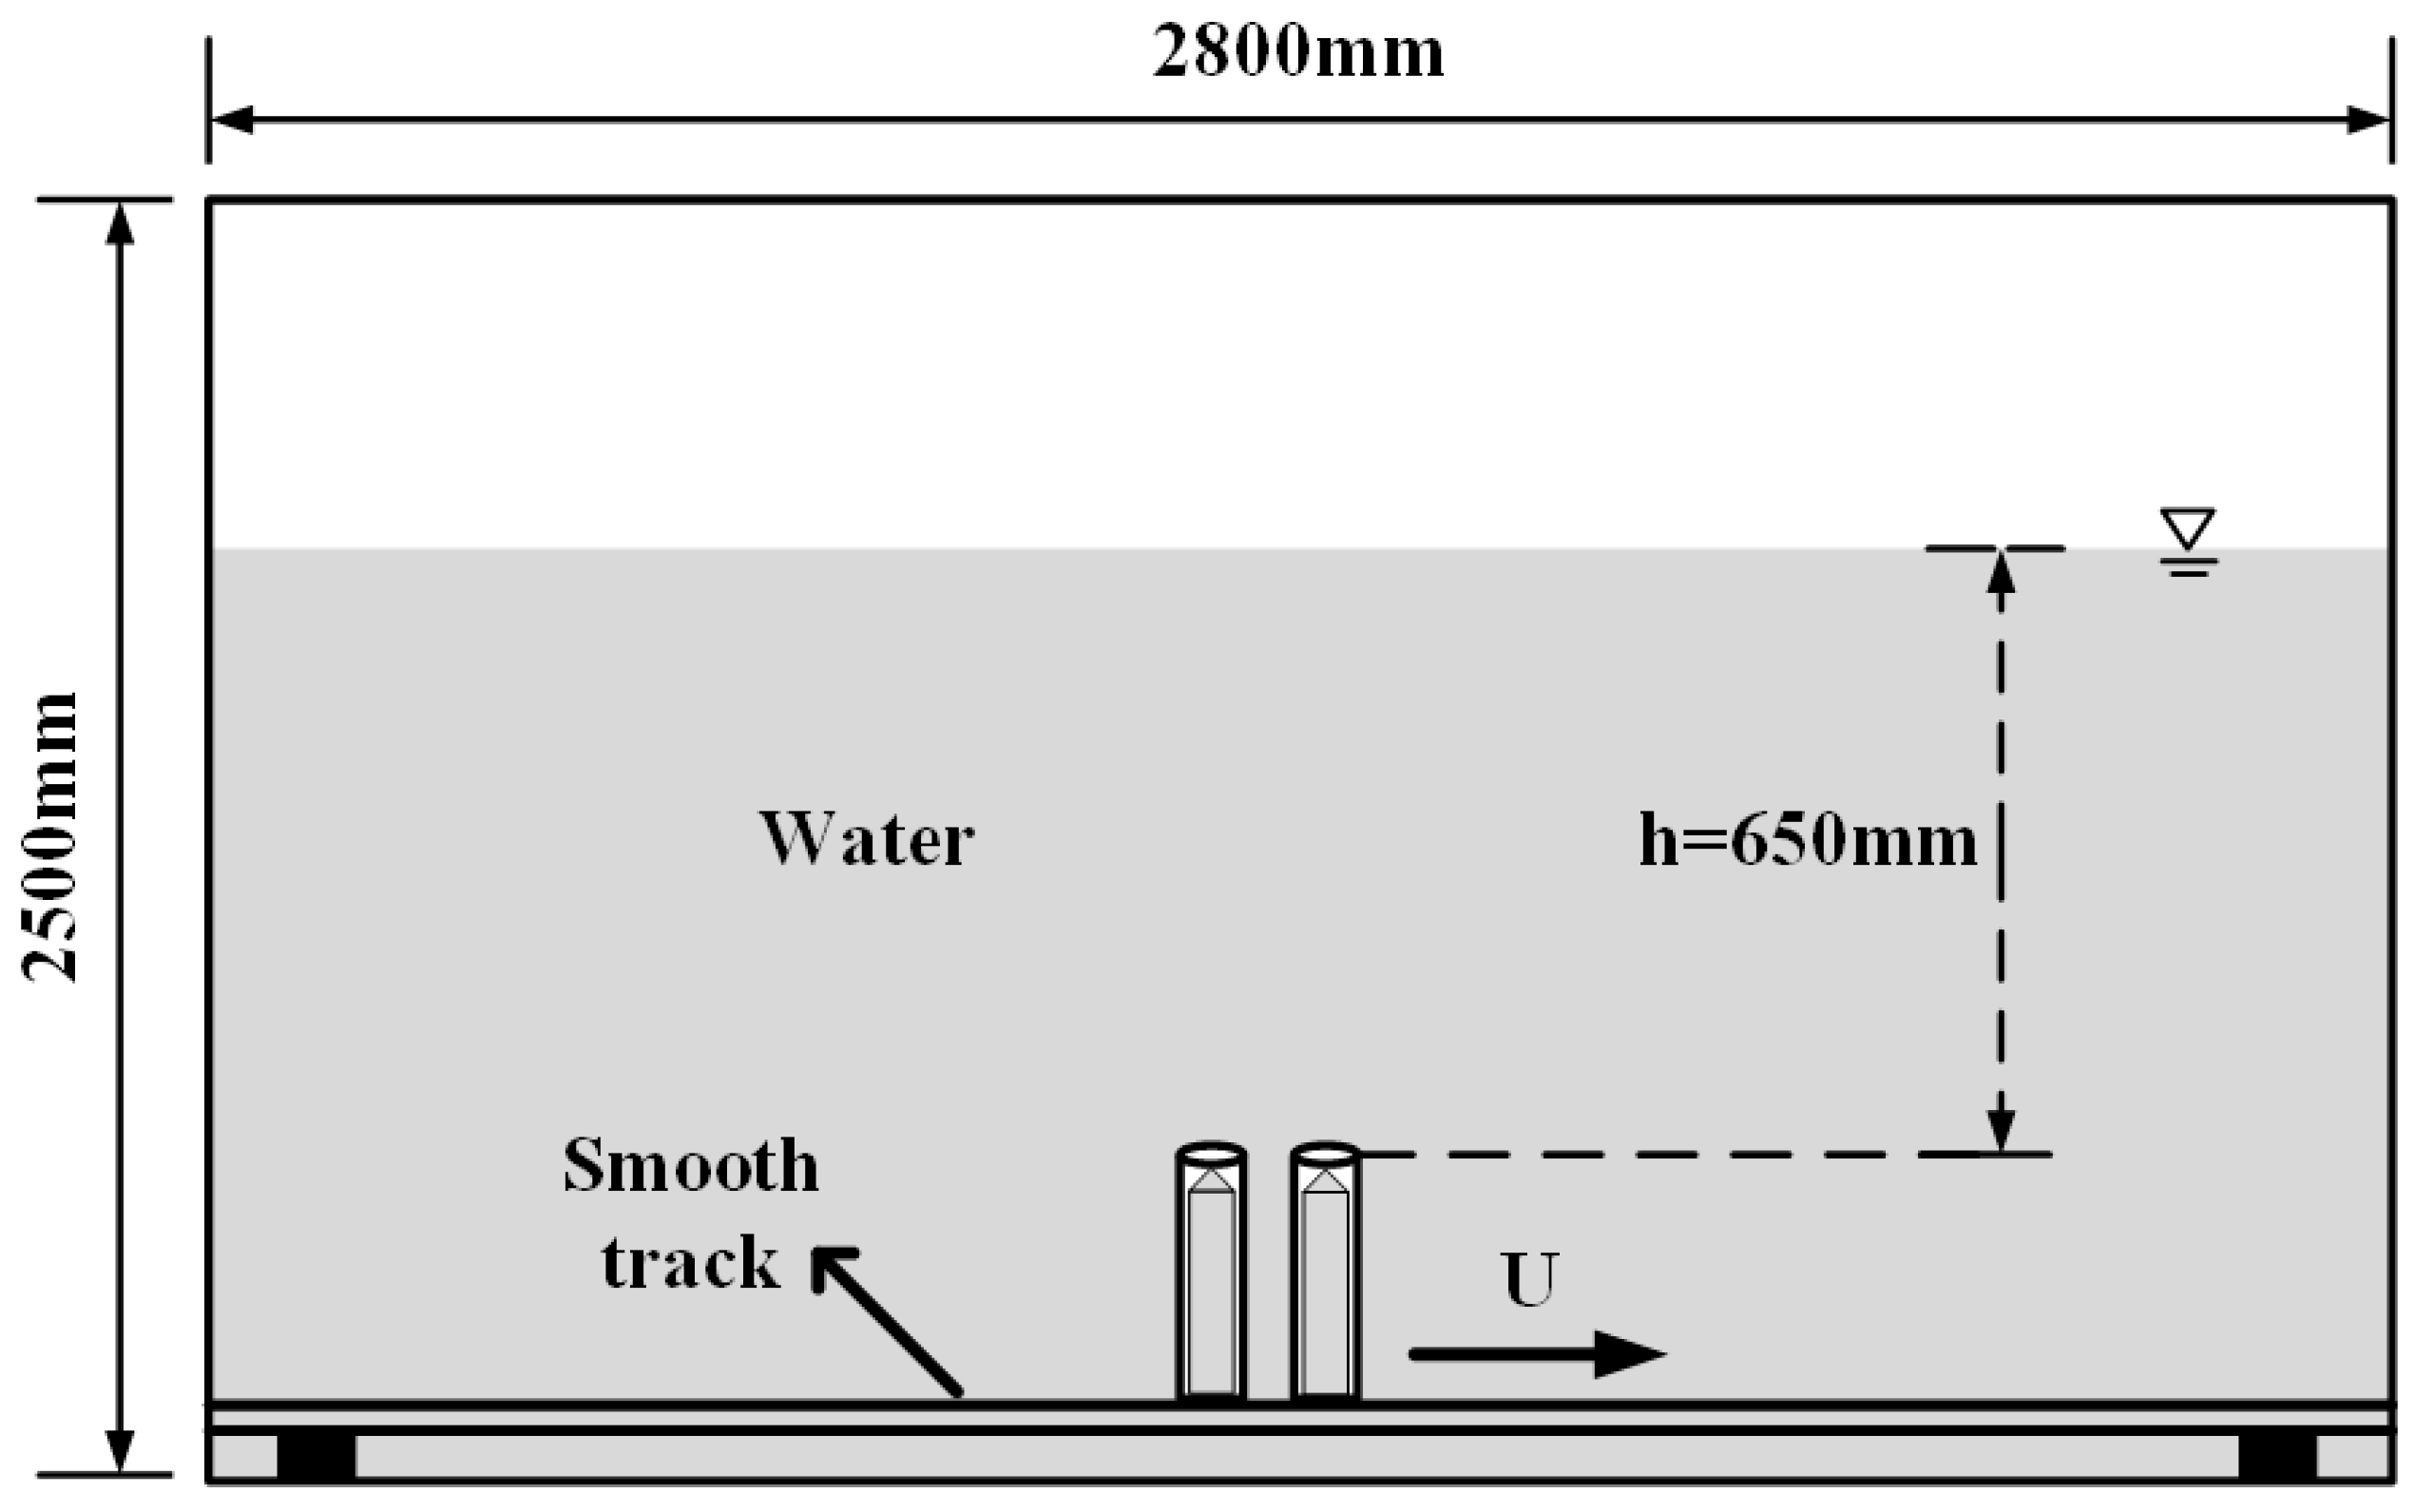
Figure 4.
Side view of slender bodies with different head shapes and length-to-diameter ratios (mm).
Figure 4.
Side view of slender bodies with different head shapes and length-to-diameter ratios (mm).
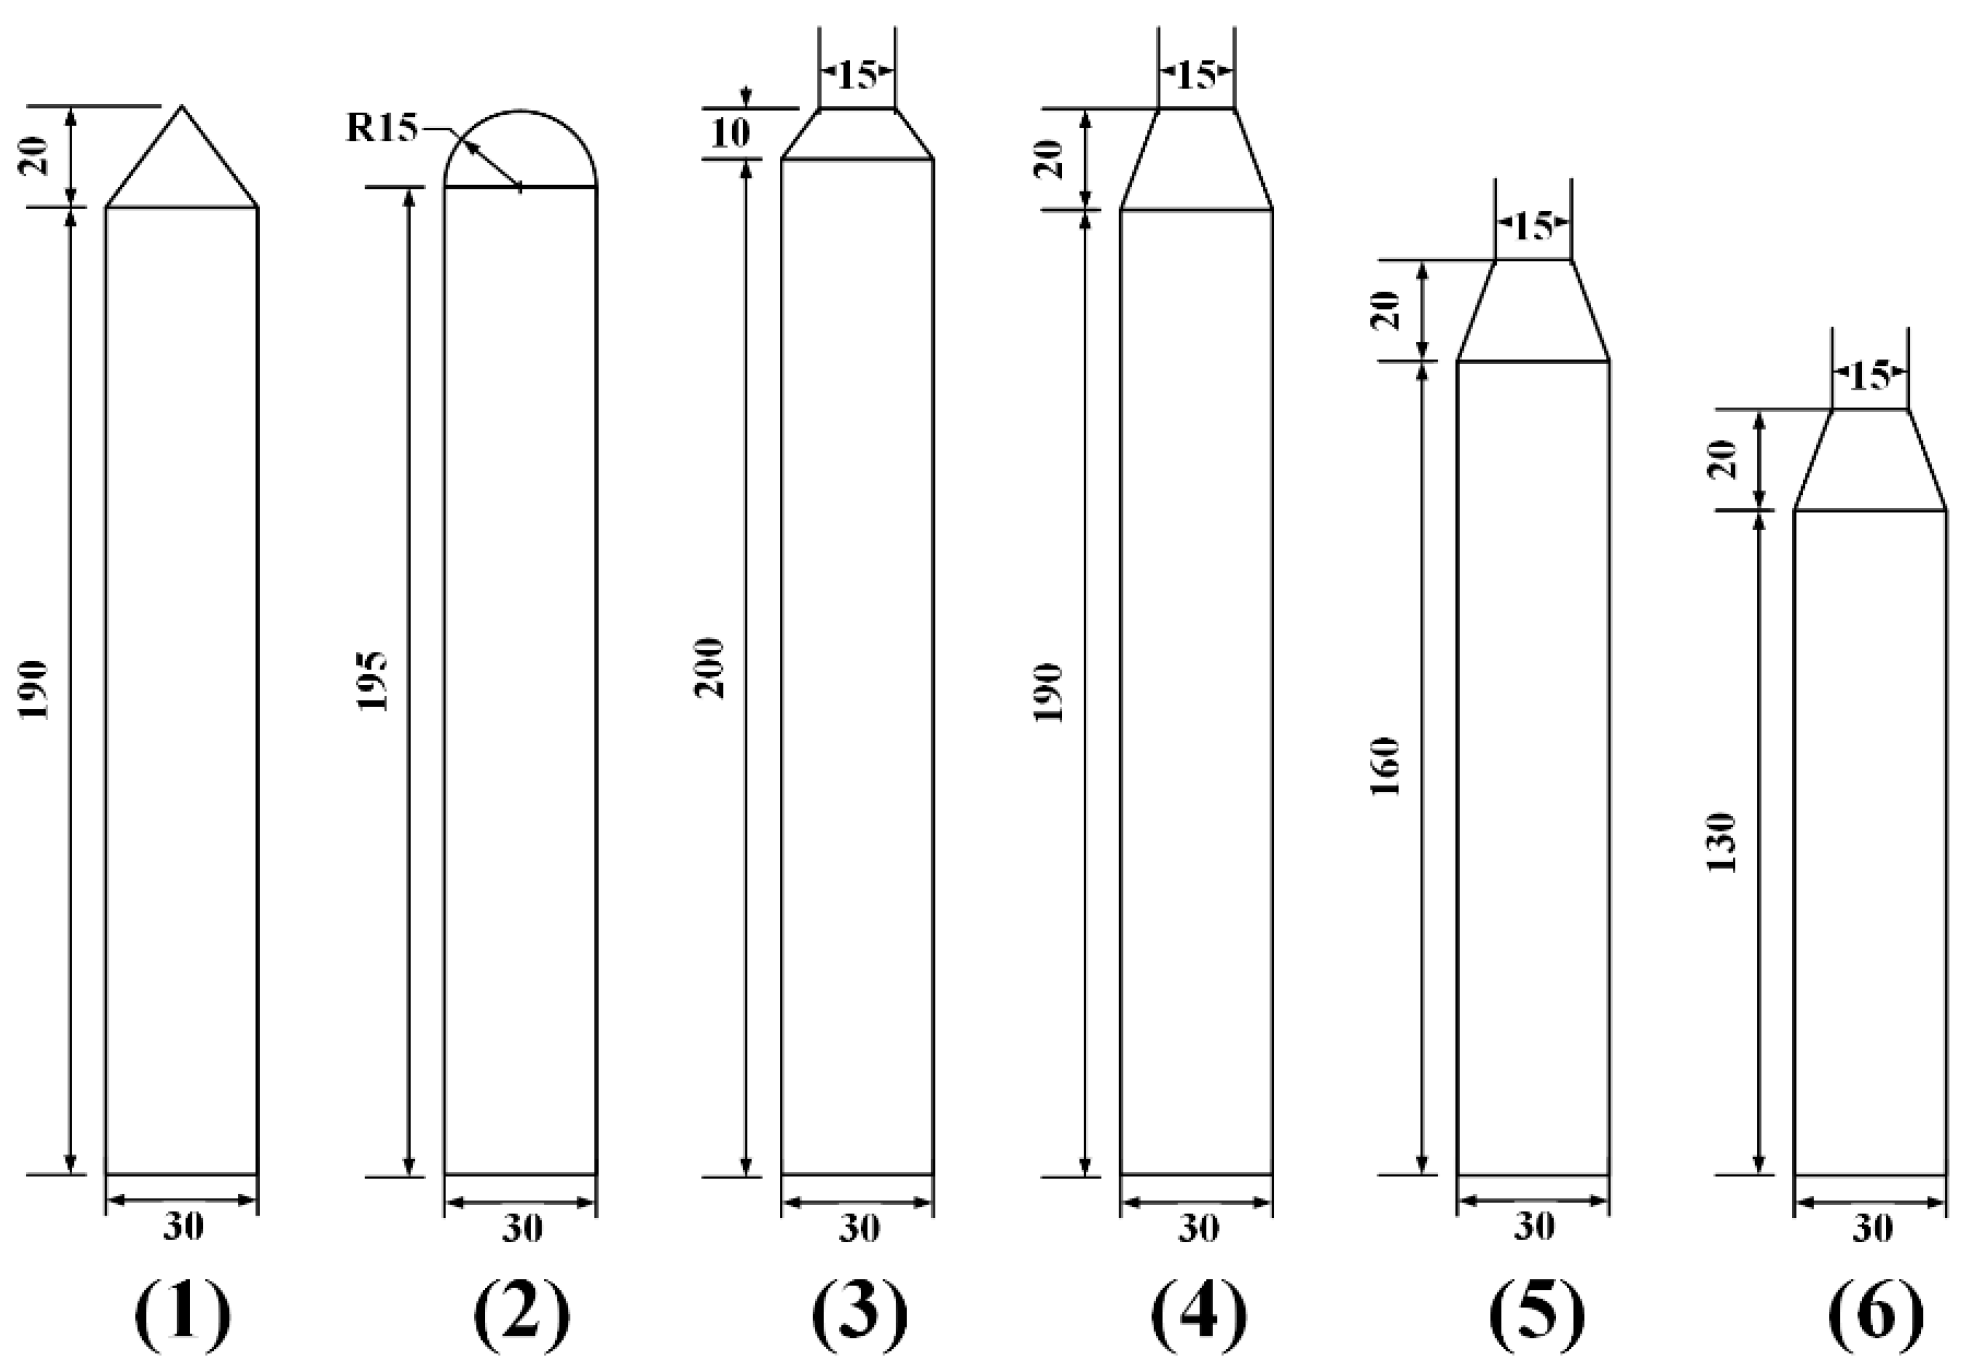
Figure 5.
Complete water-exit process of conical-headed slender body().
Figure 6.
Velocity evolution during water-exit of conical head at different ejection velocities.
Figure 7.
Cavity morphology during conical head water-exit at different velocities.
Figure 8.
Cavity length at different ejection velocities.
Figure 9.
Cavity diameter at different ejection velocities.
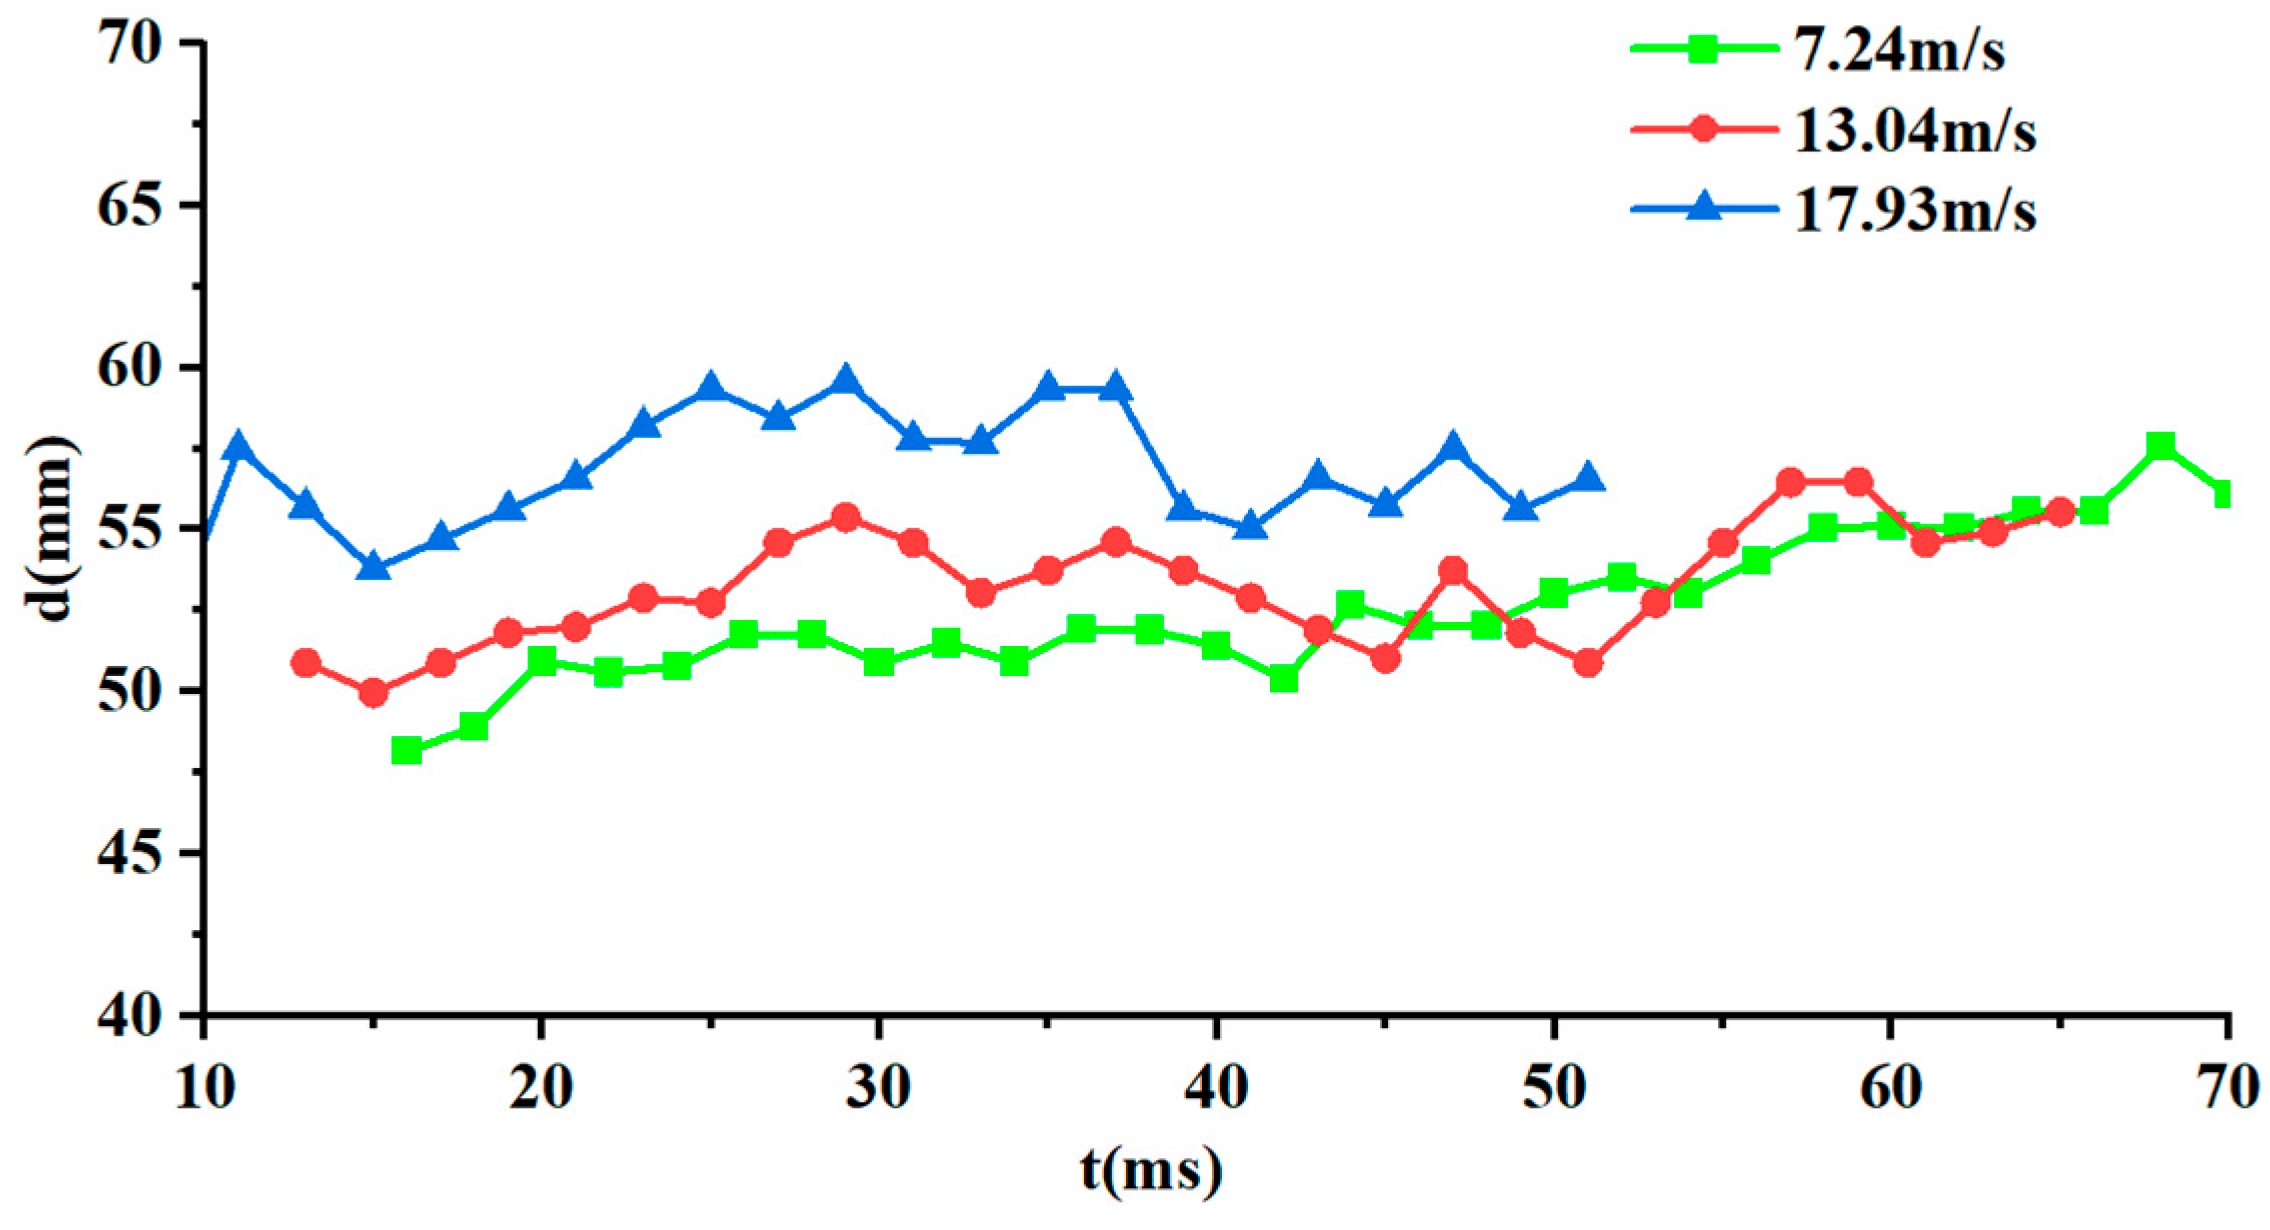
Figure 10.
Velocity evolution during water-exit of different head shapes (P=0.7MPa).
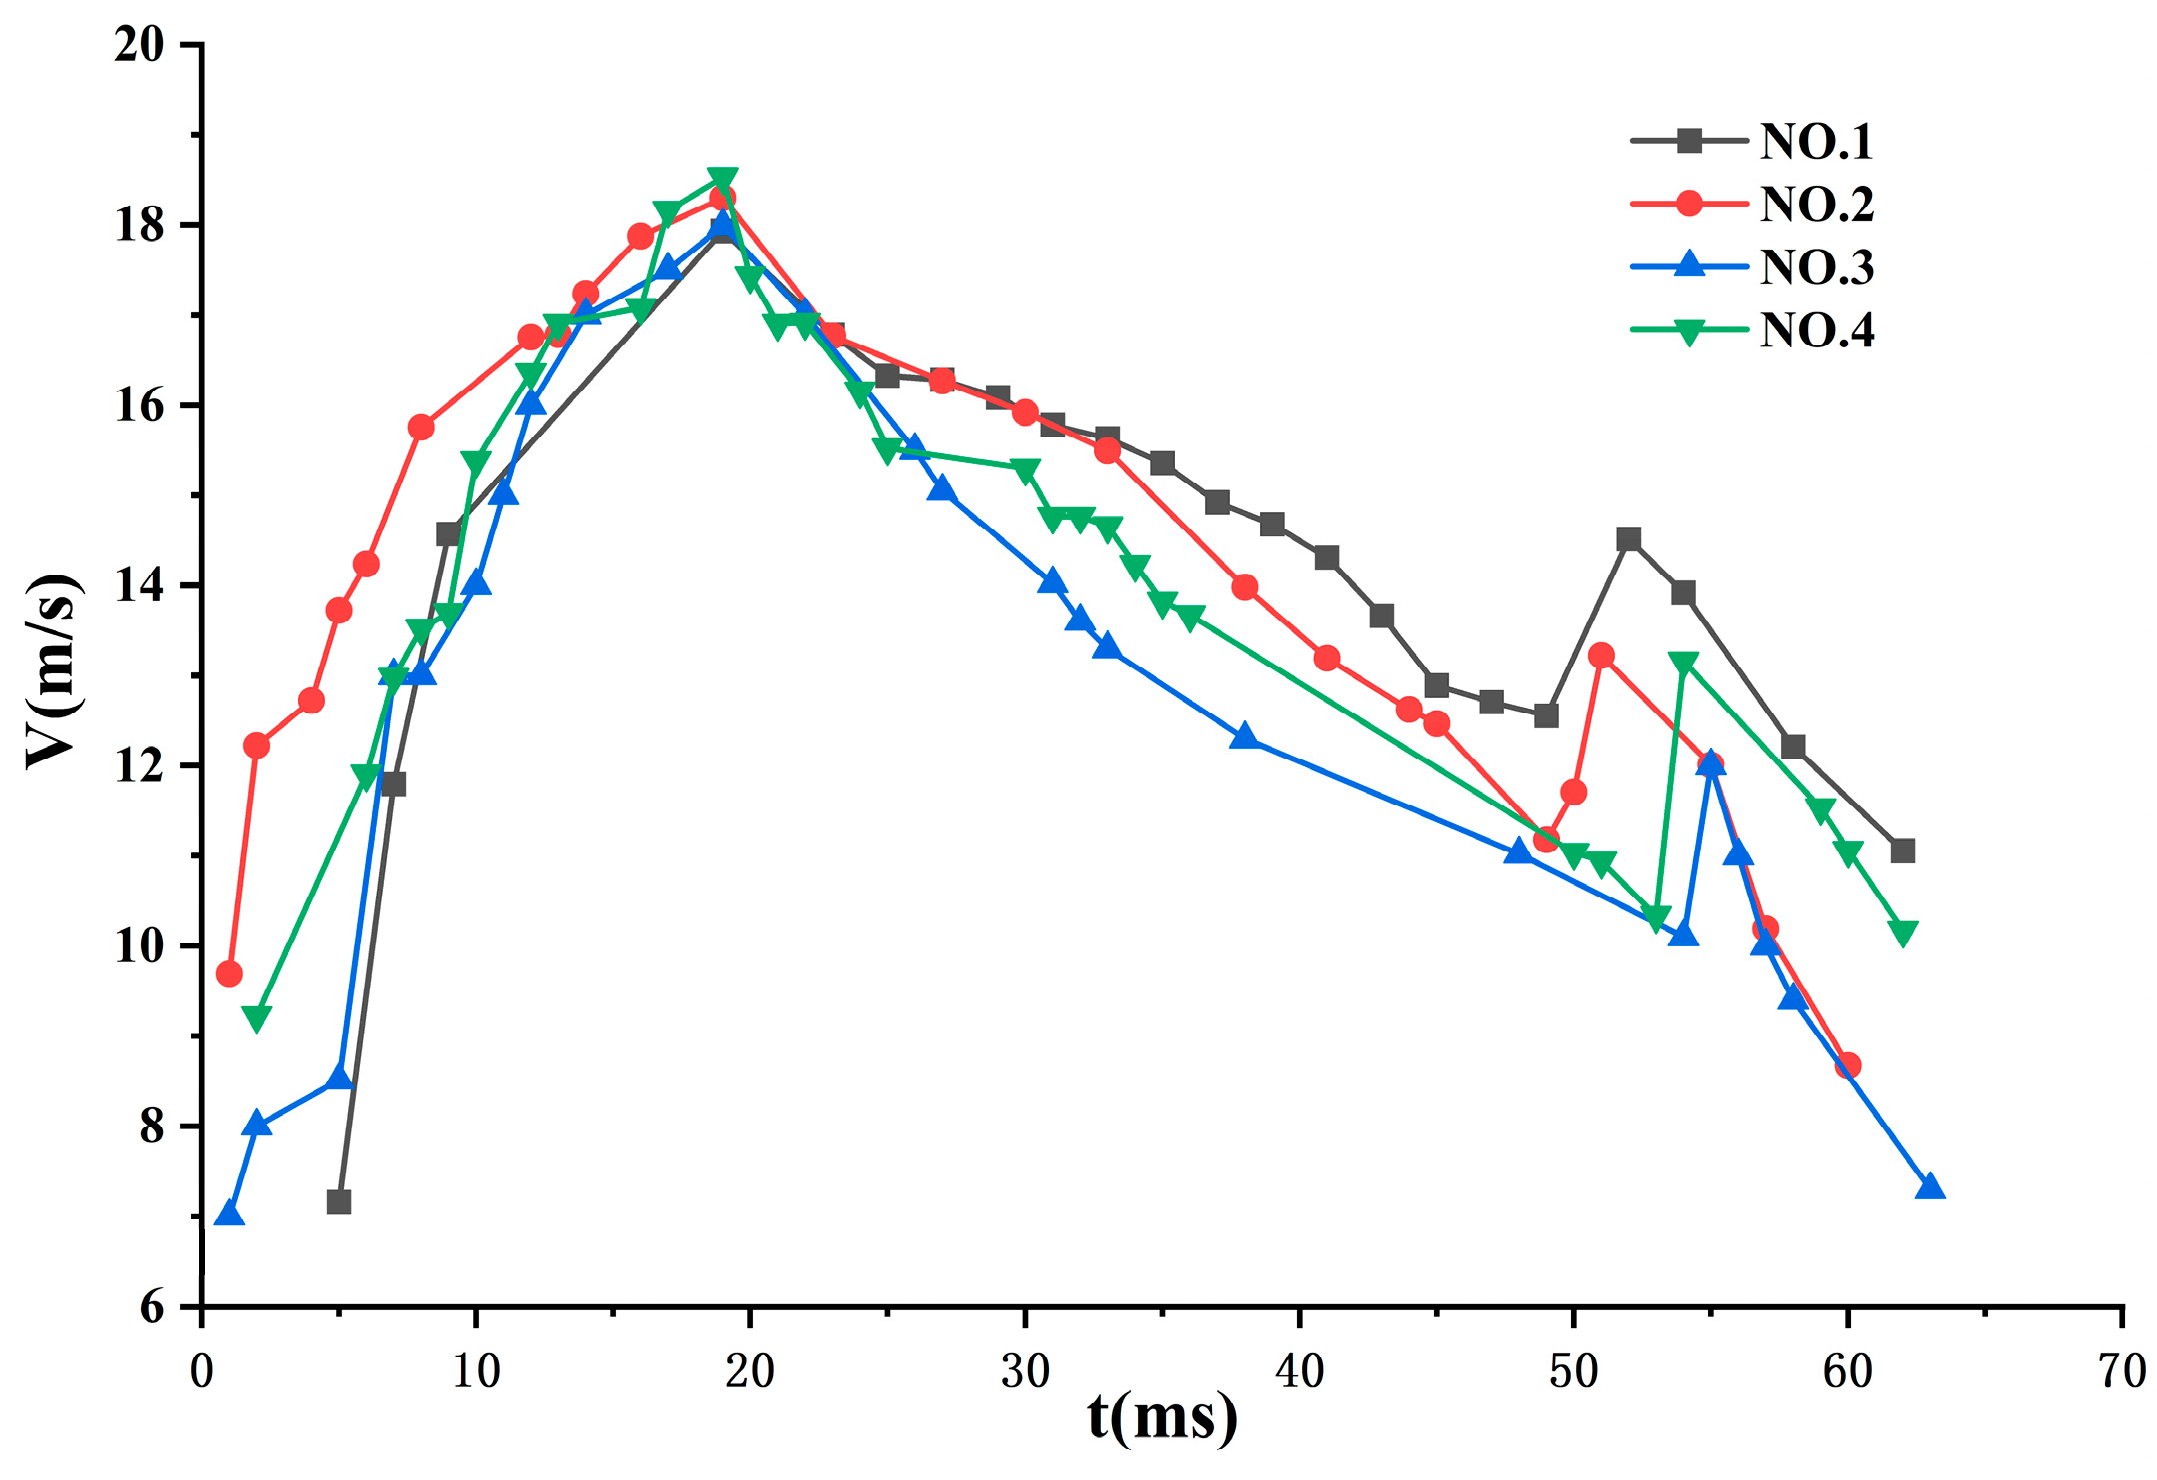
Figure 11.
Experimental images of different head shapes during water-exit.
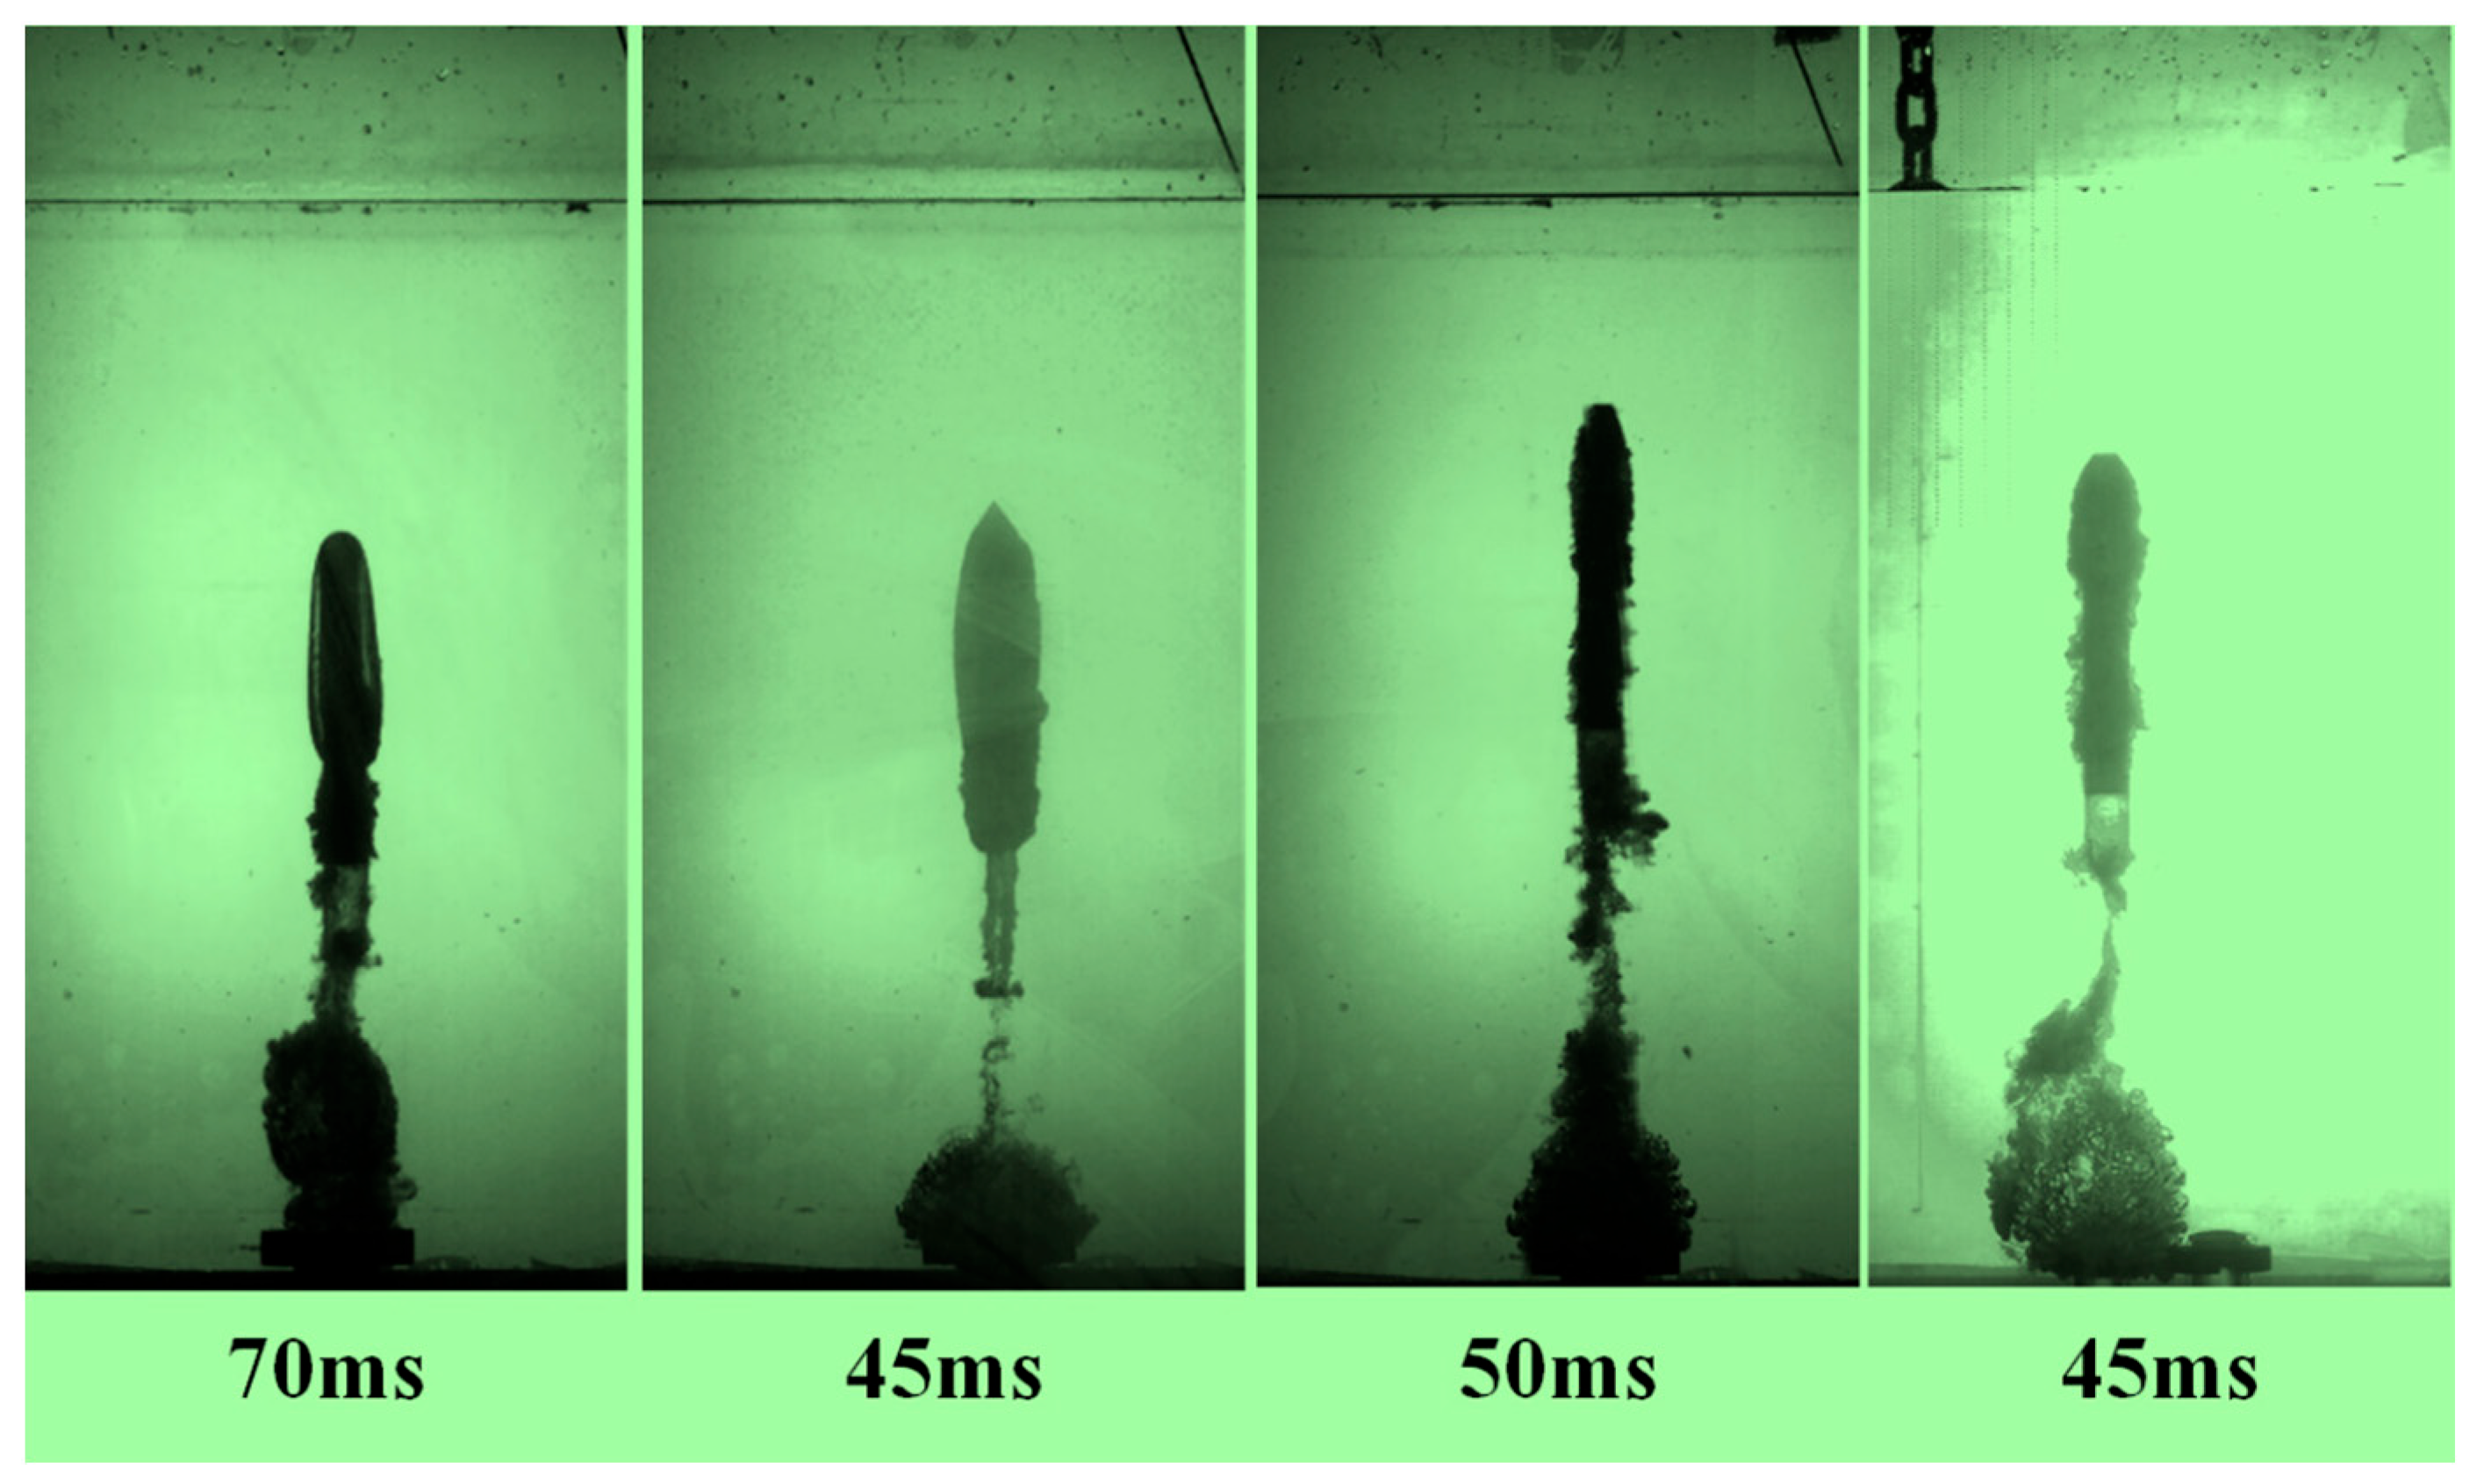
Figure 12.
Experimental images during water-exit with different length-to-diameter ratios.
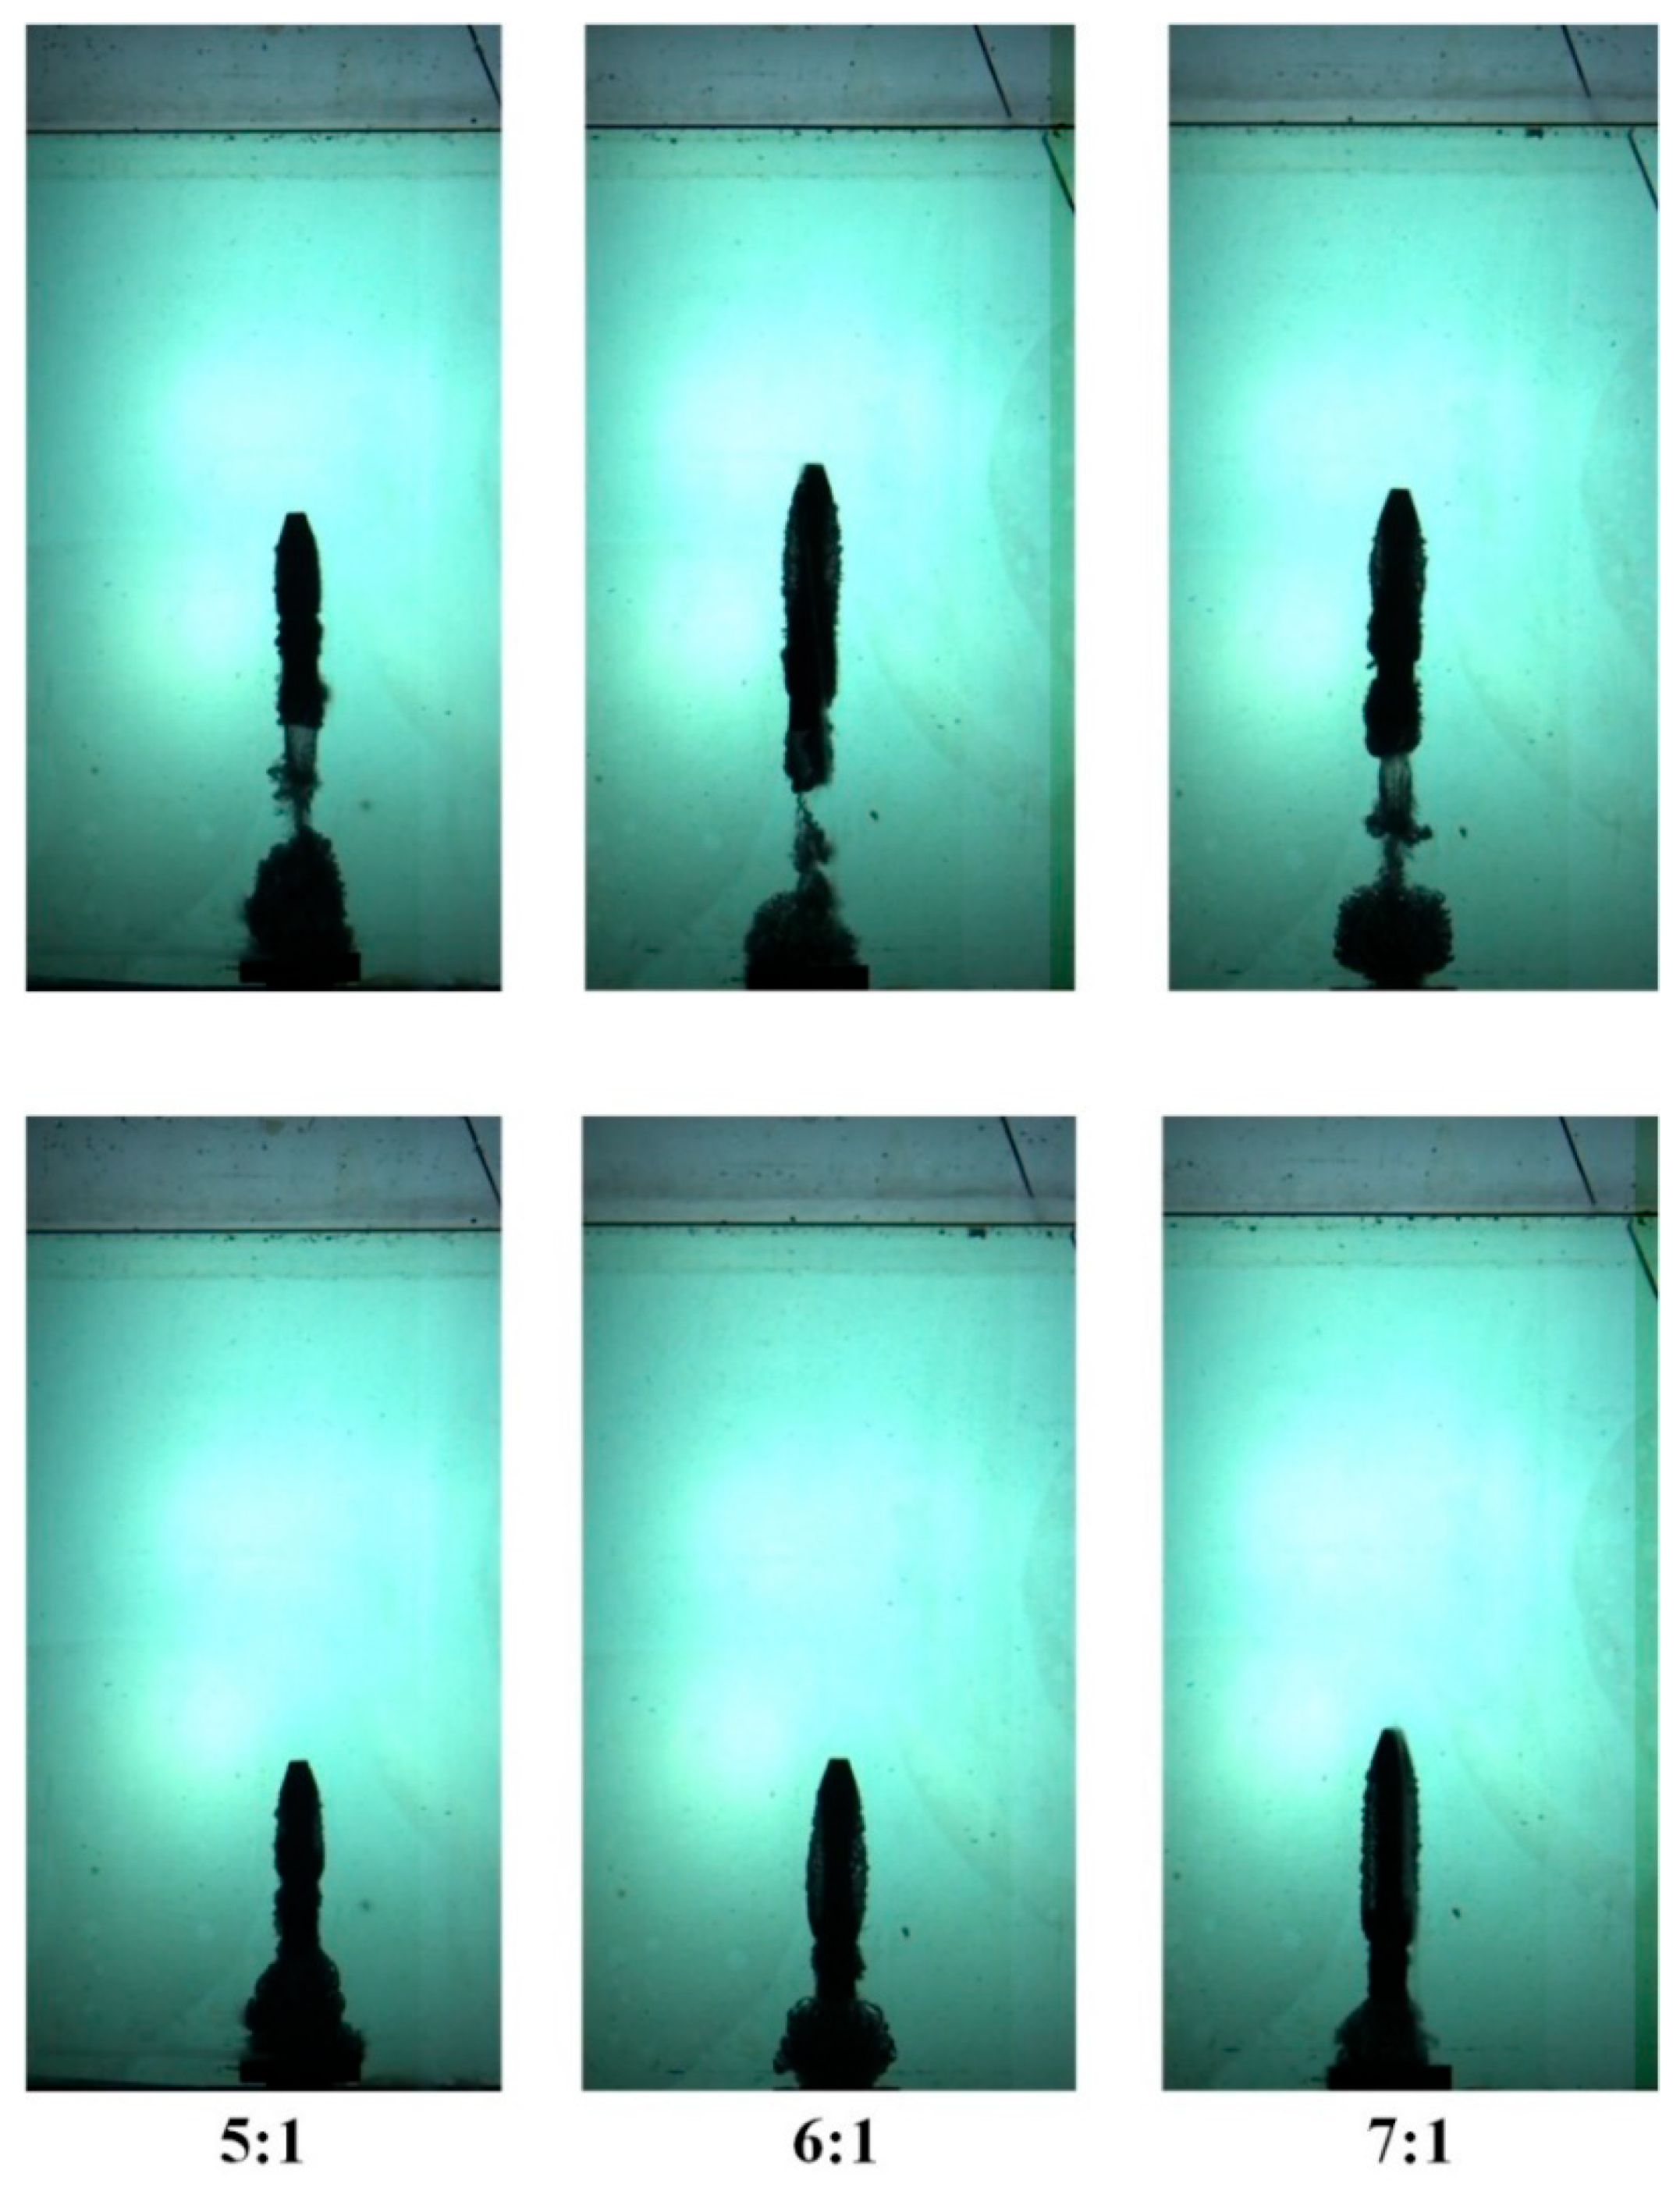
Figure 13.
Velocity evolution during water-exit with different length-to-diameter ratios.
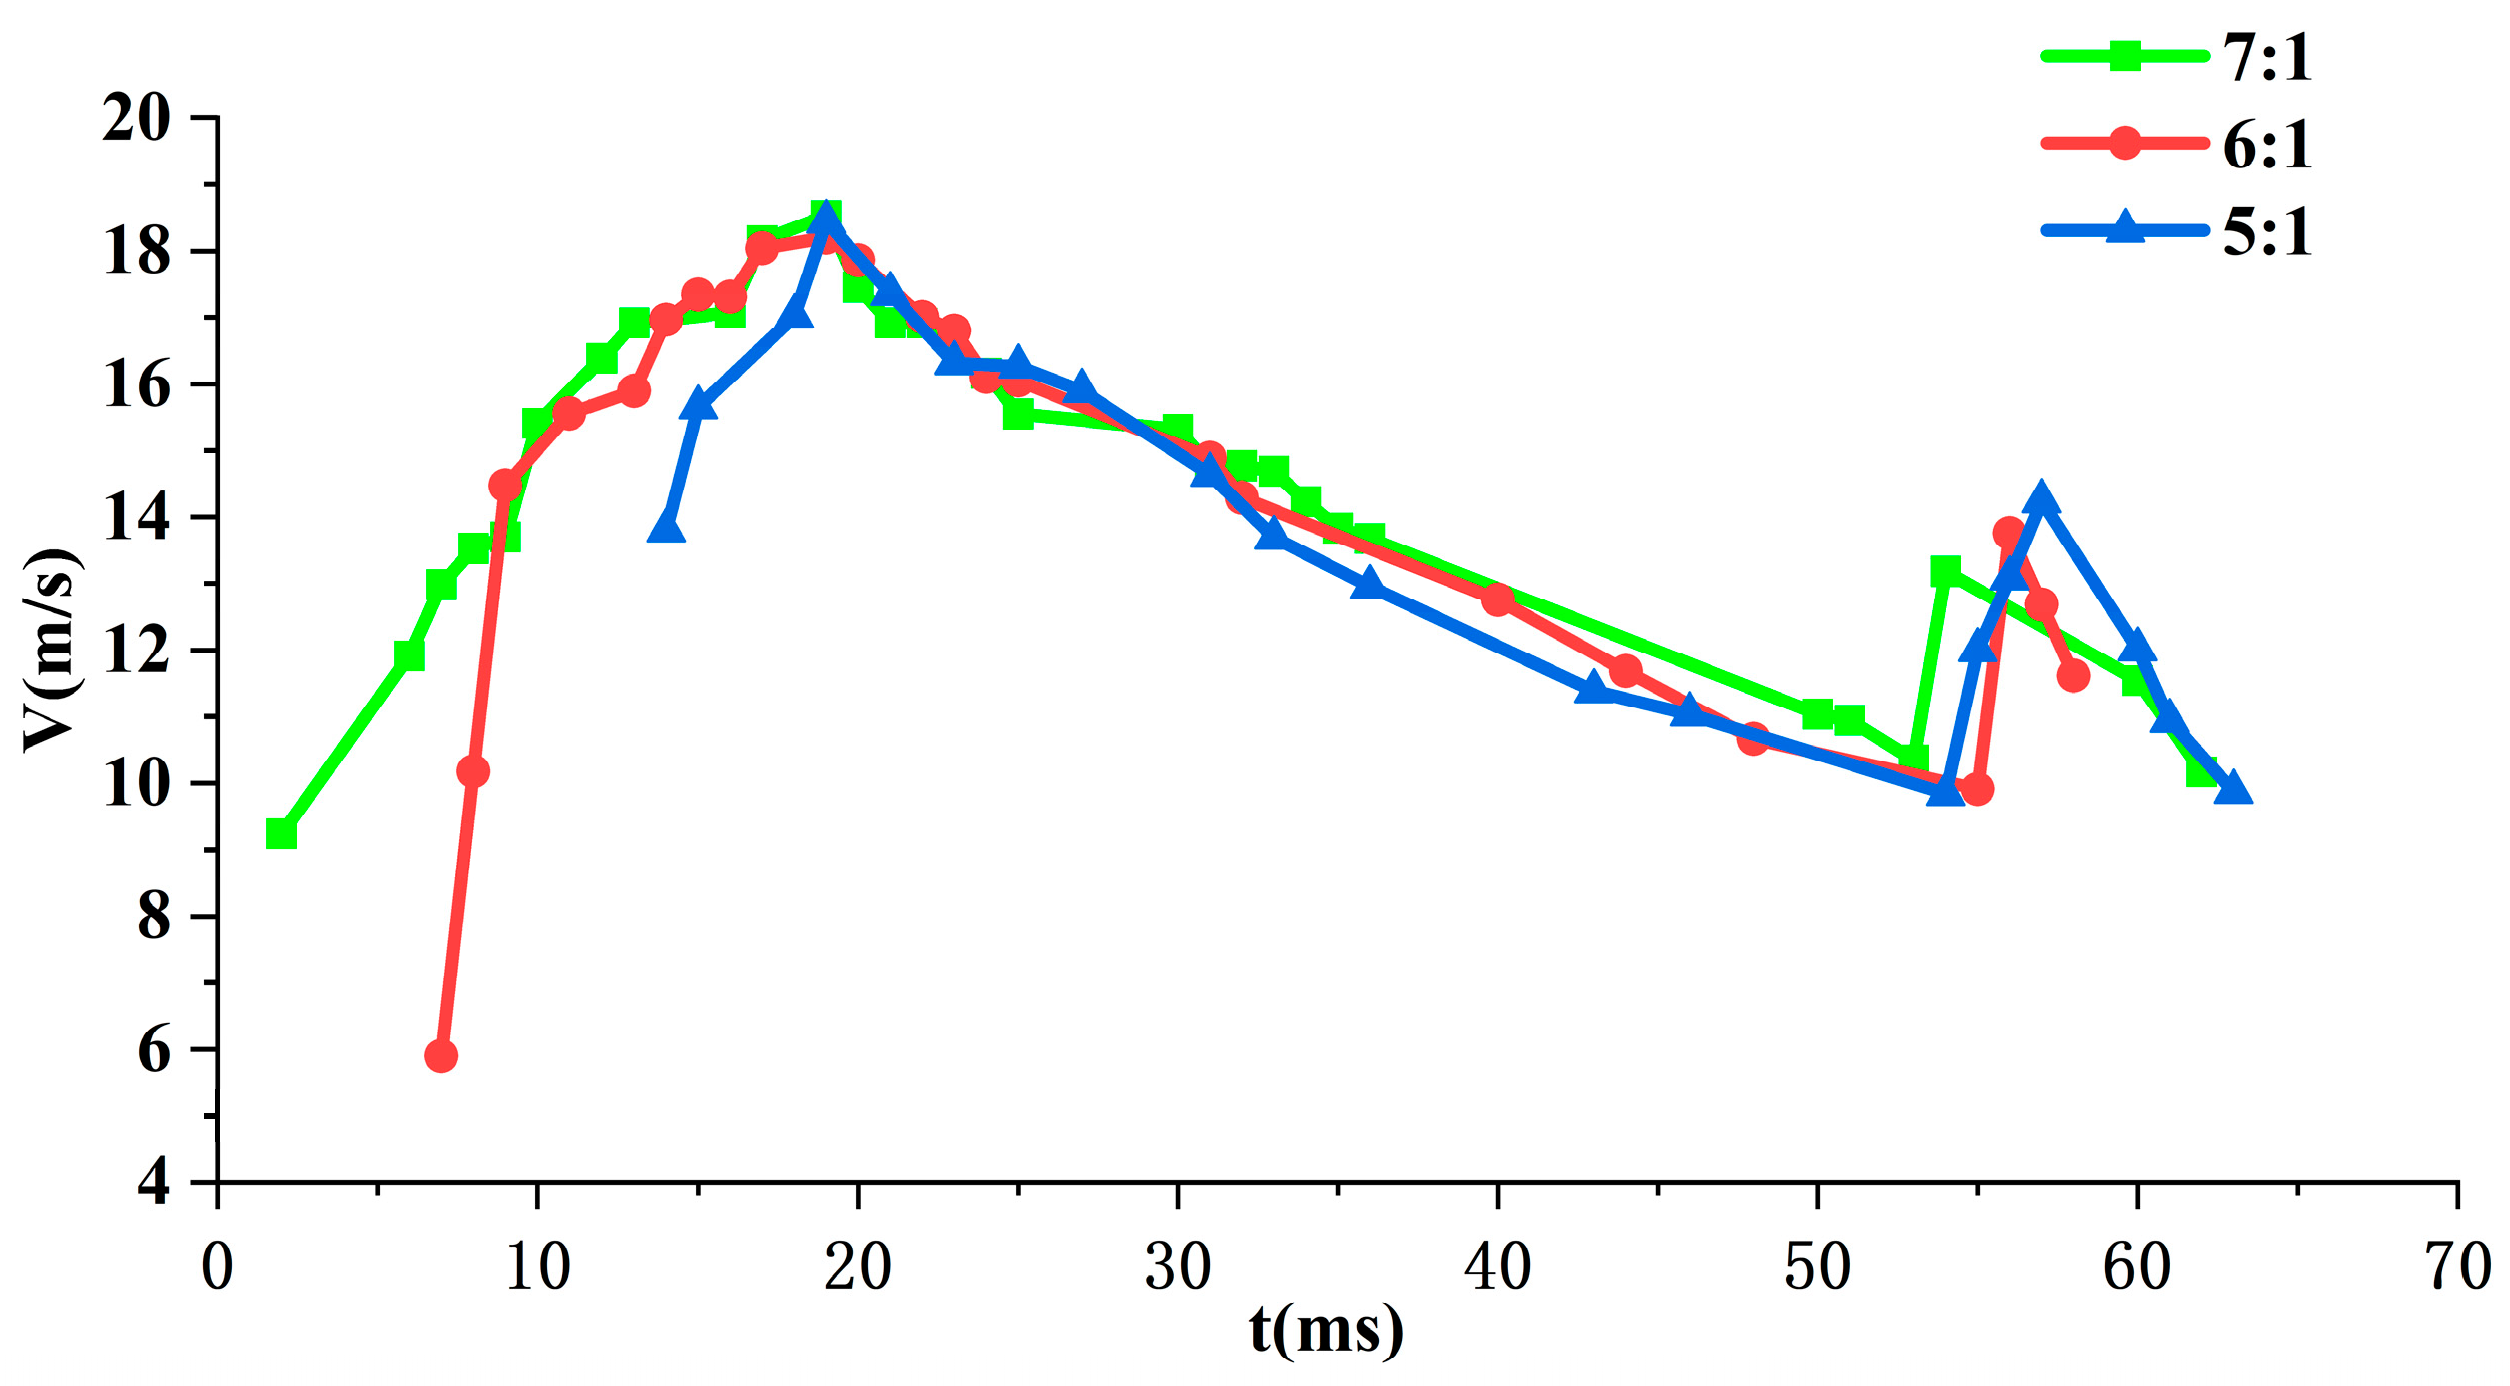
Figure 14.
Experimental images during water-exit for Case 11.
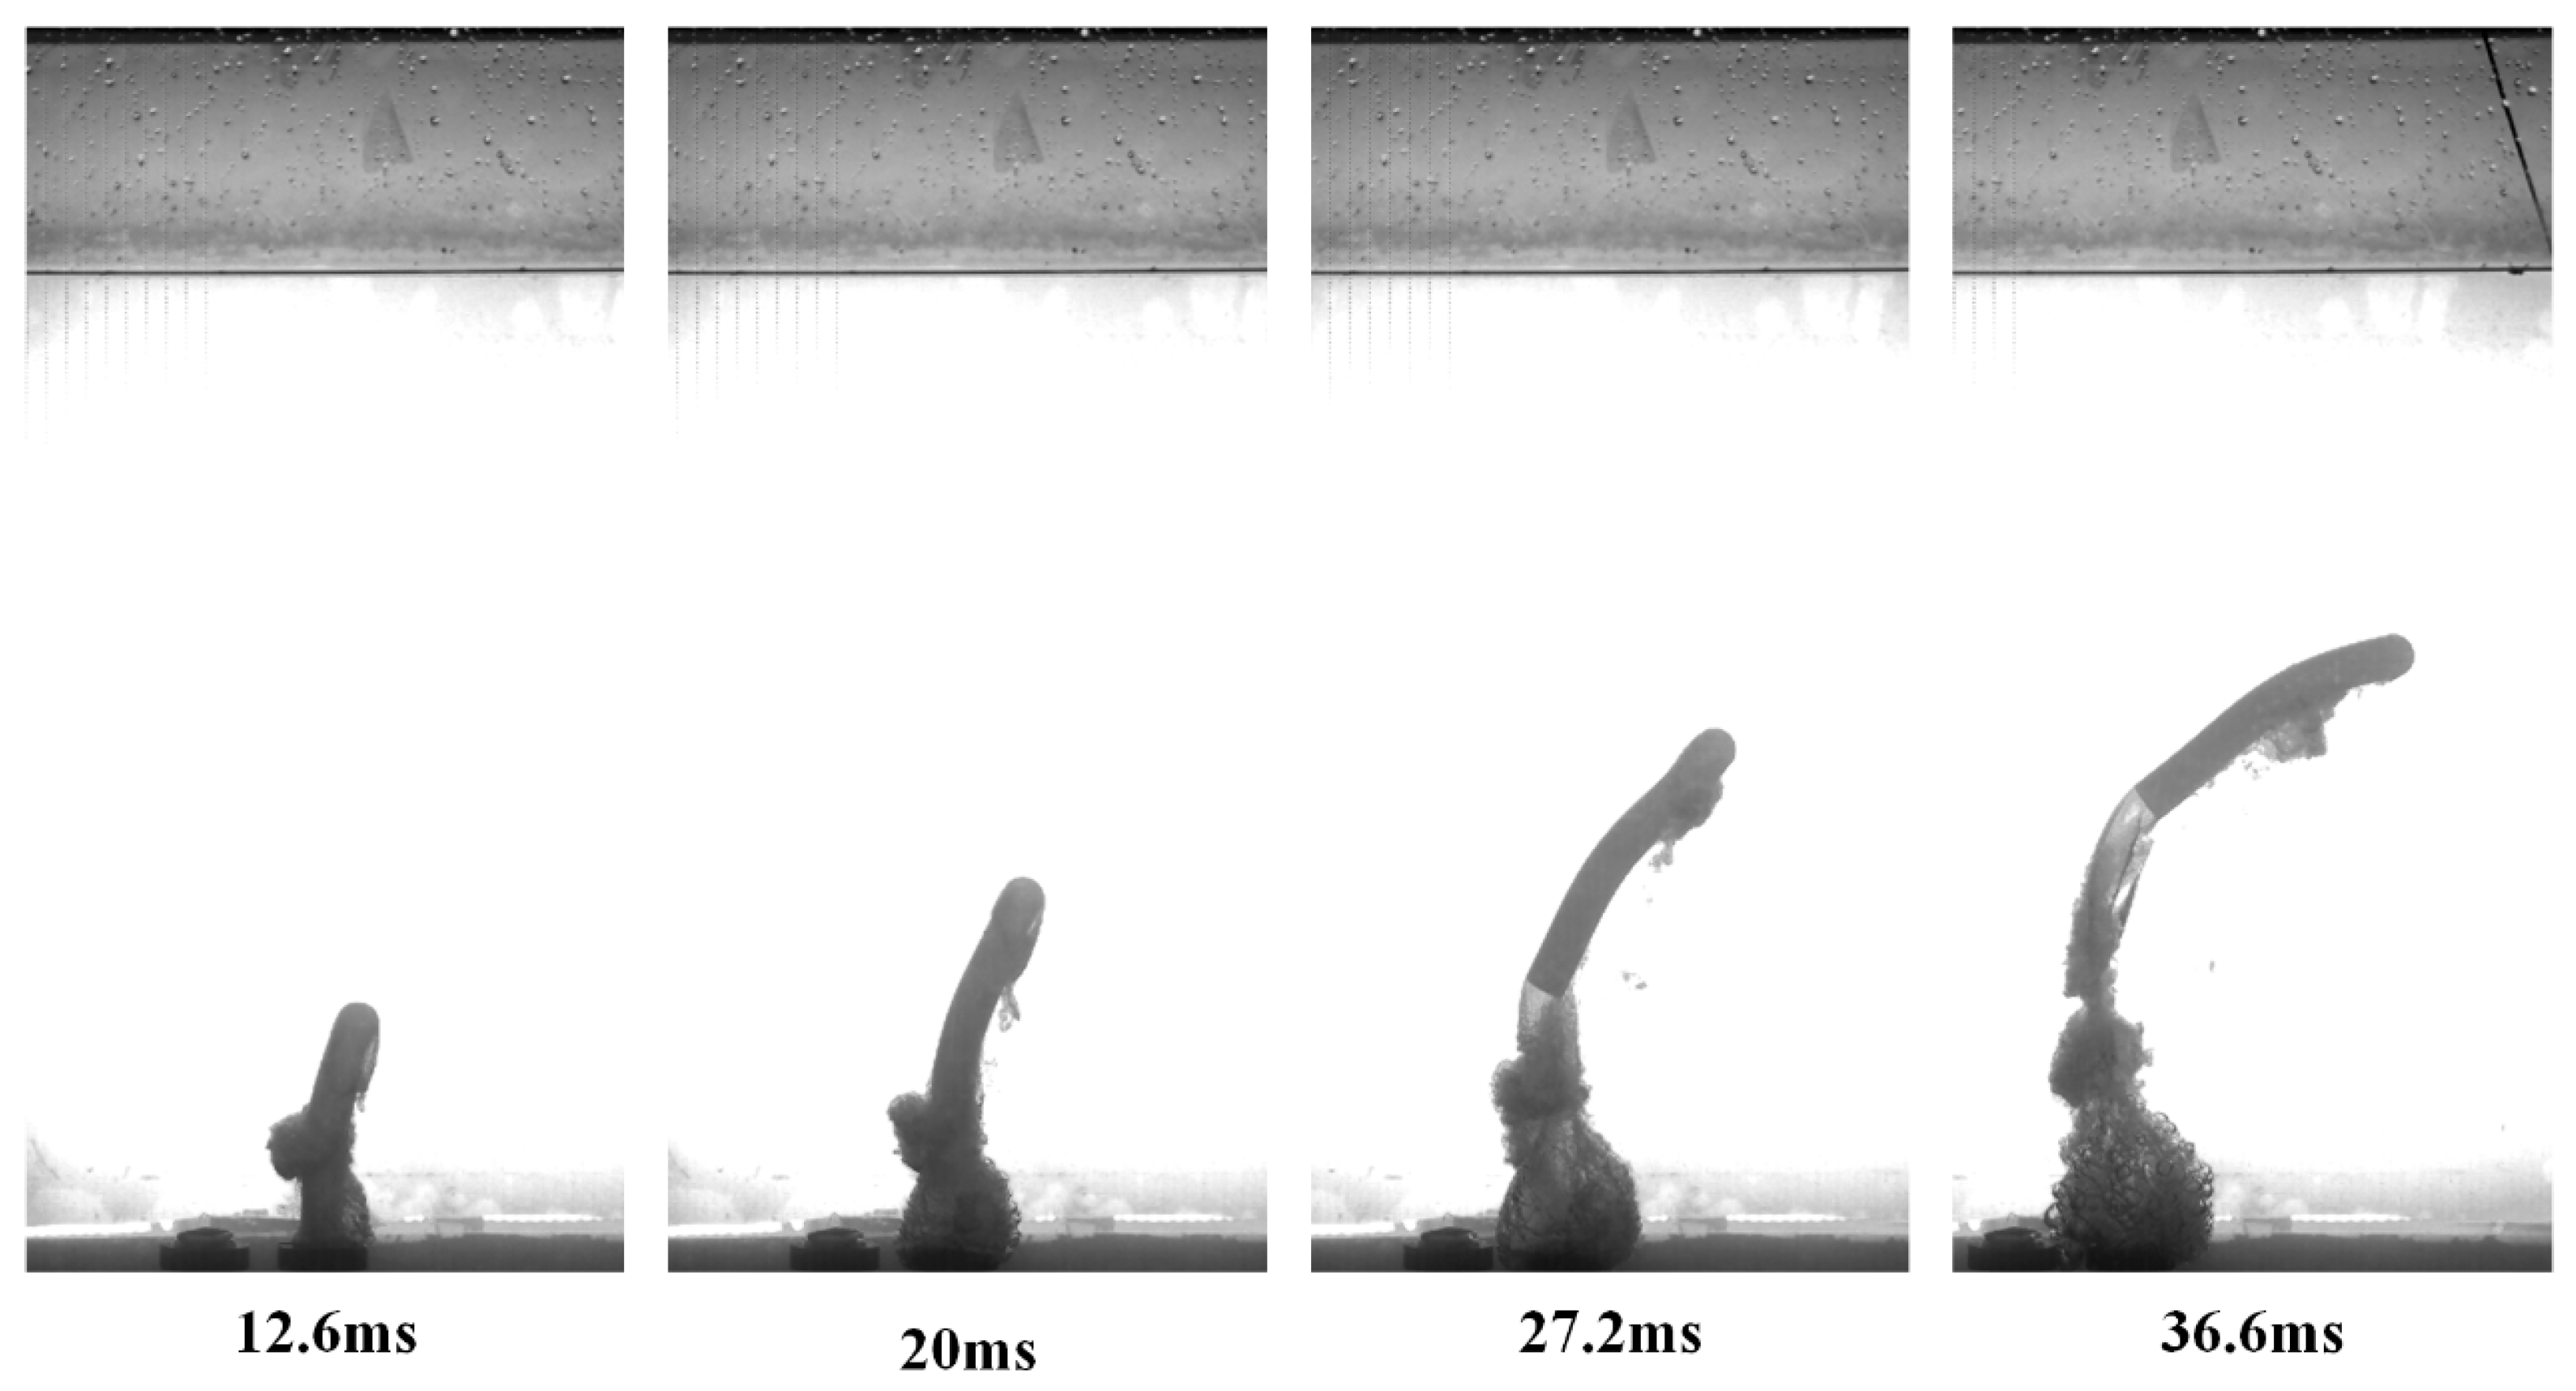
Figure 15.
Experimental images during water-exit for Case 12.
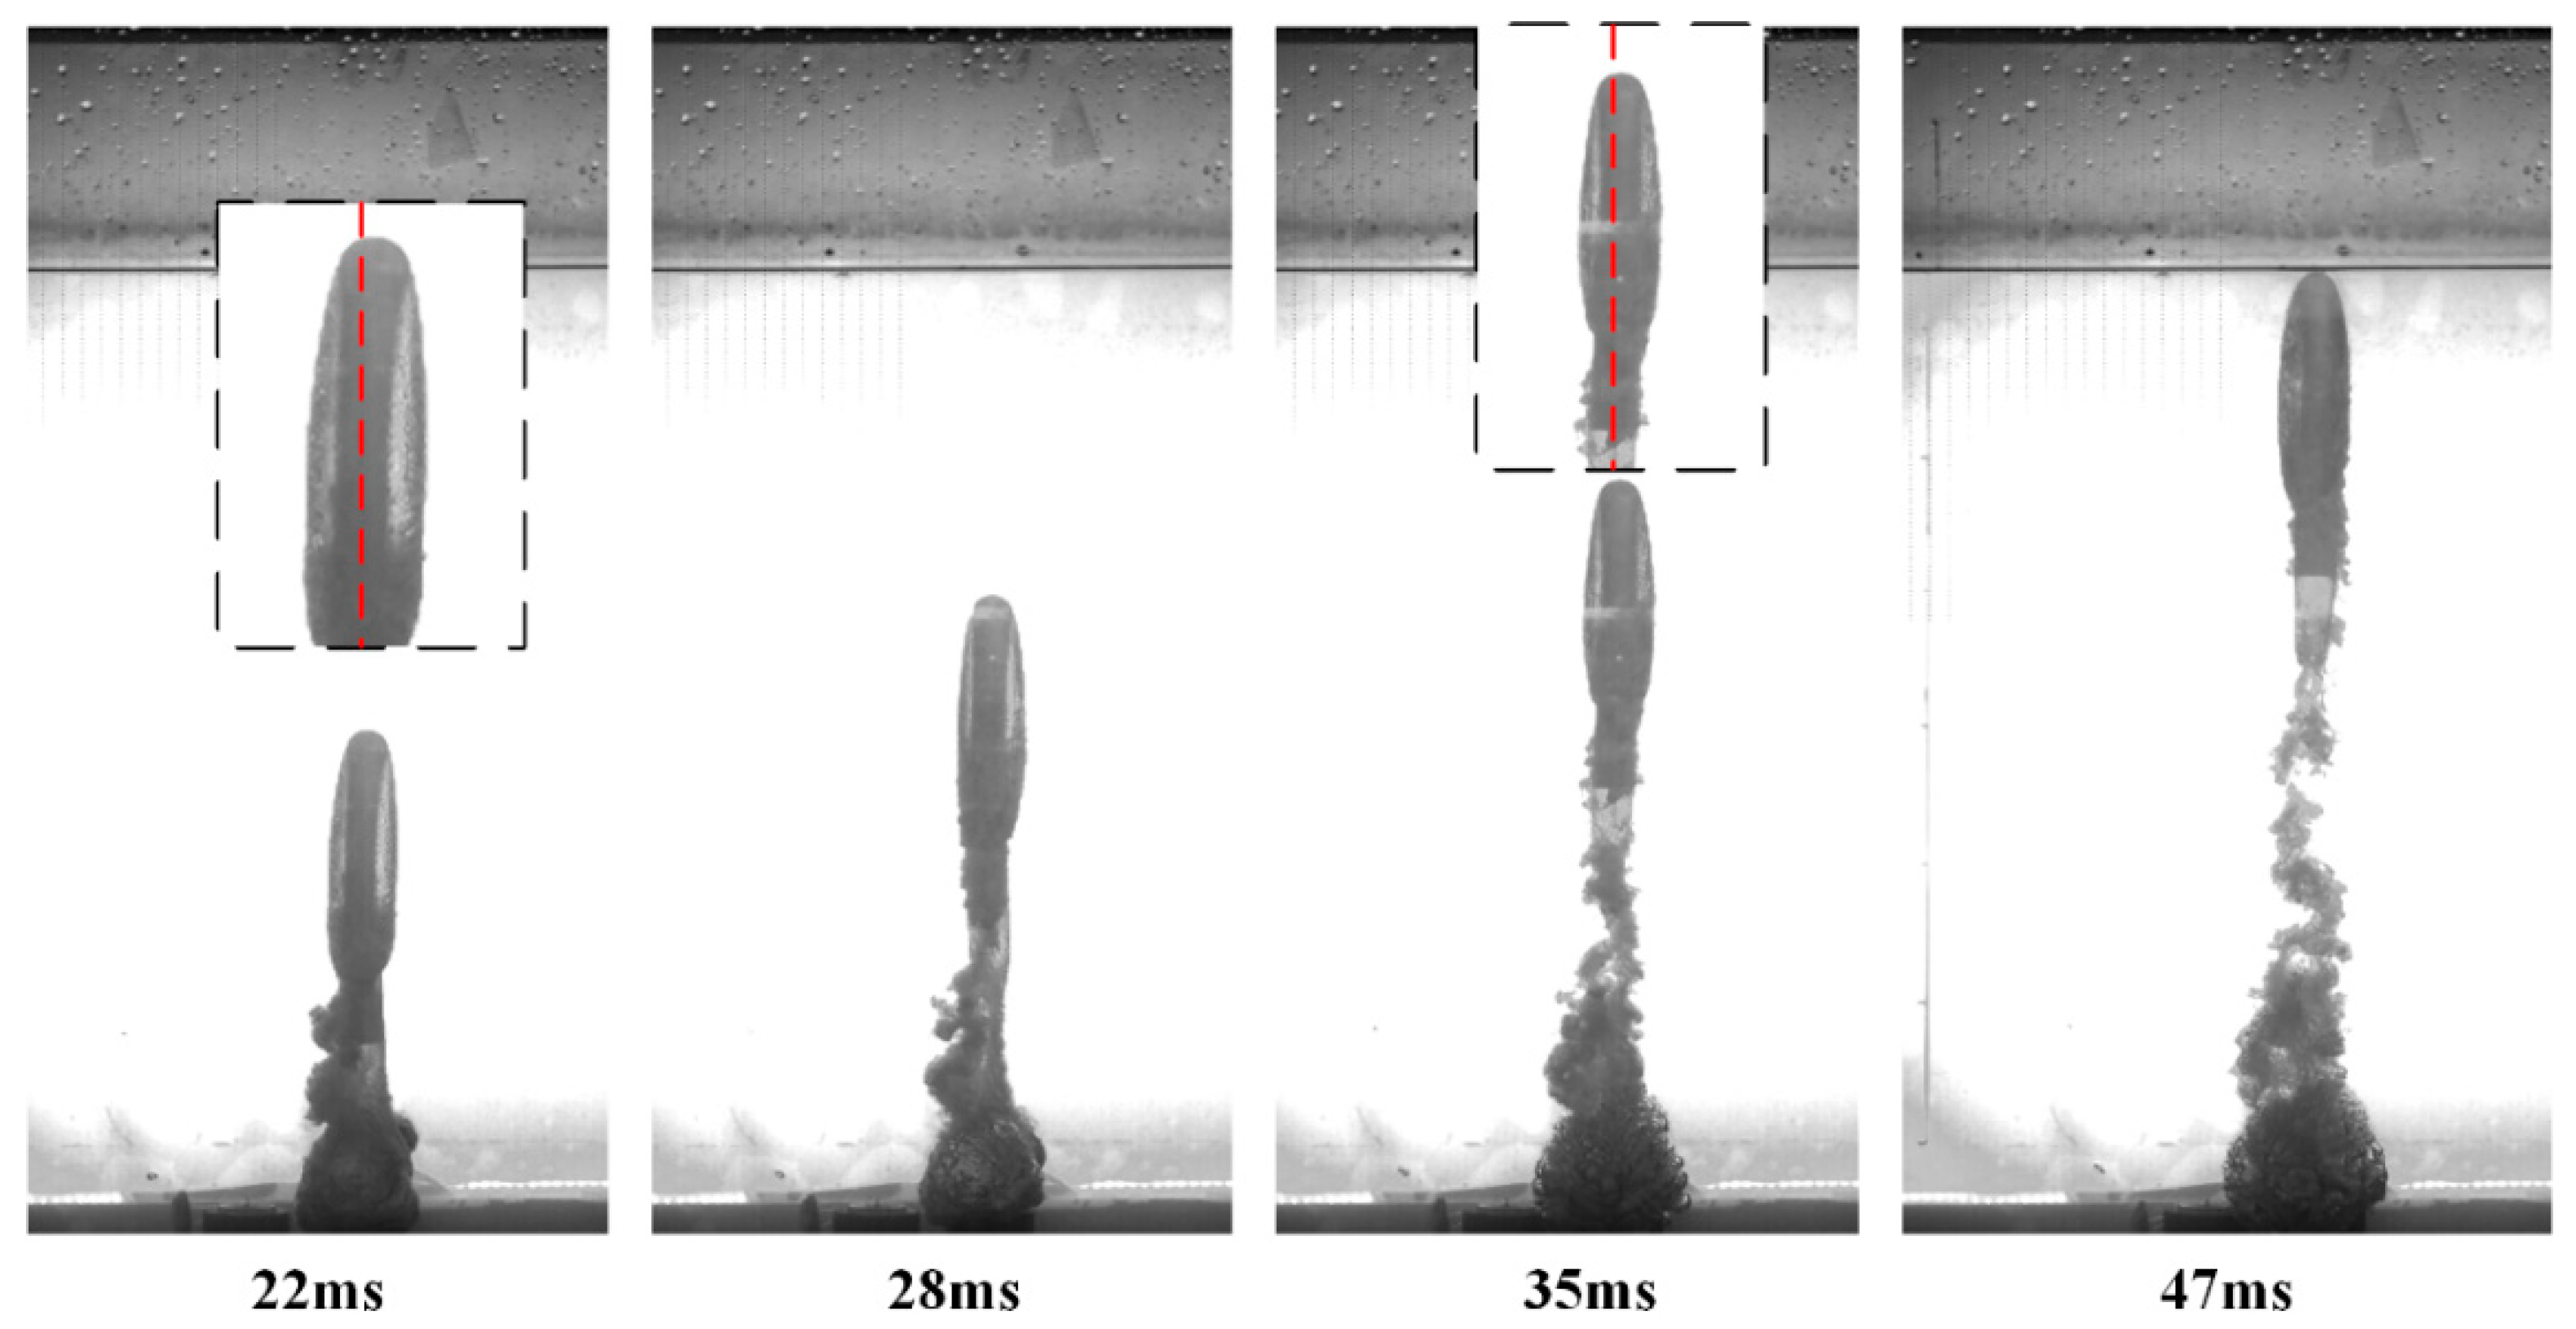
Figure 16.
Experimental images during water-exit for Case 13.
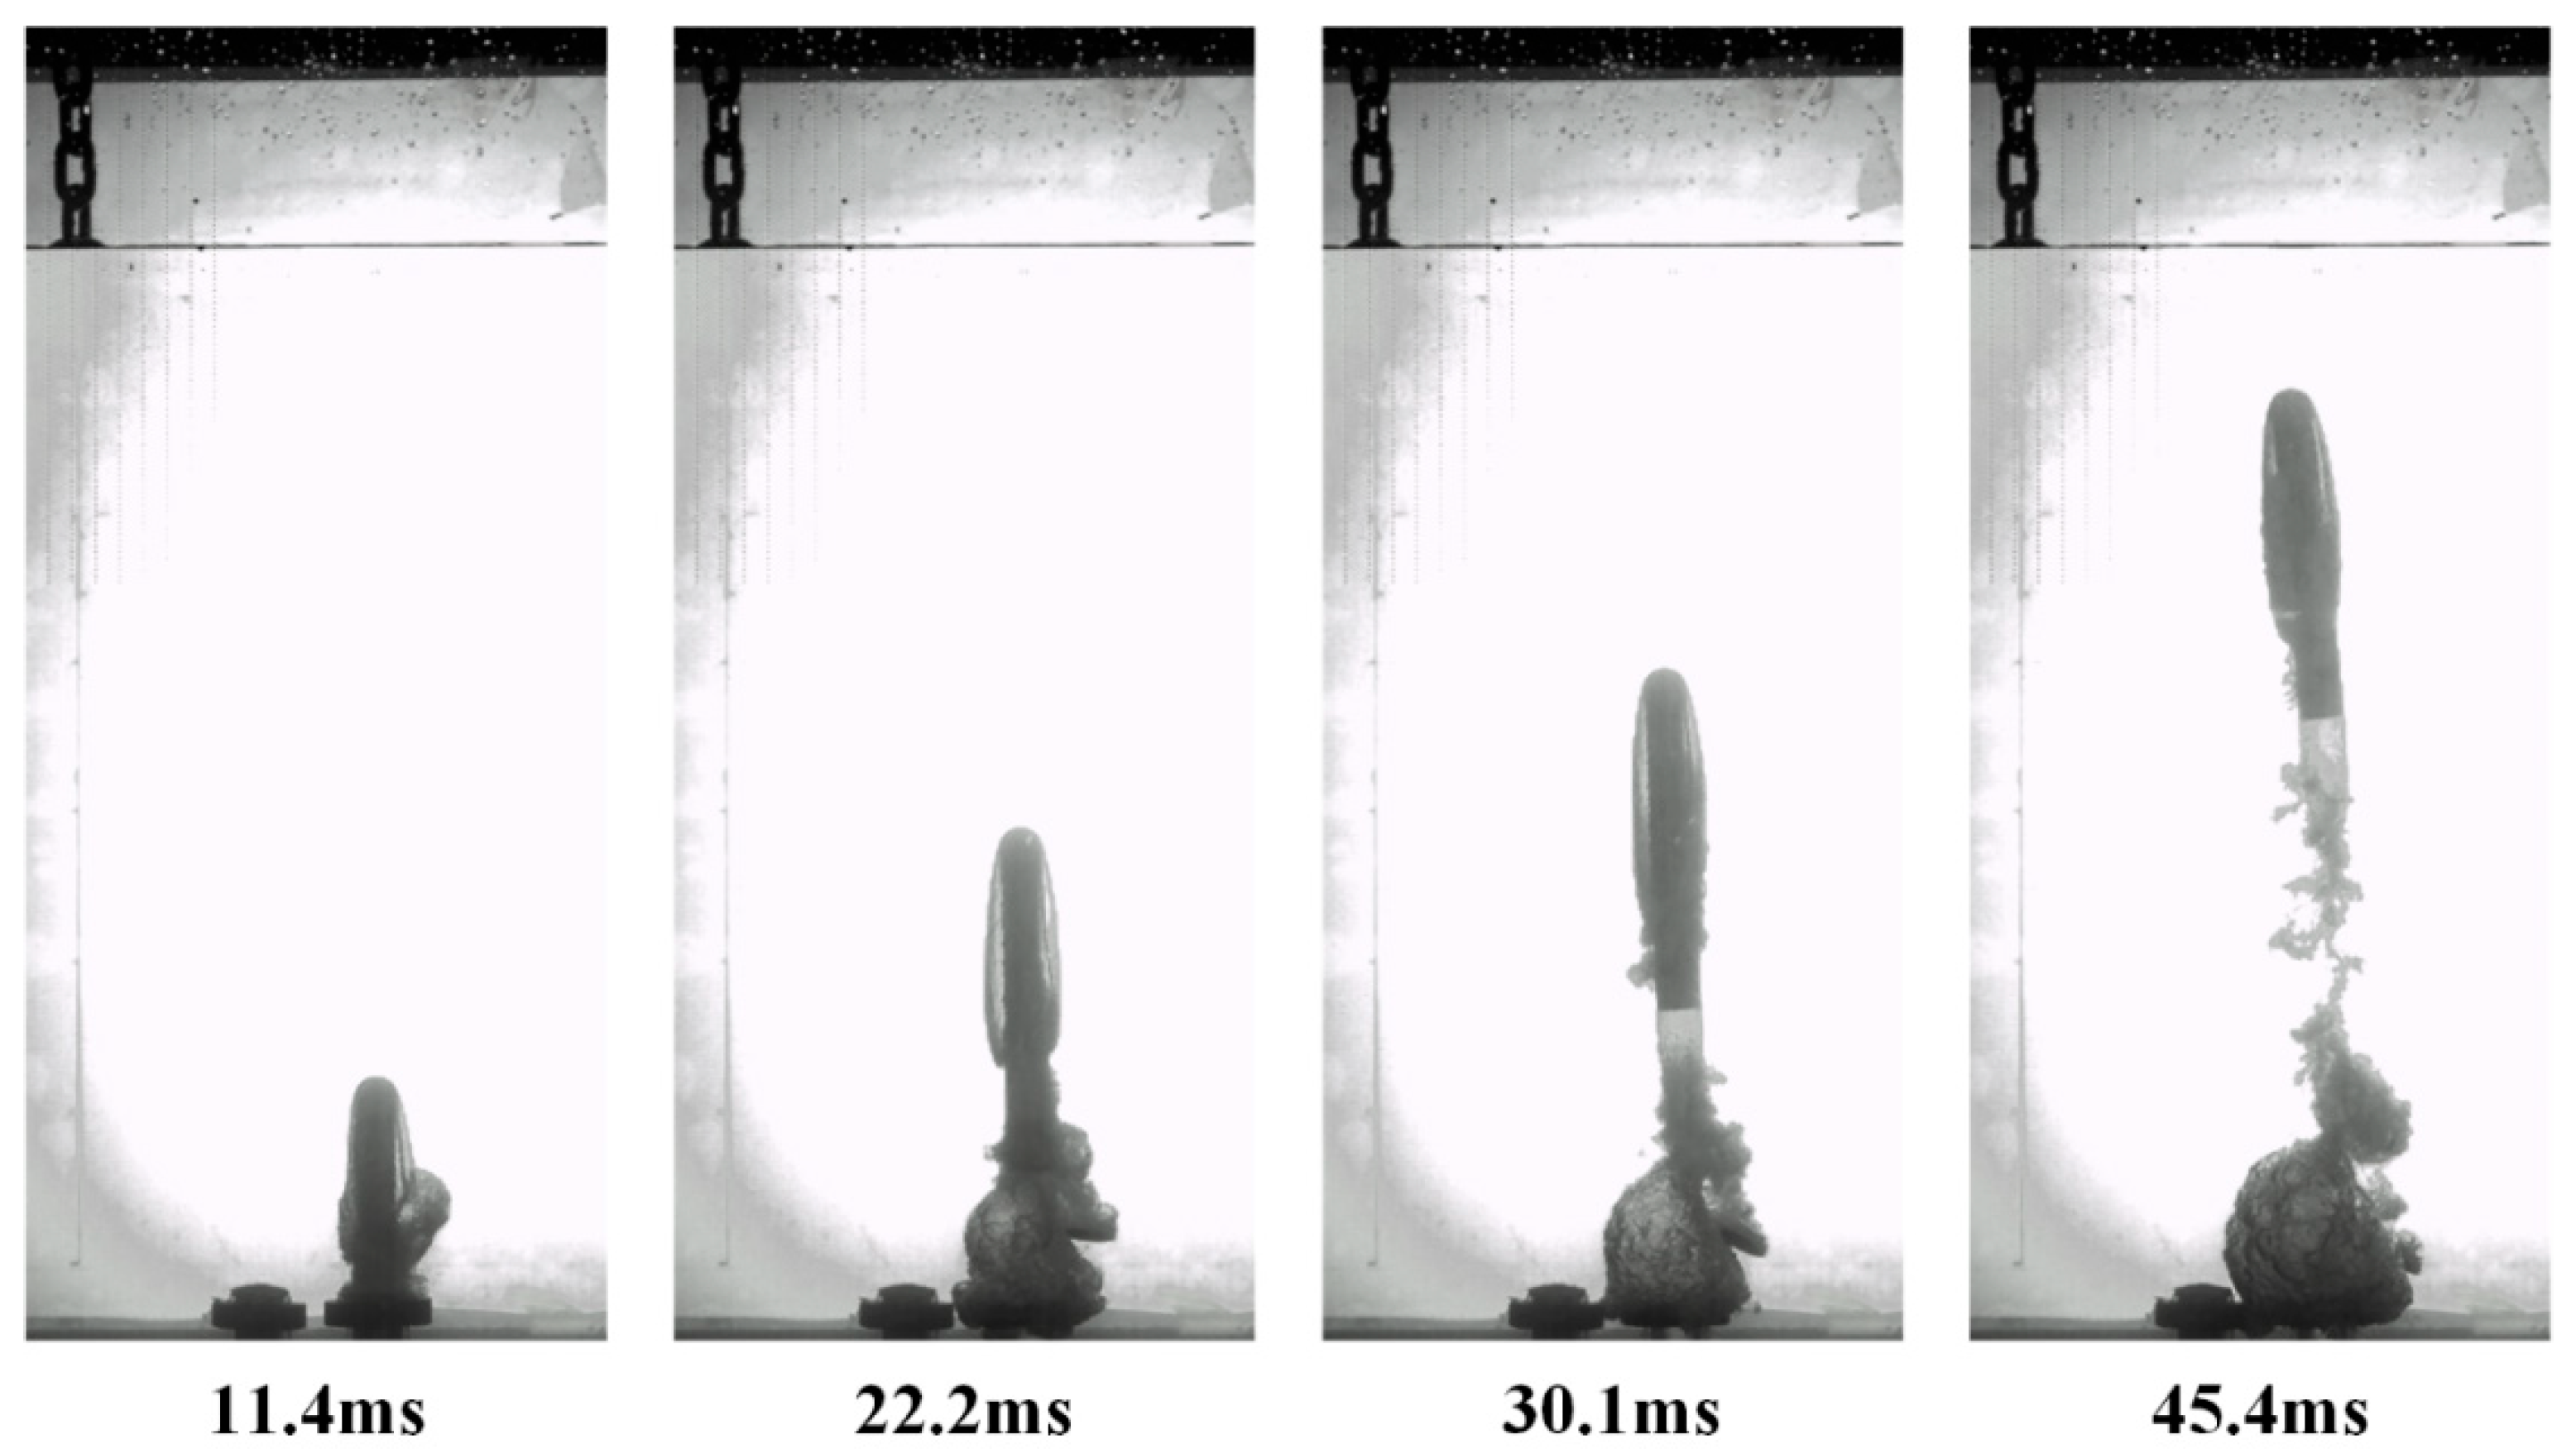

Table 1.
Parameters of six slender bodies with different head shapes and length-to-diameter ratios.
| Number | Material | Head shape | Length (mm) | Mass (g) | Center of mass position (distance from bottom)(mm) |
|---|---|---|---|---|---|
| No.1 | High-toughness resin | Conical head | 210 | 148.1 | 94 |
| No.2 | Conical head | 210 | 148.5 | 93 | |
| No.3 | Short truncated cone head |
210 | 148.1 | 94 | |
| No.4 | Long truncated cone head |
210 | 148.1 | 94 | |
| No.5 | 180 | 145.5 | 80 | ||
| No.6 | 150 | 143.6 | 68 |
Table 2.
Parameters of elastic spherical-headed slender bodies.
| Number | Material | head shape | Elastic moduli (MPa) | Poisson's ratio | Length (mm) | Mass (g) | Center of mass position (distance from bottom)(mm) |
|---|---|---|---|---|---|---|---|
| No.7 | PU 8400 rubber | Spherical head | 227.36 | 0.232 | 210 | 148.5 | 93 |
| No.8 | 253.02 | 0.365 | 210 | 148.5 | 93 | ||
| No.9 | 279.14 | 0.466 | 210 | 148.5 | 93 |
Table 3.
Overview of experimental conditions for conical-headed slender body at different velocities.
Table 3.
Overview of experimental conditions for conical-headed slender body at different velocities.
| Number | Head shape | Water depth (mm) | Pressure (MPa) | Ejection velocity (m/s) | Center of mass position (distance from bottom)(mm) |
|---|---|---|---|---|---|
| Case 1 | No.1 | 650 | 0.2 | 7.24 | 3.775 |
| Case 2 | No.1 | 650 | 0.4 | 13.04 | 1.164 |
| Case 3 | No.1 | 650 | 0.7 | 17.93 | 0.616 |
Table 4.
Drag coefficients at different ejection velocities.
| Number | Head shape | Ejection velocity (m/s) | |
|---|---|---|---|
| Case 1 | No.1 | 7.24 | 0.35 |
| Case 2 | No.1 | 13.04 | 0.25 |
| Case 3 | No.1 | 17.933 | 0.16 |
Table 5.
Experimental conditions for different head shapes.
| Number | Head shape | Water Depth (mm) | Pressure (MPa) | Ejection Velocity (m/s) | Cavitation Number |
| Case 4 | No.1 | 650 | 0.7 | 17.93 | 0.615 |
| Case 5 | No.2 | 650 | 0.7 | 18.29 | 0.591 |
| Case 6 | No.3 | 650 | 0.7 | 17.99 | 0.611 |
| Case 7 | No.4 | 650 | 0.7 | 18.53 | 0.576 |
Table 6.
Drag coefficients for different head shapes.
| Number | Head shape | Ejection velocity(m/s) | Drag Coefficient |
| Case 4 | No.1 | 17.93 | 0.16 |
| Case 5 | No.2 | 18.29 | 0.18 |
| Case 6 | No.3 | 17.99 | 0.27 |
| Case 7 | No.4 | 18.53 | 0.18 |
Table 7.
Experimental conditions for different length-to-diameter ratios.
| Number | Head shape | Water Depth (mm) | Length-to-Diameter Ratio | Pressure (MPa) | Ejection Velocity (m/s) | Cavitation Number |
| Case 8 | No.4 | 650 | 7:1 | 0.7 | 18.53 | 0.576 |
| Case 9 | No.5 | 650 | 6:1 | 0.7 | 18.2 | 0.598 |
| Case 10 | No.6 | 650 | 5:1 | 0.7 | 18.44 | 0.582 |
Table 8.
Experimental conditions for slender bodies with different elastic moduli.
| Number | Head shape | Young's Moduli (Mpa) | Poisson's Ratio | Water Depth (mm) | Pressure (MPa) | Ejection Velocity (m/s) | Cavitation Number |
| Case 11 | No.7 | 227.36 | 0.232 | 650 | 0.4 | 12.89 | 1.191 |
| Case 12 | No.8 | 253.02 | 0.365 | 650 | 0.4 | 13.14 | 1.147 |
| Case 13 | No.9 | 279.14 | 0.466 | 650 | 0.4 | 13.05 | 1.163 |
Disclaimer/Publisher’s Note: The statements, opinions and data contained in all publications are solely those of the individual author(s) and contributor(s) and not of MDPI and/or the editor(s). MDPI and/or the editor(s) disclaim responsibility for any injury to people or property resulting from any ideas, methods, instructions or products referred to in the content. |
© 2025 by the authors. Licensee MDPI, Basel, Switzerland. This article is an open access article distributed under the terms and conditions of the Creative Commons Attribution (CC BY) license (http://creativecommons.org/licenses/by/4.0/).
Copyright: This open access article is published under a Creative Commons CC BY 4.0 license, which permit the free download, distribution, and reuse, provided that the author and preprint are cited in any reuse.


