
Submitted:
26 January 2025
Posted:
27 January 2025
You are already at the latest version
Abstract
Jet pumps are widely used in various industrial and commercial applications, including aircraft fuel jettison systems, chemical plants, refineries, and water treatment facilities. This study examines the correlation between laboratory experiments on jet pumps and computer-based analyses. We conducted a total of 108 fuel flow experiments under pre-assigned parameters for suction lifts, pressures, and nozzle lengths, using water as the testing medium. Each measurement was taken in three separate trials to ensure the results were averaged mathematically. In the computer-based tests, Bernoulli’s principle and the mass continuity law were expertly translated into code. The results from these simulations were then compared with the experimental measurements to verify their accuracy. The study concluded that there is a linear relationship between the nozzle length, suction lift, and flow rate, as anticipated in accordance with the Venturi effect. Additionally, it was observed that the flow rate increased with a decrease in suction lift, an increase in nozzle length, and an increase in pressure. Conversely, the lowest flow rate was recorded when the highest suction lift, the shortest nozzle length, and the lowest pressure were employed.
Keywords:
Jet pump
; Flow rate
; Nozzle length
; Flow pressure
; Suction lift
1. Introduction
Jet pumps are highly efficient devices that utilize the kinetic energy of a fluid to move liquids, granular solids, and gases. They play a vital role in various industrial processes due to their effectiveness and versatility as fluid pumps. Additionally, jet pumps offer several advantages, including the fact that they do not require lubrication and can be made from a variety of materials such as steel, aluminum, and composites. They can be used independently or as a pre-conditioner for another pump. Besides, the jet pumps have a simple structure and are highly practical, with no moving parts, enhancing redundancy. A jet pump’s ingenious mechanism comprises three vital components: a nozzle, throat, and diffuser, as illustrated in Figure 1.
In the available literature, researchers have explored the performance and behavior of jet pumps through both computational and experimental investigations. By validating and refining computational models with experimental data, they enhance the accuracy of simulations, ensuring that predicted performance closely aligns with real-world observations. The combination of experimental and computational research improves the understanding of jet pump functionality and helps identify methods to optimize their design. Additionally, some researchers have conducted experiments with water jet pumps to determine the ideal dimensions and operational characteristics. For example, Aissa et al. [3] investigated a water jet pump to identify the optimal dimensions for such pumps. Their study concluded that increasing the driving pressure results in a higher flow rate at maximum efficiency. Other experiments by Gazzar and Gehmlich also provided valuable insights into the operation of water jet pumps and contributed to identifying ideal dimensions for maximum efficiency [4,5]. Furthermore, Han et al. [6] conducted computer analyses using computational fluid dynamics (CFD), a method frequently used for designing and developing jet pumps, building on previous experimental research. Fan et al. [7] evaluated the effectiveness of ejectors in refrigeration applications by performing CFD analysis and optimizing jet pump design through numerical simulations. Their study highlighted the ability of CFD analysis to improve pump performance and demonstrated its value in optimizing jet pump designs.
To better understand the capabilities and performance of jet pumps under various operating conditions, both experimental and computational research is being conducted on jet pumps with different suction lifts, pressures, and nozzle lengths, as demonstrated by Cable et al. [8]. This study will investigate how water jets penetrate aquifer matrices and saturated sediments, considering factors such as injection duration, nozzle size, and pressure on the distribution and efficiency of amendments in subsurface and intertidal sediments.
In conclusion, extensive computational and experimental studies have been conducted to enhance the efficiency of jet pumps by gaining insights into the complex fluid dynamics involved. However, previous investigations have largely relied on either experimental or computational methods, often constrained by specific limitations. For instance, Chaoqun et al. [9] focused solely on two-phase flow, while Xu et al. [10] utilized the Kriging model.
The novelty of this study lies in achieving coherent and understandable results that integrate jet pump laboratory experiments with computer-based calculations while varying significant parameters such as pressure, nozzle length, and suction lift. The existing literature shows a lack of in-depth analysis, which this research aims to address.
This study will contribute to advancements in jet pump technology and its applications by filling these knowledge gaps. Furthermore, it seeks to deepen the understanding of the variables affecting the efficiency and performance of jet pumps, ultimately enhancing knowledge of their capabilities in various operating environments. A strong recommendation and hypothesis will be provided based on the findings from both the experiments and computational studies.
2. Materials and Methods
As shown in Figure 2, the diffuser causes a gradual decrease in fluid velocity, increasing pressure energy. This decrease, in turn, results in an increased pressure of the mixed fluid at the end of discharge from the pump. After the mixing chamber, the mixed fluid expands, causing its velocity to decrease. This process causes the mixed fluids to recompress, effectively converting velocity energy back into pressure energy.
This paper uses a computational analysis based on the 108 experiments performed with three jet pump types. During the correspondent author's master's study, a computational study was not accomplished because of a lack of available computer-based analysis. However, in time, many fluid dynamics CFD software solutions, such as Matlab (Mathworks, USA), were developed, providing an opportunity to verify the experiments that had been executed previously.
2.1. Theoretical Foundations of the Experiments
Two important physics principles are essential for understanding how a jet pump works: the principle of mass continuity and Bernoulli's law. Additionally, the Venturi effect, a common occurrence related to the mass continuity principle and Bernoulli's law, was taken into account while conducting experiments and preparing Matlab code.
2.1.1. Bernoulli’s Law
Bernoulli's law states that fluid flows from one point to another in a piping system, and jet-pump theory can be described using the Bernoulli equation in Equation (1).
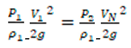
where P1 is the static pressure in the opposite direction of the flow, P2 is the static pressure at the outlet of the nozzle, V1 is the velocity in the opposite direction of the flow, VN is the velocity in the orifice, and ρ1 is the density of the fluid, which is water in this study. In the flow of the nozzle in the opposite direction to the current, it can be thought that all the energy is static. With this assumption, V1 can be neglected. In the latest form, Equation (1) can be written as given in Equation (2);
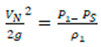
Equation (2) can be described as "head of working". The same principles apply to mixed flow through the diffuser, except that the effect at the nozzle is opposite. In this situation, Equation (3) can be written in the form as follows;
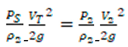 where PS is the static pressure in the suction section, P2 is the static pressure in the discharge section, VT is the velocity in the throat, V2 is the velocity in the same direction of the flow, ρ2 is the density of the mixed fluid, which is the mixture of water and air in this study. The velocity in the discharge section can be accepted and converted to a static head. In this situation, V2 = 0, and Equation (4) is calculated as follows:
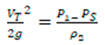
It is called a discharge head. The term "discharge head" describes the pump's pressure to transport liquid from the pump output (discharge) to the desired location. When selecting or utilizing a jet pump, its ability to overcome resistance and move water through a pipeline or lift it against gravity.
Head ratio (RH) can be calculated using equations (2) and (4) as provided in Equation (5).
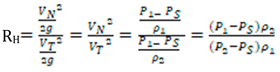
The head ratio decreases with increasing suction capacity [11], as described in Equation (5).
In a jet pump system, the "head ratio" often refers to the ratio between the outlet pressure head and the inlet pressure head. The "discharge head" determines the fluid flow rate through a jet pump. As the head ratio increases, the flow rate also increases. A higher head ratio results in faster fluid movement, increasing the amount of fluid that can be moved in a given period. Moreover, the pump's efficiency improves due to a higher head ratio, allowing more fluid to be moved with the same amount of energy. Notably, the ratio of the outlet pressure to the inlet pressure is an essential factor that affects the flow characteristics of a pump. When the outlet pressure of a jet pump increases relative to the inlet pressure, it can create a problem known as a "backpressure-induced stall." This phenomenon happens because the jet's thrust force needs to be greater than the backpressure force at the pump outlet to maintain flow. If the outlet pressure becomes too high, it can cause the flow to stall or even reverse, which is generally undesirable in most applications since it reduces the pump's efficiency and effectiveness [12].
2.1.2. Mass Continuity
The conservation of mass or any other conserved quantity inside a system is expressed by the continuity equation, commonly called the transport equation, a fundamental principle in physics and engineering. It is a partial differential equation that illustrates the movement or conservation of a quantity (such as mass, fluid, or energy) in a specific domain over time. All kinds of flows, including compressible, incompressible, Newtonian, and non-Newtonian flows, are covered by the continuity, namely the transport principle. According to the stated principle, fluid is conserved in a flow when the difference between the flow rates at entry and exit equals the mass rate.
The continuity equation can be stated in a general form as provided in Equation (6):
where ρ/∂t represents the partial derivative of the quantity ρ concerning time t, indicating the rate of change in the amount with time.
∂ρ/∂t + ∇ · (ρv) = 0
∇ · (ρv) is the flux density vector ρv divergence, representing the quantity's flow or transport through the domain. The dot product of the gradient operator ∇ and the vector ρv yields the divergence of the vector field, which essentially measures the net flow of the quantity out of or into a small volume element in the domain. ρ is the density of the conserved quantity, which may vary across the domain. v is the velocity vector field that describes the flow or transport velocity of the quantity. It is used when the quantity is transported as a fluid-like flow, such as in fluid dynamics. In addition, this term can represent other transport mechanisms such as electric current in electromagnetism.
The continuity equation guarantees that the total amount of the conserved quantity within a specific closed domain will remain constant throughout time. The behavior of the conserved quantity in the system under investigation can be examined and predicted by solving the continuity equation with the proper initial and boundary conditions. The mass continuity equation, namely the conversation of mass, can be given in Equation (7) also:
where ρ is the density (gr/cm3), A is the friction surface (cm2), and V is the velocity (m/sn)
(ρ x A x V)1 = (ρ x A x V)2
2.1.3. Venturi Effect
The Venturi effect is a phenomenon that occurs when a fluid passes through a constriction or narrowing in a pipe. This narrowing causes the velocity of the fluid to increase while the pressure decreases. The Venturi effect results from the mass continuity principle, which states that the mass flow rate of fluid remains constant across any cross-sectional area in an enclosed system. Bernoulli’s law is also closely related to the Venturi effect. It states that the pressure decreases as the fluid's velocity increases and vice versa.
The relationship between the Venturi effect, the Mass continuity principle, and the Bernoulli Principle can be understood as follows: When a fluid flows through a constriction, like in the case of the Venturi effect, it experiences an increase in velocity, which is under the Mass continuity principle, indicating that the mass flow rate of fluid remains constant. According to Bernoulli’s law, the pressure decreases as the fluid's velocity increases. Therefore, the Venturi effect results from the combined effects of the Mass Continuity and Bernoulli’s law.
3. Experiments
The experiments were conducted using a laboratory-scale jet pump setup consisting of a high-pressure air supply, a water tank where the media is sucked, different suction pipes, and a flowmeter. The nozzle was connected to a high-pressure air supply, while the suction line was connected to the water tank. The flowmeter was installed at the diffuser outlet to measure the volume of the transferred water. The absolute outside pressure was 1 Atm, and the outside ambient temperature was 20 °C during the experiments. Three jet pumps were manufactured, and the nozzle lengths, suction lifts, and pressures were changed accordingly during experiment campaigns, as depicted in Figure 3.
The experiment was designed to precisely measure the net flow quantity under the varying conditions provided in the previous section. The motivation was to determine the net flow quantities for different suction lifts, pressures, and nozzle lengths and their impact on these variables.
Based on the nozzle length value, net flow quantity values are presented separately depending on the changes in pressure and suction lift values. Table 1. displays net flow quantity values for a 25 mm nozzle length based on changes in suction lift and pressure.
Notably, the net flow quaintness value varies between 9.9 lt/min and 0.7 lt/min, directly proportional to pressure and inversely proportional to suction lift, as presented in Figure 4.
This observation highlights the significant impact of pressure and suction lift on the net flow quaintness value. Pressure plays a crucial role in determining the movement of liquid, as seen by the direct proportionality with the net flow quaintness value. Higher pressure results in a higher net flow quaintness value, indicating a greater flow rate. A greater flow rate can be advantageous when a large volume of liquid needs to be moved quickly. On the other hand, if the pressure is too high, it can lead to potential damage to the system or result in inefficient usage of resources. Table 2. comprehensively represents the net flow quantity values for a 50 mm nozzle length.
The first stage of the experiment involved finding the flow rate for each set of parameters. To measure water flow, the precise amount of water moved within a specific timeframe was recorded. The findings demonstrated that the flow rate increased with the pressure for all three pumps. It's worth noting that the flow rate of a fluid through a nozzle will increase as pressure increases. This is because the velocity of the fluid through the nozzle also increases with pressure, resulting in a higher flow rate.
Achieving optimal results requires understanding the intricate relationship between pressure and suction lift. As seen in Figure 5. the net flow quaintness value varies between 10 lt/min and 1.2 Lt/min, determining that even the slightest changes can make a significant impact.
Similarly, suction lift, which refers to the vertical distance between the liquid level and the pump inlet, significantly impacts the net flow quaintness value. The inverse proportionality shows that a higher suction lift results in a lower net flow quaintness value. When the suction lift increases, the flow rate decreases. When the pump needs to move liquid from a lower level, it can considerably impact the system's efficiency. In such applications, the pump must work harder to overcome the gravitational force opposing the liquid flow. This added strain on the pump can lead to decreased efficiency, increased energy consumption, and reduced productivity. Therefore, it is crucial to consider the impact of lower-level liquid movement on the system's overall efficiency and take appropriate measures to optimize performance. Overall, the net flow quaintness value serves as an essential indicator of the effectiveness of a pumping system and can significantly vary based on the pressure and suction lift. Table 3 provides a comprehensive representation of net flow quantity values for a 75 mm nozzle length.
The data presented in Figure 6 provides a broad range of net flow rates, which vary from 10.8 lt/min to 1.5 lt/min. This significant variability underlines the significance of making even the slightest adjustments.
In the overall evaluation of the experiments, the findings demonstrated that when pressure and suction lift were extended, the efficiency of the 25 mm and 50 mm nozzle length pumps increased. Nevertheless, as pressure and suction lift increased, the efficiency of the 75 mm nozzle length pump decreased.
Notably, as the nozzle length increases, the fluid's velocity decreases, leading to a decrease in the flow rate. Due to this increase, the 75 mm pump did not respond to pressure, and the suction lift increased, unlike the other two pumps. Increasing the nozzle length causes increased frictional losses and decreased efficiency due to the greater surface area for fluid to travel through.
The findings also revealed that the 25 mm nozzle length pump was the most efficient out of the three pumps, followed by the 50 mm and 75 mm pumps, in that order. The shorter nozzle length has enhanced the fluid flow rate by reducing frictional losses. By optimizing the nozzle length further, you can drastically improve the overall performance. Additionally, the results demonstrated that the efficiency of all three pumps declined as the suction lift extended. In other words, when the suction lift increases, the pump's inlet pressure decreases, which lowers the fluid's velocity as it passes through the nozzle. The increase in suction lift reduces efficiency because it increases frictional losses and the flow rate.
In summary, the experiment's results demonstrate that nozzle lengths, pressures, and suction lifts impact jet pump performance, as shown in Figure 7. As the nozzle length and the pressure increase, the net flow quantity also increases.
Following experiments and data analysis, the most efficient pumps were found to have nozzle lengths of 25, 50, and 75 mm, respectively. Moreover, increasing the pressure and suction lift enhanced the flow rate and efficiency—apart from the 75 mm pump. This experiment highlights how important it is to choose the jet pump settings correctly to get optimal performance.
4. Computational Study
A computer analysis was conducted to establish a coherency between the laboratory behavior and computer-based results of the jet pump. Valuable insights were gathered before the simulation, which was performed using a Matlab model. The model considered the interaction between the net flow quantity and the pump components.
4.1. Boundary Conditions
Optimizing jet pump performance requires boundary conditions that match the experiment's operating conditions. With this regard, the density of the fluid being pumped was set to 1000 kg/m3, a standard value for water.
Another critical boundary condition selected for this study is the pump efficiency, which was assigned a value of one, indicating that the pump operates 100% efficiency. While this may only be partially realistic, it serves as a valuable baseline for understanding the effect of other variables, such as pipe length and fluid features, on the performance of the jet pump. Moreover, pump efficiency is a crucial factor in the overall performance of the pump, as it directly affects the amount of work required to pump the fluid. Therefore, setting this value to a constant ensures that the results obtained can be used to analyze and optimize the design of the jet pump under different conditions.
The pipe diameter used as a boundary condition for computations was 9/16". The diameter of the pipe is critical in determining the motive fluid's velocity and resulting pressure difference across the pump. The diameter of the pipe, on the other hand, plays a crucial role in converting the kinetic energy of the motive fluid into pressure energy. For computations, a specific nozzle and diffuser geometry were chosen, which resulted in a pipe diameter of 9/16". This value was the boundary condition in our Matlab calculations, ensuring consistency throughout the study.
4.2. The Matlab Code
The results of the experiments and the computer-based calculations were compared. The Matlab (MathWorks, USA) to determine the mathematical calculations. The following codes are used for the mathematical calculations and then verification of the experimental studies:
% Jet Pump Water Flow Model with Suction Lift and Nozzle Length
% Parameters
pump_efficiency = 1; % Efficiency of the jet pump
pipe_diameter = 0.0143; % Diameter of the pipe in meters
pipe_length = 1; % Length of the pipe in meters
suction_lift = 0.02; % Suction lift (vertical distance from the liquid source to the pump)
nozzle_length = 0.25; % Length of the nozzle in meters
fluid_density = 1000; % Fluid density in kg/m^3
% Initialize the initial inlet pressure and pump power
inlet_pressure_Pa = 0;
desired_pump_power = 0;
while inlet_pressure_Pa <= 300 && desired_pump_power <= 7000
% Increment the inlet pressure and pump power
inlet_pressure_Pa = inlet_pressure_Pa + 50;
desired_pump_power = desired_pump_power + 1000;
% Calculate effective inlet pressure, accounting for suction lift
effective_inlet_pressure = inlet_pressure_Pa + fluid_density * 9.81 * suction_lift;
% Calculate flow rate based on desired pump power and effective inlet pressure
calculated_flow_rate = (desired_pump_power / (pump_efficiency * effective_inlet_pressure));
% Add nozzle length to flow rate
calculated_flow_rate = calculated_flow_rate + nozzle_length;
% Calculations
pipe_cross_sectional_area = pi * (pipe_diameter / 2)^2; % Cross-sectional area of the pipe
pipe_velocity = calculated_flow_rate / pipe_cross_sectional_area; % Flow velocity in the pipe
% Pressure drop in the pipe
pipe_resistance = 8 * fluid_density * (pipe_length + nozzle_length) * pipe_velocity^2 / (pi^2 * pipe_diameter^5);
% Display results
fprintf('Inlet Pressure: %d Pa, Flow Rate: %.2f LPM\n', inlet_pressure_Pa, calculated_flow_rate);
end
4.3. Results of the Computational Study
The computational analysis of jet pump performance has produced specific flow rate results, which are meticulously summarized in Table 4 for a nozzle length of 25 mm. These findings were generated from simulations conducted in MATLAB, a sophisticated computational environment commonly used for fluid dynamics evaluations. While the raw data is displayed in the table, the implications for jet pump operation and design are significant. Modifying the nozzle length to 25 mm has demonstrated an impact on the volumetric flow rates, providing critical insights that inform the optimization of the pump for various industrial applications. The calculated flow rates are essential for understanding how nozzle dimensions affect pump efficiency and for determining the best operational practices to achieve desired performance outcomes.
It is essential to accurately measure using Matlab code and monitor the flow quantity to ensure the results of the experiments. In this context, it is noteworthy that the range of computational flow quantity values is quite vast, with values ranging from as low as 1.1 lt/min to as high as 12.3 lt/min. It is worth noting that the measurements obtained via Matlab code show a slight increase compared to the results of the experiments. Figure 8. shows that computational flow quantity values are distributed between 12.3 lt/min and 1.1 lt/min values.
As with the 25 mm nozzle length computational results, the 50 mm nozzle measurement results in Table 5 are consistent with the experimental data. In this context, the computational results for the 75 mm nozzle length should be consistent with the previous 25 mm and 50 mm nozzle length results and the experimental results with the 75 mm nozzle length.
Figure 9 shows that thecomputational flow quantity values range from 1.3 lt/min to 12.6 lt/min.
The last computational analysis was performed for the nozzle length of 75 mm and is presented in Table 6.
The computational analysis results for three different nozzle lengths have shown remarkable consistency, further affirmed by the comparison with experimental results for 25 mm, 50 mm, and 75 mm nozzle lengths, as shown in Figure 10.
Finally, Figure 11. illustrates how the experiment's findings indicate the significant impact of nozzle lengths, pressures, and suction lifts on the performance of the jet pump. The error rate was found to be 0.05321. It is identified that the net flow amount increases in direct proportion to the nozzle length and pressure.
It is noteworthy that the consistency of the computational analysis results across all three nozzle lengths and the experimental results for 25 mm, 50 mm, and 75 mm nozzle lengths indicate high accuracy and reliability in computational analysis. This highlights the accuracy and reliability of computational analysis in predicting and analyzing fluid dynamics.
5. Results and Discussion
The findings of this study are significant for understanding the behavior of jet pumps and improving flow efficiency. The consistency of results across all variables confirms the accuracy of the computational models used, further enhancing the credibility of the entire study.
To enhance the accuracy and reliability of our findings, we conducted three measurements of the "Net Flow Quantity" for each experimental run, maintaining consistent parameters. As shown in Figure 12, the results from the 1999 experiment align well with those produced by the Matlab code in 2025, demonstrating the validity of our approach.
The fact that the experimental and Matlab results agree proves that the experimental measurements were carried out meticulously.
Moreover, this study carefully examines the consistency between computer-based analysis and experimental methods in the context of jet pump performance. Through comparing experimental data with Matlab model results, a detailed knowledge of the behavior of the jet pump under different circumstances is investigated. The methodology is robust; it uses physical experiments, Matlab calculations, and further analyses to confirm the scenarios expected to occur when a jet pump operates.
Conclusionally, the simulations closely emulate the experimental setup, with results consistently indicating that computational methods can reliably forecast jet pump performance, thereby confirming the accuracy of numerical predictions. Cross-verification is critical, as it reinforces the reliability of computational studies to supplement or even preclude extensive physical testing, ultimately leading to more efficient jet pump design and operation.
6. Conclusions
The experimental studies have provided valuable insights into the average flow rate of nozzles under varying pressure and suction lifts. They use a nozzle length of 25 mm, resulting in an average flow rate of 4.22 liters per minute, while a nozzle length of 50 mm provides an average flow rate of 4.675 liters per minute. Besides, a nozzle length of 75 mm can offer an average flow rate of 5.005 liters per minute.
After conducting the analysis, it was determined that the average flow for a 25mm nozzle length is 0.41 liters per minute, which is more than the overall average. On the other hand, for a 50 mm nozzle length, the average flow is 0.039 liters per minute, which is less than the overall average. Finally, for a 75 mm nozzle length, the average flow is 0.370 liters per minute, less than the average.
Upon analyzing the nozzle length and suction lift distribution under different pressure levels, it was found that under 50 PSI pressure, the average flow rate was 2.572 lt/min, which is 2.063 lt/min less than the average flow rate of 4.635 lt/min. Similarly, under 100 PSI pressure, the average flow rate was 3.522 lt/min, 1.113 lt/min less than the average flow rate of 4.635 lt/min. However, under 150 PSI pressure, the average flow rate was 4.45 lt/min, only 0.183 lt/min less than the average flow rate of 4.635 lt/min.
On the other hand, when the pressure was increased to 200 PSI, the average flow rate increased to 5.21 lt/min, which is 0.575 lt/min more than the average flow rate of 4.635 lt/min. Furthermore, under 250 PSI pressure, the average flow rate was 5.83 lt/min, 1.195 lt/min more than the average flow rate of 4.635 lt/min. Finally, when the pressure was increased to 300 PSI, the average flow rate was 6.22 lt/min, 1.585 lt/min more than the average flow rate of 4.635 lt/min.
Below are the average flow quantities for various suction lift heights depending on the pressure and nozzle length. For a suction lift of 20 cm, the average flow quantity is 7.922 liters per minute, 3.28 lt/min, more than the overall average flow quantity of 4.635 lt/min. Similarly, with a suction lift of 40 cm, the average flow quantity is 5.733 liters per minute, which is 1.09 lt/min, more than the average flow quantity.
However, for a suction lift of 60 cm, the average flow quantity is 4.172 liters per minute, 0.462 lt/min less than the average flow quantity. Moreover, with a suction lift of 80 cm, the average flow quantity is 3.8 liters per minute, 0.835 lt/min less than the average flow quantity. For a suction lift of 100 cm, the average flow quantity is 3.41 liters per minute, 1.218 lt/min less than the average flow quantity. Finally, for a suction lift of 120 cm, the average flow quantity is 2.76 liters per minute, 1.86 lt/min less than the average flow quantity.
Eventually, among the jet pump variations used in the experiment, obtaining the highest net flow quantity with 75 mm nozzle length, 300 psi pressure, and 20 mm suction lift values is possible to increase the flow quantity. As a general hypothesis, this study reveals that pressure increase and nozzle length extension positively affect flow. However, suction lift increase has a negative effect.
Author Contributions
Tamer Saraçyakupoğlu –Data Curation, Methodology, and Writing - Original Draft. Yaşar Pancar – Supervision, Project Administration, and Writing – review & editing. Baturalp Akgün – Software, Formal Analysis, and Validation. The authors have read and agreed to the published version of the manuscript.
Acknowledgments
The authors are grateful to Turkish Aerospace Industries and appreciate the helpful and constructive comments of the valuable reviewers.
Conflicts of Interest
The authors state that no known competing financial interests or personal relationships could have appeared to influence this proceeding paper.
References
- Saracyakupoglu T. Manufacturing and Experiments of Jet Pump. M. Sc. Thesis. Eskisehir Osmangazi University Eskisehir Türkiye, 1999.
- Wang, J; Xu, S; Cheng, H; Ji, B; Zhang, J; Long, X. Experimental investigation of cavity length pulsation characteristics of jet pumps during limited operation stage. En.. 2018. 163: 61-73. https://doi.org/10.1016/j.energy.2018.08.035.
- Gehmlich, R.K; Mueller ,C.J; Ruth, D.J; Nilsen, C.W; Skeen, S.A; Manin. J. Ducted fuel injection attenuates or prevents soot formation in mixing-controlled combustion strategies for engine applications. Appl. Ener. 2018. 226:1169-1186. https://doi.org/10.1016/j.apenergy.2018.05.078.
- Han, W; Shang, T; Su, M; Gong, C; Li, R; Meng, B. Direct Sailing Variable Acceleration Dynamics Characteristics of Waterjet Propulsion with a Screw Mixed-Flow Pump. Appl. Sci. 2019. 9 (19): 4194. https://doi.org/10.3390/app9194194.
- Fan, B; Zhaoyu, L; Ruonan, F; Songying, C. Numerical Study on Entropy Generation of the Multi-Stage Centrifugal Pump. Entr. 2022. 24 (7):923. https://doi.org/10.3390/e24070923.
- Cable, J.W; Duchene, M; Elmore, A.C; Hill, D.L; Summers, D.A; Dilly, R. Initial investigation on the use of waterjets to place amendments in the subsurface. Rem. J. 2005. 16(1).43-54.https://doi.org/10.1002/rem.20069.
- Yao, C; Zhao, Y; Ma, H; Liu, Y; Zhao, Q; Chen, G. Two-phase flow and mass transfer in microchannels: A review from local mechanism to global models. Chem. Eng. Sci. 2021. 229:116017. https://doi.org/10.1016/j.ces.2020.116017.
- Xu, K; Wang, G; Wang, L; Feihong, Y; Sun, W; Wang, X; Chen, X. Parameter Analysis and Optimization of Annular Jet Pump Based on Kriging Model. Appl. Sci. 2020. 10(21):7860. https://doi.org/10.3390/app10217860.
- Gazzar, M.E; Meakhail, T; Mikhail, S. Experimental Study of the Effect of Drag Reduction Agents on the Performance of Jet Pumps. J. Pow. Ener. 2006. 220(4):379-386. doi:10.1243/09576509JPE192.
- Gazzar, M.E; Meakhail, T; Mikhail, S. Experimental Study of the Effect of Drag Reduction Agents on the Performance of Jet Pumps. J. Pow. Ener. 2006. 220(4):379-386. doi:10.1243/09576509JPE192.
- Saker, A; Hassan, H. Z. Study of the Different Factors That Influence Jet Pump Performance. Open J. Fluid Dyn. 2013. 3 (2). doi: 10.4236/ojfd.2013.32006.
- Liu, W; Pochiraju, K. A methodology for the prediction of backpressure induced stall in eductor-jet pumps. Int. J. Refri. 2018. 95:165-174. https://doi.org/10.1016/j.ijrefrig.2018.08.007.
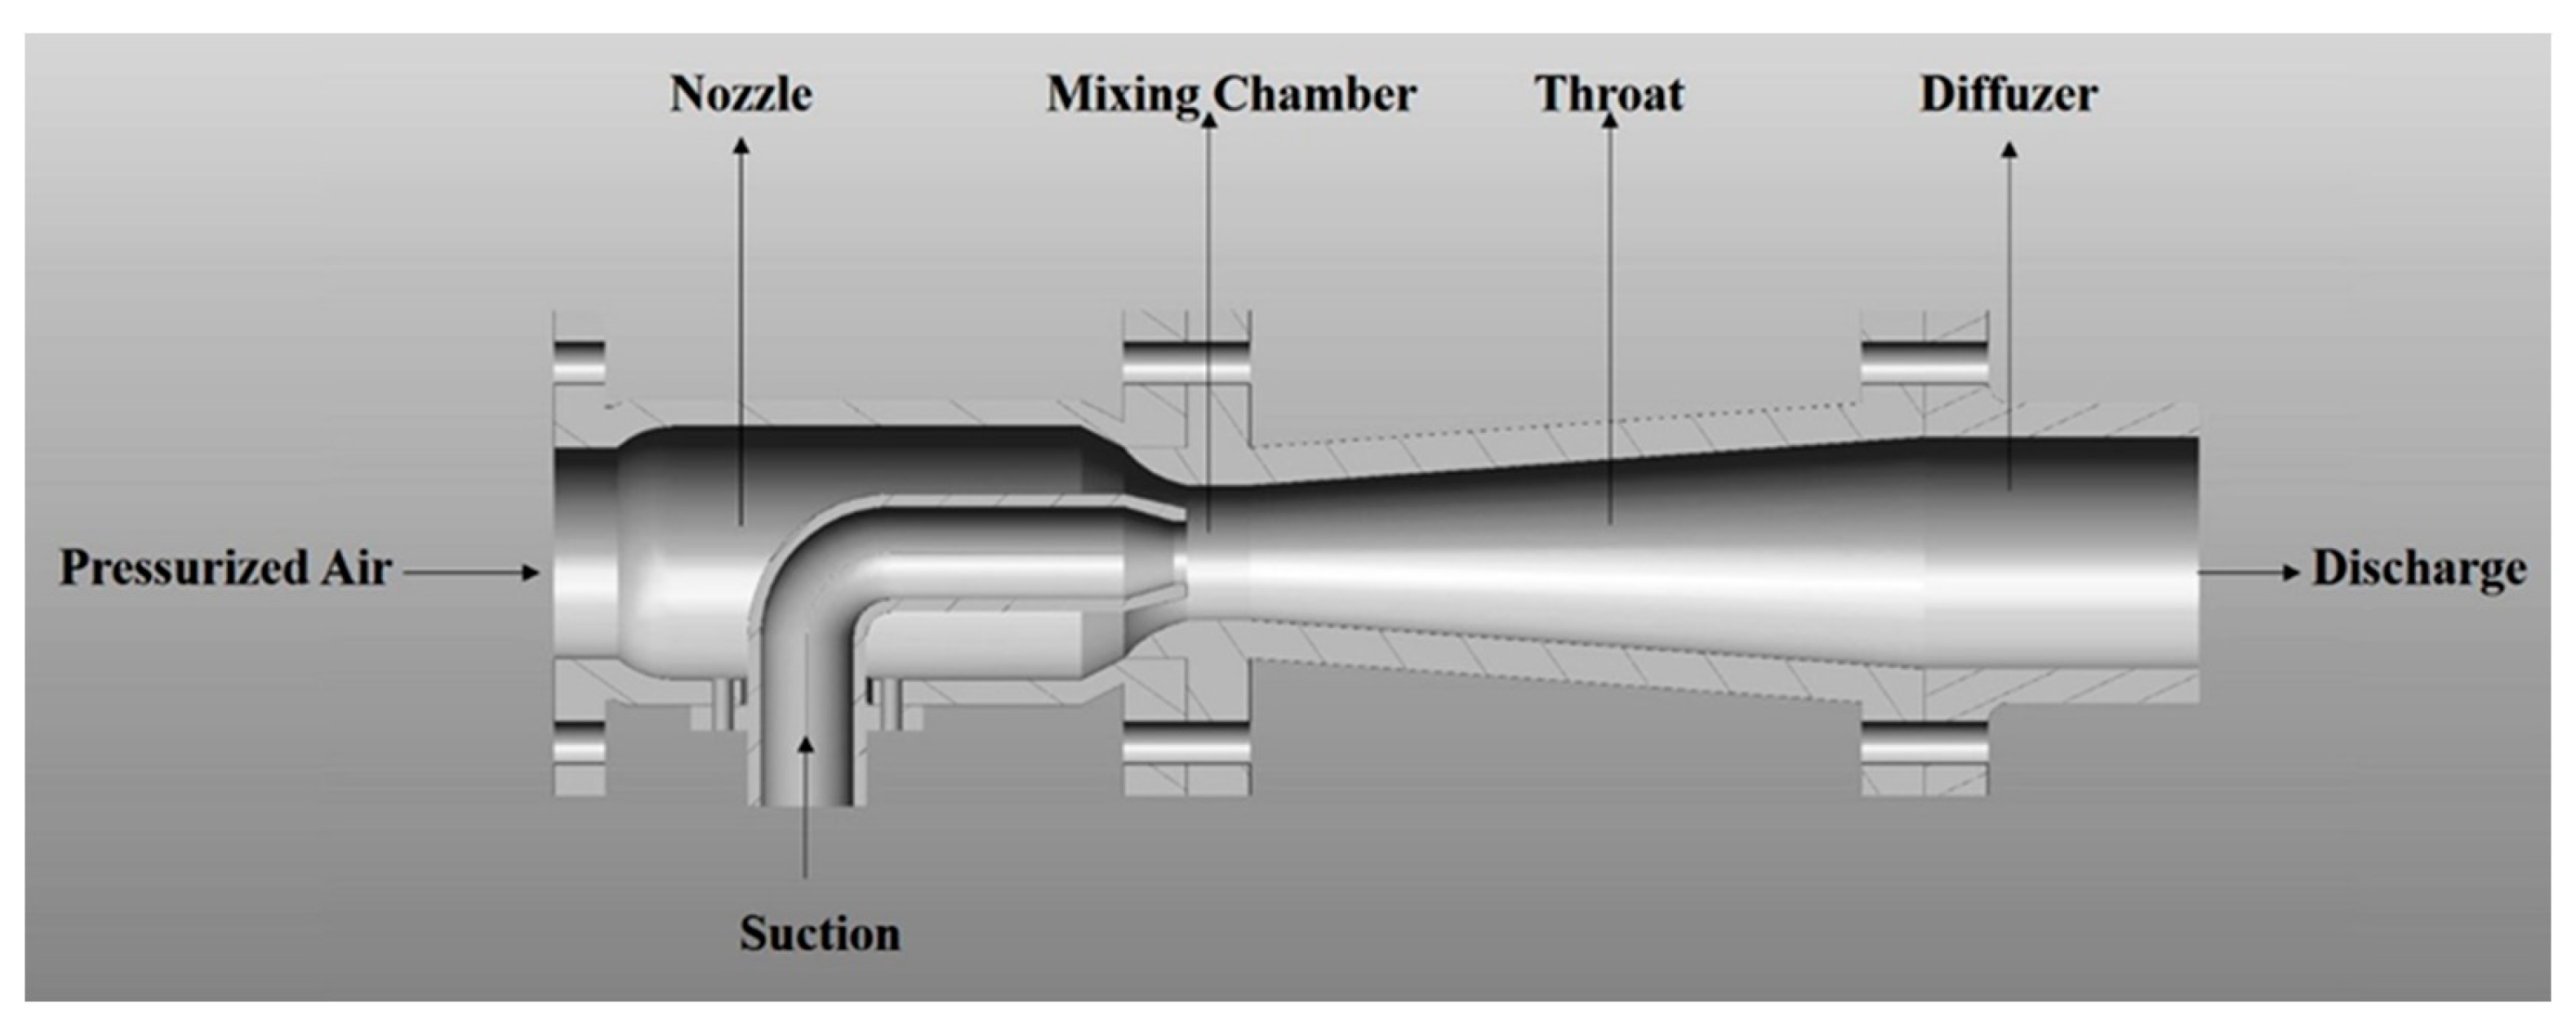
Figure 2.
The Working Principle of the Jet Pump Used in Experiments.
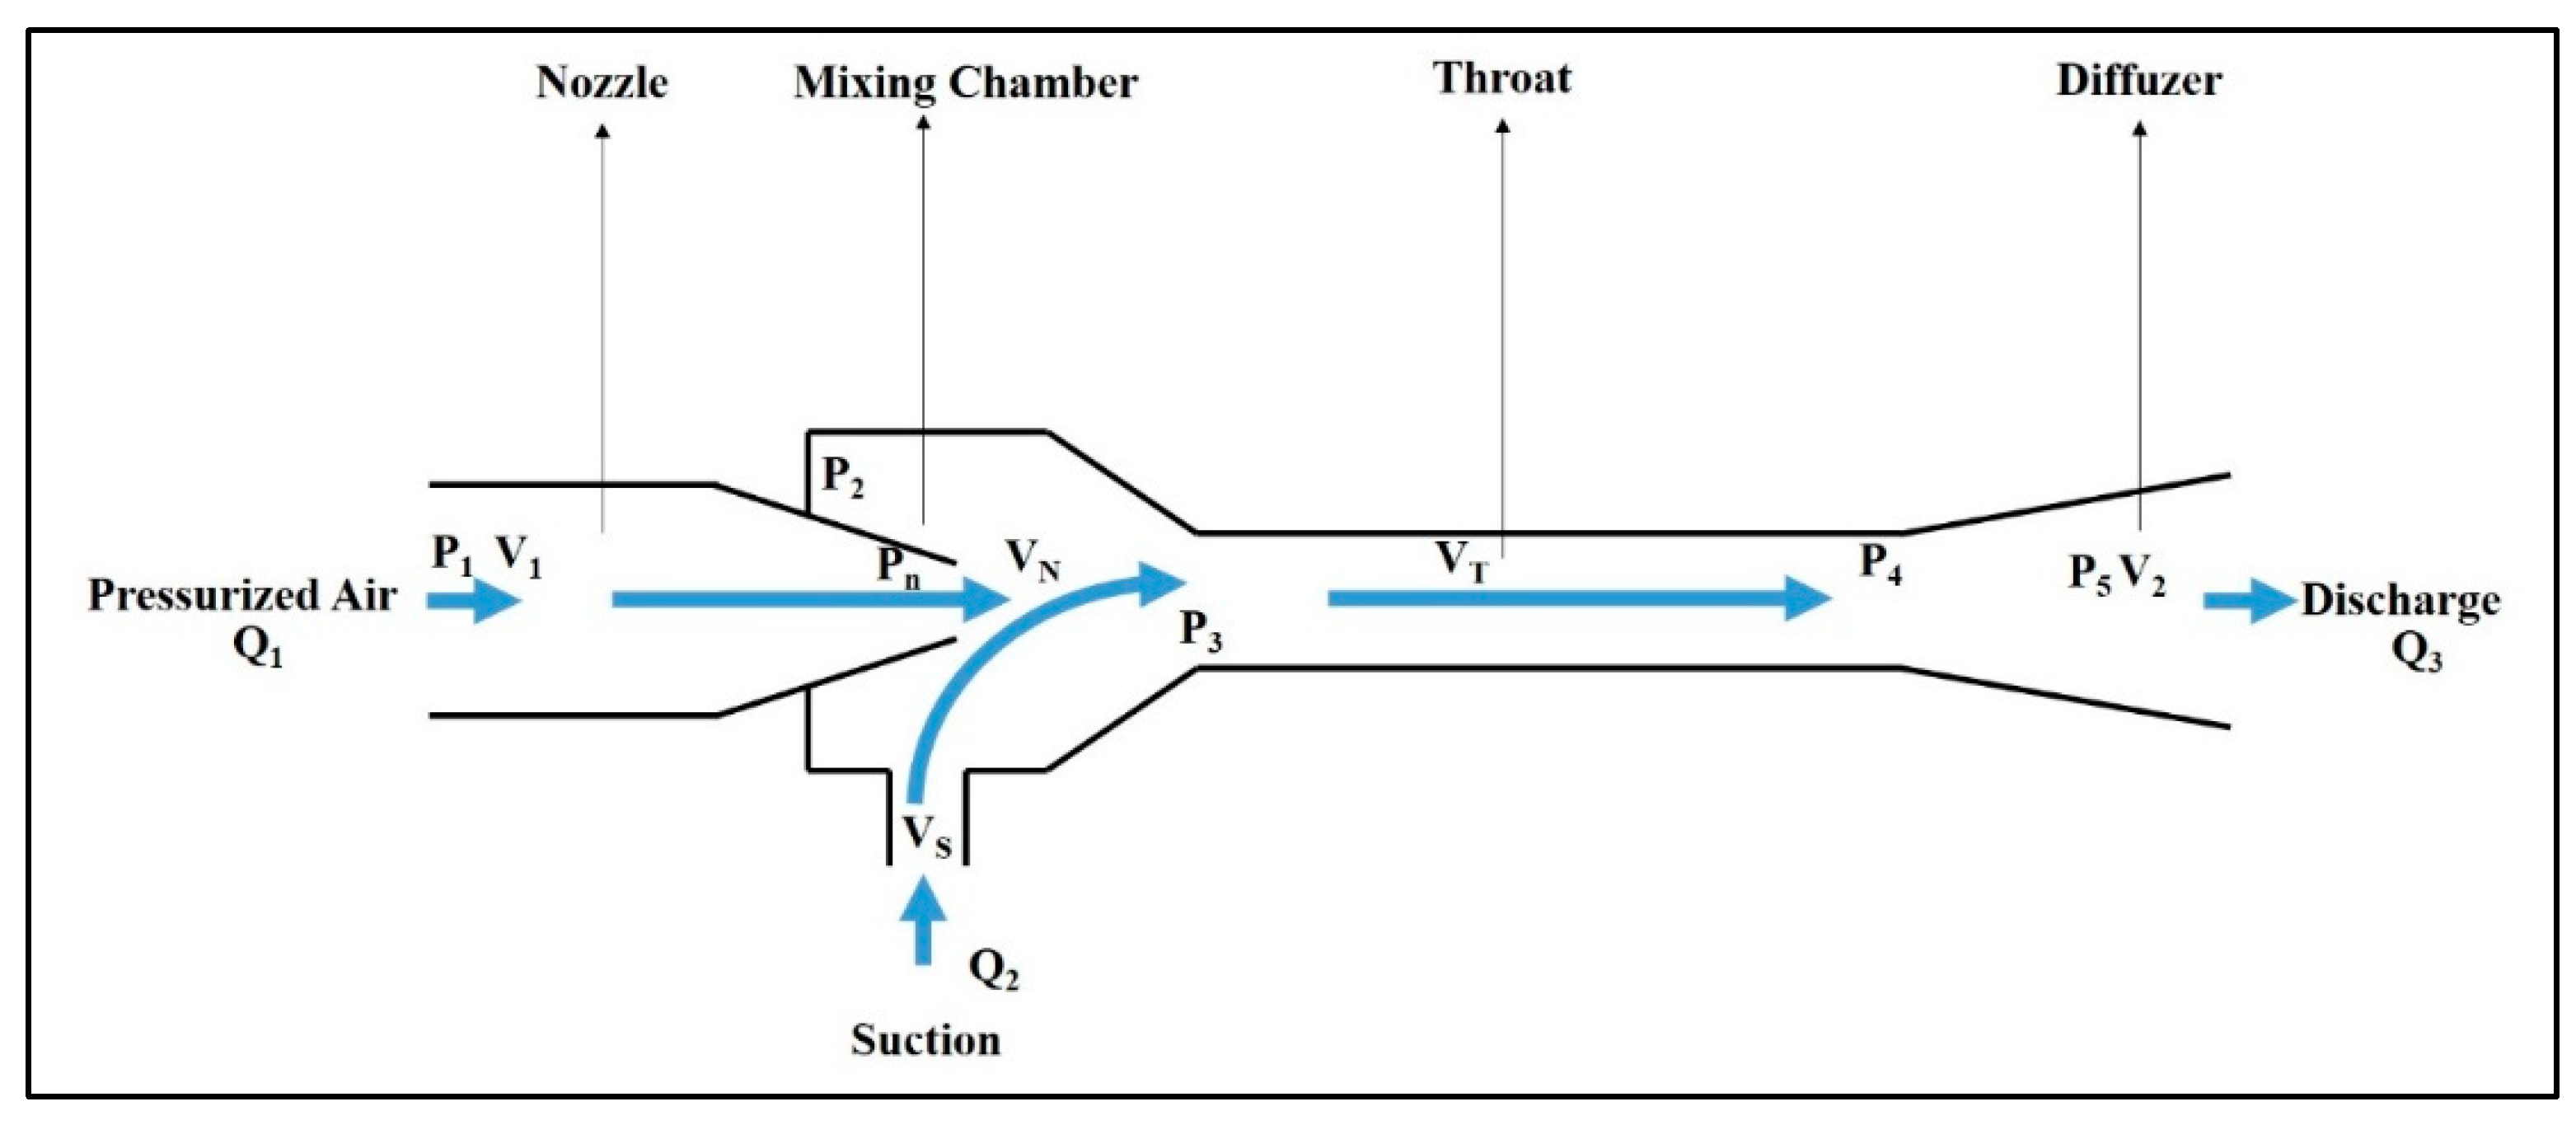
Figure 3.
Sketch of the Experimental Test Setup and Variables.
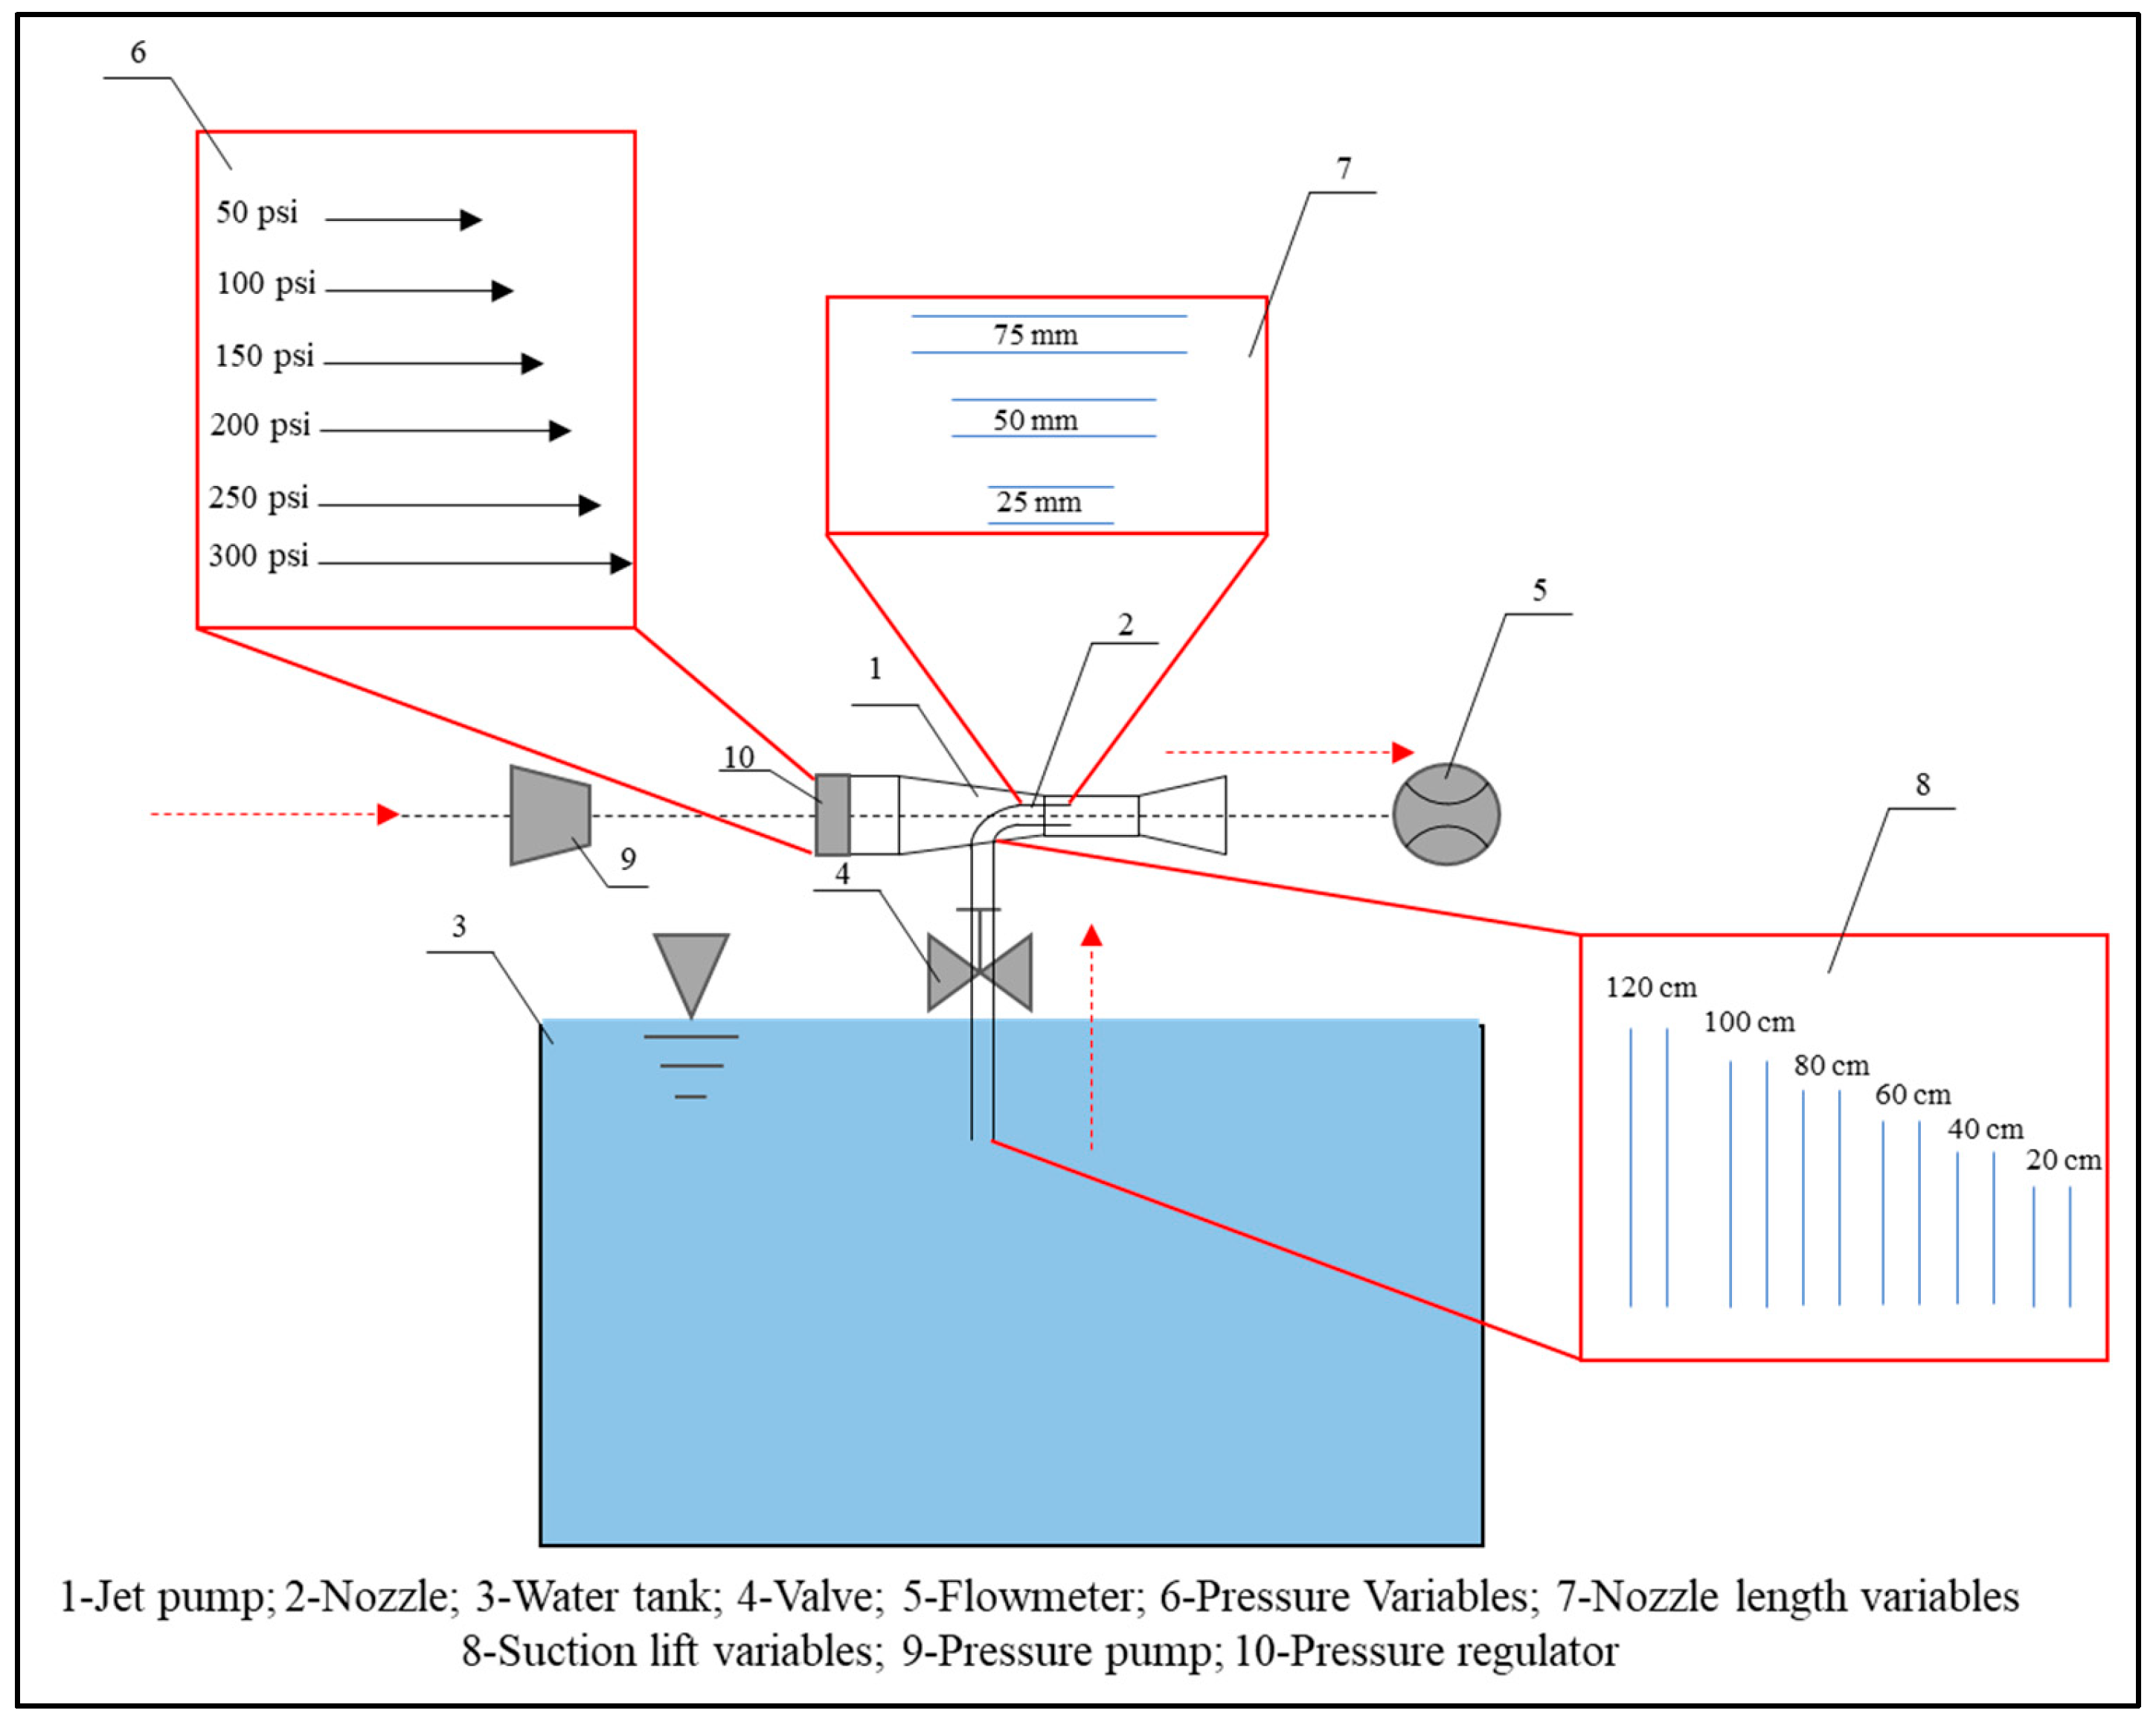
Figure 4.
Net Flow Quantity for 25 mm Nozzle Length.
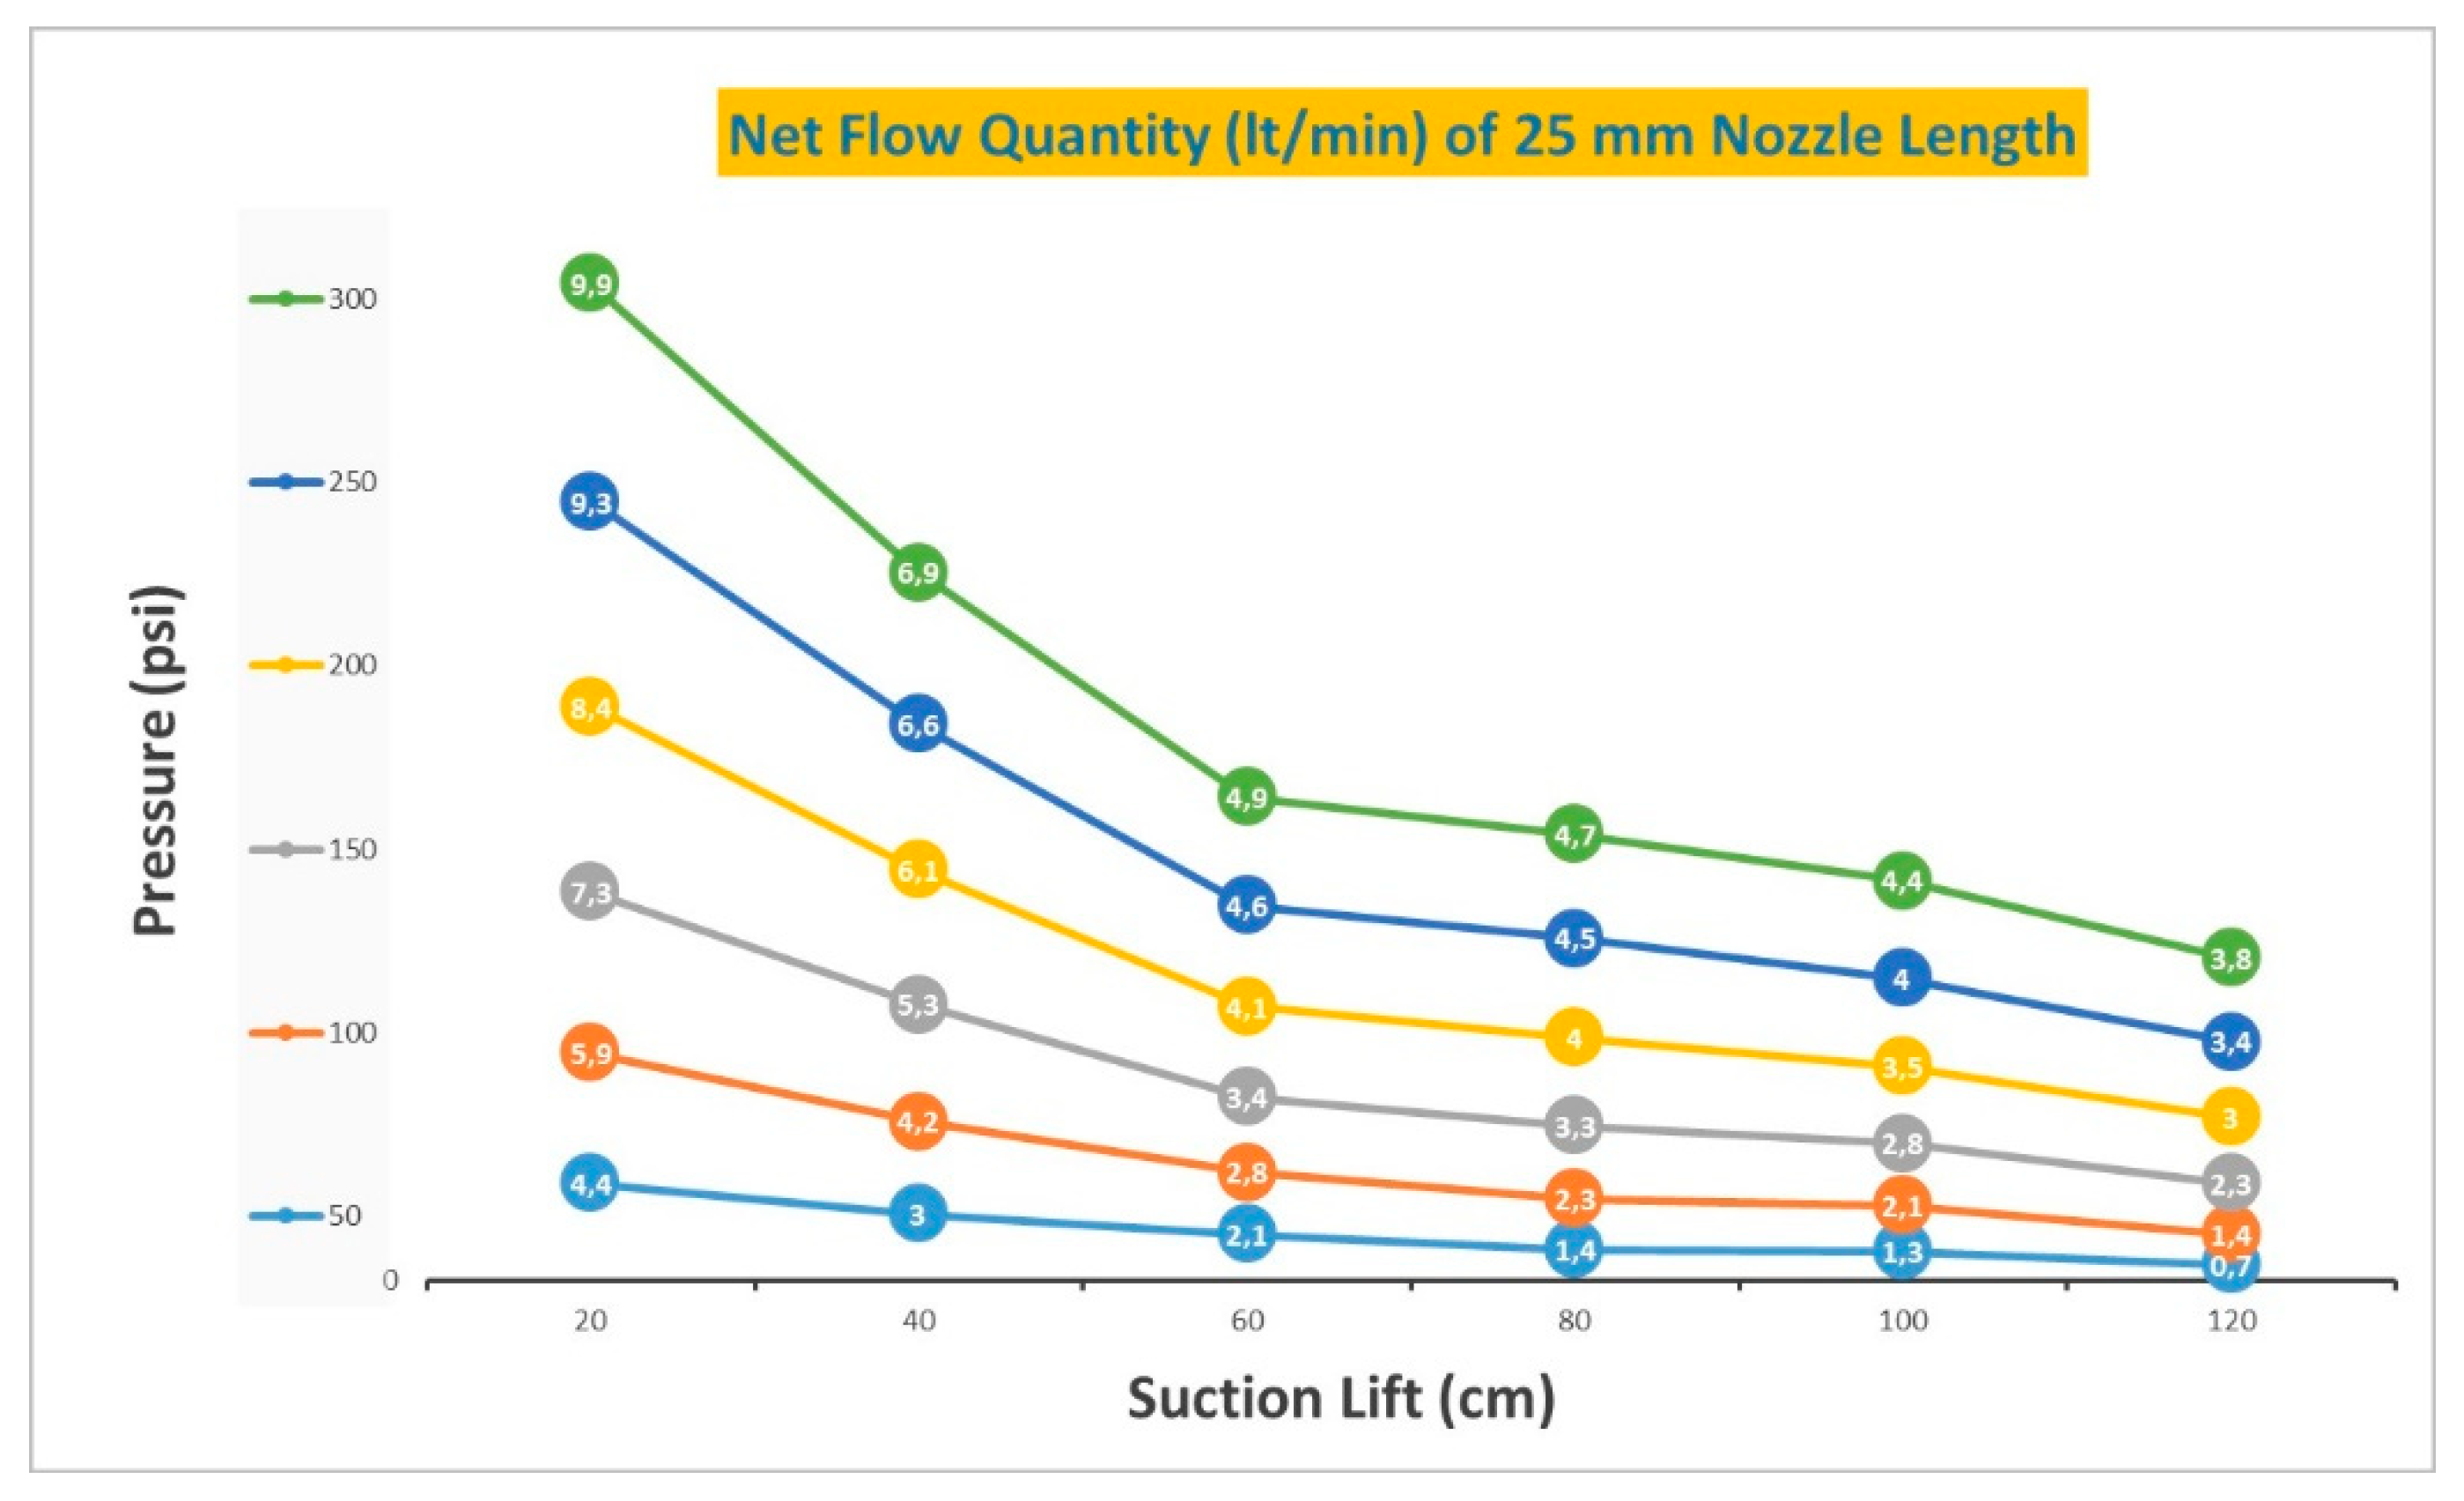
Figure 5.
Net Flow Quantity for 50 mm Nozzle Length.
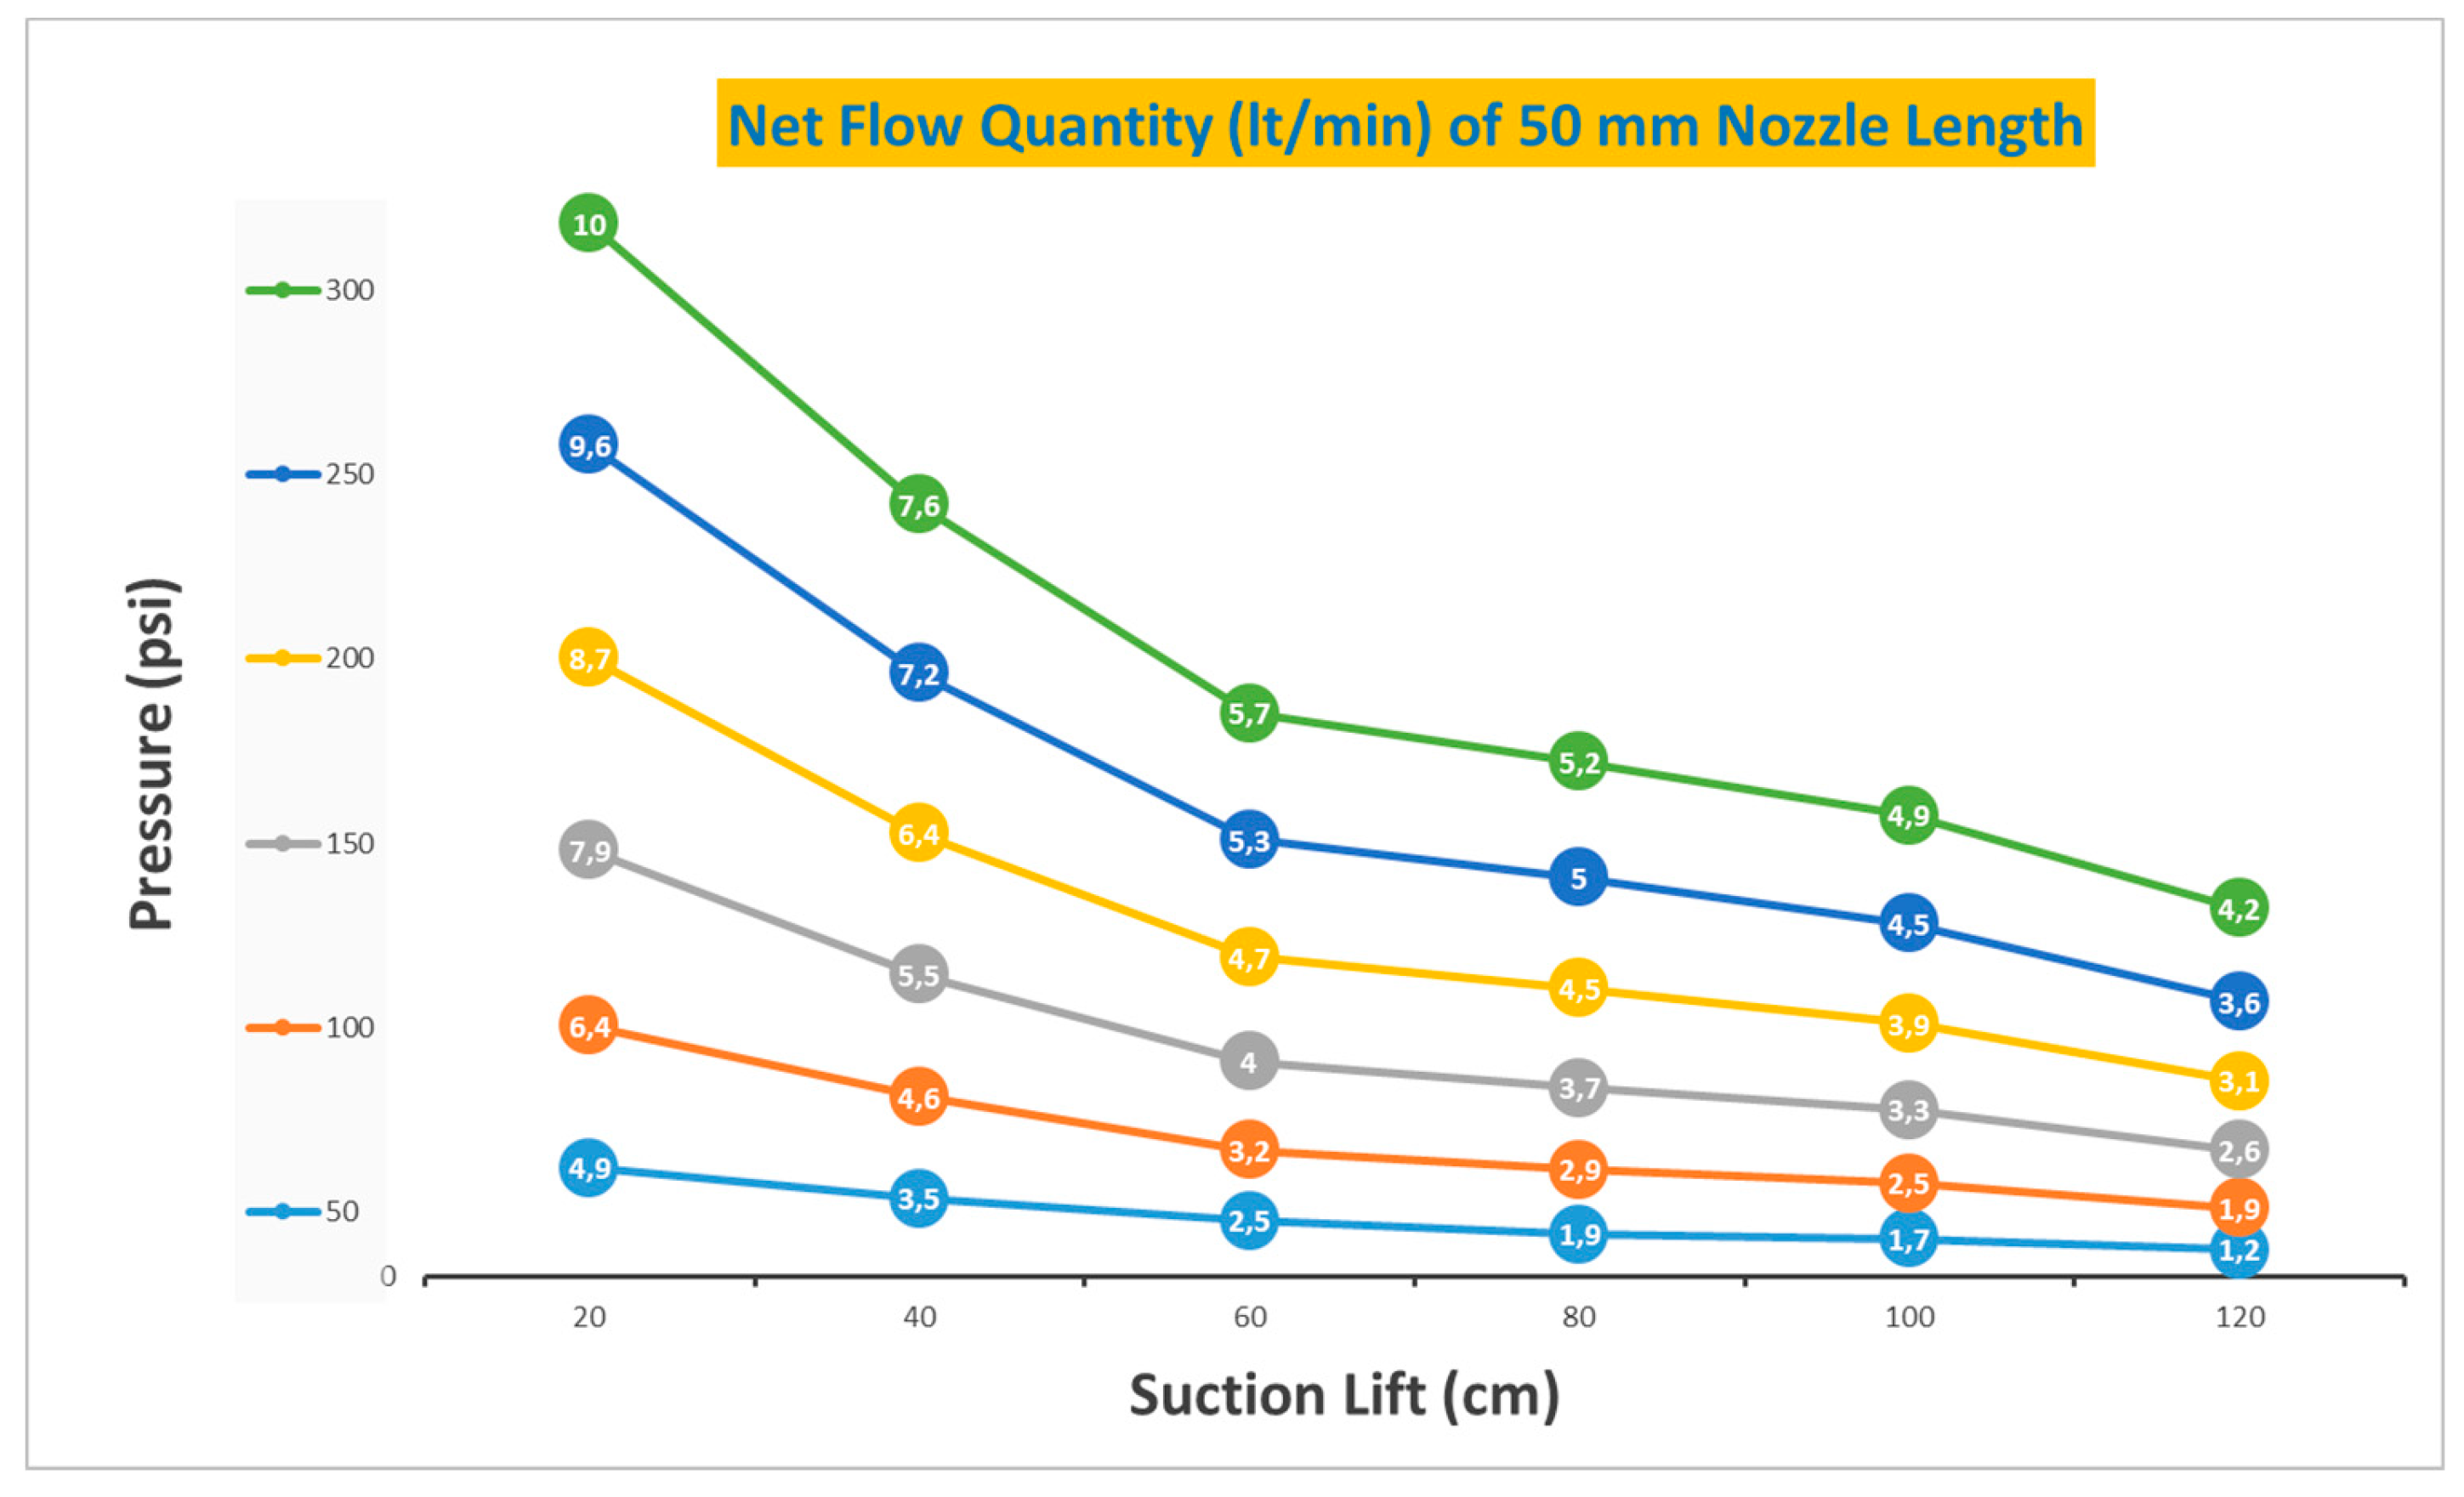
Figure 6.
Net Flow Quantity for 75 mm Nozzle Length.
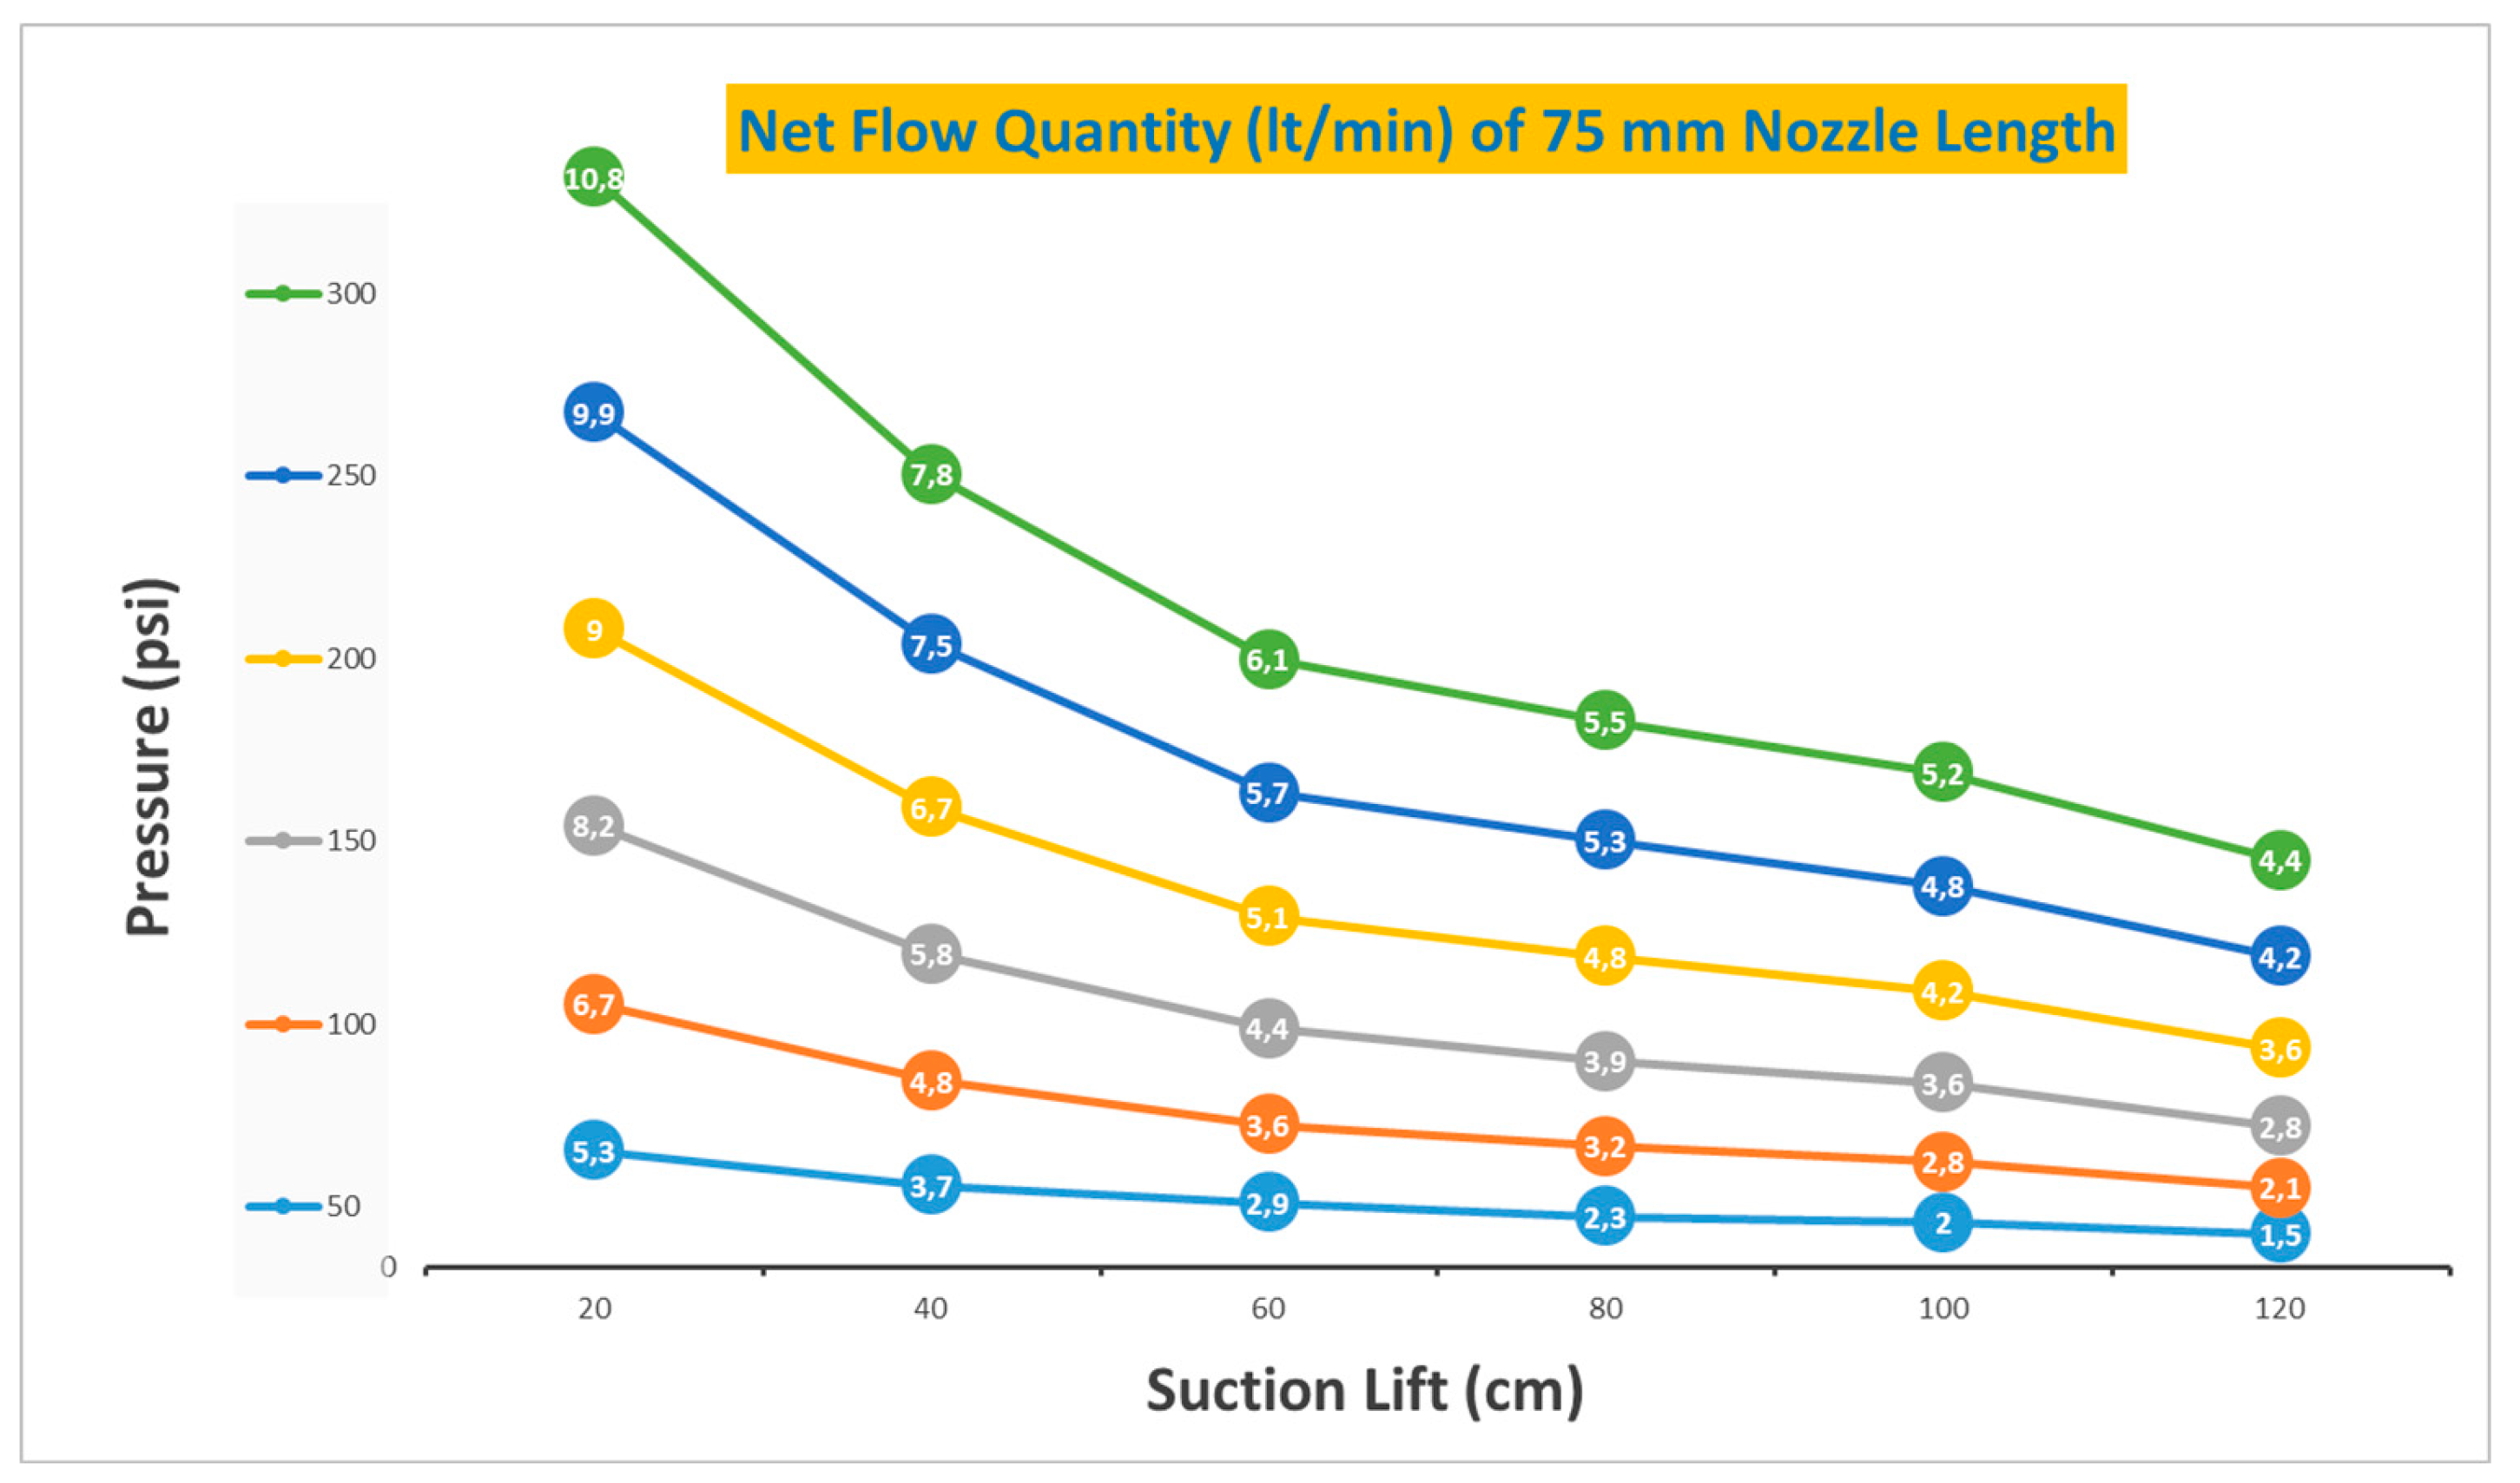
Figure 7.
Net Flow Quantity Compare for Three Types of Nozzle Lengths.
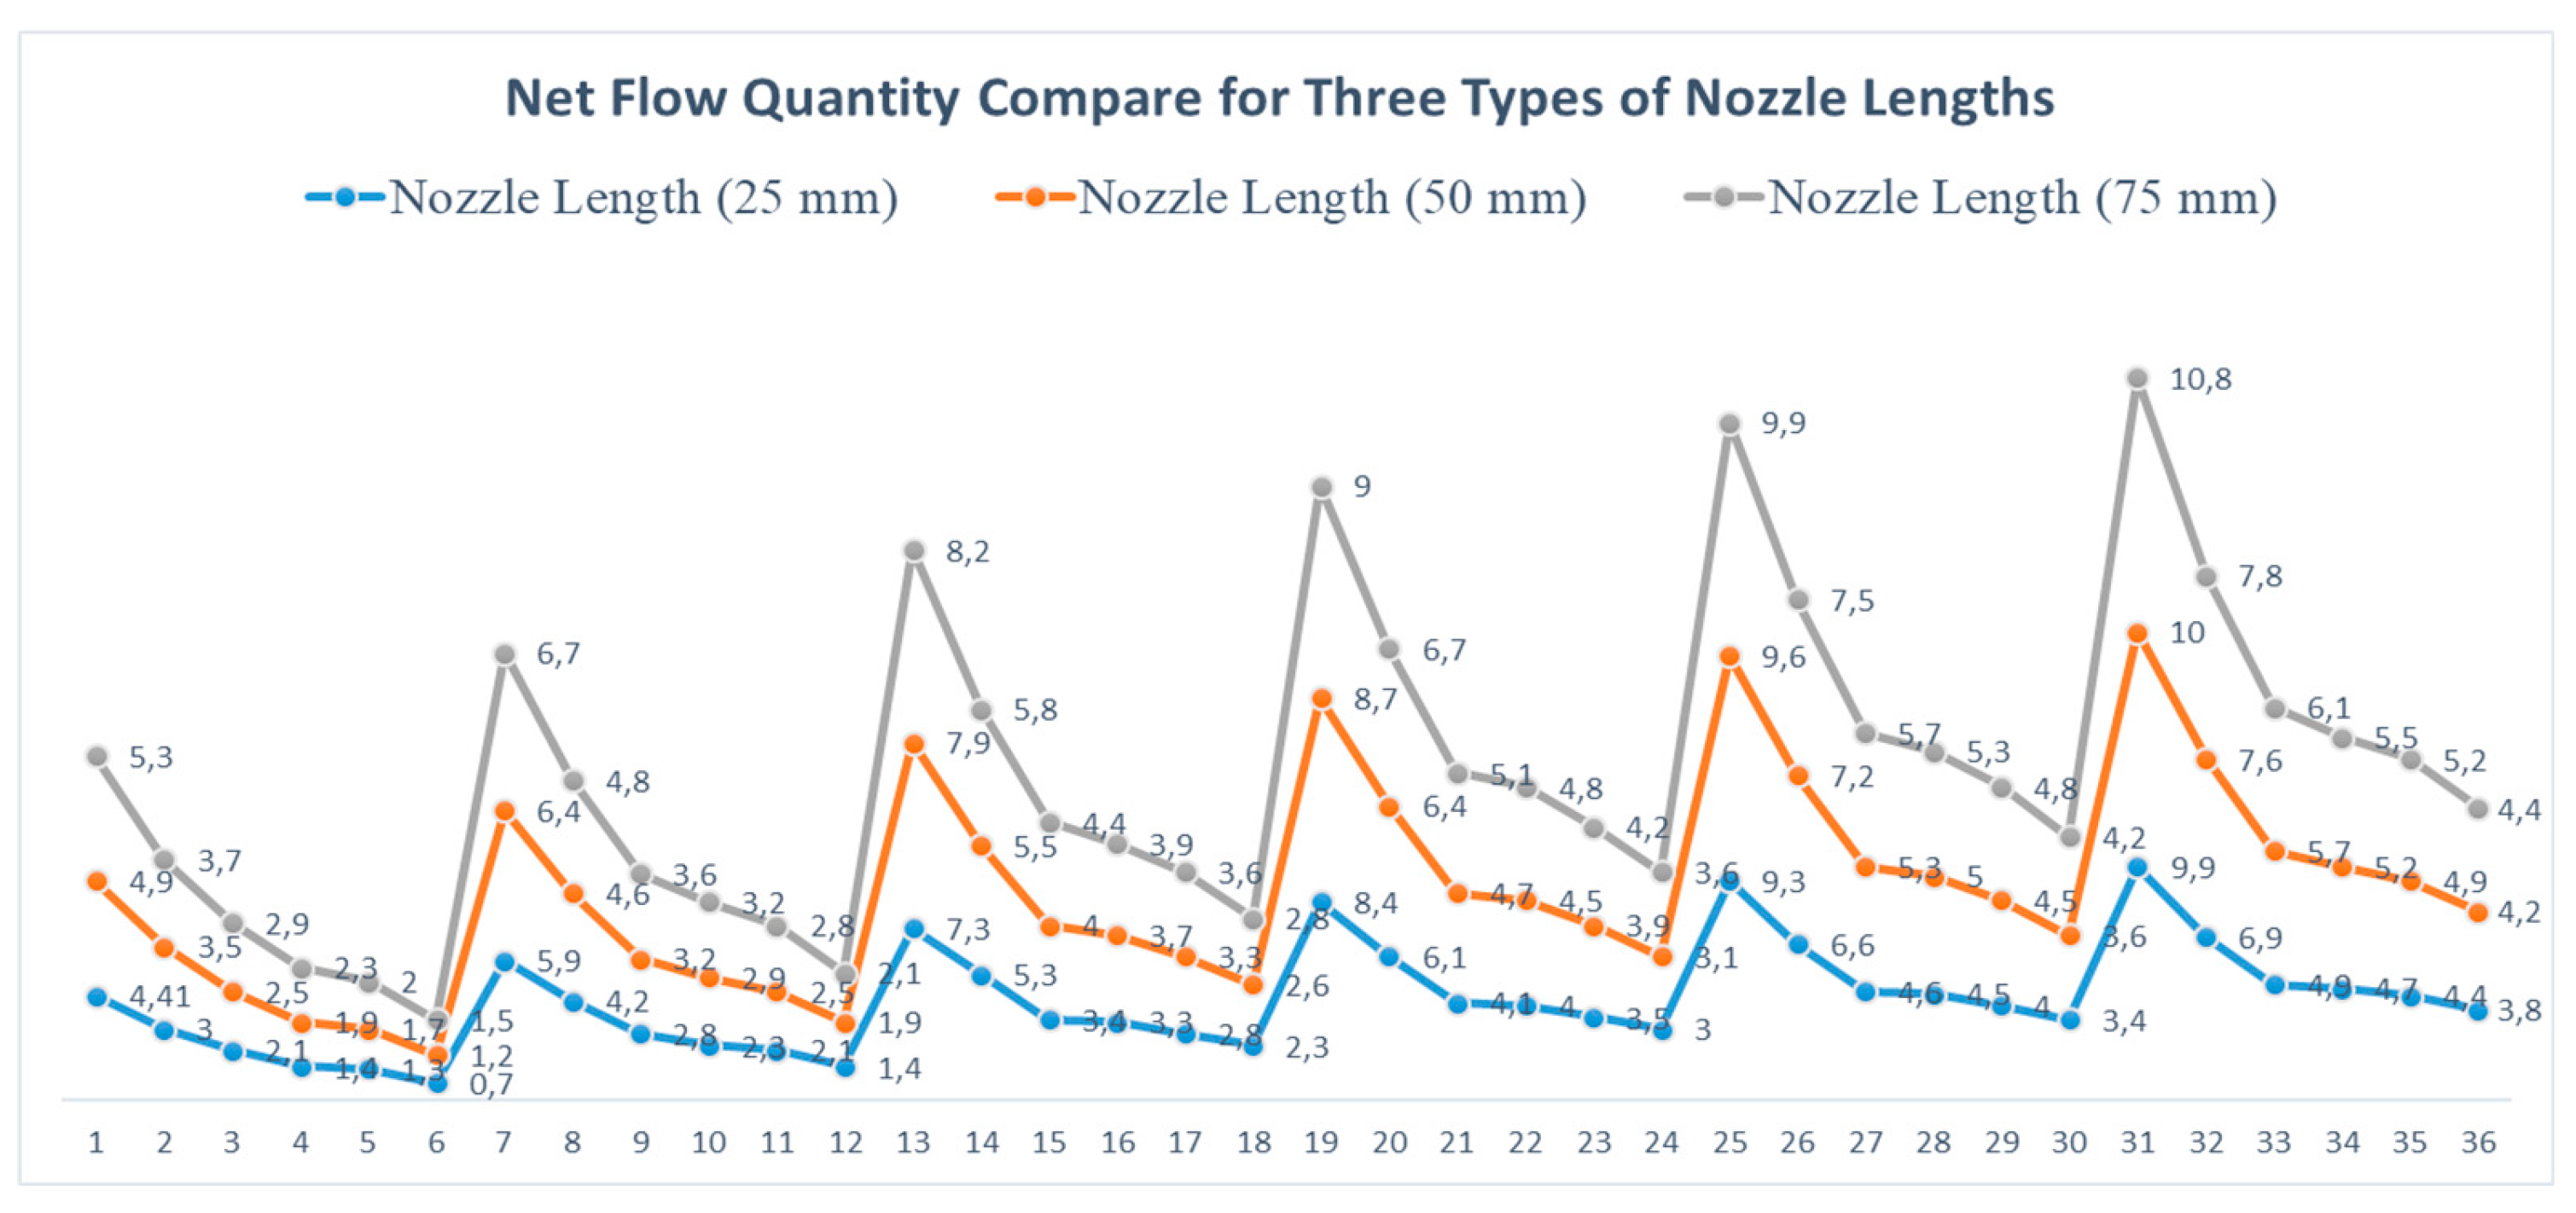
Figure 8.
Computational Flow Quantity for 25 mm Nozzle Length.

Figure 9.
Computational Flow Quantity for 50 mm Nozzle Length.
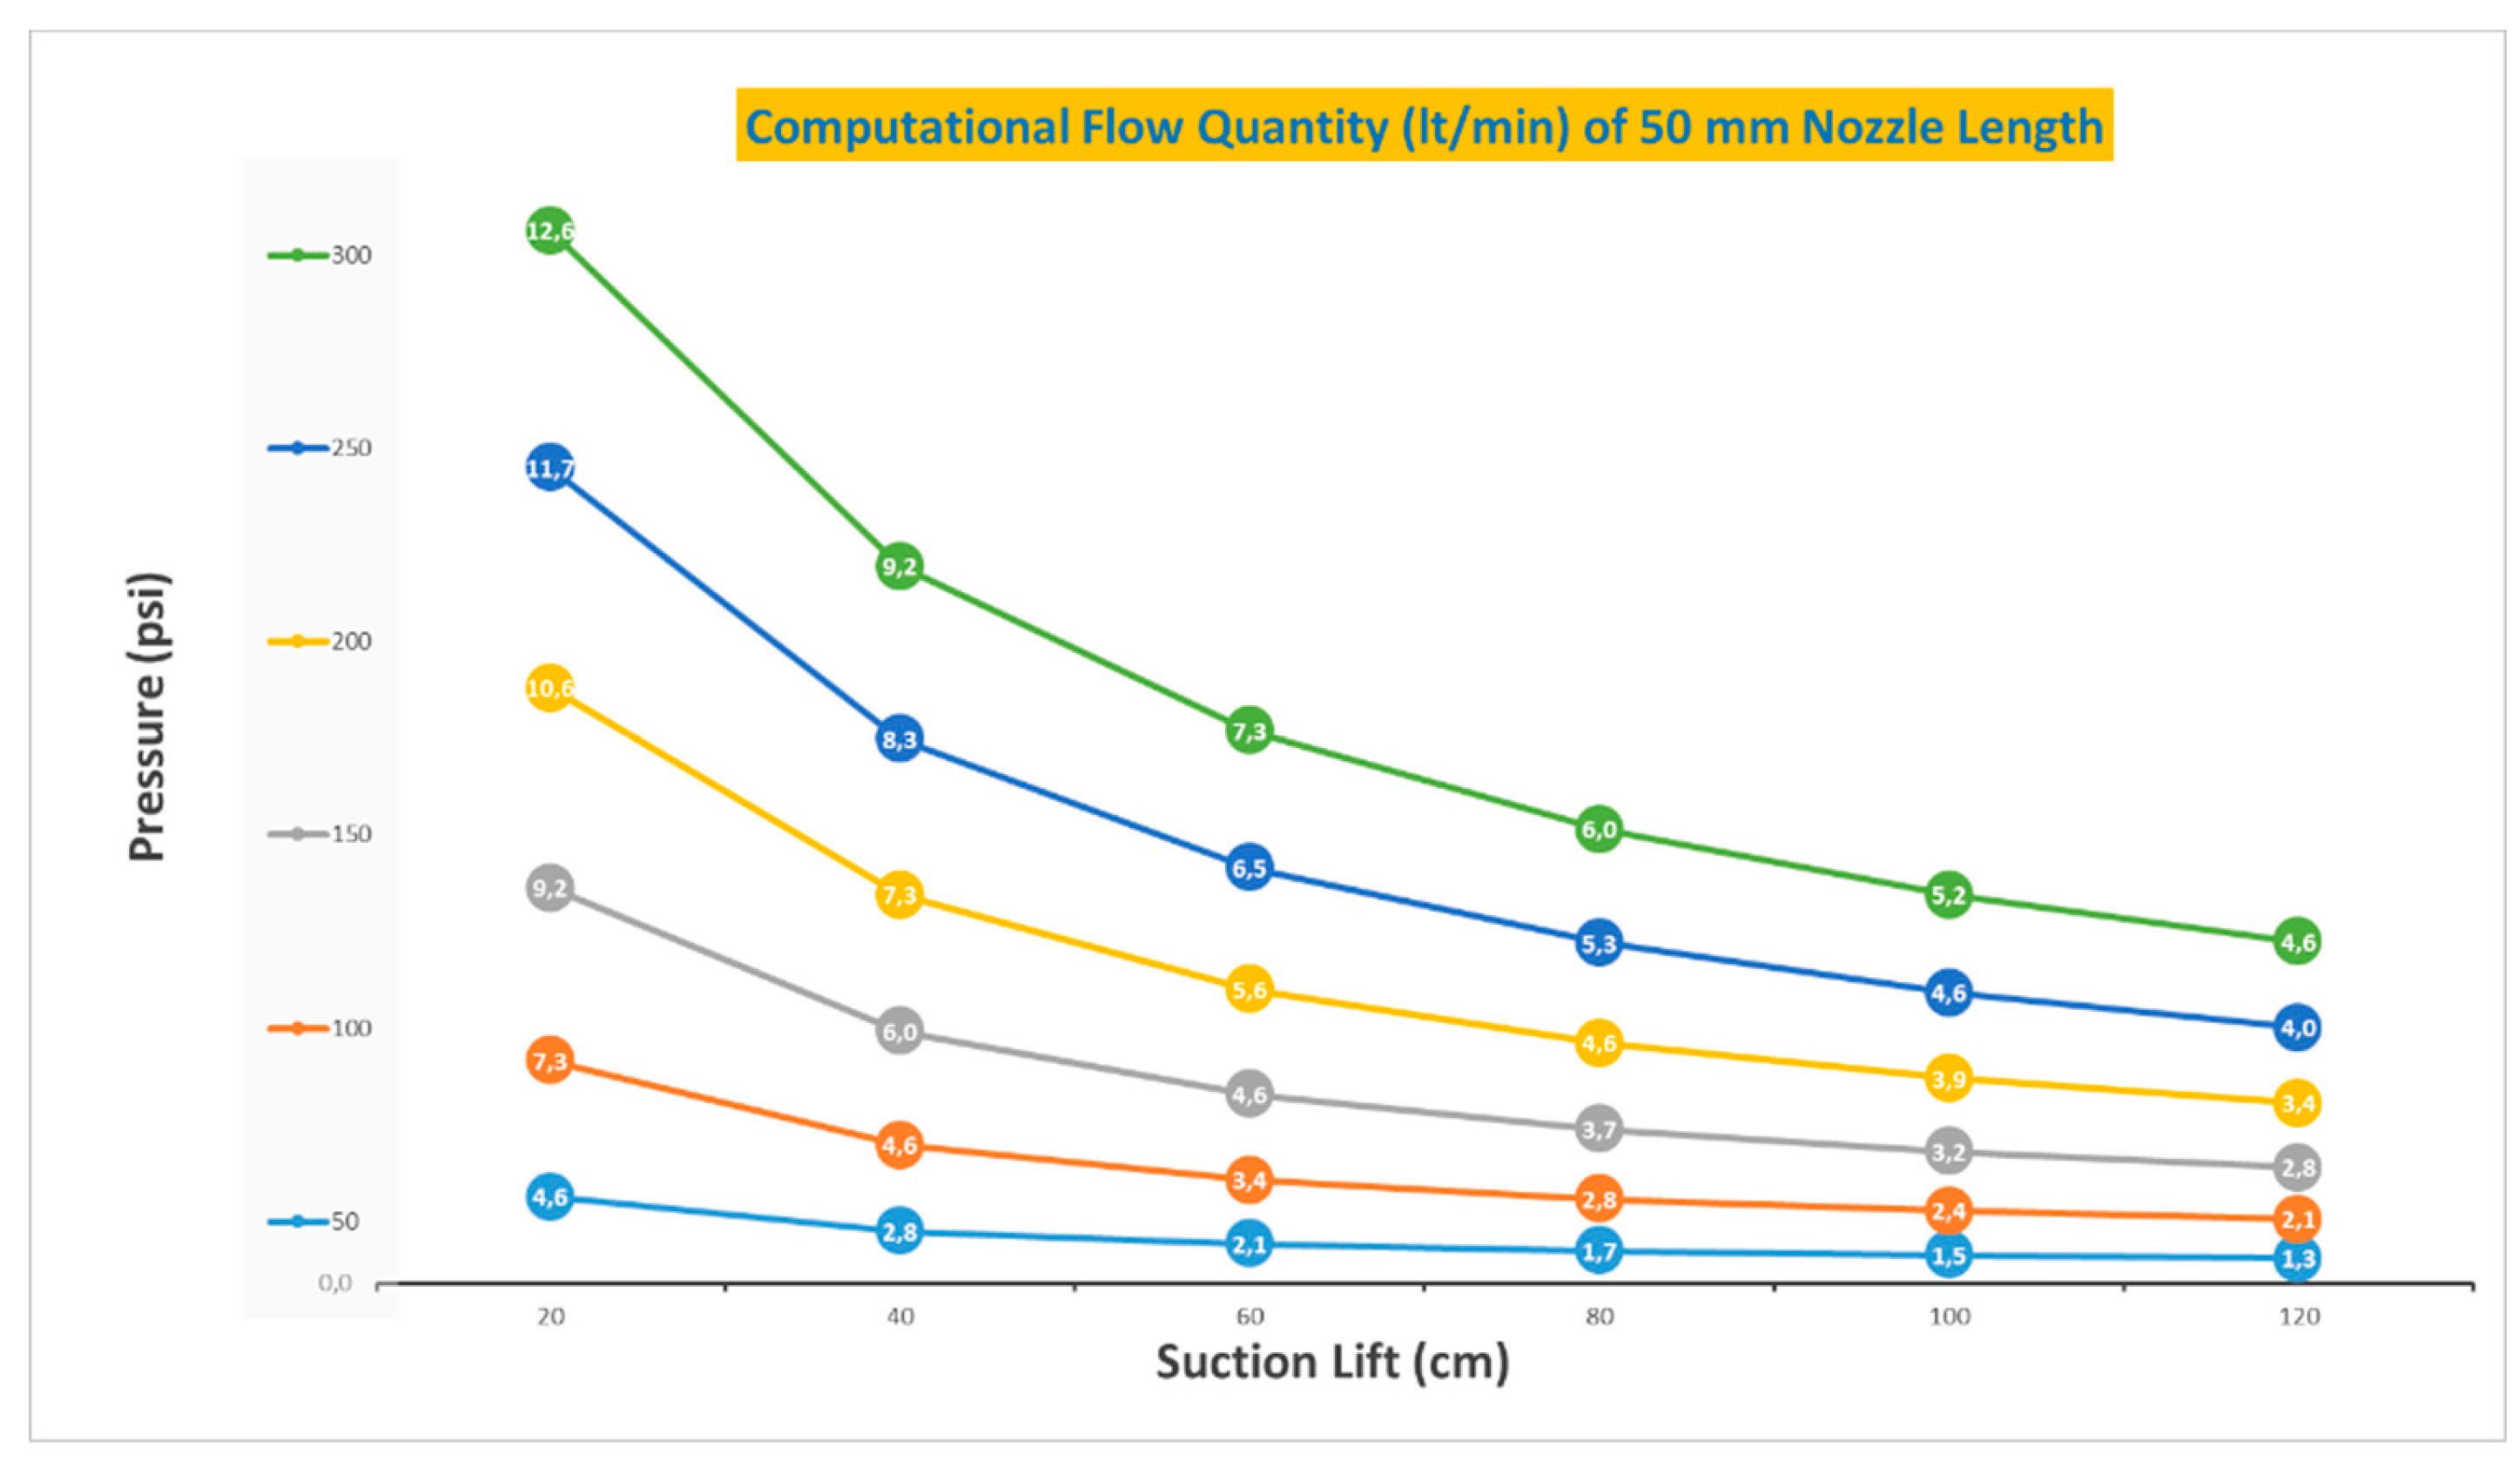
Figure 10.
Computational Flow Quantity for 75 mm Nozzle Length.
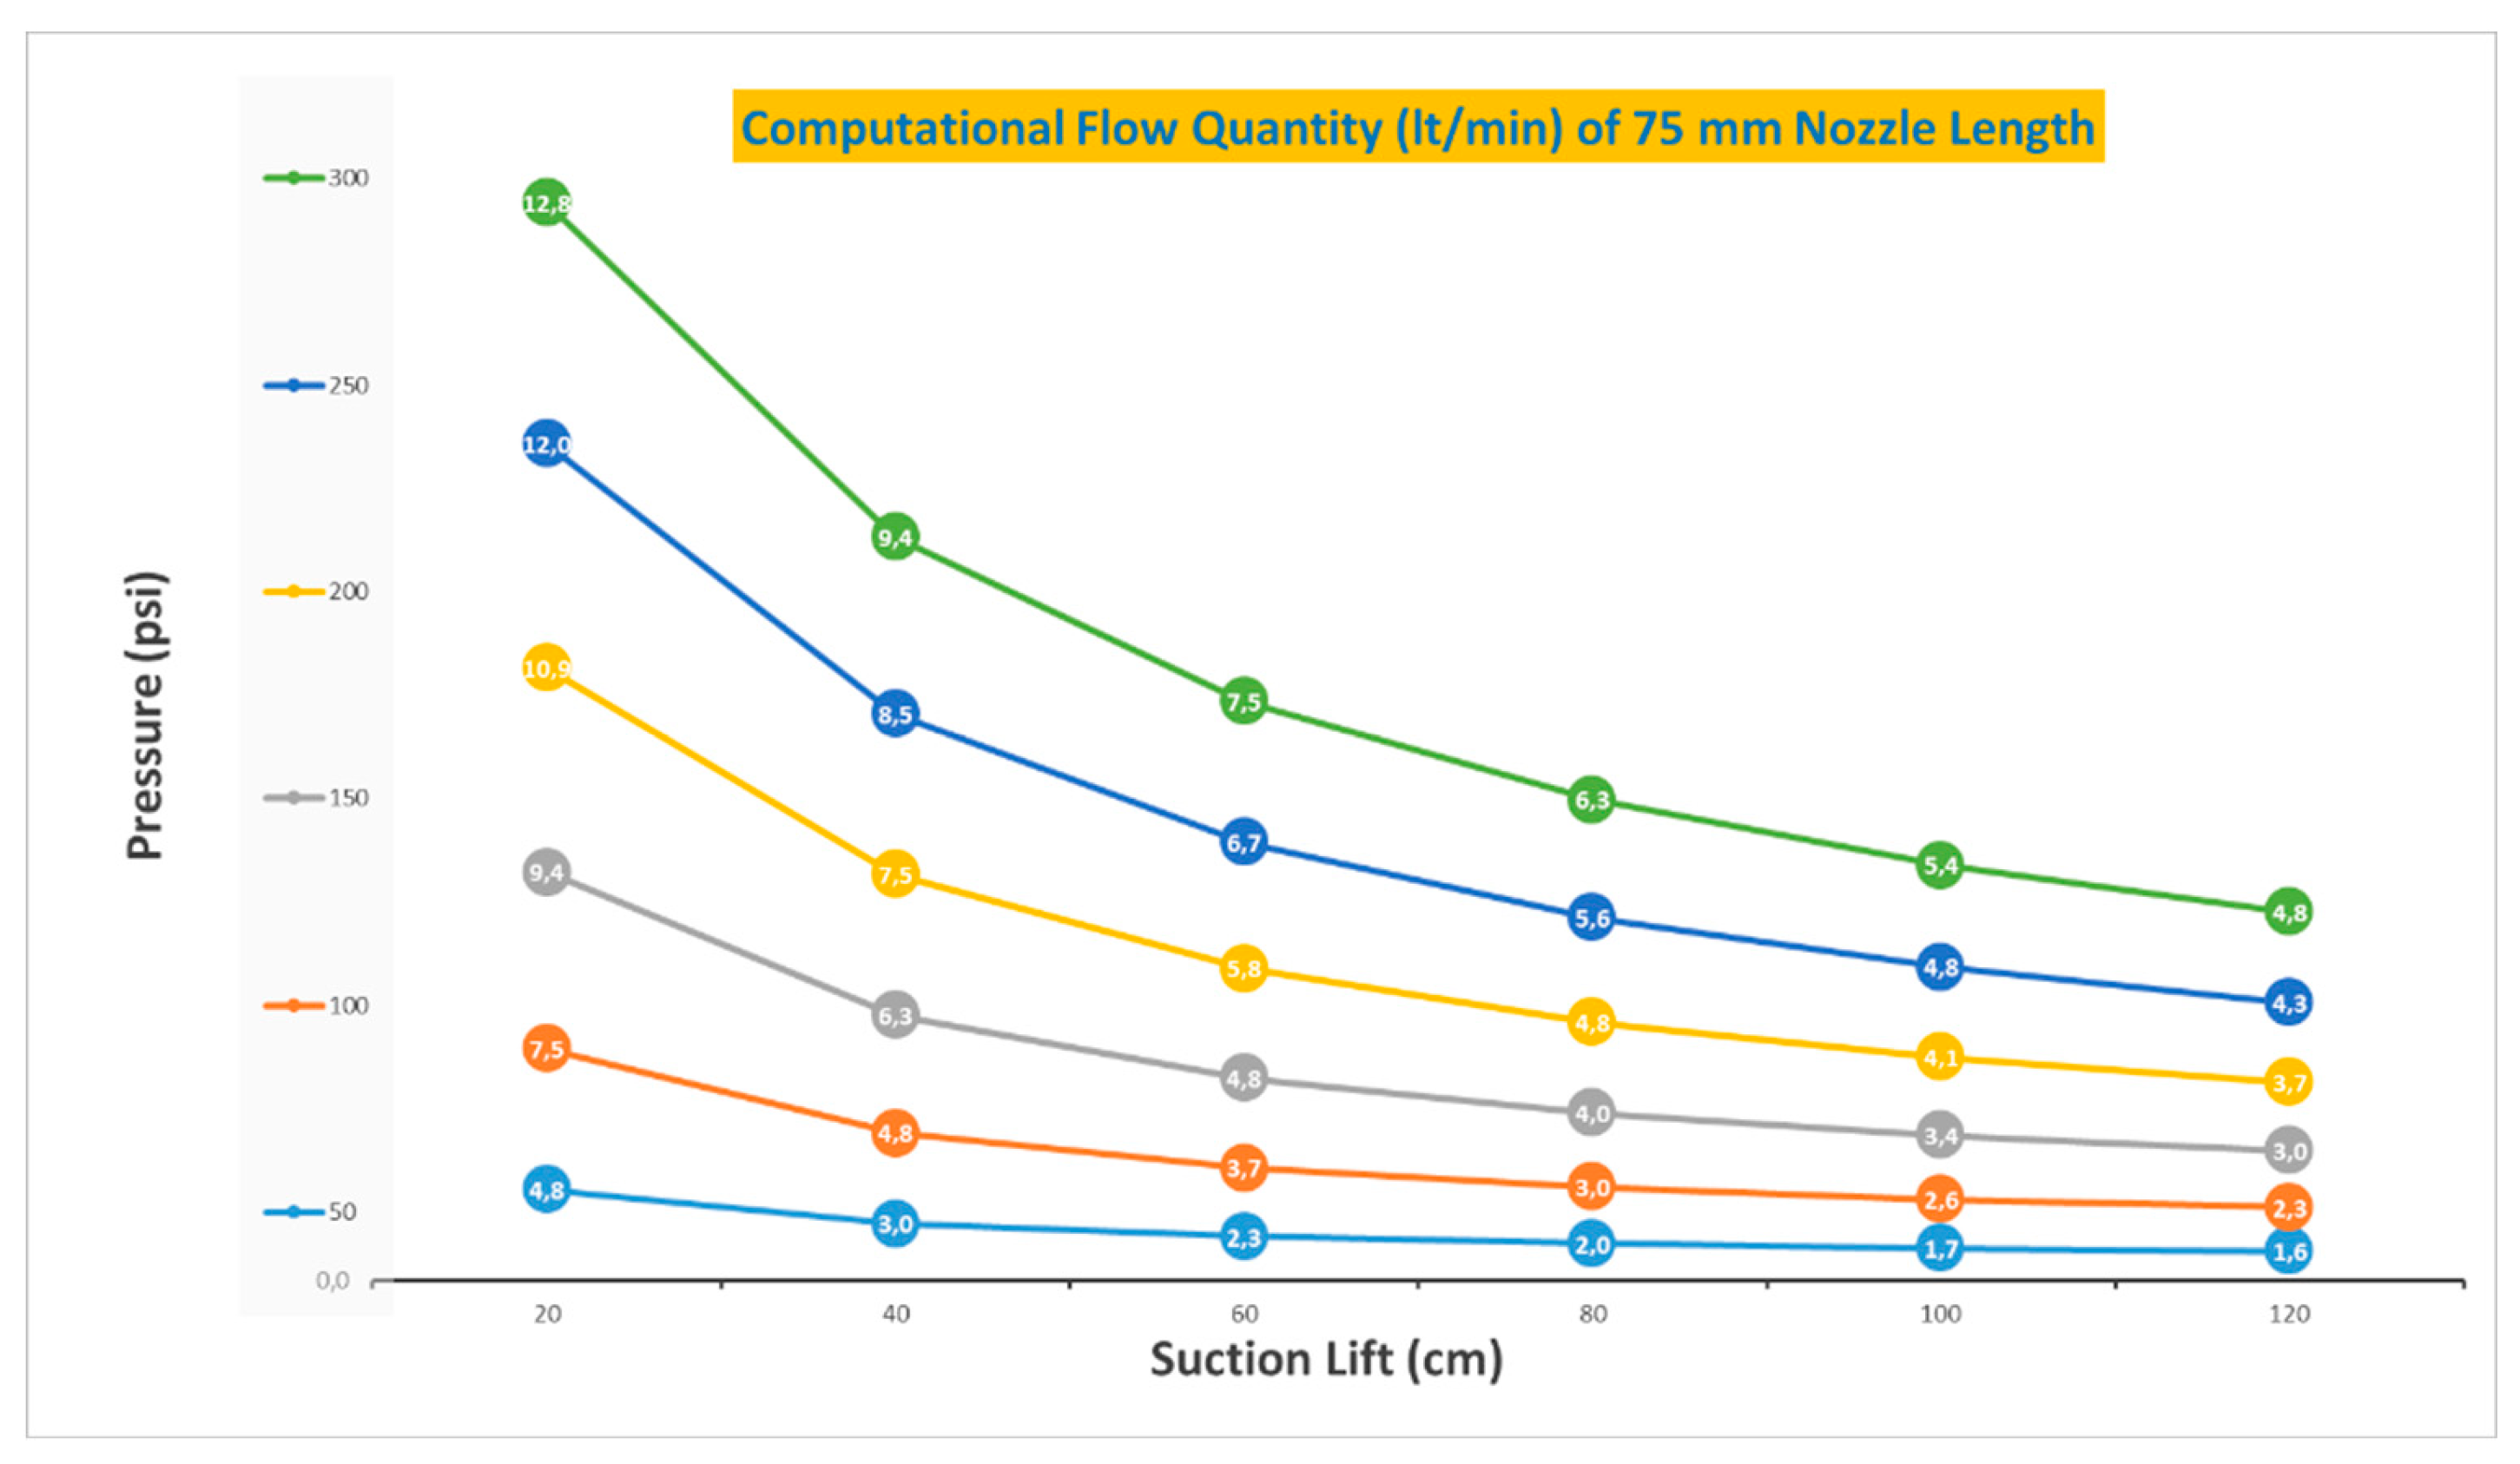
Figure 11.
Computational Flow Quantity Compare for Three Types of Nozzle Lengths.
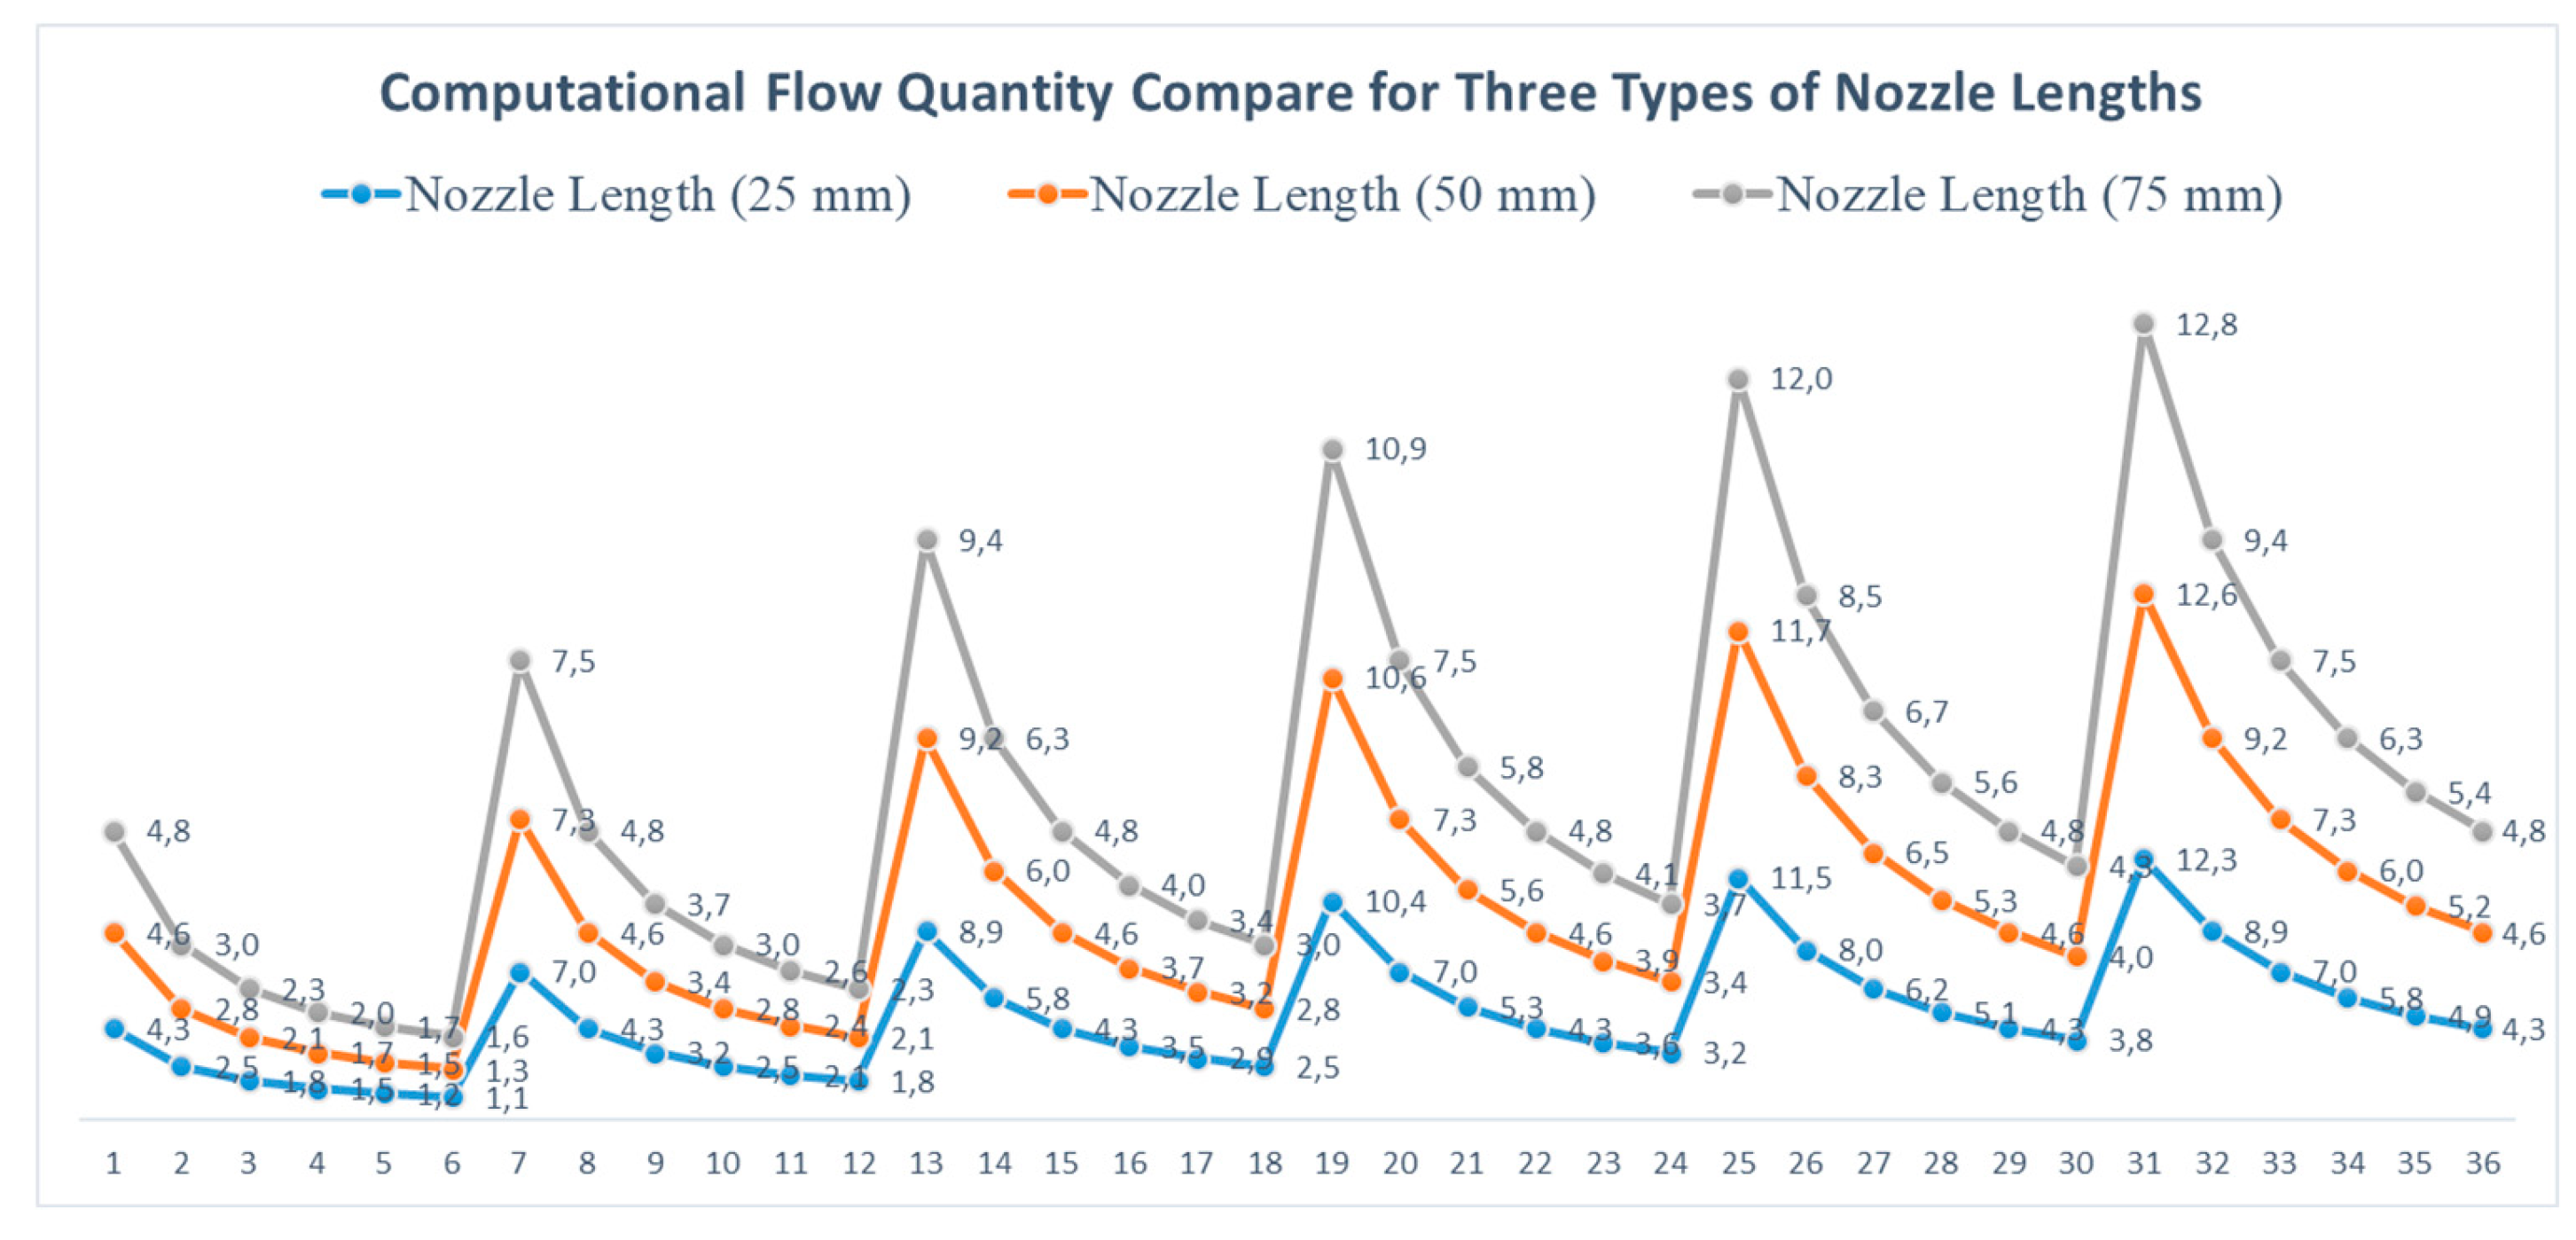
Figure 12.
Results Obtained Using the Experiment and Matlab Code.
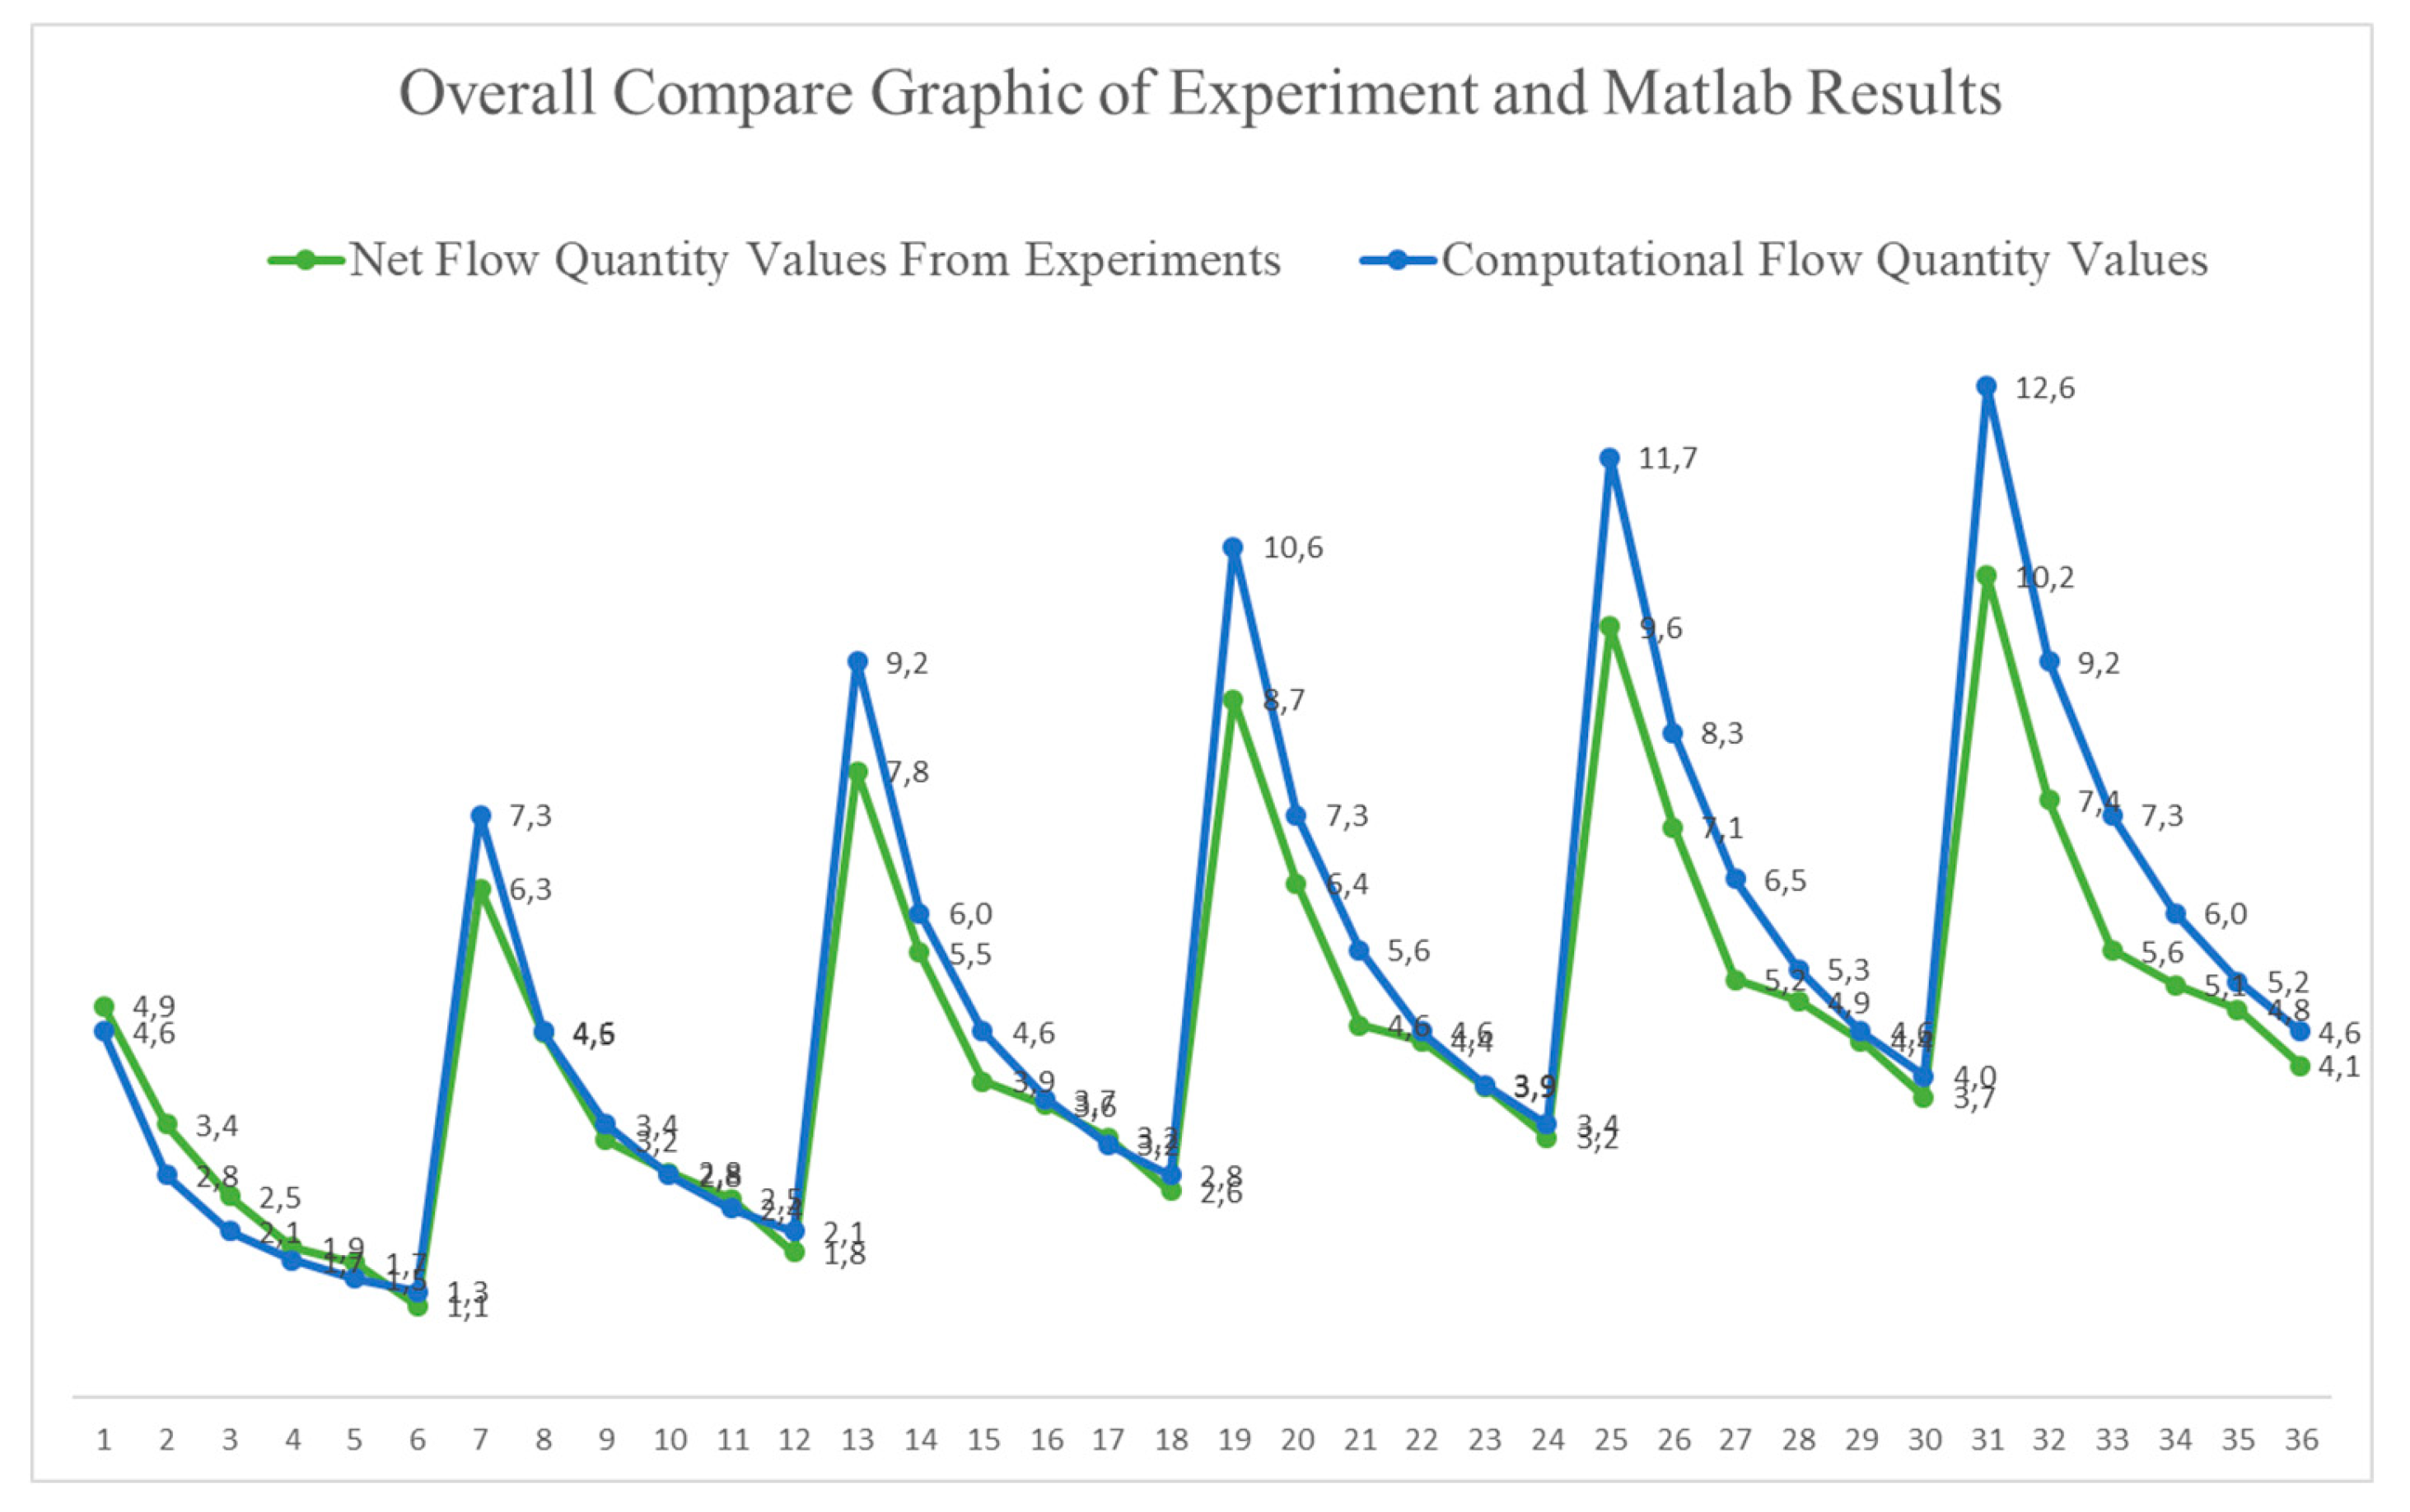

Table 1.
Net Flow Quantity Values for a 25 mm Nozzle Length.
| Nozzle Length (25 mm) | |||||||
| Suction Lift (cm) | |||||||
| 20 | 40 | 60 | 80 | 100 | 120 | ||
| Pressure (psi) | 50 | 4,4 | 3 | 2,1 | 1,4 | 1,3 | 0,7 |
| 100 | 5,9 | 4,2 | 2,8 | 2,3 | 2,1 | 1,4 | |
| 150 | 7,3 | 5,3 | 3,4 | 3,3 | 2,8 | 2,3 | |
| 200 | 8,4 | 6,1 | 4,1 | 4 | 3,5 | 3 | |
| 250 | 9,3 | 6,6 | 4,6 | 4,5 | 4 | 3,4 | |
| 300 | 9,9 | 6,9 | 4,9 | 4,7 | 4,4 | 3,8 | |
Table 2.
Net Flow Quantity Values for a 50 mm Nozzle Length.
| Nozzle Length (50 mm) | |||||||
| Suction Lift (cm) | |||||||
| 20 | 40 | 60 | 80 | 100 | 120 | ||
| Pressure (psi) | 50 | 4,9 | 3,5 | 2,5 | 1,9 | 1,7 | 1,2 |
| 100 | 6,4 | 4,6 | 3,2 | 2,9 | 2,5 | 1,9 | |
| 150 | 7,9 | 5,5 | 4 | 3,7 | 3,3 | 2,6 | |
| 200 | 8,7 | 6,4 | 4,7 | 4,5 | 3,9 | 3,1 | |
| 250 | 9,6 | 7,2 | 5,3 | 5 | 4,5 | 3,6 | |
| 300 | 10 | 7,6 | 5,7 | 5,2 | 4,9 | 4,2 | |
Table 3.
Net Flow Quantity Values for a 75 mm Nozzle Length.
| Nozzle Length (50 mm) | |||||||
| Suction Lift (cm) | |||||||
| 20 | 40 | 60 | 80 | 100 | 120 | ||
| Pressure (psi) | 50 | 5,3 | 3,7 | 2,9 | 2,3 | 2 | 1,5 |
| 100 | 6,7 | 4,8 | 3,6 | 3,2 | 2,8 | 2,1 | |
| 150 | 8,2 | 5,8 | 4,4 | 3,9 | 3,6 | 2,8 | |
| 200 | 9 | 6,7 | 5,1 | 4,8 | 4,2 | 3,6 | |
| 250 | 9,9 | 7,5 | 5,7 | 5,3 | 4,8 | 4,2 | |
| 300 | 10,8 | 7,8 | 6,1 | 5,5 | 5,2 | 4,4 | |
Table 4.
Computational Flow Quantity Values for a 25 mm Nozzle Length.
| Nozzle Length (25 mm) | |||||||
| Suction Lift (cm) | |||||||
| 20 | 40 | 60 | 80 | 100 | 120 | ||
| Pressure (psi) | 50 | 4,3 | 2,5 | 1,8 | 1,5 | 1,2 | 1,1 |
| 100 | 7,0 | 4,3 | 3,2 | 2,5 | 2,1 | 1,8 | |
| 150 | 8,9 | 5,8 | 4,3 | 3,5 | 2,9 | 2,5 | |
| 200 | 10,4 | 7,0 | 5,3 | 4,3 | 3,6 | 3,2 | |
| 250 | 11,5 | 8,0 | 6,2 | 5,1 | 4,3 | 3,8 | |
| 300 | 12,3 | 8,9 | 7,0 | 5,8 | 4,9 | 4,3 | |
Table 5.
Computational Flow Quantity Values for a 50 mm Nozzle Length.
| Nozzle Length (50 mm) | |||||||
| Suction Lift (cm) | |||||||
| 20 | 40 | 60 | 80 | 100 | 120 | ||
| Pressure (psi) | 50 | 4,6 | 2,8 | 2,1 | 1,7 | 1,5 | 1,3 |
| 100 | 7,3 | 4,6 | 3,4 | 2,8 | 2,4 | 2,1 | |
| 150 | 9,2 | 6,0 | 4,6 | 3,7 | 3,2 | 2,8 | |
| 200 | 10,6 | 7,3 | 5,6 | 4,6 | 3,9 | 3,4 | |
| 250 | 11,7 | 8,3 | 6,5 | 5,3 | 4,6 | 4,0 | |
| 300 | 12,6 | 9,2 | 7,3 | 6,0 | 5,2 | 4,6 | |
Table 6.
Computational Flow Quantity Values for a 75 mm Nozzle Length.
| Nozzle Length (75 mm) | |||||||
| Suction Lift (cm) | |||||||
| 20 | 40 | 60 | 80 | 100 | 120 | ||
| Pressure (psi) | 50 | 4,8 | 3,0 | 2,3 | 2,0 | 1,7 | 1,6 |
| 100 | 7,5 | 4,8 | 3,7 | 3,0 | 2,6 | 2,3 | |
| 150 | 9,4 | 6,3 | 4,8 | 4,0 | 3,4 | 3,0 | |
| 200 | 10,9 | 7,5 | 5,8 | 4,8 | 4,1 | 3,7 | |
| 250 | 12,0 | 8,5 | 6,7 | 5,6 | 4,8 | 4,3 | |
| 300 | 12,8 | 9,4 | 7,5 | 6,3 | 5,4 | 4,8 | |
Disclaimer/Publisher’s Note: The statements, opinions and data contained in all publications are solely those of the individual author(s) and contributor(s) and not of MDPI and/or the editor(s). MDPI and/or the editor(s) disclaim responsibility for any injury to people or property resulting from any ideas, methods, instructions or products referred to in the content. |
© 2025 by the authors. Licensee MDPI, Basel, Switzerland. This article is an open access article distributed under the terms and conditions of the Creative Commons Attribution (CC BY) license (http://creativecommons.org/licenses/by/4.0/).
Copyright: This open access article is published under a Creative Commons CC BY 4.0 license, which permit the free download, distribution, and reuse, provided that the author and preprint are cited in any reuse.


