Preprint
Article

This version is not peer-reviewed.

Detection of Undeclared Meat Species and Fatty Acid Variations in Industrial and Traditional Beef Sausages

A peer-reviewed article of this preprint also exists.

Submitted:

13 March 2025

Posted:

13 March 2025

You are already at the latest version

Abstract

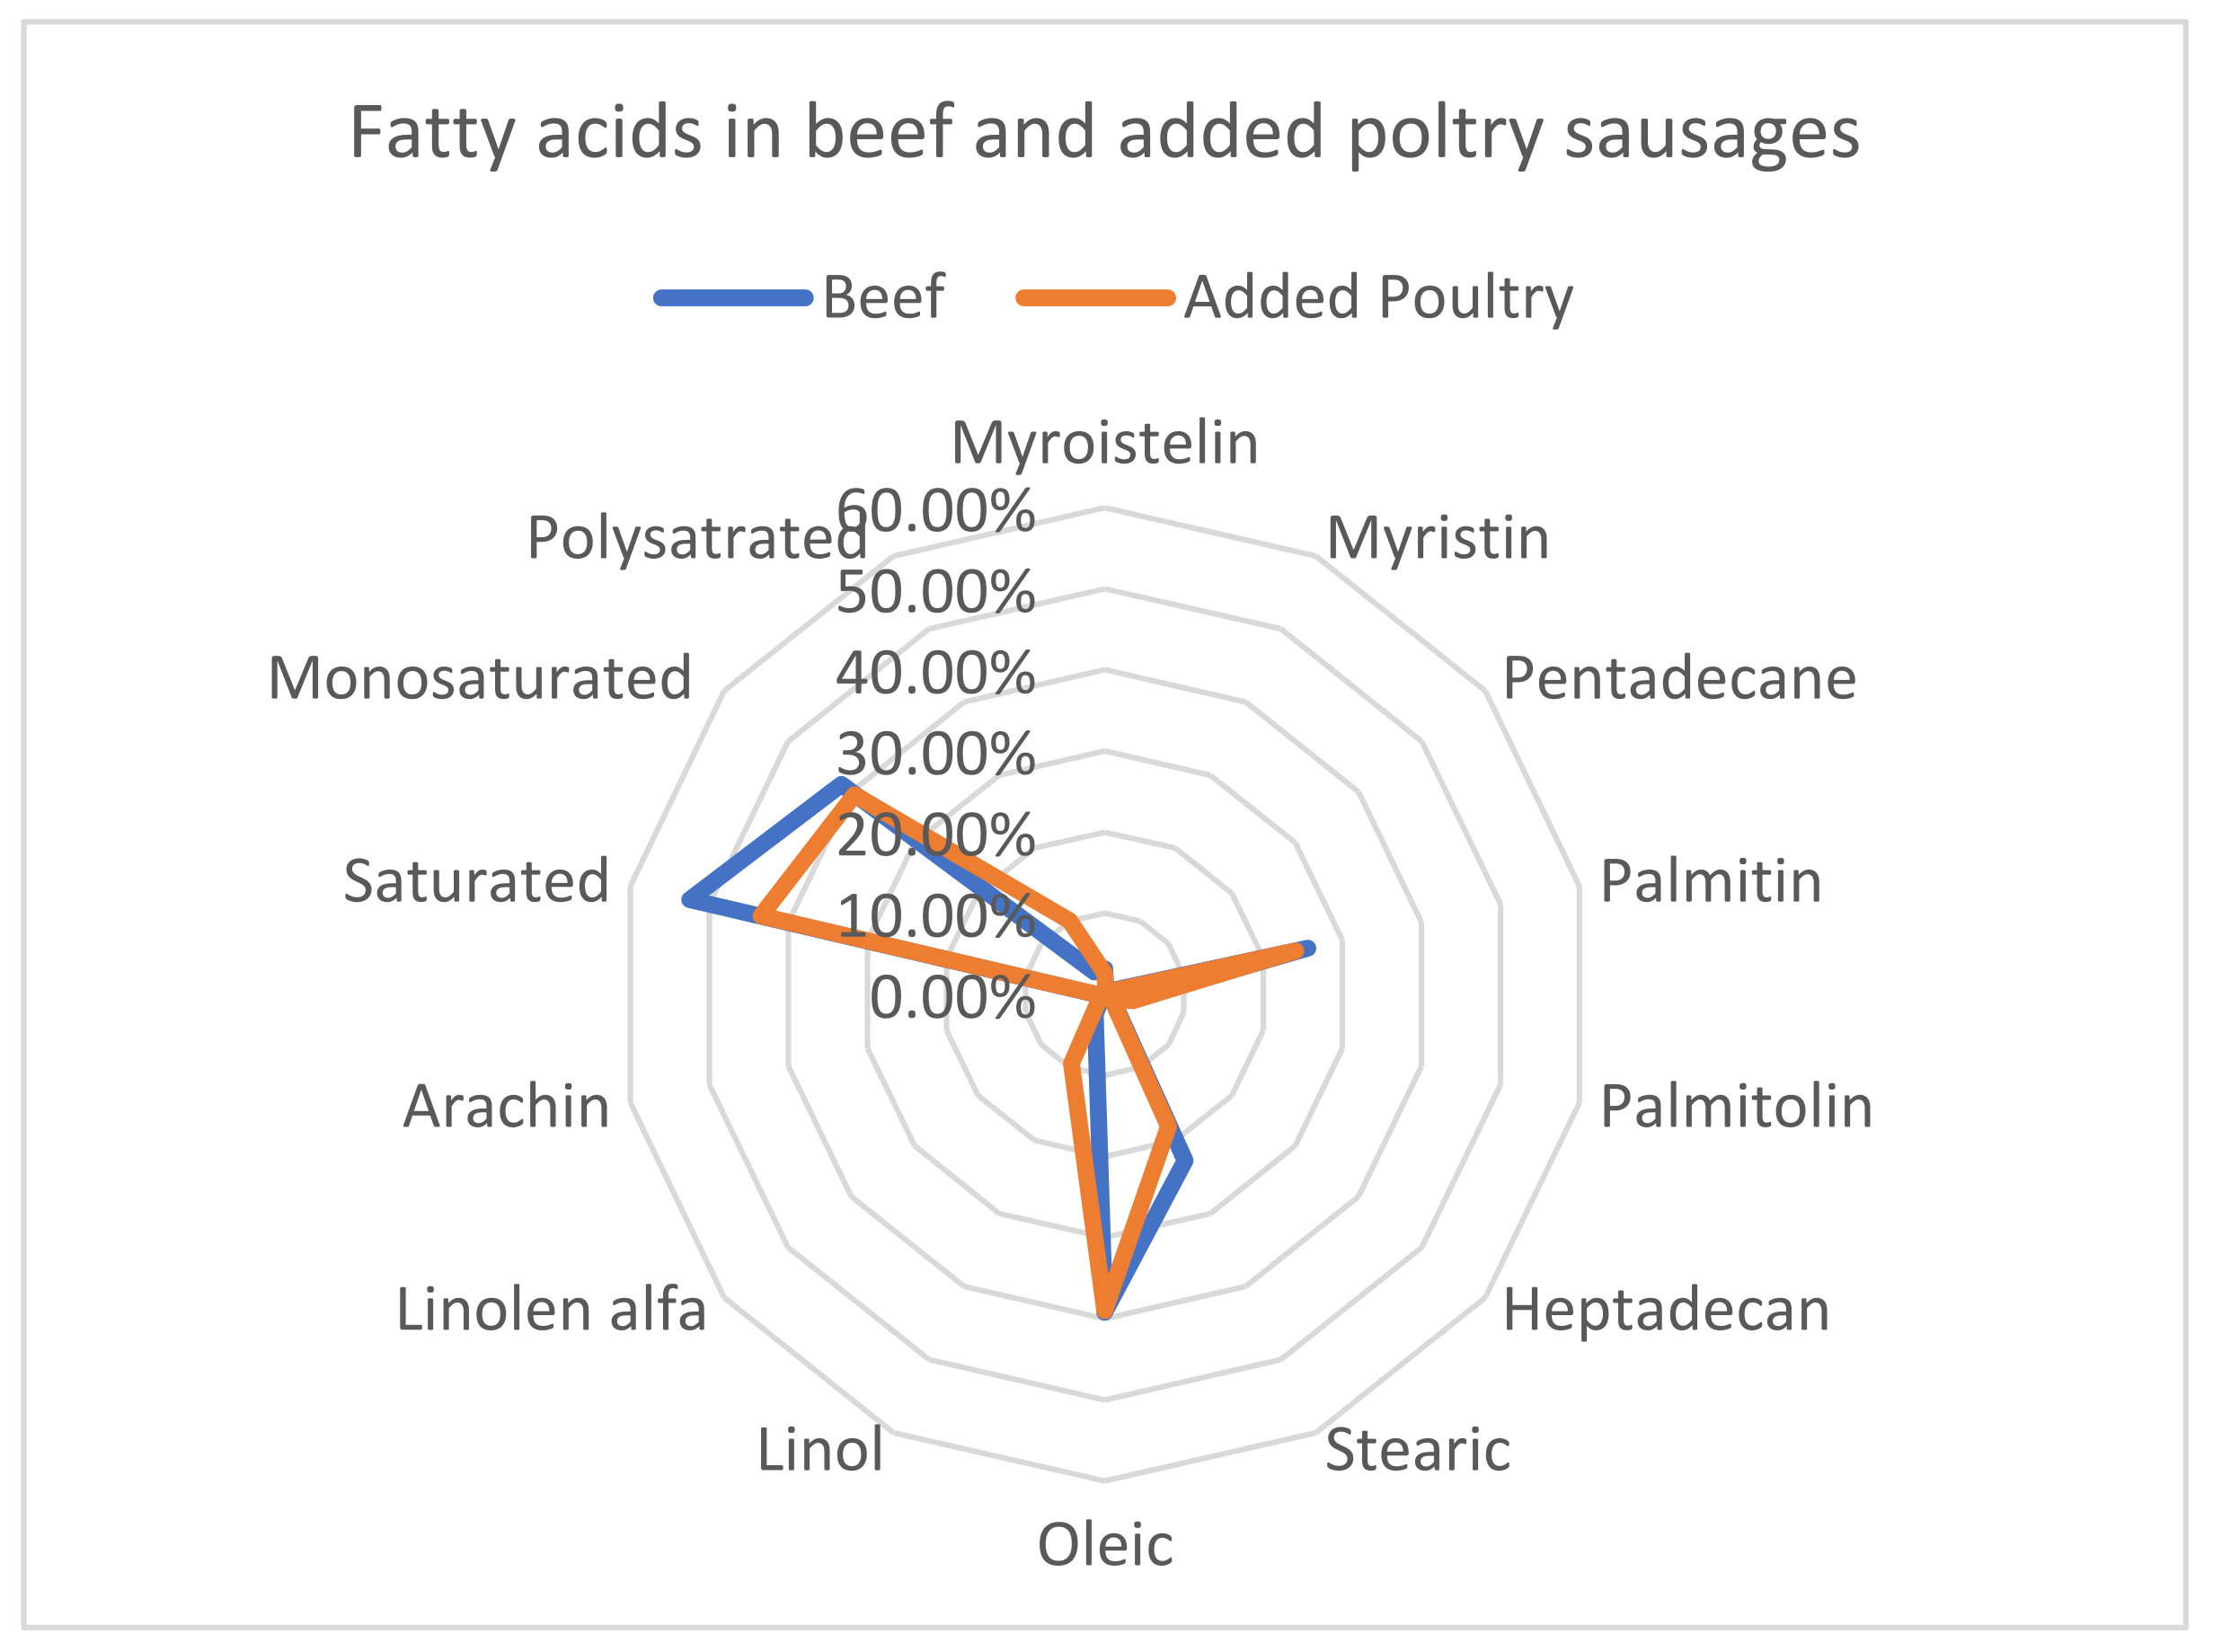
This study investigates the presence of undeclared meat species in beef sausages and analyzes the impact of poultry meat addition on the fatty acid composition. A total of 68 beef sausage samples were analyzed, comprising 43 industrial and 25 traditional (homemade) sausages. Using the LCD Array Analysis System, Meat 5.0, we detected that 52.94% of the samples contained meat from other species, with poultry being the most frequently added (45.55%), followed by mutton (4.41%) and turkey (2.9%). Notably, 46.42% of industrial sausages with added meat and 100% of homemade sausages with mixed meat were undeclared, highlighting significant mislabeling concerns. Fatty acid analysis with GC-FID revealed that sausages with poultry meat exhibited lower levels of saturated fatty acids (SFAs) and higher polyunsaturated fatty acids (PUFAs), particularly linoleic (C18:2) and alfa-linolenic (C18:3) acids. The inclusion of poultry meat significantly reduced the proportion of palmitic (C16:0) and stearic (C18:0) acids while increasing unsaturated fatty acids. As the percentage of poultry meat increased, SFAs decreased from 54.08% (at 10% poultry) to 29.55% (at 90%), while PUFAs rose from 4.09% to 26.64%. These findings indicate that poultry addition enhances the nutritional profile of sausages by improving the fatty acid balance. This study highlights the need for stricter labeling regulations to ensure consumer transparency. Future research should explore these modified products' sensory and quality attributes to assess their market acceptance.

Keywords: 
;  ;  ;  ;  ;  

1. Introduction

Meat is highly nutritious and contributes several essential nutrients that are difficult to obtain in the right amounts from other food sources [1]. Animal proteins are generally highly digestible and nutritionally superior to plant proteins, with higher amino acid bioavailability [2]. Among many meat products, sausages are privileged foods due to their diversity, nutritional value, deep roots in the peoples' culture, and economic importance. [3]. There has been tremendous improvement in almost all aspects of Sausage production such as the Shape of the product, species of animals used, casings, ingredients, equipment and machines, etc., further advances will still be made in sausage production due to the revolution of technology even in areas that have been addressed and the ones that are yet to be researched [4].
Adding meat from other species, like poultry or pork, to beef sausage is done for economic reasons because it has to do with the fraudulent substitution of cheaper meats for more expensive species [5]. This can have severe economic and ethical repercussions because, in some countries, the addition of poultry and other meats to products made from 100% beef is prohibited, or the use of pork and single-hoofed meat is a matter of concern due to religious reasons [6]. Adding chicken to beef sausages can also change the fatty acid composition of the sausage because the fatty acid profile is strongly influenced by the type of meats, as well as other ingredients such as vegetable oil and lard, used in its formulation [7]. So, in homemade beef sausages, saturated fatty acids accounted for 59.10% of total fatty acids, followed by monounsaturated (38.63%) and polyunsaturated fatty acids (2.27%). The fatty acid profile was dominated by oleic (C18:1, 34.37%) and palmitic (C16:0, 30.24%) acids, and short-chain fatty acids were also present [8]. On the other hand, chicken meat had a lower proportion of saturated fatty acids (36.4%) than beef (53.3%) and a higher proportion of polyunsaturated fatty acids (21.3%) than beef (3.0 %) [9] and the most common fatty acids in chicken meat were linoleic, oleic, and palmitic [10].
Even though substitution with species, protein content, fat content, or plant ingredients are major forms of food substitution, adulterated food products are responsible for mild to severe potential risks to public health and the environment [11]. Diarrhea, nausea, allergic reaction, diabetes, cardiovascular disease, etc., are frequently observed illnesses upon consumption of adulterated food [12]. For the reasons stated above, meat production companies must declare the addition of other spices and various grain flour to sausage. This is because a potential disagreement is observed between consumers’ expectations of meat products’ labeling and the level of transparency that can be achieved with current regulations. In particular, using “and/or” in meat products warrants further attention, notably regarding consumer education and industry guidance [14]. It should also emphasize the importance of increasing transparency and accountability within the food industry through improved communication and enforcement of regulatory standards and the need for ongoing education and training initiatives to raise awareness of food safety regulations [14]. Undeclared additions can erode trust in food labeling and regulatory systems, so the declaration of additions in sausages distinguishes between trust in food labeling itself and the trust that consumers develop in the food supply system through food labeling [15].
Meanwhile, the labeling of products is the responsibility of every company that pro-duces food, and labeling is sanctioned by the Kosovo national regulation on labeling, presentation, and advertising of food products – Administrative Instruction No. 09/2013 [16], as well as the European Union regulation No. 1169/2011 on the provision of food in-formation to consumers. This regulation mandates that food business operators provide clear and accurate information about the contents of their products to ensure consumer transparency. According to Annex VII, Part B of this regulation, the species from which the meat originates must be declared [17]. However, despite this fact, meat products are targets for species substitution and adulteration due to their market value. Therefore, it is essential to use appropriate science-based methods for determining the species origin in meat products. DNA barcoding is a useful technique for the molecular identification of biological specimens and raw and processed foods [18], and researchers have found detailed information about frequent game species used as adulterants for regular meat products and the DNA-based techniques to identify them. [19].

2. Materials and Methods

2.1. The Sampling

68 samples, 43 industrial and 25 traditional sausages, were collected from the market or the production site. The collection was carried out without considering whether the meat from different species was declared on the label. Each sample containing 250 g was divided into two parts for molecular and chemistry testing. Samples were kept at 4°C until further testing. This sample size allows for initial exploration and provides valuable insights into the use of different species meat in sausages, although we know that a larger and more diverse database would provide more representative results.

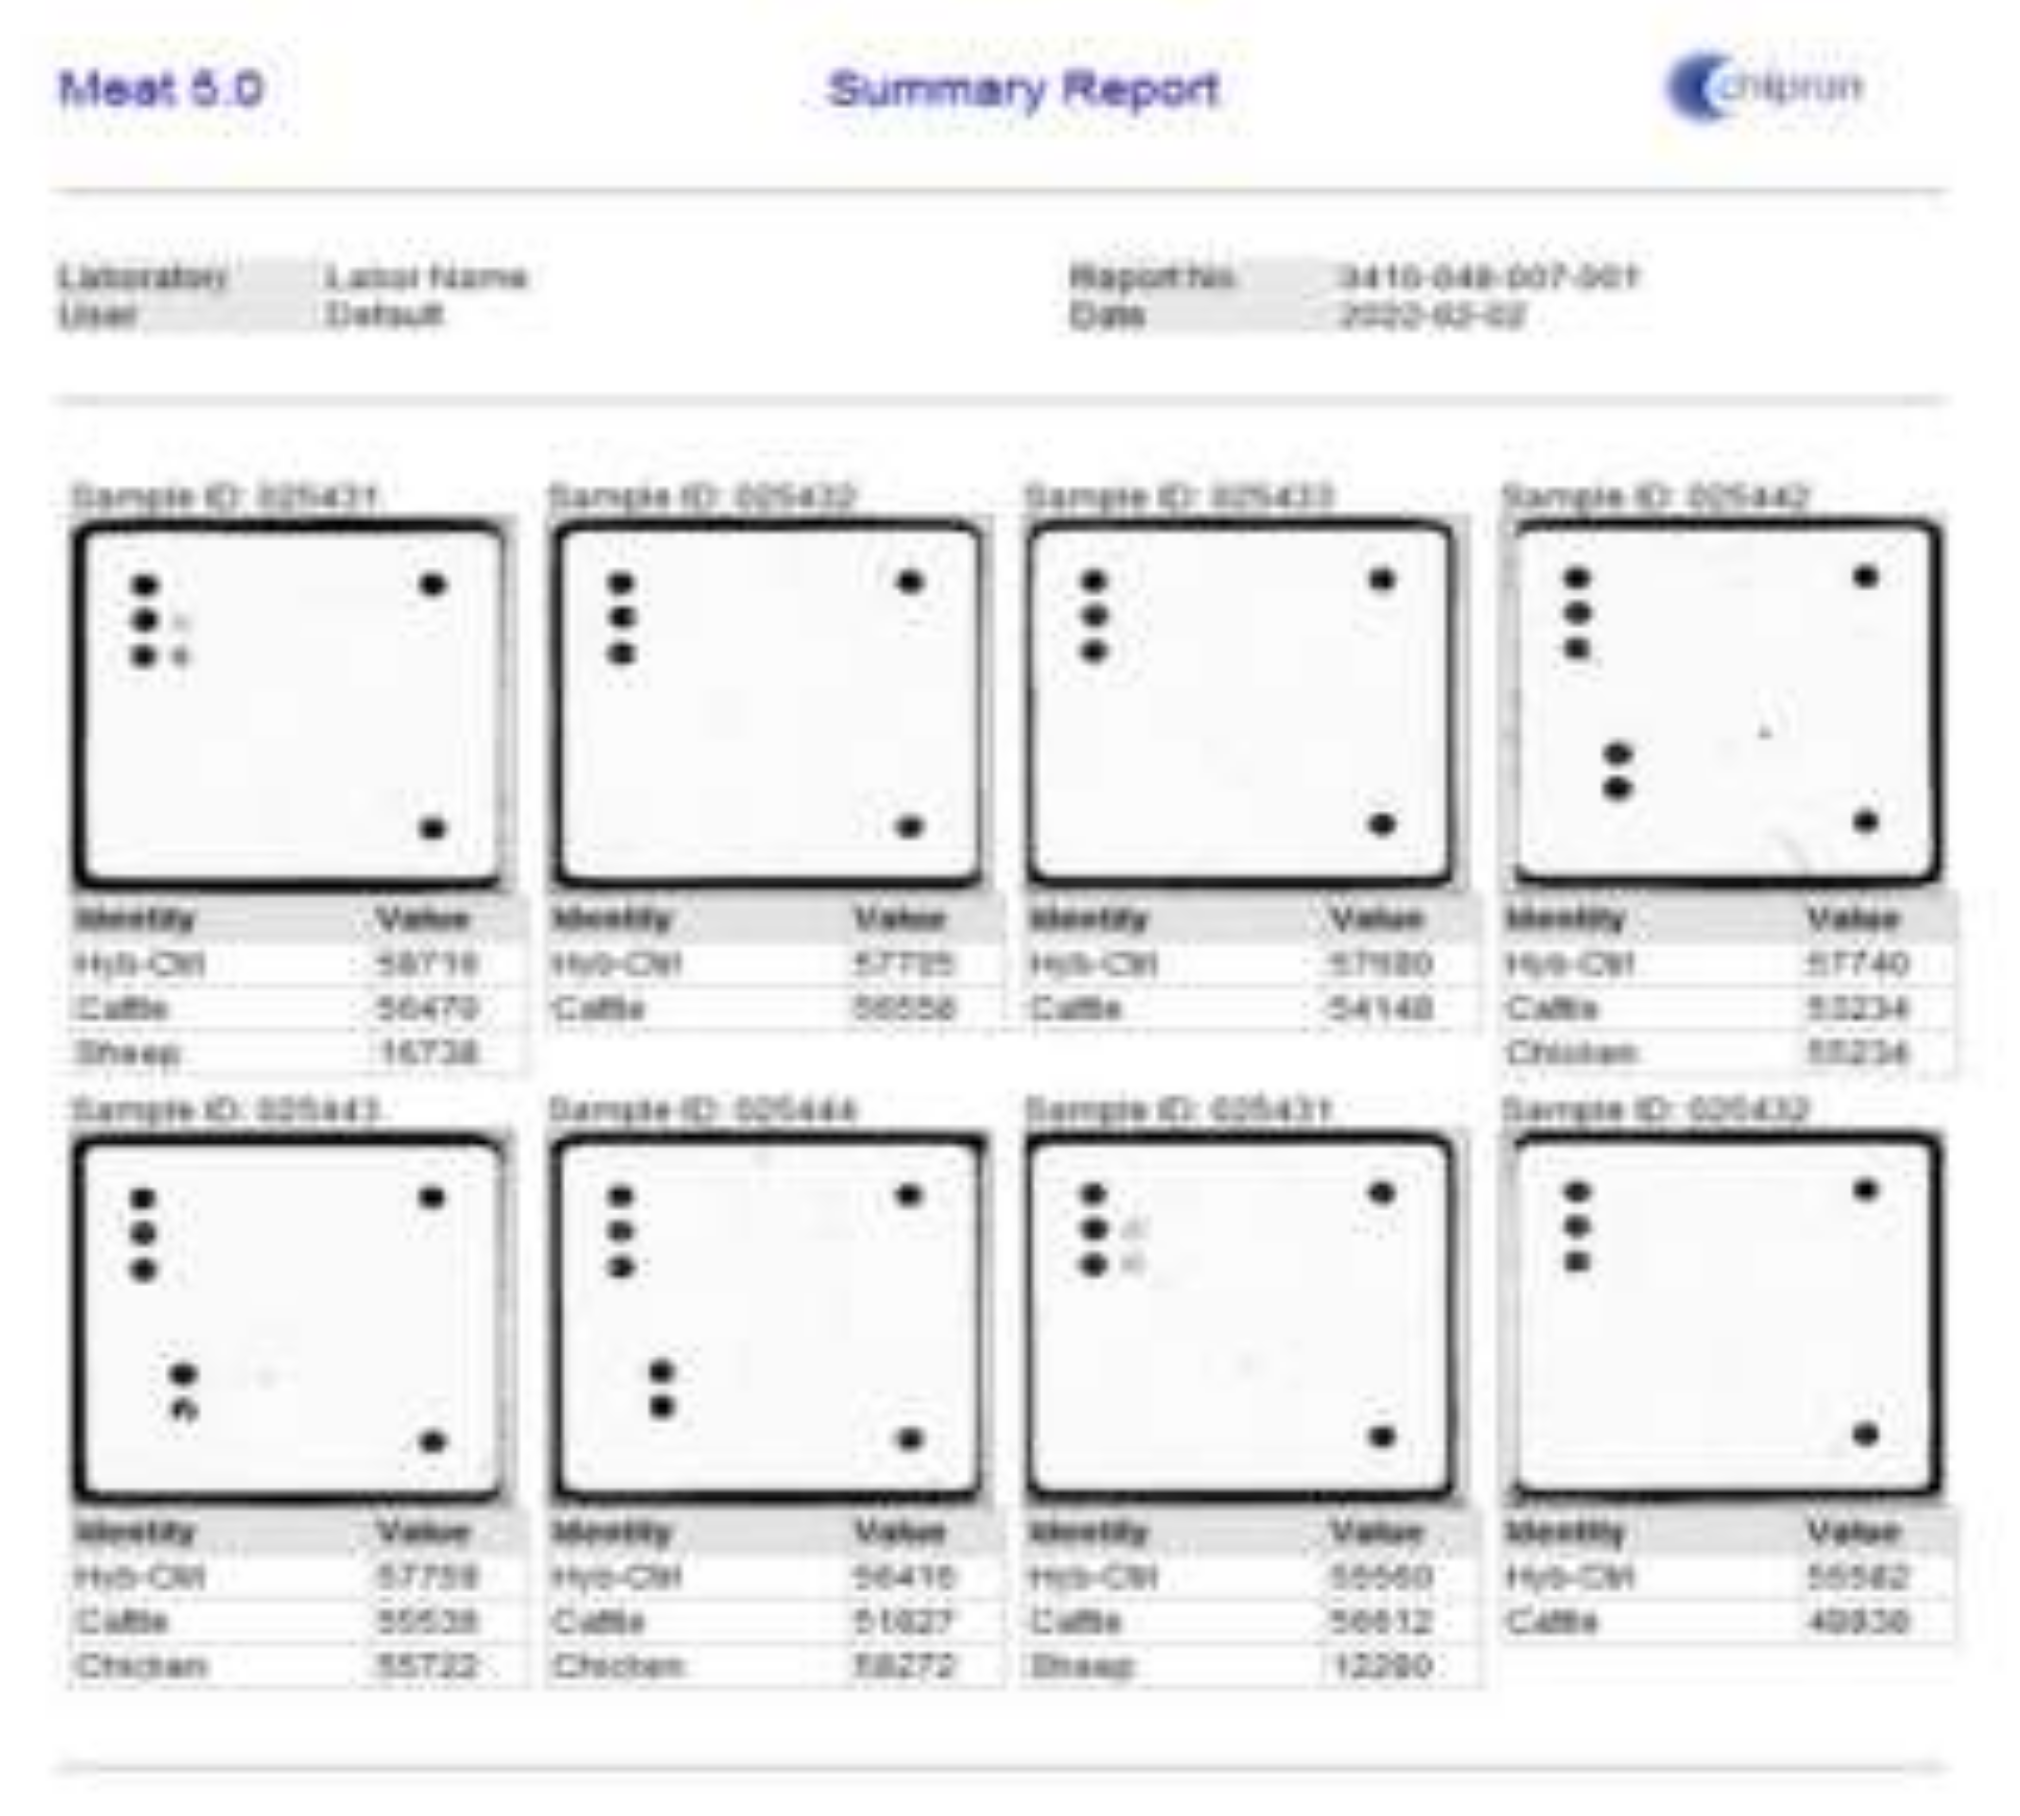
2.2. Chipron LCD Array Analysis System, Meat 5.0 – a DNA-Based Identification of 24 Animal Species in Meat Products

The MEAT 5.0 LCD-Array Kit has especially been developed for laboratories working in quality assurance and food authenticity testing. Comprising excellent specificity and detection limits of < 1% even in extensively processed food matrices (Fc-values > 24), it is the perfect tool to identify unwanted, undeclared, or intentionally mislabeled adulterations along the entire supply chain. The assay is based on a single-tube PCR amplification using primer pairs directed against a 125-165 bp fragment of the mitochondrial 16S rRNA gene. Due to the multiple copies of the mitochondrial genome per cell, the assay sensitivity is sufficient to robustly detect 0.5 to 1 nuclear genome equivalents per species. Detection limits concerning relative amounts of wet or dry weight in mixtures containing tissue / DNA from more than one animal species are in the range of 0.1 %.

2.2.1. Extraction of Sample

DNA extraction was performed by using DNeay Mericon Food Kit Qiagen®, which uses a modified cetyltrimethylammonium bromide (CTAB) extraction method. Extraction (excluding validation samples) will be performed according to the manufacturer’s standard Protocol (200 mg). The starting amount of 200 mg of the sample was used in duplicate Eppendorf tubes to get a sufficient amount of supernatant. One stainless steel bead and 1 ml of tissue lysis buffer were added to each microcentrifuge tube. Samples were ruptured by TissuLyser II Qiagen®, 30 oscillation /sec for 30 sec. Afterward, 1 ml of the mixture was taken and proceeded as indicated in the extraction protocol by adding 2.5µl of proteinase K into each tube. Samples were incubated in a thermomixer with constant shaking (1000 rpm) at 60°C for 30 min. After incubation, samples were adapted to room temperature for 10 min and then briefly on ice after incubation. Afterward, samples were centrifuged for 5 min at 2000 x g. 700 µl of supernatant was collected from both duplicates of microcentrifuge tubes were transferred into 2ml microcentrifuge tubes containing 500 µl of chloroform from Fischer Chemicals. The resulting mixture was mixed by vortexing for 15 s and centrifuged at 14,000 x g for 15 min. Then into a fresh 2 ml microcentrifuge tube 350 µl of Buffer PB and 350 µl of the upper, aqueous phase was added and mixed thoroughly by vortexing. The mixture was transferred into the QIAquick spin column placed in a 2 ml collection tube, centrifuged at 16,100 x g for 1 min and the flow-through discarded. Afterward, 500 µl Buffer AW2 was applied into the QIAquick spin column, centrifuged at 16,100 x g for 1 min and flow-through was discarded. The centrifuging step was repeated at 16,100 x g for 1 min to dry the membrane. The QIAquick spin columns were transferred into 1.5 ml microcentrifuge tubes and 150 µl Buffer EB was applied directly onto the QIAquick membrane. Incubated for 1 min at room temperature (15–25°C), and then centrifuged at 16,100 x g for 1 min to elute. Elution was ready for downstream amplification.
We take appropriate precautions to prevent contamination, e.g. by using filter tips and wearing gloves. Thaw reagents, mix (do not vortex!), and briefly spin vials before opening. We Pipet 20 µl of Master Mix into each strip or plate well (n samples + 2 controls). Pipet 5 µl of samples, negative control or Control Template into respective wells. Seal strips/plate accurately, briefly y spin strips/plate in a suitable centrifuge, and then start a rt PCR run.

2.2.2. LCD -Array

Each MEAT 5.0 LCD-Array chip (Chipron, Berlin, Germany) contains 25 species-specific capture probes fixed to each chip. These probes immobilized as duplicates, allow simultaneous detection of 17 mammalian species (cattle, sheep, horse, goat, camel, buffalo, pig, kangaroo, hare, rabbit, reindeer, roe deer, red deer, fallow deer, springbok, dog, cat) and seven bird species (chicken, turkey, goose, ostrich, mallard duck, Muscovy duck, pheasant) in food preparations. PCR runs were performed in a TOptical Gradient 96 thermocycler (Biometra, Göttingen, Germany). Amplification was performed according to the manufacturer’s instructions. Each PCR reaction contained 25 µl of an amplification mixture consisting of 12.5 µlL of × 2 Master mix (including × 10 PCR buffer, 1.5–2.0 mM MgCl2 and 10 mM each dNTP mix, and Taq Polymerase 5 U·µl-1 (EC 2.7.7.7)), 1.5 mL of primer mix ‘MEAT’, 6 µl of PCR grade water and 5 µl of diluted DNA sample. Primer mix “MEAT” and × 2 Master mix were supplied in the MEAT 5.0 LCD-Array kit. The cycle regime was set to one cycle for initial denaturation for 5 min at 95 °C, 35 repetitions including denaturation for 30 s at 94 °C, annealing for 45 s at 57 °C and elongation for 45 s at 72 °C. The last step, strand competition, ended the PCR program and took 2 min at 72 °C. To verify the presence of amplified DNA in each sample, electrophoresis on 2% agarose gel was used. LCD array hybridization was performed according to the manufacturer’s instructions. During hybridization (at 35 °C, 30 min), labeled PCR fragments were bound to specific immobilized capture probes as a dark precipitate at the bottom of each chip and were visualized by a PF3650u LCD-array scanner (PacificImage Electronics, Torrance, California, USA) using SlideReader V12 software (Chipron, Berlin, Germany). Reactions were replicated twice per analysis. The default detection cut-off threshold was a pixel value of 2000 (MEAT 5.0 Manual, version 1-1-2014).
Figure 1. LCD - chip during analysis with LCD Array.
Preprints 152241 g001

2.3. Gas Chromatography–Flame Ionization Detector (GC/FID).

Analytical determination was achieved using the MIX FAME-s fatty acid standard.
The procedure is based on base-catalyzed transesterification of fatty acids, forming methyl esters (FAME-s), and modified from Haifeng Sun and Suli Zhao, 2014 [20]. The following chemicals were used: hexane 99.9% from Honeywell Riedel-de-Haën™ (Honeywell, Charlotte, NC, USA), methanol 99.9% CHROMASOLV™ from Honeywell Riedel-de-Haën™ (Honeywell, Charlotte, NC, USA), ethyl acetate 99.7% CHROMASOLV™ from Honeywell Riedel-de-Haën™ (Honeywell, Charlotte, NC, USA), and sodium methylate from Merk and Supelco® 37 Component FAME Mix Sigma-Aldrich®, Burlington, MA, USA, as a certified reference material (CRM) by ISO 17034 and ISO/IEC 17025.

Extraction Procedure and Derivatization of Fatty Acids

Samples were homogenized with a Velp Scientifica™ OV5 homogenizer (Usmate Velate (MB), Itlay). After homogenization, 500 mg of the sample was placed into 15 mL conical tubes and mixed with 5 mL of hexane (99.9%). After vortexing for 1 minute, 1 mL of sodium methoxide (5.4 M) in methanol was added and mixed for 1 minute by vortexing. Esterification was performed at room temperature. After strong vortexing for 1 minute and centrifuging for 5 min at 5000 rpm, the supernatant was transferred to a 2 mL glass vial and 2 uL was injected in the GC/FID analysis. Samples were analyzed within an hour after esterification. The determination of FAMEs was conducted using an Agilent 8890 GC System, which features a split/splitless inlet and an FID detector, along with an Agilent 7693 automatic liquid sampler (ALS). The operational setup of GC-FID is shown in Table 1.
Otherwise, the validation of the GC-FID method was carried out based on ICH guidance entitled Text on Validation of Analytical Procedures (ICH Q2A), which presents a discussion of the characteristics that should be considered during the validation of analytical procedures. Its purpose is to provide some guidance and recommendations on how to consider the various validation characteristics for each analytical procedure [21]. The calibration curve of the GC-FID method for fatty acids is done by mixing beef ground meat with 2, 7, 10, 20, 30, 40, 50, 60, 70, 80, and 90% of chicken mechanically deboned meat (MDM). Eleven samples of traditional sausages from small family businesses tested as negative for chicken matter using an LCD Array. Each MEAT 5.0 was used as a beef matrix for mixing with chicken MDM in different proportions for validation of methods as shown in Table 2.

2.4. Statistical Analysis

A one-way ANOVA test was used to assess differences in mean values among groups. The correlation between Ct values obtained from the LCD Array for different species' DNA and the fatty acid content was determined using the correlation analysis tool in Analysis ToolPak (Microsoft Excel, 2016)."

3. Results and Discussion

3.1. Detection of DNA of species in beef sausages

The research included 68 beef sausage samples, of which 43, or 63.23%, were industrial sausages, while 25, or 36.76%, were traditional (homemade) sausages. After obtaining the results for the presence of DNA from meat of different species in declared beef sausages, it turns out that in the 32 (47.05%) samples were detected only DNA of beef, 31 (45.55%) with the detected of chicken DNA, 3 (4.41%) samples with the mutton and 2 (2.9%) samples with detected turkey DNA. It is worth noting that mutton DNA was detected in 2 sausages containing beef DNA and 1 beef sausage containing chicken DNA, while turkey DNA was detected only in the beef declared with detected chicken DNA. None of the 68 samples contained a DNA of other mammalian species like a horse, goat, camel, buffalo, pig, kangaroo, hare, rabbit, reindeer, roe deer, red deer, fallow deer, springbok, dog, cat, and bird species like a goose, ostrich, mallard duck, Muscovy duck, and pheasant.
Regarding industrial sausage (n=43), it turns out that 15 of them (34.8%) resulted in only beef DNA, while 28 of them (65.2%) had detected DNA of other species. Of the 28 samples with detected other species DNA, 23 (82.14%) resulted with detected chicken DNA. In comparison, 3 samples (10.71%) resulted with detected mutton DNA (2 samples with beef and 1 sample with also detected chicken DNA), and 2 samples (7.14%) resulted positive in turkey DNA (both samples in beef sausages detected with chicken DNA). Regarding beef homemade sausage (n=25), it turns out that 17 of them (68%) resulted in beef DNA, while 8 of them (32%) had DNA of other species. Of the 8 samples, 7 of them (87.5%) contained chicken DNA, while 1 sample (13.5%) resulted in the presence of mutton DNA.
Of all the beef sausage samples that tested positive for the presence of DNA from other species (n=36), 28 of them belonged to industrial sausages, and of these, 15, or 41.66%, were declared, compared to 13 samples, or 46.42%, which were not declared. On the other hand, none of the 8 samples of traditional beef sausage, which tested positive for the presence of DNA of other species, declared the presence of the contents of these species.
Results obtained from that analysis by Chipron LCD Array Analysis System, Meat 5.0 method of sausage, show that 36 out of 68 samples, or 52.94%, resulted positive in DNA of other species and the suspicion of intentional addition of meat of other species. The presence of poultry DNA (45.55%) is a reference to deliberate addition since, from an economic point of view, it is more profitable to add meat of cheaper species. When it comes to the presence of mutton DNA (4.41%), which has a higher price than beef itself, this does not surprise us since, in a region of Kosovo, mutton meat is added to beef sausage to improve its organoleptic properties. Without a doubt, we also leave open the possibility of cross-contamination through used edible mutton intestines. The high presence of poultry DNA in beef sausage, for economic reasons, will be the ongoing focus of our work.
Compared to works by other authors, these values are somewhat lower than a study focusing on the substitution of meat species in Poland, which found that 60% of the foods analyzed contained an undeclared ingredient or the substitution of an expensive ingredient with a cheaper option. [22] and that from 28 beef sausages, 17 (60 % were added by poultry, and the results showed that 112 (78.3%) samples were mislabeled, attributed to the false declaration of species and/or presence of undeclared meat species [23]. On the other hand, our results are higher than those of other authors, such as beef sausages containing 33 % of chicken meat. [24], that the results indicate that 15 (14.7%) of the total samples were found to contain undeclared species, and 7 (21.8%) and 2 (6.06%) poultry meat were detected in 32 salami and 33 sausage samples, respectively [25] and that undeclared animal species were detected in 27% of the meat products tested [26].
It is worth noting that the addition of meat from other species to industrial sausages was perhaps expected, but such findings in 32% of homemade sausages are somewhat of a surprise, considering that traditional recipes for homemade sausage making in Kosovo are composed of 100% beef only. Consumer acceptance is crucial, as the inclusion of other meat species in beef sausages, despite economic benefits, may face resistance without sensory studies on added poultry impact, also knowing that in Kosovo, traditional food authenticity is highly valued, making undisclosed additions potentially controversial.
The LCD Array proves to be a reliable and sensitive method for detecting species' DNA, with this study confirming its high accuracy in food testing. Other authors also found that PCR was associated with a commercial DNA macro-array on pure meat samples, spiked samples, proficiency test samples, and processed samples showed high specificity on the targeted species and allowed a sensitivity down to 1% (w/w) [27] and that the Meat 5.0 LCD-Array kit is highly specific and allow easy identification of animal species, sufficiently sensitive and provide repeatable results and recommend these methods of analysis to comprehensively monitor the presence of animal species in food samples, regardless of the degree of heat treatment or mechanical processing, as a tool to detect food adulteration [28].

3.2. Prevalence of the Fatty Acid In Sausages Made With 100 % Beef And Added Poultry Meat

From the literature and numerous papers, it is emphasized that the fatty acid profile is different in beef and poultry meat. Raising the hypothesis that the high % presence of poultry DNA cannot be just an accidental cross-contamination, we took the next step to analyze the fatty acid profile through GC-FID analysis of the differences in the fatty acid profile of sausages containing 100% beef and sausages with the presence of poultry DNA and revealed several key findings Figure 2.
The provided radar chart compares the levels of various fatty acids between 100% beef sausages and sausages with added poultry meat. The results show that beef sausages have higher levels of saturated fatty acids compared to sausages with added poultry. This is typical as beef fat generally contains more saturated fats. Sausages with added poultry have higher levels of polyunsaturated fatty acids. This aligns with the leaner profile of poultry, which typically contains more unsaturated fats. Monounsaturated fats seem slightly higher in beef sausages compared to the poultry-added ones. Specific fatty acids like Myristin, Palmitin, and Stearic acids (components of saturated fats) are more prevalent in beef sausages. Linolenic acid and other polyunsaturated fats (like Oleic) are elevated in sausages with added poultry meat, a fact that is also supported by the works of other authors who also emphasize that the sausages with chicken meat had lower stearic (C18:0) and higher linoleic (C18:3) fatty acid contents than those made with beef [29] and similar results emphasize that turkey and chicken sausages presented a higher content of polyunsaturated fatty acids than the Chester and common sausages, which presented a low saturated fatty acids content [30].
The above results verify the general differences in fatty acids in 100 % beef and added poultry sausages, which results are also consistent with the research of other authors, however, we analyzed and verified through the ANOVA statistical program whether the differences expressed above between fatty acids are statistically significant (Table 3).
Fatty acids that showed statistically significant differences in levels between the two groups and were higher in sausages in 100% beef meat include C14:0 Myristolein, C15:0 Pentadecane, C16:0 Palmitin, C17:0 Heptadecan, C18:0 Stearic, and Saturated Acids. On the other hand, fatty acids that showed statistically significant differences in levels between the two groups and were higher in sausages with added poultry meat include C18:2 Linoleic, C18:3 alfa-linolenic, and Polysaturated Acid. These differences highlight the compositional shifts caused by adding poultry meat, particularly in increasing the levels of polyunsaturated fatty acids while decreasing saturated fatty acids. Fatty acids that did not show statistically significant differences include C14:1 Myristin, C16:1 Palmitolein, C18:1 Oleic, C20:0 Arachin, and Monounsaturated Acids. This indicates that the inclusion of poultry meat has a minimal impact on these specific fatty acids, suggesting a level of consistency in these profiles regardless of the meat source.
As a summary of the above results, we can emphasize that the inclusion of poultry meat in beef sausages results in significant compositional shifts, particularly reducing saturated fatty acids and increasing polyunsaturated fatty acids, which may improve the nutritional profile of the sausages. However, some fatty acid levels (e.g., C14:1 Myristin, C18:1 Oleic, and monounsaturated acids) remain stable across formulations, suggesting that these components are less sensitive to the addition of poultry meat.

3.3. The fatty Acid Profile Depends on the % of Chicken Meat Addition

By observing the fatty acid profile and statistically significant variations in some specific fatty acids, we performed the analysis for the detection of the amount of poultry meat in 33 samples of beef sausage, resulting in the presence of poultry DNA (31 chicken and 2 turkey) through the GC-FID validation method, to observe the impact of the increased amount of poultry meat on the values and profile of fatty acids. Based on the GC-FID validation method, the results from the 33 samples analyzed, it turns out that 8 samples (24.24%) had poultry meat added to the amount of 10%, 10 samples (30.30%) to the amount of about 20%, 5 samples (15.15%) to the amount of 30%, 1 sample (3.03%) to the amount of 50%, 2 samples (6.06%) to the amount of 60%, 2 samples (6.06%) to the amount of 60%, 2 samples (6.06%) to the amount of 70%, 2 samples (6.06%) to the amount of 60%, 2 samples (6.06%) to the amount of 80% and 3 samples (9.09%) to the amount of 90%. Through the GC-FID validation method, it results that about 70% of the analyzed samples had poultry meat added to the beef sausage up to 30%, while the other 30% of the samples had an addition of 50 - 90%.
Comparing the % of poultry addition in industrial and traditional beef sausage results, out of a total of 33 samples of sausages with added poultry meat, 25 samples (75.7%) belong to industrial sausages, and 8 samples (24.4%) belong to traditional sausages. Out of the samples of sausages with the presence of poultry meat of 10%, it turns out that 5 of them are industrial and 5 of them are traditional. Out of the sausages with the addition of 10-20% chicken meat, 6 belonged to industrial sausages while 3 belonged to traditional sausages. The sausages with more than 20% of added poultry meat belong only to industrial sausages, and that 5 samples with 30 %, 1 sample with 50 %, 2 samples with 60%, 70 %, and 80 %, and 3 samples with 90 %. From the above results, it is observed that industrial sausage, in addition to having a higher frequency of adding poultry meat (75.7%), at the same time the amount of added meat goes up to 90 %. Unlike traditional sausage, which has a lower frequency of adding poultry (24.4%), at the same time, it results in the addition of smaller amounts of poultry meat, not exceeding 20 %.
Although it is evident that based on the average fatty acids, in sausage with the addition of chicken meat, the values of saturated fatty acids decrease and the values of unsaturated and semi-saturated fatty acids increase, however, we have analyzed the profile of these fluctuations according to the added amount in % of chicken meat in beef sausage (Table 4).
From the results, we can notice a clear decrease in the total percentage of Saturated Fatty Acids as the percentage of added poultry meat increases. For instance, it drops from 54.15% at 10% poultry meat to 29.55% at 90% poultry meat. Specifically, components like C16:0 Palmitin and C18:0 Stearic acid show significant reductions, reflecting that poultry meat has fewer saturated fats than other sausage mixture components. Monounsaturated acids remain relatively stable between 10% and 70% of added poultry meat, ranging between 41%-44%. However, there is a notable drop to 30.36% when the poultry meat content reaches 90%. C18:1 Oleic acid is the most prominent MUFA and shows a slight fluctuation but no dramatic trend until the 90% level. Meanwhile, Polyunsaturated Fatty Acids increase substantially as the percentage of added poultry meat rises. At 10% poultry meat, PUFAs are at 3.98 %, while at 90%, they increase to 26.64%.
The most significant contributor is C18:2 Linoleic acid, which grows consistently from 3.50% at 10% to 25.04% at 90%. This indicates poultry meat's high content of essential fatty acids. Focused on Individual Fatty Acid Trends, it is noted that C16:1 Palmitolin and C18:2 Linoleic acid increase with higher poultry meat, suggesting poultry meat is richer in these unsaturated fatty acids. C18:0 Stearic acid and C16:0 Palmitin, as major SFAs, decline, emphasizing the lower saturated fat profile of poultry meat compared to other fats used in the sausages.
Based on the results of this study, it is argued that there is a difference in the fatty acid composition of beef meat and fat compared to poultry meat and fat. Undoubtedly, this difference in fatty acid composition is also reflected in meat products, such as sausages. The fatty acid content of beef is also argued by other authors who report that meat fat comprises mostly monounsaturated and saturated fatty acids, with oleic (C18:1), palmitic (C16:0), and stearic acid (C18:0) being the most ubiquitous [31] and that beef sausage has the dominant fatty acids of palmitic acid (42.31%), oleic acid (20.19%), stearic acid (10.92%) and myristic acid (7.66%) [32]. Regarding poultry meat, it is reported that fat in broiler breast contained a proportion of 29% saturated FA (SFA): 36% monosaturated FA (MFA): 35% polyunsaturated FA (PUFA); while legs and thighs meat had a proportion of 28% SFA: 38% MFA: 33% PUFA [33] and that poultry products showed a high content of linoleic (19.54%) and low content of stearic (8.22%) acids [34].
This study highlights the technical, nutritional, cultural, and economic impacts of adding poultry to beef sausages in Kosovo. While cost-effective, unclear labeling and deviations from traditional recipes may hinder consumer acceptance, as unfamiliarity can lead to negative perceptions.

4. Conclusions

Over half (52.94%) of the analyzed beef sausage samples contained meat from other species, with poultry being the most common addition. While industrial sausages showed a higher occurrence of added meat (65.2%), 32% of homemade sausages also contained undeclared meat, which is unexpected given traditional recipes.
The inclusion of poultry meat in beef sausages significantly reduced saturated fatty acids (SFAs) while increasing polyunsaturated fatty acids (PUFAs), particularly linoleic acid (C18:2) and alfa-linolenic acid (C18:3). These compositional shifts suggest that poultry addition improves the nutritional profile by lowering unhealthy fats.
As the proportion of poultry meat increased, the total saturated fat content decreased from 54.16% (at 10% poultry) to 29.55% (at 90% poultry), while polyunsaturated fats increased from 3.98% to 26.64%. Monounsaturated fats remained relatively stable until poultry content exceeded 70%, after which they declined.
A significant portion (46.42%) of industrial sausages with added meat was undeclared, while all homemade sausages with mixed meat were completely undeclared. This highlights potential mislabeling and consumer misinformation, raising concerns about transparency in sausage production.
Future research should assess the economic impact of adding poultry to beef sausages through detailed cost-benefit analyses. Additionally, studies on organoleptic properties and consumer acceptance, particularly for traditional sausages that traditionally exclude poultry, are essential.

Author Contributions

For Conceptualization, X.B., and D.M.; methodology, D.M. and A.C.; formal analysis, D.M., V.G.Z. and M.SH.Z..; investigation, D.M., A.C.; writing—original draft preparation, D.M. and X.B.; review and editing, D.B., X.B. and Z.H.M; supervision, D.J. All authors have read and agreed to the published version of the manuscript

Funding

This research received no external funding

Acknowledgments

The authors would like to thank the staff of the chemistry and molecular biology laboratory of the Kosovo Food and Veterinary Laboratory.

Conflicts of Interest

The authors declare no conflicts of interest.

References

  1. Geiker, N.R.W.; Bertram, H.C.; Mejborn, H.; Dragsted, L.O.; Kristensen, L.; Carrascal, J.R.; Bügel, S.; Astrup, A. Meat and Human Health—Current Knowledge and Research Gaps. Foods 2021, 10, 1556. [Google Scholar] [CrossRef] [PubMed]
  2. Ajomiwe, N.; Boland, M.; Phongthai, S.; Bagiyal, M.; Singh, J.; Kaur, L. Protein Nutrition: Understanding Structure, Digestibility, and Bioavailability for Optimal Health. Foods 2024, 13, 1771. [Google Scholar] [CrossRef] [PubMed]
  3. Carballo, J. Sausages Nutrition, Safety, Processing and Quality Improvement. Foods 2021, 10, 890. [Google Scholar] [CrossRef] [PubMed]
  4. Akpan, P. Trends in Sausage Production. Afr. J. Food Sci. Technol. 2017, 8, 5. [Google Scholar]
  5. Dooley, J.J.; E Paine, K.; Garrett, S.D.; Brown, H.M. Detection of meat species using TaqMan real-time PCR assays. Meat Sci. 2004, 68, 431–438. [Google Scholar]
  6. Özlü, H.; Çevik, B.; Atasever, M.; Sarıalioğlu, M.F.; Polat, B.A. Investigation of meat species adulteration in beef-based meat products via real-time PCR in Türkiye. Qual. Assur. Saf. Crop. Foods 2023, 15, 42–48. [Google Scholar]
  7. Amaral, J.S.; Soares, S.; Mafra, I.; Oliveira, B. Assessing the variability of the fatty acid profile and cholesterol content of meat sausages. La Rivista Italiana dee sostanze grasse - L. XC - B/CMB. 2014.
  8. Berisha, K.; Gashi, A.; Mednyánszky, Z.; Bytyqi, H.; Sarkadi, S. (2023): Nutritional characterization of homemade beef sausage based on amino acid, biogenic amines, and fatty acid composition. Acta Alimentaria. 2023, Volume 52: Issue 3.
  9. de Almeida, J.C.; Perassolo, M.S.; Camargo, J.L.; Bragagnolo, N.; Gross, J.L. Fatty acid composition and cholesterol content of beef and chicken meat in Southern Brazil. Rev. Bras. de Ci?ncias Farm. 2006, 42. [Google Scholar]
  10. Belichovska, D.; Pejkovski, Z.; Silovska-Nikolova, A.; Belichovski, K. Chemical and fatty acid composition of poultry meat and pork fatback as a raw material for the production of frankfurters. J. Anim. Sci. 2020, 10, 23–28. [Google Scholar]
  11. Hassoun, A.; Måge, I.; Schmidt, W.F.; Temiz, H.T.; Li, L.; Kim, H.-Y.; Nilsen, H.; Biancolillo, A.; Aït-Kaddour, A.; Sikorski, M.; et al. Fraud in Animal Origin Food Products: Advances in Emerging Spectroscopic Detection Methods over the Past Five Years. Foods 2020, 9, 1069. [Google Scholar] [CrossRef]
  12. Momtaz, M.; Bubli, S.Y.; Khan, M.S. Mechanisms and Health Aspects of Food Adulteration: A Comprehensive Review. Foods 2023, 12, 199. [Google Scholar] [CrossRef]
  13. Vatin, G.; Théolier, J.; Dominguez, S.; Godefroy, S.B. Quantification of beef in products sold in Canada declaring multiple meat species – Regulatory and consumer implications related to accurate labeling. Food Humanit. 2024, 3, 100375. [Google Scholar]
  14. Adams, R. Food Safety Regulations and Consumer Confidence. Int. J. Livest. Policy 2024, 2, 15–25. [Google Scholar]
  15. Tonkin, E.; Wilson, A.; Coveney, J.; Webb, T. Trust in and through labelling – a systematic review and critique. Br. Food J. 2015, 117, 318–338. [Google Scholar]
  16. Regulation no. 09/2013 on labelling, presentation and advertising and food products. Ministry of Trade and Industry, Government, Republic of Kosovo. 2013.
  17. Official Journal of the European Union - Regulation (EU) No 1169/2011 of the European Parliament and of the Council of 25 October 2011 on the provision of food information to consumers. 2021.
  18. El Sheikha, A.F.; Mokhtar, N.F.K.; Amie, C.; Lamasudin, D.U.; Isa, N.M.; Mustafa, S. Authentication technologies using DNA-based approaches for meats and halal meats determination. Food Biotechnol. 2017, 31, 281–315. [Google Scholar]
  19. Adenuga, B.M.; Montowska, M. A systematic review of DNA-based methods in authentication of game and less common meat species. Compr. Rev. Food Sci. Food Saf. 2023, 22, 2112–2160. [Google Scholar]
  20. Haifeng.; Suli, Zh. Determination of Fatty Acid Methyl Esters (FAMEs) in Milk Matrix Using an Agilent 5977E GC/MS 2014.
  21. Guidance for Industry, Q2B Validation of Analytical Procedures: Methodology. U.S. Department of Health and Human Services, Food and Drug Administration, Center for Drug Evaluation and Research (CDER), Center for Biologics Evaluation and Research (CBER), November 1996 ICH.
  22. Szyłak, A.; Kostrzewa, W.; Bania, J.; Tabiś, A. Do You Know What You Eat? Kebab Adulteration in Poland. Foods 2023, 12, 3380. [Google Scholar] [CrossRef]
  23. Chuah, L.-O.; Bin He, X.; Effarizah, M.E.; Syahariza, Z.A.; Shamila-Syuhada, A.K.; Rusul, G. Mislabelling of beef and poultry products sold in Malaysia. Food Control. 2016, 62, 157–164. [Google Scholar]
  24. Tembe, D.; Mukaratirwa, S.; Zishiri, O. Undeclared Meat Species in Processed Meat Products from Retail Franchises in the Durban Metropole, KwaZulu-Natal Province, South Africa, Using Species-specific DNA Primers. Food Protection Trends. 2018, Vol 38, No. 6, p. 440–449.
  25. Keyvan, E.; Çil, G.I.; Kul, B.Ç.; Bilgen, N.; Şireli, U.Ş. Identification of meat species in different types of meat products by PCR. Ankara Üniv Vet Fak Derg. 2017, 64, 261–266. [Google Scholar]
  26. Sreenivasan, S.; Viljoen, C.D. Determining the presence of undeclared animal species using Real-time PCR in canned and ready-to-eat meat products in South Africa. Journal of Food Science and Technology. 2020, 58(2):1-6.
  27. Beltramo, C.; Riina, M.V.; Colussi, S.; Campia, V.; Maniaci, M.G.; Biolatti, C.; Trisorio, S.; Modesto, P.; Peletto, S.; Acutis, P.L. Validation of a DNA biochip for species identification in food forensic science. Food Control. 2017, 78, 366–373. [Google Scholar]
  28. Golian, J.; Drdolová, Z.; Benešová, L. (2022). Molecular diagnostic test systems for meat identification: A comparison study of the MEAT 5.0 LCD-Array and innuDETECT Assay detection methods. ACTA VET. BRNO 2020, 89: 89–96.
  29. Simsek, Y.O.; Isıklı, M. Fatty acid composition and quality characteristics of low-fat cooked sausages made with beef and chicken meat, tomato juice, and sunflower oil. Meat Science. 2002, 62 253–258.
  30. Pereira, N.R.; Tarley, C.R.; Matsushita, M.; de Souza, N.E. Proximate Composition and Fatty Acid Profile in Brazilian Poultry Sausages. J. Food Compos. Anal. 2000, 13, 915–920. [Google Scholar]
  31. Valsta, L.; Tapanainen, H.; Männistö, S. Meat fats in nutrition. Meat Sci. 2005, 70, 525–530. [Google Scholar] [PubMed]
  32. Guntarti, A.; Ahda, M.; Kusbandari, A. Determining fatty acids and halal authentication of sausage. Food Res. 2019, 4, 495–499. [Google Scholar]
  33. Morales-Barrera, J.E.; Gonzalez-Alcorta, M.J.; Castillo-Dominguez, R.M.; Prado-Rebolledo, O.F.; Hernandez-Velasco, X.; Anita Menconi, A.; Tellez, G.; Hargis, B.M.; Carrillo-Dominguez, S. Fatty Acid Deposition on Broiler Meat in Chickens Supplemented with Tuna Oil. Food Nutr. Sci. 2013, 4, 16–20. [Google Scholar]
  34. Vizcarrondo, C.A.; F. Padilla, F.C.; Martín, E. Fatty acid composition of beef, pork, and poultry fresh cuts, and some of their processed products. Agricultural and Food Sciences. Arch Latinoam Nutr. 1998, 48(4):354-8.
Figure 2. The averages of fatty acids in sausages with beef and with added chicken meat.
Preprints 152241 g002
Table 1. The operational setup of GC-FID GC System 8890 GC.
S/SL inlet 250 °C, split ration 50:1
Liner Split, ultra inert, glass wool, low-pressure drops (p/n 5190-295)
Oven ramp program 50 °C (0.5 min)
30 °C/min to 194 °C (3.5 min)
5 °C/min to 240 °C (3 min)
Carrier gas Nitrogen, 13 psi, constant pressure mode
Column DB-Fast FAME 30 m × 0.250 mm × 0.25 um 40 °C to 250/260 °C
Detector-fid 260 °C,
H2: 40 mL/min
Air: 400 mL/min
Makeup gas: 25 mL/min
Injection volume 1 uL
Table 2. Fatty acids profile in different proportions of beef and poultry for validation of GC-FID method.
Chicken meat (%) Beef Sausage (%) C14:0Myristolein C14:1Myristin C15:0Pentadecane C16:0 Palmitin C16:1 Palmitolin C17:0Heptadecan C18:0Stearic C18:1Oleic C18:2Linol C183Linolen alfa C20:0Arachin Saturated acids Mono-saturated acids Poly-saturated acids Total
100 0 0.08 0.33 0.06 18.28 3.44 0.13 6.57 29.18 37.59 4.28 0.05 25.17 32.95 41.87 99.99
0 100 3.58 0.44 0.55 29.05 2.98 1.88 24.84 33.34 2.76 0.35 0.14 60.04 36.76 3.11 99.91
99 1 0.46 0.16 0.08 19.4 3.37 0.17 8.31 29.37 35.33 3.29 0.06 28.48 32.9 38.62 100
90 10 0.66 0.17 0.11 20.2 3.32 0.29 9.84 16.5 32.18 3.14 0.07 31.17 19.99 35.32 86.48
80 20 1.23 0.27 0.19 22.23 3.02 0.58 14.18 31.26 24.64 2.29 0.08 38.49 34.55 26.93 99.97
70 30 1.57 0.32 0.26 23.91 2.96 0.85 15.46 31.85 20.72 2.04 0.04 42.09 35.13 22.76 99.98
60 40 2.05 0.43 0.31 25.3 3.03 0.95 17.5 32.12 16.66 1.59 0 46.11 35.58 18.25 99.94
50 50 2.12 0.42 0.32 25.73 2.93 1.09 19.39 32.46 14.03 1.33 0.1 48.75 35.81 15.36 99.92
40 60 2.28 0.43 0.34 26.43 3.06 1.11 18.37 32.76 13.84 1.37 0 48.53 36.25 15.21 99.99
30 70 2.84 0.55 0.44 28.35 2.85 1.41 21.65 33.24 7.77 0 0.07 54.76 36.64 7.77 99.17
20 80 2.77 0.37 0.44 28.85 2.79 1.6 22.78 34.25 5.5 0.56 0.07 56.51 37.41 6.06 99.98
10 90 3.22 0.61 0.49 28.64 2.81 1.58 24.24 34.27 3.53 0.37 0.12 58.29 37.69 3.9 99.88
7 93 3.04 0.27 0.46 29.55 2.68 1.59 23.85 34.9 3.11 0.32 0.11 58.6 37.85 3.43 99.88
2 98 3.57 0.66 0.56 31.06 2.9 1.87 23.7 33.15 2.05 0.27 0.11 60.87 36.71 2.32 99.9
Table 3. Statistical differences in fatty acids (%) in beef and added poultry sausages.
Fatty acids Beef Sausage Beef Sausage with Poultry DNA P-Value
Myroistelin 3.17 2.56 0.000893*
Myristin 0.39 0.3 0.156974
Pentadecane 0.57 0.43 0.000555*
Palmitin 25.66 24.14 0.000238
Palmitolin 3.17 3.55 0.066677
Heptadecan 1.34 1.09 0.003113*
Stearic 22.76 18.11 0.000305*
Oleic 39.18 39 0.828574
Linol 2.72 9.46 3.28E-06*
Linolen alfa 0.41 0.81 1.15E-05*
Arachin 0.58 0.51 0.250436
Saturated 52.5 43.48 0.002973*
Monosaturated 41.52 39.46 0.425882
Polyunsaturated 3.03 10.04 7.64E-06*
*Statistically significant differences.
Table 4. Profile of fatty acids in different % of added poultry meat in beef sausage.
Added meat poultry % Samples (No) C14:0Myristolein C14:1Myristin C15:0Pentadecane C16:0 Palmitin C16:1 Palmitolin C17:0Heptadecan C18:0Stearic C18:1Oleic C18:2Linol C183Linolen alfa C20:0Arachin Saturated acids Mono-saturated acids Poly-saturated acids
1 2.95 0.21 0.43 23.77 1.94 1.24 28.63 36.73 3.29 0.34 0.47 57.49 38.88 3.63
2 2.91 0.81 0.47 24.97 3.32 1.08 24 38.3 3.1 0.39 0.67 54.10 42.43 3.49
3 3.35 0.41 0.71 26.56 2.37 1.52 28.25 31.75 3.94 0.61 0.53 60.92 34.53 4.55
10% 4 3.08 0.24 0.59 26.14 3.3 1.26 21.65 39.29 3.47 0.48 0.51 53.23 42.83 3.95
5 3.96 0.23 0.7 27.68 3.46 1.41 21.21 37.42 3.13 0.35 0.43 55.39 41.11 3.48
6 3.17 0.32 0.58 24.4 2.69 1.38 22.62 40 3.6 0.57 0.67 52.82 43.01 4.17
7 3.02 0.28 0.49 24.19 2.95 1.24 22.65 40.01 3.73 0.71 0.73 52.32 43.24 4.44
8 2.72 0.24 0.5 24.27 3.67 1.26 17.58 44.99 3.74 0.39 0.63 46.96 48.9 4.13
AV 3.08 0.34 0.55 25.24 2.9 1.29 23.32 38.56 3.5 0.48 0.58 54.15 41.86 3.98
1 3.24 1.19 0.56 24.32 5.05 1.24 15.33 43.73 3.61 0.5 1.23 45.92 49.97 4.11
2 3.06 0.64 0.51 26.26 3.94 1.15 19.73 40.03 3.68 0.47 0.52 51.23 44.61 4.15
3 2.72 0.4 0.43 27.06 2.7 1.39 24.25 37.76 2.6 0.37 0.33 56.18 40.86 2.97
4 2.92 0.47 0.56 25.4 2.56 1.65 24.34 37.97 3.22 0.45 0.47 55.34 41 3.67
20% 5 3.04 0.35 0.53 25.5 3.73 1.28 19.81 38.59 5.78 0.68 0.71 50.87 42.67 6.46
6 2.88 0.22 0.6 23.99 2.97 1.31 23.72 38.12 4.79 0.55 0.86 53.36 41.31 5.34
7 3.39 0.2 0.57 26.01 2.43 1.36 24.52 35.7 4.88 0.43 0.51 56.36 38.33 5.31
8 4.09 0 0.48 24.07 4.22 1.29 15.29 43.4 5.9 0.53 0.7 45.92 47.62 6.43
9 3.19 0.26 0.5 23.24 3.13 1.22 21.14 41.37 4.12 0.41 1.43 50.72 44.76 4.53
10 3.02 0.12 0.5 25.52 3.87 1.56 17.13 43.62 3.82 0.4 0.45 48.18 47.61 4.22
AV 3.15 0.38 0.524 25.13 3.46 1.34 20.52 40.02 4.24 0.479 0.72 51.4 43.87 4.71
1 3.34 1.03 0.53 25.53 4.69 1.02 13.27 41.18 7.66 0.95 0.77 44.46 46.9 8.61
2 2.62 0.28 0.5 23.9 3.92 1.16 16.35 40.84 8.61 1.1 0.71 45.24 45.04 9.71
30% 3 2.36 0.2 0.46 24.43 2.72 1.24 22.7 34.81 9.67 0.98 0.43 51.62 37.33 10.65
4 2.77 0.37 0.59 25.19 2.66 1.61 23.03 35.65 7.07 0.52 0.55 53.74 38.68 7.59
5 2.57 0.22 0.48 22.38 3.71 1.34 14.77 44.24 8.68 0.89 0.72 42.26 48.17 9.57
AV 2.73 0.42 0.51 24.28 3.54 1.27 18.02 39.34 8.33 0.88 0.63 47.46 43.22 9.22
50% 1 2.42 0.16 0.21 22.57 3.43 0.71 15.16 37.87 15.86 1.35 0.26 41.33 41.46 17.21
1 1.52 0.47 0.26 21.03 3.78 0.63 11.4 40.83 17.99 1.58 0.51 35.35 45.08 19.57
60% 2 1.51 0.11 0.23 23.09 4.13 0.57 14.84 38.85 15.28 1.2 0.18 40.42 43.09 16.48
AV 1.51 0.29 0.24 22.06 3.99 0.6 13.1 39.84 16.63 1.39 0.34 37.88 44.08 18.02
1 1.37 0 0 23.32 4.13 1.41 10.16 38.52 19.74 1.35 0 36.26 42.65 21.09
70% 2 1.68 0.14 0.31 23.2 3.26 0.81 13.43 36.62 19.07 1.18 0.3 39.73 40.02 20.25
AV 1.52 0.14 0.31 23.26 3.69 1.11 11.79 37.57 19.4 1.265 0.3 37.99 41.33 20.62
1 1.16 0.15 0.18 20.93 4.24 0.42 13.35 36.64 21.81 0.99 0.14 36.18 41.03 22.8
80% 2 1.93 0.04 0.17 22.39 4.77 0.4 11.16 36.95 20.51 1.57 0.11 36.16 41.76 22.08
AV 1.54 0.09 0.17 21.66 4.5 0.41 12.25 36.79 21.16 1.29 0.12 36.1 41.39 22.44
1 0.67 0.15 0.21 22.04 4.53 0.26 7.77 37.12 24.49 1.6 0.16 31.11 41.8 26.09
90% 2 0.51 0.01 0.09 20.46 4.61 0.16 7.25 39.01 26.45 1.02 0.1 28.57 4.63 27.47
3 0.54 0.16 0.08 21.54 5.22 0.13 6.57 39.26 24.19 2.19 0.12 28.98 44.64 26.38
AV 0.57 0.1 0.12 21.54 4.78 0.18 7.19 38.46 25.04 1.6 0.12 29.55 30.36 26.64
AV - Averages
Disclaimer/Publisher’s Note: The statements, opinions and data contained in all publications are solely those of the individual author(s) and contributor(s) and not of MDPI and/or the editor(s). MDPI and/or the editor(s) disclaim responsibility for any injury to people or property resulting from any ideas, methods, instructions or products referred to in the content.
Copyright: This open access article is published under a Creative Commons CC BY 4.0 license, which permit the free download, distribution, and reuse, provided that the author and preprint are cited in any reuse.
Prerpints.org logo

Preprints.org is a free preprint server supported by MDPI in Basel, Switzerland.

Subscribe

Disclaimer

Terms of Use

Privacy Policy

Privacy Settings

© 2025 MDPI (Basel, Switzerland) unless otherwise stated