1. Introduction
TIG welding is an arc welding process with a non-melting electrode [
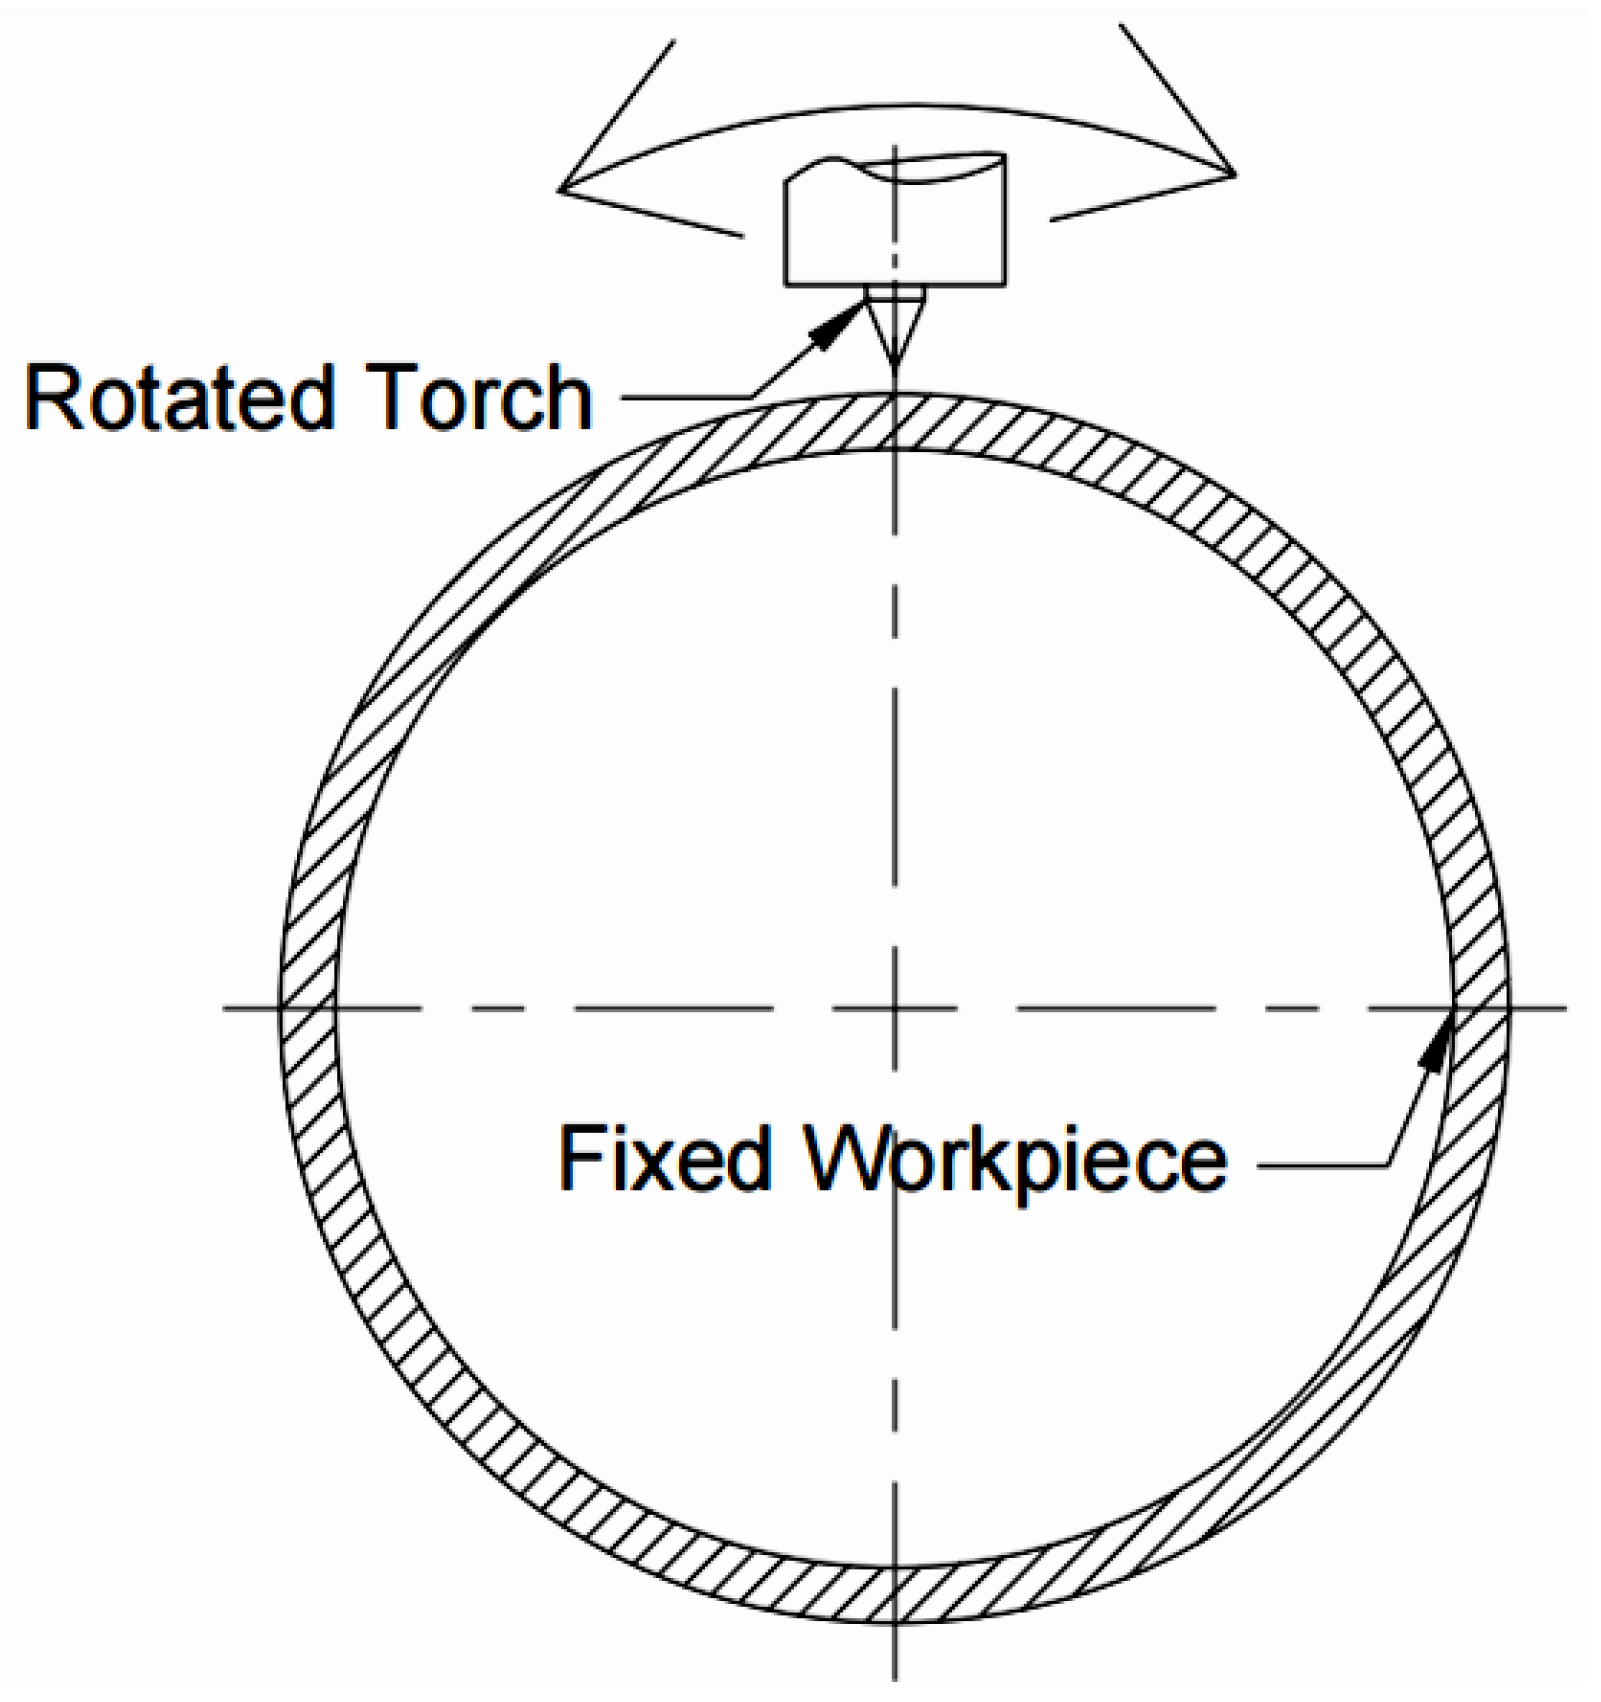
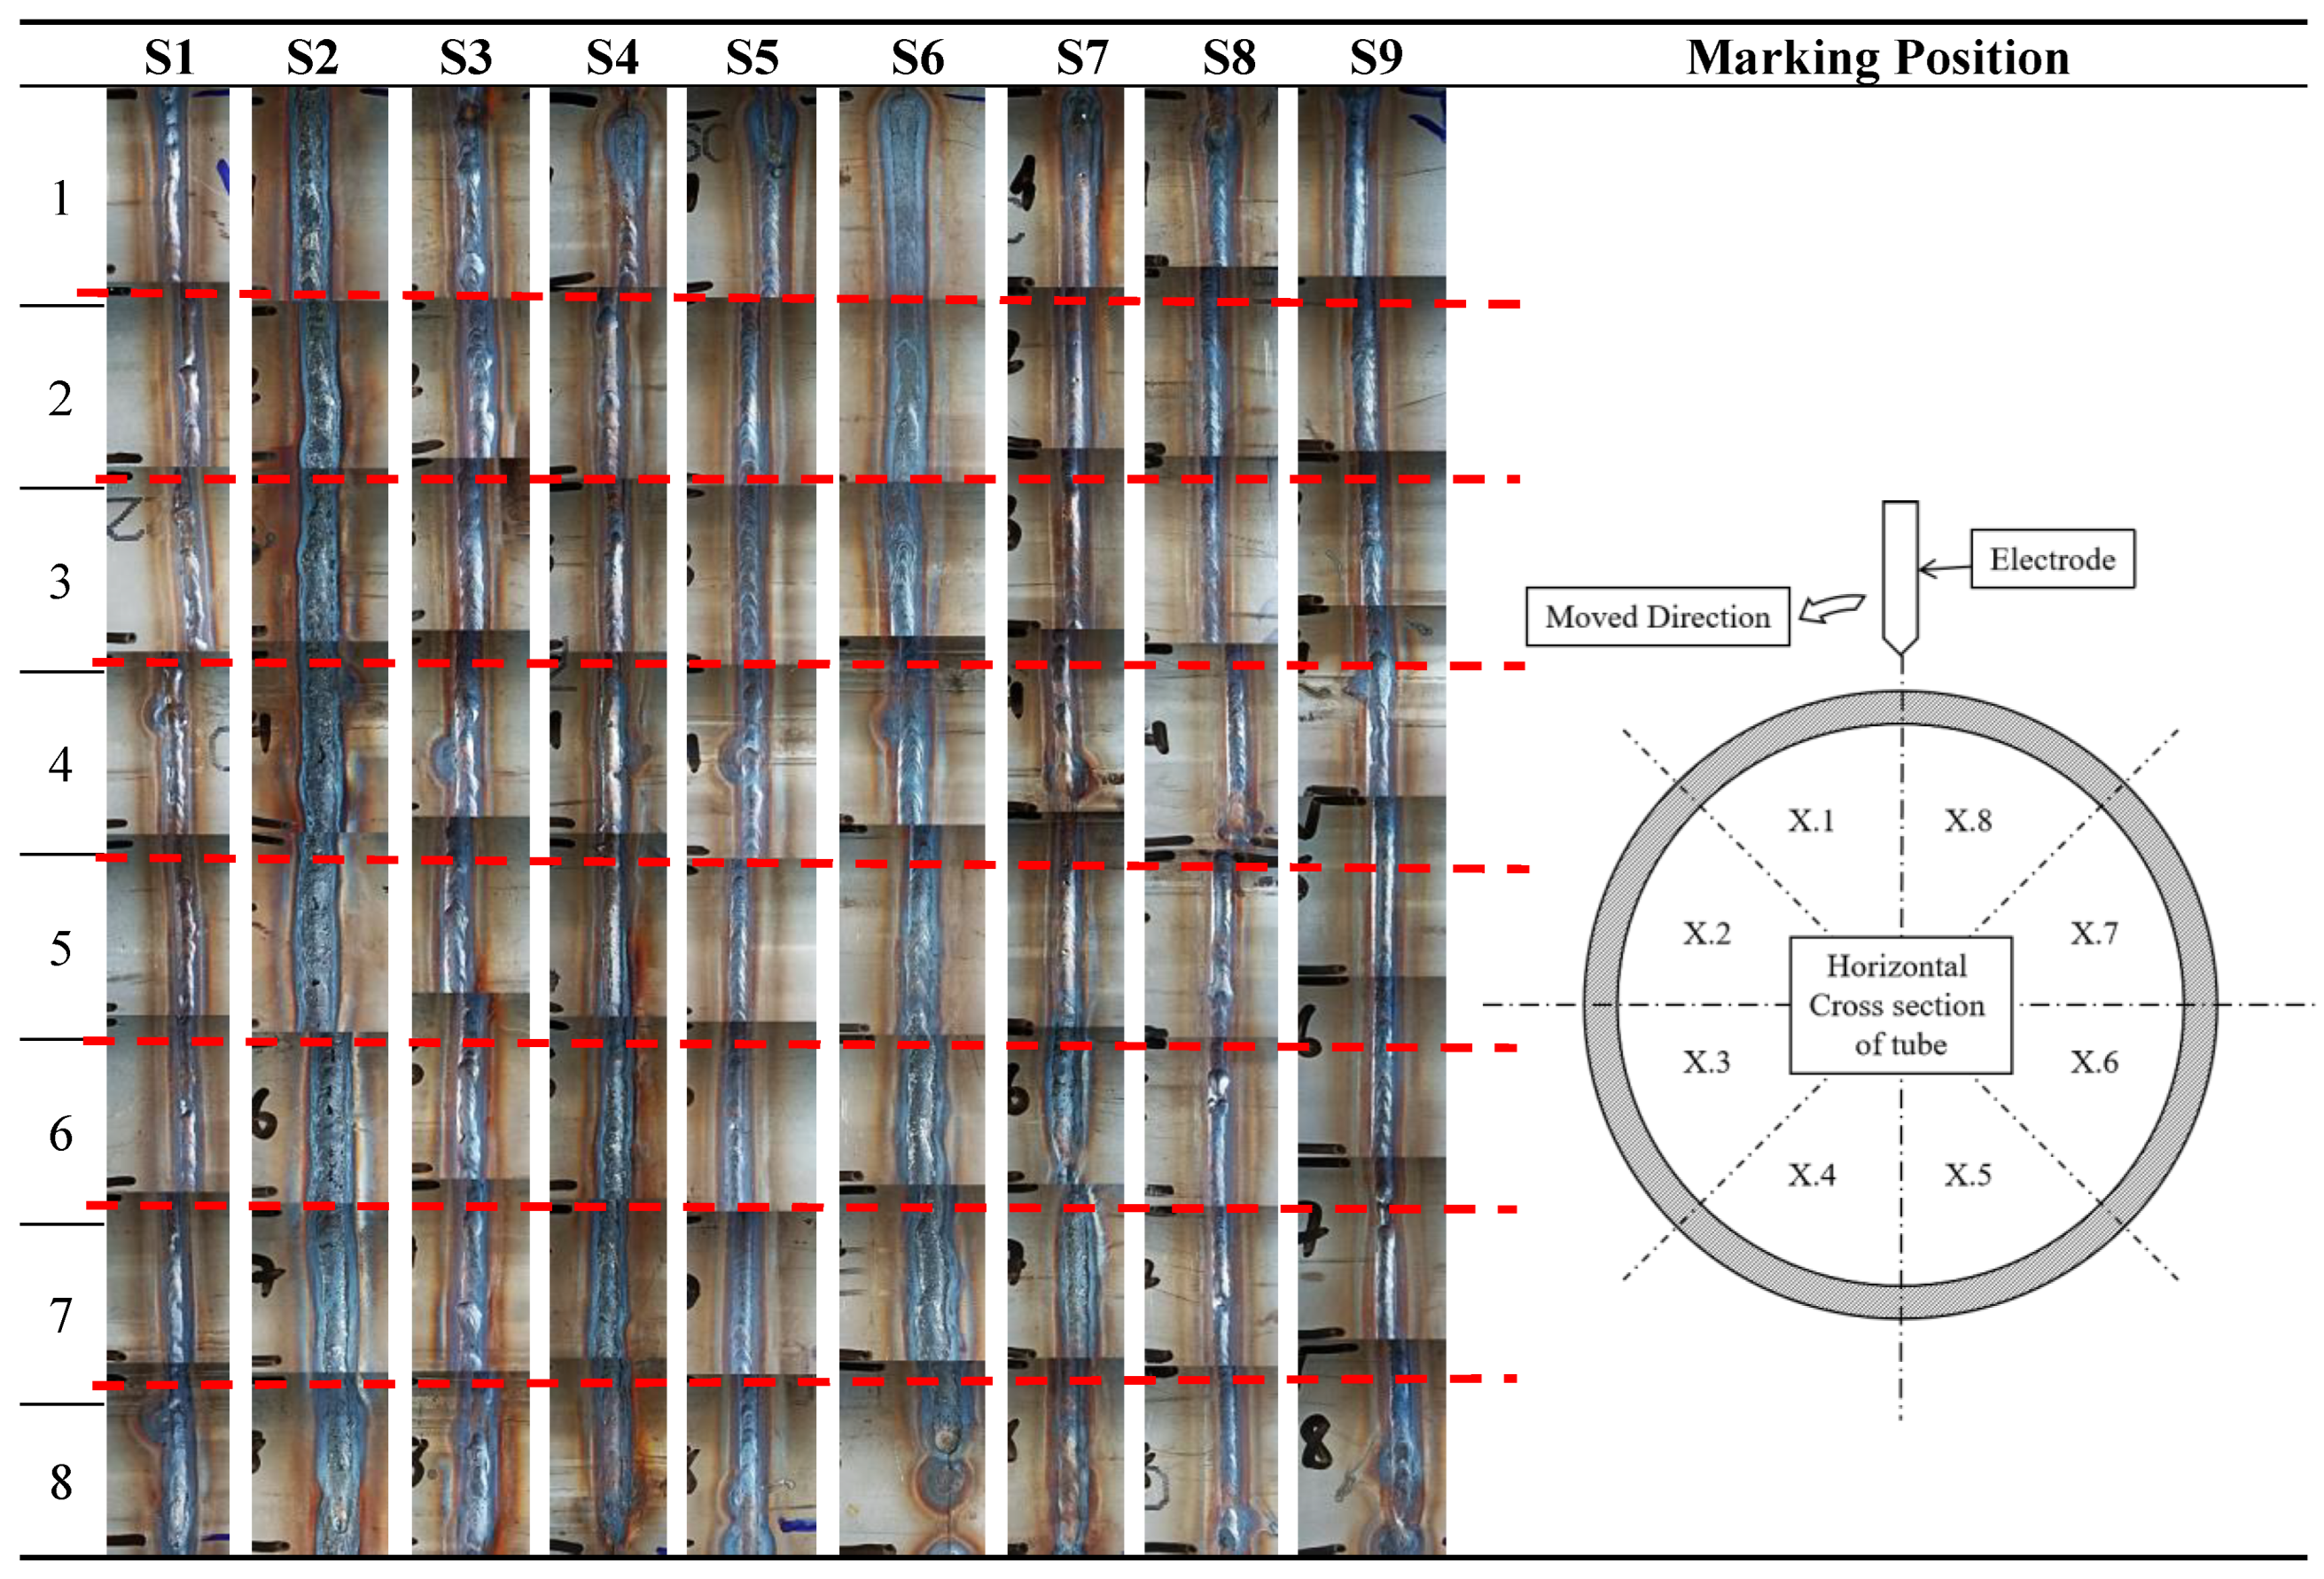
1]. TIG welding with the welding head to make a circular motion around the arc weld is called orbital welding, as shown in
Figure 1. Orbital TIG welding is widely used in industries to weld pipes to transport materials such as oil, gas, and other liquids [
2,
3,
4,
5]. Therefore, the strength of the orbital welding pipes is critical to prevent them from leaking under high pressure [
6,
7,
8,
9]. There will be numerous risks to the public and environment if weld quality control is not ensured [
10].
Heat input plays a critical role in forming welding joints during the welding process. A suitable heat input parameter will give the weld complete penetration [
11,
12,
13,
14]. If the heat input is too high, it will cause the weld to overheat, burn, and poor quality [
15]. In reverse, if it is low, the base metals will not be molten enough, leading to the poor penetration depth of the weld joints. The heat input depends on the welding curring, voltage, and travel speed. Besides, many welding parameters could influence the quality of orbital TIG welding joints. For instance, wire feed speed and filler wire diameter affect the weld’s heat input and formation process. Therefore, many authors have tried to optimize these factors to improve the orbital TIG welding quality. Singh et al. [
16], for instance, applied both simulation and experiment investigations to study the orbital welding process of AISI 316L stainless steel. They surveyed the impact of welding current, welding speed, and standoff distance via the L-9 orthogonal array via the Taguchi method. The optimal input parameters for tensile strength are a welding current of 40 A, welding speed of 1.08 mm/s, and standoff distance of 1.6 mm. Using the Taguchi optimization method, Baskoro et al. [
17] examined the orbital pipe welding process of SS316L steel. By changing the welding parameters, they focused on the tensile strength, distortion, bead width, ovality, and tapers. The results revealed that at a welding current of 114.7 A, the tensile strength could reach 661.4 Mpa with a low distortion level.
Interestingly, Mengistie et al. [
18] also optimized the orbital welding process of AISI 1020 steel pipe by using an artificial neural network and genetic algorithm. The authors tried to improve the welding joints’ tensile strength and Rockwell hardness. The greatest ultimate tensile strength (UTS) that could be attained is 411.2 Mpa, with a hardness of 95 HRB by using the parameters set of welding current of 110 A, welding voltage of 24 V, travel speed of 300 mm/min, and arc length of 3 mm. These experimental results are close to the optimization result, pointing out the advance of the artificial neural network and genetic algorithm methods. Widyianto et al. [
19] reported the impacts of welding current and sequence on the mechanical characteristics, microhardness, and distortion of the orbital pipe welding of SS316L steel. The results indicate a 51% decline compared to the original base metal. Moreover, increasing the welding sequence leads to a reduction in the microhardness of the welding bead.
However, the above studies have not mentioned the influence of the filler wire diameters on the weld despite the fact that it could strongly affect the welding quality. This study will evaluate the weld quality with different welding currents, welding voltages, travel speeds, and welding wire sizes in the orbital welding process of SUS304 steel pipe. The welding joints are conducted through the tensile test and observed by a metallurgical microscope. The results could illuminate the orbital welding process, especially with SUS304 pipe.
2. Experimental Material and Method
2.1. Experimental Material
The material used in this study is grade SUS 304 stainless steel, following standard ASTM A276/A276M [
20], with an outer diameter of 76 mm and a thickness of 2 mm. The filler wire used in this study is the same type as the workpiece. The nominal chemical composition of SUS 304 steel is shown in
Table 1.
2.2. Experimental Method
The tubes are cut into pieces with a length of 100 mm and tacked together with a total length of 200 mm. The type of welding head equipment is open arc welding, the wire feed type is continuous filler wire. The type of metal transfer is controlled under touching transfer. The electrode is a thorium electrode of type EWTh-2 with a diameter of 2.4 mm and a tip electrode angle of 45°. The shielding gas is argon with a gas flow rate of 12 LPM (liter per minute).
After some initial tests to survey the welding process, the Taguchi method is used to design parameters with an L9 matrix, three factors that is filler wire diameter (D
w), current (I), and filler wire speed (V
f), are examined with three levels, as presented in
Table 2.
The heat input value is calculated according to formula (1) [
21]:
where HI is heat input (J/mm), and η is the weld thermal efficiency, which often is 0.6 for the GTAW method, U is arc voltage (V), V
s is travel speed (mm/s) and I is current (A).
Besides, other welding parameters are fixed, such as a voltage of 20 V, an arc length of 2 mm, a travel speed of 5.5 mm/s, a cup diameter of 9 mm, and shielding gas Argon with a flow rate of 12 LPM. The Taguchi design table and HI values are shown in
Table 3.
After welding, the samples are tested by a visual assessment according to AWS D18.1 [
22]. The welding samples are also experienced and a tensile test according to ISO 6892-1 [
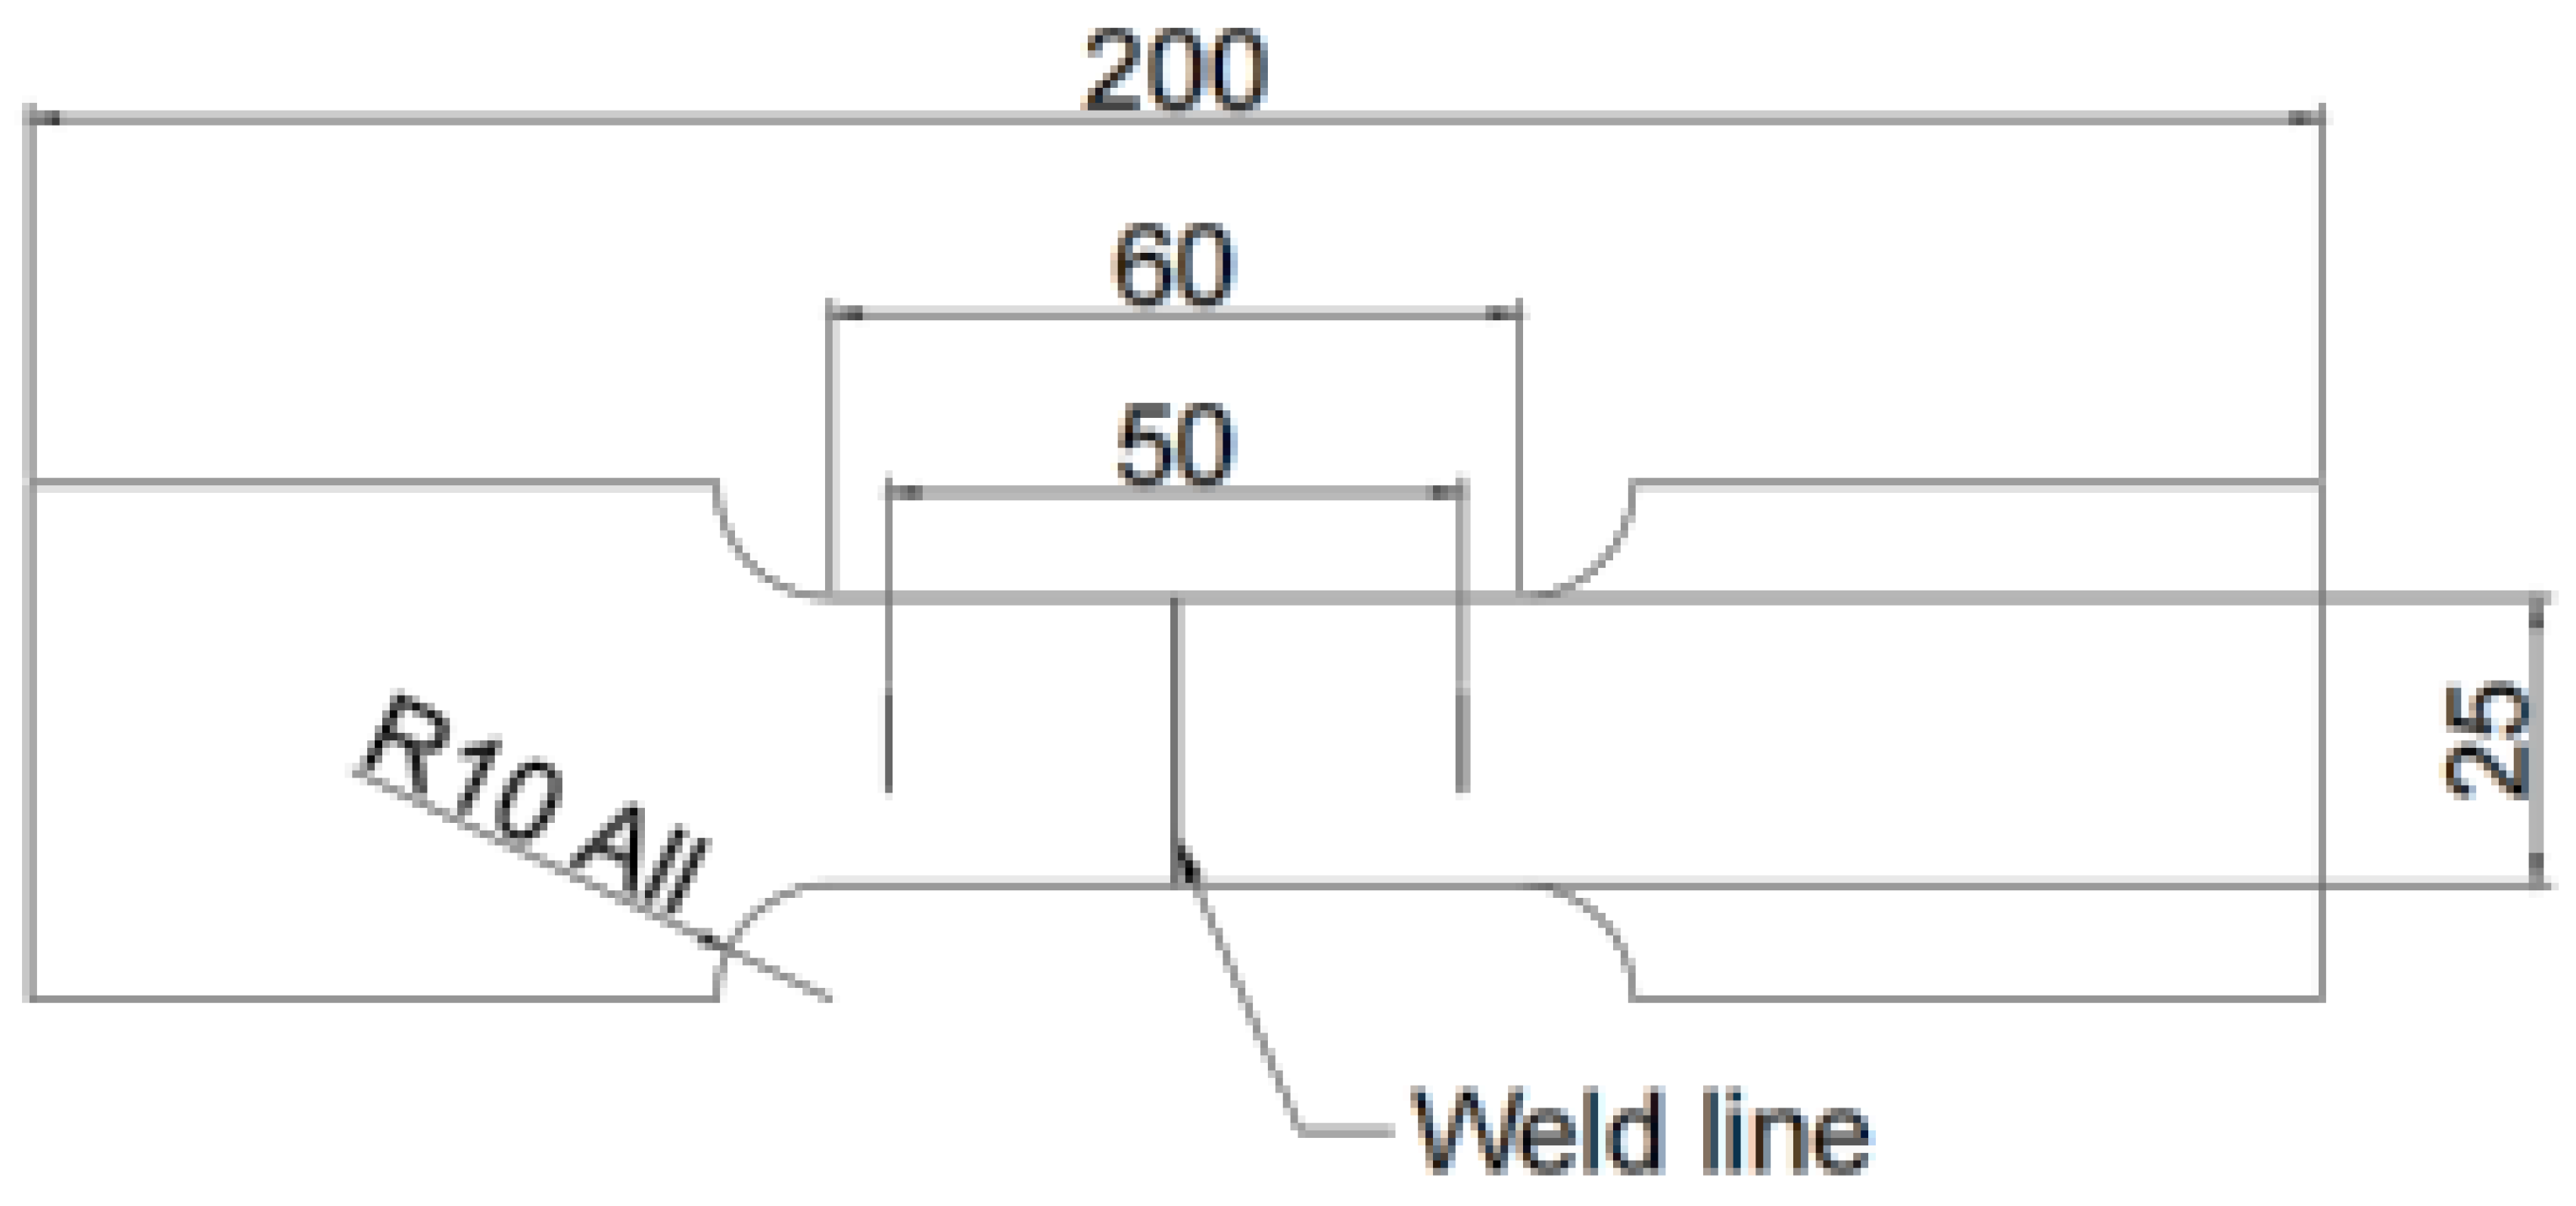
23]. The tensile test shape is presented in
Figure 2; the test position is selected following the ASME IX standard [
24]. Finally, the microstructures of the samples are also observed after cutting, molding, grinding, polishing, and etching, as shown in
Figure 3.
3. Results and Discussion
3.1. Visual Test Results
Table 4 shows the geometry of welds, while the assessment according to the AWS D18.1 standard is presented in
Table 5. The passed sample numbers are S3‒S7 and S9. On the other hand, sample numbers S1, S2, and S8 failed the AWS D18.1 standard because they failed to meet the weld height criterion. The height of these samples is already 0.3 mm higher than the criteria. In addition, sample S2 has a weld joint width greater than 4.0 mm, which can not meet the requirements.
Table 4 also shows that sample S2 has a dark gray color and has much porosity on the weld surface, indicating poor quality. The reasons for the failed S1 and S2 samples could be the small filler wire diameter of 0.8 mm and low HI value of 0.26 KJ/mm. The low HI could reduce the penetration depth, leading to low welding quality [
25].
The small filler especially causes the concentration of the molten metal, leading to a poor weld bead contribution. In reverse, other samples, such as S4‒S9, with larger filler wire diameters, have the better weld bead as the heat contribution is better. Samples S4, S5, and S6 have a filler wire diameter of 1mm for a more even welding and finer metal wavelengths. Samples S7, S8, and S9 with a filler wire diameter of 1.2 mm, the appearance image shows the smoothest and most uniform metal wavelength.
3.2. Tension Test Results
The tensile test results are presented in
Table 6. The results indicate that the UTS values range from 72 Mpa to 562 Mpa. The lowest UTS value is 72 Mpa, which is the UTS of the S1 sample. This low value is the “failed” result in visual assignment according to AWS D18.1 standard, as shown in
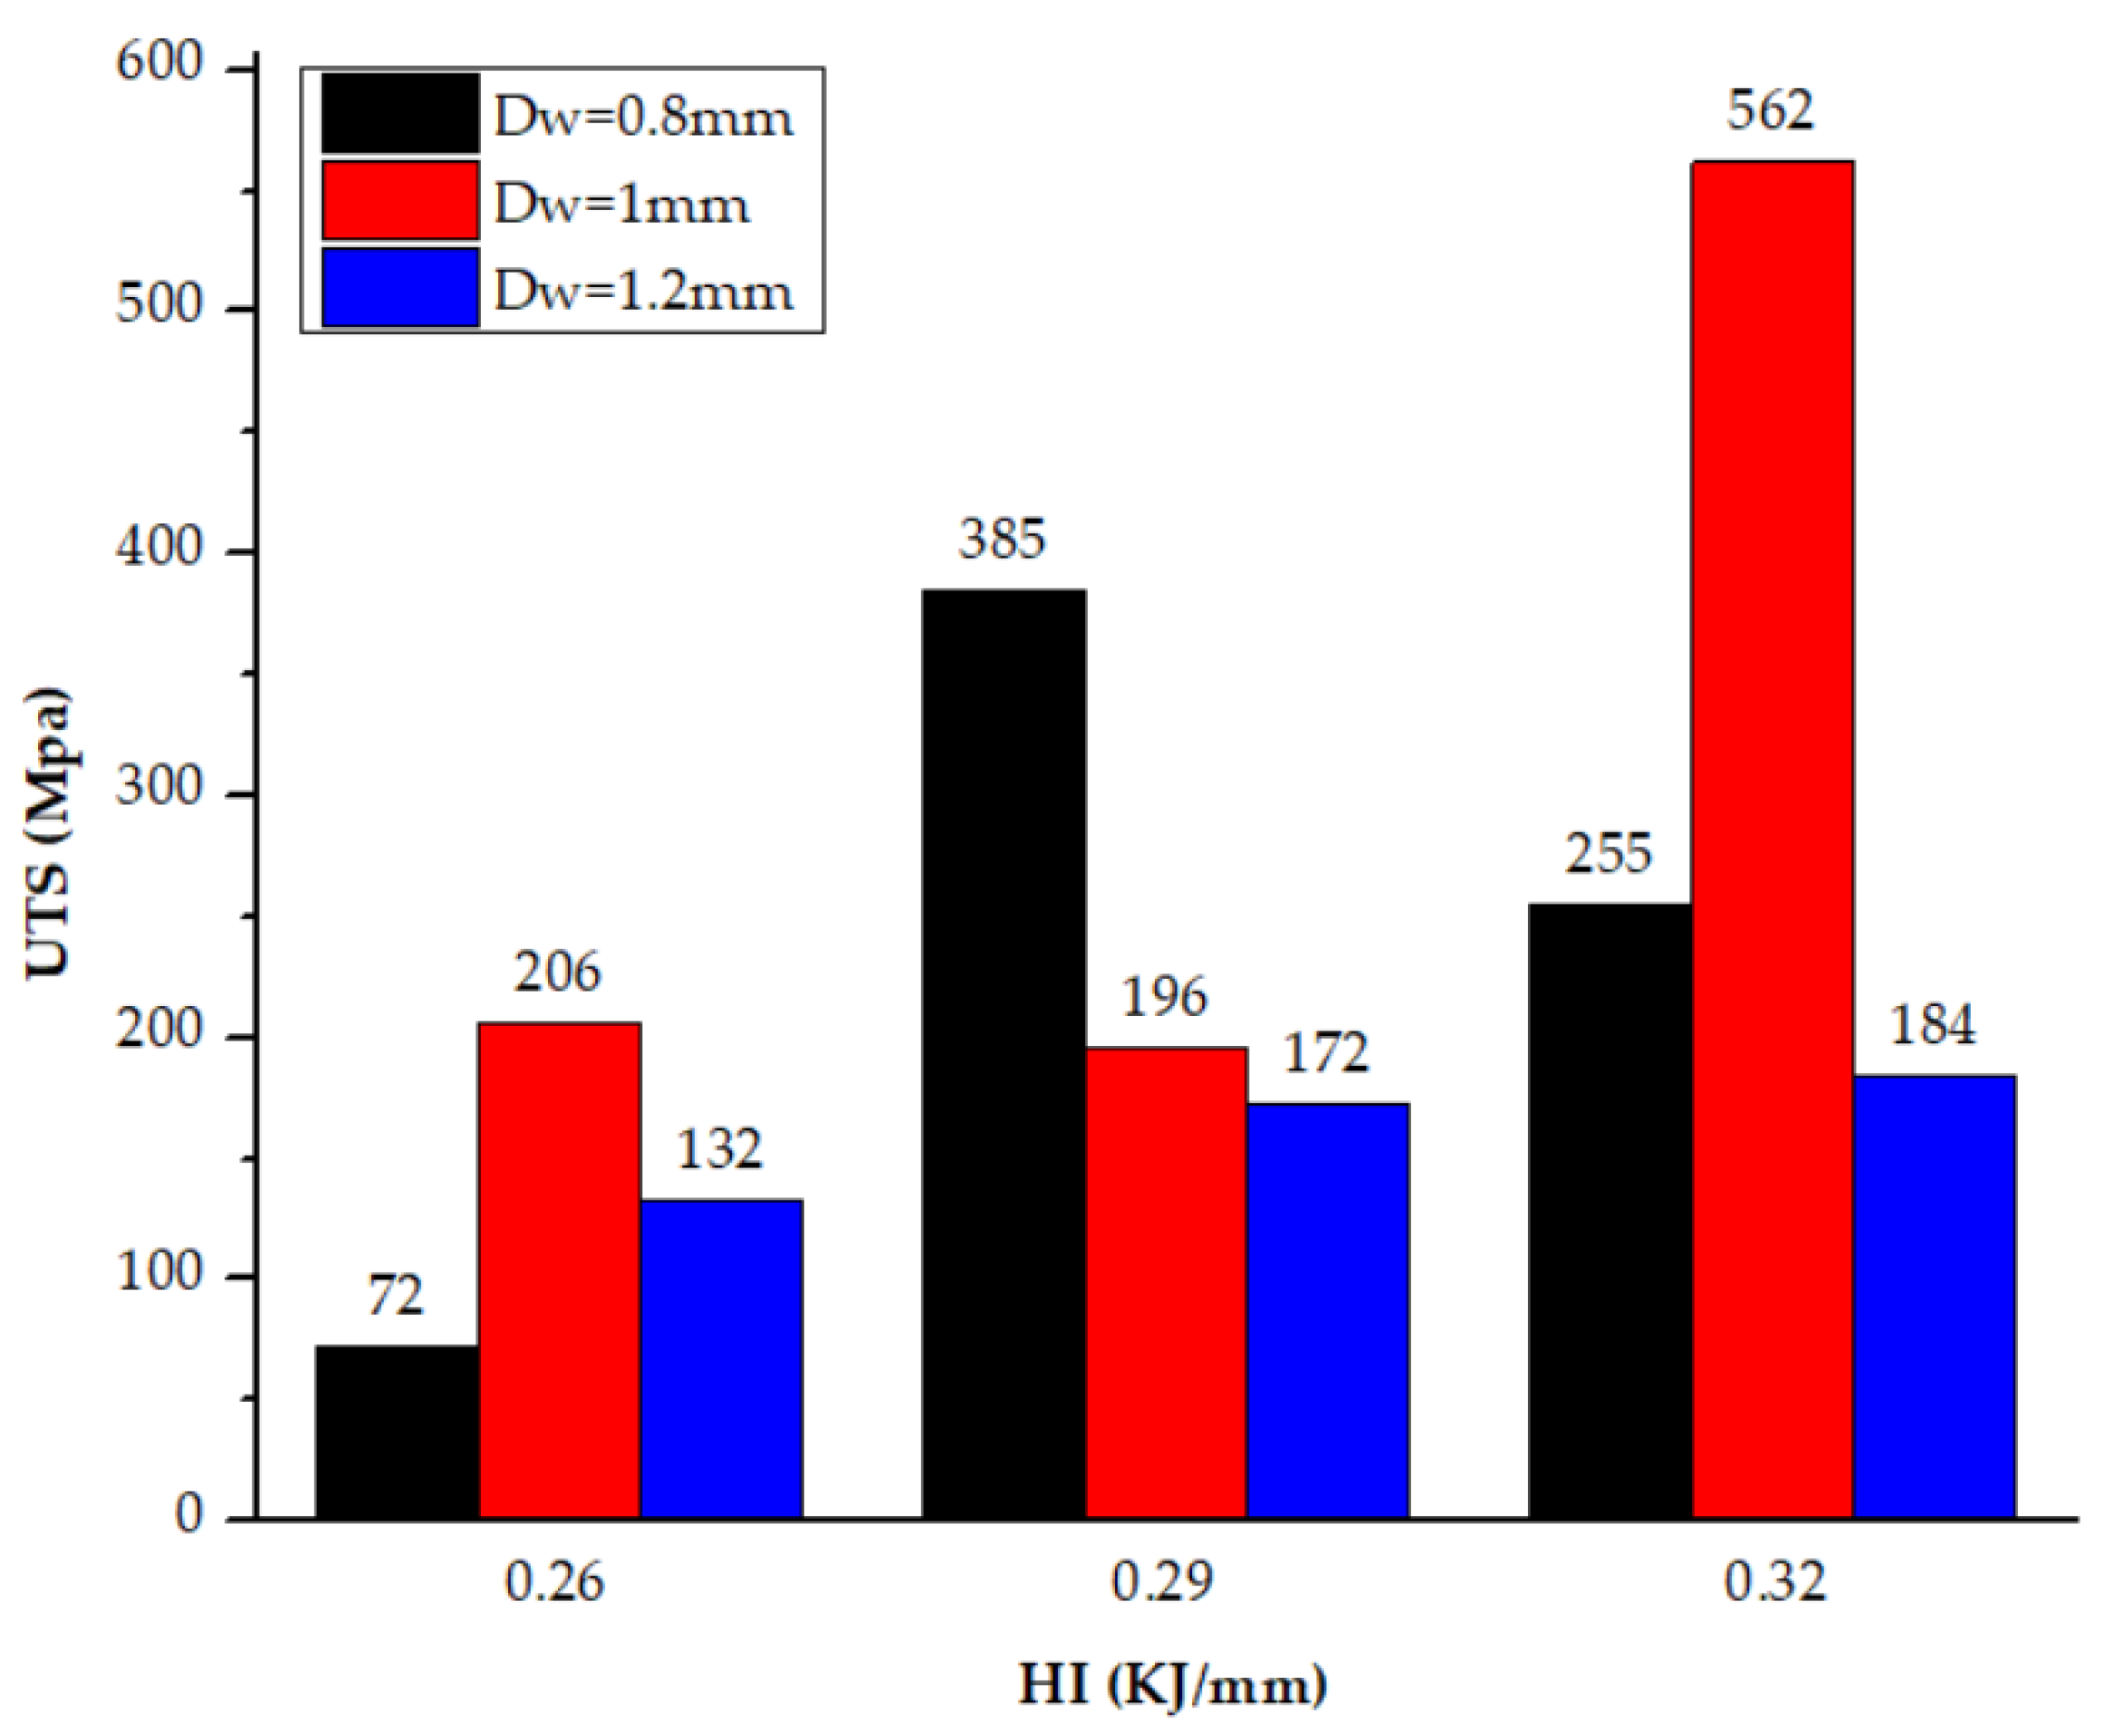
Table 5. On the contrary, sample S6 reaches the highest UTS value of 562 Mpa, greatly higher than the other samples. The relationships between HI and D
w on Utensile strength are illustrated in
Figure 4. The average UTS values are 137 Mpa, 251 Mpa, and 334 Mpa, corresponding to the HI values of 0.26 KJ/mm, 0.29 KJ/mm, and 0.32 KJ/mm. The reason for this phenomenon is that the higher HI leads to a better melting rate of the base metal. Therefore, the penetration depth is higher. This once again demonstrates that HI plays a crucial role in increasing the depth of penetration of the weld. The higher penetration depth leads to a better UTS value of the weld joints [
26]. Moreover, the average UTS of welds using D
w of 0.8mm, 1mm, and 1.2mm are 237 Mpa, 321 Mpa, and 162 Mpa, respectively. Therefore, high UTS values are usually found in samples with HI of 0.29 KJ/mm and 0.32 KJ/mm and D
w of 0.8 mm and 1 mm. Specifically, the highest UTS value at HI of 0.29 KJ/mm is 385 Mpa with D
w of 0.8mm, and 562 MPa is the highest UTS value at HI of 0.32 KJ/mm with D
w of 1 mm. The results of this study also indicate that D
w of 1.2mm seems unsuitable for the HI values and base material thickness surveyed. Increasing the filler diameter can significantly impact the final weld quality. For example, the larger filler diameter could lead to a higher deposition rate, which means more materials are deposited. Moreover, a larger filler diameter can increase the HI rate that transfers to the base metal. Filler diameter also can impact the penetration depth and weld bead geometry, in which the larger filler diameters might provide deeper penetration and a wider bead. With a suitable HI of 0.32 KJ/mm, the tensile strength reaches its highest value of 562 Mpa when using the filler diameter of 1.0 mm, indicating 1.0 mm is the suitable diameter selection. However, the UTS value needs further analysis via the Taguchi method. In addition, other factors, such as wire feed speed, also impact the welding strength.
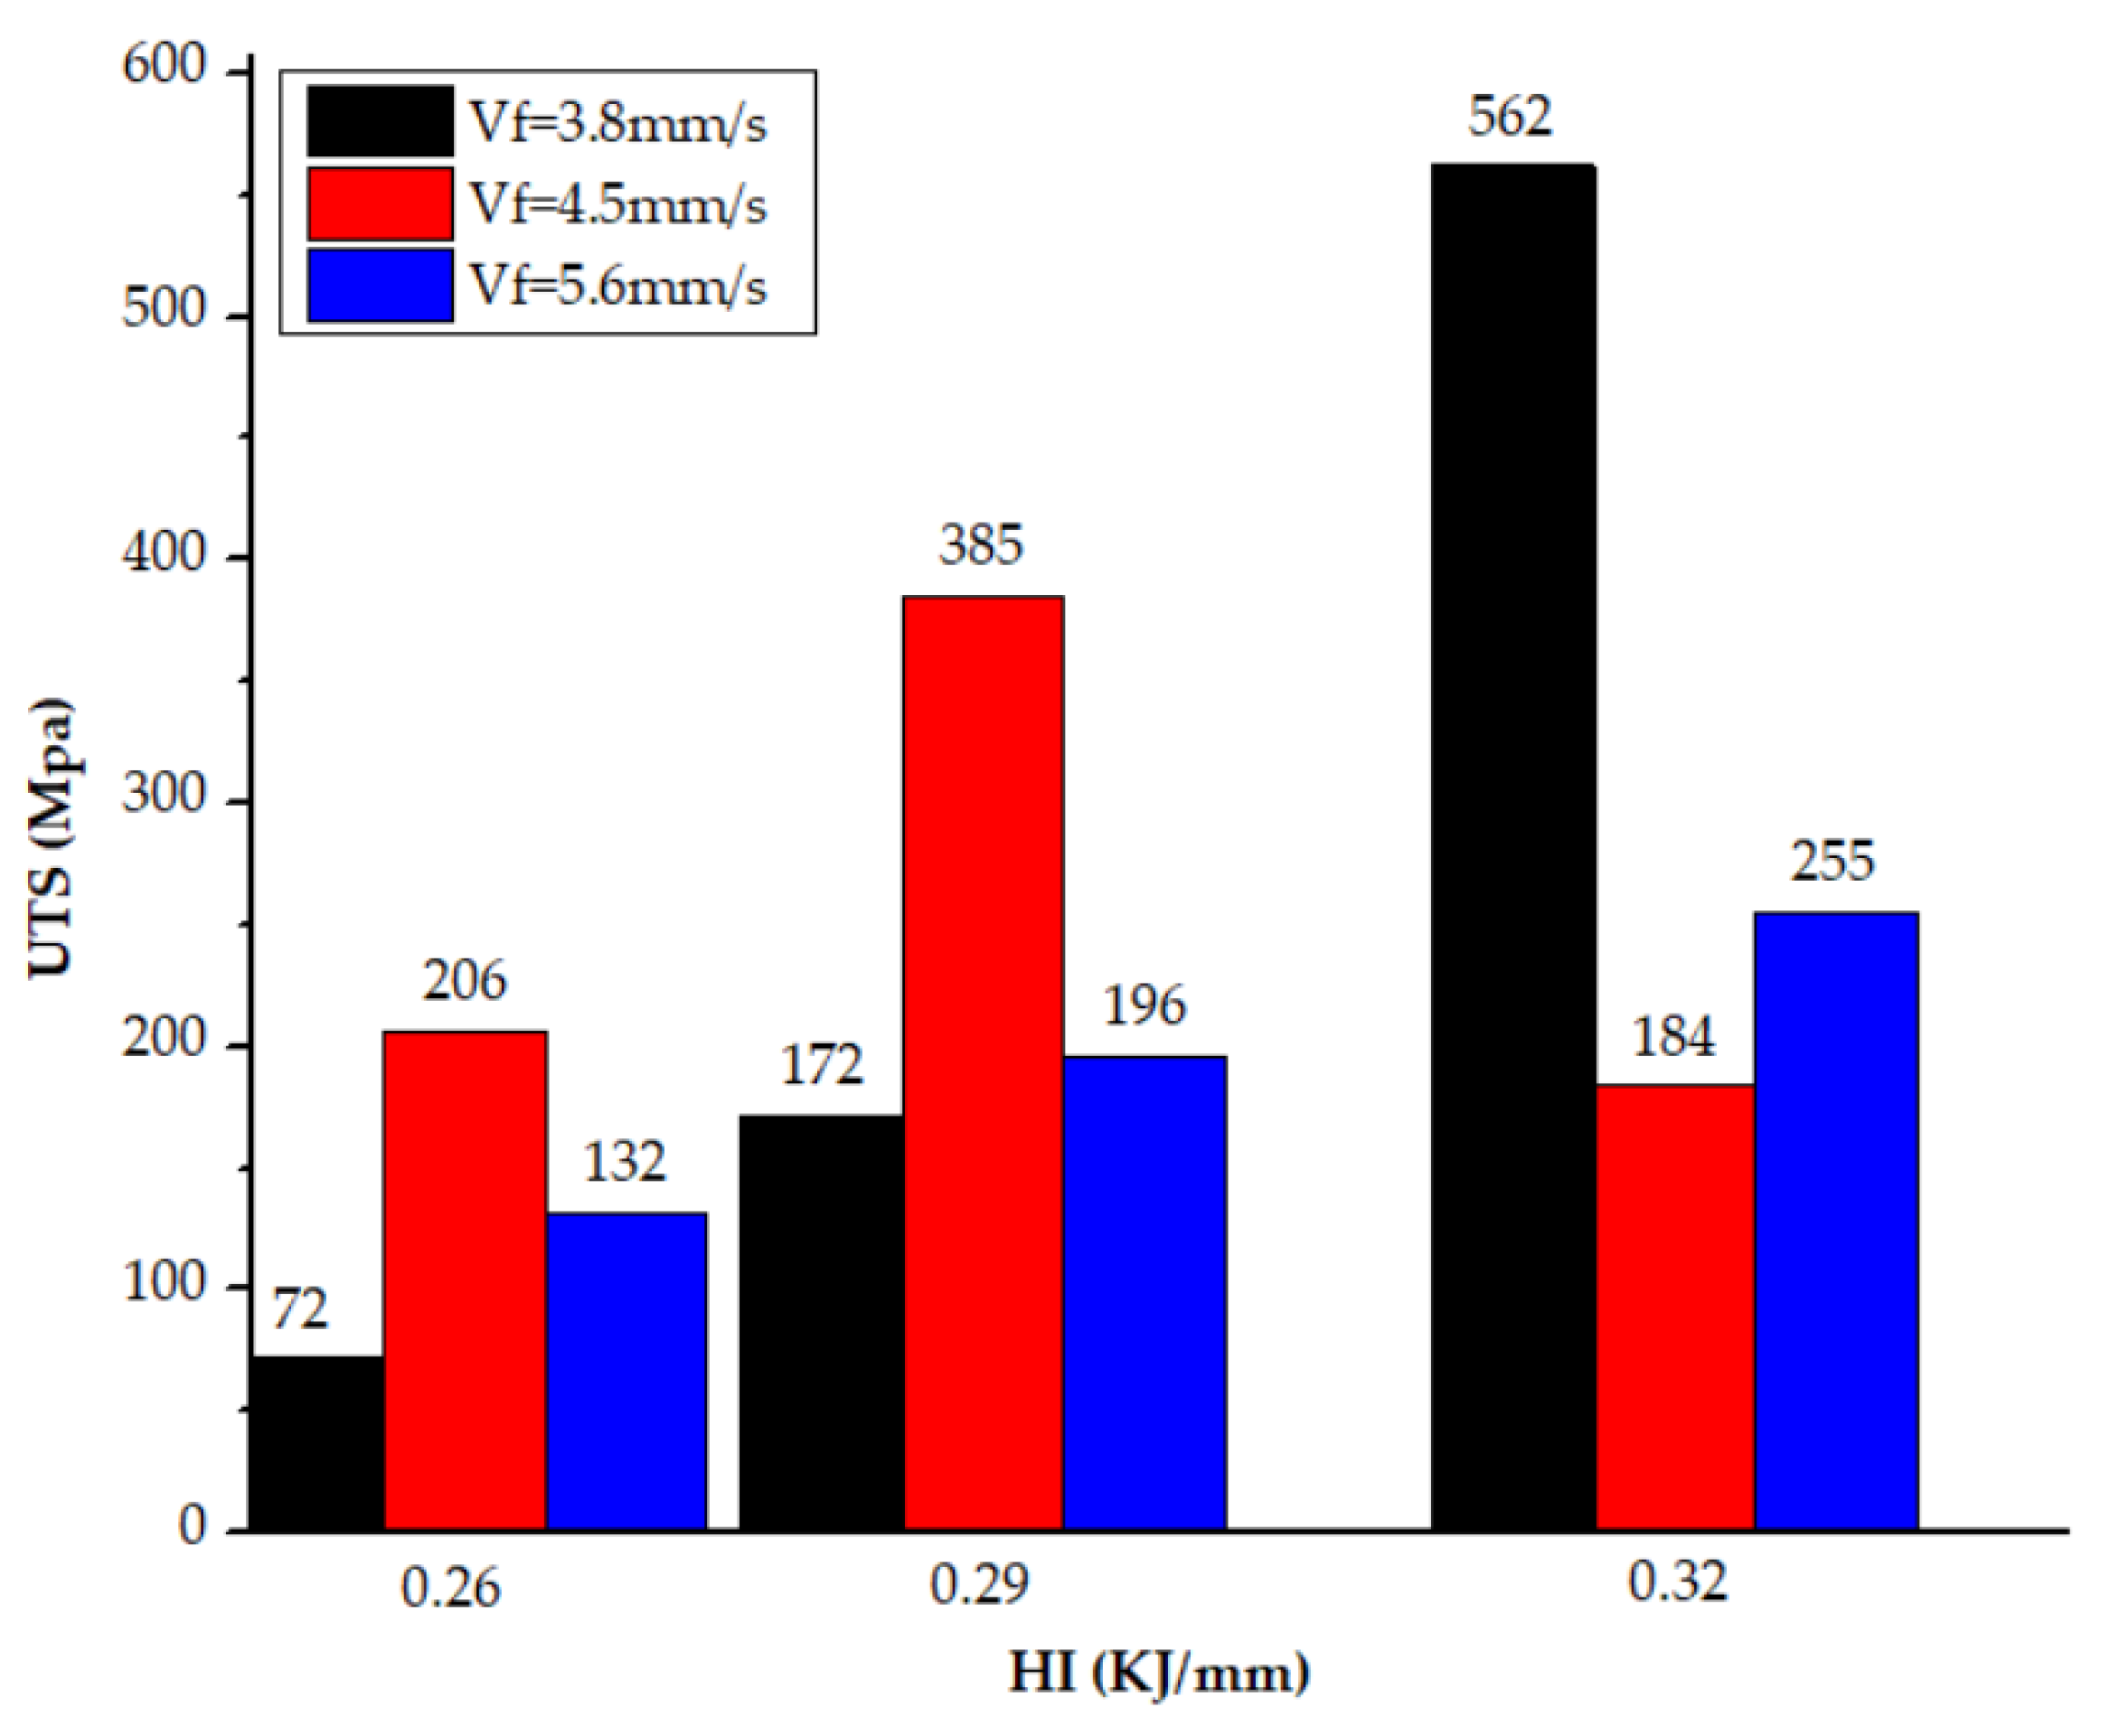
Figure 5 shows the relationship between HI and V
f on tensile strength. From 0.26 KJ/mm to 0.29 KJ/mm, increases in the wire feed speed led to an improvement in the UTS value of the weld. However, at 0.32 KJ/mm, only a 5.6 mm/s case has an improvement trend. The other wire feeding speed has declined. In other words, the HI rate and wire feeding feed strongly impact the tensile strength of the orbital 304 steel pipe [
25,
26,
27]. The results will be further investigated via the Taguchi method.
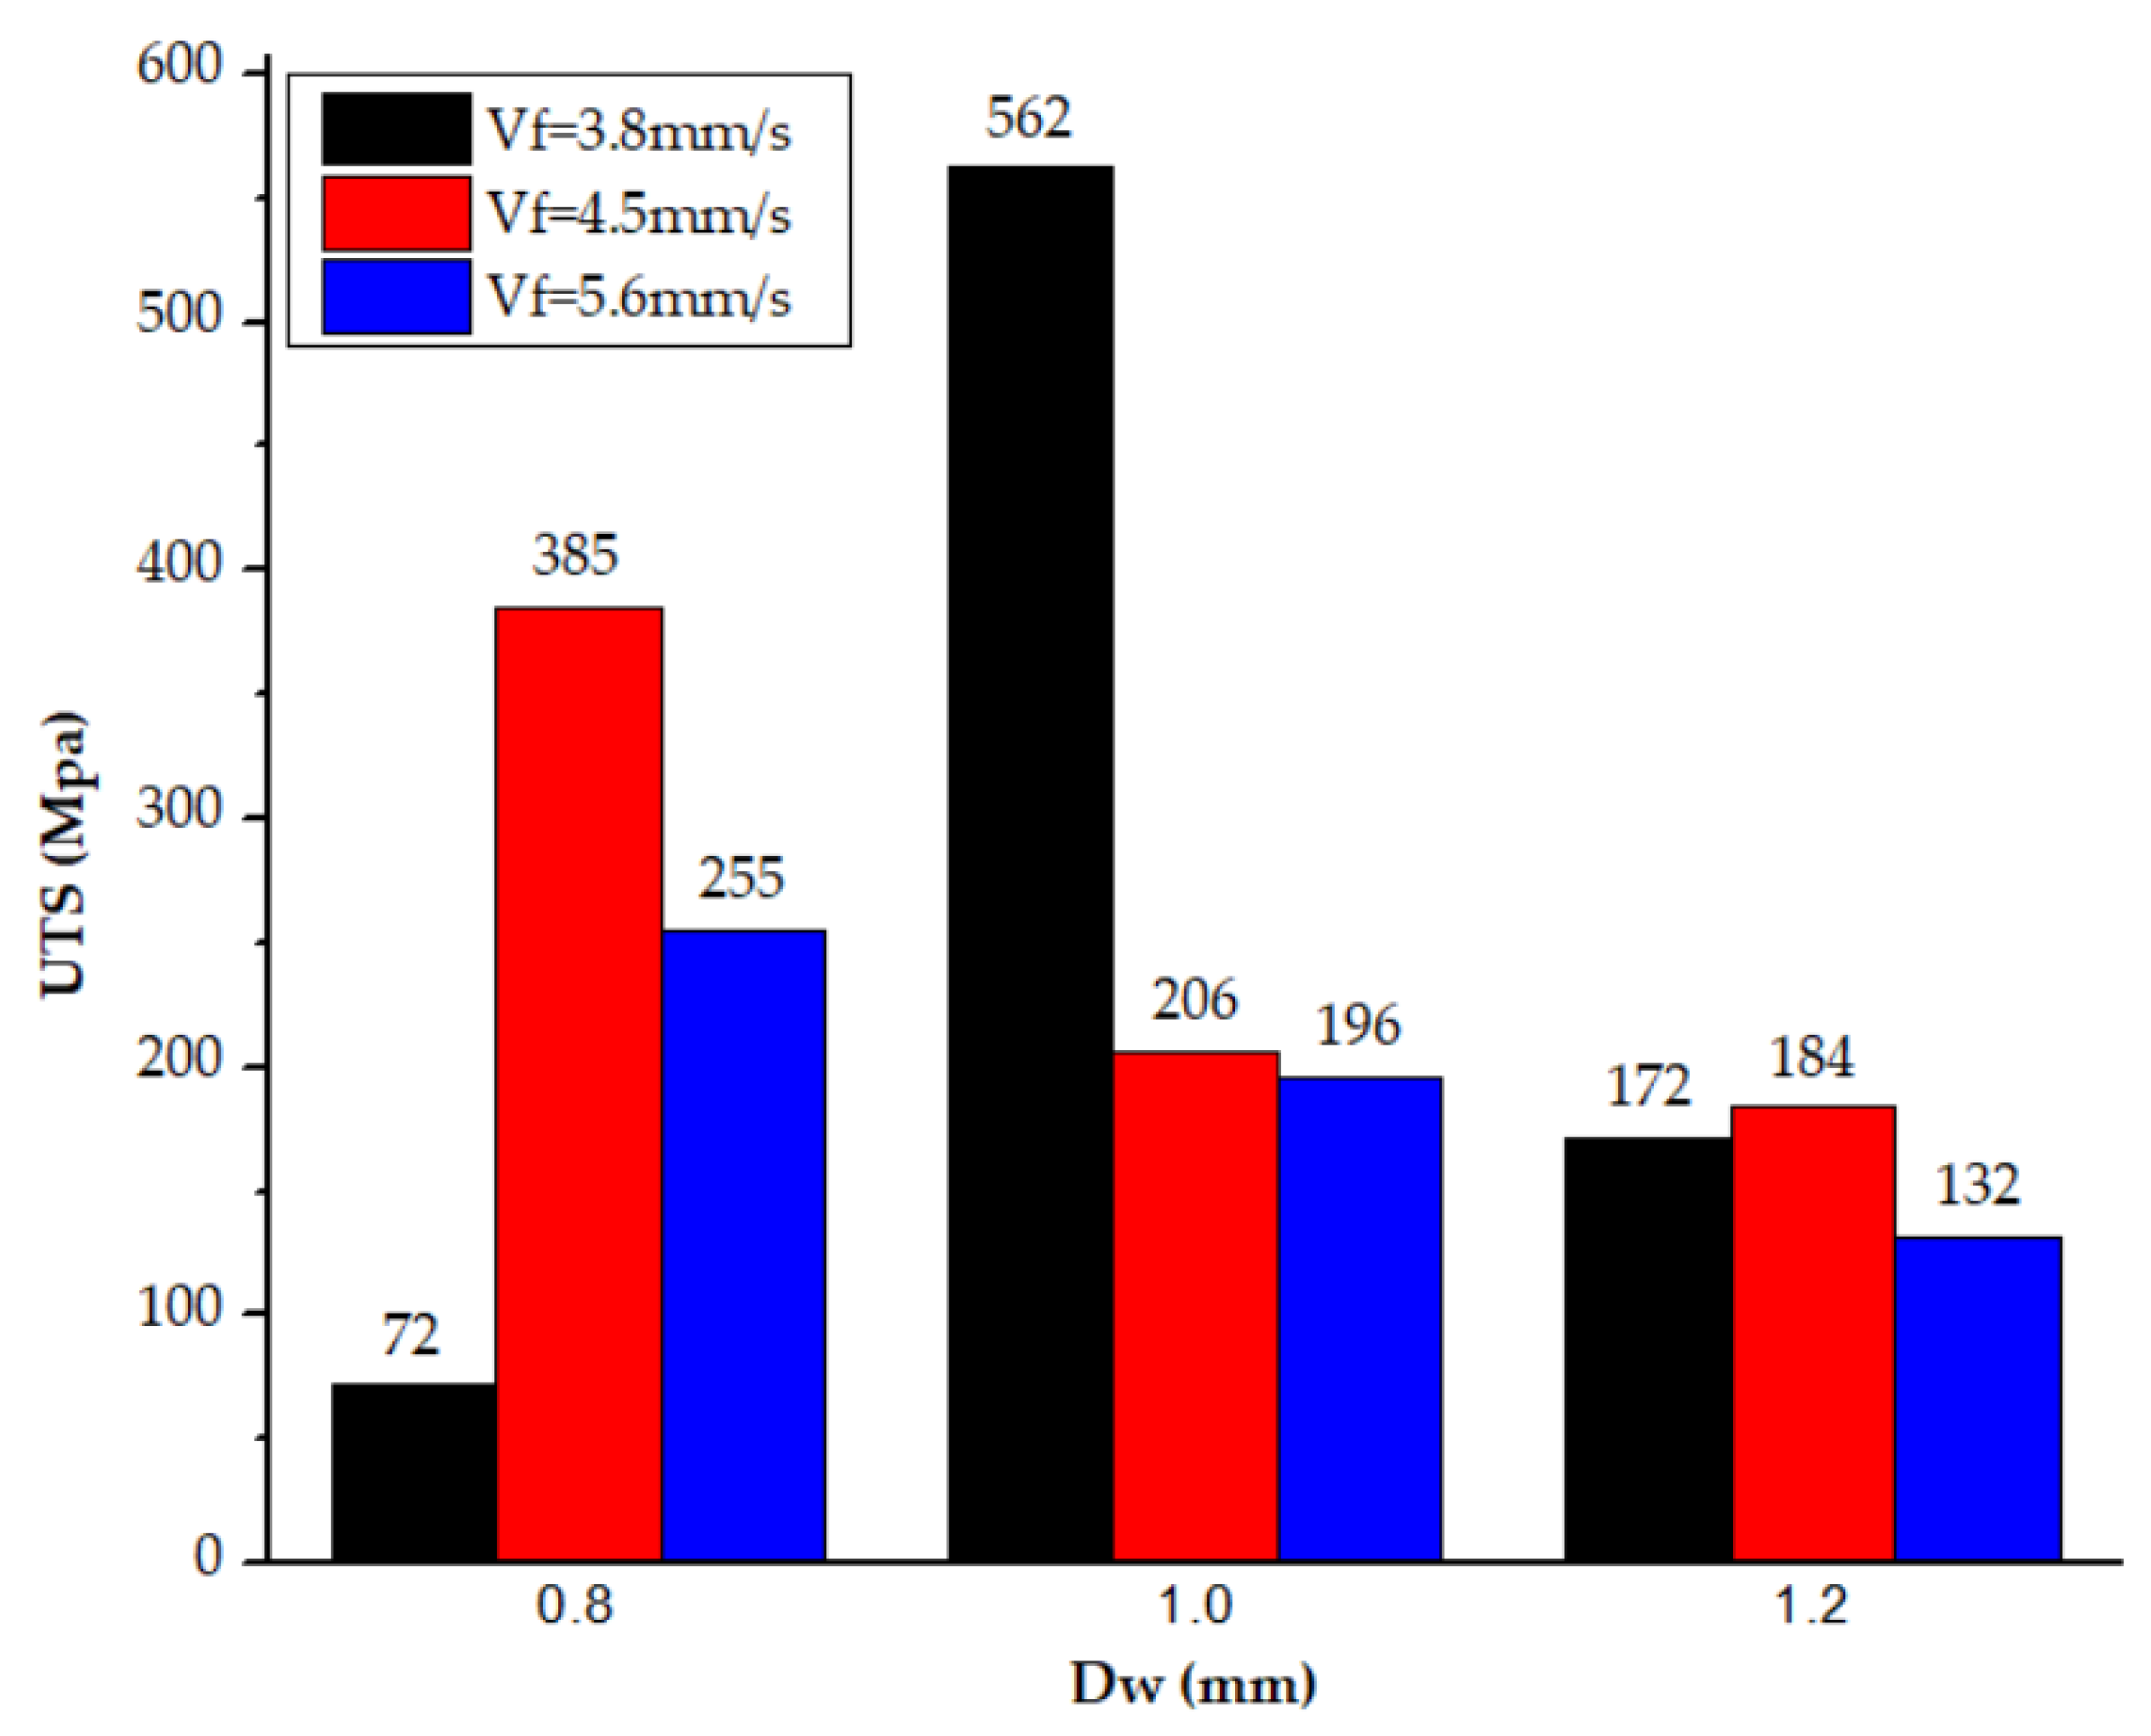
Figure 6 demonstrates the relationship between D
w and V
f on tensile strength. The average UTS values are 237.3 Mpa, 321.3 Mpa, and 162.7 Mpa, corresponding to the D
w of 0.8 mm, 1.0 mm, and 1.2 mm. An increase in the D
w value from 0.8 mm to 1.0 mm leads to a rise in the tensile strength. However, increasing the D
w further to 1.2 mm results in a reduction in the UTS value. The low UTS value of the weld joint could be the filling wire diameter melting rate. This means that a larger diameter and a higher wire feeding Sspeed could result in a poorer melting rate, and therefore, the penetration depth is lower [
28,
29,
30]. D
w of 0.8 mm and 1.0 mm is generally better than D
w of 1.2 mm.
3.3. Microstructure
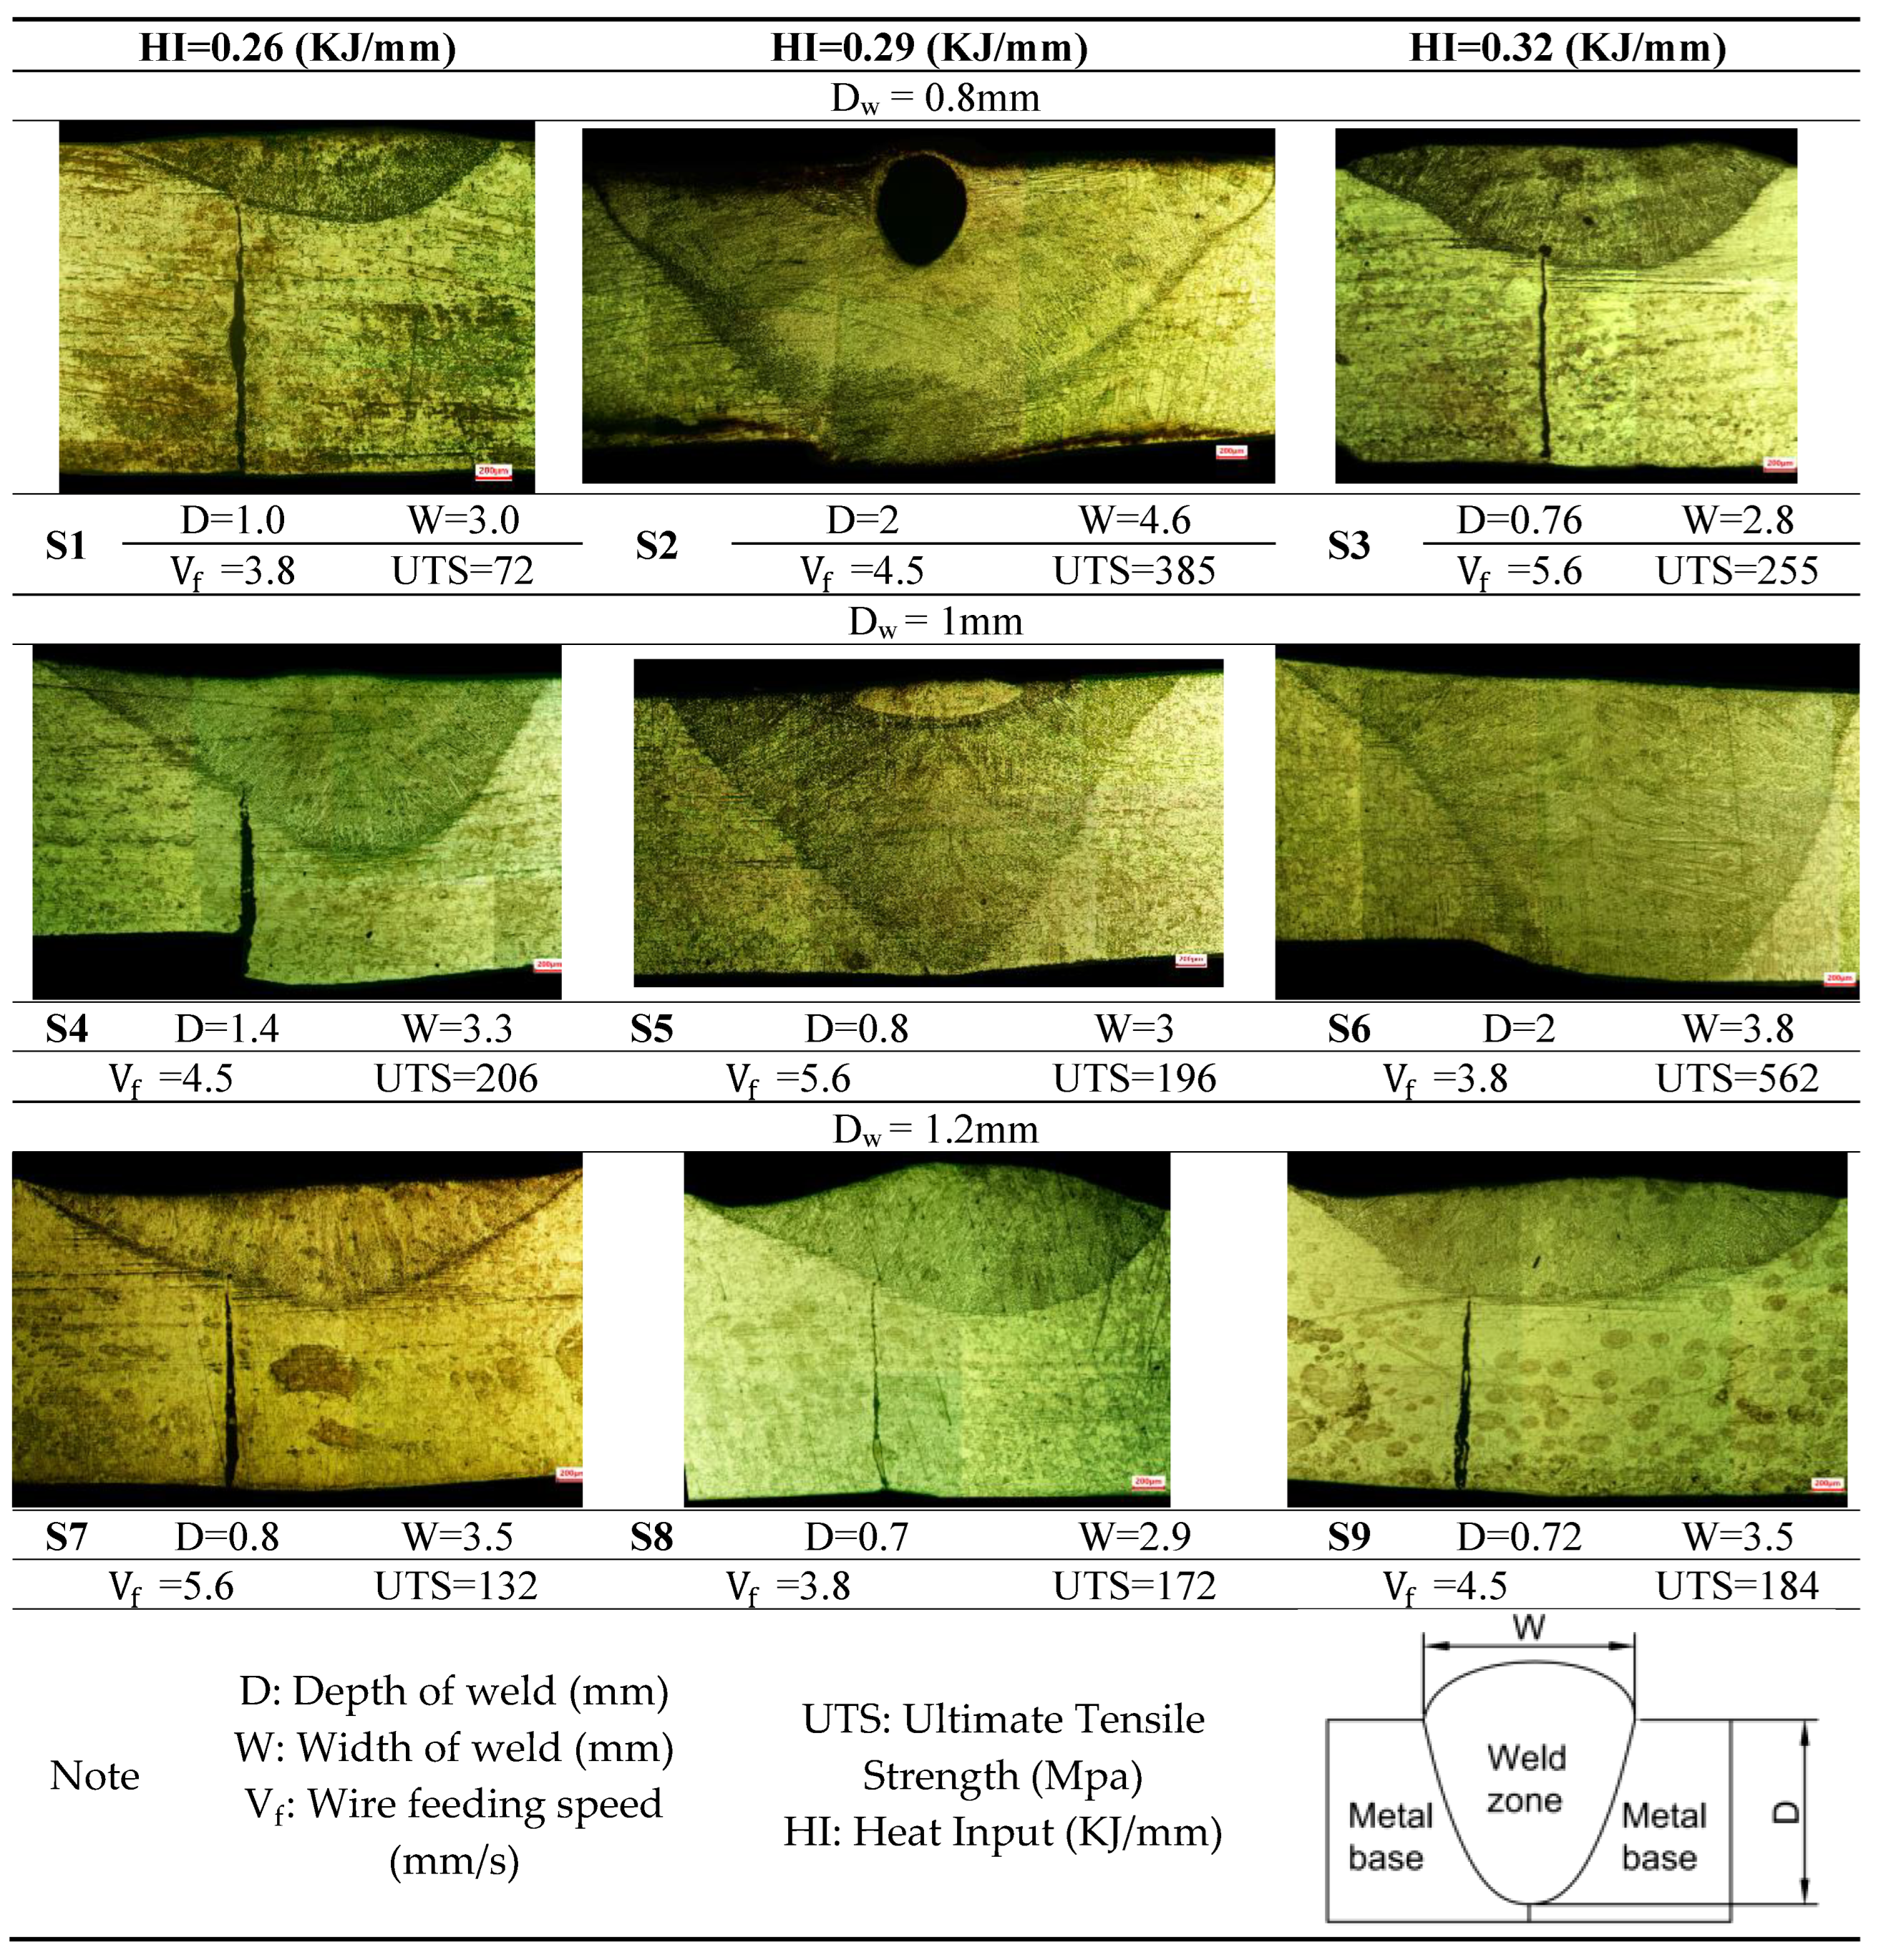
The overview microstructure of all samples is presented in
Table 7. According to
Figure 6 and
Table 7, the samples with an HI of 0.26 KJ/mm are not fully penetrated. Therefore, it is also the cause of the low UTS of the samples in this group. In addition, observing samples with an HI of 0.29 KJ/mm, samples S5 and S8 were not fully penetration, but sample S2 was. The appearance of the S2 shows a dark gray color and lots of porosity on the surface, and the micrograph shows that the internal structure is also porous. The prediction is that this sample is overheated. The reason is that the contact surface between the two pipes has not been carefully cleaned, and the gas flow adjustment of the backing gas and gas entering the welding head is not careful, leading to more gas for backing gas and reducing the amount of gas for the welding head. For samples with an HI of 0.32 KJ/mm, there is a complete penetration in the S6 sample, and two samples, S3 and S9, are not fully penetration. Observe the parameters of these three models, S3 and S9 cs, and the maximum wire feed speed.
According to Chen et al. [
31], the diameter of the molten metal bridge (d
s) depends on the filler wire speed (V
f) and the metal transfer period (T) from the filler metal to the pool weld with the formula:
When V
f increases, the period and the metal supply will decrease. This phenomenon also makes the filler metals more inclined to penetrate the arc center before they are melted, which takes away the heat of the weld pool and prevents the arc from reaching the weld pool. In
Figure 6, samples with a D
w of 1.2 mm are not fully penetrated but possess an extensive breadth. The problem occurs when the models S7 and S9 with the largest V
f give a large width while the V
f of S8 is the smallest for a smaller width. The metal transfer period of S8 is the largest of the three samples so that the metal width will be more significant. The microscopic observation sampling location selection has the start or end of the metal transfer period, where the weld size is usually smaller. Possessing the largest D
w also increases the arc resistance and heat removal of the weld pool of these models. Samples with D
w of 0.8 mm and 1 mm have a smaller D
w, but when combined with different V
f and HI levels, the quality of the weld is also affected. Only sample S6 combines maximum HI, minimum V
f, and average D
w, providing the best UTS. For more proof that S2 is overheating, the microstructure is further investigated in the following figure.
Observing the microstructure of samples S7, S8, and S9, there is a significant misalignment between the weld root and the gap of the two pipe ends. The possible cause is the use of an unsuitable diameter of filler wire for the pipe thickness and HI that leads to heat loss in the weld pool, which significantly reduces weld penetration. As a result, the UTS of these samples is below 200 Mpa, which is lower than the UTS of sample S3 at 255 Mpa, despite having nearly the same penetration depth but the weld root in S3 is less misaligned compared to S7, S8, and S9. Similarly, the S1 weld also exhibited misalignment and low penetration, resulting in the lowest UTS value of 72 Mpa. As for sample S4, due to misalignment during tack welding and the formation of a large gap, its penetration was also low, with a UTS of 206 Mpa. These findings highlight the importance of selecting an appropriate filler wire for HI, as it directly impacts weld penetration, tensile strength, and the overall quality of the weld.
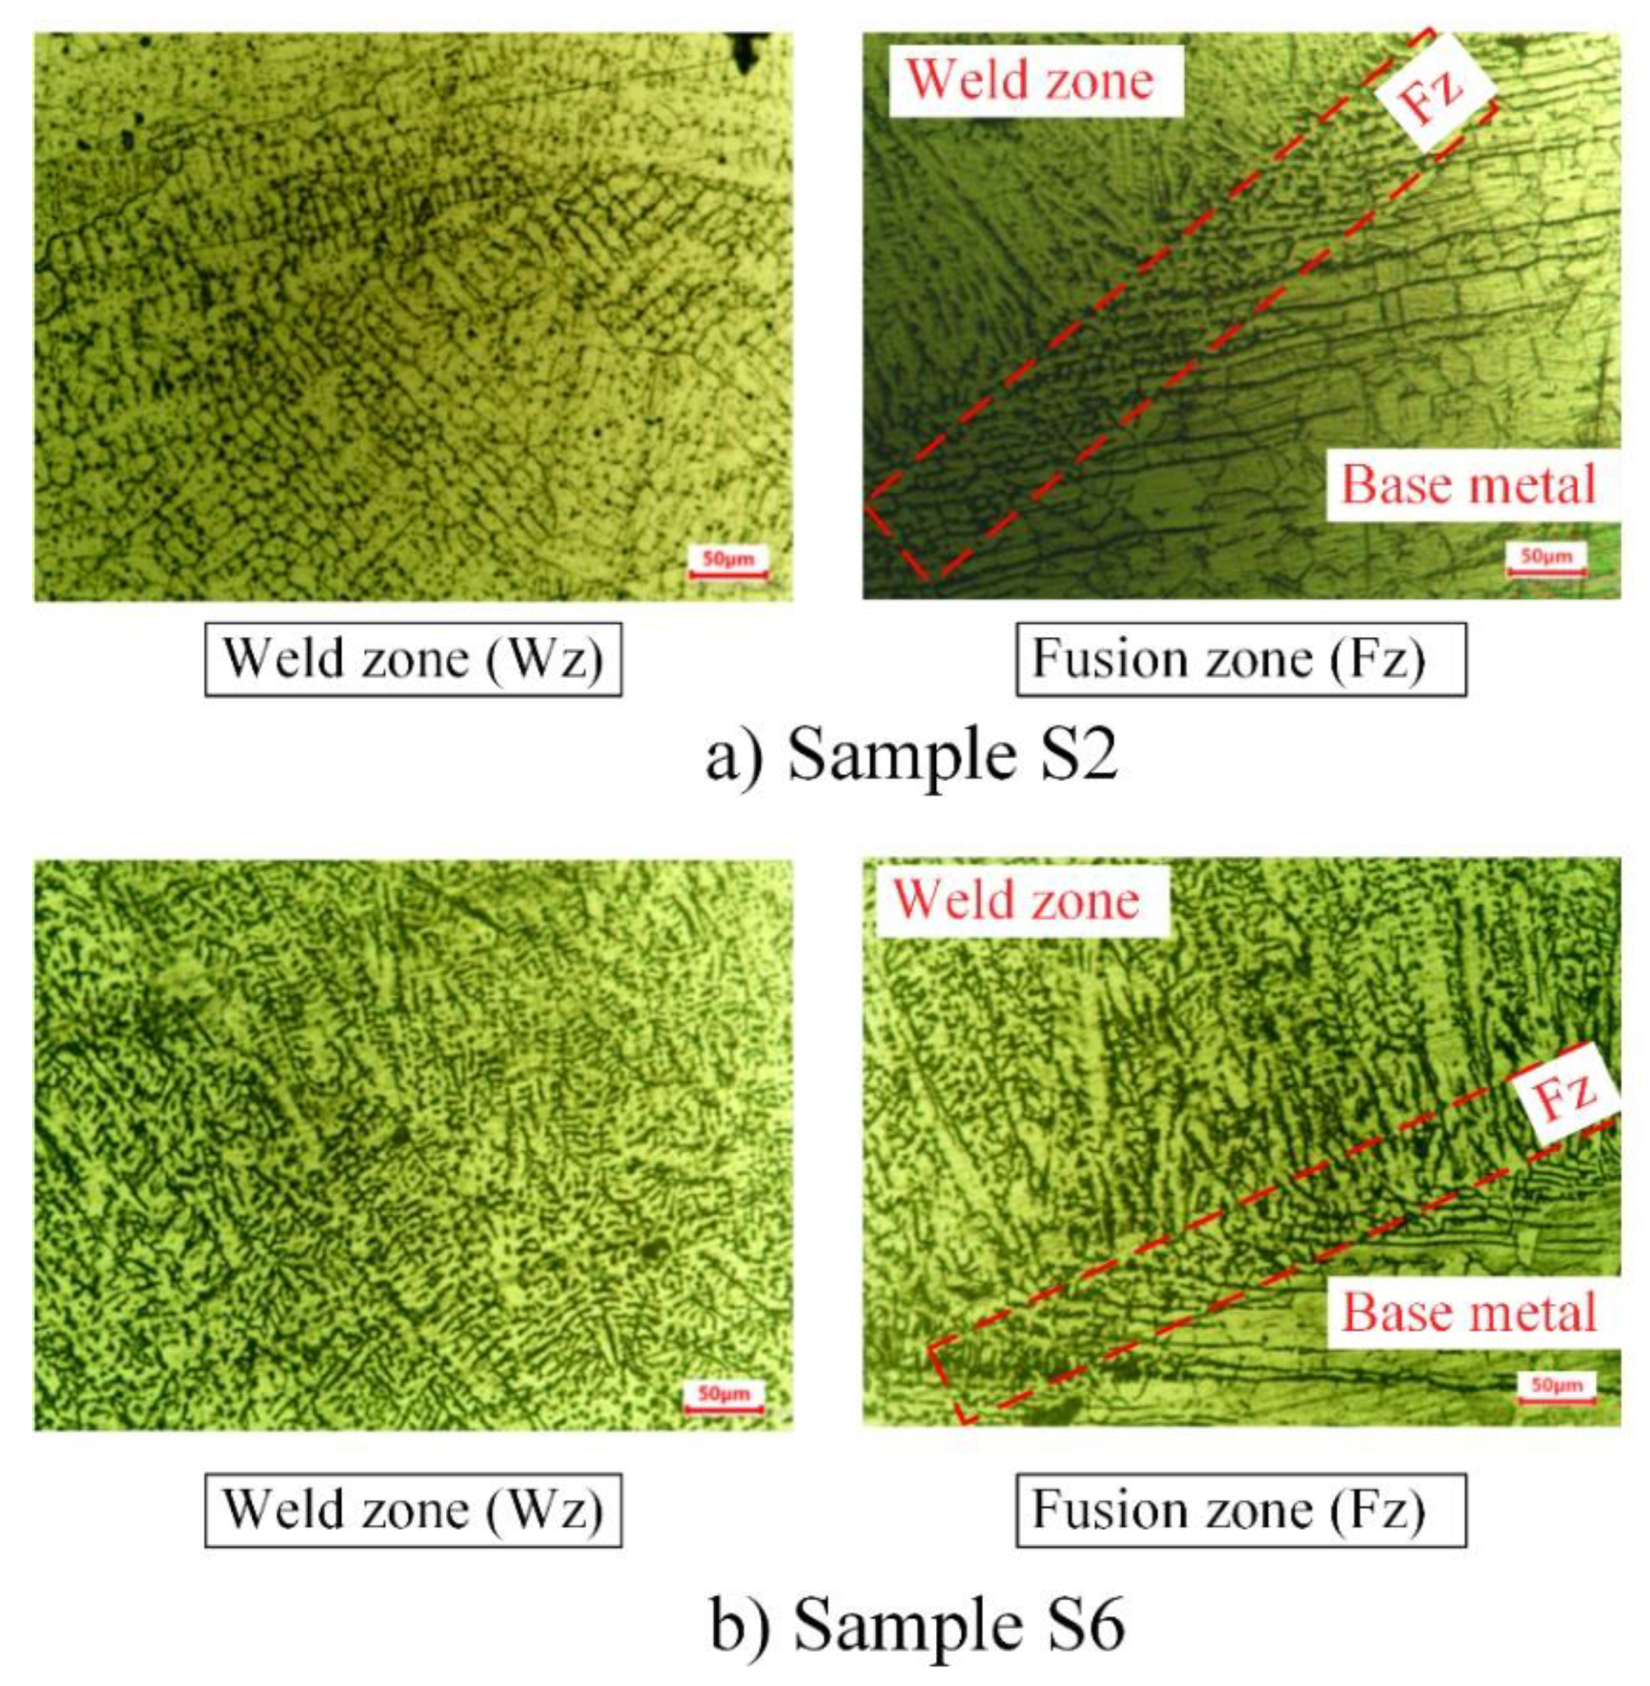
Figure 7 shows the optical micrograph showing the microstructure of the weld zone and fusion zone of samples S2 and S6. The analysis at larger magnification with samples S2 and S6 is conducted because these two samples are entirely penetrating. In S2 sample, there are interdendrite structures with coarse grain size, leading to the decrease of UTS value of 385 Mpa. On the contrary, the interdendrite structures in sample S6 are much finer, leading to a better UTS value of 562 Mpa. This result is consistent with the report of Kumar et al. [
32], which also reveals the impact of interdendrite structure size on the UTS of the weld joints. Because the HI of sample S6 is higher than that of sample S2, as shown in
Table 3. Moreover, sample S6 was filled with a wire diameter of 1mm at a Vf of 3.8mm/s, whereas the wire diameter used in sample S2 was 0.8mm with a Vf of 4.5mm/s. These results indicate that although sample S6 had a higher HI, the larger diameter wire and slower wire feed speed compared to sample S2 caused the solidification rate of the S6 weld to be faster. Consequently, the microstructure of sample S6 was finer, and the fusion zone was smaller and more compact than that of sample S2. These results indicate that changing the filler wire diameter significantly affects HI, as it absorbs heat to melt and deposit metal into the weld pool. This adjustment can help balance HI, preventing excessive penetration, distortion, or oxidation in stainless steel.
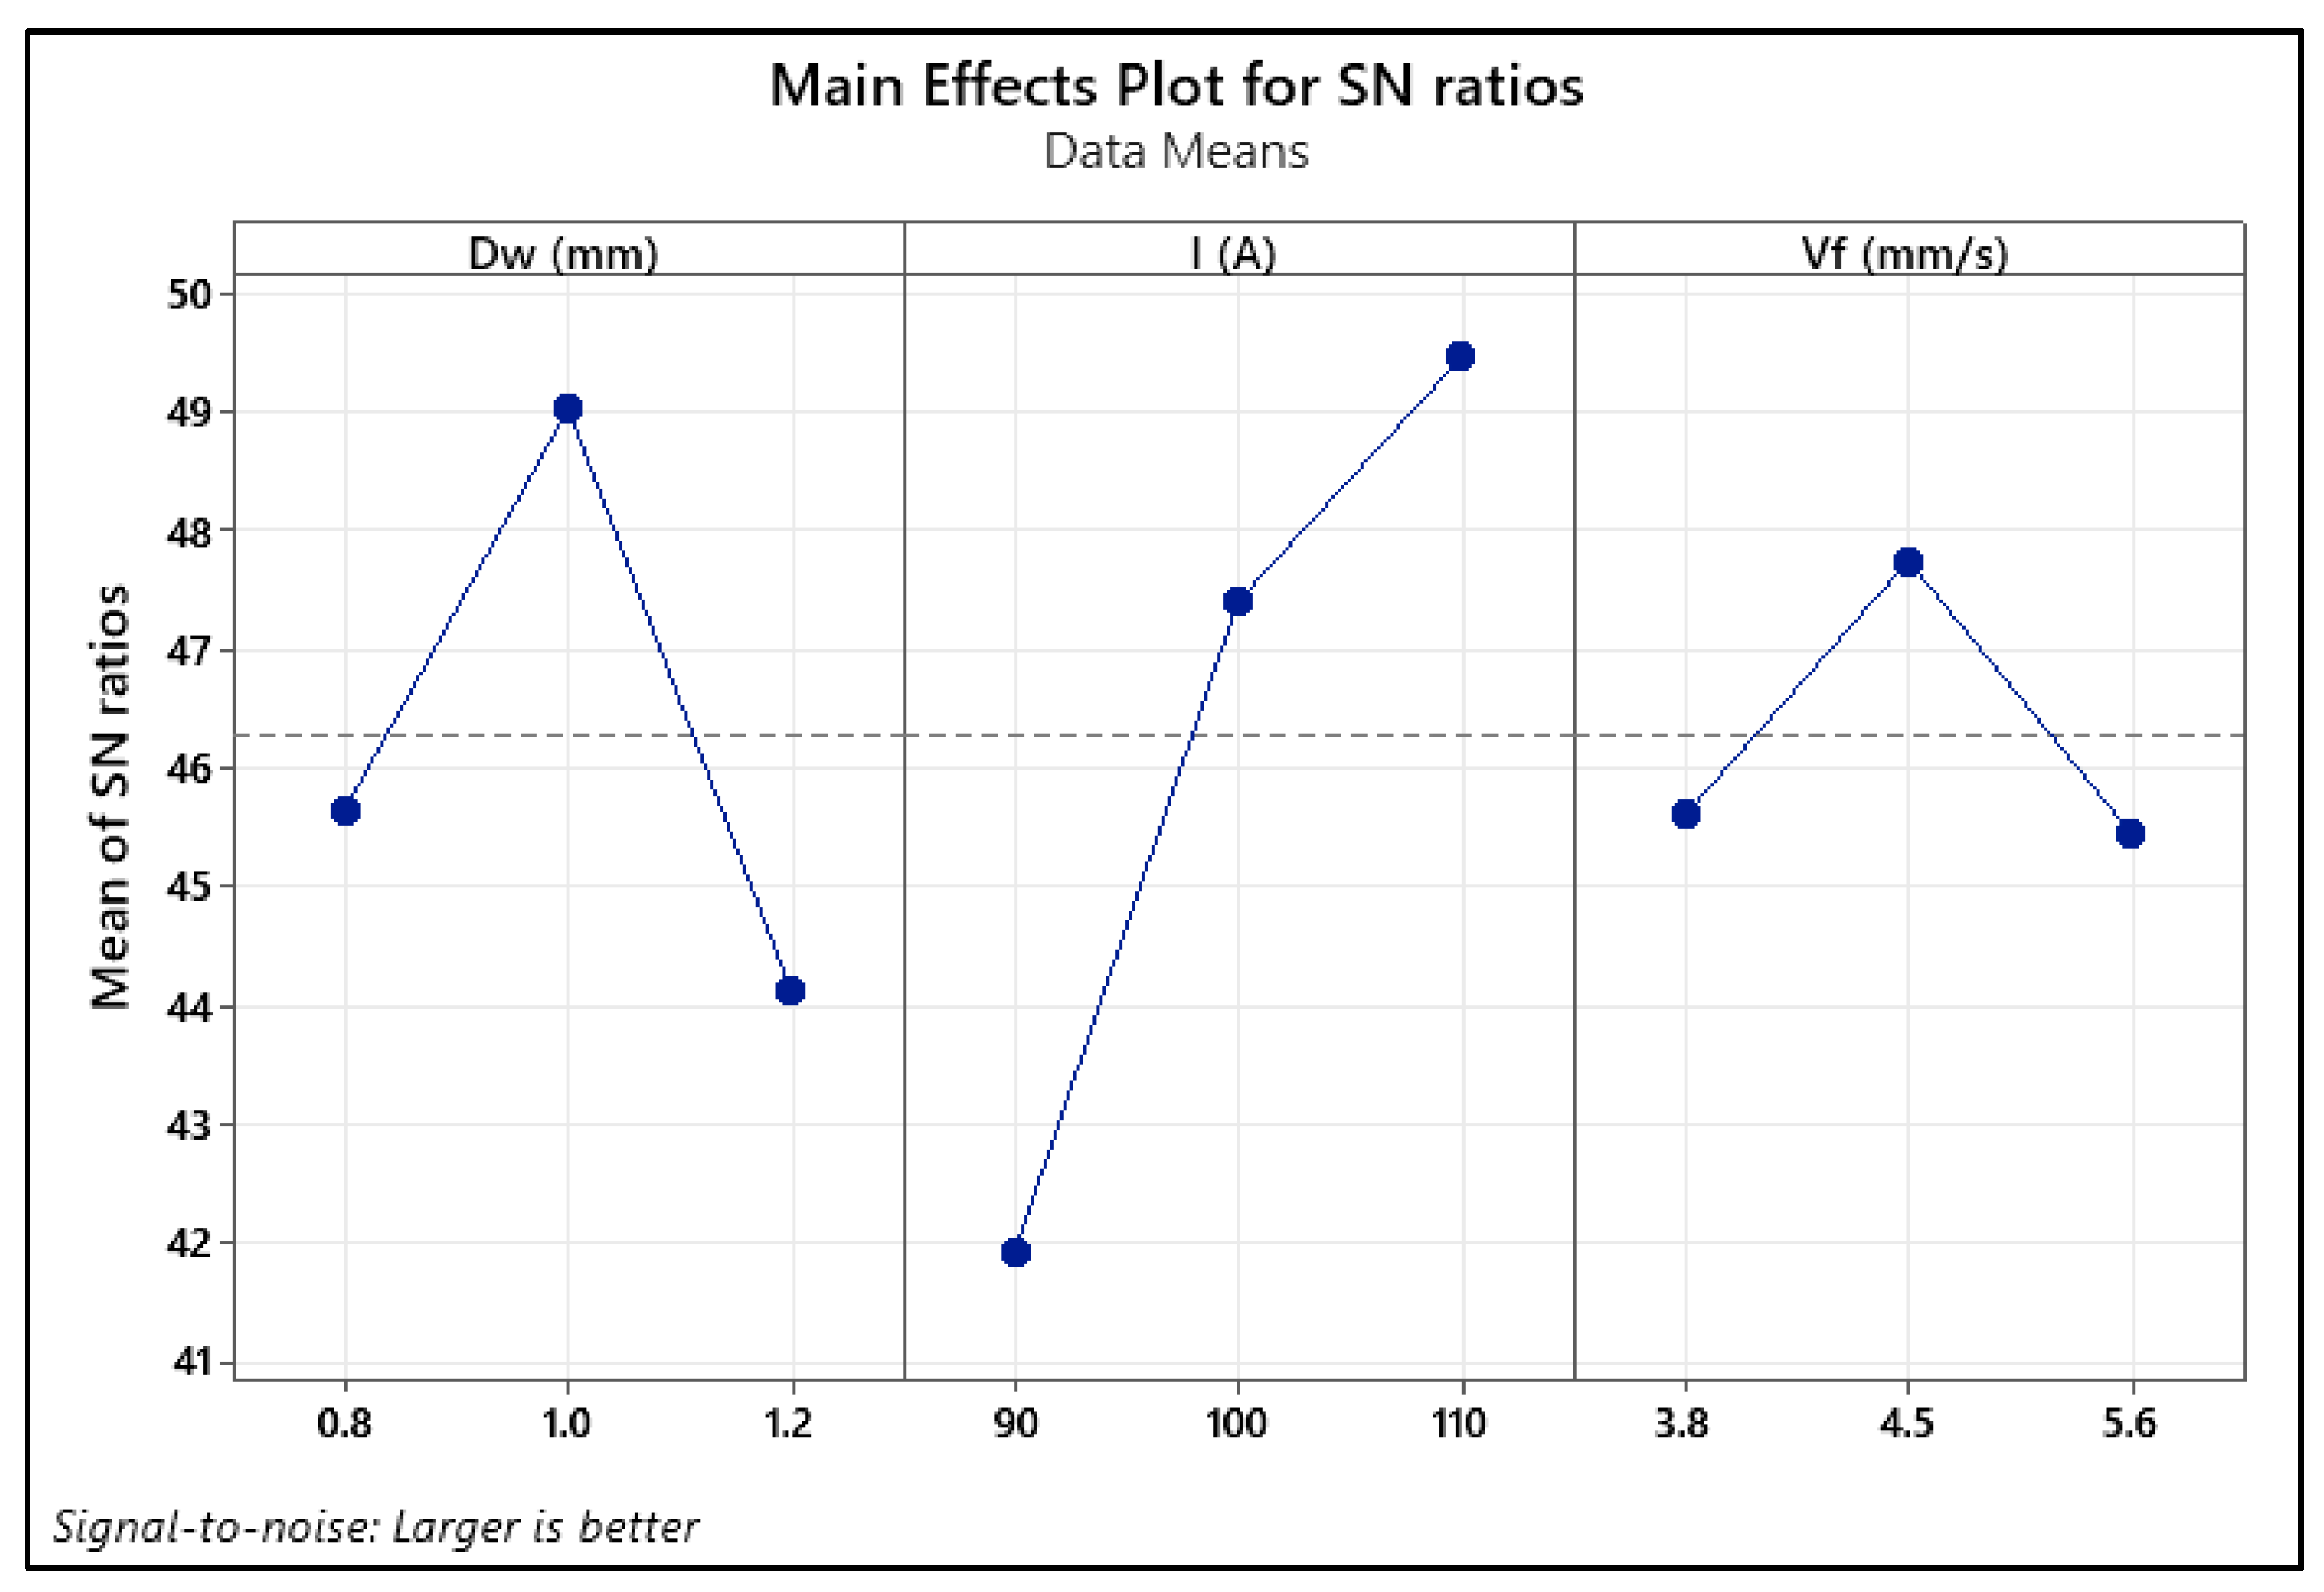
3.4. Taguchi Analysis
Based on the Taguchi analysis method and Minitab software, the results presented by the Taguchi method are shown in
Table 8 and
Table 9 and
Figure 8.
Table 8 displays the response table for the Signal to Noise ratio. The welding current has the highest impact rank, followed by the wire feeding diameter. The welding speed ranks in the lowest position. The direct impact of the welding current on the HI value could explain the high-ranking effect of the welding current on the tensile strength. The optimal results in
Figure 8 are presented in
Table 9: D
w of 1.0 mm, welding current of 110 A, and welding speed of 4.5 mm/s, with the corresponding HI of these parameters of 0.32 KJ/mm. The predicted tensile strength from these parameters is 432.4 Mpa, which is lower than the highest UTS value of 562 Mpa.
4. Conclusions
This study investigates the influences of orbital welding parameters such as voltage, current, travel speed, and filler wire diameters on the tensile strength of 304 steel pipes. The results show that the best sample has a UTS value of 562 MPa with Vf of 3.8 mm/s, HI 0.32 KJ/mm and Dw 1 mm. Moreover, high tensile values are obtained at HI levels of 0.32 KJ/mm, Vf from 3.8 mm/s to 4.5 mm/s, and Dw from 0.8 mm to 1 mm. When HI increases, the tensile strength increases. However, if HI rises too high, the weld will overheat, and the tensile strength will decrease. With an HI value of 0.32 KJ/mm or less, it is unsuitable for the 1.2 mm filler wire diameter to create a good welding joint. The welding current has the highest impact rank, followed by the wire feeding diameter. The welding speed ranks in the lowest position compared to other parameters. The direct impact of the welding current on the HI value could explain the high-ranking effect of the welding current on the tensile strength. The optimal results are Dw of 1.0 mm, welding current of 110 A, and welding speed of 4.5 mm/s, corresponding to a predicted tensile strength of 432.4 Mpa.
Author Contributions
Conceptualization, Ngoc-Thien Tran and Thanh Trung Do; Formal analysis, Ngoc-Thien Tran, Van Huong Hoang and Dinh Ngoc Huy; Funding acquisition, Ngoc-Thien Tran and Thanh Trung Do; Investigation, Ngoc-Thien Tran, Van-Thuc Nguyen, Thanh Trung Do, Ha Tan Phat and Van Thanh Tien Nguyen; Project administration, Van-Thuc Nguyen, Dinh Ngoc Huy and Ha Tan Phat; Visualization, Ngoc-Thien Tran, Van Huong Hoang and Dinh Ngoc Huy; Writing – original draft, Ngoc-Thien Tran, Van-Thuc Nguyen and Thanh Trung Do; Writing – review & editing, Ngoc-Thien Tran, Van-Thuc Nguyen, Thanh Trung Do and Van Thanh Tien Nguyen. All authors have read and agreed to the published version of the manuscript.
Funding
The authors thank the support of the HCMC University of Technology and Education (HCMUTE) via Grant No. T2025 for this study.
Data Availability Statement
The data used to support the findings of this study are available from the corresponding author upon request.
Acknowledgments
The authors acknowledge the support of the HCMC University of Technology and Education (HCMUTE).
Conflicts of Interest
The authors declare no conflict of interest.
References
- Polysoude, S. A. S. (2009). The Orbital Welding Handbook. Polysoude, Nantes, France.
- e Silva, R. H. G., Schwedersky, M. B., & da Rosa, Á. F. (2020). Evaluation of toptig technology applied to robotic orbital welding of 304L pipes. International Journal of Pressure Vessels and Piping, 188, 104229.
- Gomes de Oliveira, G. L., Cordeiro de Miranda, H., & Farias, J. P. (2010). Residual stress evaluation in small diameter pipes welded using the orbital TIG process. Welding International, 24(10), 749-757.
- Riffel, K. C., Silva, R. H. G. E., Dalpiaz, G., Marques, C., & Schwedersky, M. B. (2019). Keyhole GTAW with dynamic wire feeding applied to orbital welding of 304L SS pipes. Soldagem & Inspeção, 24, e2418. [CrossRef]
- Baskoro, A. S., Kiswanto, G., Widyianto, A., & Panji, M. (2021). Influence of Welding Parameters on Macrostructure, Microstructure and Mechanical Properties in Orbital Pipe Welding of A36 Mild Steel Pipe. International Journal of Integrated Engineering, 13(7), 288-296. [CrossRef]
- McNair, S. A., Chaharsooghi, A. S., Carnevale, M., Rhead, A., Onnela, A., Daguin, J., ... & Lunt, A. J. (2022). Manufacturing technologies and joining methods of metallic thin-walled pipes for use in high pressure cooling systems. The International Journal of Advanced Manufacturing Technology, 1-15. [CrossRef]
- Robertson, S., Penney, J., McNeil, J. L., Hamel, W. R., Gandy, D., Frederick, G., & Tatman, J. (2020). Piping and pressure vessel welding automation through adaptive planning and control. JOM, 72, 526-535.
- Kim, D. S., Heo, S. H., Heo, S. U., & Kim, J. (2024). Orbital-Rail-Type Automatic Inspection Device for Pipeline Welds Using Radiation Dose Prediction Results from FLUKA Simulation. Applied Sciences, 14(14), 6165.
- García González, J., Hernández-Ortega, J. J., Jiménez-Ballesta, A. E., & Pedreño, R. Z. (2021). Analysis of Tube-to-Tubesheet Welding in Carbon Steel Heat Exchangers of a Double Plate Header Box. Materials, 15(1), 261.
- Mamvura, T. A., Paterson, A. E., & Fanucchi, D. (2017). The impact of pipe geometry variations on hygiene and success of orbital welding of brewing industry equipment. Journal of the Institute of Brewing, 123(1), 81-97.
- Shen, S., Oguocha, I. N. A., & Yannacopoulos, S. (2012). Effect of heat input on weld bead geometry of submerged arc welded ASTM A709 Grade 50 steel joints. Journal of Materials Processing Technology, 212(1), 286-294. [CrossRef]
- Rai, R., Kelly, S. M., Martukanitz, R. P., & DebRoy, T. (2008). A convective heat-transfer model for partial and full penetration keyhole mode laser welding of a structural steel. Metallurgical and Materials Transactions A, 39, 98-112. [CrossRef]
- Benyounis, K. Y., Olabi, A. G., & Hashmi, M. S. J. (2005). Effect of laser welding parameters on the heat input and weld-bead profile. Journal of materials processing technology, 164, 978-985. [CrossRef]
- Nowacki, J., & Rybicki, P. (2005). The influence of welding heat input on submerged arc welded duplex steel joints imperfections. Journal of Materials Processing Technology, 164, 1082-1088.
- Kumar, R. Defects Associated with Welding Techniques and Their Detection Methods. In Advanced Welding Techniques (pp. 63-89). CRC Press.
- Singh, N. K., & Pradhan, S. K. (2020). Experimental and numerical investigations of pipe orbital welding process. Materials Today: Proceedings, 27, 2964-2969.
- Baskoro, A. S., Widyianto, A., Prasetyo, E., & Kiswanto, G. (2024). The Taguchi and Response Surface Method for Optimizing Orbital Pipe Welding Parameters in Pulsed Current Gas Tungsten Arc Welding (PC-GTAW) for SS316L. Transactions of the Indian Institute of Metals, 1-14.
- Mengistie, A. K., & Bogale, T. M. (2023). Development of automatic orbital pipe MIG welding system and process parameters’ optimization of AISI 1020 mild steel pipe using hybrid artificial neural network and genetic algorithm. The International Journal of Advanced Manufacturing Technology, 128(5-6), 2013-2028.
- Widyianto, A., Baskoro, A. S., Kiswanto, G., & Ganeswara, M. F. G. (2021). Effect of welding sequence and welding current on distortion, mechanical properties and metallurgical observations of orbital pipe welding on SS 316L. Eastern-European Journal of Enterprise Technologies, 2(12), 110.
- ASTM A276/A276M; Standard Specification for Stainless Steel Bars and Shapes. ASTM: West Conshohocken, PA, USA, 2023.
- Van Huong, H., Nguyen, T. T., Nguyen, V. T., & Nguyen, V. T. T. (2024). Material Strength Optimization of Dissimilar MIG Welding between Carbon and Stainless Steels. Metals, 14(9), 1011.
- American National Standards Institute (2009). Specification for Welding of Austenitic Stainless Steel Tube and Pipe Systems in Sanitary (Hygienic) Applications (AWS D18.1/D18.1M:2009), 2nd Edition. International Standard Book Number: 978-0-87171-749-8.
- International Standard (2019). Metallic materials - Tensile testing - Part 1: Method of test at room temperature, Third edition. ISO 6892-1.
- The American Society of Mechanical Engineers (2019). An International Code 2019 ASME Boiler & Pressure Vesel Code, Section IX: Welding, Brazing and Fusing Qualifications (ASME BPVC.IX-2019) .
- Nguyen, T. T., Hoang, V. H., Nguyen, V. T., & Nguyen, V. T. T. (2024). Dissimilar MIG Welding Optimization of C20 and SUS201 by Taguchi Method. Journal of Manufacturing and Materials Processing, 8(5), 219.
- Khdir, Younis K.; Kako, Salim A.; and Gardi, Ramadhan H. (2020) “Study of Welding Dissimilar Metals – Low-carbon Steel AISI 1018 and Austenitic Stainless Steel AISI 304,” Poly technic Journal: Vol. 10: Iss. 1, Article 1.
- Thien, T. N., Thang, T. Q., & Hau, N. T. (2022). Effect of Orbital Welding Parameters on the Weld Geometry. Advanced Materials and Engineering Materials, 116.
- Pu, J., Zhao, Y., Jiang, Y., Zou, J., & Song, S. (2020). Influence of wire feeding speed on the melting behavior and formation of narrow-gap joint by laser welding with filler wire. Journal of Laser Applications, 32(3). [CrossRef]
- Huang, W., Chen, S., Xiao, J., Jiang, X., & Jia, Y. (2021). Investigation of filler wire melting and transfer behaviors in laser welding with filler wire. Optics & Laser Technology, 134, 106589. [CrossRef]
- Zhao, Y., Long, Y., & Li, Z. (2022). Research progress of transition layer and filler wire for laser welding of steel and aluminum dissimilar metals. The International Journal of Advanced Manufacturing Technology, 1-10. [CrossRef]
- Chen, S., Zhang, S., Huang, N., Zhang, P., & Han, J. (2016). Droplet transfer in arcing-wire GTAW. Journal of Manufacturing Processes, 23, 149-156. [CrossRef]
- Kumar, S., & Shahi, A. S. (2011). Effect of heat input on the microstructure and mechanical properties of gas tungsten arc welded AISI 304 stainless steel joints. Materials & Design, 32(6), 3617-3623. [CrossRef]
|
Disclaimer/Publisher’s Note: The statements, opinions and data contained in all publications are solely those of the individual author(s) and contributor(s) and not of MDPI and/or the editor(s). MDPI and/or the editor(s) disclaim responsibility for any injury to people or property resulting from any ideas, methods, instructions or products referred to in the content. |
© 2025 by the authors. Licensee MDPI, Basel, Switzerland. This article is an open access article distributed under the terms and conditions of the Creative Commons Attribution (CC BY) license (http://creativecommons.org/licenses/by/4.0/).