
Submitted:
01 May 2025
Posted:
06 May 2025
You are already at the latest version
Abstract
This paper investigates for the first time self-shielded flux-cored wires with an exothermic MnO2-Al addition and the effect of hardfacing modes on the deposited alloy of the FeCMn system. Additionally, the paper proposes a new experimental research methodology using an orthogonal experimental design with nine experiments and three levels. At the first stage, it is proposed to use the Taguchi plan (L9) method to find the most significant variables. At the second stage, for the development of a mathematical model and optimization, a factorial design is recommended. The studied parameters of the hardfacing mode were: travel speed (TS), set voltage on the power source (Uset), contact tip to work distance (CTWD), and wire feed speed (WFS). The following parameters were studied: welding thermal cycle parameters, microstructure, grain size, non-metallic inclusions, and mechanical properties. The results of the analysis showed that the listed parameters of the hardfacing modes have a different effect on the characteristics of the hardfacing process with self-shielded flux-cored wire with an exothermic addition in the filler. It was determined that for flux-cored wires with an exothermic addition, the size of the deposited metal grain size is most affected by the contact tip to work distance CTWD, to a lesser extent by the travel speed TS and the WFS wire feed speed. The research results showed that the travel speed (TS) had the main influence on the thermal cycle parameters (heat input, cooling time) and hardness. The analysis of the deposited metal samples showed that an increase in the travel speed had a negative impact on the number of non-metallic inclusions (NMIs) in the deposited metal. While the size of NMIs was influenced by the wire feed speed and the set voltage on the power source.
Keywords:
hadfield manganese steel
; self-shielded flux-cored wire
; exothermic addition
; thermal cycle parameters
; heat Input
; microstructure austenitic
; grain size
; hardness
; non-metallic inclusions
; Taguchi method
; factorial design
1. Introduction
Welding and hardfacing technologies can provide competitive advantages such as cost and quality of the final product in agriculture [1,2], mechanical engineering [3,4], automotive industry [5,6,7], transport sector [8,9] and other industries. In addition, the use of surfacing technology can extend the service life of worn surfaces subjected to various types of destruction (abrasive [10,11,12,13], corrosive [14,15], abrasive-impact [16,17], and others). In each of these sectors of the economy, the application of welding technologies and welding materials is essential. Among the variety of welding materials, the following are distinguished: stick electrodes, solid wires, flux-cored wires, and SAW wires & fluxes [18,19]. Recent publications have shown that flux-cored wire hardfacing is a promising technology [20,21,22,23], which is explained by its high process performance, high welding stability, excellent quality of deposited metal, and arc visibility. These advantages are especially important for hardfacing processes using hardening alloys. Depending on the tribological conditions, different alloys are used, such as FeCCrX [24,25], FeCB [26,27,28,29], FeCMn [30], and others. High-manganese alloys of the FeCMn type with a high manganese and carbon content have been most widely used for impact abrasive wear and contact fatigue in high-stress rolling [31,32,33]. These steels are characterized by high impact strength and the ability to harden [34]. Hadfield steel has good work hardening capacity, high strength and toughness after hardening, and it has been widely used in industrial applications. However, the presence of non-metallic inclusions significantly affects its wear behavior. This study investigates the role of these inclusions in the abrasive wear process of Hadfield steel by examining their formation, distribution, and impact on mechanical properties. The results suggest that non-metallic inclusions act as stress concentrators, promoting crack initiation and propagation, thereby accelerating material removal under abrasive conditions. However, non-metallic inclusions such as oxides, sulfides, and nitrides can degrade its performance by serving as initiation points for microcracks and reducing overall toughness. Thus, it is important to improve the quality of the deposited metal. The appearance of non-metallic inclusions in the deposited metal during the flux-cored wire hardfacing is mainly due to the melting nature of the flux-cored wire. Flux-cored wire consists of an inner flux and an outer metal sheath. According to Trembach et al [35] the formation of the non-metallic inclusions (NMIs) occurs as follows: at the melting of the electrode, a protrusion of filler is formed at its end near the arc column. The formation of the protrusion is explained by the non-uniformity of melting of the metal sheath and the filler in the flux-cored wire. That is explained by the predominant heating of the metal sheath by Joule heat (welding current flowing through the electrode), due to the significantly higher electrical conductivity of the metal sheath [35]. The second reason is the cathode spot relocations of the arc column around the perimeter of the end of the metal sheath [36]. In this case, the melting of the filler material from the arc heat is realized by radiation of the arc column and to a lesser extent by convectiveheat. These features contribute to the preferential melting of the metal sheath, which is the main reason for the uneven melting of the filler and the metal sheath. The formed protrusion can subsequently collapse, and in the unmelted state and enter the weld pool [35].
It is well known that there are three modes of transferring the metal droplet to the molten pool: spray, globular and short circuit [37]. For hardfacing processes, when the chemical composition of the deposited metal is important, which is always more alloyed than substrate materials, the last two modes are preferable. In spray and globular modes of the molten droplets transfer, the arc continues burning throughout the molten droplet transfer process, providing high heat input, which increases the fraction of the substrate material. Whilein the short circuit transfer mode, the molten droplet transfer occurs when the droplet at the wire tip comes into contact with the weld pool under conditions of low current and voltage, causing the arc to extinguish. This results in relatively low heat input [37], which is beneficial for hardfacing processes. When the welding arc between the wire tip and the weld pool extinguishes, a short circuit occurs, which causes the arc voltage to drop below ∼10 V, which can be used to evaluate the occurrence of a short-circuit procedure [38]. However, this reduces the deposition rate, because it is achieved at lower values of the welding current.
To improve the uniformity of melting of the flux cored wire and to increase the productivity of the hardfacing process, the introduction of exothermic addition into the filler for flux cored wires is accepted [39,40,41,42,43]. The positive effect of introducing the exothermic addition into the filler is explained by the generation of additional heat capable of melting the filler components [44]. Various exothermic additive systems are used, which are different combinations of oxidizing agents (such as Fe2O3, CuO, Mn2Oetc) and reducing agents (Al, Mg etc). However, these exothermic mixtures have different characteristics of reaction kinetics, among the important ones for filler materials are: ignition temperature, reaction rate, thermal effect of the exothermic reaction, specific heat of combustion.
The studies by Li et al [45] showed a positive effect of the exothermic mixture on the stability of the process, the droplets became smaller and the transfer time became less with increasing the exothermic addition. The decrease in the droplet diameter of theelectrode material is mainly due to a decrease in surface tension [45]. Trembach et al [46] noted that, depending on the hardfacing modes, the exothermic reaction in the filler can occur at different stages of the welding process: (1) in the electrode extension section (2) in the arc column and (3) in the weld pool. Moreover, from the point of view of achieving a greater effect from the introduction of an exothermic addition, the reaction at stage (1) is the most desirable. In accordance with their recommendations, it is necessary to choose such hardfacing parameters at which the exothermic mixture reacts at the electrode melting stage (in the electrode extension section) before the arc. At the same time, high arc stability and low dilution of the deposited metal with the substrate materials are achieved, while maintaining high productivity and efficiency of the hardfacing process [46]. Whereas, the exothermic reaction at the weld pool stage will increase the penetration depth and increase the dilution of the deposited metal by the substrate material [47], which is undesirable for the hardfacing process. Furthermore, studies by Trembach et al have shown a positive effect of adding the exothermic addition to the filler on the welding current [46] and the morphology of the welding bead [48], which changes the parameters of the welding thermal cycle [49,50]. Changes in the welding thermal cycle parameters will affect the microstructure, which will affect the performance indicators such as wear resistance and corrosion resistance through the impact on the microstructure and mechanical properties.
The aim of this work is to determine the influence of hardfacing modes on such parameters as hardfacing thermal cycle parameters, microstructure, grain size, hardness and content and morphology of non-metallic inclusions of the deposited metal using a self-shielded flux-cored wire with high-energy exothermic addition of MnO2-Al.
2. Materials and Methods
2.1. Materials
For the hardfacing process, flux-cored wires with filler compo[49,50sitions as shown in Table 1 were used. A metal strip made of St 24 DIN 1614.1 steel (20 mm in width and 0.5 mm in thickness) was used, which was formed into a metal wire sheath about the core filler. The self-shielded flux-cored wire was made according to the procedure described in [35].
The chemical composition of the deposited metal samples was analyzed using a Spectrolab LAVFC01A optical emission spectrometer. The typical content of the elements in the deposited metal is as follows: 1.36 wt% C; 9.3 wt% Mn; 2.8 wt% Cr; 0.76 wt% Ti; 0.72 wt% Si; 0.046 wt% N; 0.02 wt% S and 0.058 wt% P.
2.1. Design Experiment
When searching for models of mathematical dependencies, the most important task is the choice of variables. Having too many variables (with respect to the number of observation/data set) in a model will result in a relation between variables and the outcome that only exists in that particular data set [51]. Some variables also may have a negligible effect on outcome and can therefore be excluded. In this case, a preliminary review of possible variables will be mandatory, which in the future, after screening, will be used to search for a mathematical model. Therefore, we recommend that at the first stage of searching for a prediction model, the most significant parameters from a series of candidate variables are determined. Taguchi is another method suitable to the optimization of welding processes that can be used in the design of high quality system without increasing costs, allowing to under-standing the effect of individual and combined process parameters from reduced experimental test. For the Taguchi method, orthogonal arrays have been used. An analysis of variance (ANOVA) is used in parallel with the Taguchi method. Analysis of variance (ANOVA) allows us to determine the contribution of each factor to the responses, which allows us to identify the most significant variables [52]. Factorial design is used for conducting experiments as it allows study of interactions between factors. Reliable mathematical models of the variables of interest can be developed with a minimum number of experiments by combining Taguta's method with factorial design. [53].
The Taguchi method was then used to obtain the welding combinations that are shown in Table 2. The variable parameters of the hardfacing modes, i.e., hardfacing speed (x1), set voltage of the power source (x2), contact tip to work distance (x3), and wire feed speed (x4) were optimized using the Box-Behnken experimental design and STATISTICA software (Statsoft Inc., 2006). The experimental design contained four process variables, each at three equidistant levels (-1, 0, 1).
The matrix of the experiment plan is shown in Table 3. The three different processing variables combined with each of the three levels led to an L9 orthogonal matrix.
The full cubic model is represented in Equation (8):
where y— the predicted response variable; iand j are the number of ingredients in the mixture;K—components given by the equation; βi—expected response at the top; βij—coefficients indicate the amount of quadratic curvature along the edge of the simplex region consisting of binary mixtures of xi and xj; andδij—account for ternary blending among three separate components in the interior of the design. βijk— the coefficient of the regression coefficient of the product terms of two or three variables. xi, xj, and xk represent three different design variables.
2.4. Welding Thermal Cycle Parameters
During the hardfacing process the deposited metal experiences metallurgical effects caused by the thermal cycle of welding. To evaluate this effect, such indicators as heat input Qin, heat input rate (Qr), cooling rate (CR800-500) and cooling time (Δt8/5) [48,50].
Heat input (Qin) is the quantity of energy introduced from the arc per unit length of weld. The heat input was calculated by the means Eq. 2 [52]
where Qin—heat input, (kJ/mm); Ua—arc voltage, V; I—arc current, A; TS—travel speed, mm/min; H—coefficient of efficiency of the process; ηFCAW = 0.8.
The cooling rate has been calculated between 800 °C and 500 °C (CR800-500), as this temperature range is significant for the relevant phase transformations that take place in ferrous alloys and can be calculated using the following equation [48].
where ΔT800-500 was the temperature variation within the selected range of 800 and 500 °C.
The cooling time Δt800-500 between two given temperatures, commonly between 800 and 500 C, for sheets with three-dimensional heat flow, can be calculated by the following equation 4 [48].
where E is welding energy (kJ·cm-1), kis material thermal conductivity λ=42 J/(s·m·C) [45], and T0is the initial temperature of the plate T0=25 °C.
3. Results
3.1. Prediction of Mathematic Model for Thermal Cycle Parameters
Table 8 showed the experimental values of thermal cycle parameters. Table 7 showed the experimental and calculated (obtained from the equations of the mathematical model) values of the thermal cycle of hardfacing HI, cooling time in the temperature range of 800-500 °C Δt8/5, cooling rate CR of the deposited metal in the temperature range of 800-500 °C, and the calculated value of hardness HB obtained by hardfacing with the developed SFCW with exothermic addition (EA) of MnO2-Al in the filler material.
Table 8 presents the regression coefficients for each response.
The statistical characteristics of the obtained mathematical models indicate their reliability and adequacy. The developed mathematical models are considered adequate (the obtained Fisher's criterion exceeds the table valueFact > 3 [81]). The regression model of the thermal cycle parameters has the following form:
3.1.1 Analyses of ANOVA for Thermal Cycle Parameters
Figure 1 showed the effect of the parameters of the hardfacing modes on the heat input HI, cooling time in the temperature range of 800-500 °C Δt8/5, and cooling rate CR of the deposited metal in the temperature range of 800-500 °C.
Based on the above pie chart, it could be concluded that the main contribution to the parameters of the welding thermal cycle was made by the travel speed TS. A minor influence was exerted by the set voltage of the power source . The influence of other parameters of the hardfacing modes on the welding thermal cycle parameters was at the level of noise.
3.1.2. AnalysesTaguchi for Thermal Cycle Parameters
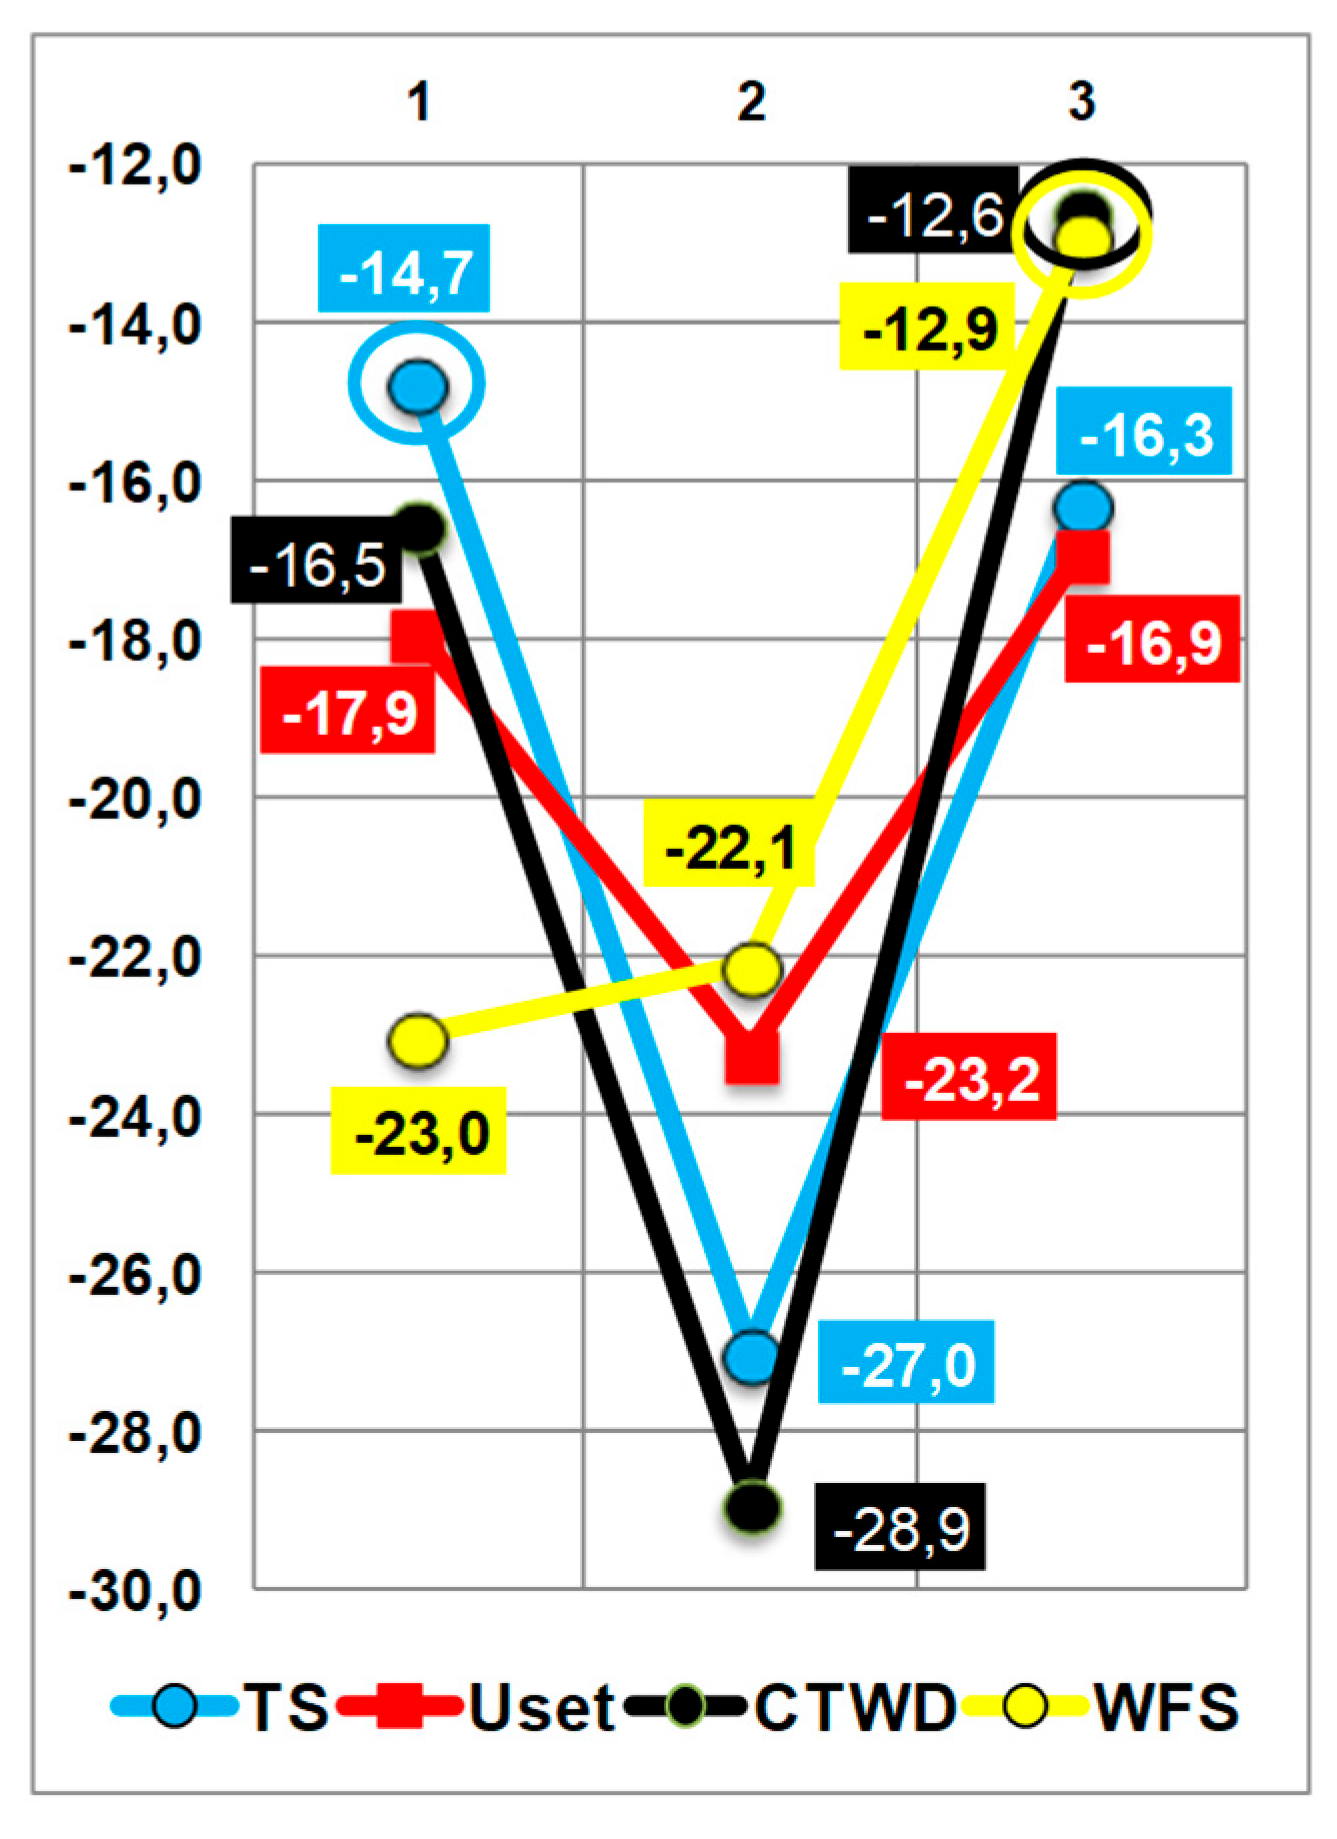
For the preliminary optimization of hardfacing modes, we conducted studies, and Figure 2 showed the experimental results of the calculated S/N ratios for the heat input using the Taguchi method.
Figure 2 (a) showed that the lowest value of heat input HI and cooling time Δt8/5 in the temperature range of 800-500 °C was achieved at a low level of travel speed TS=0.27m-min-1. The lower the value of heat input HI and the cooling time in the temperaturerange of 800-500 °C Δt8/5, the lower the level of overheating and, accordingly, the higher the technological properties of the deposited metal. Therefore, when selecting the optimal hardfacing parameters, it is of particular importance to ensure a low heat input and a high cooling rate in the temperature range of 800-500 °C Δt8/5.
Analyzing the diagrams of S/N ratios for the thermal cycle parameters of hardfacing (HI and Δt8/5), the optimal hardfacing modes could be noted: travel speed TS=0.27m-min-1, set voltage on the power source Uset=32.5V, contact tip to work distance CTWD=30mm and WFS=1.527mm-min-1.
3.1.3. Development of Mathematics Model (Box-Hunter) for Thermal Cycle Parameters
The equation of mathematical dependence of the indicators was shown below 5-7.
The statistical significance and degree of influence of each of the factors on the dependent variables were represented by Pareto charts in Figure 3 (a), (b), (c), and graphs of the observed and predicted values of the influence of each factor on the dependent variables to assess the quality of the constructed mathematical models were shown in Figure 4 (a), (b), (c), respectively.
The analysis of Pareto charts showed that the two terms of the mathematical model equation (TS and Uset) had the greatest impact on all indicators of the hardfacing thermal cycle. At the same time, the main factor was the travel speed. Analysis of Figure 4 (a), (b), (c) showed a fairly high accuracy of the predicted values for all the constructed mathematical models.
Figure 5 showed the response surfaces of the mathematical model of the dependence of the hardfacing thermal cycle parameters on the parameters of the hardfacing modes.
The analysis of Figure 4 showed the dependence of the hardfacing thermal cycle parameters on the travel speed TS and, to a lesser extent, the set voltage on the power source Uset, which affected the cooling rate of the deposited metal. If the heat input HI and the cooling rate in the temperature range of 800-500 °C Δt8/5 reached their lowest values at a high level of TS=0.69m-min-1 and regardless of the Uset level, the cooling rate CR increased with the increase in the level of travel speed TS.
3.2. Microstructure of the Deposited Metal
Figure 5 showed the microstructures of the deposited metal using SFCW with EA in the filler, obtained by hardfacing at the conditions specified in Table 3.
Figure 5 (a) showed a microstructure with pronounced traces of primary crystallization, represented by alloy-depleted austenite and highly dispersed precipitates of a secondary phase. First of all, in the form of titanium nitrides TiN. A similar structure was shown in Figure 5 (b) and Figure 5 (c). However, in these cases, a deeper transformation of the dendrites was observed with a corresponding decrease in the boundary development and an increase in equilibrium from the thermodynamic point of view.
A significant change in morphology was observed in the structure of sample Exp. 4 (Figure 5 (d)). The dendritic structure could be traced, but it was highly fragmented. The matrix was an austenite saturated with alloying elements with very dispersed precipitates at the crystallite boundaries (degenerate interdendritic space) where the residual alloying elements and impurities were segregated.
The microstructure of Figure 5 (e) was an acicular troostite and austenite with higher mechanical characteristics than the previous ones. The microstructure of Figure 5 (f) had an even higher set of micromechanical characteristics, as it consisted of fine acicular martensite and soft austenite. The microstructure of Figure 5 (g) had a complex composition and included pearlite, austenite, and carbide inclusions with a developed interfacial surface. The microstructure of Figure 5 (h) consisted of matrix austenite and sparse, coarse martensite needles.
The only microstructure with decomposition products of austenite (eutectoid) was the microstructure in Figure 5 (i). It also showed a large number of non-metallic inclusions.
3.3. Grain Size of Deposited Metal
Figure 6 showed photos of the microstructure of the deposited metal made at the modes specified in Table 3 and the grain size indication.
Figure 7 illustrated histograms of the distribution of grain size in the deposited metal by their nominal size.
Table 4 showed the data on grain morphology in the deposited metal.
Table 5 presented the experimental and calculated values (obtained from the mathematical model equations) of grain size (GS), resulting from hardfacing with the developed self-shielded flux-cored wire (SFCW) containing an exothermic addition (EA) of MnO₂–Al in the filler.
Table 5 presented the experimental and calculated values (obtained from the mathematical model equations) of grain size (GS), resulting from hardfacing with the developed self-shielded flux-cored wire (SFCW) containing an exothermic addition (EA) of MnO₂–Al in the filler.
3.4.1. Analyses of ANOVA Forgrain Size
Figure 6 showed the effect of hardfacing parameters on grain size.
The analysis of the pie chart data showed that the grain size GS of the deposited metal was significantly influenced by the contact tip to work distance CTWD (contribution of 45.35%). The travel speed and wire feed speed had a lesser impact. Their contribution was 27.82% and 19.63%, respectively. The influence of such a parameter as the set voltage on the power source was significantly small, so it was not taken into account when building mathematical models.
3.4.2. Analyses Taguchi for Grain Size
Figure 7 showed the experimental results of the calculated S/N ratios for grain size using the Taguchi method.
Figure 7.
Diagram of main effects for the S/N ratio for grain size characteristics GS.
Analyzing the diagram of the S/N ratio for the grain size indicator, it could be noted that the optimal hardfacing in terms of obtaining the minimum grain size in the hardfacing should be performed at the maximum contact tip to work distance CTWD=50 mm, high travel speed at low or high values (TS=0.27m·min-1 or TS=0.69m·min-1) and wire feed speed at a high level (WFS=2.73m·min-1).
3.4.3. Development of Mathematics Model (Box-Hunter) for Grain Size
The equation of the obtained regression model for grain size is provided in Equation (8):
The statistical significance and the degree of influence of each factor on the dependent variables were presented by the Pareto chart in Figure 8 (a). To evaluate the quality of the constructed mathematical model, a graph of the observed and predicted values of the influence of each factor on the dependent variables was obtained, which was shown in Figure 8(b).
The analysis of the Pareto chart in Figure 8 (a) showed that the significant parameters of the hardfacing mode in terms of their influence on the GS grain size are the contact tip to work distance CTWD and the wire feed speed WFS. The analysis of Figure 8 (b) showed the high accuracy of the predicted values for the constructed mathematical model.
Figure 9 shows the response surfaces of the mathematical models of the dependence of grain size on hardfacing modes.
The effect of hardfacing modes on grain size showed an excellent result depending on the combination of parameters. An increase in both mode parameters, both the travel speed in combination with the contact tip to work distance Figure 9 (a1), as well as the travel speed and wire feed rate Figure 9 (a3), led to a decrease in the grain size of the deposited metal. This could be explained by the fact that in the heat input calculation formula, the travel speed appeared in the denominator. A different pattern of influence on grain size was observed for the combination of contact tip to work distance and wire feed speed, as shown in Figure 9 (a2): the grain size tended to decrease with increasing contact tip to work distance and decreasing wire feed speed, which was directly proportional to the welding current and appeared in the numerator of the heat input formula.
3.5. Non-Metallic Inclusions
Figure 10 showed the macrostructures of non-metallic inclusions in the deposited metal.
Table 6 showed the size parameters of non-metallic inclusions in the deposited metal.
3.5.1. Analyses of ANOVA for Non-Metallic Inclusions NMI
Table 7 showed the size of non-metallic inclusions in the deposited metal.
Figure 11 showed the effect of the hardfacing modes parameters (travel speed, set voltage on the power source, contact tip to work distance, and wire feed speed) on the characteristics of non-metallic inclusions: NNMInumber, SNMIaverage area, maximum length of LLNMI, and average length of LNMI.
Studying the pie charts allowed us to conclude that the dominant parameter influencing the value of the number of non-metallic inclusions NNMI in the deposited metal was the travel speed TS (contribution of 75.8%). The set arc voltage had a much smaller effect on the number of NNMI (contribution of 16.4%). Other mode parameters did not affect the NNMI parameter.
The average SNMIarea and the average LNMIlength of non-metallic inclusions depended on the value of the wire feed speed (contributions of 43.2% for each parameter), as well as the set arc voltage (contributions of 52.4% and 32.6%, respectively). The averageLNMIlength was slightly influenced by the CTWD contact tip to work distance (contribution of 13.8%), while the TS travel speed had no effect. There was no effect of CTWD and TS on the average SNMIarea.
3.5.2. Analyses Taguchi for Non-Metallic Inclusions
For preliminary optimization of hardfacing modes, a study was performed, the results of which were presented in Figure 12, which showed the calculation of the S/N ratio for the NMI indicators using the Taguchi method. For preliminary optimization of hardfacing modes, a study was performed, the results of which were shown in Figure 12, showed the calculation of the S/N ratio for the NMI indicators using the Taguchi method.
Figure 12 (a) showed that the lowest number, maximum and average length of non-metallic inclusions could be obtained at the travel speed TS at medium and high levels (TS=2.07m-min-1 and TS=2.73m-min-1), as well as at the set arc voltage at the second level (Uset=29.2V). The smallest area of non-metallic inclusions was provided when hardfacing at the minimum levels of the set arc voltage (Uset=26.0V) and wire feed speed (WFS=1.50m-min-1).
The analysis of the diagrams of the main effects of the S/N ratio (see Figure 12) showed that in terms of obtaining the minimum values of the number of NNMI, the area of SNMIand the length (LLNMI іLNMI) of non-metallic inclusions, the optimal hardfacing modes would be the following: travel speed TS = 0.47 m-min-1, set voltage on the power source Uset= 29.2V, contact tip to work distance CTWD = 30 mm and WFS = 1.50 mm-min-1.
3.5.3. Development of Mathematics Model (Box-Hunter) for Non-Metallic Inclusions NMI
The developed mathematical models of non-metallic inclusion characteristics are presented in Eq. 9-12.
The statistical significance and the degree of influence of each factor on the dependent variables were represented by Pareto charts in Figure 13.
Consideration of the obtained Pareto charts made it possible to conclude that the main significant hardfacing modes were the travel speed TS, the set arc voltage Uset, and the wire feed speed WFS. The analysis of Figure 13 of the graphs of the observed and predicted values of the dependent variable showed high accuracy for all the constructed mathematical models.
Figure 14 showed the 3D response surfaces of the developed mathematical models.
As shown in Figure 11 (a) and Figure 14(a), the total number of NMIs would be affected by the travel speed. This could be explained by the lifetime of the weld pool. The higher the travel speed, the lower the heat input, and thus the weld pool lifetime. The size of the latter was also determined by the volume of molten electrode metal, which was determined by the wire feed speed. Whereas the size of the NMIs was influenced by such welding parameters as the set voltage on the power source and the wire feed speed.
3.6. Mechanical Properties
Table 7 showed the experimental and calculated (obtained from the equations of the mathematical model) values of HRA hardness measured after hardfacing with the developed FCAW-SS with exothermic addition (EA) of MnO2-Al in the filler.

Table 7.
Experimental (e) and calculated (c) values of HRA hardness.
| № | N Speciment | Fillermaterial | Hardness | |||
| HRA (e) | HRA (c) | Diff. | Dev. | |||
| 1 | Р5-Е1-1 | Р5-Е1-1 | 62,00 | 60,04 | 1,96 | 0,03 |
| 2 | Р5-Е1-2 | Р5-Е1-2 | 61,00 | 63,25 | -2,25 | -0,04 |
| 3 | Р5-Е1-3 | Р5-Е1-3 | 58,00 | 57,72 | 0,28 | 0,01 |
| 4 | Р5-Е1-4 | Р5-Е1-4 | 69,00 | 67,55 | 1,45 | 0,02 |
| 5 | Р5-Е1-5 | Р5-Е1-5 | 69,00 | 69,56 | -0,56 | -0,01 |
| 6 | Р5-Е1-6 | Р5-Е1-6 | 72,00 | 72,89 | -0,89 | -0,01 |
| 7 | Р5-Е1-7 | Р5-Е1-7 | 79,00 | 75,86 | 3,14 | 0,04 |
| 8 | Р5-Е1-8 | Р5-Е1-8 | 69,00 | 70,73 | -1,73 | -0,03 |
| 9 | Р5-Е1-9 | Р5-Е1-9 | 71,00 | 72,40 | -1,40 | -0,02 |
The analysis showed that the samples had the highest hardness
3.4.1. Analyses of ANOVA and Taguchi forHardness
Figure 15 showed the contribution of each of the hardfacing mode parameters to the hardness and S/N ratio at each level,
Figure 14.
Pie chart of the influence of hardfacing modes on Hardness (a) and the main effects diagram for the S/N ratio for Hardness (b).
Figure 14.
Pie chart of the influence of hardfacing modes on Hardness (a) and the main effects diagram for the S/N ratio for Hardness (b).
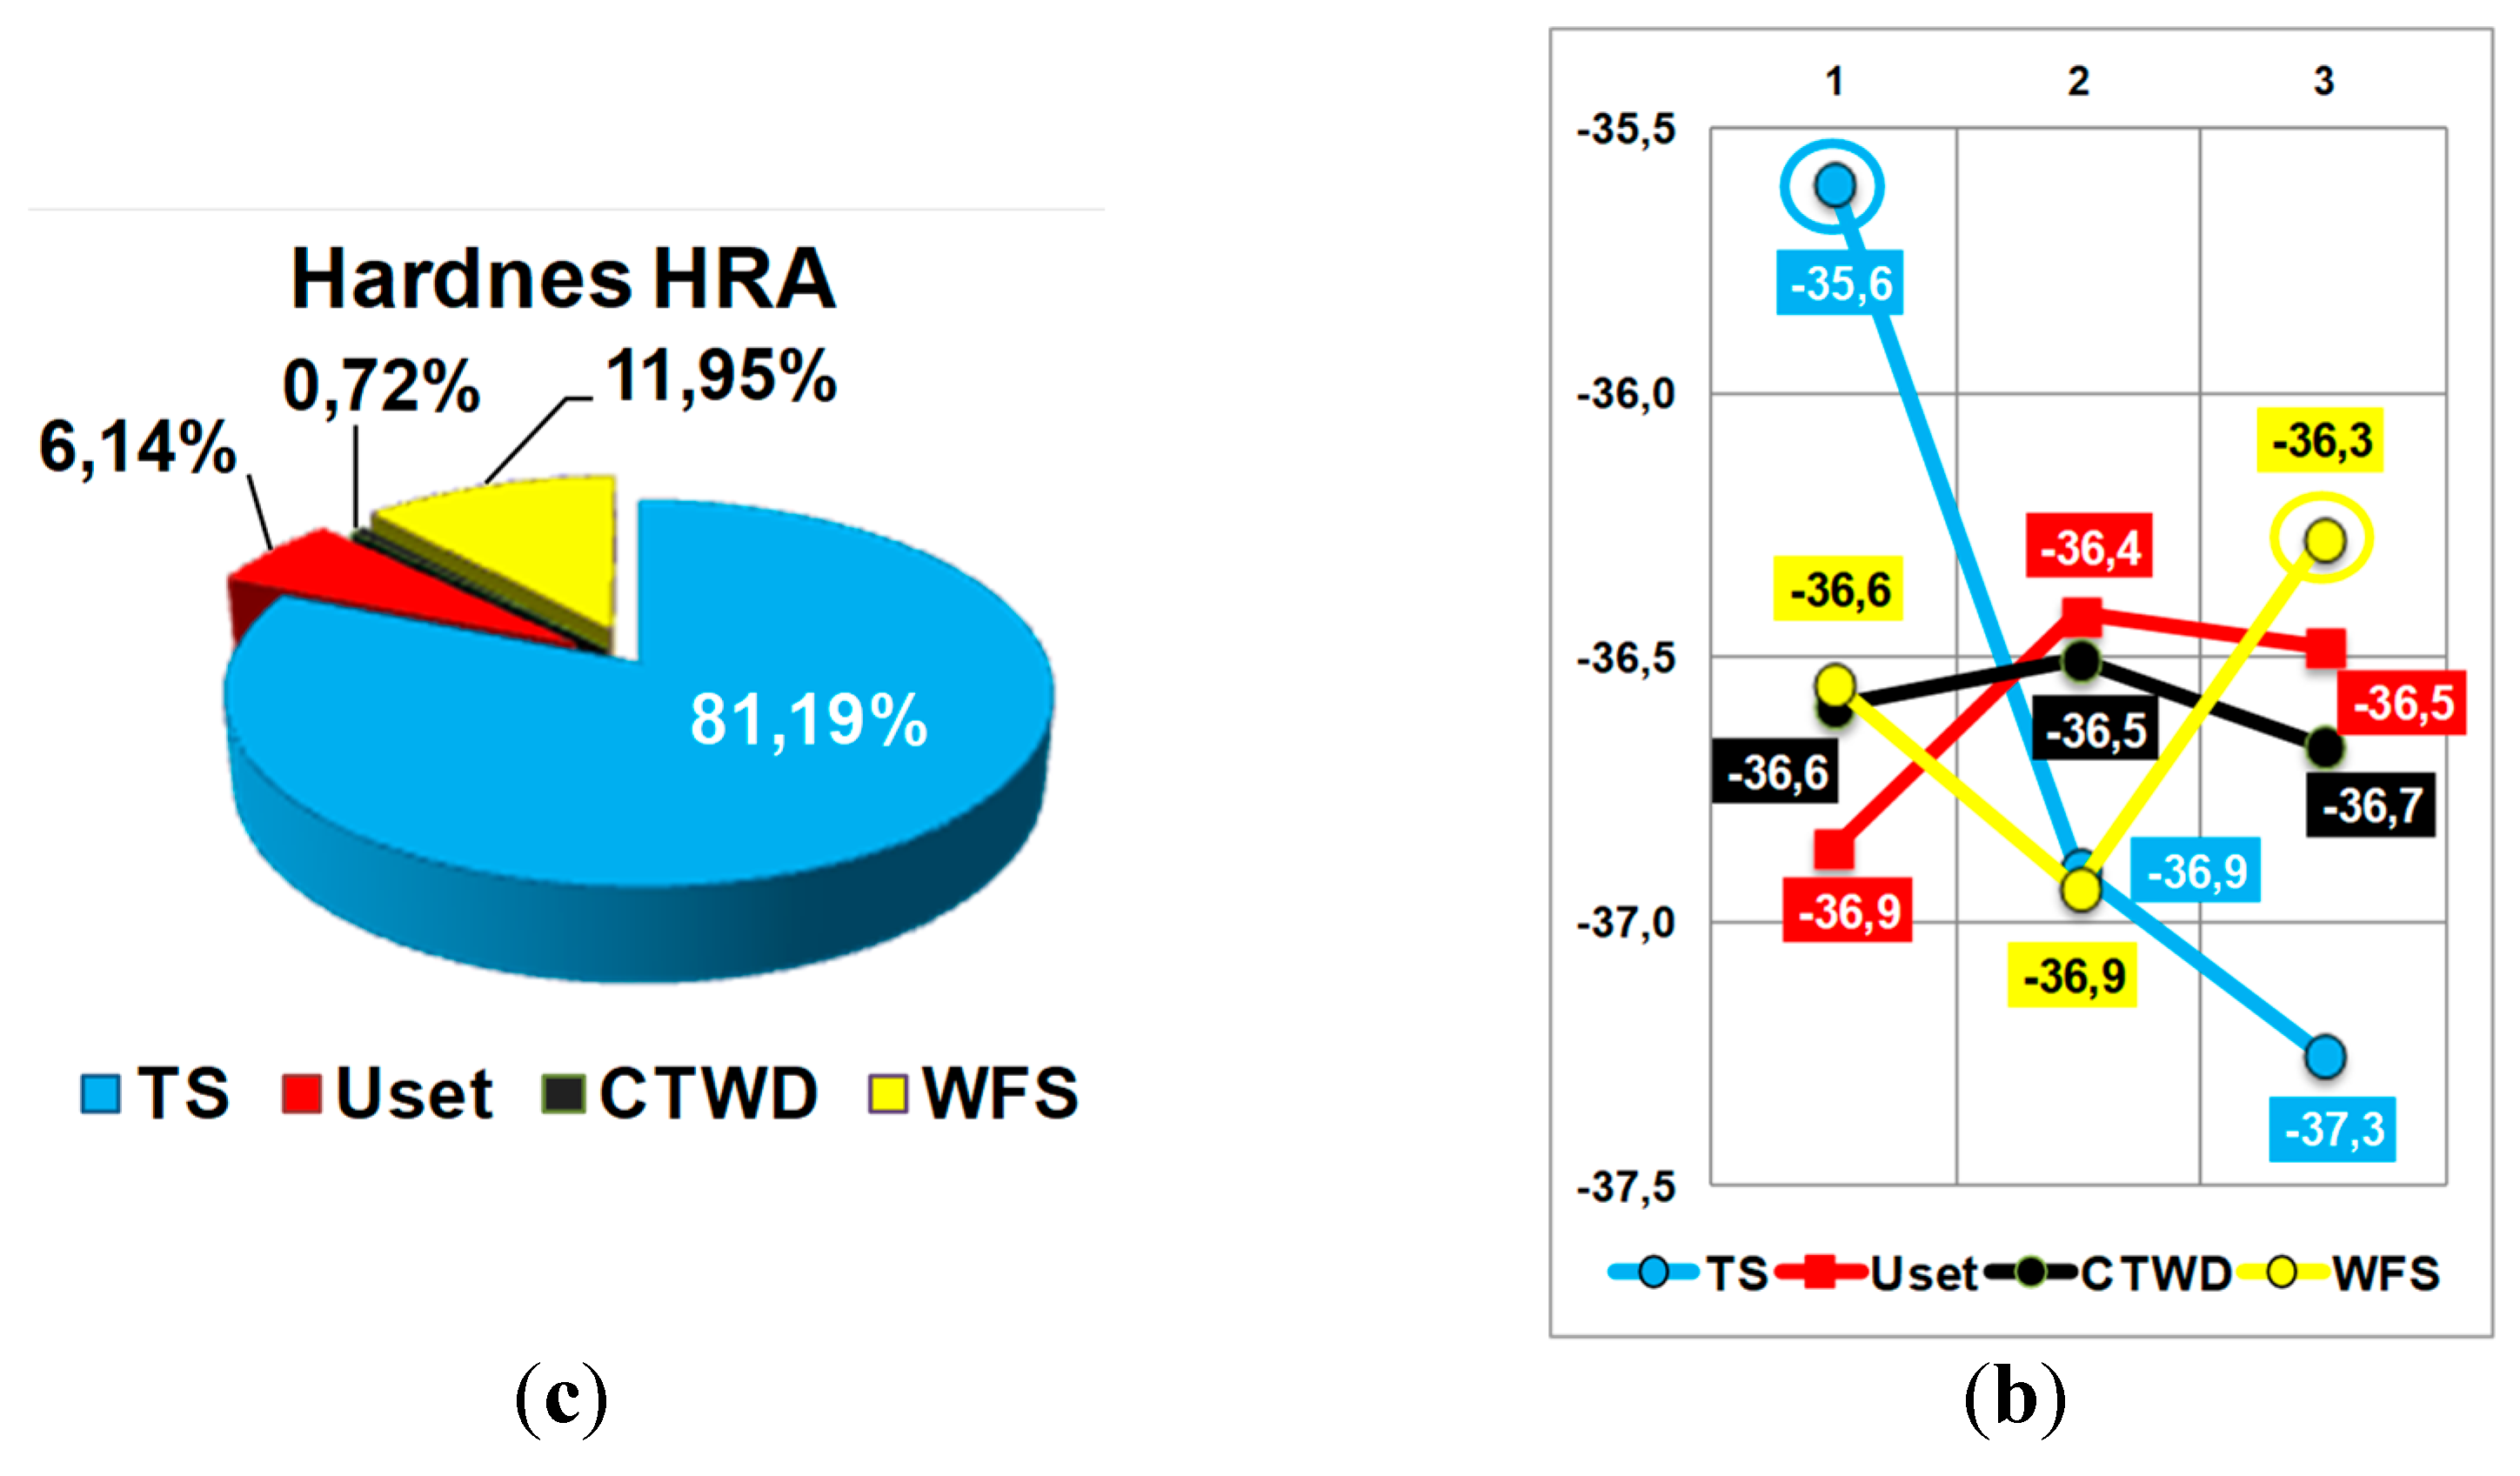
According to Figure 15 (a), the main influence on hardness was exerted by the travel speed (contribution was 81.19%). The wire feed speed (WFS) also had an effect. The effect of other mode parameters was not significant, so their influence could be neglected.
Analysis of the graph in Figure 15 (b) showed that the optimum conditions for obtaining the lowest hardness of the high manganese alloy inherent in the austenitic matrix would be achieved at a low travel speed (TS) (TS=0.27m-min-1) and at high wire feed speed (WFS=2.73m-min-1).
3.4.3. Development of Mathematics Model (Box-Hunter) for Hardness
The equation of the obtained regression model for hardnes is provided in Equation (13):
The statistical significance and the degree of influence of each factor on Hardness was represented by the Pareto chart in Figure 16 (a). To evaluate the quality of the constructed mathematical model, a graph of the observed and predicted values of the influence of each factor on hardness was plotted in Figure 16 (b).
The analysis of the Pareto chart of Figure 16 (a) showed that in terms of the influence of hardfacing modes on the HRA hardness value, the most significant were the TS travel speed and the WFS wire feed speed. This was confirmed by the results of the ANOVA analysis. The developed mathematical model Figure 16 (b) showed a high accuracy of the predicted values.
Figure 17 showed the response surface of the mathematical model of the dependence of the hardness of the deposited metal on the hardfacing modes.
It is known that the austenitic phase in high manganese steels corresponds to a hardness of 190-220 HB (56-64 HRA) [54]. The 3D surface of the hardness dependence on the significant parameters of the hardfacing mode for the developed mathematical model showed that the desired level of mechanical properties would correspond to a travel speed at a low level TS≤0.4 m·min-1.
4. Discussion
Our studies have shown a significant effect of welding modes on the microstructure of the deposited metal and its mechanical properties, made by flux-cored wire with a high-energy exothermic MnO2-Aladdition under different hardfacing modes.
It should be noted that for the considered ranges of changes in the parameters of the hardfacing modes, the greatest influence on the microstructure and mechanical properties was exerted by the travel speed TS and wire feed speed WFS. At the same time, the quality of the deposited metal, characterized by the content and morphology of non-metallic inclusions, was most affected by such parameters of the hardfacing modes as wire feed speed and arc voltage. The amount of NMIs was most affected by the travel speed, which could be explained by the rapid solidification of the weld pool. As a result, the NMIs did not have time to float up and transfer into weld slag.
The main reason for the reduction in grain size was the decreased lifetime of the molten weld pool, which was primarily influenced by the travel speed TS and wire feed speed WFS. These parameters of the hardfacing mode affected the cooling rate and the weld pool lifetime. This ultimately affected the degree of removal of small-sized non-metallic inclusions. Small-sized non-metallic inclusions served as centers of crystallization and refined grains. These inclusions lowered the energy barrier for crystal formation and acted as focal points around which metal atoms arranged themselves into a crystalline lattice. Thus, the hardfacing modes directly influenced the size and cooling rate of the weld pool and the amount of small-sized NMIs. The study by Wang et al [55] showed that the total number of NMIs and their size were affected by the presence of an exothermic mixture. The main effect was an increase in their total number and average size. While the study by Trembach et al [35] demonstrated that the presence of an exothermic addition in the filler increased the number of non-metallic inclusions in the deposited metal and reduced their size.
In addition, in some hardfacing modes, there were cases when the exothermic reaction took place at the weld pool stage. This resulted in the ingress of the exothermic addition components (namely MnO2 and Al) in their original form into the molten weld pool.
The results showed that lower travel speeds corresponded to higher hardness values. This was due to the lower cooling rate and, accordingly, the formation of harder structural components than primary austenite. This tendency was typical for high manganese, high carbon alloys such as Hadfield steel. This corresponded to a high level of travel speed and wire feed speed.
Further studies will be conducted to investigate the effect of hardfacing modes on the tribological properties of the deposited metal.
5. Conclusions
At present, there is great experience in analyzing and using parameters for research and comparison of arc burning stability in the fusion arc welding process. As parameters characterizing arc stability, both graphical (current and voltage cyclograms, box plots with frequency histograms) and statistical parameters such as standard variation and coefficients of variation for welding current and arc voltage have been used. In this paper, an experimental study of the influence of the introduction of exothermic addition (CuO-Al) into the core filler of a self-shielded, flux-cored wire electrode on the average of the welding current and arc voltage as well as arc stability, was carried out, with conclusions as follows:
1. It has been determined that the introduction of exothermic addition components into the core filler will have a significant effect on the stability of the flux-cored arc welding process. This can be attributed to changes in the chemical composition of the arc column, resulting from enrichment, depending on the composition of the core filler, with easily ionizable elements or compounds (such as Cu) or with less readily ionizable compounds (such as Al2O3);
2. The results of research
Author Contributions
Conceptualization, I.T. and B.T.; methodology, I.T.; validation, I.T., Ol.B. and Y.M.; formal analysis, A.G. and B.T.; investigation, I.T. and S.K.; resources, I.T.; data curation, I.T., B.T. and O.B., ; writing—original draft preparation, B.T. and I.T. ; writing—review and editing, I.T., Y.M., and O.V.; visualization, I.T., B.T., S.K. and A.P.; supervision, A.G.; project administration, B.T. and N.M.. All authors have read and agreed to the published version of the manuscript
Funding
This research received no external funding.
Institutional Review Board Statement
Not applicable.
Informed Consent Statement
Written informed consent has been obtained from the patient(s) to publish this paper.
Data Availability Statement
Data are contained within the article.
Acknowledgments
In this section, you can acknowledge any support given which is not covered by the author contribution or funding sections. This may include administrative and technical support, or donations in kind (e.g., materials used for experiments).
Conflicts of Interest
The authors declare no conflicts of interest.
References
- Çevik, B.; Şahin, Ö.; Gülenç, B. Flux cored arc welding on 30MnB5 steels used in agricultural mechanisation: microstructure evolutions and mechanical properties. Sādhanā. 2021, 46, 155. [Google Scholar] [CrossRef]
- Dilay, Y.; Guney, B.; Ozkan, A.; Oz, A. Microstructure and wear properties of WC-10Co-4Cr coating to cultivator blades by DJ-HVOF. Emerging Materials Research. 2021, 10, 278–288. [Google Scholar] [CrossRef]
- Ulbrich, D.; Stachowiak, A.; Kowalczyk, J.; Wieczorek, D.; Matysiak, W. Tribocorrosion and Abrasive Wear Test of 22MnCrB5 Hot-Formed Steel. Materials. 2022, 15, 3892. [Google Scholar] [CrossRef] [PubMed]
- Viňáš, J.; Brezinová, J.; Brezina, J.; Maruschak, P.O. Structural and Mechanical Features of Laser-Welded Joints of Zinc-Coated Advanced Steel Sheets. Mater Sci. 2019, 55, 46–51. [Google Scholar] [CrossRef]
- Ulbrich, D.; Kowalczyk, J.; Jósko, M.; Sawczuk, W.; Chudyk, P. Assessment of Selected Properties of Varnish Coating of Motor Vehicles. Coatings 2021, 11, 1320. [Google Scholar] [CrossRef]
- Ulbrich, D.; Psuj, G.; Bartkowski, D.; Bartkowska, A. Assessment of Coating Properties in Car Body by Ultrasonic Method. Appl. Sci. 2024, 14, 8117. [Google Scholar] [CrossRef]
- Spišák, E.; Kaščák, Ľ.; Viňáš, J. Research into properties of joints of combined materials made by resistance spot welding. Chemickélisty. 2011, 105, 488–490. [Google Scholar]
- Riabov, I.; Goolak, S.; Neduzha, L. An Estimation of the Energy Savings of a Mainline Diesel Locomotive Equipped with an Energy Storage Device. Vehicles. 2024, 6, 611–631. [Google Scholar] [CrossRef]
- Zhang, T.; Yang, K.; Zhu, Z.; Xu, L.; Chen, G.; Fang, N.; Kou, S. Effect of Cr and W on microstructure and wear resistance of arc additive manufactured flux-cored wire for railway wheels. Journal of Materials Research and Technology. 2024, 30, 3438–3447. [Google Scholar] [CrossRef]
- Krbata, M.; Kohutiar, M.; Escherova, J.; Klučiar, P.; Studeny, Z.; Trembach, B.; Beronská, N.; Breznická, A.; Timárová, Ľ. Continuous Cooling Transformation of Tool Steels X153CrMoV12 and 100MnCrW4: Analysis of Microstructure and Hardness Changes. Appl. Mech. 2025, 6, 16. [Google Scholar] [CrossRef]
- Cunha, M.C.; Oliveira, H.R.; Oliveira, A.; Souza, M.C.C. Microstructural and wear investigation of FeCrC and FeCrC-NbBhardfacing alloys deposited with FCAW-S. Int J Adv ManufTechnol. 2024, 136, 1241–1251. [Google Scholar] [CrossRef]
- Chabak, Y.G.; Golinskyi, М.A.; Efremenko, V.G.; Halfa, H.; Zurnadzhy, V.I.; Efremenko, B.V.; Tsvetkova, E.V.; Dzherenova, A.V. Ti-rich carboborides in the multi-component high-boron alloy: morphology and elemental distribution. Physics and Chemistry of Solid State. 2023, 24, 707–713. [Google Scholar] [CrossRef]
- Yanchuk, V.; Kruhlov, I.; Zakiev, V.; Lozova, A.; Trembach, B.; Orlov, A.; Voloshko, S. Thermal and Ion Treatment Effect on Nanoscale Thin Films Scratch Resistance. Metallophysics and Advanced Technologies. 2022, 44, 1275–1292. [Google Scholar] [CrossRef]
- Sukhova, O.V.; Polonskyy, V.A. . Structure and corrosion of quasicrystalline cast Al–Co–Ni and Al–Fe–Ni alloys in aqueous NaCl solution. East European Journal of Physics. 2020, 3, 5–10. [Google Scholar] [CrossRef]
- Sukhova, O.V.; Polonskyy, V.A.; Ustinova, K.V. Corrosion resistance of alloys of the Al–Cu–Fe–(Si,B) system in mineralized saline and acid solutions. Materials Science. 2019, 55, 291–298. [Google Scholar] [CrossRef]
- Prysyazhnyuk, P.; Bembenek, M.; Drach, I.; Korzhov, A.; Romanyshyn, L.; Ropyak, L. Restoration of the Impact Crusher Rotor Using FCAW with High-Manganese Steel Reinforced by Complex Carbides. Management Systems in Production Engineering, 2024, 32, 294–302. [Google Scholar] [CrossRef]
- Hlushkova, D.B.; Bagrov, V.A.; Saenko, V.A.; Volchuk, V.M.; Kalinin, A.V.; Kalinina, N.E. Study of wear of the bulding-up zone of martensite-austenitic and secondery hardening steels of the Cr-Mn-Ti system. Problems of Atomic Science and Technology. 2023, 144, 105–109. [Google Scholar] [CrossRef]
- Sharma, L.; Chhibber, R.; Kumar, V.; Khan, W.N. Element transfer investigations on silica based Submerged Arc welding fluxes. Silicon. 2022, 15, 301–319. [Google Scholar] [CrossRef]
- Trembach, B.; Balenko, O.; Davydov, V.; Brechko, V.; Trembach, I.; Kabatskyi, O. Prediction the Melting Characteristics of Self-Shielded Flux Cored arc Welding (FCAW-S) with Exothermic Addition (CuO-Al). IEEE 4th International Conference on Modern Electrical and Energy System (MEES). 2022, 01–06. [Google Scholar] [CrossRef]
- Hadˇzihafizovi´c, D. Flux cored arc welding, Sarajevo. 2022. [Google Scholar]
- Wolski, A.; Świerczyńska, A.; Lentka, G.; Fydrych, D. Storage of high-strength steel flux-cored welding wires in urbanized areas. Int J of Precis Eng Manuf-Green Tech. 2024, 11, 55–70. [Google Scholar] [CrossRef]
- Świerczyńska, A.; Varbai, B.; Pandey, C.; Fydrych, D. Exploring the trends in flux-cored arc welding: Scientometric analysis approach. Int. J. Adv. Manuf. Technol. 2024, 130, 87–110. [Google Scholar] [CrossRef]
- Liu, Q.; Mi, H.; Feng, L.; Guo, W.; He, B. A critical overview of welding and directed energy deposition with flux-cored wires. Journal of Manufacturing Processes. 2025, 142, 231–268. [Google Scholar] [CrossRef]
- Júnior, J.G.F.; Cardoso, A.H.C.; Bracarense, A.Q. Effects of TiC formation in situ by applying titanium chips and other ingredients as a flux of tubular wire. J Braz Soc MechSci Eng. 2020, 42, 375. [Google Scholar] [CrossRef]
- Fagundes, J.G.; Moreno, A.M.; Ribeiro, P.H.; Arias, A.R.; Bracarense, A.Q. Formation of TiC by the application of Ti6Al4V machining chips as flux compounds of tubular wires. Journal of physics. Conference series. 2018, 1126, 012027. [Google Scholar] [CrossRef]
- Lozynskyi, V.; Trembach, B.; Hossain, M.M.; Kabir, M.H.; Silchenko, Y.; Krbata, M.; Sadovyi, K.; Kolomiitse, O.; Ropyak, L. Prediction of phase composition and mechanical properties Fe–Cr–C–B–Ti–Cu hardfacing alloys: modeling and experimental validations. Heliyon. 2024, 10. [Google Scholar] [CrossRef]
- Bembenek, M.; Prysyazhnyuk, P.; Shihab, T.; Machnik, R.; Ivanov, O.; Ropyak, L. Microstructure and Wear Characterization of the Fe-Mo-B-C-Based Hardfacing Alloys Deposited by Flux-Cored Arc Welding. Materials. 2022, 15, 5074. [Google Scholar] [CrossRef]
- Trembach, B.; Grin, A.; Subbotina, V.; Vynar, V.; Knyazev, S.; Zakiev, V.; Kabatskyi, O. Effect of exothermic addition (CuO-Al) on the structure; mechanical properties and abrasive wear resistance of the deposited metal during self-shielded flux-cored arc welding. Tribol. Ind. 2021, 43, 452–464. [Google Scholar] [CrossRef]
- Prysyazhnyuk, P.; Shlapak, L.; Ivanov, O.; Korniy, S.; Lutsak, L.; Burda, M.; Hnatenko, I.; Yurkiv, V. In situ formation of molybdenum borides at hardfacing by arc welding with flux-cored wires containing a reaction mixture of B4C/Mo. Eastern-European Journal of Enterprise Technologies. 2020, 12, 46–51. [Google Scholar] [CrossRef]
- Shihab, S.T.A.; Prysyazhnyuk, P.; Andrusyshyn, R.; Lutsak, L.; Ivanov, O.; Tsap, I. Forming the structure and the properties of electric arc coatings based on high manganese steel alloyed with titanium and niobium carbides. East.-Eur. J. Enterp. Technol. 2020, 1, 38–44. [Google Scholar] [CrossRef]
- Venturelli, B.N.; Albertin, E.; de Azevedo, C.R.F. The Effect of the Austenite Grain Refinement on the Tensile and Impact Properties of Cast Hadfield Steel. Mater. Res. 2018, 21, 1–8. [Google Scholar] [CrossRef]
- Brykov, M.N.; Akrytova, T.O.; Osipov, M.J.; Petryshynets, I.; Puchy, V.; Efremenko, V.G.; Shimizu, K.; Kunert, M.; Hesse, O. Abrasive Wear of High-Carbon Low-Alloyed Austenite Steel: Microhardness, Microstructure and X-ray Characteristics of Worn Surface. Material. 2021, 14, 6159. [Google Scholar] [CrossRef] [PubMed]
- Zurnadzhy, V.I.; Efremenko, V.G.; Brykov, M.N.; Petryshynets, I.; Pastukhova, T.V.; Kussa, R.A. The Metastability of Retained Austenite in Multiphase Steel during Abrasive Wear. J. Frict. Wear. 2020, 41, 119–124. [Google Scholar] [CrossRef]
- Luo, Q.; Zhu, J. Wear property and wear mechanisms of High-manganese austenitic hadfield steel in dry reciprocal sliding. Lubricants. 2022, 10, 37. [Google Scholar] [CrossRef]
- Trembach, B.; Grin, A.; Makarenko, N.; Zharikov, S.; Trembach, I.; Markov, O. Influence of the core filler composition on the recovery of alloying elements during the self-shielded flux-cored arc welding. J. Mater. Res. Technol. 2020, 9, 10520–10528. [Google Scholar] [CrossRef]
- Karimi, M.R.; Wang, S.H.; Jelovica, J. Characterization of cold metal transfer and conventional short-circuit gas metal arc welding processes for depositing tungsten carbide-reinforced metal matrix composite overlays. Int J Adv ManufTechnol. 2023, 128, 2551–2570. [Google Scholar] [CrossRef]
- Kim, C.J.; Seo, B.W.; Son, H.J.; Kim, S.; Kim, D.; Cho, Y.T. Slag inclusion-free flux cored wire arc directed energy deposition process. Materials & Design. 2024, 238, 112669. [Google Scholar] [CrossRef]
- Zhu, Z.; Fan, K.; Liu, H.; Ma, G. Characteristics of short-circuit behaviour and its influencing factors in self-shielded flux-cored arc welding. Science and Technology of Welding and Joining. 2016, 21, 91–98. [Google Scholar] [CrossRef]
- Park, Y.D.; Kang, N.; Malene, S.H.; Olson, L. Effect of exothermic additions on heat generation and arc process efficiency in flux-cored arc welding. Metals MaterInt. 2007, 13, 501–509. [Google Scholar] [CrossRef]
- Zharikov, S.V.; Grin, A.G. Investigation of slags in surfacing with exothermic flux-cored wires. Welding International. 2015, 29, 386–389. [Google Scholar] [CrossRef]
- Vlasov, A.F.; Makarenko, N.A. Special features of heating and melting electrodes with an exothermic mixture in the coating. Welding International. 2016, 30, 717–722. [Google Scholar] [CrossRef]
- Vlasov, A.F.; Makarenko, N.A.; Kushchiy, A.M. Using exothermic mixtures in manual arc welding and electroslag processes. Welding International. 2017, 31, 565–570. [Google Scholar] [CrossRef]
- Li, H.; Hu, C.; Hu, J.; Han, K.; Wang, Z.; Yang, R.; Liu, D. Underwater wet welding of high-strength low-alloy steel using self-shielded flux-cored wire with highly exothermic Al/CuO mixture. J Mater Process Technol. 2024, 328, 118404. [Google Scholar] [CrossRef]
- Allen, J.W.; Olson, D.L.; Frost, R.H. Exothermically assisted shielded metal arc. welding. Weld. J. 1998, 77, 277–285. [Google Scholar]
- Li, H.L.; Liu, D.; Guo, N.; Chena, H.; Dua, Y.P.; Feng, J.C. The effect of alumino-thermic addition on underwater wet welding process stability. J. Mater. Process. Technol. 2017, 245, 149–156. [Google Scholar] [CrossRef]
- Lozynskyi, V.; Trembach, B.; Katinas, E.; Sadovyi, K.; Krbata, M.; Balenko, O.; Krasnoshapka, I.; Rebrova, O.; Knyazev, S.; Kabatskyi, O.; Kniazievf, H.; Ropyak, L. Effect of Exothermic Additions in Core Filler on Arc Stability and Microstructure during Self-Shielded, Flux-Cored Arc Welding. Crystals. 2024, 14, 335. [Google Scholar] [CrossRef]
- Park, S.; Won, J.; Yoo, S.; Moon, B.; Kim, C.; Kang, N. Influence of welding position and dilution on mechanical properties and strengthening design of flux cored arc weld metal for high manganese steels. Int J Adv ManufTechnol. 2024, 130, 3509–3523. [Google Scholar] [CrossRef]
- Trembach, B.; Trembach, I.; Maliuha, V.; Knyazev, S.; Krbata, M.; Kabatskyi, O.; Balenko, O.; Zarichniak, Y.; Brechka, M.; Mykhailo, B.; Khabosha, S.; Kniazieva, H. Study of self-shielded flux-cored wire with exothermic additions CuO-Al on weld bead morphology, microstructure, and mechanical properties. Int J Adv ManufTechnol. 2025, 137, 4685–4711. [Google Scholar] [CrossRef]
- Trembach, B.; Silchenko, Y.; Balenko, O.; Hlachev, D.; Kulahin, K.; Heiko, H.; Bellorin-Herrera, O.; Khabosha, S.; Zakovorotnyi, O.; Trembach, I. Study of the hardfacing process using self-shielding flux-cored wire with an exothermic addition with a combined oxidizer of the Al-(CuO/Fe2O3) system. Int J Adv ManufTechnol. 2024, 134, 309–335. [Google Scholar] [CrossRef]
- Passos, T.A.; Costa, H. , Luz, F.K.C.; Pintaude, G. The Effect of the Dilution Level on Microstructure and Wear Resistance of Fe-Cr-CV Hardfacing Coatings Deposited by PTA-P. Coatings. 2022, 12. [Google Scholar] [CrossRef]
- Guyon, I.; Elisseeff, A. An introduction to variable and feature selection. Journal of machine learning research. 2003, 3, 1157–1182. [Google Scholar] [CrossRef]
- Trembach, B.; Grin, A.; Turchanin, M.; Makarenko, N.; Markov, O.; Trembach, I. Application of Taguchi method and ANOVA analysis for optimization of process parameters and exothermic addition (CuO–Al ) introduction in the core filler during self-shielded flux-cored arc welding. Int. J. Adv. Manuf. Technol. 2021, 114, 1099–1118. [Google Scholar] [CrossRef]
- Alao, A.R.; Konneh, M. Application of Taguchi and Box-Behnken designs for surface roughness in precision grinding of silicon. International Journal of Precision Technology. 2011, 2, 21–38. [Google Scholar] [CrossRef]
- Jafarian, H.R.; Sabzi, M.; Mousavi Anijdan, S.H.; Eivani, A.R.; Park, N. The Influence of Austenitization Temperature on Microstructural Developments, Mechanical Properties, Fracture Mode and Wear Mechanism of Hadfield High Manganese Steel. J. Mater. Res. Technol. 2021, 10, 819–831. [Google Scholar] [CrossRef]
- Wang, J.; Li, H.; Hu, C.; Wang, Z.; Han, K.; Liu, D.; Wang, J.; Zhu, Q. The Efficiency of Thermite-Assisted Underwater Wet Flux-Cored Arc Welding Process: Electrical Dependence, Microstructural Changes, and Mechanical Properties. Metals. 2023, 13, 831. [Google Scholar] [CrossRef]
Figure 1.
Pie charts of the influence of hardfacing mode parameters on the characteristics of the hardfacing thermal cycle.
Figure 1.
Pie charts of the influence of hardfacing mode parameters on the characteristics of the hardfacing thermal cycle.
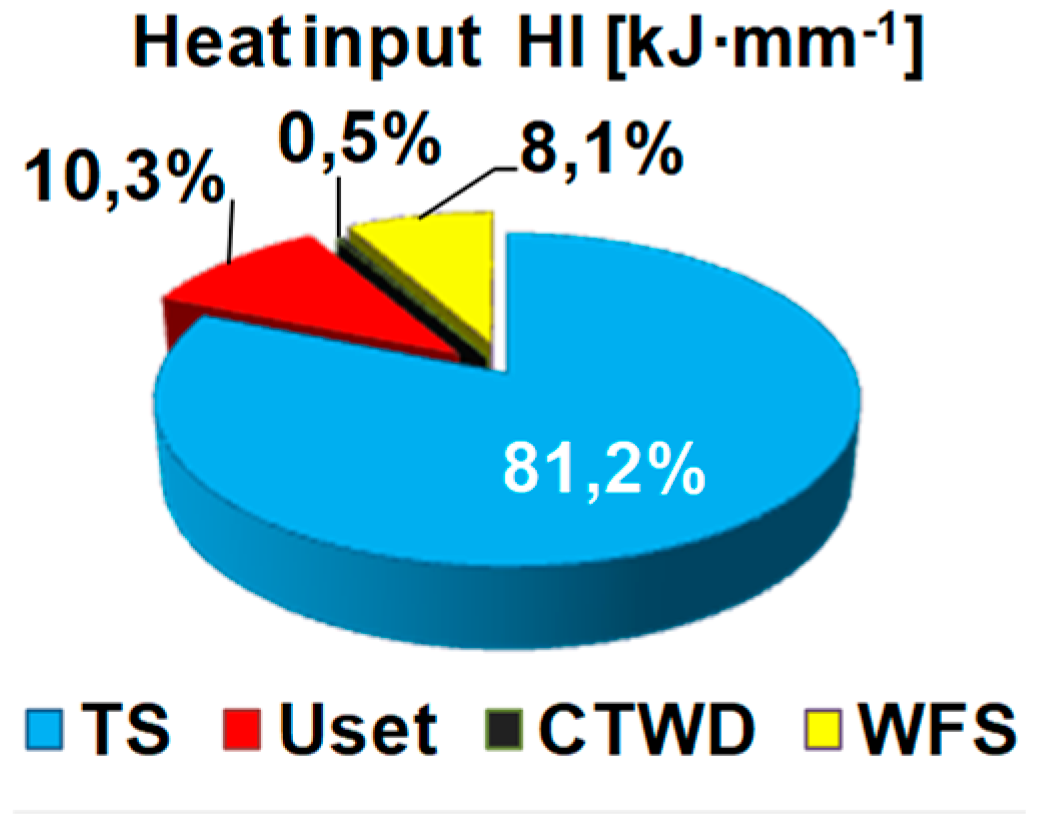
Figure 2.
Diagram of the main effects of the S/N ratio for the characteristics of the hardfacing thermal cycle: (a) Heat Input HI; (b) Cooling time Δt8/5;; (c) Cooling rate CR.
Figure 2.
Diagram of the main effects of the S/N ratio for the characteristics of the hardfacing thermal cycle: (a) Heat Input HI; (b) Cooling time Δt8/5;; (c) Cooling rate CR.
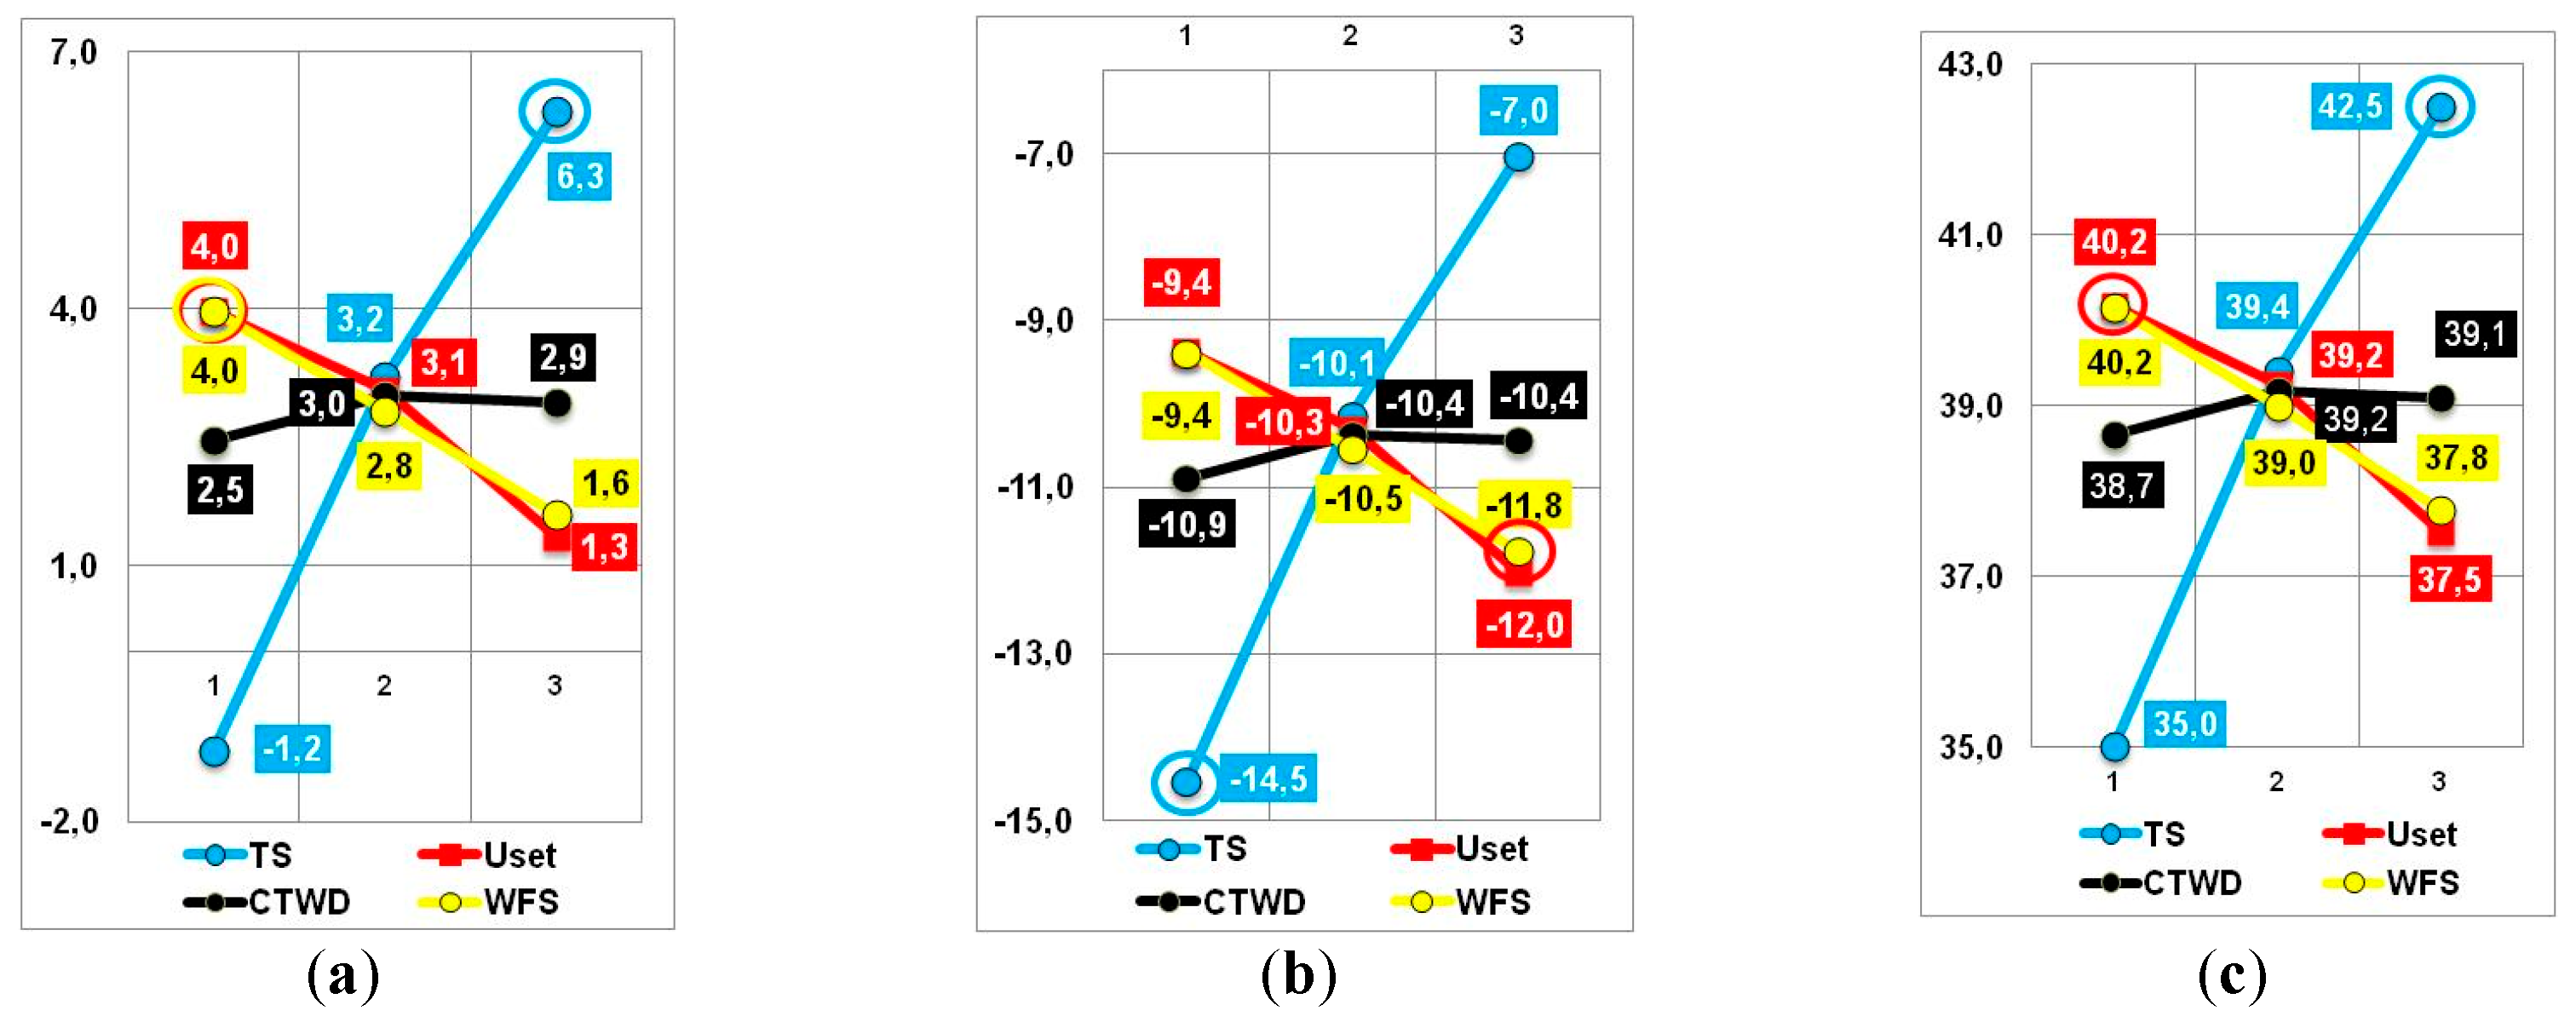
Figure 3.
Pareto charts for the characteristics of the hardfacing thermal cycle: (a) Heat Input HI; (b) Cooling time Δt8/5; (c) Cooling rate CR.
Figure 3.
Pareto charts for the characteristics of the hardfacing thermal cycle: (a) Heat Input HI; (b) Cooling time Δt8/5; (c) Cooling rate CR.
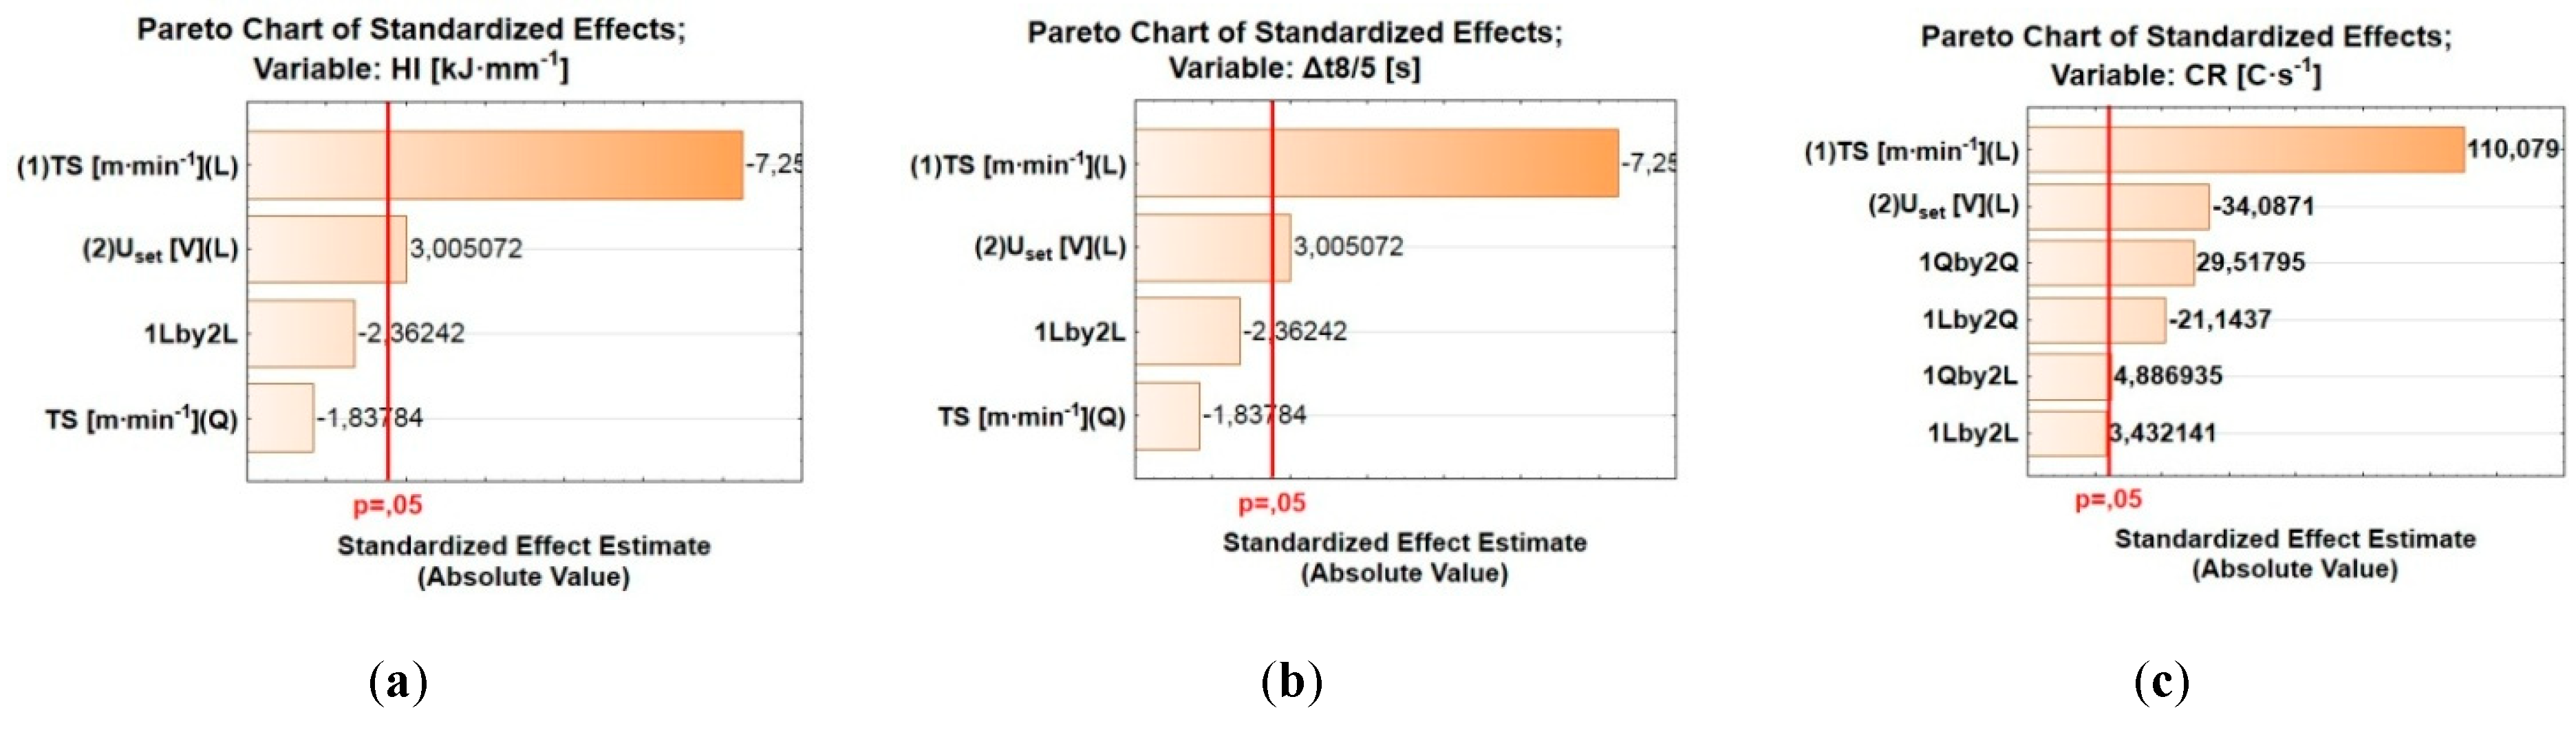
Figure 4.
Graphs of the predicted values of the influence of each factor on the dependent variables for: (a) Heat Input HI; (b) Cooling time Δt8/5; (c) Cooling rate CR.
Figure 4.
Graphs of the predicted values of the influence of each factor on the dependent variables for: (a) Heat Input HI; (b) Cooling time Δt8/5; (c) Cooling rate CR.
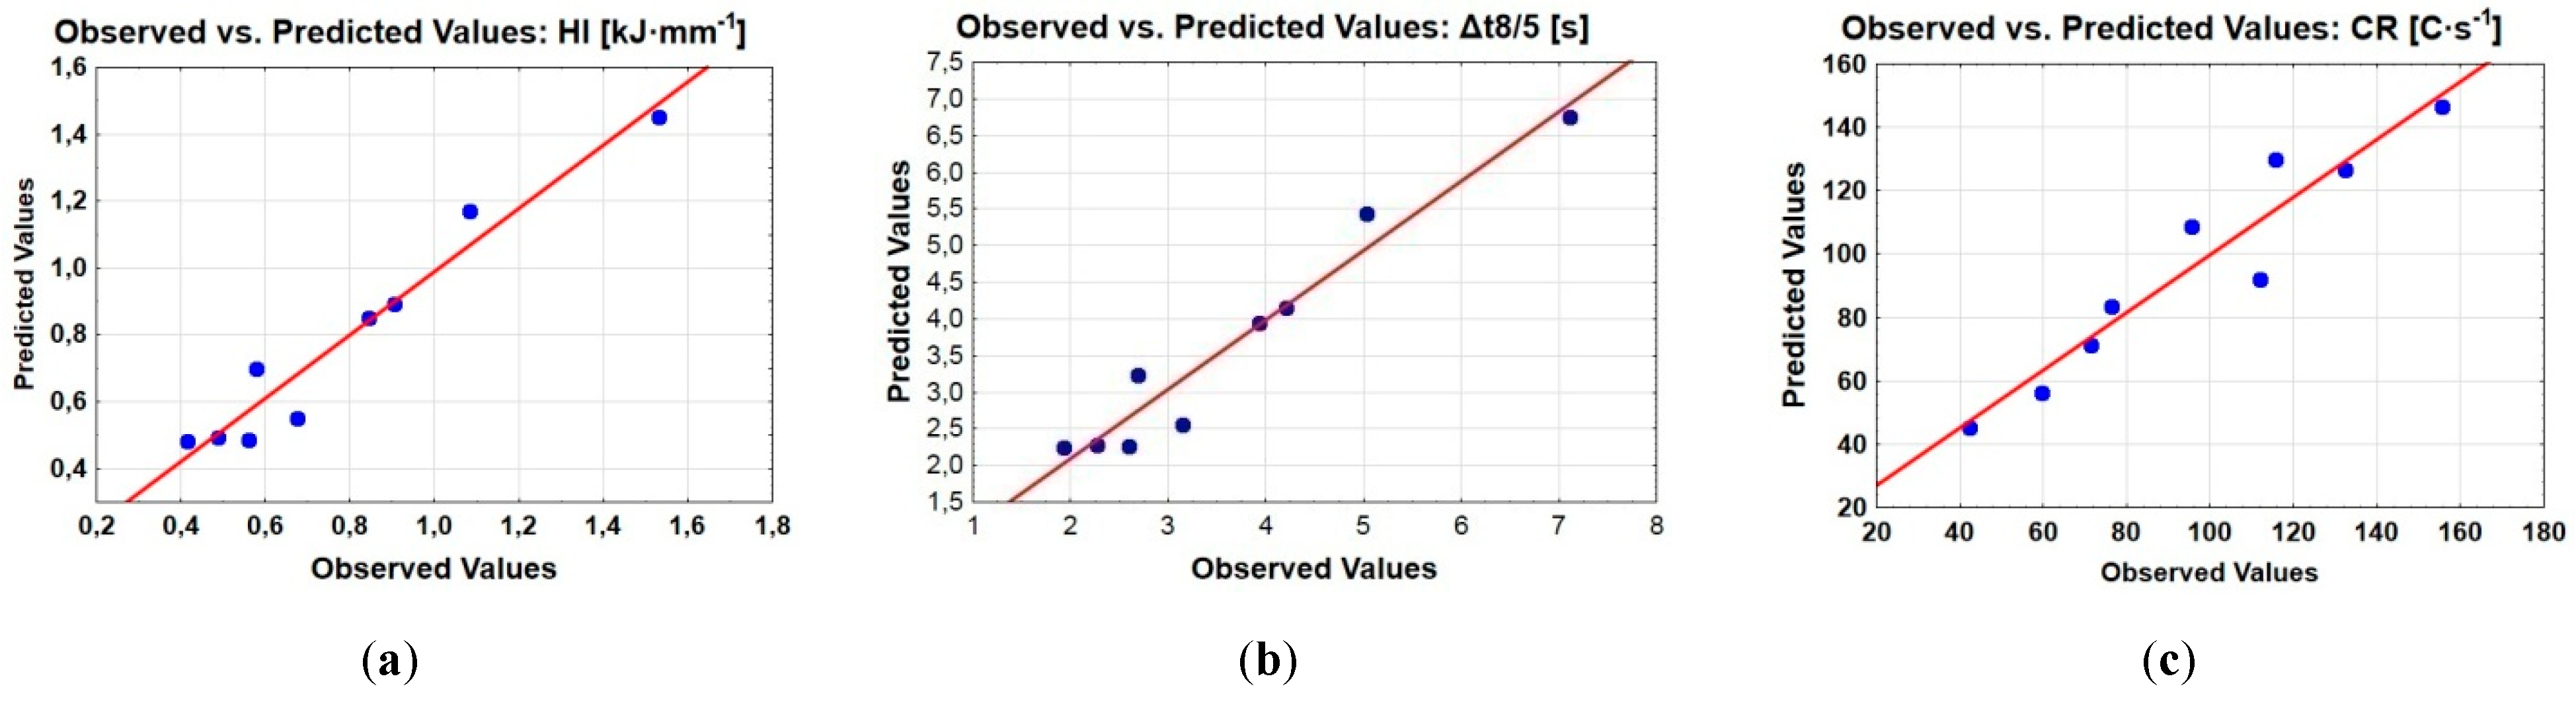
Figure 4.
Response surfaces of the mathematical model of the dependence of hardfacing thermal cycle parameters: (a) Heat Input HI; (b) Cooling time Δt8/5; (c) Cooling rate CR.
Figure 4.
Response surfaces of the mathematical model of the dependence of hardfacing thermal cycle parameters: (a) Heat Input HI; (b) Cooling time Δt8/5; (c) Cooling rate CR.
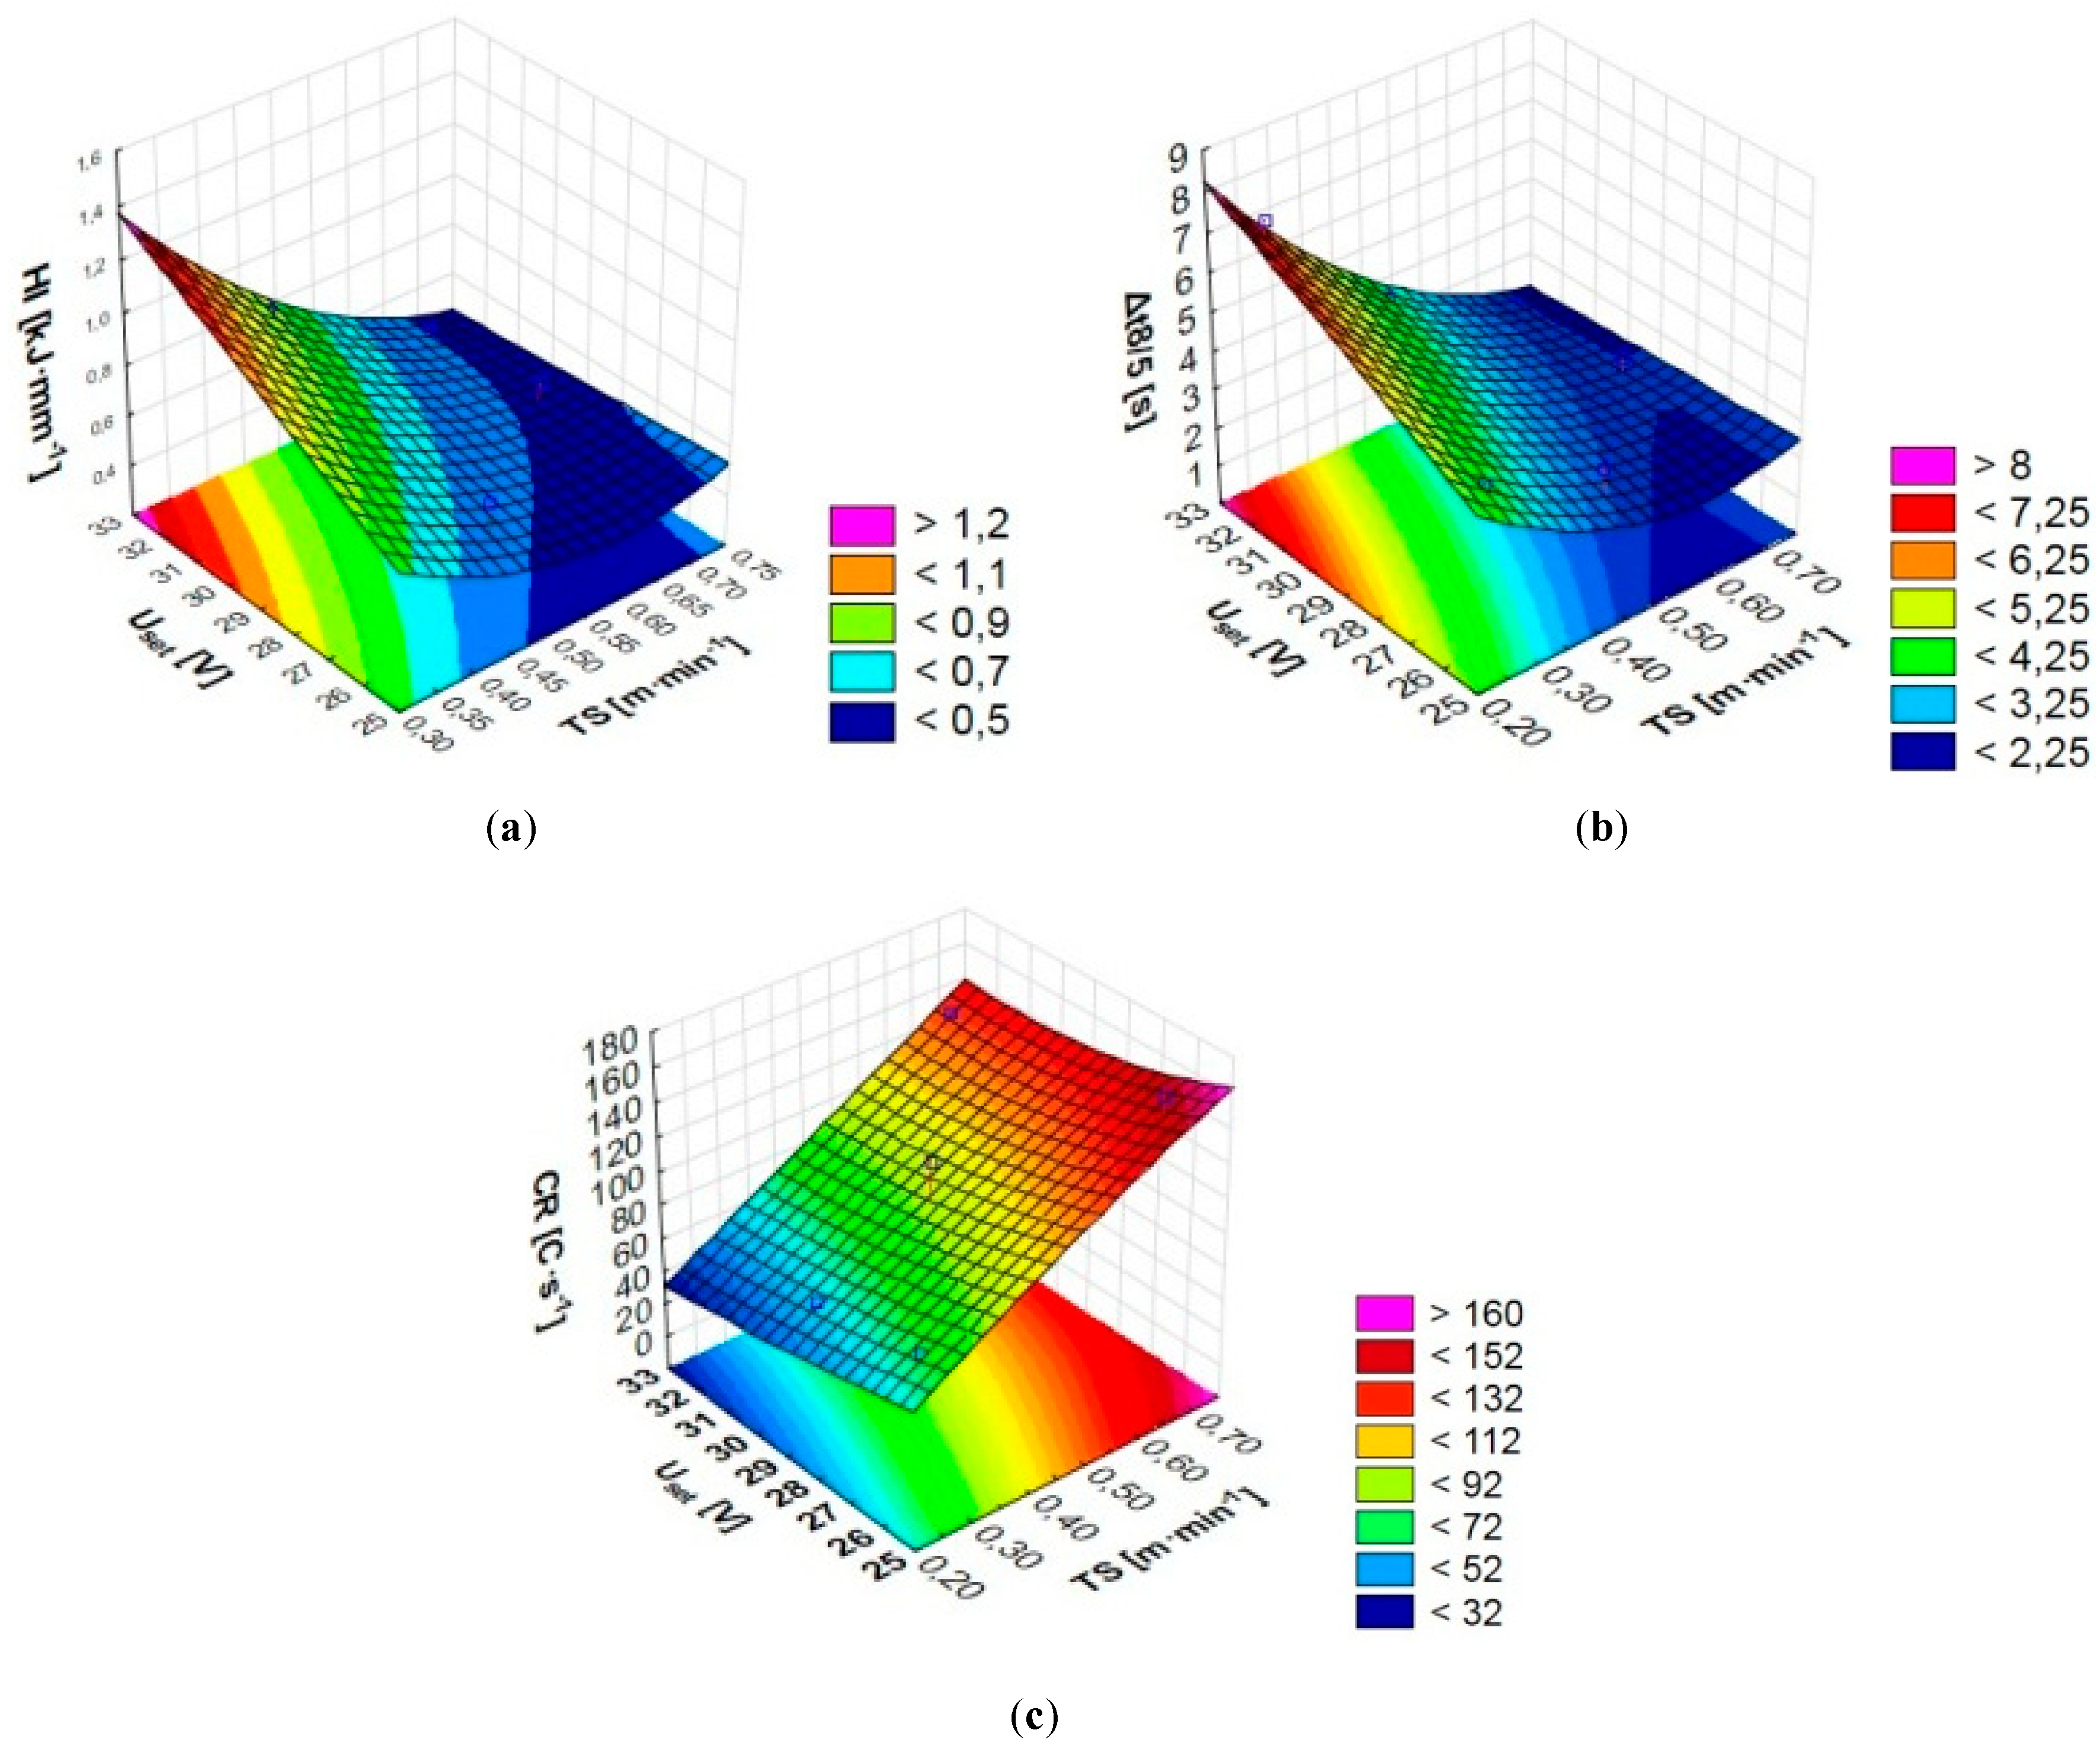
Figure 5.
Microstructure of the deposited metal, ×200: (a) Exp.1, (b) Exp.2, (c) Exp.3, (d) Exp.4, (e) Exp.5, (f) Exp.6, (g) Exp.7, (h) Exp.8, (i) Exp.9.
Figure 5.
Microstructure of the deposited metal, ×200: (a) Exp.1, (b) Exp.2, (c) Exp.3, (d) Exp.4, (e) Exp.5, (f) Exp.6, (g) Exp.7, (h) Exp.8, (i) Exp.9.
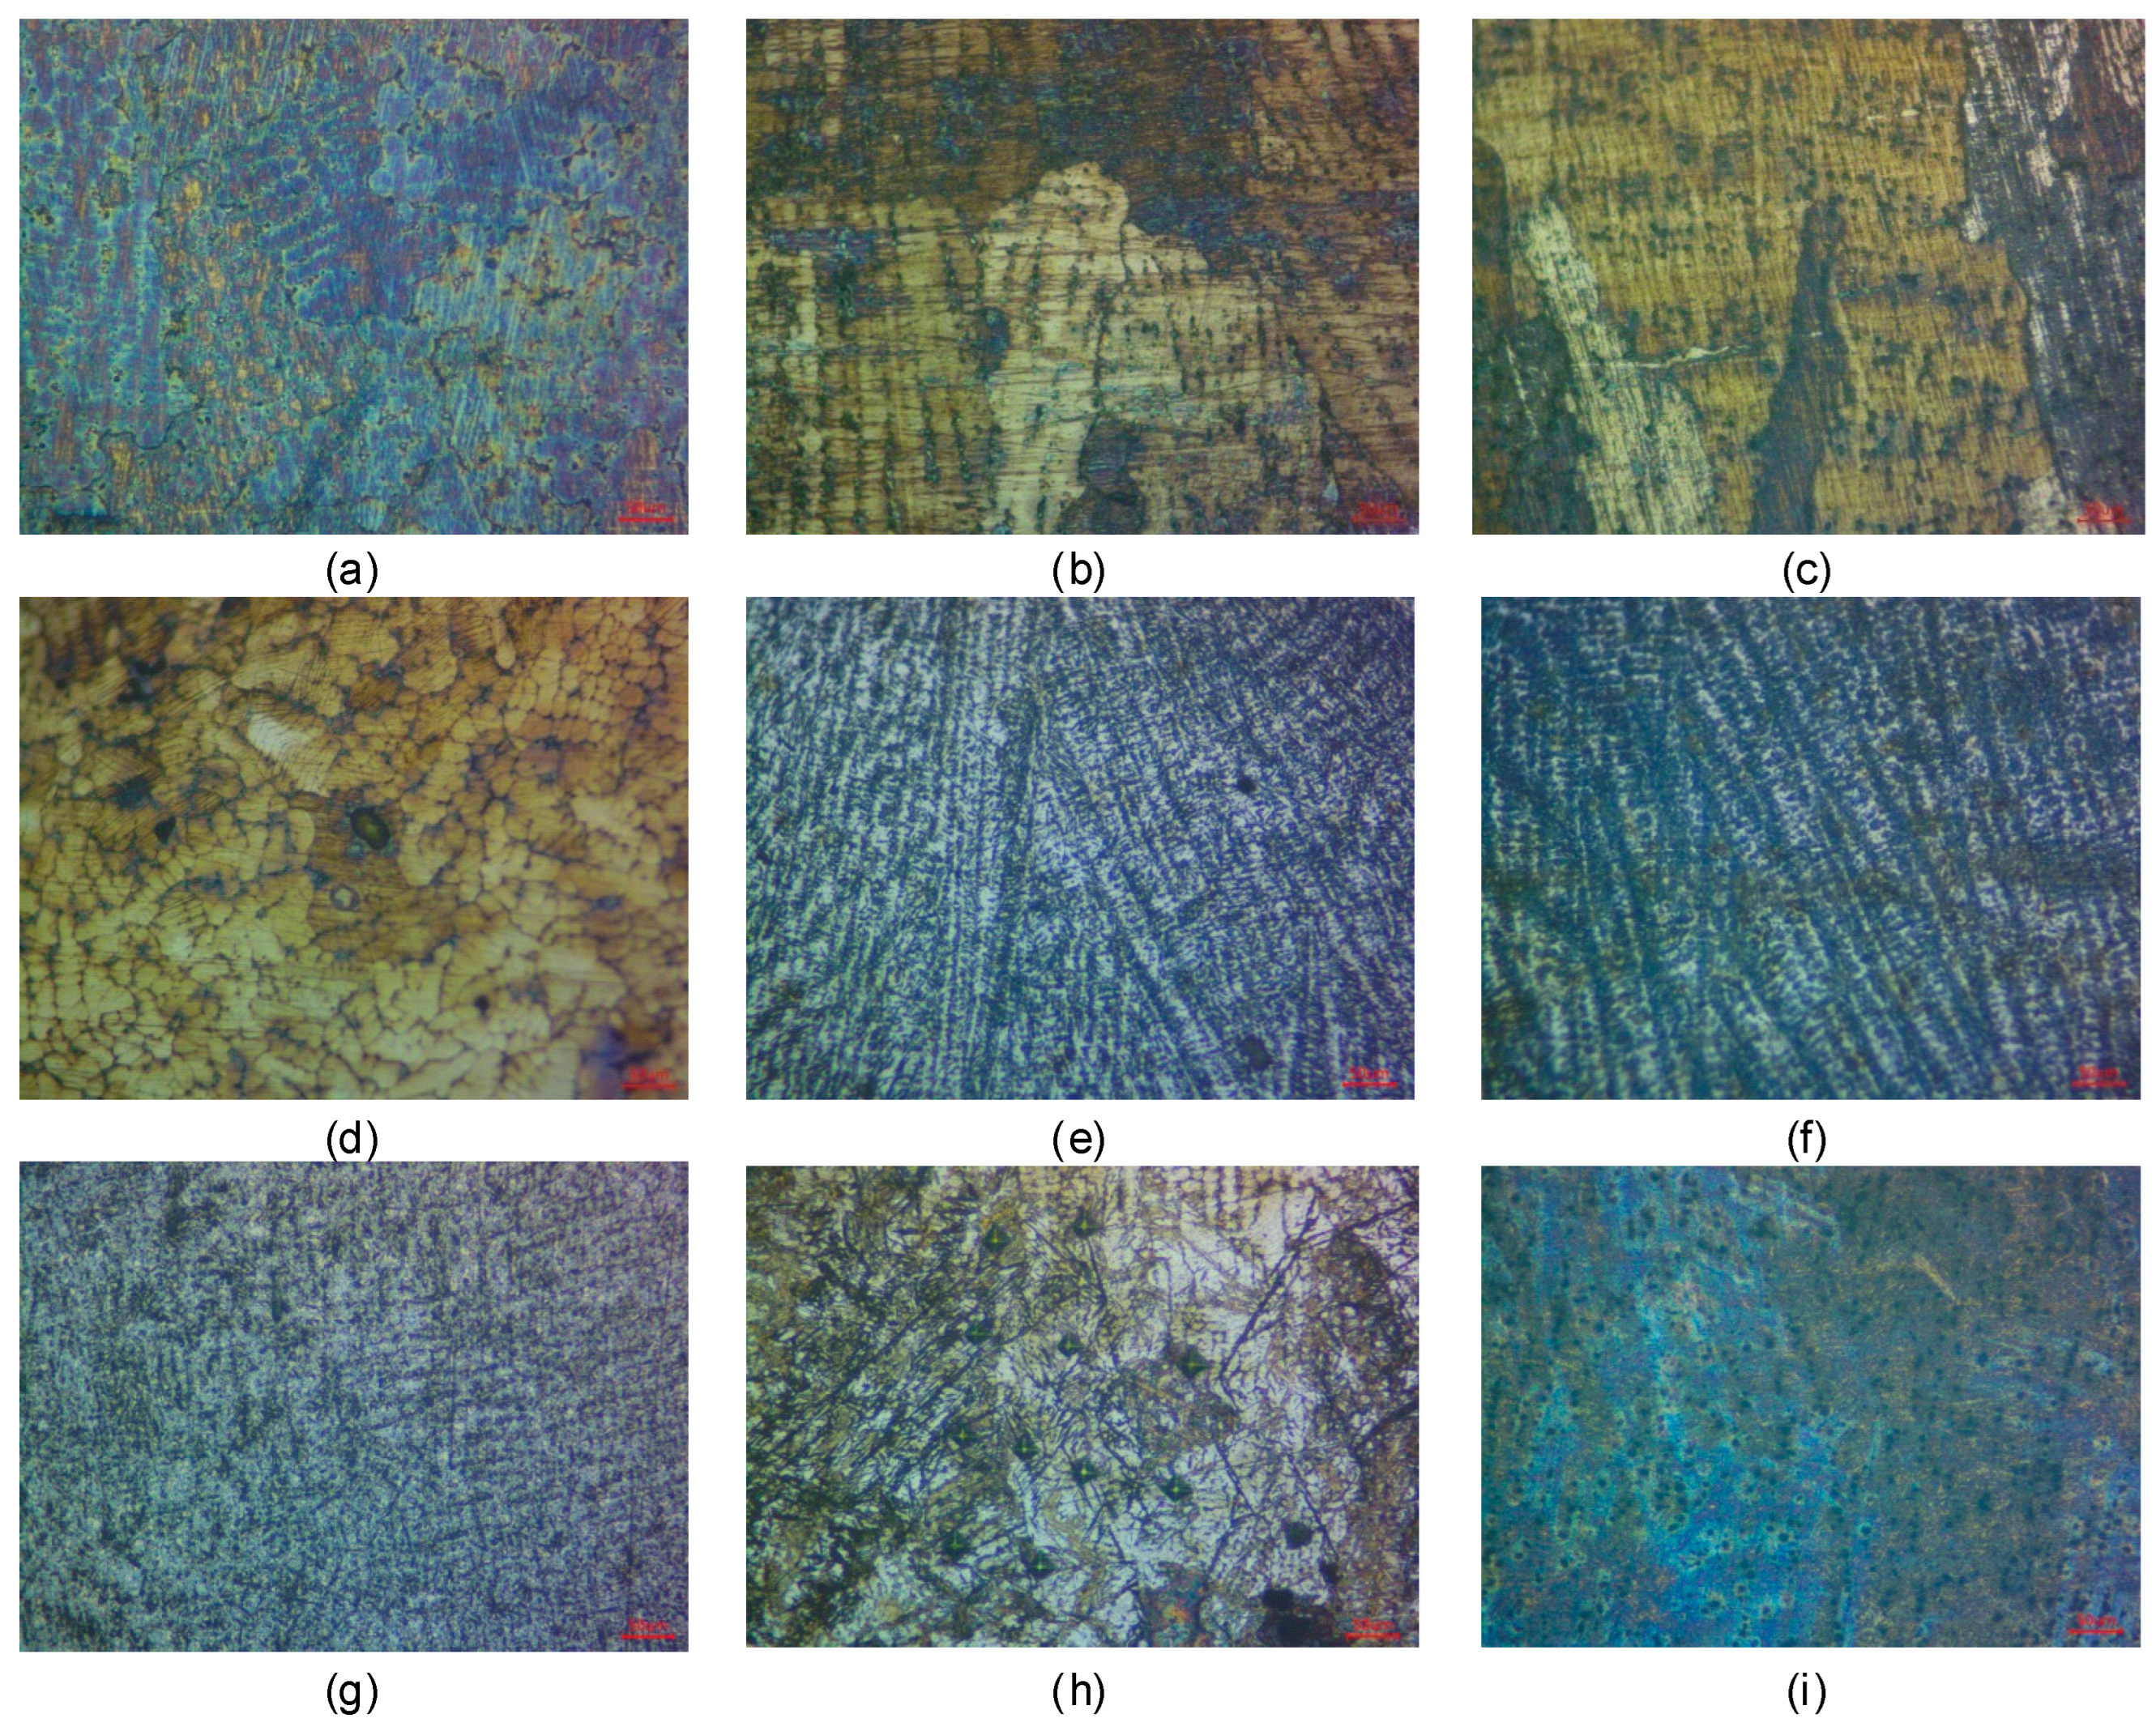
Figure 6.
The grain size of the deposited metal, ×200: (a) Exp.1, (b) Exp.2, (c) Exp.3, (d) Exp.4, (e) Exp.5, (f) Exp.6, (g) Exp.7, (h) Exp.8, (i) Exp.9.
Figure 6.
The grain size of the deposited metal, ×200: (a) Exp.1, (b) Exp.2, (c) Exp.3, (d) Exp.4, (e) Exp.5, (f) Exp.6, (g) Exp.7, (h) Exp.8, (i) Exp.9.
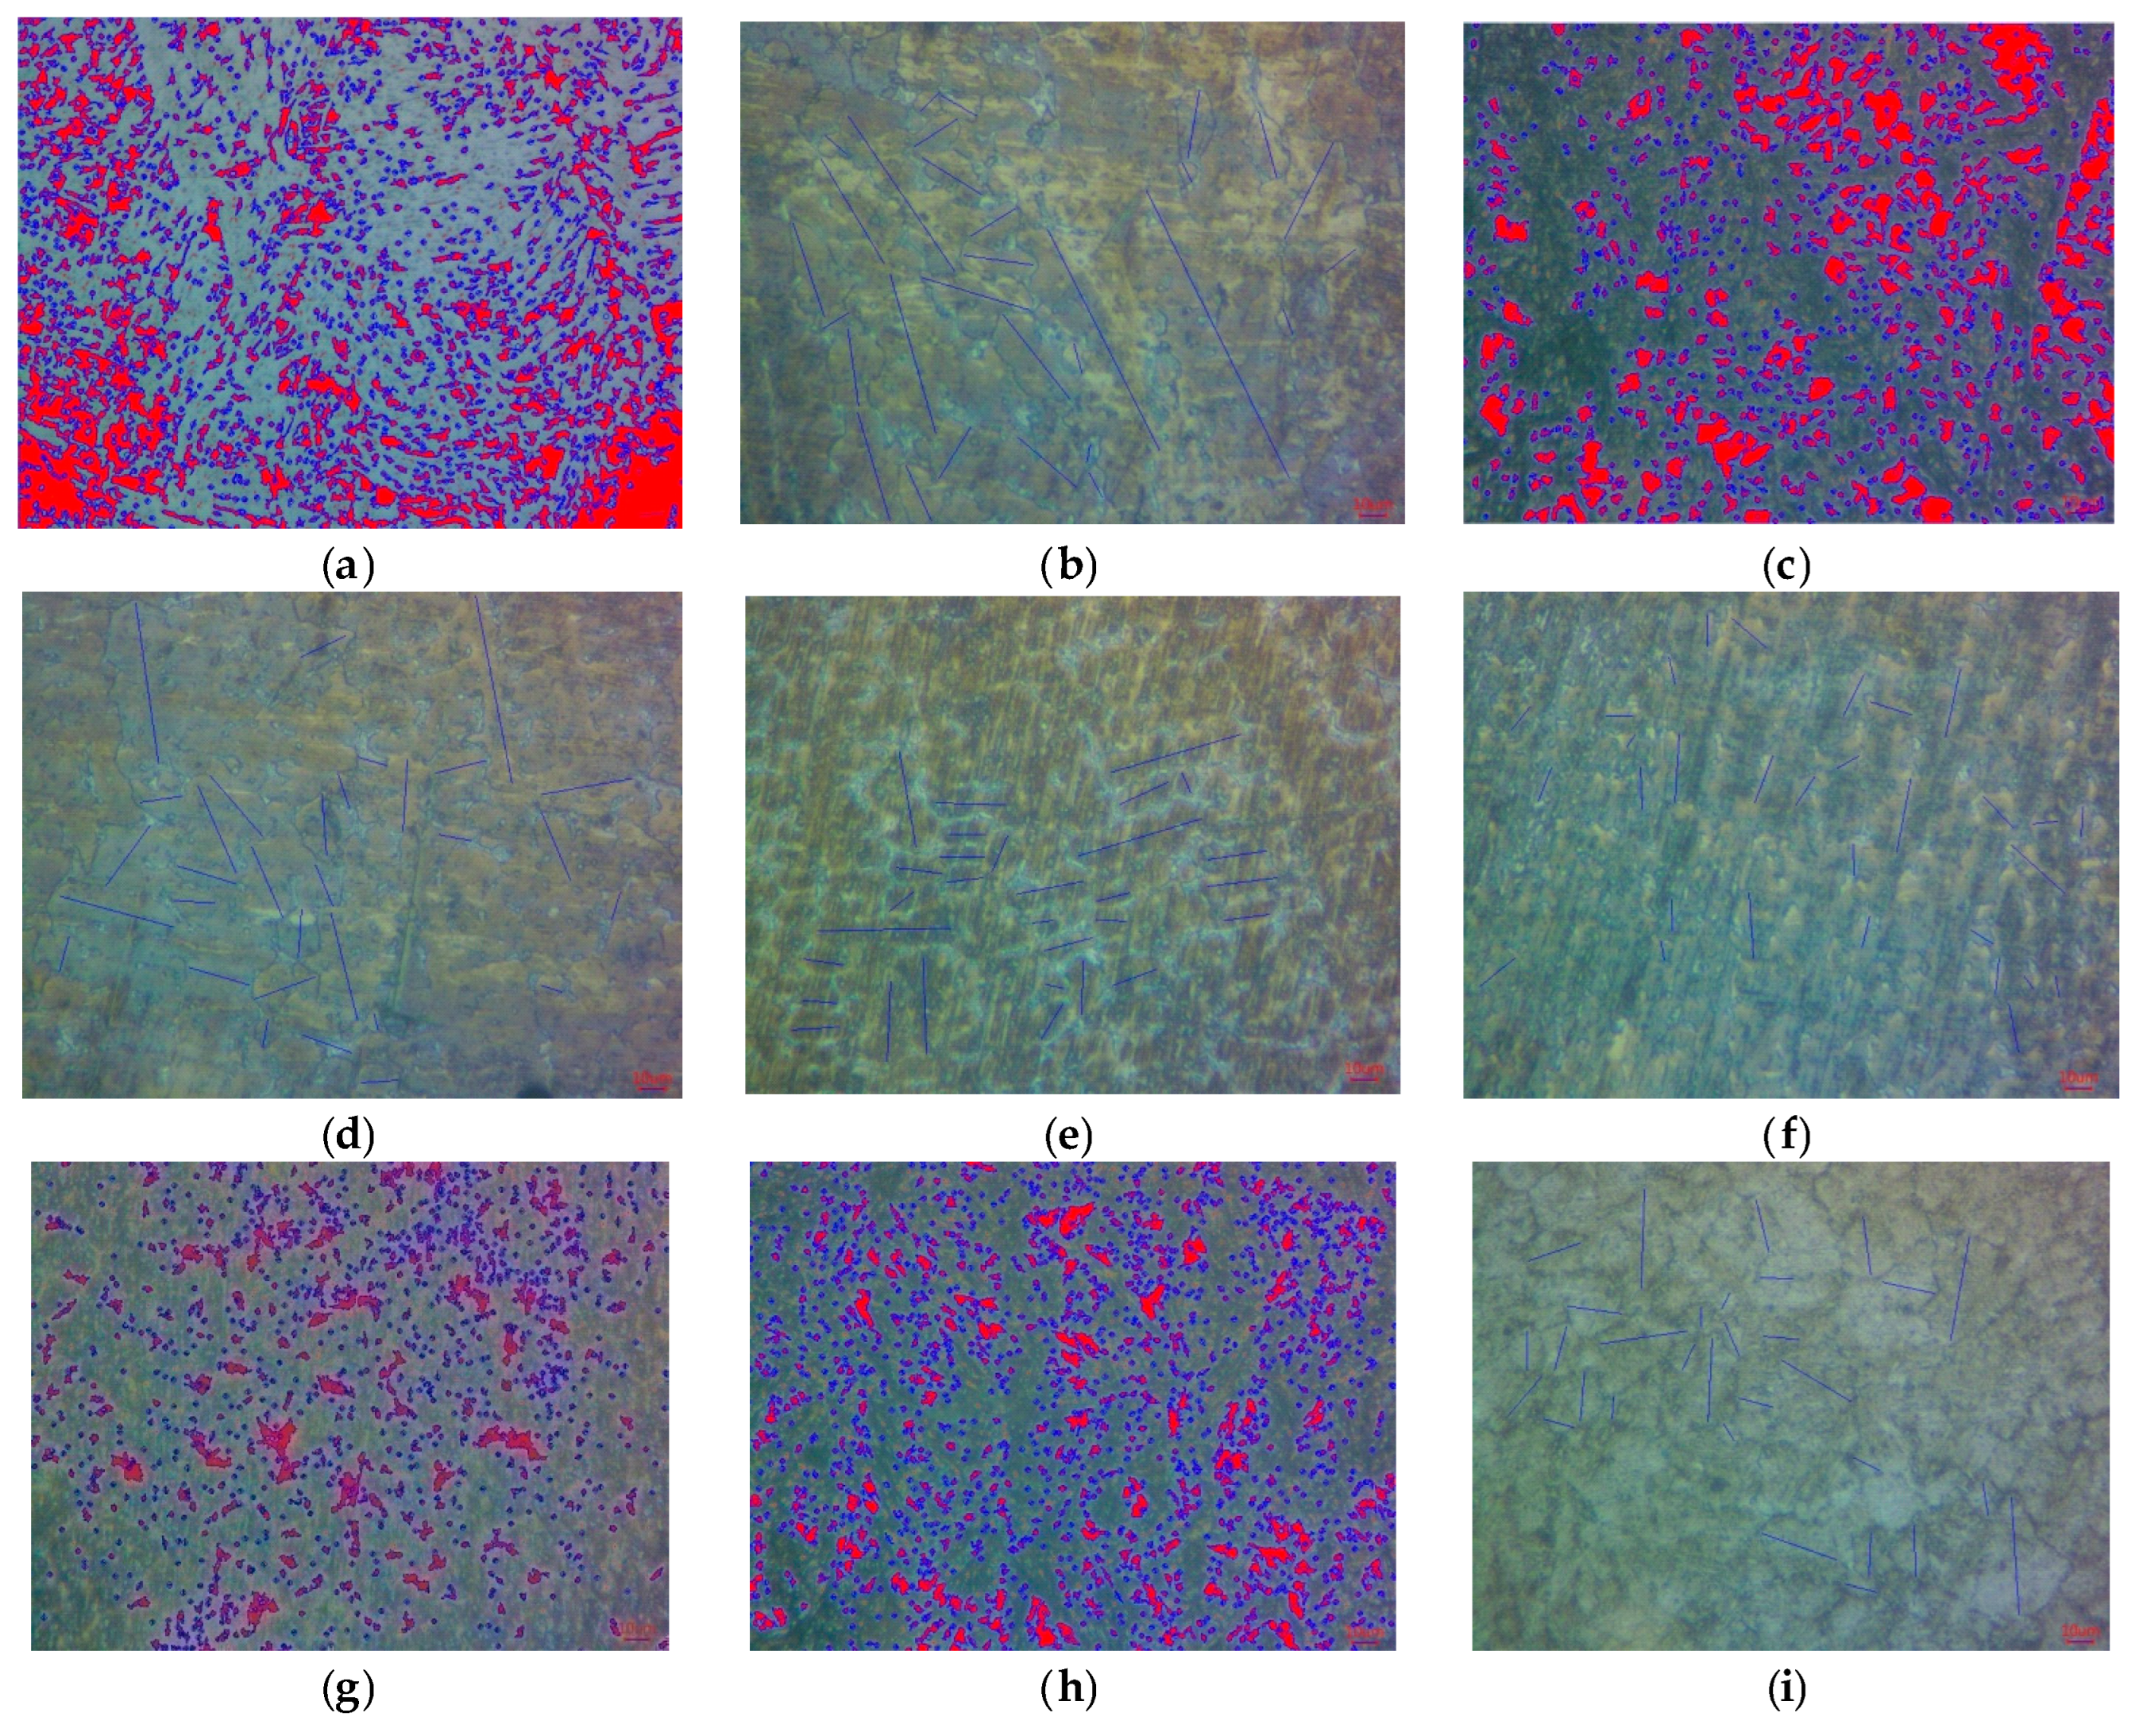
Figure 7.
Histogram of the distribution of grain size in the deposited metal by their nominal size depending on the hardfacing mode: (a) Exp.1, (b) Exp.2, (c) Exp.3, (d) Exp.4, (e) Exp.5, (f) Exp.6, (g) Exp.7, (h) Exp.8, (i) Exp.9.
Figure 7.
Histogram of the distribution of grain size in the deposited metal by their nominal size depending on the hardfacing mode: (a) Exp.1, (b) Exp.2, (c) Exp.3, (d) Exp.4, (e) Exp.5, (f) Exp.6, (g) Exp.7, (h) Exp.8, (i) Exp.9.
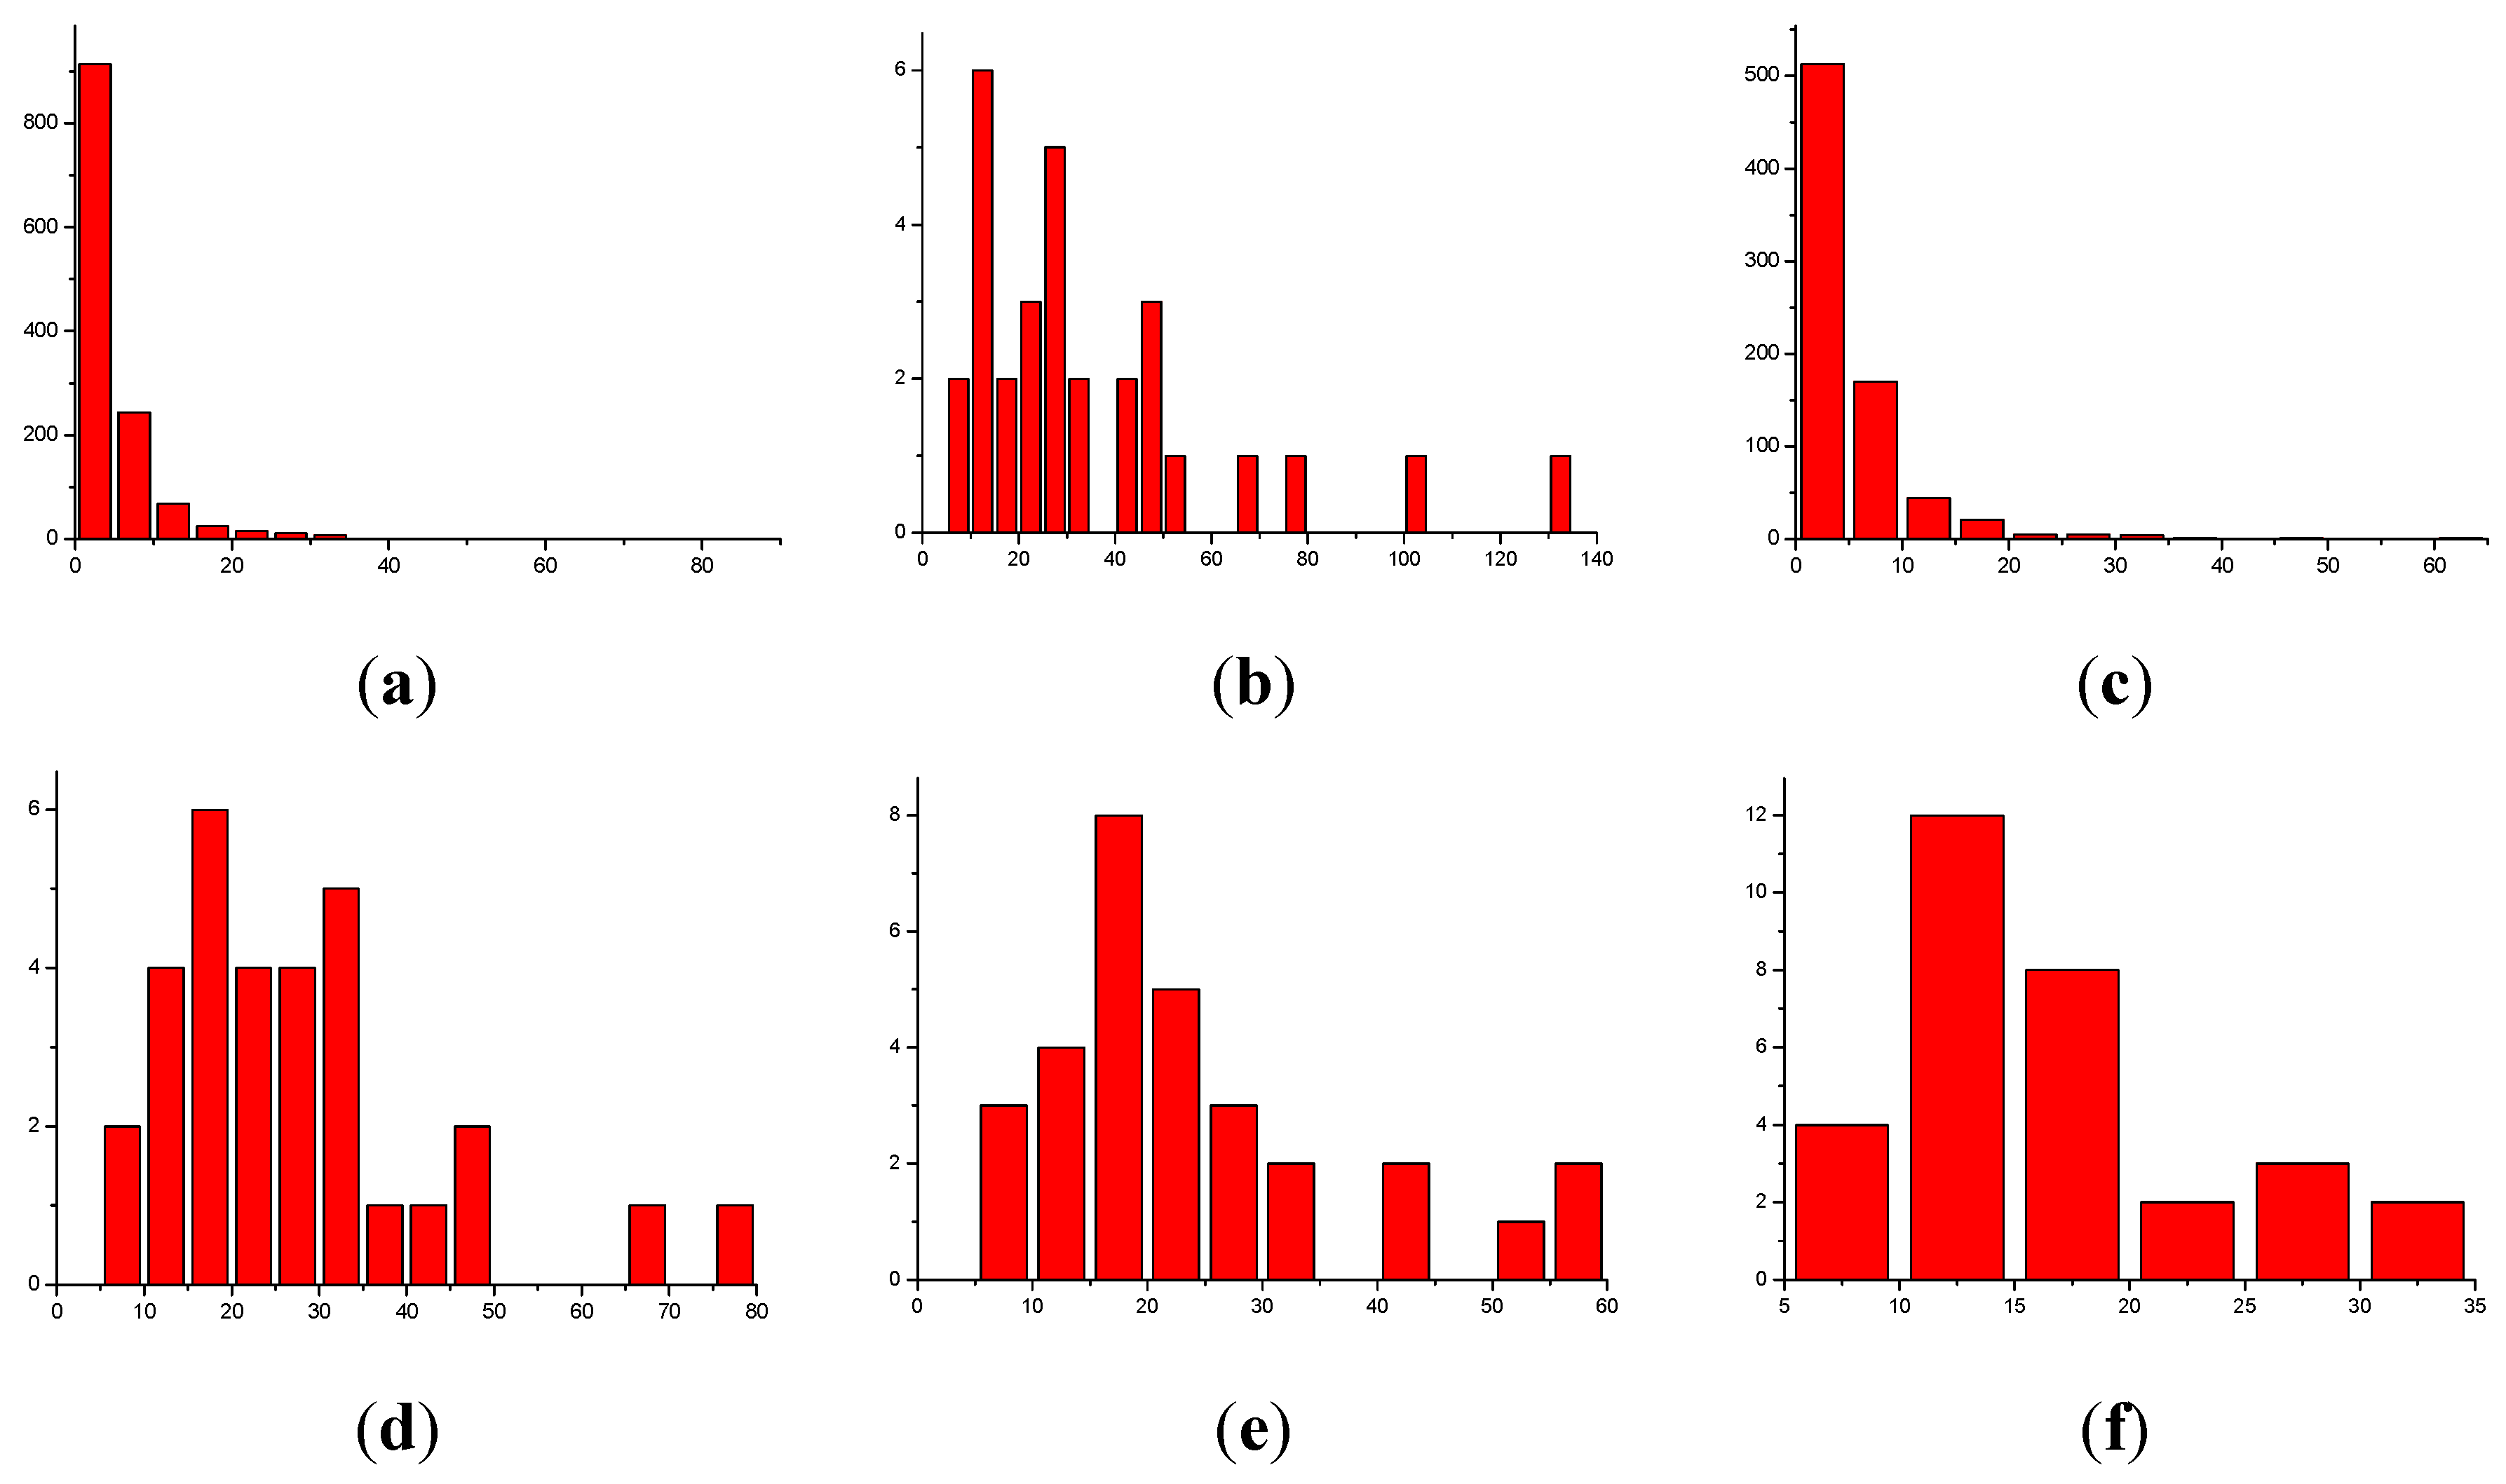
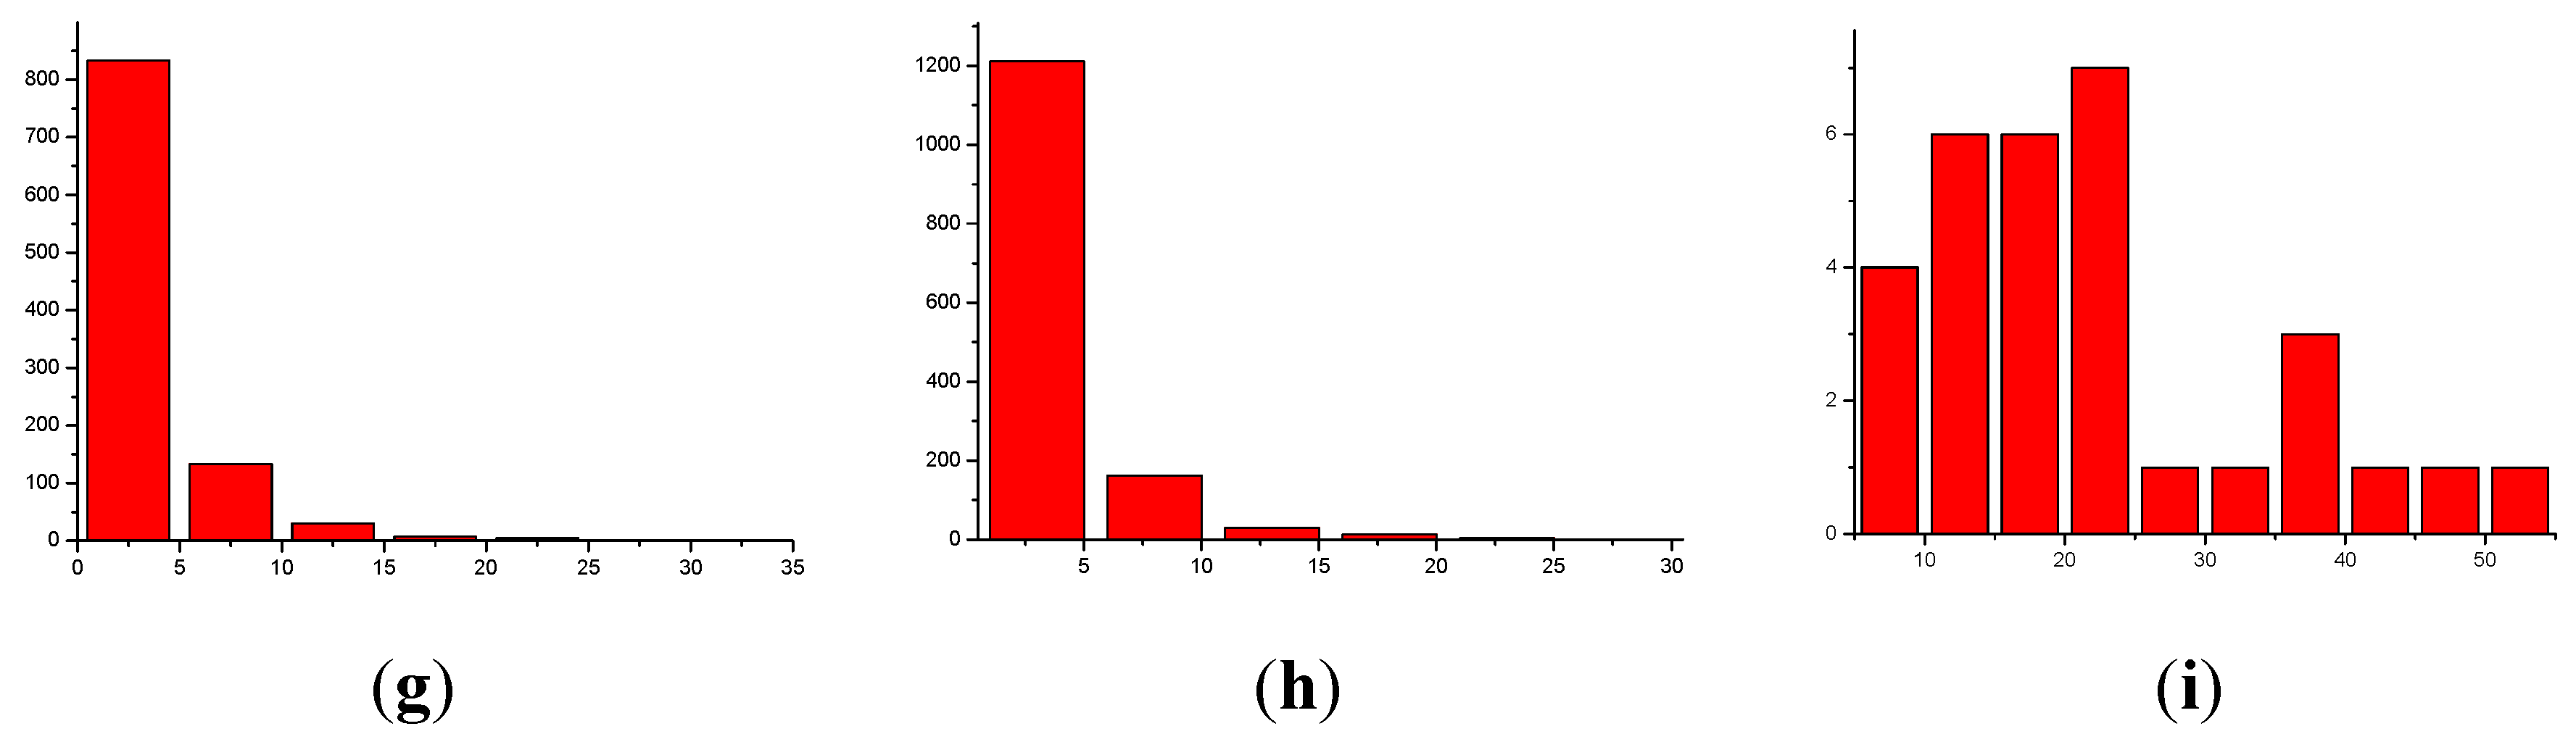
Figure 6.
Pie charts of the effect of hardfacing modes on grain size.
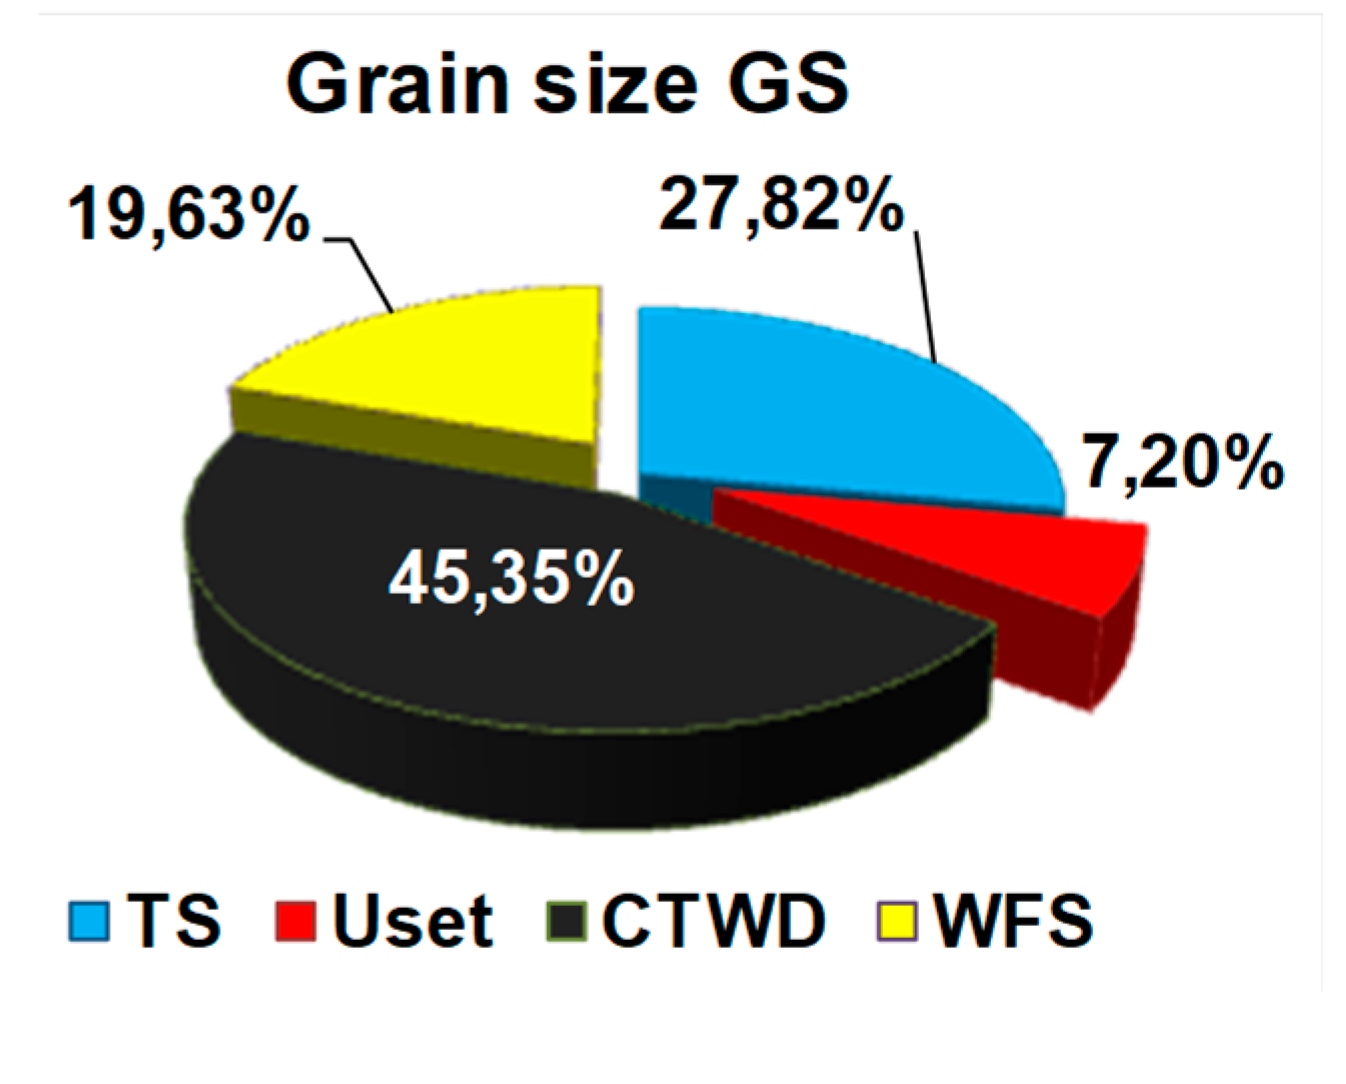
Figure 8.
Pareto chart (a) and observed and predicted values of the dependent variable (b) for Grain size.
Figure 8.
Pareto chart (a) and observed and predicted values of the dependent variable (b) for Grain size.
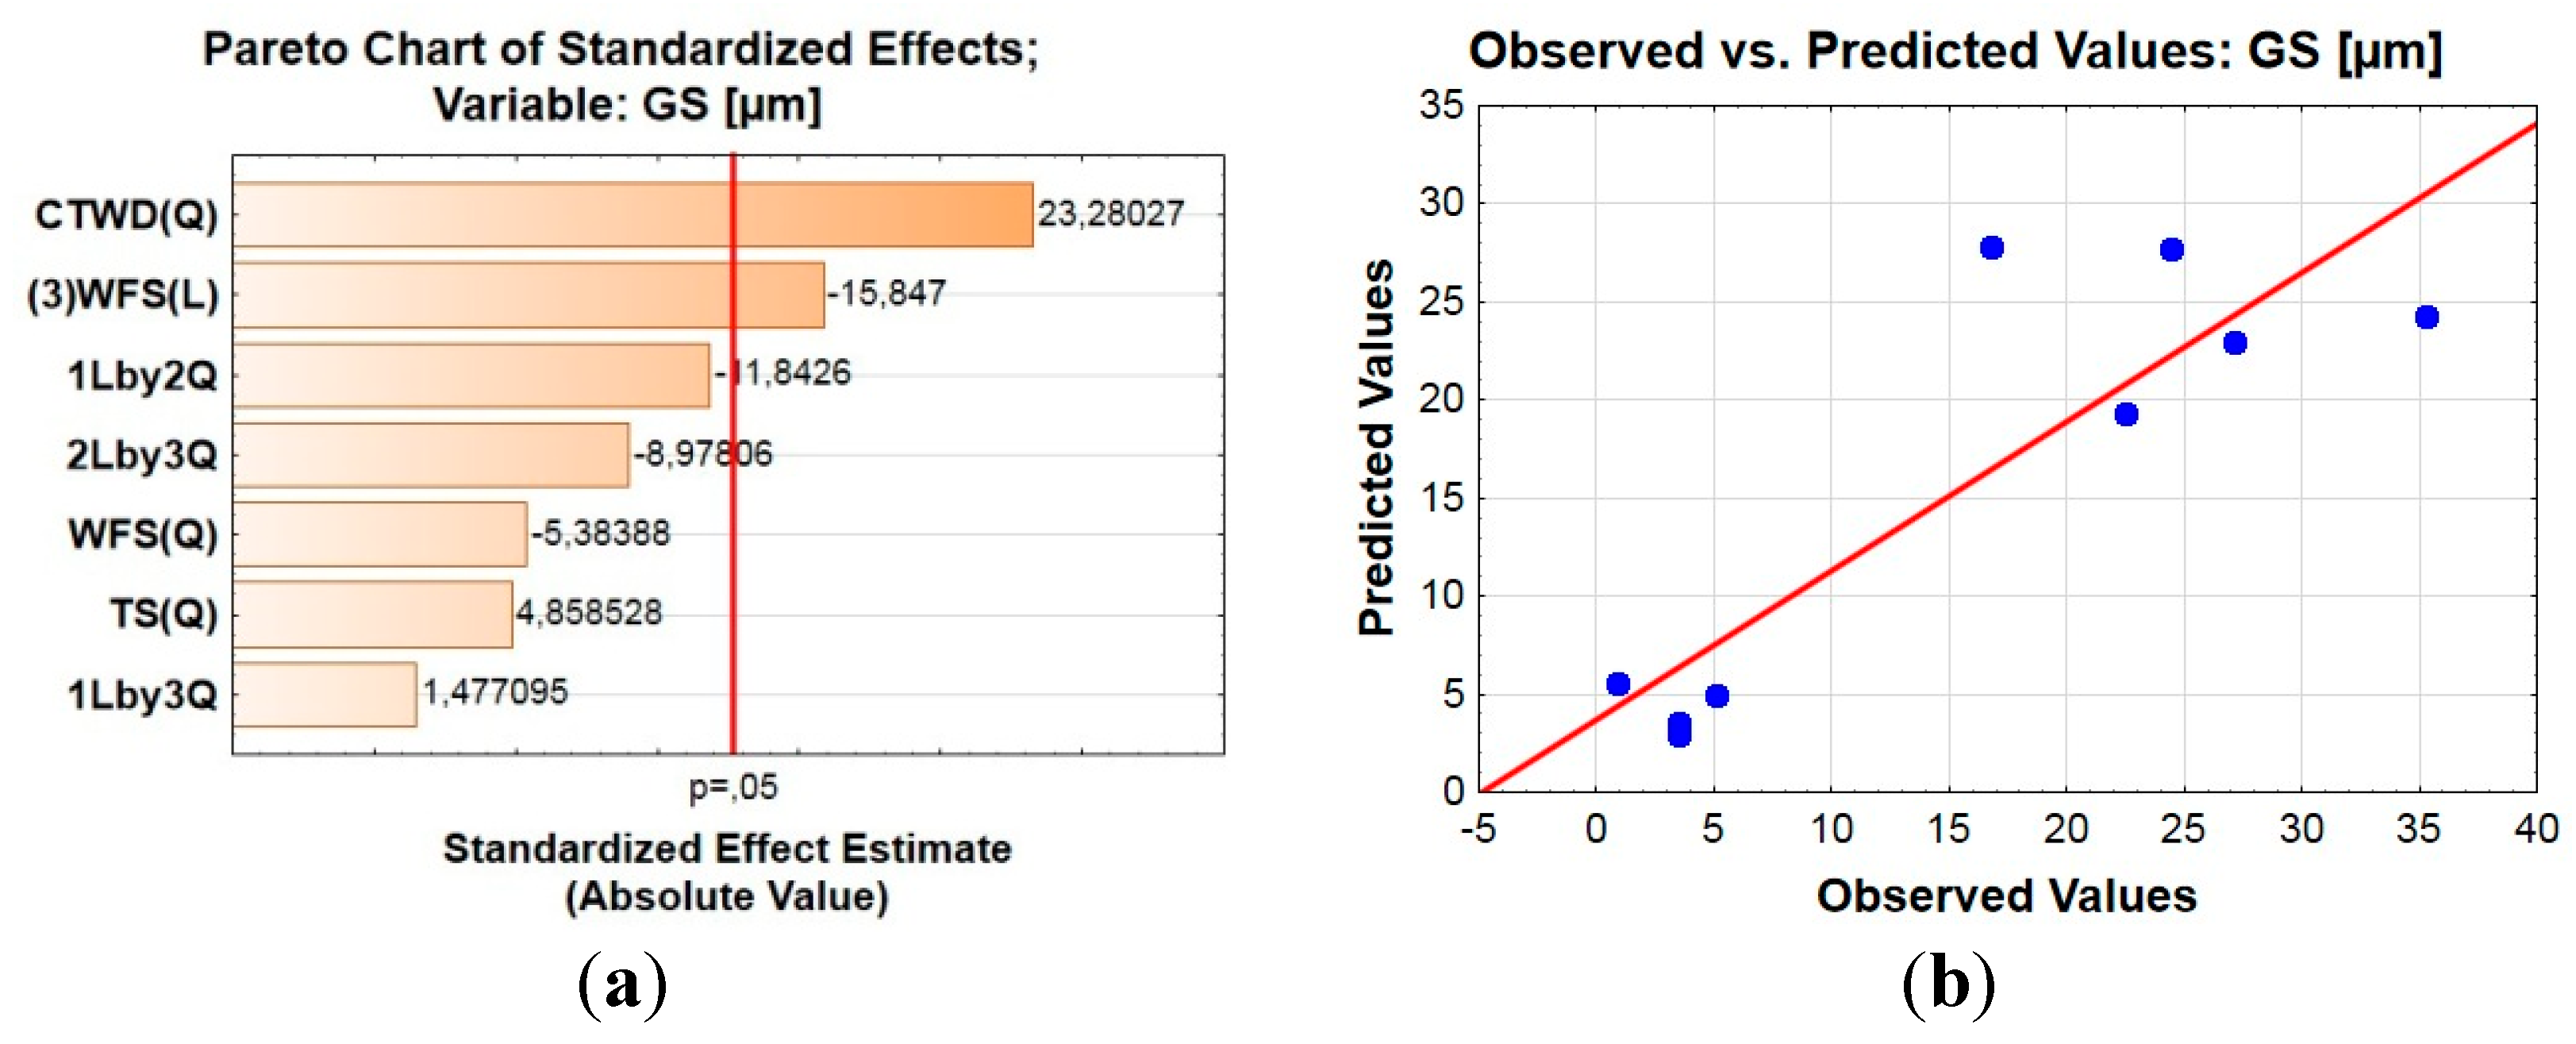
Figure 9.
Response surfaces of the mathematical model of grain size dependence on hardfacing modes.
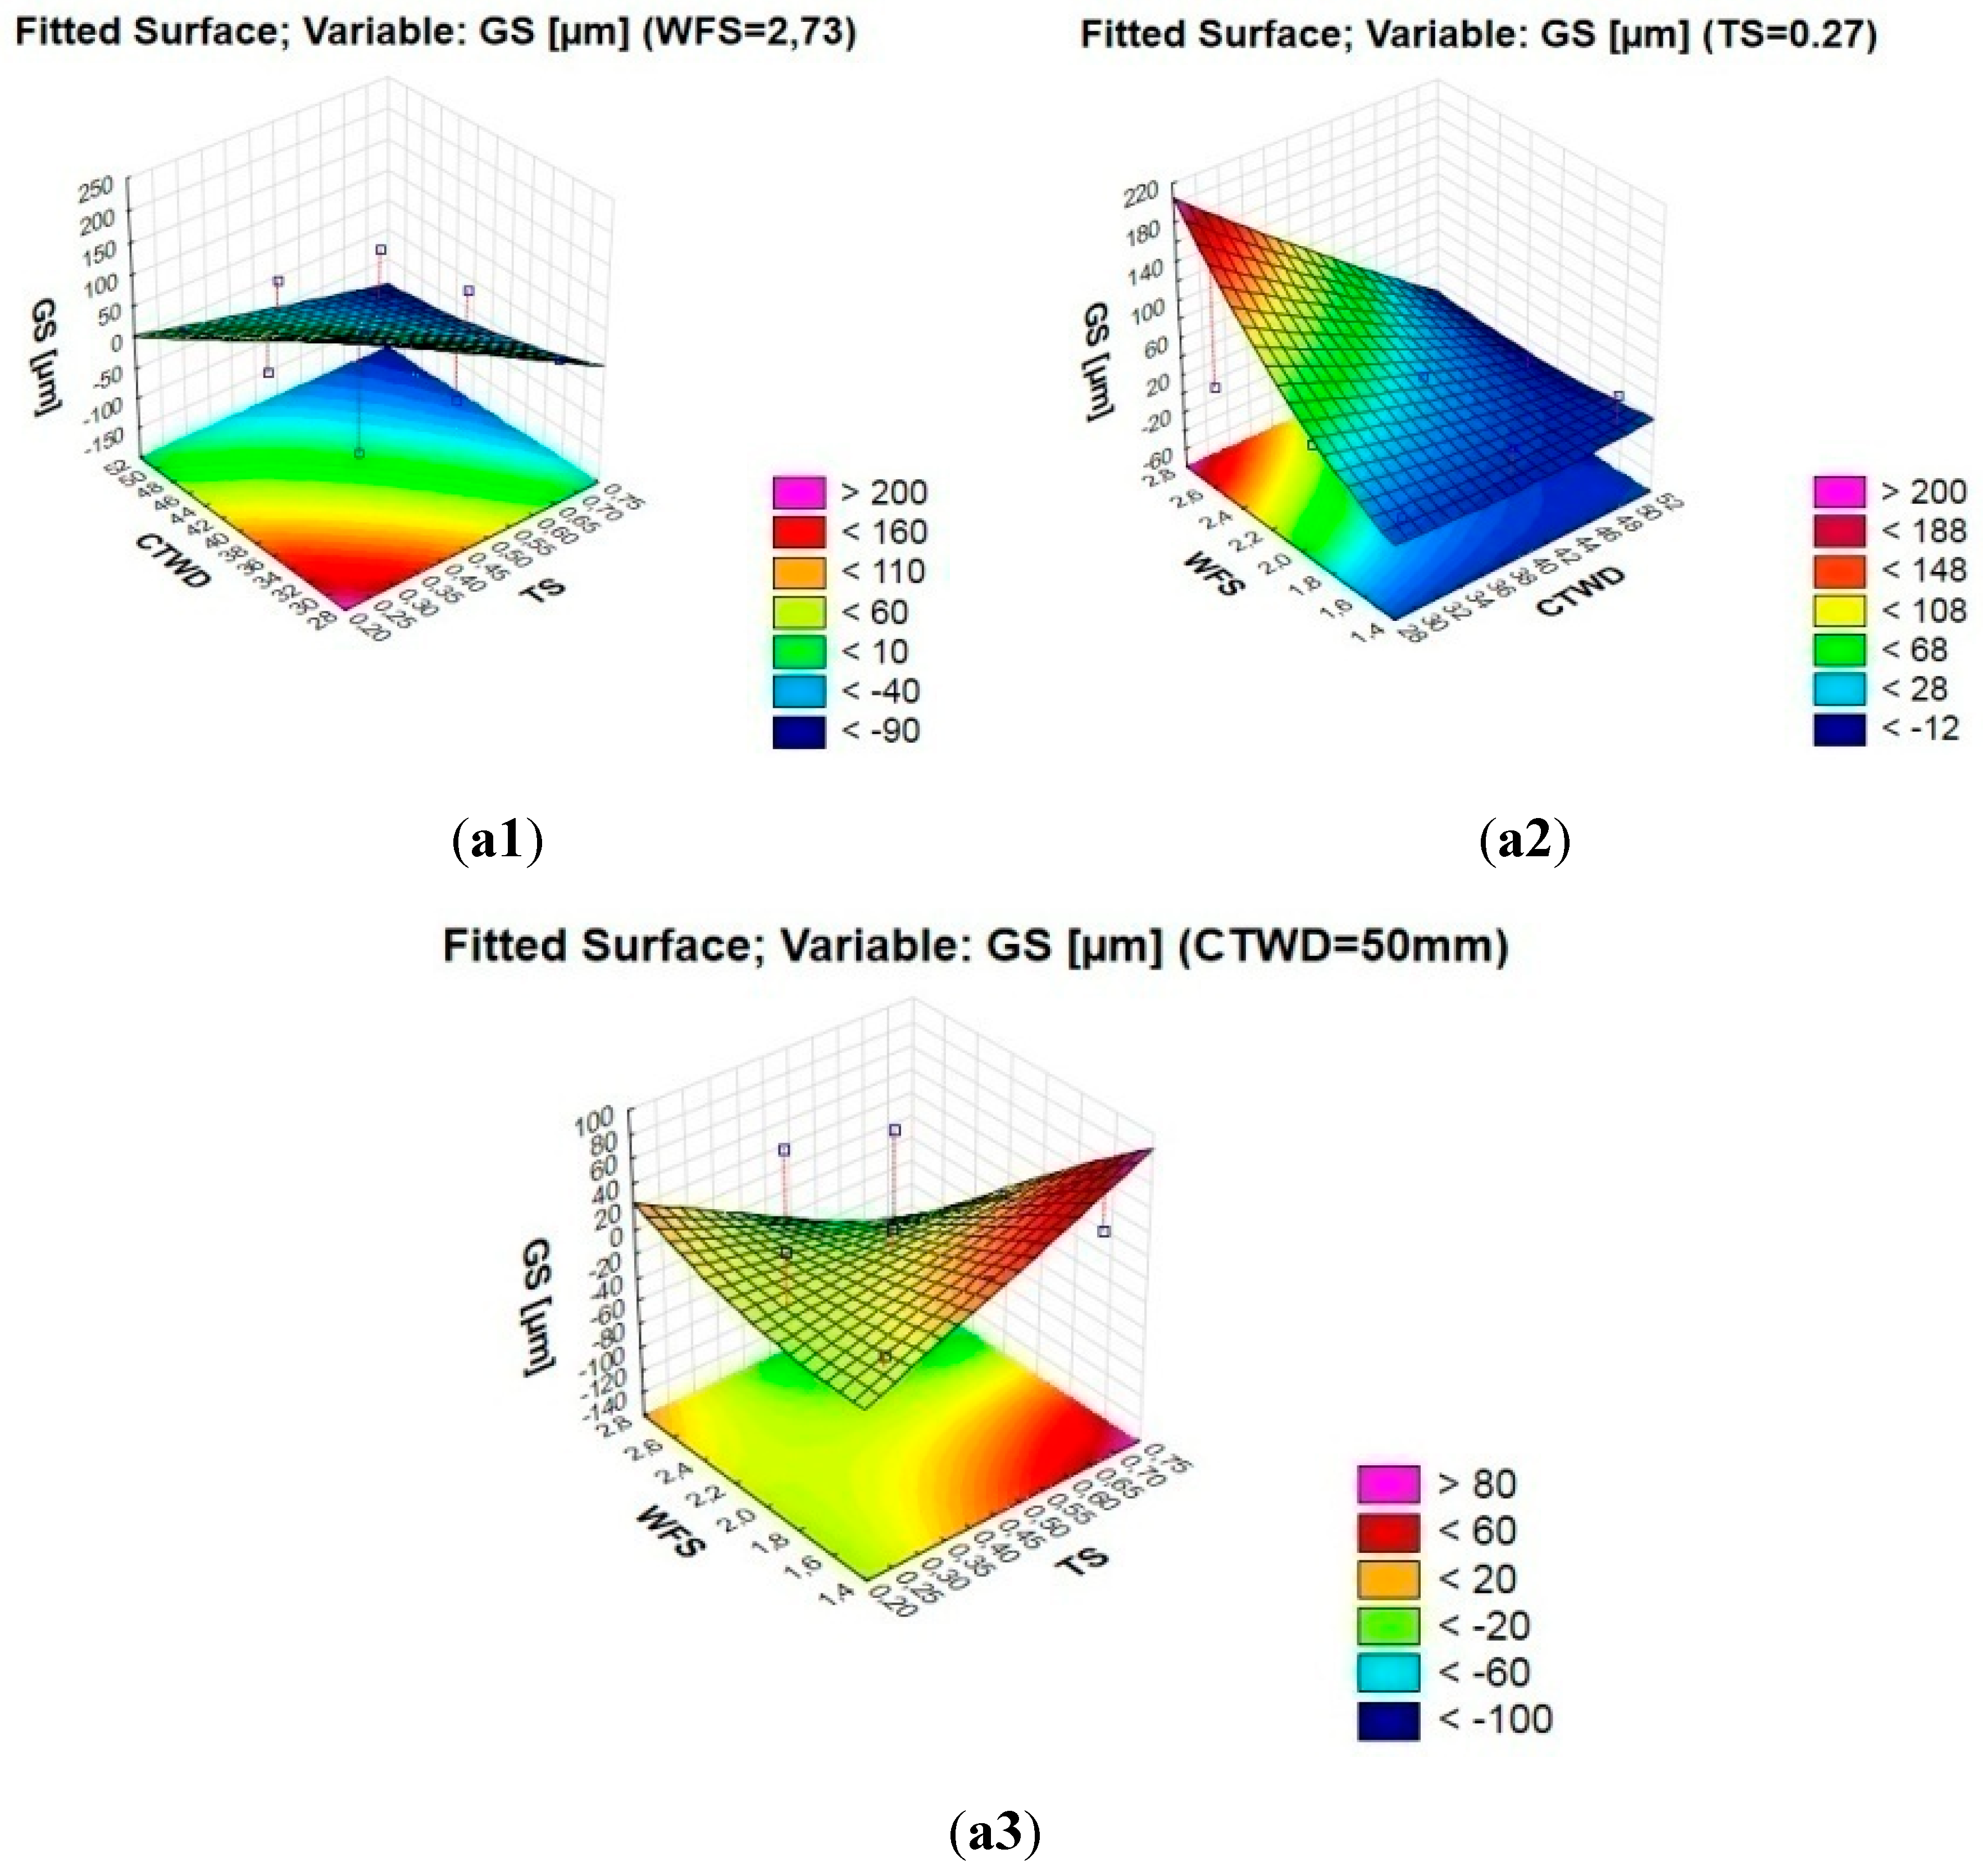
Figure 10.
Non-metallic inclusions in the deposited metal, ×200: (a) Exp.1, (b) Exp.2, (c) Exp.3, (d) Exp.4, (e) Exp.5, (f) Exp.6, (g) Exp.7, (h) Exp.8, (i) Exp.9.
Figure 10.
Non-metallic inclusions in the deposited metal, ×200: (a) Exp.1, (b) Exp.2, (c) Exp.3, (d) Exp.4, (e) Exp.5, (f) Exp.6, (g) Exp.7, (h) Exp.8, (i) Exp.9.
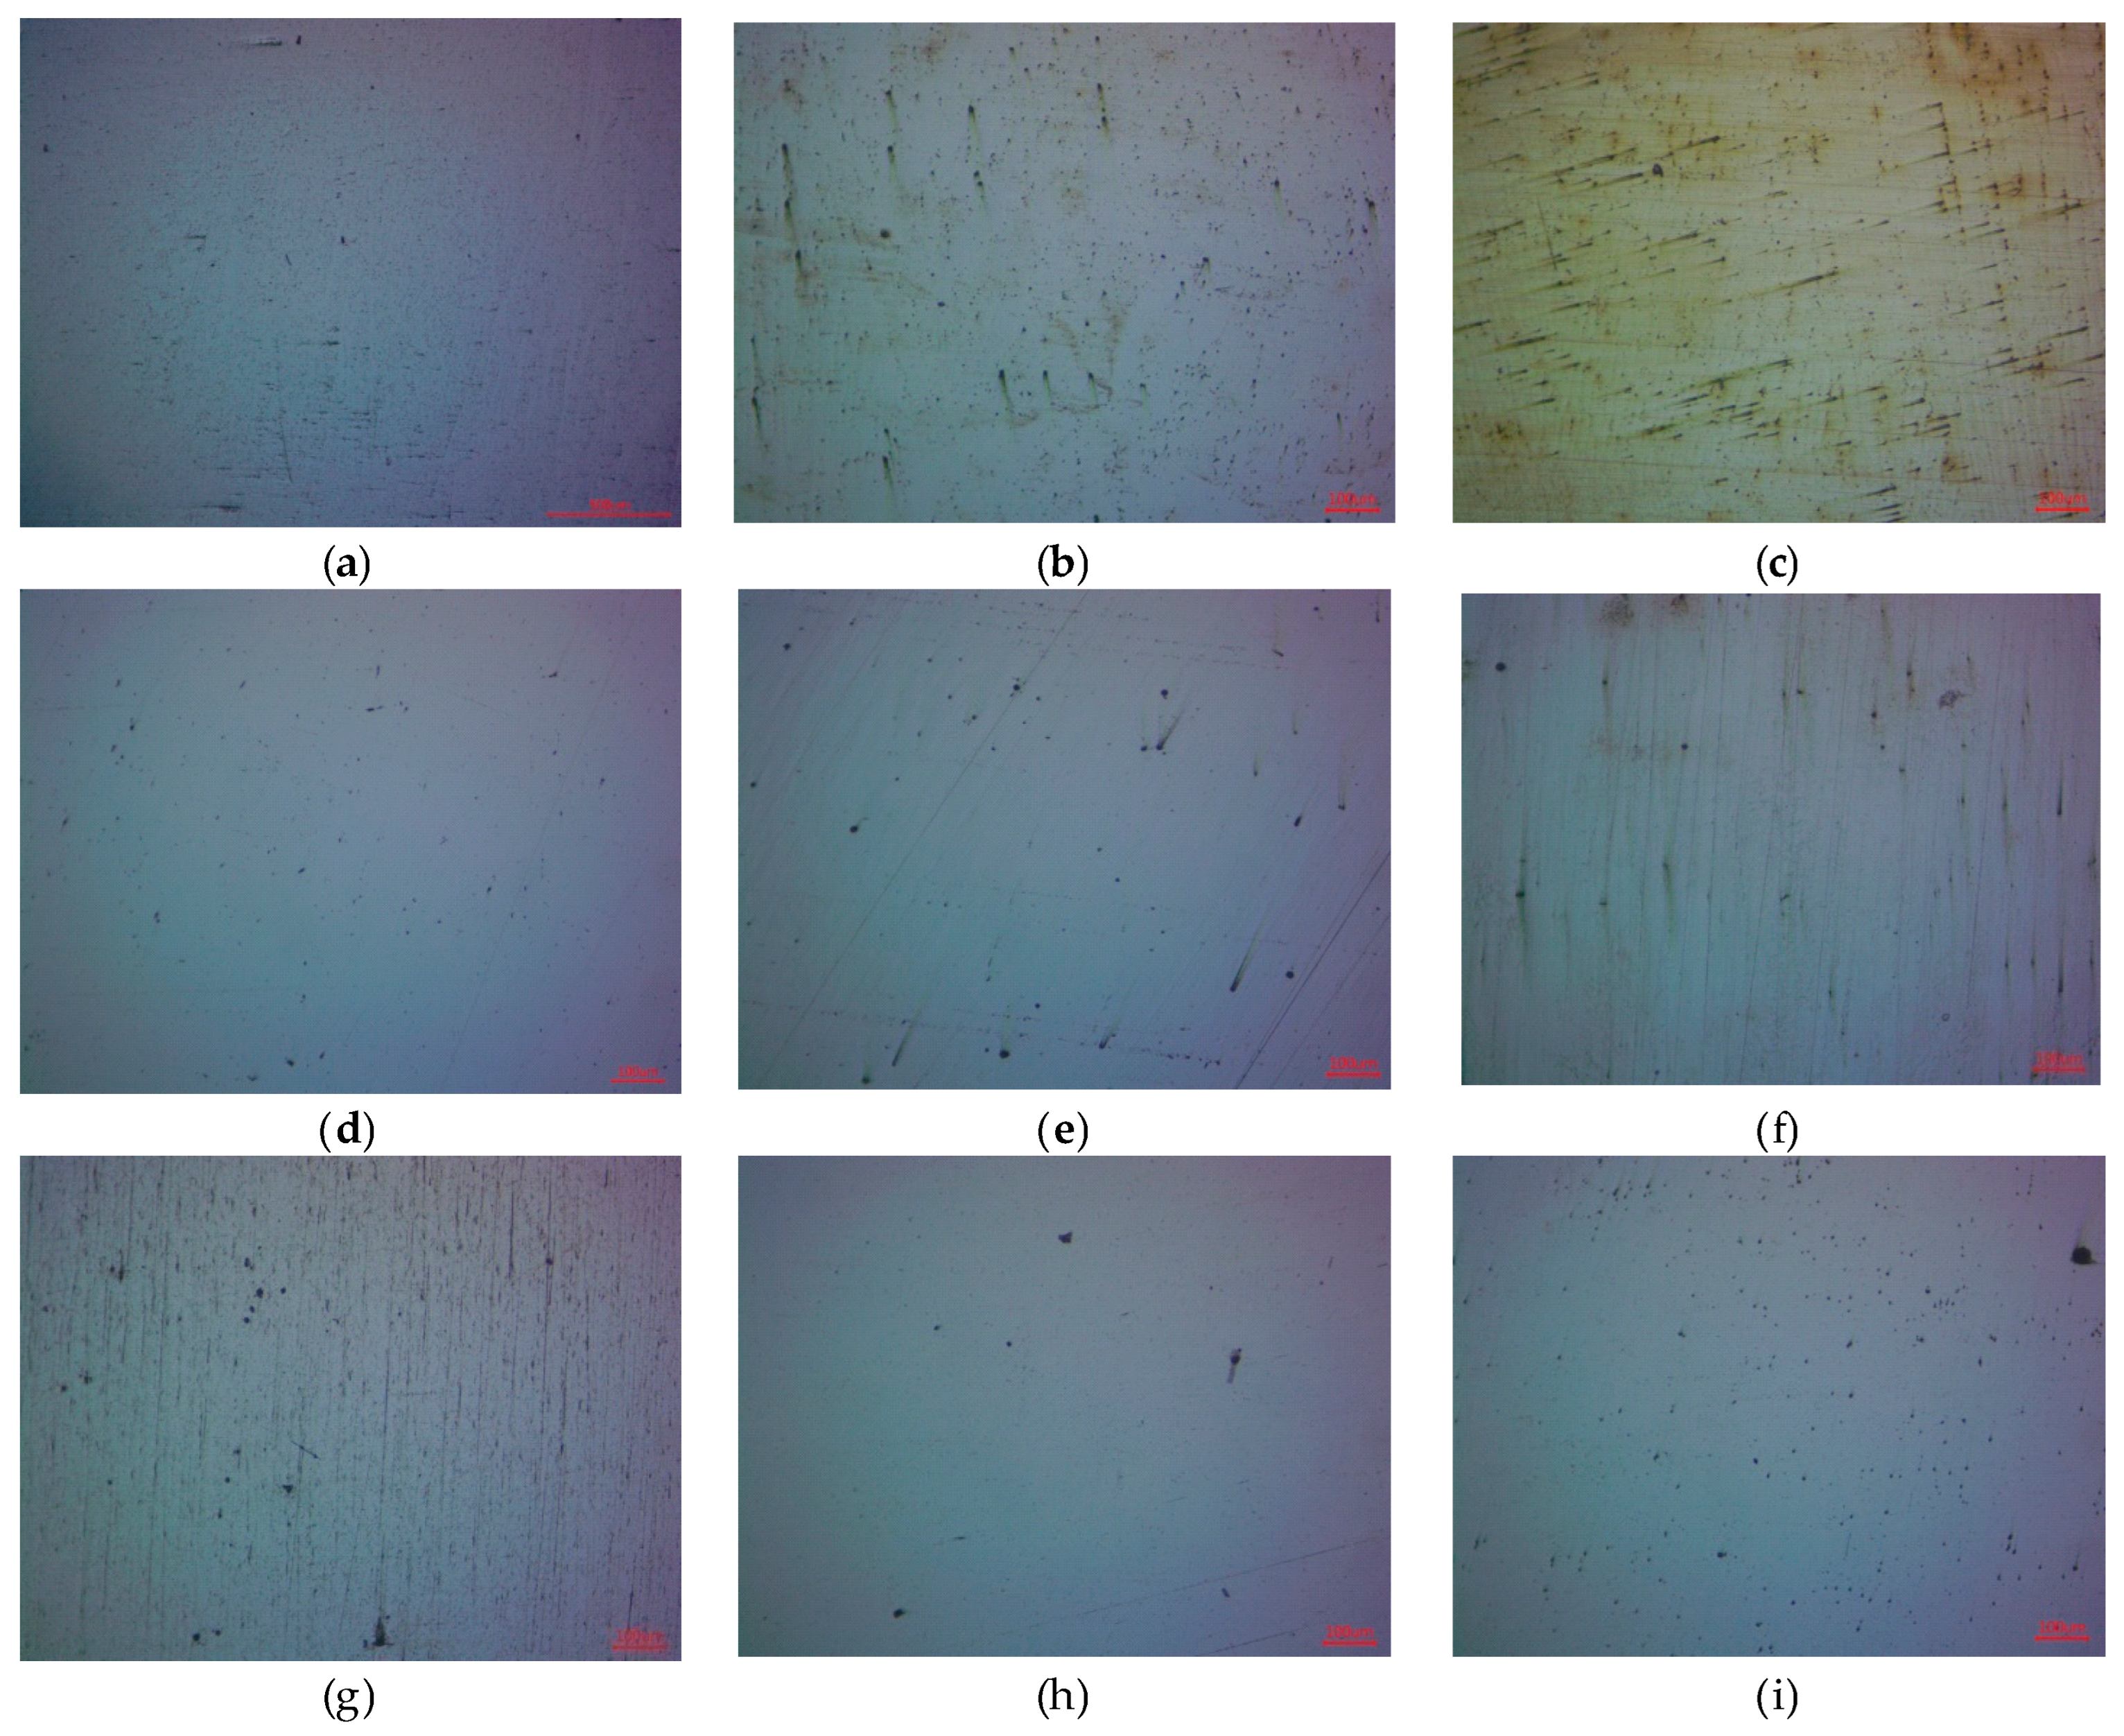
Figure 11.
Pie charts of the influence of hardfacing mode parameters on NMIs parameters: (a) number of NNMI; (b) average area of SNMI; (c) length of LLNMI and (d) average length of LNMI.
Figure 11.
Pie charts of the influence of hardfacing mode parameters on NMIs parameters: (a) number of NNMI; (b) average area of SNMI; (c) length of LLNMI and (d) average length of LNMI.
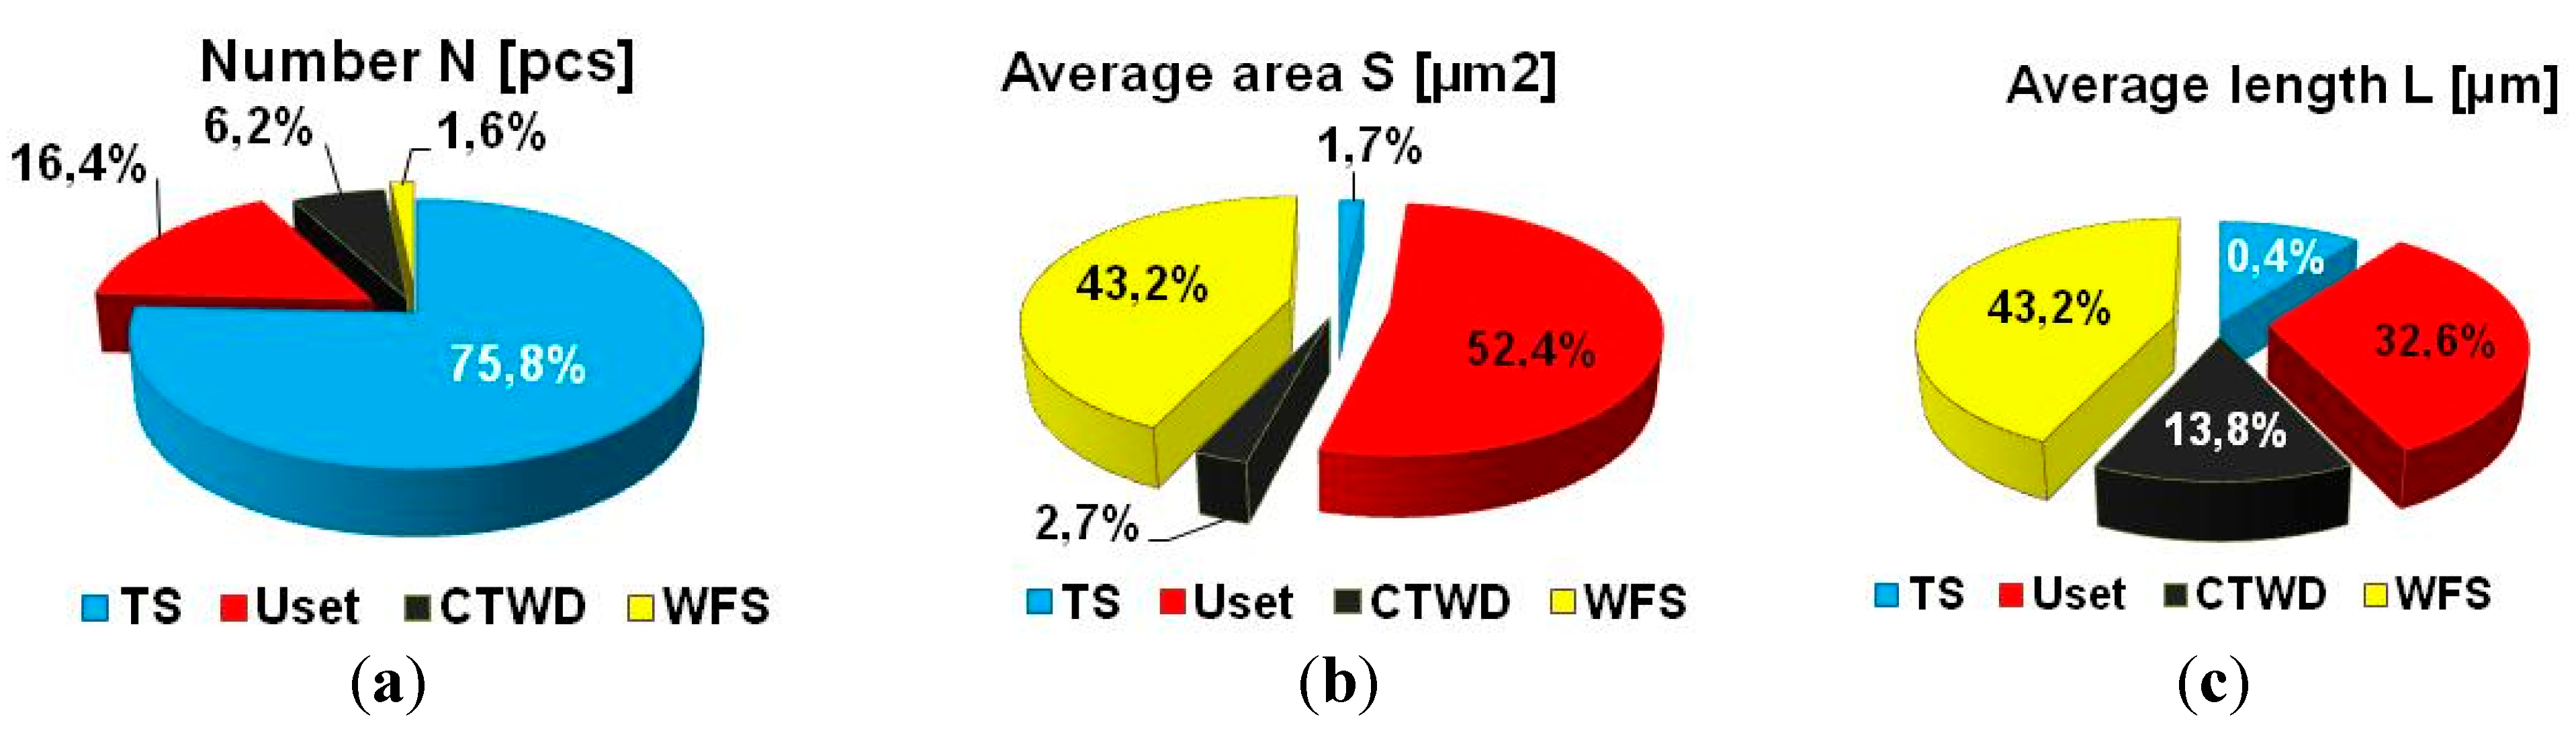
Figure 12.
Diagram of the main effects of the S/N ratio for the characteristics of non-metallic inclusions parameters: (a) number of NNMI; (b) average area of SNMI; (c) length of LLNMI and (d) average length of LNMI.
Figure 12.
Diagram of the main effects of the S/N ratio for the characteristics of non-metallic inclusions parameters: (a) number of NNMI; (b) average area of SNMI; (c) length of LLNMI and (d) average length of LNMI.
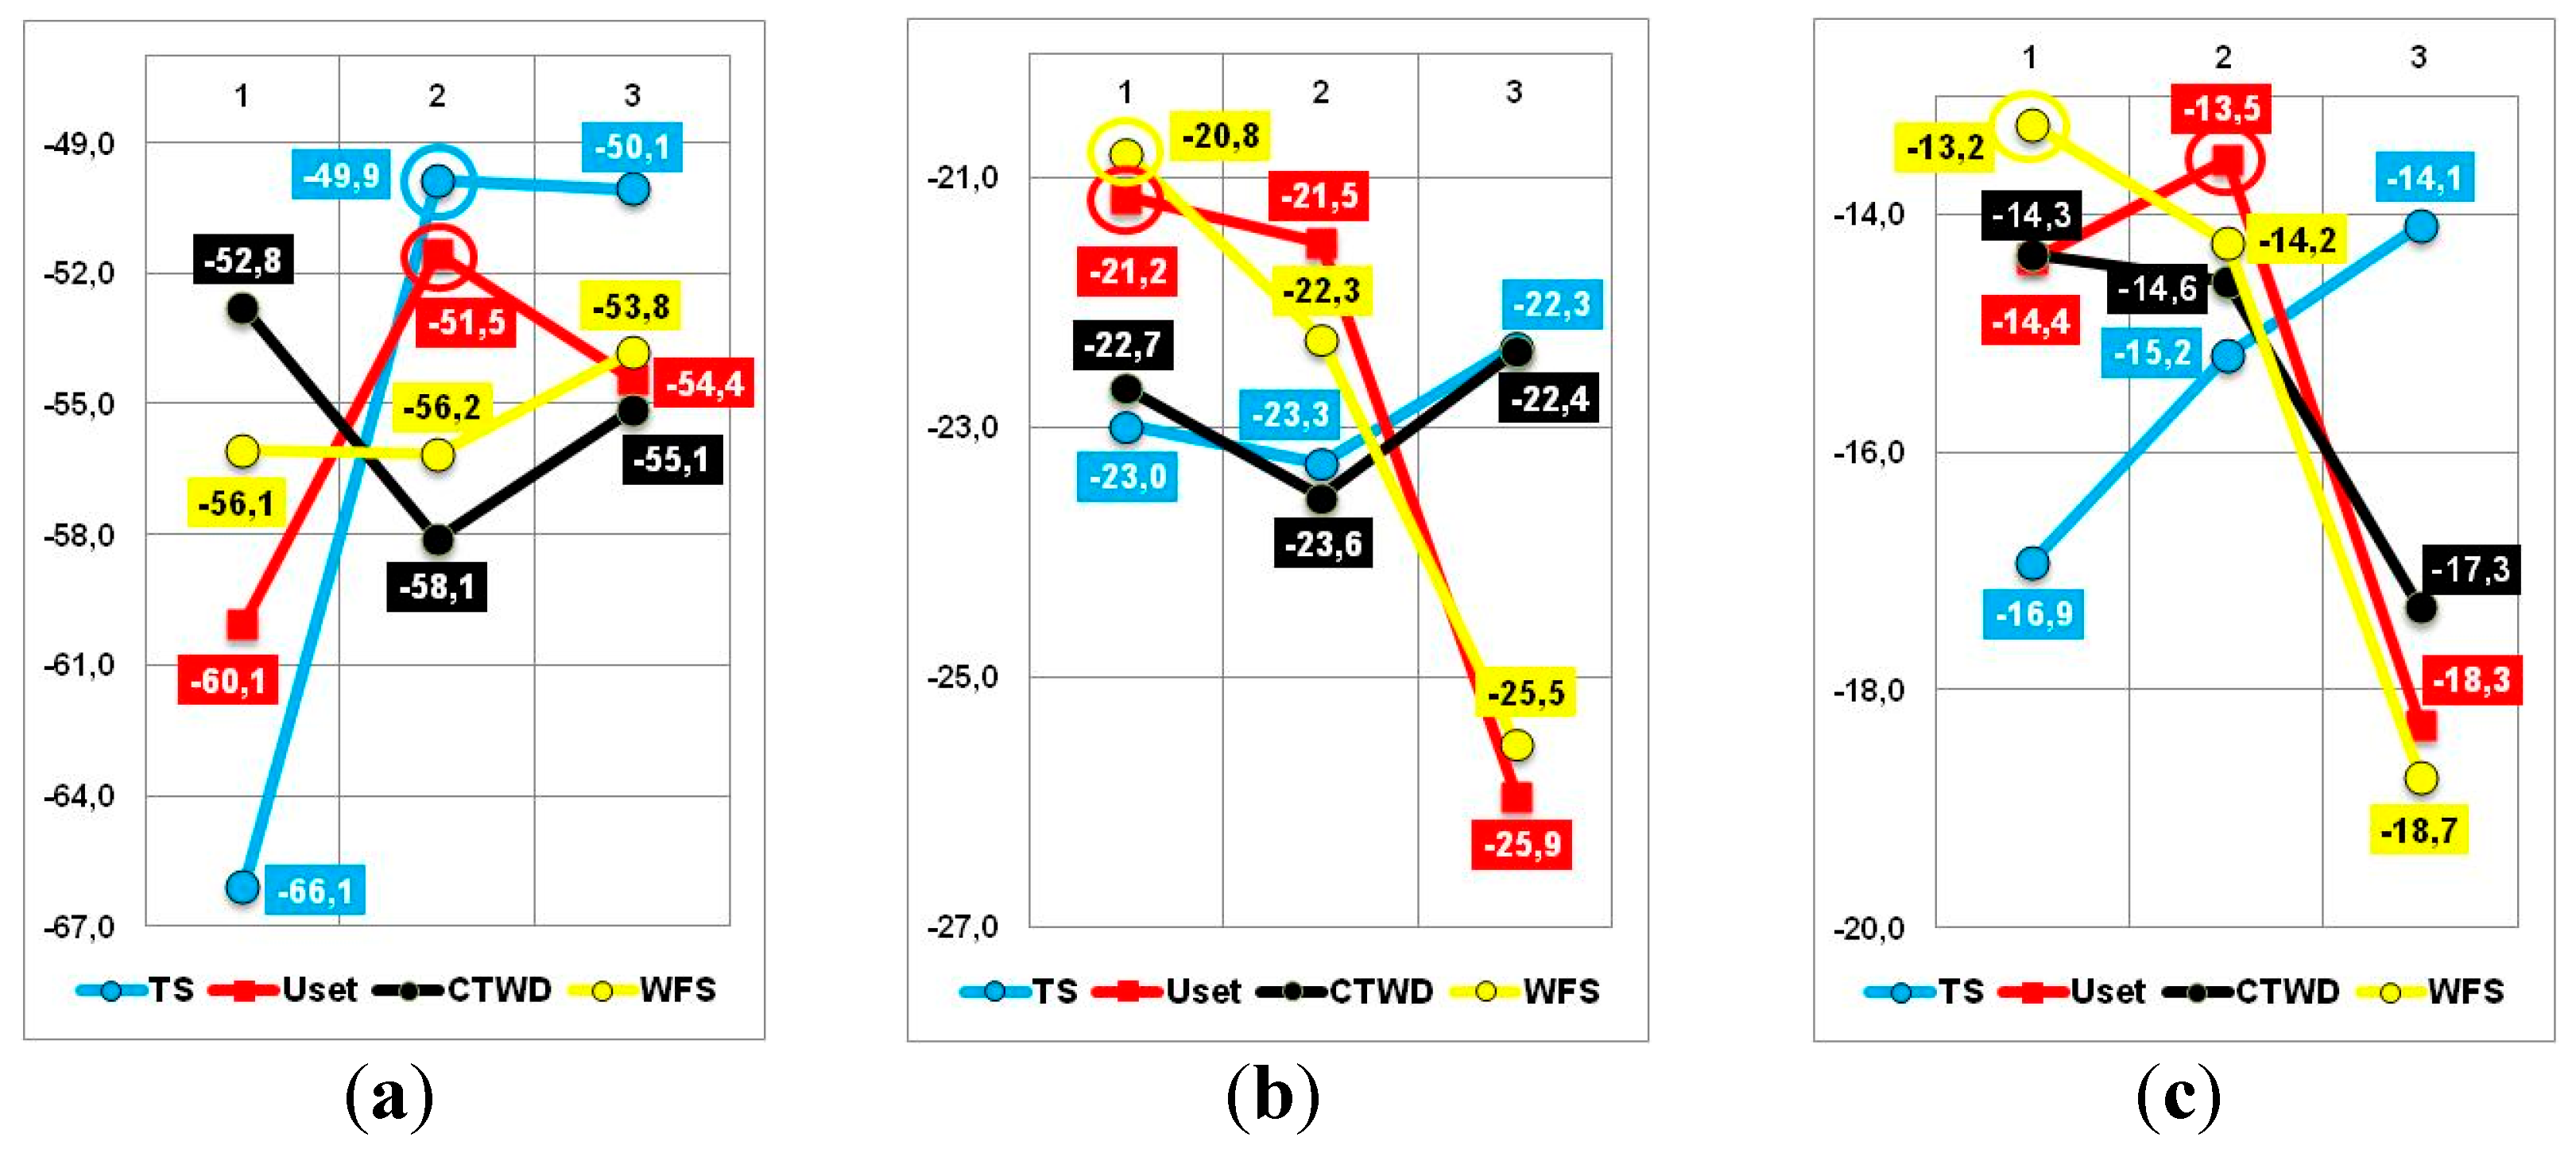
Figure 13.
Pareto charts: (a) number of NNMI; (b) average area of SNMI and (c) average length of LNMI.
Figure 13.
Pareto charts: (a) number of NNMI; (b) average area of SNMI and (c) average length of LNMI.
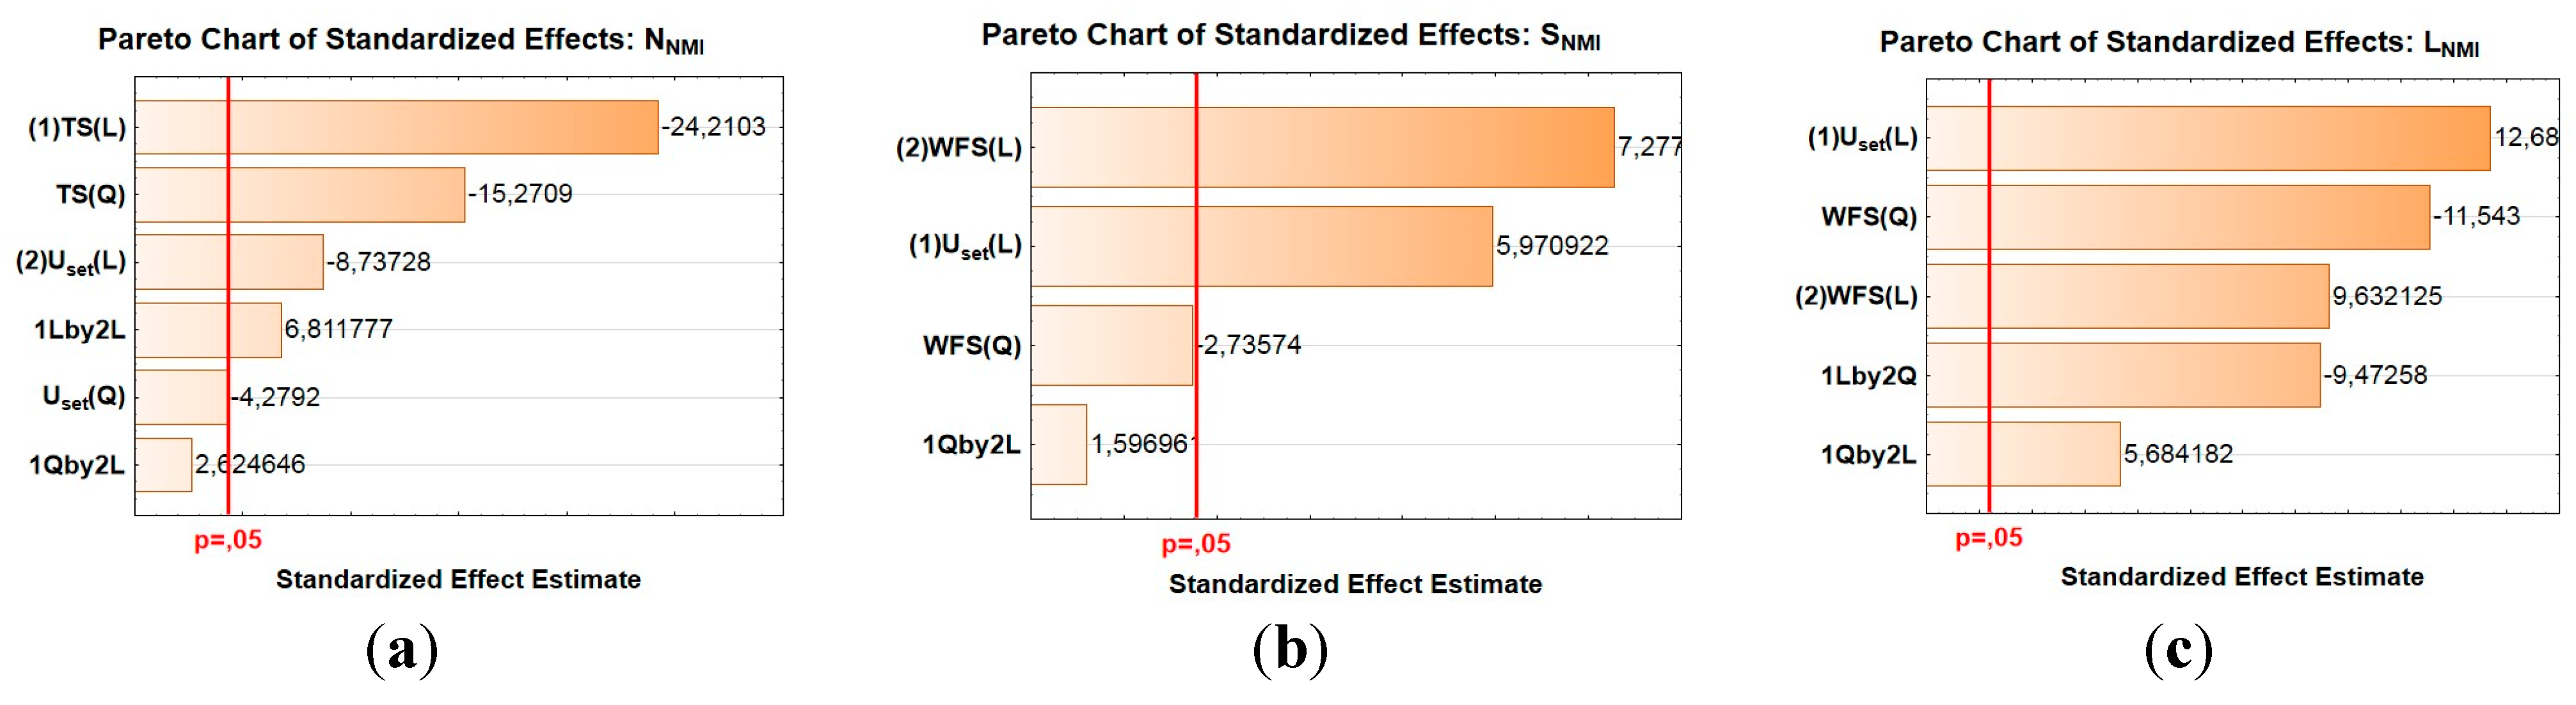
Figure 14.
Response surfaces of the mathematical model of the dependence of non-metallic inclusion morphology indicators: (a) number of NNMI; (b) average area of SNMI; (c) average length of LNMI.
Figure 14.
Response surfaces of the mathematical model of the dependence of non-metallic inclusion morphology indicators: (a) number of NNMI; (b) average area of SNMI; (c) average length of LNMI.
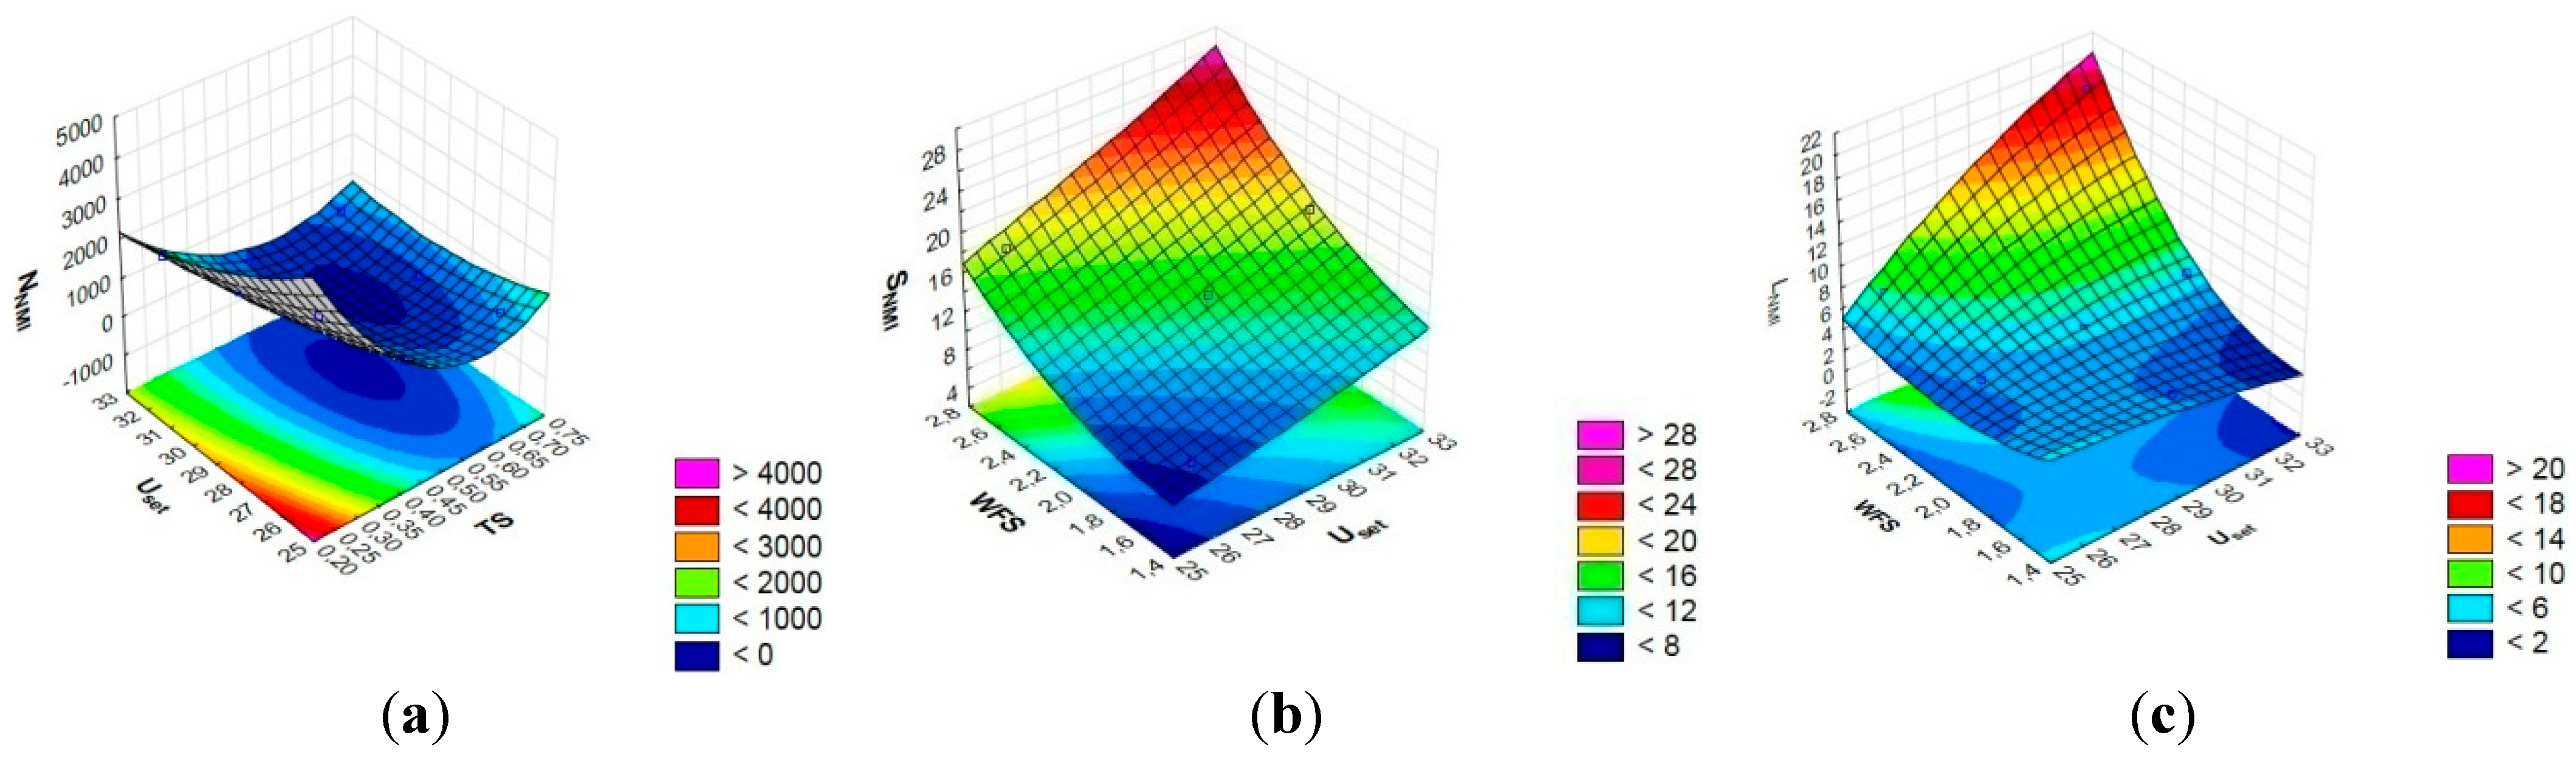
Figure 16.
Pareto chart (a) and observed and predicted values of the dependent variable (b) for Hardness HRA.
Figure 16.
Pareto chart (a) and observed and predicted values of the dependent variable (b) for Hardness HRA.
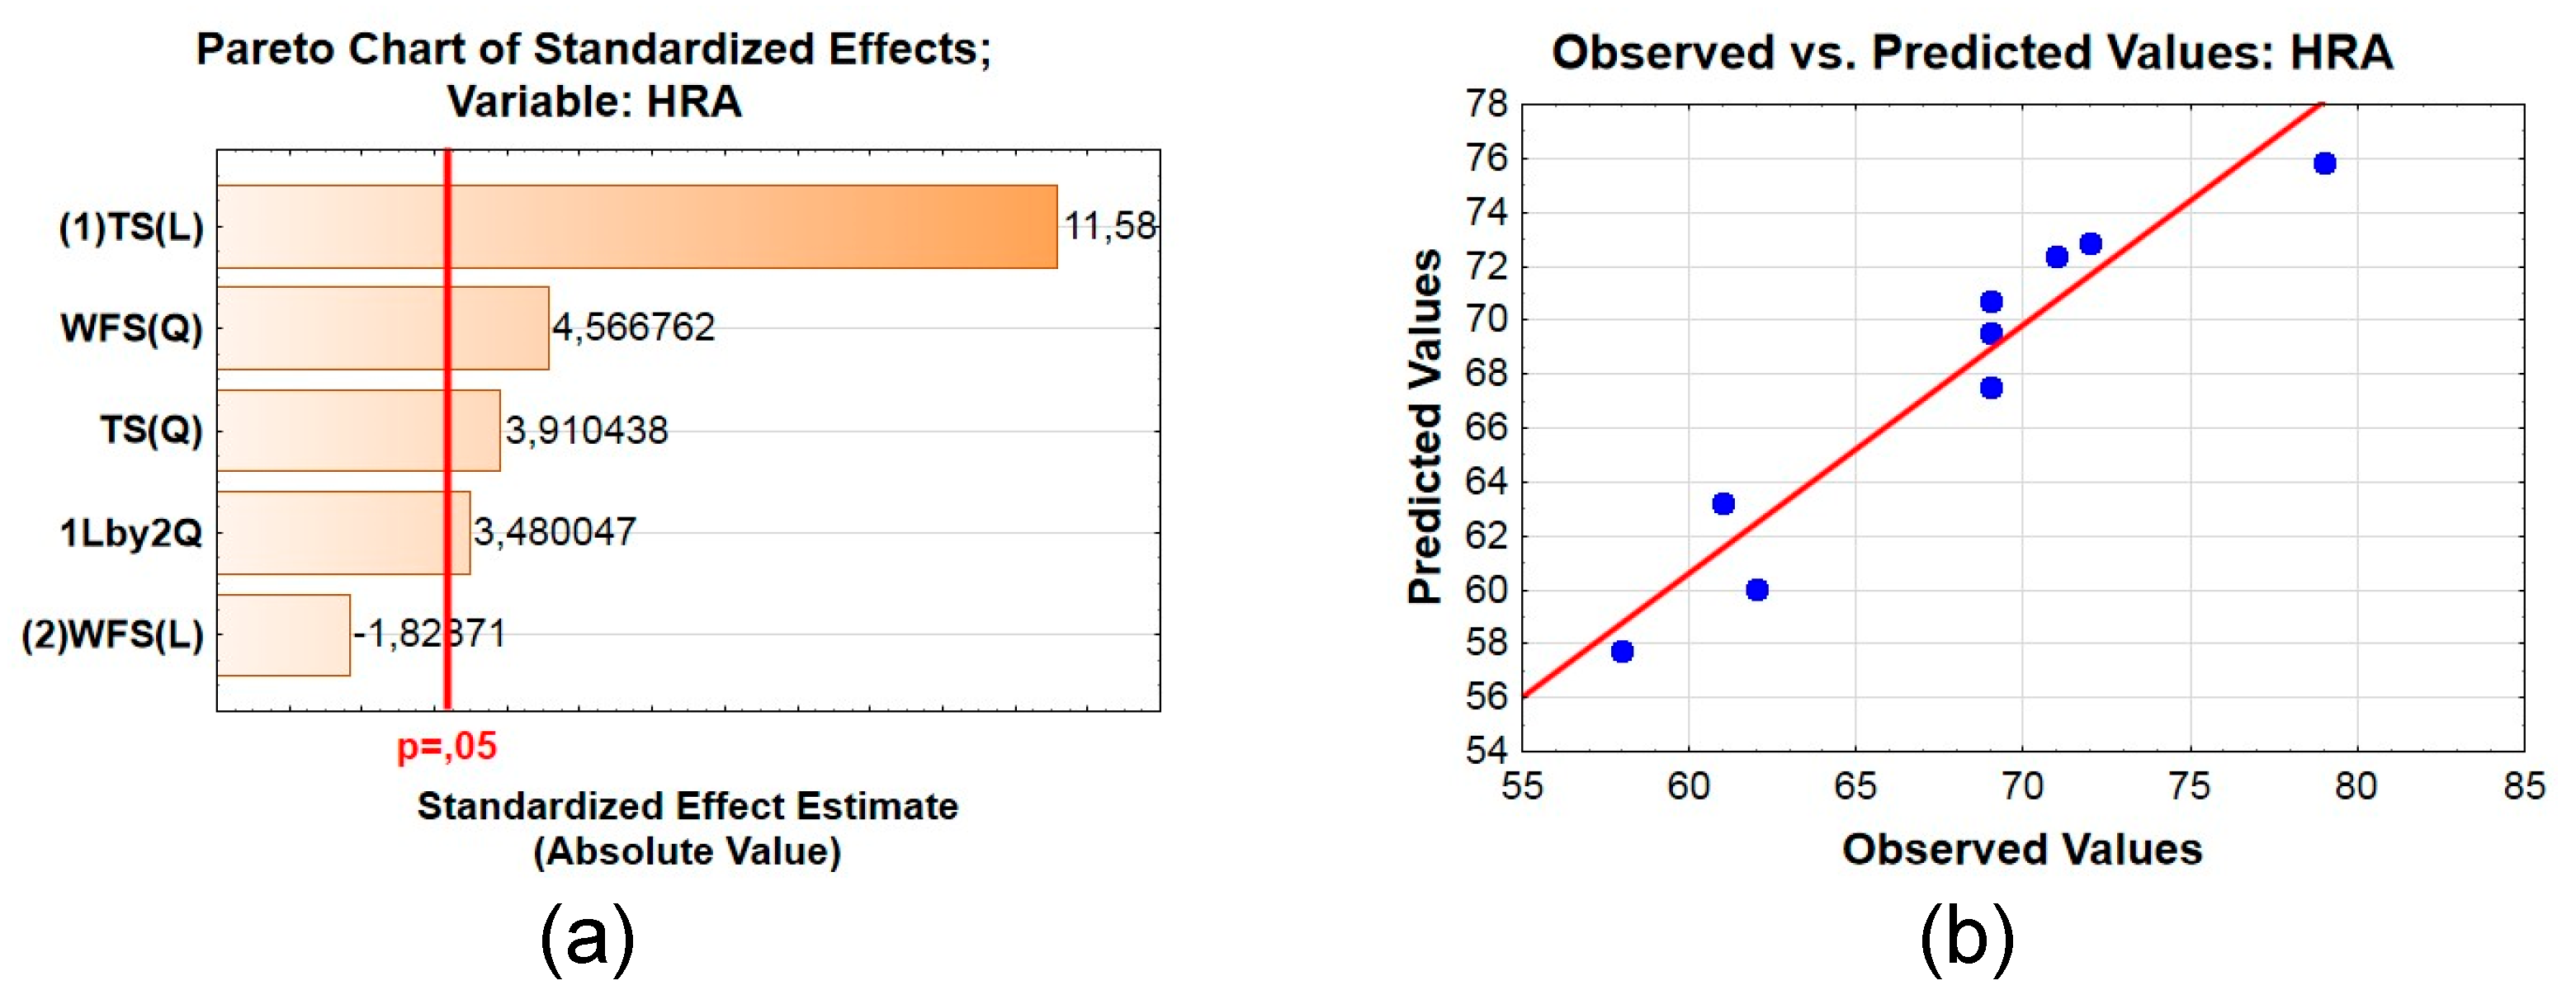
Figure 17.
The response surface of the mathematical model of the dependence of HRA hardness on hardfacing modes.
Figure 17.
The response surface of the mathematical model of the dependence of HRA hardness on hardfacing modes.
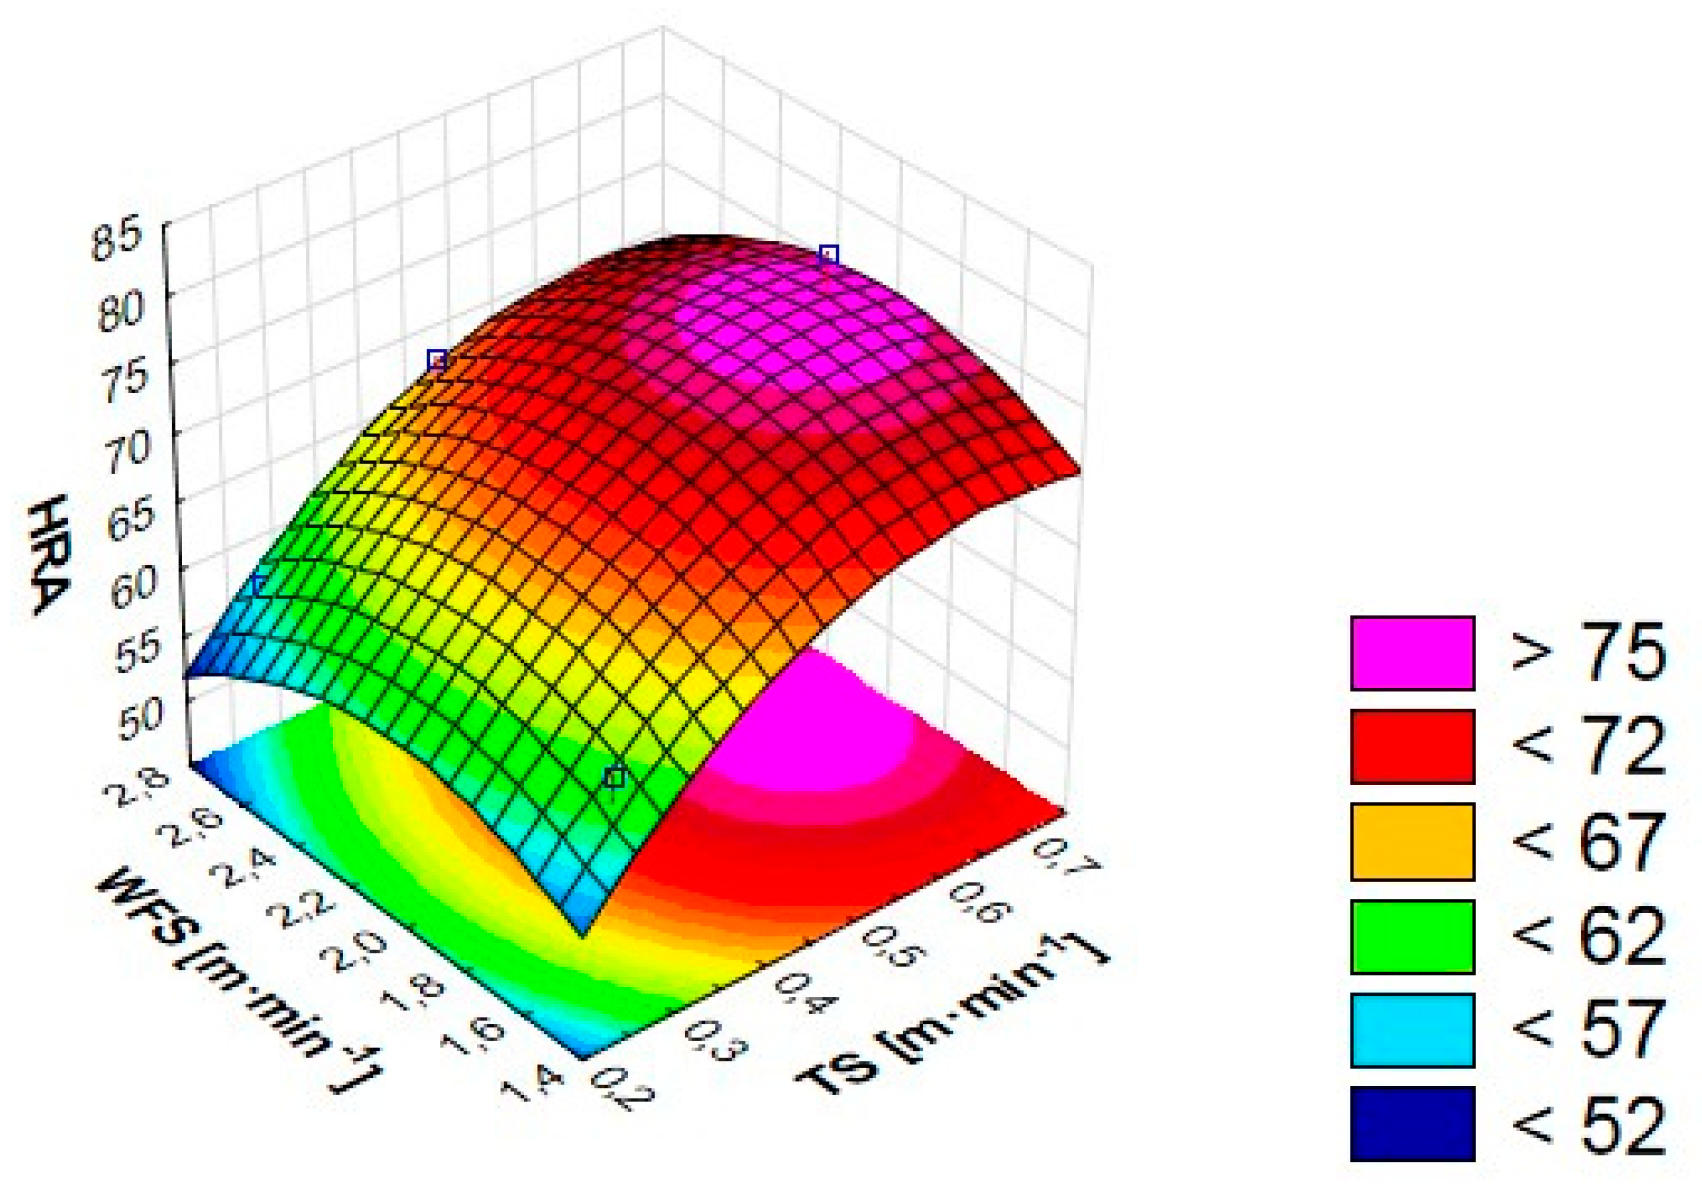
Table 1.
Composition of core filler FCAW-SS, wt.%.
| The name of the component | Content of the components in core filler of FCAW-S, [wt.%] |
|---|---|
| Gas-slag-forming components | |
| Fluorite concentrate GOST 4421-73 | 10 |
| Rutile concentrate GOST 22938-78 | 6 |
| Calcium carbonate GOST 8252-79 | 3 |
| Zirconium dioxide GOST 21907-76 | 3 |
| Components of exothermic addition | |
| Oxide of mangan powder-like GOST 4470-79 | 21 |
| Aluminum powder PA1 GOST 6058-73 | 9 |
| Alloying and deoxidizers | |
| Ferromanganese FMN-88A GOST 4755-91 | 20 |
| Ferrosilicon FS-92 GOST 1415-78 | 2 |
| Titanium powder PTM-3 TU 14-22-57-92 | 5 |
| Metal Chrome X99 GOST 5905-79 | 6.2 |
| Oxide of yttrium powder-like TU 48-4-524-80 | 1.6 |
| Graphite is silver | 7.6 |
| Iron powder PZhR-1 GOST 9849-86 | 5.6 |
Table 2.
Input variables selected and their levels.
| Code | Input variable(Factor) | Unit | Notation | Level | ||
|---|---|---|---|---|---|---|
| Low (-1) |
Average (0) |
High (+1) |
||||
| A | Travel speed | [m·min-1] | TS | 0.27 | 0.47 | 0.69 |
| B | Arc welding voltage | [V] | Uset | 26.0 | 29.2 | 32.5 |
| C | Contact tip to work distance | [mm] | CTWD | 30 | 40 | 50 |
| D | Wire feed speed | [m·min-1] | WFS | 1.50 | 2.07 | 2.73 |
Table 3.
Design matrix of the experiment of full factor analysis using the orthogonal array by the method.
Table 3.
Design matrix of the experiment of full factor analysis using the orthogonal array by the method.
| № | Code mean | Fact mean | ||||||
| Factor А | Factor В | Factor С | Factor D | TS, m·min-1 | Uset, V | CTWD, мм | WFS, m·min-1 | |
| 1 | 1 | 1 | 1 | 1 | 0.27 | 26.0 | 30 | 1.50 |
| 2 | 1 | 2 | 2 | 2 | 0.27 | 29.2 | 40 | 2.07 |
| 3 | 1 | 3 | 3 | 3 | 0.27 | 32.5 | 50 | 2.73 |
| 4 | 2 | 1 | 2 | 3 | 0.47 | 26.0 | 40 | 2.73 |
| 5 | 2 | 2 | 3 | 1 | 0.47 | 29.2 | 50 | 1.50 |
| 6 | 2 | 3 | 1 | 2 | 0.47 | 32.5 | 30 | 2.07 |
| 7 | 3 | 1 | 3 | 2 | 0.69 | 26.0 | 50 | 2.07 |
| 8 | 3 | 2 | 1 | 3 | 0.69 | 29.2 | 30 | 2.73 |
| 9 | 3 | 3 | 2 | 1 | 0.69 | 32.5 | 40 | 1.50 |
Table 7.
Experimental and calculated values of thermal cycle parameters.
| № | Heat Input | Heat input per area | ||||||
|---|---|---|---|---|---|---|---|---|
| HI (e) [kJ·mm-1] | HI (c) [kJ·mm-1] |
Diff. [kJ·mm-1] |
Dev. [%] |
Qar(e) [J·mm-3] |
Qar(e) [J·mm-3] |
Difference | Deviation [%] | |
| 1 | 15,08 | 2840,45 | -24,45 | -0,01 | 70,11 | 13,48 | -1,28 | -0,11 |
| 2 | 18,04 | 1922,85 | 48,15 | 0,02 | 83,90 | 26,21 | -0,41 | -0,02 |
| 3 | 25,51 | 1506,71 | -23,71 | -0,02 | 118,62 | 17,19 | 0,41 | 0,02 |
| 4 | 11,26 | 633,59 | -16,59 | -0,03 | 52,35 | 10,17 | -0,87 | -0,09 |
| 5 | 9,61 | 181,33 | 32,67 | 0,15 | 44,70 | 17,07 | 1,93 | 0,10 |
| 6 | 14,08 | 245,08 | -16,08 | -0,07 | 65,47 | 10,41 | -0,91 | -0,10 |
| 7 | 6,91 | 547,97 | 41,03 | 0,07 | 32,12 | 13,48 | 1,42 | 0,10 |
| 8 | 9,31 | 208,82 | -80,82 | -0,63 | 43,29 | 17,06 | -1,17 | -0,07 |
| 9 | 8,12 | 389,21 | 39,79 | 0,09 | 37,77 | 8,03 | 0,87 | 0,10 |
| № | Cooling time | Cooling time | ||||||
| Δt8/5 (e) [s] |
Δt8/5 (e) [s] |
Δt8/5 (e) [s] |
Δt8/5 (e) [s] |
CR (e) | CR (c) | Diff. | Dev. | |
| 1 | 70,11 | 70,11 | 70,11 | 70,11 | 4,28 | 4,81 | -0,51 | -0,20 |
| 2 | 83,90 | 83,90 | 83,90 | 83,90 | 3,58 | 5,40 | -0,90 | 0,01 |
| 3 | 118,62 | 118,62 | 118,62 | 118,62 | 2,53 | 17,74 | 0,16 | -0,02 |
| 4 | 52,35 | 52,35 | 52,35 | 52,35 | 5,73 | 6,96 | -0,16 | 0,11 |
| 5 | 44,70 | 44,70 | 44,70 | 44,70 | 6,71 | 3,99 | 0,51 | 0,10 |
| 6 | 65,47 | 65,47 | 65,47 | 65,47 | 4,58 | 5,56 | 0,64 | 0,19 |
| 7 | 32,12 | 32,12 | 32,12 | 32,12 | 9,34 | 3,98 | 0,92 | -0,02 |
| 8 | 43,29 | 43,29 | 43,29 | 43,29 | 6,93 | 5,40 | -0,10 | -0,11 |
| 9 | 37,77 | 37,77 | 37,77 | 37,77 | 7,94 | 5,56 | -0,56 | -0,12 |
| The indices on the right side of the geometric parameter notation mean that: (e) - experimental values (c) - calculated values obtained by introducing the corresponding values of variables into the developed mathematical models. | ||||||||
Table 8.
Result of analysis of variance for the applied models on thermal cycle parameters.
| Parameter | Source | Adjusted Sum of Square (SS) | Degree of Freedom (df) | Adjusted Mean Square (MS) | F-Value | p-Value |
|---|---|---|---|---|---|---|
| Heat input per area Qar | Model | 1131,290 | 4 | 282,8224 | 4,016757 | 0,103360 |
| Total Error | 281,643 | 4 | 70,4106 | - | - | |
| Total Adjusted | 1412,932 | 8 | 176,6165 | - | - | |
| CoolingrateCR | Model | 39,86240 | 4 | 9,965601 | 6,326263 | 0,065692 |
| Total Error | 17,90334 | 4 | 4,475835 | - | - | |
| Total Adjusted | 57,76575 | 8 | 7,220718 | - | - | |
| CoolingtimeΔt8/5 | Model | 1,695558 | 4 | 0,423889 | 7,492063 | 0,052057 |
| Total Error | 0,612885 | 4 | 0,153221 | - | - | |
| Total Adjusted | 2,308443 | 8 | 0,288555 | - | - |
Table 4.
Grain morphology of the studied samples of deposited metal.
| No. | Number of grains | Grain size [μm] | ||
|---|---|---|---|---|
| Average | Minimum | Maximum | ||
| 1 | 1291 | 5,1 | 0,9 | 86,1 |
| 2 | 30 | 35,3 | 7,9 | 133,8 |
| 3 | 765 | 0,9 | 63,5 | 5,2 |
| 4 | 31 | 27,1 | 7,1 | 79,9 |
| 5 | 30 | 24,4 | 8,2 | 57,4 |
| 6 | 31 | 16,8 | 7,0 | 31,9 |
| 7 | 1009 | 3,5 | 0,9 | 31,3 |
| 8 | 1421 | 3,5 | 0,9 | 26,6 |
| 9 | 31 | 22,5 | 8,1 | 51,1 |
Table 5.
Experimental (e) and calculated (c) values of grain size.
| № | Grain size (GS) | |||
| GS (e)[μm] | GS (c)[μm] | Diff. | Dev. | |
| 1 | 5,10 | 4,92 | 0,18 | 0,04 |
| 2 | 35,30 | 24,24 | 11,06 | 0,31 |
| 3 | 0,90 | 5,57 | -4,67 | -5,19 |
| 4 | 27,10 | 23,01 | 4,09 | 0,15 |
| 5 | 24,40 | 27,71 | -3,31 | -0,14 |
| 6 | 16,80 | 27,85 | -11,05 | -0,66 |
| 7 | 3,50 | 3,52 | -0,02 | -0,01 |
| 8 | 3,50 | 2,92 | 0,58 | 0,17 |
| 9 | 22,50 | 19,37 | 3,13 | 0,14 |
Table 6.
Characteristics of non-metallic inclusions in the deposited metal.
| No. | Number of NMIs | Average Area, µm² | Average Perimeter, µm | Length, µm | ||
| Average | Min | Max | ||||
| 1 | 2816 | 8,9 | 11,6 | 4,3 | 81,2 | 115,9 |
| 2 | 1971 | 12,2 | 13,4 | 4,5 | 0,9 | 110,8 |
| 3 | 1483 | 25,8 | 77,9 | 17,9 | 1,1 | 555,0 |
| 4 | 617 | 17,6 | 19,9 | 6,8 | 1,2 | 67,2 |
| 5 | 214 | 9,3 | 12,3 | 4,5 | 1,1 | 21,1 |
| 6 | 229 | 19,0 | 18,5 | 6,2 | 1,2 | 118,7 |
| 7 | 589 | 9,5 | 12,9 | 4,9 | 1,2 | 109,4 |
| 8 | 128 | 14,9 | 14,1 | 5,3 | 1,2 | 39,4 |
| 9 | 429 | 15,9 | 14,1 | 5,0 | 1,2 | 59,0 |
Table 7.
Morphological characteristics of non-metallic inclusions in deposited metal samples that have been deposited under different modes of deposition.
Table 7.
Morphological characteristics of non-metallic inclusions in deposited metal samples that have been deposited under different modes of deposition.
| № | Number NNMI | Averagearea SNMI | ||||||
| NNMI(e) [pcs] | NNMI(c)[pcs] | Diff.[pcs] | Dev. | SNMI(e) [µm2] | SNMI(c) [µm2] | Diff.[µm2] | Dev. | |
| 1 | 2816 | 2840,45 | -24,45 | -0,01 | 12,2 | 13,48 | -1,28 | -0,11 |
| 2 | 1971 | 1922,85 | 48,15 | 0,02 | 25,8 | 26,21 | -0,41 | -0,02 |
| 3 | 1483 | 1506,71 | -23,71 | -0,02 | 17,6 | 17,19 | 0,41 | 0,02 |
| 4 | 617 | 633,59 | -16,59 | -0,03 | 9,3 | 10,17 | -0,87 | -0,09 |
| 5 | 214 | 181,33 | 32,67 | 0,15 | 19,0 | 17,07 | 1,93 | 0,10 |
| 6 | 229 | 245,08 | -16,08 | -0,07 | 9,5 | 10,41 | -0,91 | -0,10 |
| 7 | 589 | 547,97 | 41,03 | 0,07 | 14,9 | 13,48 | 1,42 | 0,10 |
| 8 | 128 | 208,82 | -80,82 | -0,63 | 15,9 | 17,06 | -1,17 | -0,07 |
| 9 | 429 | 389,21 | 39,79 | 0,09 | 8,9 | 8,03 | 0,87 | 0,10 |
| № | Maximumlength | Averagelength | ||||||
| LLNMI(e) [µm] | LLNMI(c)[µm] | Diff.[µm] | Dev. | LNMI(e)[µm] | LNMI(c)[µm] | Diff. | Dev. | |
| 1 | 115,9 | 112,71 | 3,19 | 0,03 | 4,30 | 4,81 | -0,51 | -0,20 |
| 2 | 110,8 | 111,26 | -0,46 | -0,00 | 4,50 | 5,40 | -0,90 | 0,01 |
| 3 | 555,0 | 555,19 | -0,19 | 0,00 | 17,90 | 17,74 | 0,16 | -0,02 |
| 4 | 67,2 | 67,01 | 0,19 | 0,00 | 6,80 | 6,96 | -0,16 | 0,11 |
| 5 | 21,1 | 24,29 | -3,19 | -0,15 | 4,50 | 3,99 | 0,51 | 0,10 |
| 6 | 118,7 | 119,68 | -0,98 | -0,01 | 6,20 | 5,56 | 0,64 | 0,19 |
| 7 | 109,4 | 95,86 | 13,54 | 0,12 | 4,90 | 3,98 | 0,92 | -0,02 |
| 8 | 39,4 | 69,07 | -29,67 | -0,75 | 5,30 | 5,40 | -0,10 | -0,11 |
| 9 | 59,0 | 41,44 | 17,56 | 0,30 | 5,00 | 5,56 | -0,56 | -0,12 |
Disclaimer/Publisher’s Note: The statements, opinions and data contained in all publications are solely those of the individual author(s) and contributor(s) and not of MDPI and/or the editor(s). MDPI and/or the editor(s) disclaim responsibility for any injury to people or property resulting from any ideas, methods, instructions or products referred to in the content. |
© 2025 by the authors. Licensee MDPI, Basel, Switzerland. This article is an open access article distributed under the terms and conditions of the Creative Commons Attribution (CC BY) license (http://creativecommons.org/licenses/by/4.0/).
Copyright: This open access article is published under a Creative Commons CC BY 4.0 license, which permit the free download, distribution, and reuse, provided that the author and preprint are cited in any reuse.


