Introduction
Attention Deficit/Hyperactivity Disorder (ADHD) is a neurodevelopmental disorder that affects 7–11% of school-age children, and 60–70% of these cases persist into adulthood (Burke et al., 2014; Danielson et al., 2018). ADHD is characterized by poor planning and memory with increased impulsivity, inattention, and hyperactivity (Brock et al., 2009). The average age of diagnosis for ADHD is 7 years old, though advances in assessment have allowed diagnosis to occur as early as preschool age. The spectrum of ADHD consists of three clusters of traits grouped into subtypes (e.g., inattentive, hyperactive, and combined) descriptive of different dominant behavioral dysregulation (Barnard et al., 2010; Rowland et al., 2015; Scahill & Schwab-Stone, 2000; Thomas et al., 2015).
Despite advances in treatment, there is much to learn about individual differences in the neural circuitry that underly the broader ADHD phenotype. Early diagnoses primarily occur in children with the most severe symptoms—typically males with the hyperactive subtype—neglecting female children, children with the inattentive or combined subtype, and children with less severe symptoms. Furthermore, males with ADHD are more likely to have comorbid learning disabilities, disruptive behavior, social dysfunction, and depression, whereas females have an increased rate of substance use disorders, anxiety, and depression, and are twice as likely to have the inattentive subtype of the disorder (Gilbert et. al., 2023; Yoshimasu et al., 2012). In addition, women with ADHD are more likely to be diagnosed in adulthood rather than in childhood, whereas men are more likely to be diagnosed in childhood and to present with the hyperactive subtype (Barnard et al., 2010). Moreover, males are twice (10%) as likely compared to females (5%) to be diagnosed with ADHD overall (Ayano et. al., 2023). These discrepancies lead to systemic long-term issues such as inequivalences in who receives treatment and who does not (Martin, 2024; Skoglund et. al., 2024).
Not only do these limitations exist in the clinic, but they are also present in research.
Specifically, idiosyncrasies in symptom severity, referral, sex specific prevalence rates, and subtype have also been largely neglected in research surrounding the neural ontogeny of this disorder (Arnett et al., 2015; Biederman et al., 2002). Despite this, few research studies consider subtypes and subtype trait characteristics spanning the ADHD phenotype in their analysis of intersections between cognitive processing and neural substrates underlying this process. Traditionally, neuroimaging work has been done with male children or adults who have the hyperactive subtype, even though this group represents just 50% of the clinical phenotype (Willcutt, 2012) with another source showing that the inattentive subtype is actually the most common subtype (Ayano et. al., 2023). Only recently has the field begun to explore sex and subtype, as well as symptom severity, at the neural level for ADHD (Park & Park, 2016; Rosch et. al., 2018). As a result, the role of sex differences in the emergence of ADHD in early childhood is muddied by underrepresentation in the samples, in part due to larger systemic issues already discussed, but also in part due to the research available on those children that might initially be missed in the clinic. These discrepancies are not isolated to clinical practice; the current parental identification and subsequent clinical referral problem for girls and women with ADHD, specifically, is also perpetuated by societal norms for appropriate behavior prior to school age (Cho et. al., 2024; Mowlem et al., 2019; Murray et al., 2019).
A review of recent literature demonstrates that the basis of this study is still present and necessary. More studies are advancing and promoting the idea of studying sex differences within ADHD, especially related to neural correlates of ADHD, but these results are lacking conclusive results. One study using diffusion tensor imaging and a battery of Go/No-Go tasks showed that females with ADHD had higher fractional anisotropy (white matter microstructure index) in the medial orbitofrontal cortex than males with ADHD as well as males with ADHD showing more impulsivity on the Go/No-Go tasks than females with ADHD (Peterson et. al., 2023). Another study also using diffusion tensor imaging showed that reduced fractional anisotropy in the orbitofrontal cortex-amygdala and ventral anterior cingulate cortex-amygdala tracts was specific to males with ADHD compared to females with ADHD (Rosch et. al., 2023). An fMRI study recently found that (unrelated to sex), different ADHD subtypes show different neural correlates of segregation, specifically with the inattentive subtype showed a negative correlation with segregation, and the inattentive and combined subtypes showed lower segregation components than TD children (Wang et. al., 2024). Outside of neuroimaging studies, recent work has shown sex-related differences in behavior as well as other aspects of ADHD in general. One study showed that there is a significant gap in auditory and visual attention behavioral outcomes between TD and ADHD-diagnosed children as well as a specific effect of sex in both groups (Lin et. al., 2023). Another study has demonstrated marked differences based on sex in emotional dysregulation, specifically that girls with ADHD levels remain high whereas boys with ADHD improve significantly during adolescence (De Ronda et. al., 2024). Lastly, another study showed that cortisol secretion is affected differentially based on a sex by subtype interaction in that inattentive boys showed lower hair cortisol concentration that TD boys and combined-type girls showed higher hair cortisol concentration than TD girls (Pauli-Pott et. al., 2024). Overall, this area of research is increasing in prevalence, but more is needed and necessary as outcomes of this research have major implications for clinical practice in the field of ADHD.
The notion that we need a better understanding of the neural mechanism(s) driving cognitive dysfunction associated with ADHD to fully address the needs of this group is not a new one. The NIH has been working to extend neural work to consider symptom severity and presentation as a spectrum, rather than grouping individuals as simply clinical or control. (Pacheco, et. al., 2022). Beyond separating groups based on ADHD diagnostic status, there is increasing support for analysis based on symptom severity. Recent studies have identified that reduced activation in the left prefrontal, left premotor, left frontal eye field, left primary motor cortex, and right supplementary motor cortex seen in ADHD populations is significantly correlated with symptom severity (Jacobson et al., 2018). The same correlation is seen in research with younger ADHD populations where a dimensional approach allows for accurate evaluation of a wider range of functioning (Stephens et al., 2021). Including both males and females in the sample, as well as all three subtypes, is necessary to fully understand the spectrum of this neurocognitive delay as it emerges in early and middle childhood. One way to accomplish this would be to examine children prior to or at the beginning of treatment, along with better sampling to account for the lack of generalizability of neural findings related to ADHD.
Functional Connectivity in the ADHD Brain: A Potential Lifeline to Address Sample Disparities in Neuroscience
Even with a large body of existing behavioral research on ADHD, there is still limited information on the temporal dynamics underlying neural differences in this disorder. Specifically, the literature has largely neglected functional connectivity (FC) and profile work with younger populations at the precipice of typical diagnosis (5–6-year-olds). Known structural brain differences between individuals with and without ADHD partially account for behavioral performance differences in executive functioning. For example, research done on slightly older children with ADHD demonstrated reduced gray matter in bilateral frontal, parietal, and temporal lobes (Jacobson et al., 2018) as well as abnormalities in right inferior frontal gyrus and white matter volume in caudal portion of temporal cortex (Pironti et al., 2014). Despite these findings, the literature is inconsistent on whether structure and anatomy or functional activation drives these findings. Using functional magnetic resonance imagery (fMRI) data collected during the resting state, Hearne et al. (2019) found that structural connectivity did not significantly differ between ADHD and control groups, but the ADHD group showed reduction in structure function coupling, including linking frontoparietal systems with sensory networks. Additional research supports the conclusion that dysfunction is caused by differences in connectivity rather than regional abnormalities, and that the use of stimulant medications can normalize the dysfunctional connectivity in affected individuals (Konrad & Eickhoff, 2010). These studies had limited samples that underrepresented the larger phenotype of ADHD. Thus, either approach would be an appropriate starting point for broadening the application of these neural findings to this understudied clinical group.
Neuroimaging of very young children is difficult when utilizing common neuroimaging technology, like fMRI. The primary objective of this study is to address these issues more comprehensively. Functional near-infrared spectroscopy (fNIRS) is a valuable technique to use for successfully collecting FC data in young children with ADHD because it allows the participant to move and therefore does not require longer recording times due to sampling constraints (e.g., fMRI). Moreover, this method of using resting-state FC analyses to elucidate the neural underpinnings of group differences or behavioral outcomes is an important aspect of growing neuroimaging literature. Resting-state functional connectivity shows synchronized activation of spatially remote neural populations at rest and can be used as a baseline or intrinsic neural measure that can then correlate with or predict group differences or behaviors (Lu, et. al., 2010). This has many applications in research, but also in clinical practice, as these neural profiles that are being created allow for biological underpinnings to be understood without needing to use an extensive battery of tasks or assessments, and it can be used across neuroimaging techniques, fNIRS being a common choice.
Current Approach
The current study utilizes a measure of FC during rest (i.e., passive viewing) to further evaluate functional brain differences between children with and without ADHD. Specifically, steps were taken to include an even number of female and male participants, younger children prior to or who had recently begun treatment, and a variety of subtypes beyond hyperactive. Symptom severity and sex across results were also investigated.
Hypotheses
It is hypothesized that marked differences in functional connectivity will be seen at rest between male and female children with and without ADHD. First, global hypoconnectivity in children with ADHD as compared to TD children is expected across the frontal, parietal, and temporal cortices. Between male and female children, differences are expected in the nature of the functional connectivity profile, in that TD and ADHD females will have more fine-tuned resting state functional connectivity profiles. Within the ADHD group, it is predicted that the differences between male and female children will be exaggerated beyond the main effect of sex. These relationships will be looked at with a continuous symptom severity score, with the prediction that male children will show different patterns of hypoconnectivity with increasing symptom severity as compared to female children.
Methods
Participants
A total of 52 children between six and eight years of age were included in this study (M=6.80, Female=24). All participants were recruited from the community of Southeastern Nebraska based on voluntary entry into a database for research participation, parental consent and child assent (for children seven or eight years of age) was obtained prior to the start of the study. In the first part of the study, a licensed clinical psychologist with experience working with ADHD populations administered the Kiddie Schedule for Affective Disorders and Schizophrenia (K-SADS) in combination with parental interviews and the Disruptive Behavior Disorder (DBD) Parent/Teacher rating scale. Based on these interviews, twenty-five children were assigned to the clinical group with a diagnosis of ADHD (M=6.92, Female=11), and twenty-seven children were assigned to the typically developing (TD) group (M=6.70, Female=13).
Exclusion criteria for this study included history of seizures, Tourette’s syndrome, autism spectrum disorder, and a lack of evidence for impairment across multiple settings (despite a clinically relevant number of ADHD symptoms). Moreover, the Wechsler Abbreviated Scale of Intelligence-II (WASI-II) was administered, and children scoring below eighty were excluded to exclude children with confounding developmental delays. In total, seven children were excluded based on these criteria, mainly due to lack of impairment across multiple settings, and these children were separate from the total n=52 described above.
Survey Procedures
When possible, consent, demographics, KSADS, and WASI-II were obtained via virtual appointment prior to performing the tasks to minimize contact while recruiting during a pandemic. First, the parents filled out a demographics form. Then, the clinician gave the participant a shortened version of the WASI-II that included the vocabulary and matric reasoning assessments. The WASI-II is a general intelligence test designed to assess overall cognitive capabilities in children and adults (6–89 years old). The K-SADS is a semi-structured interview designed to measure mood, anxiety, psychotic, and disruptive behavior disorders in children from 6–18 years old. A collaborating clinician at Boys Town National Research Hospital gave a K-SADS interview to one or both parents. If the parent had concerns about ADHD, the clinician offered to give the DBD Parent/Teacher rating scale to the teacher. This assessment was taken into consideration for the final grouping when available.
Demographics
Researchers administered a demographics questionnaire that was specifically designed to collect information concerning household income, parental education level, number of siblings, race, ethnicity, sex, primary spoken languages, special education, and adoption status. Demographics were used for descriptive statistics only.
The Affective Reactivity Index Parent Form (ARI-P)
The ARI-P was given to measure irritability in the participant. This parental report scale has been tested and found to be consistent for clinical and research use in multiple different samples (Stringaris et. al., 2012). The ARI-P is scored from “0 - Not true” to “2 - Certainly true.”
Parental Stress Scale (PSS)
The PSS was given to the parent to measure the total stress that the role of parenting has put on the parent. Scores ranged from “1 - Strongly disagree” to “5 - Strongly agree.” The questionnaire can be focused on an individual child, or all their children, and we requested that the parents report on the former. The PSS has been validated many times over for each psychometric property (Algarvio et al., 2018; Berry, 1995; Harding et al., 2020; Pontoppidan et al., 2018; Zelman & Ferro, 2018).
The Disruptive Behavior Disorder Parent/Teacher Rating Scale
The DBD Parent/Teacher rating scale was given to the parent and the participants teacher and used to determine group placement. This scale consists of 42 items with four subscales: conduct disorder, Oppositional Defiant Disorder (ODD), ADHD-inattention, and ADHD-hyperactive. It is rated on a 4-point scale, where 0 means “not at all” and 3 means “very much.” The teacher can also withhold a response by indicating they do not know.
Parent IRS: The Narrative Description of a Child
The Parent IRS was given to the accompanying parent to scale how their child’s behavioral problems affect different aspects of their life at home and at school and whether each area needs special treatment or services (Fabiano et al., 2006). This scale is rated from 0–7 and is on a sliding scale. The parents could also explain and expand on their answers in their own words.
fNIRS Procedures
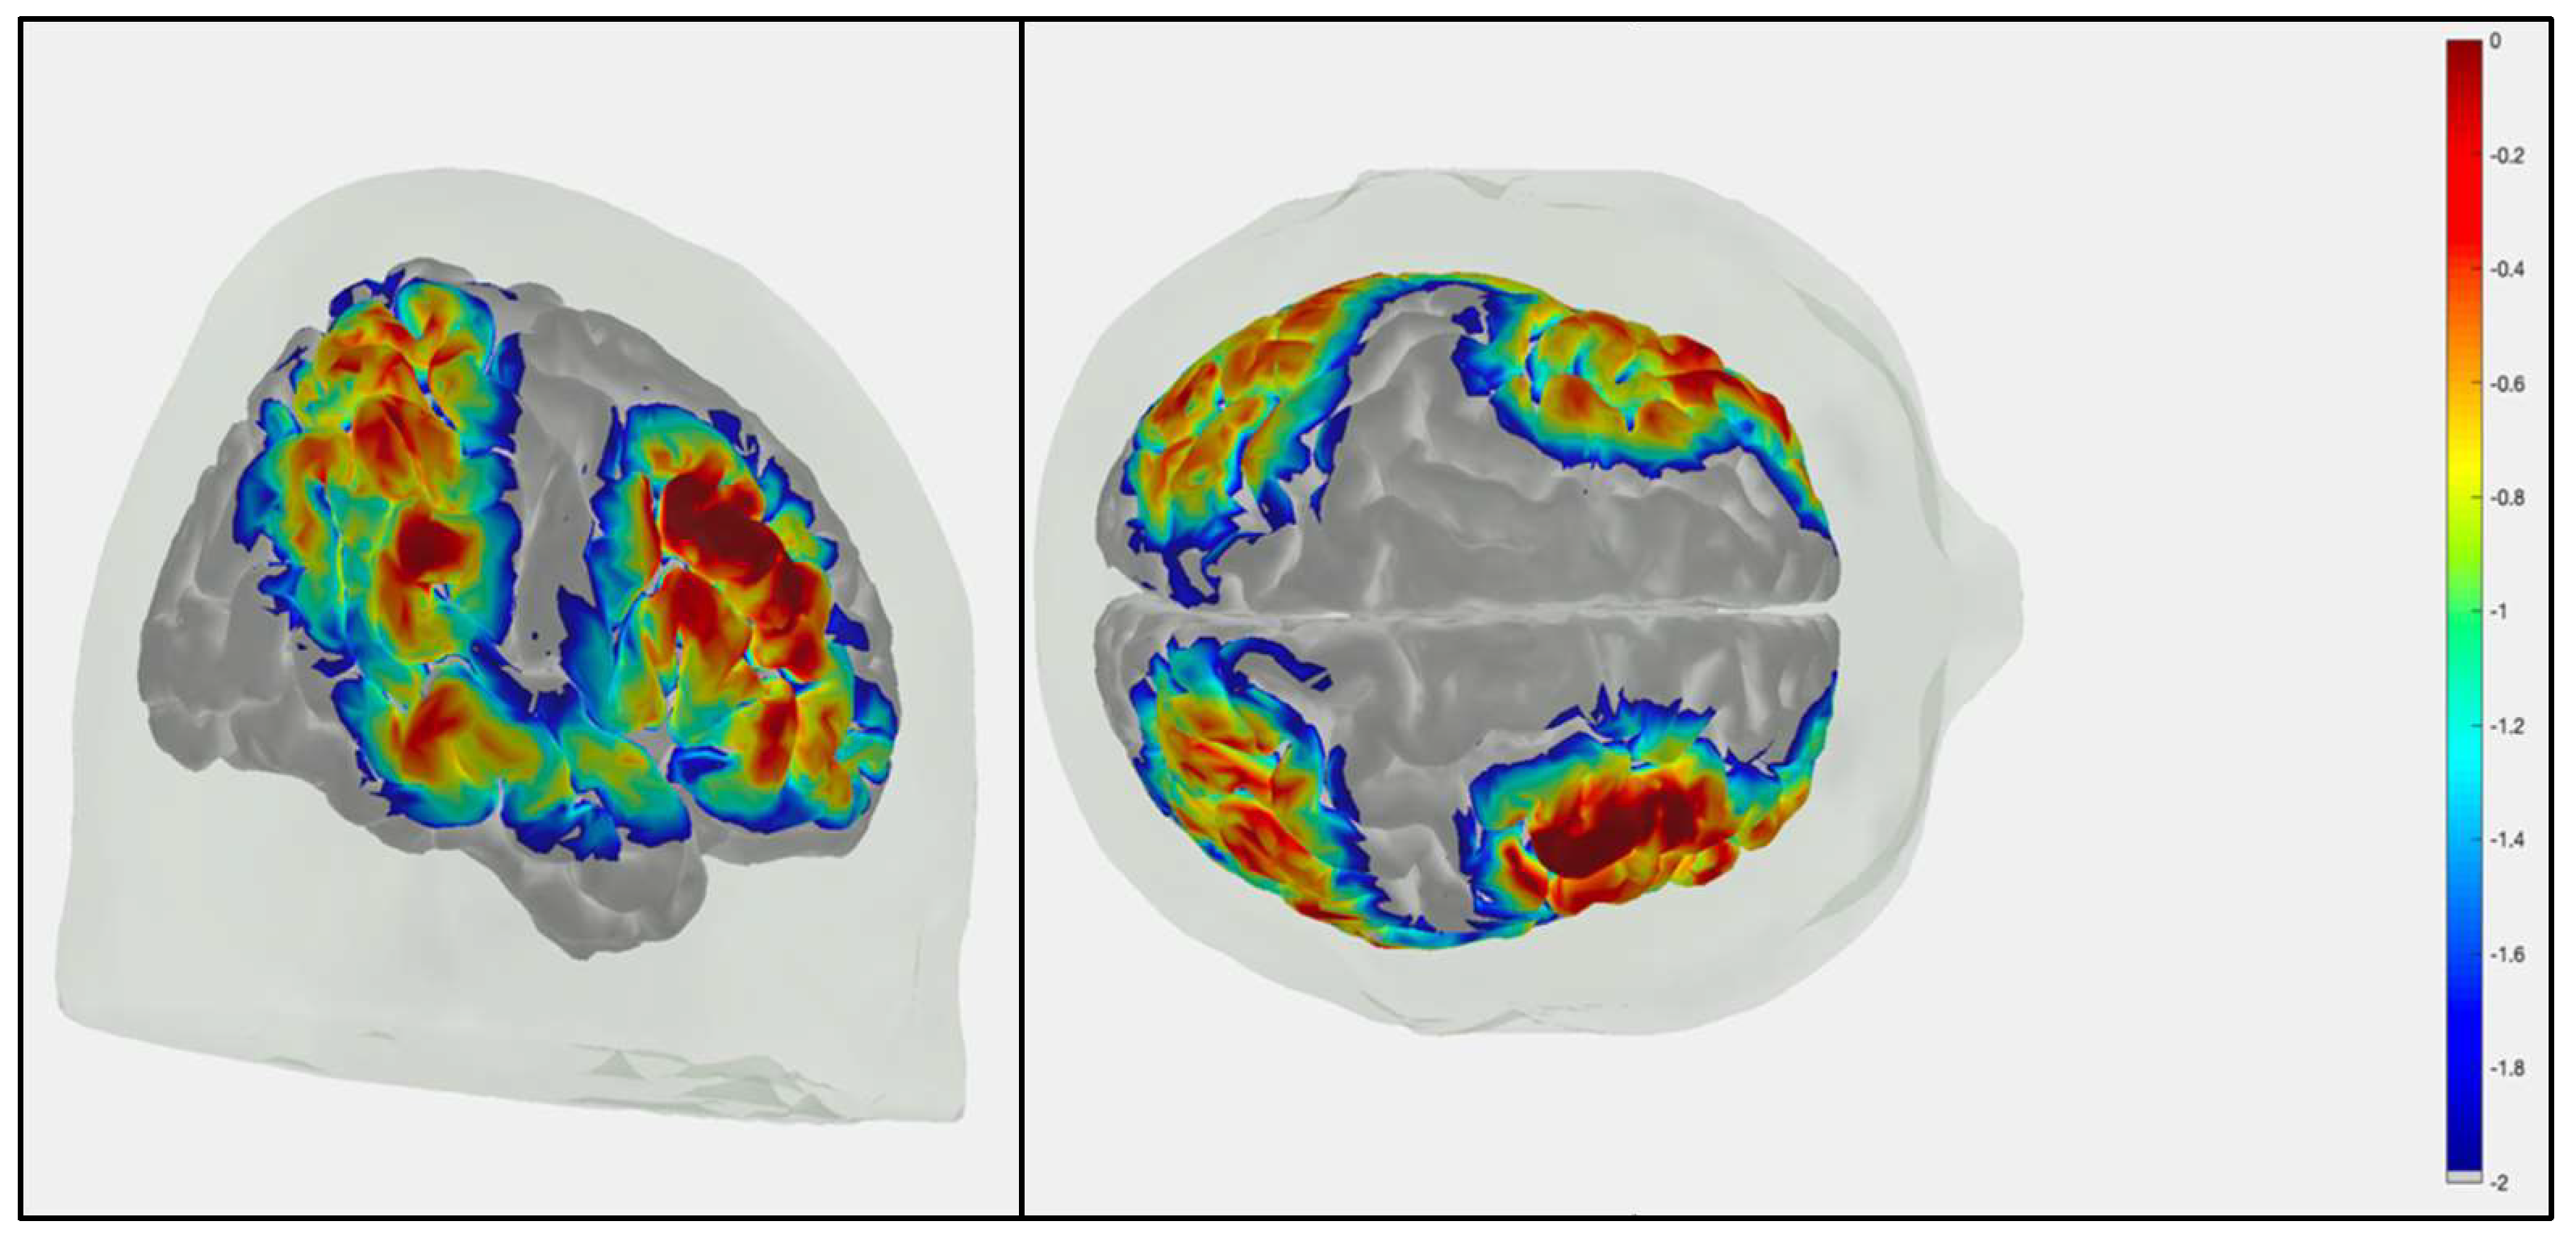
The participants sat in front of a laptop computer on a table adjusted to the participants’ height. First, the circumference of the child’s head was measured, which we used to mark the central anatomical point on the head (Cz), halfway between the nasion and inion and both pre-aural areas. Caps were between 52 and 56 cm, which was based on two cm added to the circumference of the child’s head. Once capped, the sources and detectors were adjusted to an appropriate signal-to-noise ratio as calculated by NIRStar 15.5 software. During the task, fNIRS was collected using NIRScout continuously at 3.4 Hz with light wavelengths of 760 and 850 nm. The probe used was comprised of 16 sources and 16 detectors arranged to cover bilateral frontal, parietal, and temporal cortices as seen in the sensitivity profile (
Figure 1). All sources and detectors were placed 3 cm apart creating a 38-channel array for functional connectivity measures. Placement of sources was relative to the revised 10-10 system (see
Figure 1; see supplemental Table S1 for corresponding MNI coordinates) over bilateral frontal cortex (FP 1-2, AF 5-6, F 3-8, FC 3-8), bilateral parietal cortex (CP 1-6, P 1-6), and bilateral temporal cortex/temporal-parietal junction (T 7-8, TP 7-8). We used timestamps at trial onsets to synchronize data. The fNIRS cap was on and recorded data throughout all tasks included in this study, and data collection was stopped briefly between each task.
Passive-Viewing Paradigm
The task used to collect resting-state functional connectivity data was a
Passive Viewing Paradigm as studies have shown that passively watching a video provides better compliance (Vanderwal et. al., 2015) and data collected is roughly analogous to other rest protocols, even in children (Zhang et. al., 2019). In this task, children watched a series of five short videos interrupted briefly by a black screen with a white fixation. Each video (see
Figure 2) was soothing and low stimulation that was paired with calming, instrumental music. The music was slow-tempo and temporally synchronized with motion in the videos to avoid any brain activity related to perceptual asynchrony (Lo & Zeki, 2014). While watching the set of videos, children were given the following instructions: “For this game, you will need to be very still and calm before I start the videos. Remember to keep your eyes on the screen while watching and stay as still and quiet as you can.” Each video lasted between 45 and 90 seconds, which gave a total of between four and five minutes of resting (video watching) time. Each child met the criterion of having at least four minutes of recorded data after motion corrections were run (Kerr-German et. al., 2022).
Analysis
Survey Data
Participants were given total scores for the PSS, ARI-P, and Parent IRS and specific sub scores for the Parent/Teacher DBD rating scale (ADHD, ODD, Conduct Disorder) and K-SADS (Symptom Severity and Vocabulary) based on conventional scoring criteria for each survey. T tests were performed to ensure that there were no differences in any scores between any age group or sex (p > .05). A partial correlation was run between each of the survey totals and sub-scored to determine if the scored between surveys were correlated. A Symptom Severity sub score was calculated using the K-SADS interviews and was used as a continuous variable for the entire sample during neural analysis. Results from the K-SADS interviews were also used to determine ADHD subtype (hyperactive, inattentive, or combined-type).
fNIRS Data
In the current study, the same analyses were employed as used with children at risk for ADHD in (Kerr-German et al., 2022) for this passive viewing task. At least thirty seconds of recording prior to the first video was obtained, and only data from the task—during passive viewing—was included in these analyses. For this analysis, the AnalyzIR toolbox within MATLAB (Santosa et. al., 2018) was used. After correcting for motion artifacts using the PCA method, raw fNIRS data was converted to changes in optical density. Then, the measured intensity data of the two wavelengths were converted to relative HbO and HbR concentration changes using the modified Beer-Lambert law (Cope et. al., 1988). To extract the individual FC measures, a robust correlation approach was taken, implementing an iterative autoregressive least-square technique (Santosa et al., 2017) to calculate the robust correlation coefficient of the temporally whitened signals to control the false-discovery rate. This approach yields more reliable estimates of serially correlated errors and statistical outliers due to motion artifacts in functional connectivity data (Temporal Derivative Distribution Repair [TDDR]; Fishburn et al., 2019). To be considered significant, q values had to be ≤ .05. The analyses included are the main effect of sex within the combined-type group compared to the main effect of sex within the TD group. In addition, the interaction between symptom severity score and sex within the combined-type group and TD group are included. All analyses were done while controlling for any possible age effects to avoid confounds, as there are still outstanding questions surrounding the way the brain at rest changes with age (Camacho et. al., 2020).
Results
Demographics
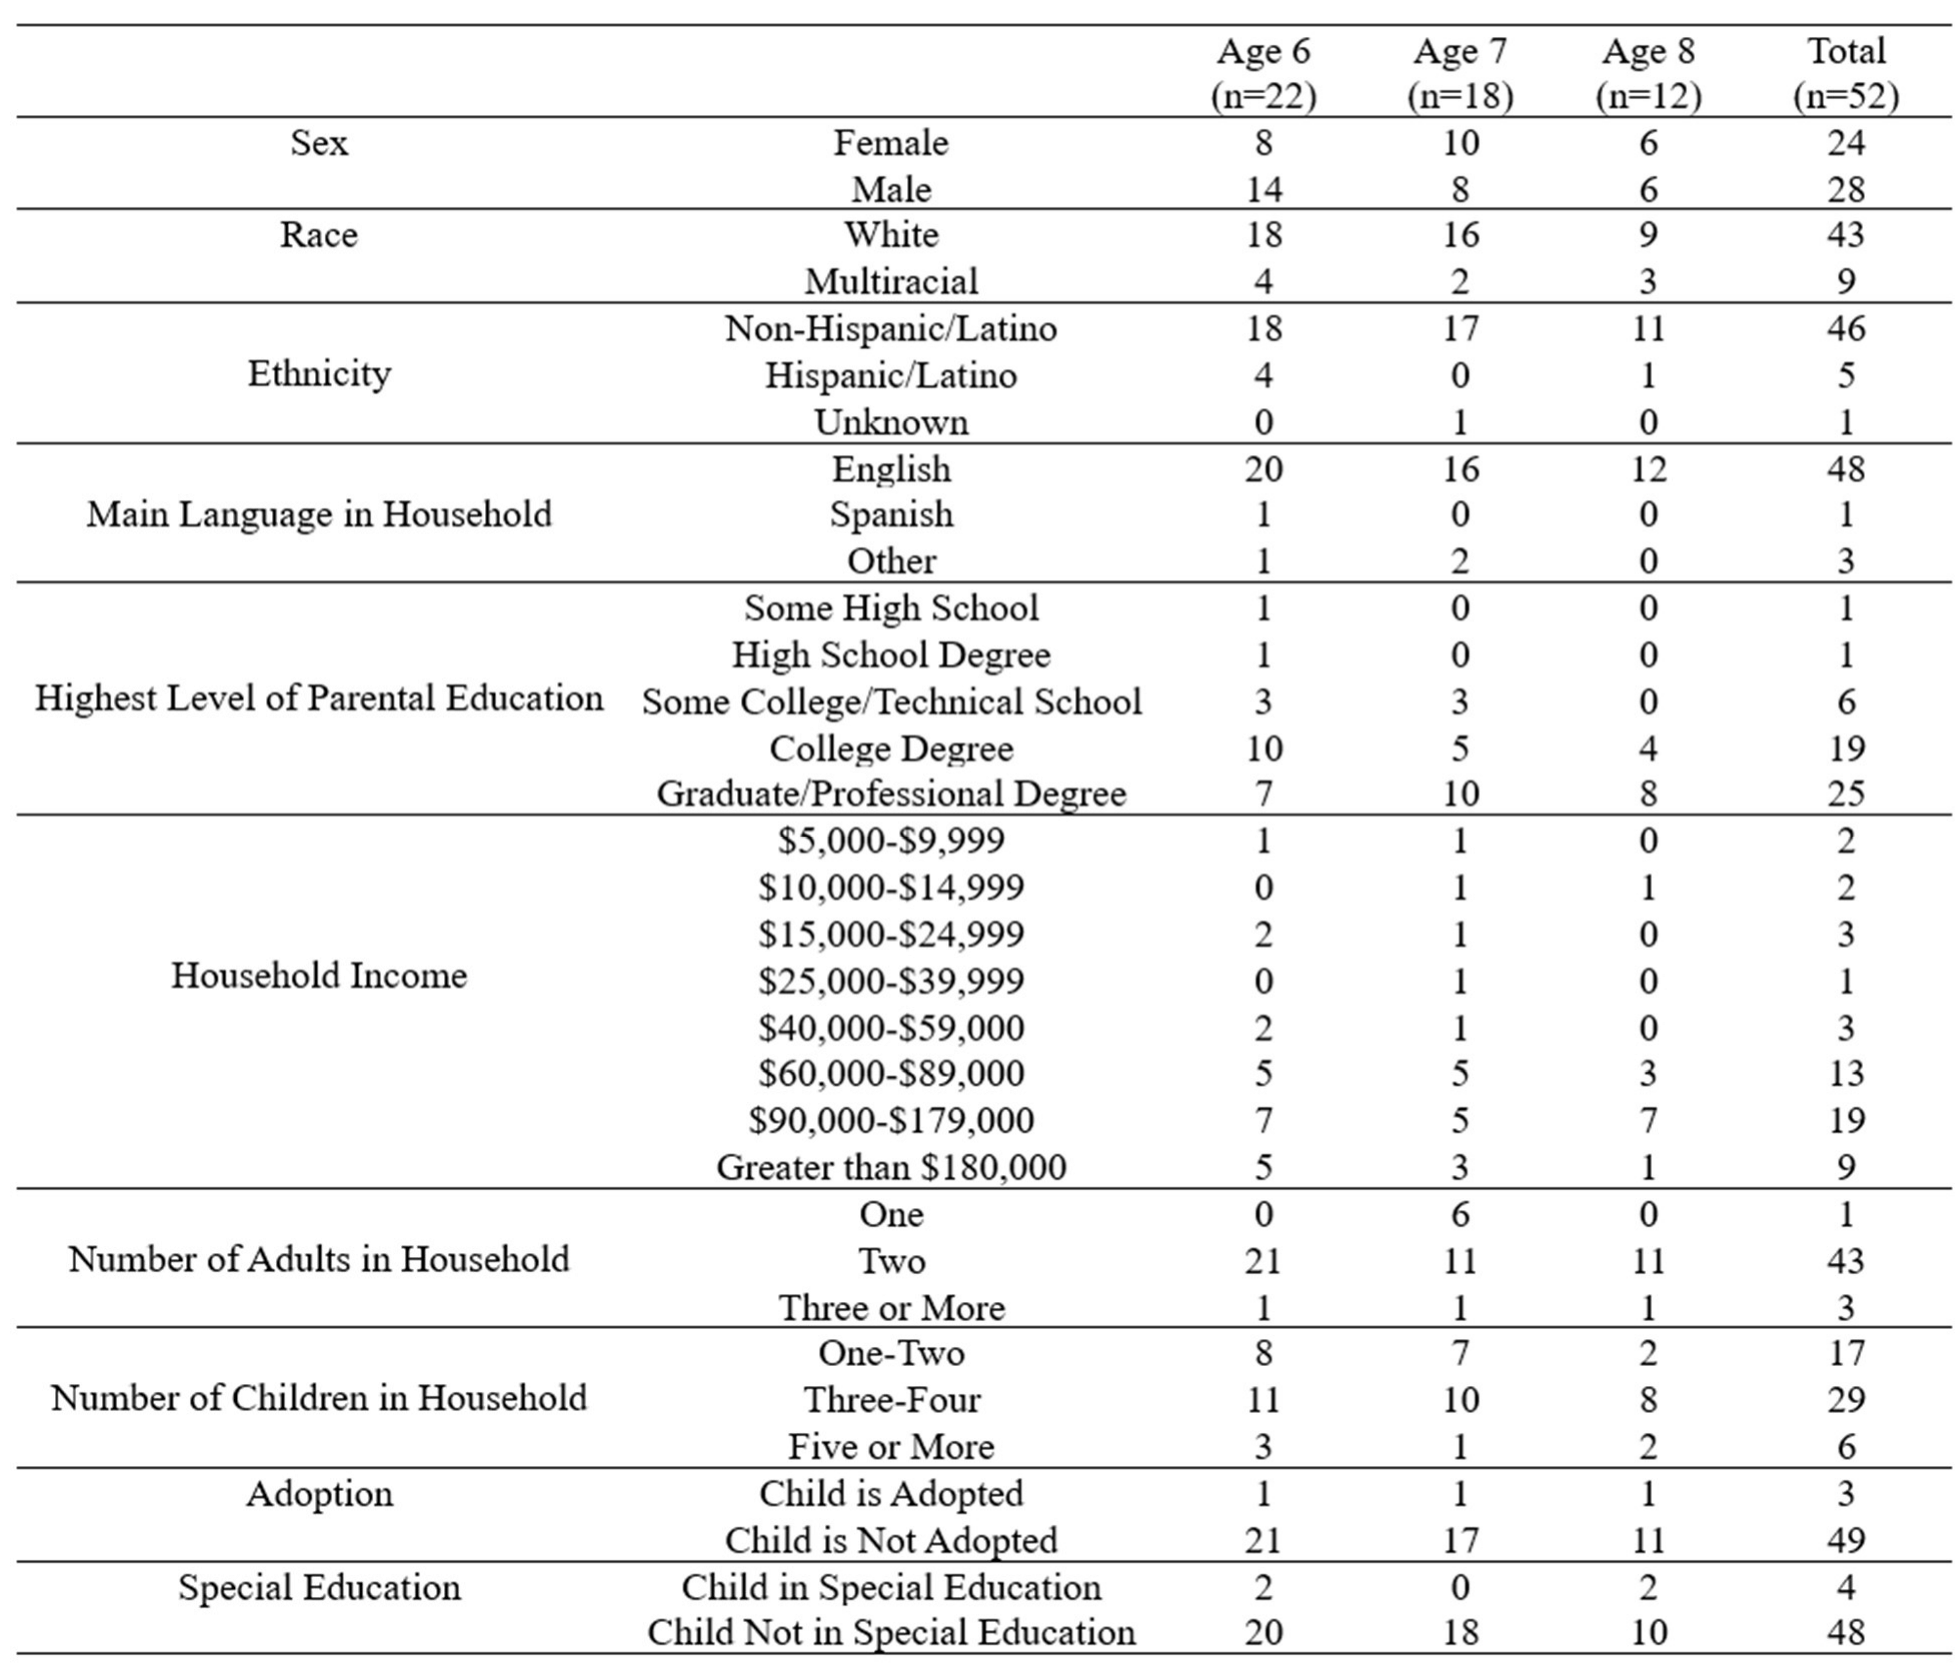
Table 1 displays the number of total participants (n=52) in the study broken down by demographic information recorded using our demographics survey filled out by the participants’ parents. The sample was not evenly distributed based on race, ethnicity, and SES. Most of the sample was English-speaking, white, non-Hispanic/Latino, and of high SES. Due to this, the results provided should not be generalized across all populations, and future work is needed to create more generalizability among these data.
Survey Analyses
As shown in
Table 2, the hyperactive and inattentive groups both have very small sample sizes. Due to this, combined type or overall ADHD groups were considered in future analyses. However, samples of male and female children across age are relatively balanced.
Table 3 shows the mean symptom severity scores by group (TD, clinical ADHD, and each subtype) also broken down by age and sex. The symptom mean severity scores are drastically higher in the ADHD sample versus the TD sample
, validating this as a continuous measure of ADHD symptom level across groups. The combined-type group, which will be important for later analyses, also has a significantly higher mean symptom severity score
than the TD group.
The difference between symptom severity score based on sex between groups was also investigated. Males have a significantly higher mean symptom severity score (M=26.91,24.21,2.64) than females (M=21.90,20.91,2.46) in all three groups (combined-type, ADHD, and TD respectively according to three t-tests. For combined-type group, , for the ADHD group, , and for the TD group, .
Survey Results
All participants completed all of the aforementioned surveys in full. There were no significant differences between any age group for the total scores for the Parent IRS, Parent/Teacher DBD rating scale, PSS, ARI-P, K-SADS Symptom Severity, or clinical grouping (p > .05). As expected, 6-year-olds did have a significantly lower K-SADS Vocabulary subscore than their 8-year-old counterparts [F (2, 49) = 11.049, p < .001]. The ADHD group and TD group showed differences in their ARI-P [F (1, 50) = 10.376, p < .001] and Symptom Severity scores [F (1, 50) = 151.467, p = .002], while the PSS and Vocabulary sub -score did not (p > .05).
|
Table 1. Partial Correlations for ADHD Survey Data (K-SADS, PSS, ARI-P, and Parent/Teacher DBD Rating Scale). |
| |
1 |
2 |
3 |
4 |
5 |
6 |
7 |
| 1. K-SADS Vocabulary |
-- |
|
|
|
|
|
|
| 2. K-SADS Symptom Severity |
-.043 |
-- |
|
|
|
|
|
| 3. PSS |
-.04 |
.339 |
-- |
|
|
|
|
| 4. ARI-P |
-.371 |
.557* |
.349 |
-- |
|
|
|
| 5. ADHD-Inattention |
-.025 |
.766* |
.264 |
.351 |
-- |
|
|
| 6. ADHD-Hyperactive |
.084 |
.824* |
.463* |
.5* |
.836* |
-- |
|
| 7. ODD |
-.101 |
.304 |
.246 |
.669* |
.315 |
.458* |
-- |
|
Note. *Bonferroni corrected p < .007, two-tailed test, controlling for age in years. |
A partial correlation analysis was conducted to examine the main variables of the survey data (K-SADS Vocabulary and Symptom Severity, PSS, ARI-P, and Parent Teacher DBD rating scale) while controlling for age (see
Table 1).
Neural Results
Of the 52 participants that completed the final battery, 47 were included in the RS final analysis. Participants were excluded (TD = 2, ADHD = 2) for two reasons: (a) if 20% of channels were lost due to poor signal quality, or (b) less than 80% of data remained due to motion artifact (see
Table 1). Though neither younger nor older children were excluded more often, those in the clinical group were generally excluded more than the TD population, displaying one challenge with recording neural data from this population.
Passive Video Watching/Resting State Task
The resting state task was analyzed for functional connectivity between regions during passive video watching. A difference between sexes was investigated because a difference in FC is generally observed (Tomasi & Volkow, 2012), and a large dichotomy between males and females exists in ADHD symptomology and connectivity (Park & Park, 2016). There were nine synchronous connections in the lFC within males at rest and one negative connection between the left frontal cortex and the right parietal. Within females, there were two connected channel pairings, one within the lFC and another within the lPC. Finally, there was a significant connection between channels in the left and right parietal cortex for participants high on the Symptom Severity score (see
Table 2).
Table 2.
ΔHbO2 as It Relates to Symptom Severity, & Sex Effect During Resting State.
Table 2.
ΔHbO2 as It Relates to Symptom Severity, & Sex Effect During Resting State.
| Channel Connectivity |
MNI Region |
Condition |
R |
z |
t |
q |
| 1<-->2 |
lFC<-->lFC |
Male |
0.521209 |
0.577999 |
4.883782 |
0.002015 |
| 1<-->3 |
lFC<-->lFC |
Male |
0.334026 |
0.347353 |
4.618476 |
0.004508 |
| 2<-->4 |
lFC<-->lFC |
Male |
0.338104 |
0.35195 |
5.179304 |
0.000809 |
| 2<-->6 |
lFC<-->lFC |
Male |
0.350914 |
0.366486 |
5.378394 |
0.00044 |
| 3<-->2 |
lFC<-->lFC |
Male |
0.281118 |
0.288896 |
4.694692 |
0.003648 |
| 3<-->4 |
lFC<-->lFC |
Male |
0.403652 |
0.428005 |
4.431514 |
0.008137 |
| 3<-->5 |
lFC<-->lFC |
Male |
0.184477 |
0.186613 |
4.002845 |
0.02873 |
| 4<-->6 |
lFC<-->lFC |
Male |
0.32942 |
0.342178 |
5.33512 |
0.000501 |
| 4<-->35 |
lFC<-->lFC |
Male |
-0.19612 |
-0.19869 |
-3.98387 |
0.029831 |
| 5<-->6 |
lFC<-->rPC |
Male |
0.415942 |
0.442775 |
3.807233 |
0.046841 |
| 3<-->5 |
lFC<-->lFC |
Female |
0.205807 |
0.208789 |
3.94482 |
0.03296 |
| 13<-->14 |
lPC<-->lPC |
Female |
0.53267 |
0.593866 |
3.894906 |
0.037276 |
| 13<-->33 |
lPC<-->rPC |
Symptom Severity |
0.001943 |
0.001943 |
4.210226 |
0.015532 |
Resting-State Functional Connectivity Analyses
As described above, there were four main analyses of resting-state functional connectivity ran from this study.
Table 4 shows the main effect of sex within the combined-type group (n=21, Female=10), and
Table 5 shows the main effect of sex within the TD group (n=27, Female=13). First, it is seen that there is generally more connectivity in the TD group than the combined-type group, especially in male children. This shows less connectivity in the combined-type group than TD. It can also be seen that connectivity in female children seems to be more fine-tuned than male children, as predicted. Females in the combined-type group show hypoconnectivity between the parietal cortices compared to their TD peers. Male children in the combined-type group specifically show increased connectivity within the right frontal cortex compared to their TD peers, other than showing less connectivity overall.
Table 6 shows the results within the combined-type group looking at the interaction between sex and symptom severity, and
Table 7 shows this for the TD group. Again, less significant connectivity is seen within the combined-type group when compared to the TD group, especially for male children who show less refined functional connectivity overall. In the combined-type group, female children show decreased connectivity as symptom severity increases whereas male children show increasing connectivity as symptom severity increases. However, female children in the TD group have increased connectivity with increasing symptom severity between the left frontal and parietal cortices, which is lacking in the combined-type group. Male children in the TD group show a lot of functional connectivity patterns both increasing and decreasing with increases in symptom severity, but in the combined-type group, it is seen that connectivity solely increases with severity. These data show that there are different resting-state functional connectivity profiles correlating to symptom severity in male and female children depending on whether they have combined-type ADHD or are in the TD group.
Discussion
This study investigated neural and behavioral differences in children with and without ADHD, with a focus on sex differences and subtype variation in resting-state functional connectivity (rsFC) using functional near-infrared spectroscopy (fNIRS). The findings provide novel insights into the distinct neural profiles of male and female children with ADHD, especially within the combined subtype, and their relationship with symptom severity at the time of diagnosis.
Sex Differences in Functional Connectivity
The results revealed significant differences in rsFC between male and female children with ADHD. Specifically, male children exhibited less refined functional connectivity overall compared to their female counterparts, aligning with previous research suggesting that ADHD manifests differently by sex at the neural level (citation). Within the combined-type group, male children showed increased connectivity with rising symptom severity, whereas female children showed decreased connectivity with increasing severity. This suggests that males and females may have distinct neural mechanisms underlying symptom expression in ADHD that is directly related to hypo or hyper-connections within and between critical attention and executive functioning cortical regions.
These findings align with prior research indicating that males with ADHD tend to present with more hyperactive and impulsive traits, whereas females are more likely to exhibit inattentive symptoms and emotional dysregulation (citation). The observed hypoconnectivity in males with ADHD further support the notion that males may have more widespread functional network disruptions, whereas females display more localized alterations.
Impact of Symptom Severity on Sub type-Specific Findings
A key strength of this study is the examination of ADHD symptom severity as a continuous variable rather than a binary classification of diagnosis. The results showed that increased symptom severity was linked to increased connectivity in males within the combined-type group, but the opposite trend was observed in females. This highlights the importance of considering symptom severity when investigating ADHD-related neural differences. It also suggests that symptom severity may have a sex-specific impact on functional connectivity patterns in ADHD.
The findings underscore the importance of considering ADHD subtypes in neuroimaging research. Most previous studies have focused primarily on the hyperactive subtype or male-dominant samples, which limits the generalizability of the findings. In this study, the combined-type group demonstrated distinct connectivity profiles compared to the typically developing (TD) group, with less refined connectivity in males and more consistent patterns in females. This supports the hypothesis that different ADHD subtypes may be driven by different underlying neural mechanisms.
Clinical and Research Implications
The observed sex and subtype differences have important implications for clinical practice and future research. Early diagnosis and intervention strategies should be tailored to account for these neural and behavioral differences. The findings suggest that male and female children with ADHD may benefit from different therapeutic approaches, particularly those targeting functional connectivity. Moreover, the study highlights the need for more inclusive sampling in ADHD research to better capture the full spectrum of symptom presentation across sexes and subtypes.
Despite its strengths, this study has several limitations. First, the sample size for the hyperactive and inattentive subtypes was small, which may have limited the power to detect subtype-specific differences. Second, the study primarily included children from high socioeconomic backgrounds, which may reduce the generalizability of the findings to more diverse populations. Third, while fNIRS provides valuable insights into functional connectivity, it has limited spatial resolution compared to other imaging modalities like fMRI. Future studies should aim to replicate these findings in larger and more diverse samples and explore the longitudinal trajectories of rsFC patterns in ADHD.
Conclusions
This study contributes to a growing body of research demonstrating that ADHD is a heterogeneous disorder with distinct neural signatures based on sex, subtype, and symptom severity. The findings reinforce the importance of using a dimensional approach to better capture individual differences in ADHD and to develop more targeted and effective interventions. Understanding the neural basis of these differences is critical for improving diagnostic accuracy and treatment outcomes for children with ADHD.
Clinical research has neglected to investigate the neural and individual differences between sex and subtype in populations with ADHD. Utilizing fNIRS, the research presented uncovers differences in the neural functional pathways of early-age males and females with and without ADHD. Possible implications of the research presented include a deeper understanding of neural circuitry that paves way for clearer subtype understanding, symptom presentation between the sexes, and diagnosis and intervention at an earlier age for girls. Future research could explore the socialization of females and include broader demographic populations for richer generalizability.
References
- Algarvio, S.; Leal, I.; Maroco, J. Parental Stress Scale: Validation study with a Portuguese population of parents of children from 3 to 10 years old. Journal of Child Health Care 2018, 22(4), 563–576. [Google Scholar] [CrossRef] [PubMed]
- Arnett, A. B.; Pennington, B. F.; Willcutt, E. G.; DeFries, J. C.; Olson, R. K. Sex differences in ADHD symptom severity. Journal of Child Psychology and Psychiatry 2015, 56(6), 632–639. [Google Scholar] [CrossRef]
- Ayano, G.; Demelash, S.; Gizachew, Y.; Tsegay, L.; Alati, R. The global prevalence of attention deficit hyperactivity disorder in children and adolescents: An umbrella review of meta-analyses. Journal of Affective Disorders 2023, 339, 860–866. [Google Scholar] [CrossRef] [PubMed]
- Barnard, L.; Stevens, T.; To, Y. M.; Lan, W. Y.; Mulsow, M. The Importance of ADHD Subtype Classification for Educational Applications of DSM-V. Journal of Attention Disorders 2010, 13(6), 573–583. [Google Scholar] [CrossRef]
- Berry, J. O. The Parental Stress Scale: Initial Psychometric Evidence. Journal of Social and Personal Relationships. 1995. [Google Scholar]
- Biederman, J.; Mick, E.; Faraone, S. V.; Braaten, E.; Doyle, A.; Spencer, T.; Wilens, T. E.; Frazier, E.; Johnson, M. A. Influence of Gender on Attention Deficit Hyperactivity Disorder in Children Referred to a Psychiatric Clinic. American Journal of Psychiatry 2002, 159(1), 36–42. [Google Scholar] [CrossRef]
- Brock, L. L.; Rimm-Kaufman, S. E.; Nathanson, L.; Grimm, K. J. The contributions of ‘hot’ and ‘cool’ executive function to children’s academic achievement, learning-related behaviors, and engagement in kindergarten. Early Childhood Research Quarterly 2009, 24(3), 337–349. [Google Scholar] [CrossRef]
- Burke, J. D.; Boylan, K.; Rowe, R.; Duku, E.; Stepp, S. D.; Hipwell, A. E.; Waldman, I. D. Identifying the irritability dimension of ODD: Application of a modified bifactor model across five large community samples of children. Journal of Abnormal Psychology 2014, 123(4), 841–851. [Google Scholar] [CrossRef] [PubMed]
- Camacho, C.M.; Quinones-Camacho, L.E.; Perlman, S.B. Does the child brain rest?: An examination and interpretation of resting cognition in developmental cognitive neuroscience. NeuroImage 2020, 212, 116688. [Google Scholar] [CrossRef]
- Cho, Y.; Son, H.M.; Chung, T.; Kim, J. Exploring the biases of the perception of inattention, hyperactivity, and impulsivity of students from parents, teachers, self-reports, and a VR measure. Psychol Schs 2024, 61, 2567–2588. [Google Scholar] [CrossRef]
- Cope, M.; Delpy, D. T.; Reynolds, E. O. R.; Wray, S.; Wyatt, J.; van der Zee, P. Mochizuki, M., Honig, C. R., Koyama, T., Goldstick, T. K., Bruley, D. F., Eds.; Methods of Quantitating Cerebral Near Infrared Spectroscopy Data. In Oxygen Transport to Tissue X; Springer US, 1988; Vol. 222, pp. 183–189. [Google Scholar] [CrossRef]
- Danielson, M. L.; Bitsko, R. H.; Ghandour, R. M.; Holbrook, J. R.; Kogan, M. D.; Blumberg, S. J. Prevalence of Parent-Reported ADHD Diagnosis and Associated Treatment Among U.S. Children and Adolescents, 2016. Journal of Clinical Child and Adolescent Psychology: The Official Journal for the Society of Clinical Child and Adolescent Psychology, American Psychological Association, Division 53 2018, 47(2), 199–212. [Google Scholar] [CrossRef]
- De Ronda, A.C.; Rice, L.; Zhao, Y.; Rosch, K.S.; Mostofsky, S.H.; Seymour, K.E. ADHD-related sex differences in emotional symptoms across development. European Child & Adolescent Psychiatry 2024, 33, 1419–1432. [Google Scholar] [CrossRef]
- Fabiano, G. A.; Pelham; Jr., W. E.; Waschbusch, D. A.; Gnagy, E. M.; Lahey, B. B.; Chronis, A. M.; Onyango, A. N.; Kipp, H.; Lopez-Williams, A.; Burrows-MacLean, L. A Practical Measure of Impairment: Psychometric Properties of the Impairment Rating Scale in Samples of Children with Attention Deficit Hyperactivity Disorder and Two School-Based Samples. Journal of Clinical Child & Adolescent Psychology 2006, 35(3), 369–385. [Google Scholar] [CrossRef]
- Fishburn, F. A.; Ludlum, R. S.; Vaidya, C. J.; Medvedev, A. V. Temporal Derivative Distribution Repair (TDDR): A motion correction method for fNIRS. NeuroImage 2019, 184, 171–179. [Google Scholar] [CrossRef]
- Gilbert, M.; Boecker, M.; Reiss, F.; Kaman, A.; Erhart, M.; Schlack, R.; Westenhofer, J.; Dopfner, M.; Ravens-Sieberer, U. Gender and Age Differences in ADHD Symptoms and Co-occurring Depression and Anxiety Symptoms Among Children and Adolescents in the BELLA Study. Child Psychiatry & Human Development 2023. [Google Scholar] [CrossRef]
- Harding, L.; Murray, K.; Shakespeare-Finch, J.; Frey, R. Understanding the Parental Stress Scale with a Foster Carer Cohort. Family Relations 2020, 69(4), 865–879. [Google Scholar] [CrossRef]
- Hearne, L. J.; Lin, H.-Y.; Sanz-Leon, P.; Tseng, W.-Y. I.; Gau, S. S.-F.; Roberts, J. A.; Cocchi, L. ADHD symptoms map onto noise-driven structure–function decoupling between hub and peripheral brain regions. Molecular Psychiatry 2019. [Google Scholar] [CrossRef]
- Jacobson, L. A.; Crocetti, D.; Dirlikov, B.; Slifer, K.; Denckla, M. B.; Mostofsky, S. H.; Mahone, E. M. Anomalous Brain Development Is Evident in Preschoolers with Attention-Deficit/Hyperactivity Disorder. Journal of the International Neuropsychological Society 2018, 24(6), 531–539. [Google Scholar] [CrossRef] [PubMed]
- Kerr-German, A. N.; Buss, A. T.; White, S.; Doucet, G. Assessing the relationship between risk for ADHD and functional connectivity in toddlers. Developmental Cognitive Neuroscience. 2022. [Google Scholar]
- Konrad, K.; Eickhoff, S. B. Is the ADHD brain wired differently? A review on structural and functional connectivity in attention deficit hyperactivity disorder. Human Brain Mapping 2010, 31(6), 904–916. [Google Scholar] [CrossRef]
- Lin, H.; Chiu, E.; Hsieh, H.; Wang, P. Gender Differences in Auditory and Visual Attentional Performance in Children with and without ADHD. Archives of Clinical Neuropsychology 2023, 38, 891–903. [Google Scholar] [CrossRef]
- Lo, Y. T.; Zeki, S. Perceptual asynchrony for motion. Frontiers in Human Neuroscience 2014, 8. [Google Scholar] [CrossRef]
- Lu, C.M.; Zhang, Y.J.; Biswal, B.B.; Zang, Y.F.; Peng, D.L.; Zhu, C.Z. Use of fnirs to assess resting state functional connectivity. J. Neurosci. Methods 2010, 186(2), 242–249. [Google Scholar] [CrossRef] [PubMed]
- Martin, J. Why are females less likely to be diagnosed with ADHD in childhood than males? Lancet Psychiatry 2024, 11, 303–310. [Google Scholar] [CrossRef]
- Mowlem, F.; Agnew-Blais, J.; Taylor, E.; Asherson, P. Do different factors influence whether girls versus boys meet ADHD diagnostic criteria? Sex differences among children with high ADHD symptoms. Psychiatry Research 2019, 272, 765–773. [Google Scholar] [CrossRef] [PubMed]
- Murray, A. L.; Booth, T.; Eisner, M.; Auyeung, B.; Murray, G.; Ribeaud, D. Sex differences in ADHD trajectories across childhood and adolescence. Developmental Science 2019, 22(1), e12721. [Google Scholar] [CrossRef] [PubMed]
- Pacheco, J.; Garvey, M.A.; Sarampote, C.S.; Cohen, E.D.; Murphy, E.R.; Friedman-Hill, S.R. The contributions of the RDoC Research Framework on Understanding the Neurodevelopmental Origins, Progression and Treatment of Mental Illnesses. J Child Psychol Psychiatry 2022, 63(4), 360–376. [Google Scholar] [CrossRef] [PubMed]
- Park, B.; Park, H. Connectivity differences between adult male and female patients with attention deficit hyperactivity disorder according to resting-state functional MRI. Neural Regeneration Research 2016, 11(1), 119. [Google Scholar] [CrossRef]
- Pauli-Pott, U.; Skoluda, N.; Nater, U.M.; Becker, K.; Derz, F.; Kaspar, E.; Kasperzack, D.; Kehm, K.; Kott, M.; Mann, C.; Schurek, P.; Pott, W.; Schlob, S. Long-term cortisol secretion in attention deficit hyperactivity disorder: roles of sex, comorbidity, and symptom presentation. European Child & Adolescent Psychiatry 2024, 33, 569–579. [Google Scholar] [CrossRef]
- Peterson, R. K.; Duvall, P.; Crocetti, D.; Palin, T.; Robinson, J.; Mostofsky, S. H.; Rosch, K. S. ADHD-related sex differences in frontal lobe white matter microstructure and associations with response control under conditions of varying cognitive load and motivational contingencies. Brain Imaging and Behavior 2023, 17, 674–688. [Google Scholar] [CrossRef]
- Pironti, V. A.; Lai, M.-C.; Müller, U.; Dodds, C. M.; Suckling, J.; Bullmore, E. T.; Sahakian, B. J. Neuroanatomical Abnormalities and Cognitive Impairments Are Shared by Adults with Attention-Deficit/Hyperactivity Disorder and Their Unaffected First-Degree Relatives. Biological Psychiatry 2014, 76(8), 639–647. [Google Scholar] [CrossRef]
- Pontoppidan, M.; Nielsen, T.; Kristensen, I. H. Psychometric properties of the Danish Parental Stress Scale: Rasch analysis in a sample of mothers with infants. PLOS ONE 2018, 13(11), e0205662. [Google Scholar] [CrossRef]
- Rosch, K. S.; Mostofsky, S. H.; Nebel, M. B. ADHD-related sex differences in fronto-subcortical intrinsic functional connectivity and associations with delay discounting. Journal of Neurodevelopmental Disorders 2018, 10(1), 34. [Google Scholar] [CrossRef] [PubMed]
- Rosch, K. S.; Batschelett, M.A.; Crocetti, D.; Mostofsky, S. H.; Seymour, K. E. Sex differences in atypical fronto-subcortical structural connectivity among children with attention-deficit/hyperactivity disorder: Associations with delay discounting. Behavioural Brain Research 2023, 452, 114525. [Google Scholar] [CrossRef] [PubMed]
- Rowland, A. S.; Skipper, B. J.; Umbach, D. M.; Rabiner, D. L.; Campbell, R. A.; Naftel, A. J.; Sandler, D. P. The Prevalence of ADHD in a Population-Based Sample. Journal of Attention Disorders 2015, 19(9), 741–754. [Google Scholar] [CrossRef]
- Santosa, H.; Aarabi, A.; Perlman, S. B.; Huppert, T. J. Characterization and correction of the false-discovery rates in resting state connectivity using functional near-infrared spectroscopy. Journal of Biomedical Optics 2017, 22(5), 055002. [Google Scholar] [CrossRef]
- Santosa, H.; Zhai, X.; Fishburn, F.; Huppert, T. The NIRS brain AnalyzIR toolbox. Algorithms 2018, 11(5), 73. [Google Scholar] [CrossRef] [PubMed]
- Scahill, L.; Schwab-Stone, M. Epidemiology of ADHD in School-Age Children. Child and Adolescent Psychiatric Clinics of North America 2000, 9(3), 541–555. [Google Scholar] [CrossRef]
- Skoglund, C.; Poromaa, I. S.; Leksell, D.; Selling K., E.; Cars, T.; Giacobini, M.; Young, S.; Kallner, H. K. Time after time: failure to identify and support females with ADHD-a Swedish population register study. Journal of Child Psychology and Psychiatry 2024, 65(6), 832–844. [Google Scholar] [CrossRef]
- Stephens, R. L.; Elsayed, H. E.; Reznick, J. S.; Crais, E. R.; Watson, L. R. Infant Attentional Behaviors Are Associated with ADHD Symptomatology and Executive Function in Early Childhood. Journal of Attention Disorders 2021, 25(13), 1908–1918. [Google Scholar] [CrossRef]
- Stringaris, A.; Goodman, R.; Ferdinando, S.; Razdan, V.; Muhrer, E.; Leibenluft, E.; Brotman, M. A. The Affective Reactivity Index: A concise irritability scale for clinical and research settings. J Child Psychol Psychiatry 2012, 9. [Google Scholar]
- Thomas, R.; Sanders, S.; Doust, J.; Beller, E.; Glasziou, P. Prevalence of Attention-Deficit/Hyperactivity Disorder: A Systematic Review and Meta-analysis. Pediatrics 2015, 135(4), e994–e1001. [Google Scholar] [CrossRef]
- Vanderwal, T.; Kelly, C.; Eilbott, J.; Mayes, L.C.; Castellanos, F.X. Inscapes: A movie paradigm to improve compliance in functional magnetic resonance imaging. NeuroImage 2015, 122(15), 222–232. [Google Scholar] [CrossRef]
- Wang, X.; Yang, C.; Dong, W.; Zhang, Q.; Ma, S.; Zang, Y.; Yuan, L. Impaired segregation of the attention deficit hyperactivity disorder related pattern in children. Journal of Psychiatric Research 2024, 170, 111–121. [Google Scholar] [CrossRef] [PubMed]
- Willcutt, E. G. The prevalence of DSM-IV attention-deficit/hyperactivity disorder: A meta-analytic review. Neurotherapeutics: The Journal of the American Society for Experimental NeuroTherapeutics 2012, 9(3), 490–499. [Google Scholar] [CrossRef] [PubMed]
- Yoshimasu, K.; Barbaresi, W. J.; Colligan, R. C.; Voigt, R. G.; Killian, J. M.; Weaver, A. L.; Katusic, S. K. Childhood ADHD is strongly associated with a broad range of psychiatric disorders during adolescence: A population-based birth cohort study. Journal of Child Psychology and Psychiatry, and Allied Disciplines 2012, 53(10), 1036–1043. [Google Scholar] [CrossRef] [PubMed]
- Zelman, J. J.; Ferro, M. A. The Parental Stress Scale: Psychometric Properties in Families of Children with Chronic Health Conditions: The Parental Stress Scale. Family Relations 2018, 67(2), 240–252. [Google Scholar] [CrossRef]
- Zhang, H.; Shen, D.; Lin, W. Resting-state functional MRI studies on infant brains: A decade of gap-filling efforts. NeuroImage 2019, 185, 664–684. [Google Scholar] [CrossRef]
|
Disclaimer/Publisher’s Note: The statements, opinions and data contained in all publications are solely those of the individual author(s) and contributor(s) and not of MDPI and/or the editor(s). MDPI and/or the editor(s) disclaim responsibility for any injury to people or property resulting from any ideas, methods, instructions or products referred to in the content. |
© 2025 by the authors. Licensee MDPI, Basel, Switzerland. This article is an open access article distributed under the terms and conditions of the Creative Commons Attribution (CC BY) license (http://creativecommons.org/licenses/by/4.0/).