Preprint
Article

This version is not peer-reviewed.

Factors Influencing Dietary Diversity among Primary School Adolescents in Addis Ababa, Ethiopia: A Cross‐Sectional Study

Submitted:

11 March 2025

Posted:

12 March 2025

You are already at the latest version

Abstract

Objective: To investigate the factors influencing dietary diversity of 24-hour meals among primary school adolescents in Addis Ababa, Ethiopia.Design: A cross-sectional study was conducted.Setting: Public primary schools in Addis Ababa, Ethiopia.Participants: A total of 293 students were selected through simple random sampling, ensuring a representative sample of the adolescent population.Outcome Measure (s): Dietary diversity was assessed using the Food and Agriculture Organization's (FAO) 12 food group categories. The Individual Dietary Diversity Score (IDDS) was calculated to quantify dietary diversity.Analysis: Bivariable and multivariable analyses were performed to identify associations between dietary diversity and potential influencing factors. Odds ratios (OR) with 95% confidence intervals (CI) were calculated, with significance set at P < 0.05.Results: The average Dietary Diversity Score (DDS) for school meals was 3.45 (±1.16), while for outside-school meals, it was 3.59 (±1.13). The proportion of students with adequate dietary diversity was 52.24% for within-school meals and 56.68% for outside-school meals. Significant factors influencing dietary diversity included higher family income (adjusted odds ratio [AOR] = 2.5, 95% CI = 1.574-4.877), higher education level of parents (AOR = 4.3, 95% CI = 1.358-13.44), smaller family size (AOR = 2.6, 95% CI = 1.02-6.702), and medium-sized family (AOR = 2.42, 95% CI = 1.199-4.88).Conclusions and implications: Promoting dietary diversity among adolescents is crucial for fostering healthier eating habits and improving nutritional outcomes. Key factors influencing dietary diversity include family income, parental education, and family size. Interventions should focus on enhancing food access, addressing income disparities, providing educational resources on nutrition, and collaborating with local food suppliers. Prioritizing dietary diversity in school feeding programs can significantly improve health outcomes and establish lifelong healthy eating habits. Comprehensive strategies involving schools, families, community stakeholders, and policymakers are essential for effective implementation. Future research should evaluate the long-term impacts of these interventions on dietary diversity and overall health outcomes among adolescents.

Keywords: 
;  ;  ;  

Introduction

Adolescents constitute more than 16% of the global population, totaling approximately 1.2 billion, with even higher proportions in Sub-Saharan Africa (SSA), reaching 23% [1]. This critical developmental period, defined by the World Health Organization (WHO) as spanning from 10 to 19 years of age, is further divided into early adolescence (10-13 years), mid-adolescence (14-16 years), and late adolescence (17-19 years) [2]. During this phase, adolescents experience significant physical growth and psychosocial changes, necessitating increased caloric and nutrient intake to support their development [2].
Nutrition plays a pivotal role in the health and development of children and adolescents throughout their "first 8000 days" [3]. School meal programs are particularly important, as they provide essential benefits, including reducing malnutrition, preventing overweight and obesity, improving school attendance and academic performance, and promoting gender equity in education [3,4,5,6,7]. Inadequate nutrition during adolescence can have long-lasting effects on cognitive development, potentially leading to decreased learning ability, poor concentration, and impaired academic performance [8].
Despite the recognized importance of dietary diversity among adolescents, its assessment remains limited in many developing countries, including Ethiopia, where there is a scarcity of data on adolescent nutrition [9]. Previous studies in Ethiopia have predominantly focused on the overall nutritional status of adolescents, identifying chronic deficiencies and issues related to overweight and obesity. While dietary diversity has been acknowledged as a determinant of malnutrition, the factors influencing dietary diversity itself have not been thoroughly explored [10,11,12,13,14,15,16]. Notably, consecutive reports from the Ethiopia Demographic and Health Survey have failed to include or analyze the dietary diversity of adolescents [17,18,19].
The eating patterns of adolescents are shaped by a myriad of factors, including lifestyle choices, food marketing, media influence, socioeconomic status, and cultural norms [20]. This study aims to assess and identify the factors influencing the dietary diversity of 24-hour meals among public primary school adolescents in Addis Ababa, Ethiopia. The findings will provide valuable insights into the determinants of adolescents' dietary diversity and offer implications for promoting healthier eating habits within this population.

Methods

Study Setting, Design and Period

In April 2023, a cross-sectional study was conducted among school adolescents in Addis Ababa, focusing on 20 public primary schools in five sub-cities. Addis Ababa, a significant and diverse city, is projected to have over 5 million residents by 2036. The city has a city-wide school feeding program that caters to approximately 638,857 students across 264 public primary schools [21]. It also faces socio-economic challenges such as high unemployment, poverty, and food insecurity [22].

Sampling Procedure

The study employed a multi-stage sampling approach. Firstly, five sub-cities were randomly selected from the eleven in Addis Ababa. Secondly, a purposive sampling method was used to select 20 public primary schools, justified by their representation of diverse socio-economic backgrounds. Within each sub-city, four schools were randomly chosen. Finally, study participants from grades 6 and 7 were selected using simple random sampling, ensuring proportional allocation based on school size.

Sample Size Determination

The sample size of the study participants was determined based on the literature, using a formula that considers the standard deviation (SD) of the outcome variable (σ) and the desired margin of error (E) with a significance level (α) of 0.05 [23]. The literature provided a standard deviation value of 34.0 for food energy gained from school meals. By applying the formula based on the mean of a continuous outcome variable in a single population, a sample size of 294 participants was determined [23,24] . Using the formula n = z σ ϵ 2 where
z = 1.96 (z-score for a 95% confidence level)
σ = 34.0 (standard deviation), and
ϵ = 5 (margin of error of 5 units)
n = 1.96 34.0 5 2 = 177.64
The calculated sample size is approximately 177.64. After adding 10% of this value (approximately 18), the adjusted sample size becomes 196 participants. Applying a design effect of 1.5 results in a final sample size of 294 participants.

Source and Study Population

The source population for this study consisted of all adolescents attending public primary schools in Addis Ababa. The study population comprised adolescents in grades 6 and 7 who were enrolled in the selected public primary schools during the study period.

Data Collection Tools and Procedures

The dietary diversity of adolescents in this study was assessed using the Individual Dietary Diversity Score (IDDS) following the guidelines of the Food and Agriculture Organization (FAO) [25,26]. A total of 12 food groups were assigned a score of 1 each, with a maximum score of 12. The Dietary Diversity Score (DDS) was calculated by summing the number of distinct food groups consumed within a 24-hour recall period. The scores were categorized as low (less than 5 food groups), medium (5-6 food groups), and high (7-12 food groups) to analyze dietary patterns and identify individuals with varying levels of dietary diversity [27,28]. Written consent was obtained from the parents of participants under 18 years old, and the data collectors introduced themselves, explained the study's purpose, and obtained verbal assent from each participant. Nutrition counseling was provided by trained nutritionists to encourage diversified dietary habits, with follow-up assessments to evaluate its effectiveness.

Dietary Assessment and Data Collection

The study employed the adapted multiple-pass 24-hour recall method by Gibson and Ferguson to collect detailed information on food type and quantity [29]. This method, known as the "four passes," was tailored for the Ethiopian context to account for local dietary practices. Pass 1 involved participants listing all foods and drinks consumed throughout the day, including night-time intake. Pass 2 obtained detailed descriptions of the listed items, including preparation method, source, state, and presentation. Pass 3 focused on estimating portion sizes using various methods such as direct weight measurement, standard unit sizes, and proxy weight estimation using aids like play dough or rice. Pass 4 involved reviewing the data for accuracy and identifying errors. The multiple-pass 24-hour recall method provided precise and systematic information on dietary intake, including food and drink types, portion sizes, and recipe details.

Quality Assurance

Prior to data collection, a pre-test was conducted with a sample of 30 adolescents from a similar demographic to assess the clarity and effectiveness of the questionnaire. Based on the pre-test findings, minor adjustments were made to the wording of questions to enhance understanding. A comprehensive three-day training was provided to supervisors, editors, coders, and data collectors, focusing on ODK organization, interview skills, and 24-hour recall interviews. The questionnaire was initially prepared in English and translated into Amharic. Rigorous oversight measures were implemented, including daily examinations. Supervisors ensured form completeness and maintained data integrity throughout the process.

Ethical Standards Disclosure

This study (IRB/04/2015/2023) received ethical approval from the Institutional Review Board of the College of Natural and Computational Sciences, Addis Ababa University (CNS–IRB). Written informed consent was obtained from all participants, and parental or guardian consent was obtained for minors, ensuring adherence to ethical standards. Strict privacy and ethical considerations were followed during data management, including secure data storage and restricted access to personal information.

Data Analysis

The study employed a classification-based approach to calculate the Dietary Diversity Score (DDS), categorizing participants into low (less than 5 food groups), medium (5-6 food groups), and high (7-12 food groups) levels of dietary diversity. Data were collected and entered into the Open Data Kit (ODK) software, followed by a rigorous cleaning process to ensure accuracy. The cleaned dataset was then exported to STATA software for statistical analysis. Descriptive statistics, including mean, median, standard deviations, interquartile range, and frequency tables, were used to summarize the characteristics of the study sample and the DDS. Wealth groups were categorized as low, middle, and high. Bivariate and multivariate logistic regression analyses were conducted to assess associations, with adjusted odds ratios (AOR) and 95% confidence intervals (CI) computed. Variables with a p-value less than 0.05 were considered statistically significant. The logistic regression model's goodness of fit was evaluated using the Hosmer and Lemeshow test, which assesses how well the model fits the data, with a significance level set at 0.64. Missing data were handled using multiple imputation techniques to ensure robust statistical analysis.

Results

Socio-Demographic Characteristics of Study Participants

Table 1 summarizes the socio-demographic data of the respondents. Among the school children, 59% were male, reflecting a slight gender imbalance. Similarly, 60.75% of household heads were male. Most household heads (70.31%) were married, indicating stable family structures.
In terms of education, 39.25% of household heads had completed primary school, suggesting a significant portion with limited educational attainment. A high unemployment rate of 73.7% among household heads indicates economic challenges. However, 49.49% reported monthly earnings exceeding 5,000 ETB, suggesting some families have alternative income sources.

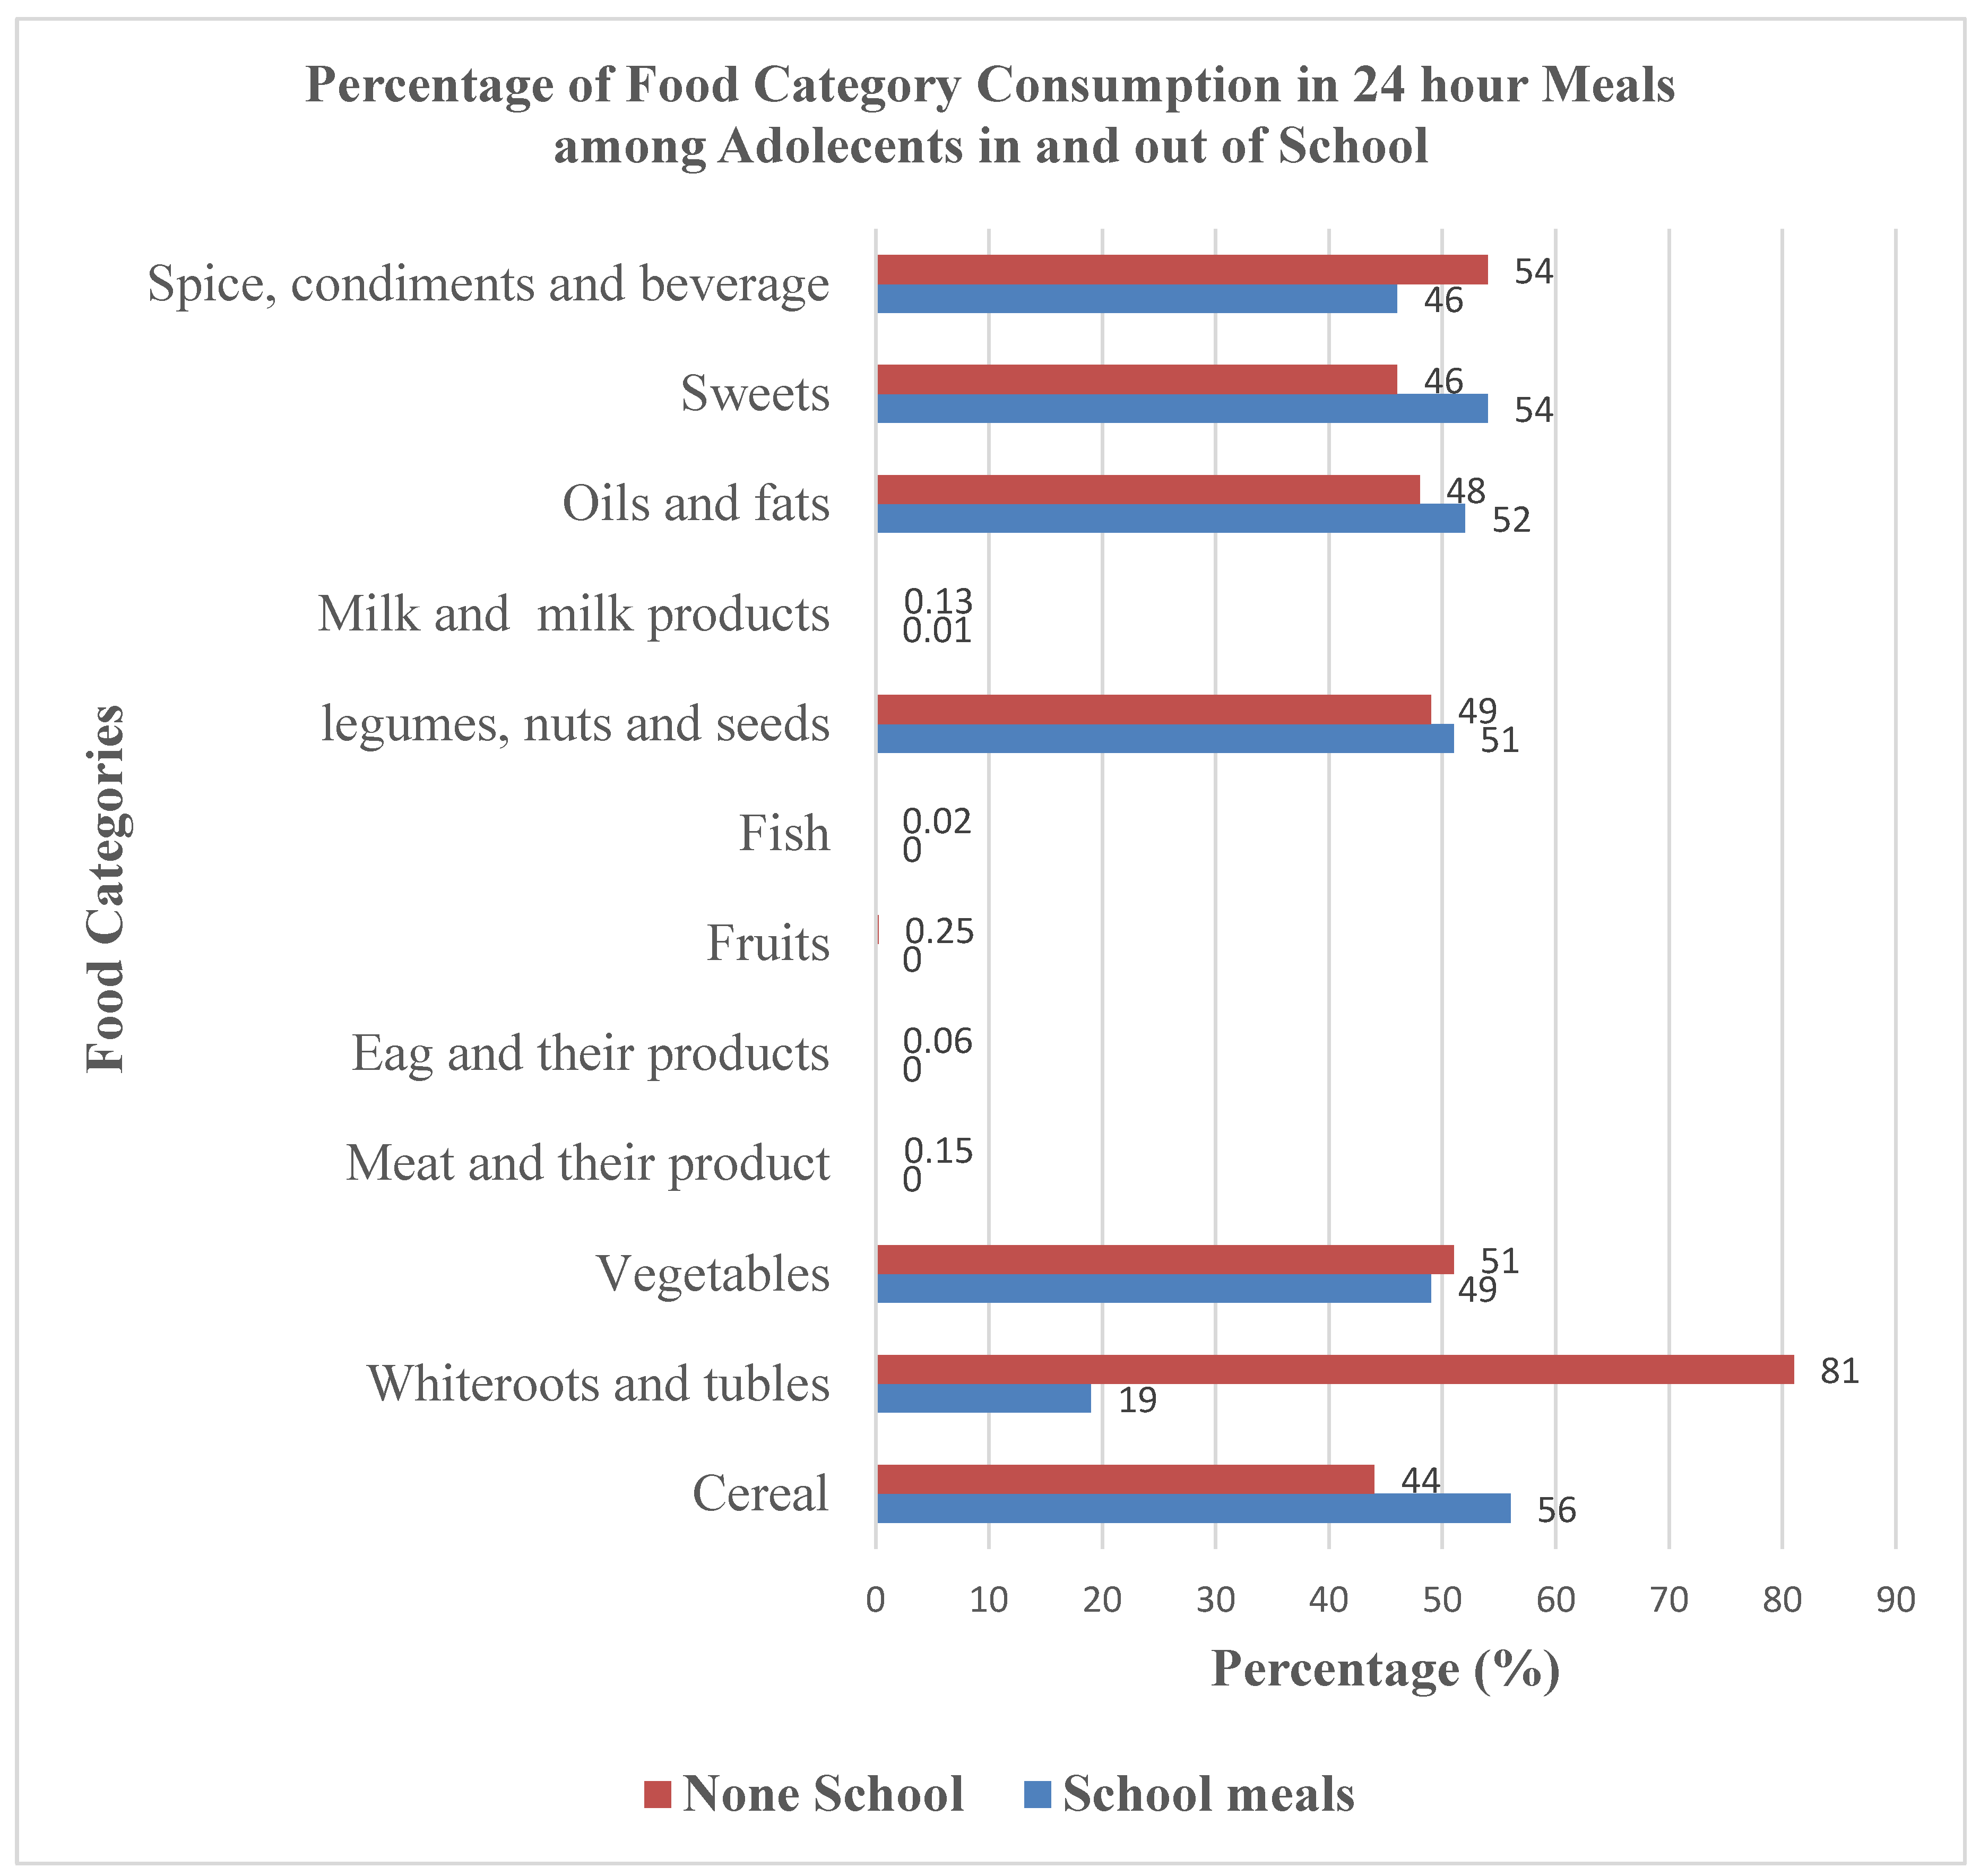
Comparing Food Category Consumption: School Meals Versus Meals Outside of School Among Adolescents

Figure 1 illustrates significant differences in food category consumption between school meals and meals consumed outside of school among adolescents. Within school meals, cereals are the most frequently consumed category, representing 56.0% of total consumption. Additionally, vegetables, legumes, nuts, and oil seeds account for 48.9%, while oils and fats constitute 52.3%. Notably, fish, fruits, eggs and their products, meat and their products, and milk and milk products are absent from school meals, indicating a lack of protein and dairy sources in these meals.
In contrast, meals consumed outside of school show a different consumption pattern. White roots and tubers dominate, comprising 81.0% of total consumption. Vegetables, legumes, nuts, and oil seeds account for 51.1%, while spices, condiments, and beverages represent 53.6%. The diversity in food categories consumed outside of school highlights potential nutritional advantages compared to school meals, particularly in terms of carbohydrate sources and the inclusion of a wider variety of food groups.

Dietary Diversity Score of School Meals and Out-of-School Meals

Table 2 presents the distribution of the Dietary Diversity Score (DDS) for 24-hour meals among public primary school adolescents, comparing meals provided in a school setting to those consumed outside of school. The mean DDS for meals served in the school environment is 3.45 ± 1.16, while meals taken outside the classroom have a mean DDS of 3.59 ± 1.13.
Among the meals provided in school, 52.24% of the total 293 meals achieved a DDS of 5 or higher, indicating adequate dietary diversity. However, 47.76% of these meals had a DDS below 4, reflecting inadequate dietary diversity. In contrast, for meals consumed outside of school, 56.68% had a DDS of 5 or higher, suggesting better dietary diversity, while 43.32% of out-of-school meals scored below 5, indicating inadequate dietary diversity.
Overall, a higher percentage of meals consumed outside of school (56.68%) achieved an adequate DDS compared to those provided within the school setting (52.24%). These findings highlight the need for targeted interventions to improve the nutritional quality and variety of meals in both settings, with the goal of increasing the proportion of meals that meet adequate dietary diversity standards.

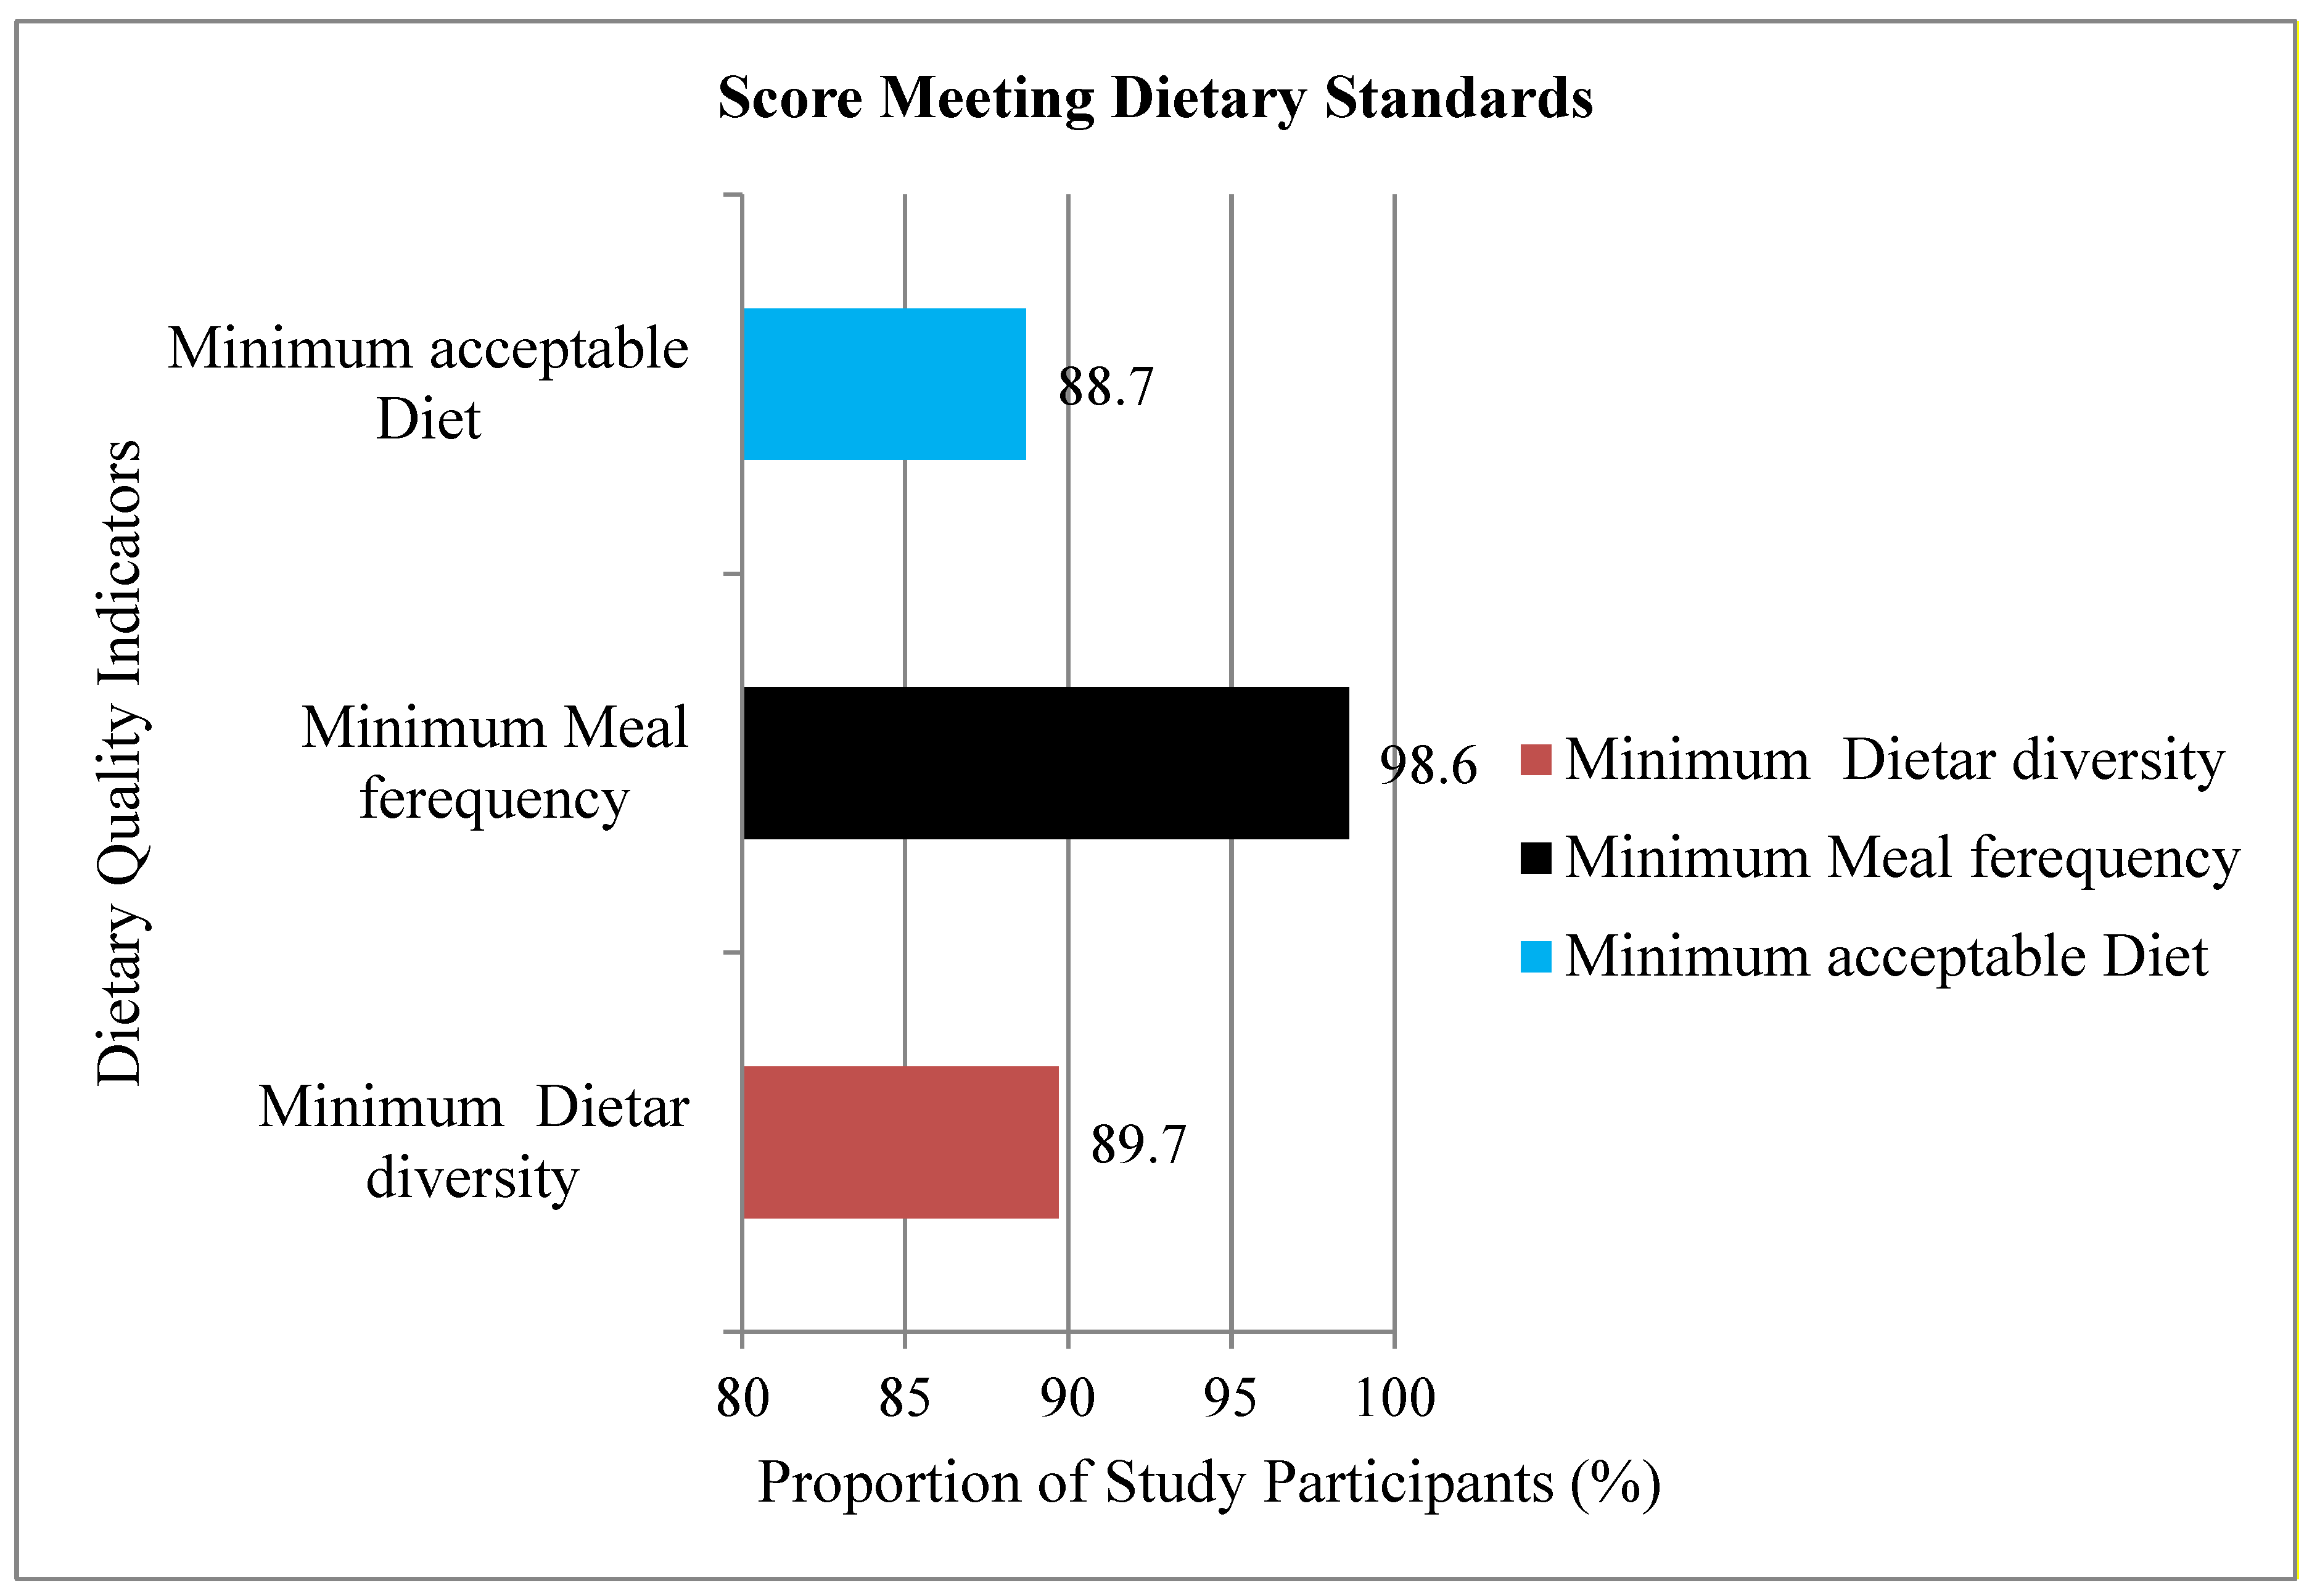
Compliance with Minimum Dietary Diversity, Minimum Meal Frequency, and Minimum Acceptable Diet

This study examined three key indicators of dietary quality: minimum dietary diversity (MDD), minimum meal frequency (MMF), and minimum acceptable diet (MAD). MDD measures the proportion of participants consuming at least five food categories, while MMF indicates the percentage of participants meeting the recommended meal frequencies. MAD represents participants who meet both MDD and MMF criteria.
The findings reveal a high percentage of participants meeting the MDD requirement, with 89.7% consuming at least five food groups. Furthermore, 98.6% of participants met the recommended minimum meal frequency, demonstrating strong adherence to dietary guidelines. The MAD, which combines both MDD and MMF criteria, was recorded at 88.7%.
These results indicate a positive trend in dietary practices among the participants and underscore the effectiveness of current nutritional interventions (Figure 2). However, while the high compliance rates are encouraging, it is essential to further investigate the quality and variety of food sources within the consumed categories to ensure that the nutritional needs of the participants are fully met. Additionally, exploring potential barriers that may affect dietary compliance in different contexts could provide valuable insights for future interventions.

Regression Analysis of Dietary Diversity Score (DDS) for 24-Hour Meals

The regression analysis revealed a significant association between family income and the Dietary Diversity Score (DDS) for 24-hour meals. Individuals with a family income above 5000 ETB had notably higher odds of achieving a higher DDS compared to those with an income range of 2000-5000 ETB. The adjusted odds ratio (AOR) for the income group above 5000 ETB was 2.485, with a 95% confidence interval (CI) of 0.263 to 2.1.
This finding indicates that higher family income is positively linked to greater dietary diversity in 24-hour meals. Families with higher incomes generally have improved access to a wider variety of foods, including more nutritious options, which contributes to a higher DDS. The results underline the crucial role of economic factors in determining the quality and diversity of food consumed within a 24-hour period.
Table 3. Bivariate and multivariate logistic regression analysis of (DDS) for the 24-hour meals.
Independent Variables Factors Associated with Dietary Diversity Score of 24-Hour Meals
COR (95% CI) p-value AOR p-value (95% CI)
Sex of adolescence(Reference: Female) 1
Male 0.90 0.44,1.87 0.78 0.987 0.973 -.681,0.87
Gender of the household head (reference: female) 1 .
Male 1.05 0.51,2.15 0.547 1.041 0.936 -1.07, 1.01
Marital status of the household head (reference: widowed) 1 .
Divorced 2.321 .512,10.5 0.275 2.154 0.338 -.0.84, 2.5
Married 1.236 .438,3.48 0.688 1.462 0.568 -1.14, 1.6
Unmarried 1.964 .205,18.77 0.558 1.886 0.598 -2.2, 2.7
Educational Status (reference: illiterates) 1 .
Secondary 0.955 .179, 5.08 0.957 0.862 0.873 -1.5, 2.45
College and above 0.611 0.126, 2.97 0.542 0.466 0.408 -2.2, 1.7
Occupation
(reference: Unemployed)
1 .
Employed 0.989 0.44, 2.22 0.979 1.03 0.948 -.599, 1.47
Family income (Reference:2000-5000) 1 .
<2000 1.2 0.46, 3.12 0.709 1.104 0.851 -.854, 1.31
>5000 2.495 1.11, 5.59 0.026** 2.485 0.035** 0.263, 2.1
Family size
Reference (>6)
1
1-3 0.406 0.12,1.4 0.154 2.146 0.744 -2.4, 0.397
4-6 0.427 0.1,1.8 0.249 0.839 0.973 -2.72, 0.49

Regression Analysis of Dietary Diversity Score (DDS) for out-of-School Meals

The regression analysis revealed significant associations between education level, occupation, family income, family size, and dietary diversity in non-school meals. Notably, education level demonstrated a clear relationship, with higher levels of education associated with greater dietary diversity. Participants with primary school education had an adjusted odds ratio (AOR) of 2.773, while those with secondary school education exhibited an AOR of 3.312. The highest education level, college and above, had the strongest impact, with an AOR of 4.270.
Occupation also played a crucial role, as being employed was linked to higher dietary diversity, with an AOR of 1.880. Family income was significantly associated with dietary diversity; participants from higher-income families (above 5000 ETB) showed an AOR of 2.770, indicating that increased financial resources enhance access to a wider variety of food options.
Family size further influenced dietary diversity; individuals from smaller families (1-3 members) had an AOR of 2.610, and those from families of sizes 4-6 had an AOR of 2.420. These findings indicate that education level, occupation, family income, and family size significantly impact the diversity of diets in non-school meals.
Table 4. Bivariate and multivariate analysis of factors associated with dietary diversity of out-of-school meals2023 (n=293).
Independent Variables Factors Influencing the Dietary Diversity of Non-School Meals
COR P-Value [95% CI] AOR p-value [95 % CI]
Sex of Child:
Female

1
Male 0.904 0.674 .566, 1.444 .885 .639 0.531-1.475
Family head Gender Female 1 .
Male 0.99 0.995 .623 , 1.60 .628 .179 0.318-1.238
Marital status Widowed 1
Divorced 1.765 .227 .702, 4.44 1.207 .713 0.443-3.283
Married 1.547 .247 .739 3.24 1.098 .847 0.426-2.83
unmarried 1.68 .447 .441 6.39 1.292 .731 0.3-5.565
Education
illiterate
1 1 .
Primary school 2.559 .053* 0.98, 6.64 2.773 .053* 0.986-7.796
Secondary school 3.35 .018** 1.23, 9.12 3.312 .037** 1.077-10.19
College and above 4.94 .002*** 1.88 14.32 4.27 .013** 1.358-13.44
Occupation unemployed 1 1
Employed 2.30 0.003*** 1.32, 4.01 1.88 .047** 1.01-3.49
Family income ~2000-5000 ETB 1
<2000 ETB 0.82 0.573 0.411, 1.64 1.15 .714 0.543-2.441
>5000 ETB 2.196 0.000*** 1.13, 4.26 2.77 0.000*** 1.574-4.877
Family size
(>6)
1 1
1-3 1.779 0.158 0.79, 3.96 2.61 .045** 1.02-6.702
4-6 1.9 0.051* 0.99, 3.62 2.42 .014 1.199-4.88
*** p<.01, ** p<.05, * p<.1.

Discussion

In the present study, the prevalence of inadequate dietary diversity among adolescents was found to be approximately 47.8% for meals provided within a school setting and 43.3% for meals consumed outside of school. These findings are consistent with a study conducted in the Amhara region among female adolescents [30], and another study in the same region in Woldia, Northeast Ethiopia [31]. However, the prevalence is lower than a study conducted in Jimma, which reported a rate of 80.5% [32]. These variations in dietary diversity levels could be attributed to differences in the reference period used, the number of food groups included in the scoring system, and variations in the study settings. Additionally, cultural norms, food availability, and socioeconomic status can also influence dietary diversity. It is important to consider these factors when interpreting and comparing results to identify potential sources of variation in dietary diversity.
Comparing our findings to a study conducted in Iran among female adolescents, which reported a prevalence of 21.3% [33], our observed dietary diversity rates are higher. This difference could be attributed to socioeconomic disparities between the study populations, with participants in our study potentially having better access to a wider variety of foods due to higher socioeconomic status or other factors promoting diversified food consumption.
The mean Dietary Diversity Score (DDS) in our study was 5.6 (±0.9), consistent with findings from studies conducted in India [33], the Amhara region among female adolescents, the Tigray region among female adolescents [34], and Bangladesh among adult females 4.28 [35]. However, our mean DDS was lower compared to studies conducted in Ahvaz (6.81) [33], and Tehran (6.25) [36]. Differences in the food groups included in the scoring system and socioeconomic disparities among study participants could potentially explain the variation in DDS.
An interesting finding in our study is that all participants reported consuming cereals, which aligns with findings from studies conducted in Mozambique [37], and Ghana [38]. The widespread consumption of cereals can be attributed to their abundant production and high accessibility in the market. We observed that adolescents living in larger families (four or more members) had a 2.4 times higher prevalence of inadequate dietary diversity compared to those in smaller families. This finding is consistent with studies conducted in South Africa [39] and Ethiopia [15,31]. It is crucial to note that as the number of family members increases, economic challenges may arise in meeting the family's needs. Individuals in larger families may face difficulties allocating sufficient time and resources to maintain a higher quality diet.
Thus, our findings highlight the prevalence of inadequate dietary diversity among adolescents and the factors that influence it. Understanding these factors and their implications is crucial for the development of targeted interventions and policies to improve dietary diversity. By addressing socioeconomic disparities, promoting access to a diverse range of foods, and considering cultural norms and family dynamics, we can work towards fostering healthier eating habits and improving the overall well-being of adolescents.
There are several limitations to consider in this study. Firstly, the cross-sectional design restricts our ability to establish causality between the identified factors and dietary diversity. Longitudinal studies would provide more robust evidence in this regard. Secondly, the study focused on a specific geographical area, Addis Ababa, and may not be generalizable to other regions in Ethiopia. Additionally, the reliance on self-reported data for dietary assessment introduces the possibility of recall bias and social desirability bias. Future research should consider employing objective measures or a combination of methods to enhance the accuracy of dietary assessment. Lastly, the study did not explore cultural and social factors that may influence dietary diversity, which could provide valuable insights for future investigations. Despite these limitations, this study contributes to our understanding of the factors influencing adolescent dietary diversity and provides valuable implications for interventions and policy development.

Implications for Research and Practice

The findings emphasize the importance of considering education level, occupational status, family income, and family size when developing policies and interventions to promote healthier eating habits. Future research should focus on exploring effective strategies to provide equitable access to diverse and nutritious food choices, regardless of demographic characteristics. This includes investigating the barriers that different socioeconomic groups face in accessing healthy food and identifying local resources that can be leveraged to improve food security.
Strengthening and enhancing school meal programs by incorporating a variety of food categories, such as fish, fruits, eggs, meat, and dairy products, can significantly improve the nutritional quality of meals provided within the school setting. Additionally, implementing training programs for school staff on nutrition and food preparation can further enhance the effectiveness of these meal programs.
To support healthier eating habits, it is crucial to educate parents and caregivers about making nutritious meal selections and preparations. This can be achieved through workshops, informational campaigns, and resources that provide practical cooking tips and meal planning strategies. Collaborating with local food suppliers and implementing community-based interventions can improve access to affordable and nutritious food options for students both in and out of school.
Moreover, interventions and policies should be designed to consider not only socioeconomic factors but also cultural preferences and dietary restrictions to ensure their effectiveness across diverse populations. Engaging community stakeholders in the development and implementation of these programs can foster greater acceptance and participation.
By addressing these factors comprehensively, we can promote a diverse and balanced diet for individuals, contributing to their overall health and well-being. Future studies should evaluate the long-term impacts of these interventions on dietary diversity and health outcomes, providing data that can guide ongoing improvements in nutrition policies and programs.

Author Contributions

YT conceptualized the research, developed the study design, facilitated data collection, performed data curation and analysis, and led project administration. YT also wrote the original draft, edited, and approved the final version of the article, with access to and verification of the underlying data.

Funding

None.

Acknowledgments

We thank the Addis Ababa Education Bureau for their support and express our gratitude to the sub-cities, public primary schools, study participants, and data collectors for their cooperation and contributions to this research.

Conflicts of Interest

None.

References

  1. Isabirye N, Bukenya JN, Nakafeero M, Ssekamatte T, Guwatudde D, Fawzi W. Dietary diversity and associated factors among adolescents in eastern Uganda: A cross-sectional study. BMC Public Health. 2020;20(1):4-11. [CrossRef]
  2. Textbook N. Nelson Textbook of Pediatrics, Nineteenth Edition International Edition.
  3. School Meals and Food Systems: Rethinking the Consequences for Climate, Environment, Biodiversity and Food Sovereignty.; 2023.
  4. Chakraborty T, Jayaraman R. School feeding and learning achievement : Evidence from India ’ s midday meal program. J Dev Econ. 2019;139(April):249-265. [CrossRef]
  5. Langford, R., Bonell, C. P., Jones, H. E., Pouliou, T., Murphy, S. M., Waters, E., Komro, K. A., Gibbs L, F., Magnus, D., & Campbell R. The WHO Health Promoting School framework for improving the health and well-being of students and their academic achievement. Cochrane Database Syst Rev. Published online 2014. [CrossRef]
  6. Effects of a school feeding intervention on school attendance rates among elementary schoolchildren in rural Kenya . Nutrition. 2011;27(2):2011. [CrossRef]
  7. Snilstveit B, Gallagher E, Phillips D; et al. Protocol Interventions for improving learning outcomes and access to education in low- and middle- income countries : A systematic review. (September 2017).
  8. Abahussain NA. O riginal Article Was there a change in the body mass index of Saudi adolescent girls in Al-Khobar between 1997 and 2007 ? 2011;18(2):15-19. [CrossRef]
  9. Ochola S, Masibo PK iny. Dietary intake of schoolchildren and adolescents in developing countries. Ann Nutr Metab. 2014;64:24-40. [CrossRef]
  10. Aemro M, Mesele M, Birhanu Z, Atenafu A. Dietary diversity and meal frequency practices among infant and young children aged 6-23 months in Ethiopia: A secondary analysis of Ethiopian Demographic and Health Survey 2011. J Nutr Metab. 2013;2013. [CrossRef]
  11. Ali D, Saha KK, Nguyen PH; et al. Household food insecurity is associated with higher child undernutrition in Bangladesh, Ethiopia, and Vietnam, but the effect is not mediated by child dietary diversity. J Nutr. 2013;143(12):2015-2021. [CrossRef]
  12. Nguyen PH, Avula R, Ruel MT; et al. Maternal and child dietary diversity are associated in bangladesh, vietnam, and ethiopia. J Nutr. 2013;143(7):1176-1183. [CrossRef]
  13. Beyene M, Worku AG, Wassie MM. Dietary diversity, meal frequency and associated factors among infant and young children in Northwest Ethiopia: A cross-sectional study. BMC Public Health. 2015;15(1):1-9. [CrossRef]
  14. Wondafrash M, Huybregts L, Lachat C, Bouckaert KP, Kolsteren P. Dietary diversity predicts dietary quality regardless of season in 6-12-month-old infants in south-west Ethiopia. Public Health Nutr. 2016;19(14):2485-2494. [CrossRef]
  15. Workicho A, Belachew T, Feyissa GT; et al. Household dietary diversity and Animal Source Food consumption in Ethiopia: Evidence from the 2011 Welfare Monitoring Survey. BMC Public Health. 2016;16(1):0-11. [CrossRef]
  16. Zerfu TA, Umeta M, Baye K. Dietary diversity during pregnancy is associated with reduced risk of maternal anemia, preterm delivery, and low birth weight in a prospective cohort study in rural Ethiopia. Am J Clin Nutr. 2016;103(6):1482-1488. [CrossRef]
  17. Central Statistical Agency [Ethiopia], ICF International. Ethiopia Demographic and Health Survey 2011. Published online 2012:1-452.
  18. ICF CSAE and. Ethiopia Demographic and Health Survey.; 2016.
  19. Yisma E, Smithers LG, Lynch JW, Mol BW. Cesarean section in Ethiopia: Prevalence and sociodemographic characteristics. J Matern Neonatal Med. 2019;32(7):1130-1135. [CrossRef]
  20. WHO. Nutrition in Adolescence Issues and Challenges for the Health Sector : Issues in adolescent health and development. Ganeva WHO Press. Published online 2005:1-115. https://apps.who.int/iris/bitstream/handle/10665/43342/9241593660_eng.pdf.
  21. MoE. Federal Democratic Republic of Ethiopia, Ministry of Education Statistics Annual Abstract (ESAA).; 2022. file:///C:/Users/HP/Downloads/ESAA 2014 EC (2021-22 G.C) Final.pdf%0Awebsite: www.moe.gov.et Email:.
  22. Gezahegn et al. City Profile: Addis Ababa.; 2017. [CrossRef]
  23. Oakland GB. Determining Sample Size. Univ Florida, Gainesville, FL 32611. 1953;85(3):108-113. [CrossRef]
  24. Destaw Z, Wencheko E, Kidane S; et al. School feeding contributed valuable dietary energy and nutrients despite suboptimal supply to school-age children and adolescents at primary schools in Addis Ababa, Ethiopia. Nutrition. 2022;102. [CrossRef]
  25. Gina Kennedy, Terri Ballard and M-CD. Guidelines for Measuring Household and Individual Dietary Diversity. European Union, through the EC-FAO; 2013. www.foodsec.org.
  26. Horsey B, Swanepoel L, Underhill S, Aliakbari J, Burkhart S. Dietary Diversity of an Adult Solomon Islands Population. Nutrients. 2019;11(7):1-14. [CrossRef]
  27. Mbwana HA, Kinabo J, Lambert C, Biesalski HK. Determinants of household dietary practices in rural Tanzania: Implications for nutrition interventions. Cogent Food Agric. 2016;2(1). [CrossRef]
  28. Khamis AG, Ntwenya JE, Senkoro M; et al. Association between dietary diversity with overweight and obesity: A cross-sectional study conducted among pastoralists in Monduli District in Tanzania. PLoS ONE. 2021;16(1 January):1-14. [CrossRef]
  29. Gibson R. An Interactive 24-Hour Recall of Assessing the Adequacy of Iron and Zinc Intakes in Developing Countries. Vol 10.; 1989.
  30. Wassie MM, Gete AA, Yesuf ME, Alene GD, Belay A, Moges T. Predictors of nutritional status of Ethiopian adolescent girls: A community based cross sectional study. BMC Nutr. 2015;1(1):1-7. [CrossRef]
  31. Endalifer ML, Andargie G, Mohammed B, Endalifer BL. Factors associated with dietary diversity among adolescents in Woldia, Northeast Ethiopia. BMC Nutr. 2021;7(1):1-8. [CrossRef]
  32. Belachew T, Lindstrom D, Gebremariam A; et al. Food Insecurity, Food Based Coping Strategies and Suboptimal Dietary Practices of Adolescents in Jimma Zone Southwest Ethiopia. PLoS ONE. 2013;8(3):1-9. [CrossRef]
  33. Vakili M, Abedi P, Sharifi M, Hosseini M. Dietary diversity and its related factors among adolescents: A survey in Ahvaz-Iran. Glob J Health Sci. 2013;5(2):181-186. [CrossRef]
  34. Mulugeta A, Tessema M, Kiday H, Seid O. Examining Means of Reaching Adolescent Girls for Iron Supplementation in Tigray , Northern Ethiopia. Published online 2015:9033-9045. [CrossRef]
  35. M NI, Akther F, Ss SS, Nahar Q. Journal of Nutrition & Food Sciences Assessment of Micro Nutritional Malnutrition in an Urban Area of Bangladesh among the Adult Population on the Basis of Individual Dietary Diversity Score ( IDDS ). 2015;5(3). [CrossRef]
  36. Mirmiran P, Azadbakht L, Esmaillzadeh A, Azizi F. Dietary diversity score in adolescents - A good indicator of the nutritional adequacy of diets: Tehran lipid and glucose study. Asia Pac J Clin Nutr. 2004;13(1):56-60.
  37. Korkalo L. Hidden Hunger in Adolescent Mozambican Girls : Dietary Assessment , Micronutrient Status , and Associations between Dietary Diversity and Selected Biomarkers Hidden Hunger in Adolescent Mozambican Girls : Dietary Assessment , Micronutrient Status , and As.; 2016.
  38. Nti CA, Brown A, Danquah A. Adolescents ’ Knowledge of Diet-Related Chronic Diseases and Dietary Practices in Ghana. 2012;2012(November):1527-1532.
  39. Grobler WCJ. Socio Economic Determinants of Household Dietary Diversity in a Low Income Neighbourhood in South Africa Proceedings of 30th International Business Research Conference. 2015;(April).
Figure 1. Comparison of food category consumption between school meals and out-of-school meals among adolescents in Addis Ababa, Ethiopia.
Preprints 152067 g001
Figure 2. Proportion of adolescents meeting minimum dietary diversity (MDD), minimum meal frequency (MMF), and minimum acceptable diet (MAD in Addis Ababa, Ethiopia.
Preprints 152067 g002
Table 1. Socio-demographic characteristics of grade 6 and 7 students and their parents in Addis Ababa, Ethiopia, 2023 (n=293).
Variable n %
Sex of adolescence
Female 120 40.96
Male 173 59.04
Gender of the household head
Female 115 39.25
Male 178 60.75
Marital status of the household head
Married 206 70.31
Divorced 42 14.33
Died 33 11.26
Unmarried 12 4.10
Educational status of the household head
Illiterate 24 8.19
Primary school 115 39.25
Secondary school 69 23.55
College and above 85 29.01
Household head occupation
Employed 77 26.3
Unemployed 216 73.7
Family monthly income (ETB)
<2000 48 16.38
2000-5000 100 34.13
>5000 145 49.49
Table 2. Dietary diversity of 24-hour meals among public primary school adolescents: school meals vs. out-of-school meals, 2023 (n=293).
Dietary Diversity Score Meals provided within a school setting Meals consumed outside of school
n % n %
1 6 2.1 14 4.8
2 80 27.3 76 26.1
3 54 18.4 36 12.4
4 130 44.4 116 39.9
5 21 7.2 44 15.1
6 2 0.7 5 1.7
Disclaimer/Publisher’s Note: The statements, opinions and data contained in all publications are solely those of the individual author(s) and contributor(s) and not of MDPI and/or the editor(s). MDPI and/or the editor(s) disclaim responsibility for any injury to people or property resulting from any ideas, methods, instructions or products referred to in the content.
Copyright: This open access article is published under a Creative Commons CC BY 4.0 license, which permit the free download, distribution, and reuse, provided that the author and preprint are cited in any reuse.
Prerpints.org logo

Preprints.org is a free preprint server supported by MDPI in Basel, Switzerland.

Subscribe

Disclaimer

Terms of Use

Privacy Policy

Privacy Settings

© 2025 MDPI (Basel, Switzerland) unless otherwise stated