
Submitted:
11 March 2025
Posted:
12 March 2025
You are already at the latest version
Abstract
Turbines are rotating machines that generate power by the expansion of a fluid; due to their characteristic these turbomachines are widely applied in the aerospace propulsion systems. Since due to the clearance between rotor blade tip and casing, there is a leakage flow from blade pressure to suction sides, which generates an energy loss. There are different strategies that can be applied to avoid part of this loss, one of them is by the application of the called desensitization techniques. The application of these techniques on gas turbines have been widely evaluated, however, there is a lack of these analyzes for hydraulic turbines. This work is a sequence of previous analyzes developed for the first stage of the hydraulic axial turbine used on the Space Shuttle Main Engine (SSME) Low Pressure Oxidizer Turbopump (LPOTP). The last work analyzed the application of squealer geometries at rotor tip. In the present paper, the winglet geometry techniques were investigated based on three-dimensional flowfield calculation. The commercial CFX v.19.2 and ICEM v.19.2 software were used, respectively, on the numerical simulations and computational meshes generation. Experimental results published by the National Aeronautics and Space Administration (NASA), and data from previous works, were used on the computational model validation. The parametric analysis was done by the variation in the winglet thickness and width. The results obtained shown that increasing the winglet thickness, the stage efficiency is also increased. However, its width geometrical dimension almost does not impact this result. It was verified an efficiency increase of 2.0%, over the entire turbine operational range. It was found that the proposed geometries application also changes the cavitation occurrence along the stage, which is a relevant result, since it can impact the turbine life cycle.
Keywords:
Hydraulic Axial turbine
; tip clearance
; CFD
; desensitization techniques
; winglet
; turbopump
; aerospace propulsion
1. Introduction
Turbomachines are important rotating component applied in different industrial sectors, as automotive, maritime, power generation, and aerospace. Regarding the aerospace area, it is the core of the propulsion system, widely installed in aircrafts, rockets and other subsystems to supply shaft power or energy generation. In the specific case of axial turbines, these components are designed to convert the potential energy of a high-pressure fluid in kinetic energy, by internal flowfield acceleration through the turbine’s stages [1,2]. Due to its three-dimensional and unsteady nature, this flow characteristics is very complex [3]. The internal losses are vastly studied by several researchers to better understand the flow behavior aiming design improvements associated with machine efficiency and/or performance. By the way, considering some constructive constraints, there is a gap between the rotor blade tip and casing, in which an amount of main flow leaks in this region. This leakage flow, increase the secondary flow and causes machine performance drop, because this part of the flowfield not participated integrally in the energy transfer processes between flow and rotor blade. The interaction of this secondary flow with the main flow, intensify the losses generation. With this, the tip leakage losses are one of the highest internal losses in turbomachines design. Although the gap between the rotor blade tip and the casing is small, its effects on the aerodynamics, efficiency and performance of the turbomachine are large [4], and for this reason it is desirable to make this as small as possible, in order to reduce its impact.
In general, the tip clearance has a dimension associated with some percentage of the rotor blade height, in the range of 1 to 2% [5]. Several research works were developed addressing this subject [6,7,8] and according with Booth et al. [9], a 1 to 3% efficiency loss will be generated in an axial turbine with a tip clearance of about 1% of the rotor’s blade height. Other works also discuss the minimum gap dimension, necessary do avoid rubbing between the blade and casing [10,11], as well as the variation of gap during the turbomachine operation [12].
In the case of hydraulic axial turbines, the tip leakage interacts with the main flow impacting the cavitation phenomenon close to the region. This unwanted phenomenon has a huge influence on the project of Liquid Propelled Rocket Engines (LRPE), since these propulsion systems apply hydraulic axial turbine in their design. Considering the high costs of these systems, and the impact of the cavitation on them, motivated the evaluation of this phenomenon in different academic works [13,14]. Other than that, it is worth to mention that the cavitation is essentially a multiphase phenomenon, and its proper evaluation by numerical schemes must be carried out with multiphase simulation. However, it is already demonstrated in other works [15,16,17], that monophase CFD analysis can be used for these evaluations, with results comparable to those from multiphase simulations.
As demonstrated on previous paragraphs, both effects caused by the tip leakage (efficiency loss and cavitation) are undesired and must be mitigated as much as possible, with the aim of increase the LPRE life cycle and reduce its energy consumption. For this reason, over the time different strategies were developed, among them the called desensitization techniques. These ones are rotor blades tip geometric modifications that changes the flow characteristic at the clearance region, reducing part of the leakage and also changing the heat transfer coefficient at this location, as described by Saha et al. [18].
The application of these techniques, and their effects, were already studied in other references as [19,20,21]. However, most of these works are related to the turbomachines that operate with compressible fluids, and there is a lack of studies evaluating the benefits of these tip modifications on hydraulic turbomachines.
On a previous research [17], a numerical parametric studied was carried out evaluating the application of the squealer tip desensitization technique on the first stage of the hydraulic axial turbine used in the Low Pressure Oxidizer Turbopump (LPOTP) of the Space Shuttle Main Engine (SSME). On that paper, it was shown that the application of the squealer would be able not only to increase the efficiency of the analyzed turbomachine, but also to change the cavitation regions along the stage, impacting its life cycle.
The present research, is a sequence of the work published in reference [17]. However, a new numerical parametric study is carried out, showing the influence of a winglet-type geometry installed in the rotor blade in the first stage of a hydraulic axial turbine. These analyzes were carried out using CFD techniques based on RANS (Reynolds Average Navier-Stokes) simulations and the turbine stage analyzed is the same one already studied on previous researches [17,22,23,24]. At the end, the results here presented are compared with those already presented in [17] and [22], and with the experimental data reported by NASA [25]. The commercial CFX v.19.2 software, from ANSYS Workbench, was used to perform the numerical calculations of fluid mechanics equations, presented in this paper.
2. Tip Leakage Effects
2.1. Leakage Behavior
To obtain an adequate results of flow characteristics inside of a turbomachine, the turbulence should be quantified. The machine geometrical details are also very important. Hence, the tip clearance between the rotor tip and casing, is usually considered and its gap must be realistic with the real component.
Due to the complex geometry and pathway of the fluid motion through a turbomachine, and in this case the existence of fixed and rotating blade rows, the flow characteristics and its secondary losses generates the increase of energy losses, consequently, entropy [26,27]. Each of these energy loss sources have motivated the development of several physical-mathematical models based on test data, in order to quantify them, as can be seen in at [28,29,30,31].
Specifically analyzing the flow at rotor tip region this has a great impact on the axial turbomachines, what motivated different studies over the years [32], been these related with the impact on their performance and also regarding the heat transfer at blade tip region [33,34,35]. In this work, following the same approach of previous researches [15,17], only the tip leakage effects on the turbine stage efficiency and performance are discussed.
A representation of leakage flow on the tip region is shown on Figure 1. In this illustration, region D represents the streamline location on the endwall. In this region the leakage flow is divided in bubbles b1 and b2, to exemplify the flow attachment at blade tip surface in the gap region, involving the machine casing. Usually bubble b1 is formed on the blade tip corner and bubble b2 is located after the blade suction side. A detailed discussion of this flow behavior is presented by Dey and Camci [36].
Other than bubbles b1 and b2, the Figure 1 also illustrate the location of regions s1 and s2, that are, respectively, related with the scrapping and leakage vortexes. The first one is generated on the main flow, while the second is formed by the fluid that cross the tip region. The leakage flow that generates the leakage vortex meets with the scrapping vortex and the result of the interaction will increase or decrease the losses on that region, depending on the rotation direction of those vortexes; if these vortexes have the same direction losses are increased, otherwise they decrease [32].
Due to the relative movement between the turbine casing and the rotor blades, and also considering the non-slip flow condition, the velocity field profile in this region became relatively complex. A representation of this velocity profile is shown in Figure 2. Due to the characteristic of the flow on this region, as shown on this figure and discussed in previous researches [17,22,36], there will be a stagnation point in the velocity profile, with the change of the velocity direction. This behavior is repeated for each longitudinal section along the blade thickness, which generates a stagnation line on the tip, and it is represented in Figure 2 as the A1-A2 line [36]. Furthermore, bubble b1, modify the flow characteristic and may favor the fluid to leak from the pressure to the suction side, increasing the discharge coefficient on the region and the aerodynamic losses [36].
In summary, all the effects described in this section impact the performance of the axial turbines, and must be considered during these machines detailed design. The importance of these effects can be checked by the number of academic researchers developed over the years addressing these issues [3,15,17,36,37,38,39,40].
2.2. Cavitation
Cavitation is a phenomenon that damages hydraulic turbomachines, reducing their life cycle, and is caused by a static pressure reduction that leads to the vaporization of part of the flowing fluid [41]. In the specific case of turbopumps applied in rocket engines, these components operate under high pressure rates and rotational speeds, which favor the phenomenon occurrence [42]; for this reason, the cavitation emergence is practically inevitable, and there must be a compromise between the phenomenon existence, and the component design parameters [43].
Cavitation is a transient process [44] and also a multiphase phenomenon. Although these characteristics, it was already demonstrated in previous works [15,16], that steady state monophase numerical CFD analyzes can be used to carried out the simulations of this phenomenon for hydraulic turbomachines. The same approach proposed in [15,16], and replicated in the results presented in [17], is applied on this research, and the phenomenon is considered to occur on the locations where the flow static pressure is equal to the water vapor pressure.
It is worthy to mention the numerical analyzes of this phenomenon is not limited to the turbomachines, and this was already evaluated at different works [45,46,47,48]. Also, there is a lack of researches evaluating the cavitation on turbopump, which justify the development of more studies on this area; numerical studies found on the open literature, usually evaluate this phenomenon for other turbomachines [49,50,51,52,53].
3. SSME LOX Booster Turbopump
The SSME was the propulsion system designed to be installed in one of the most successful aerospace projects, the Space Shuttle [54]. This LPRE operates with LOX and LH2; these propellants selection was made due to the fact that this was the combination that provides the highest specific thrust on that time [46]. The diagram with the thermodynamic cycle of this engine is presented in Figure 3 [55]. A detailed discussion of this engine cycle can be found on previous works [56].
Since this research is a sequence of previous ones [17,22], the turbomachine under analyze is the same already evaluated on those works, been this the SSME oxidizer booster turbopump. This turbopump is highlighted on the schematic presented in Figure 3, and a representation of this component is shown on Figure 4. As can be seen in this last figure, in order to make this TP compact, the turbine is mounted inside the pump, adding complexity to its design.
In this work, following the same approach of the previous ones [17,22], only the first stage of the axial turbine of the SSME LOX booster turbopump is analyzed. Its flat tip rotor geometry was obtained through some design parameters and with the support and use of the AXIAL® and AxCent® software, developed by Concept NREC, as already described on other researches [15,16].
4. Tip Desensitization Methods
4.1. General Considerations
Desensitization methods are geometric modifications that are made on the axial turbine rotor blade tip, changing the fluid flow characteristics on this region with the aiming of reduce part of the leakage that cross the clearance between these blades and the machine casing. The reduction of this undesirable flow increases the turbine efficiency and/or performance, in addition to change the heat transfer coefficient on the region.
Although, there is no general rule to be used in all axial turbines. Each machine has its particularities and needs, depending on the geometrical and flow characteristics. They are usually classified into three different groups: squealer, winglet and squealer-winglet. An illustration of each of these geometrical modifications is shown on Figure 5.
The benefits that can be reached with the desensitization methods motivated the evaluation of these techniques on different turbomachines, however, the majority of them were developed for turbines that operate with compressible flow [57,58,59,60,61,62]. This historical aspect represents a great opportunity for the development of researches related to hydraulics turbomachines. However, it is also an issue, since these analyzes usually need the input from previous studies. Due to this lack of data availability, the geometric parameters presented by da Silva et al. [3] were used as the start point in this research.
In this work, it is present the analysis applying the winglet technique to the first stage of the SSME LOX turbine booster. A parametric analysis varying the thickness and width of this geometric modification is carried out, and the results obtained are compared with the ones that were presented in previous publications [17,22].
4.2. Winglet
The winglet geometric modification (that can also be found on the literature as partial shroud) is characterized by been an aerodynamic component that positioned in on the rotor blades tip, which protrudes out of the suction, pressure or even both sides of the blade [3]. As any other tip desensitization, the winglets are used to prevent the leakage at the gap region, increasing the turbomachine performance; in addition, one of the aims of this technique application is to decrease the drag and the tip vortex.
The behavior of the flow over a pressure side winglet tip is illustrated in Figure 6 [36]. As already mentioned in this document, in the internal flow of an axial turbine a leakage vortex is formed near of the rotor blades suction side. This behavior can also be seen in Figure 6. However, the pressure side geometric extension created by the winglet, can significantly affect the flow behavior in this region, weakening the leakage vortex [3].
The winglet geometries are usually defined by two parameters, been them the element thickness and width [63]. Figure 7 shows an illustration of these parameters. These are the geometric dimensions that are varied and sometimes optimized in order to analyze the effect of their modifications on the turbine stage analyzed in this research.
The technique to enhance or modify the winglet geometry, has been extensively studied over the years. Dey, Camci and Kavurmacioglu [64], evaluated the effects of different winglet geometries on their research. The results found by them showed that the configuration with the modification at blade tip in the pressure side, could provide a reduction in tip vortex momentum, also changing the flow conditions on the gap and reducing the leakage.
A numerical and experimental analysis in order to investigate the benefits of applying a pressure side winglet installation was presented by Zhou et al. [65]. The results obtained were compared with the original axial turbine rotor blade, considering the common flat tip and squealer geometries. Considering the winglet and the squealer, it was shown that the vortexes generated by these geometries acted as a restriction, avoiding the leakage on the region. The winglet installation at blade pressure side, also allowed a reduction of the pressure difference at blade tip region, in the regions close to the leading edge. However, at the blade mid-chord and trailing edge locations, this difference has increased. At the end, the authors concluded that the pressure side winglet provides an improvement in aerodynamic performance in comparison with the other geometries.
In a previous research, Tonon et al. [63] presented a comparison between two different winglet geometries, analyzing their effects on the performance of the first stage of the axial turbine used in the SSME LOX booster TP. Both geometries analyzed were generated with the same thickness and width values, being differentiated by their configuration at the trailing edge. One of the geometries connects to the trailing edge with an angle close to 90°, while the second one has a smooth connection, as is shown in Figure 8 [63]. The authors concluded that the application of the winglet geometry with the smoother connection on the trailing edge provides just small performance benefits on the stage performance. The other one would be able achieve greater improvements on this parameter. However, due to its geometrical characteristic, a larger wake region is generated at trailing edge, increasing the flow instability.
Although many studies evaluating the benefits of winglet geometries have been carried out considering the application of this technique on the blade pressure side, there are some others that consider the insertion of this modification on the suction side, as the work developed by Seo and Lee [66]. The authors studied two suction side winglet geometries, one of them that allows to vary the width dimension (VWSS) and the other with fixed dimensions (CWSS). The results presented shown that both strategies are able to reduce the aerodynamic losses when compared with the flat tip.
In addition to the researches presented in this section, there are a many other that can be found on the open literature evaluating the benefits of pressure, suction or even both sides winglet geometries [67,68,69,70,71]. For reference, only pressure side winglet geometries are analyzed in this work.
5. Computational Mesh, Boundary Conditions, and Numerical Issues
Following the same approach of a previous research [17], the geometry evaluation process presented in this work was started with reference on the parameters of the winglet geometry proposed by da Silva [3], considering 2.70% for width and 2.90% for thickness, both percentages are in relation to the rotor blade height. In order to carry out the parametric analysis proposed, widths of 5.40% and 8.10%, and thicknesses of 5.80% and 8.70%, were also used. The combination of these dimensions generates 9 different winglet geometries to be analyzed. For example, the combination of the 2.70% width with each one of the thickness values established (2.90%, 5.80% and 8.70%), generates 3 geometries. The same reasoning is applied to the other width values (5.40% and 8.10%).
Computational mesh characteristics, boundary conditions, residual behavior and numerical setting used in the CFD simulations are described in the next sections.
5.1. Computational Mesh Characteristics
The ICEM v. 19.2 commercial software was used to perform the mesh generation and geometrical modifications on the rotor tip geometry, following the reference [17]. Tetrahedral unstructured meshes were generated following its best practices to obtain an adequate control volume shapes, in order to properly represent the details of the geometries analyzed. An illustration of these meshes is shown in Figure 9.
A total of 25 prism layer were generated at walls to determine the boundary-layer region with good resolution and accuracy. Although this number of layers significantly increases the number of elements, and consequently the computational cost, this is necessary to avoid the use of wall functions couple with turbulence model. In this work, the turbulence equations were integrated until the walls. More discussion about these subject will be discussed on further sections.
5.2. Mesh Independence Study
The mesh independence study, carried out in this work, follows the same procedure described in [17]. Four progressively refined computational meshes were generated and, with their independency guaranteed, one of them is choose to be used on the analyzes. The elements number of each of these meshes is shown in Table 1.
The total pressure distribution from hub to shroud on the rotor blade trailing edge location were compared for each mesh configuration. Figure 10 shows this comparison for two of the winglet geometries analyzed. As can be seen, there is no great variation in this parameter distribution, concluding that the mesh independence condition is satisfied. Same behavior was checked for the other winglet configurations. It was defined to use the mesh 3 to carried out the simulation for all the geometries analyzed in this work.
5.3. Initial and Boundary Conditions
An adequate initial condition is important to avoid numerical instabilities during the first numerical iteration, even numerical divergences [3]. These conditions are used to initiate the numerical solution of the Partial Differential Equations (PDEs) for spatial integration and Ordinary Differential Equations (ODE) for the time integration.
Boundary-conditions are set for each numerical domain surface. Depending on the turbomachine operational characteristics these conditions will be different. In the present paper, the following boundary-conditions are set at surfaces:
- Stage inlet: inflow velocity vector angles (axial direction), total temperature (294K), mass flow and turbulent intensity (5%).
- Stage Outlet: average static pressure at blade hub location and it is variation until the casing, using the radial equilibrium equation.
- Stator-Rotor interface: mixing-plane.
- Wall surfaces: non-slip condition.
- Blade-to-blade surfaces: periodicity.
On the experimental analyzes developed and reported by NASA [25] the total pressures at the stage inlet and outlet were kept constant over its entire operational range. These pressures values are, respectively, 2,410,000 Pa and 550,000 Pa. Different rotational speeds were considered and analyzed based on this information. At machine outlet, the static pressure and mass flow values were varied keeping the inlet and outlet total pressures within ±0.1% of the values reported in [25]. This same approach was already applied on previous researches [17,22].
Other than the aforementioned, although the analyzed turbine operates with LOX the tests reported by NASA [25] were carried out using water as working fluid. This was also to fluid used in the numerical simulations.
5.4. Numerical Scheme
The numerical schemes applied in this work to calculate the general fluid mechanics equations numerically, are described in previous work [15,17]. The commercial software ANSYS CFX v. 19.2 was used to solve the Reynolds Averaged Navier-Stokes (RANS). The, first and second-order discretization schemes were applied in the convection terms of the turbulence model and momentum equations. Modified Rhie-Chow discretization method [72] was applied in the numerical scheme to solve the RANS equations. The time marching scheme is implicit. For the flow eddy viscosity determination, the two-equations k-ω SST turbulence model was employed.
Specifically, regarding the SST two-equation model, in order to avoid the use of wall functions, the computational mesh must be generated to keep the values of y+ below 2. Still for this model, when the y+ value is between 2 and 11, a blend of wall functions and low Reynolds formulation is automatically set. If the y+ parameter is between 11 and 300, only wall functions are used [73]. The y+ value of all meshes used on this research were kept bellow 2.
5.5. Residual Behavior
Regarding CFD simulations, the numerical residues along the iterations must be reduced by some magnitude orders in order to achieve the results convergence [17,22]. Continuity, momentum and energy equations residues history are shown on Figure 11; peaks noted in these residues are the result of variations in the boundary conditions.
Other parameter used to monitor numerical convergence were: conservative variables, pressure ratio, inlet and outlet total pressure; these variables behavior are shown in Figure 12. During the process to obtain the numerical solutions, for some rotational speeds, the results of the monitored properties fluctuated around an average value. This issue was faced from the 2113, 2454 and 2795 rotational speeds, it is a characteristic already shown on previous researches [15,17], and is related to the transient nature of the flow for these operating conditions. Figure 13 illustrate this behavior. In these cases, a representative value of the properties was obtained by the average of the last 200 iterations.
Other that the already mentioned, especially at low rotational speeds and for some of the studied geometries, it was impossible to obtain the approximated solution. Under these conditions, instability and divergence problems occurred. Due to these reasons, each analyzed geometry has a different number of operational points results.
6. Results
6.1. Effect of Winglet Geometries on Stage Efficiency
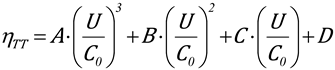
The results obtained with the application of the winglet geometries at rotor tip blades were compared with those of the flat tip and squealer geometries available in [17,22]. The results of the nine geometries analyzed are divided into different graphics. Total efficiency versus blade-jet-velocity results for the 2.90% winglet thickness geometries, combined with the different width values, are presented in Figure 14(a). Figures 14(b) and 14(c) present the same analysis, respectively for 5.80% and 8.70% thicknesses. To facilitate the quantitative comparison, these Winglet Geometries results were interpolated through a third-degree polynomial function. The following equations were used to calculate the parameters presented in these figures.
On the results presented in Figures 14(a), 14(b) and 14(c), it is noted that the winglet width has almost no impact on the turbine efficiency. For winglet geometries with a thickness of 2.90%, the average efficiency increases over the stage operational range were 0.16%, 0.18% and 0.24%, respectively for the 2.10%, 5.40% and 8.10% widths. Considering the winglet geometries with 8.70% thickness, these average increases were 2.22%, 2.23% and 2.08%. For these two thickness values, it is shown that the winglet width has little influence on the state total.
However, for Figure 14(b), a slightly different behavior was obtained. On this figure there is a significant difference between the results obtained for the width of 2.70%, when compared with those obtained for the others. Also, the number of operational conditions that were possible to be simulated with 5.40% and 8.10% widths, is less than for the 2.70% width, which indicates that this parameter increases the flow instabilities for a transient condition and also increase the numerical instability. The boundary-conditions used in the present work consider steady-state regime. Hence, transient flow condition can push the numerical iterations for divergence.
Despite these results, it is noted that only the width increases to values above 2.70%, impact the stage efficiency; for all other geometries studied, no significant influence was noted by this parameter change. For this reason, another analysis was made comparing different winglet thicknesses, keeping the width constant. Figure 14(d) shows this analysis; the effects of the variation of the winglet thickness are observed, keeping the width at 5.40%. As shown in this figure, the winglet thickness increase tends to increase the turbine total efficiency. This efficiency increase is much more significant for thickness variation from 2.90% to 5.80%. The total efficiency average increase over the operational range, in comparison with the flat tip, is of 0.18%, 2.03% and 2.23%, respectively for the 2.90%, 5.80% and 8.70% thicknesses.
Comparing these results with the ones presented in previous researches [17], it is concluded that the winglet application is able to provide better improvements on the analyzed turbine performance than the squealer technique. For reference, the highest average efficiency increase, in comparison with the flat tip, obtained with the squealer geometries was of 1.43%. As mentioned above, for some winglet geometries this average increase is higher than 2.0%.
In summary, the stage total efficiency tends to increase with the increase in the winglet thickness. However, it is noted that there must be a maximum value of this parameter from which the efficiency remains constant.
The coefficients of the polynomials presented in Figure 14 are shown on Table 2. The quantitative comparisons between the flat tip and the winglet geometries, are shown in Table 3, Table 4 and Table 5, respectively for the 2.90%, 5.80% and 8.70% thicknesses. It is also listed the average efficiency increase for each of these geometries.
6.2. Effect of Squealer Geometries in the Axial Turbine Flowfield Characteristics
Figure 15 and Figure 16 shown the streamlines and static entropy contours regions in the tip clearance region, respectively. Specifically, for the Figures 15(a) and 16(a) these results are related to the rotor blade flat tip geometry, and where already presented in previous works [17]. The flow characteristics on the blade suction side is joined by the leakage flow and is observed the formation of leakage vortex. Also, it is noted that the flow on the suction side is separated from the blade surface. These secondary flows favor the trailing edge wake region.
These figures, 15 and 16, also show the streamlines and static entropy contours, for the 2.90%, 5.80% and 8.70% winglet thickness, keeping element width at 5.40%. Comparing the behavior of the streamlines of the winglet geometries with the ones of the flat tip, a similar behavior is noted. There are differences in the flow at trailing edge region. The first one is about the leakage vortex, which with the winglet application presents a higher velocity. This higher velocity may indicate that the leaked have a greater momentum, compared to the common flat tip. Furthermore, there is an increase in the stagnation region at trailing edge location. This can generate flow disturbances that tend to increase the stage losses, and may be associated with the trailing edge geometry. Regarding the static entropy contours, it is noted that the winglet results shown a lower intensity of this property, when compared to the flat tip. These are expected results, since the efficiency of the winglet geometries are higher than the efficiency of the flat tip.
In order to have a better understand about the association of these vortexes, Fig. 17 was generated based on a stationary reference frame view. For the flat tip rotor configuration this association is shown on Fig. 17(a). By the analysis of this figure, it is possible to observe that leakage and scrapping vortexes have different rotation directions, which reduce the region losses.
Figures 17(b), 17(c) and 17(d) show these vortexes, respectively for the winglets with 2.90%, 5.80% and 8.70% thickness, and 5.40% width. Figure 17(b) results are very similar to those shown in Figure 6.17, which is expected, since the average efficiency over the operational range obtained with the winglet of 2.90% thickness and 5.40% width, is very close to the flat tip one. In the Figures 17(c) and 17(d), it is possible to visualize the vortexes behavior at blade tip, midspan and hub locations, are significantly altered. The scrapping vortex is displaced in relation to the flat tip case, due to the effects of the leakage and passage vortexes. This is a different behavior in comparison with the results presented in previous works [17], related to squealer geometries; for these geometries the scrapping vortex was displaced towards the blade height. Furthermore, the leakage flow velocity through the blade tip is greater than that observed for the flat tip.
As already mentioned, cavitation is a harmful phenomenon that can cause high turbomachines performance reductions and erosion problems at metallic surfaces. Regarding rockets engines, the damages caused can lead to the system collapse. Some applications have requirements that make the operation without cavitation impossible. Soft and moderate cavitations, in general are acceptable for some applications, but its level should be analyzed and monitored.
The last results that were generated in this study are a comparison between the cavitation regions along the turbine stage with and without the application of the desensitization techniques. These results are presented in Fig. 18 and were generated with the same approach proposed in [15,16] and applied in previous researches [17,22]; the cavitation is considered to occur on the regions that the reaches the water vapor pressure (~2300 Pa).
Figures 18(b), 18(c) and 18(d) shown the possible cavitation regions for the winglets of 2.90%, 5.80% and 8.70% thicknesses, and 5.40% width, respectively. Considering the results in Figure 18(b), no significant differences are observed in relation to the flat tip. For other geometries, in the blade tip location, cavitation tends to become more intense, and at blade suction side, it is observed that there was a considerable reduction of this phenomenon. This is an important result, since this phenomenon reduction tends to decrease the LPRE components damages. The cavitation characteristics in the blade tip region, can be evaluated carefully during the turbomachine design phase to avoid performance and safe operational conditions.
Since the same approach described on [15,16,17,22,24,44] was utilized to generate these results, they were obtained through monophasic flow simulations. This is an approximation that can provide adequate results when compared with the multiphase flow simulations, as already discussed in these previous works. Although this approach is enough to comply with the scope of this research, the use of multiphase simulations is necessary in analyzes that require a detailed evaluation of the phenomenon.
The results obtained on this work, show that the application of the proposed treatments is able to provide interesting benefits for the axial turbine analyzed. Regarding the turbine efficiency, the results of the winglet geometries, show that these could increase this parameter even more than the squealer geometries analyzed in previous works [17]. It was also shown that the width dimension in the winglet configuration has almost no impact on the turbine efficiency. About the winglet thickness dimension, its increase tends to enhance the turbomachine performance.
Comparing the results obtained from the numerical simulations considering the rotor flat-tip and winglet configurations, it is possible to observe that these geometrical arrangements also impact the cavitation issues, mainly at suction side region. There is a cavitation increase in rotor blade tip region. These results are relevant, since they could affect the turbine life cycle.
Despite of the possible benefits of the modified geometries application on the turbine stage efficiency and other flow characteristics, the analyzes presented in this research are related only to the fluid flow inside the turbomachine. There are other engineering aspects related to the operation of these mechanisms that must be evaluated through structural analyzes (stresses, natural frequence, vibration, Campbell and Bode diagrams), in order to validate the use of these techniques in a real turbine. Considering the winglet width and thickness geometrical dimensions, those have a crucial impact on the relationship between fluid dynamic and mechanical characteristics, as well as the cavitation regions along the stage.
7. Conclusions
The present work is a sequence of previous researches [17,22] that evaluate the application of desensitization techniques in a hydraulic axial turbine. The results shown in this document are related with the application of different winglet geometries; although these techniques have been extensively evaluated on gas turbines, there is a lack of studies evaluating their benefits on turbomachines that operate with incompressible work fluids.
This research uses as a reference the first stage of the SSME LPOTP hydraulic axial turbine. Numerical simulations and computational meshes generation processes were carried out, respectively, making the use of CFX CFD solver and ICEM v.19.2 commercial software, developed by ANSYS®.
The main conclusions obtained in the present research are:
- The winglet parametric analysis was performed considering 2.90%, 5.80% and 8.70% thickness, and 2.70%, 8.40%, and 8.10% width. These percentages are all in relation to the blade height. The nine proposed geometries results shown that the winglet thickness increase supply a positive impact on the turbine total efficiency – the greater the thickness, the greater the stage efficiency. There must be a maximum value of this parameter from which the efficiency remains constant.
- The winglet width dimension almost does not impact the stage efficiency.
- In general, the results found in this work show that the winglet geometries analyzed are able to provide a higher increase in the stage performance than the squealer techniques evaluated in a previous research [17].
- Winglet geometry of 8.70% thickness and 5.40% width, provide the highest stage efficiency average increase (2.23%), over the entire turbine operational range, in comparison with the rotor flat tip configuration. For reference, the highest average increase of this parameter for the squealer geometries, available in [17], was of 1.43%.
- Regarding the vortexes in the tip region, the same behavior shown in previous works for the flat tip and the squealer geometries were maintained for the winglet modifications: they have a different rotation direction, reducing the losses on the region. However, for the winglet geometries that provide the better performance results, it is noted that the scrapping vortex is displaced in relation to the flat tip case, due to the leakage and passage vortexes effects.
- The cavitation results obtained with the application of winglet geometries show that would be possible to reduce the occurrence of this phenomenon at the blade suction side for some configurations. However, for these same configurations, there is an increase of the cavitation on the tip region. The effects of these combined changes on the turbine life cycle must be carefully analyzed thought structural simulations and tests.
- All proposed and evaluated geometries in this work are pressure side winglet geometries; it would be interesting to develop analyzes also for suction side and both sides variations of this desensitization technique.
- In order to validate the results obtained by the numerical simulations, the development experimental tests are necessary.
Acknowledgments
The authors would like to thank the ITA (Aeronautics Institute of Technology) Department of Turbomachines for the support and infrastructure provided during this research work; as well as the Coordenação de Aperfeiçoamento de Pessoal de Nível Superior (CAPES - Higher Education Improvement Coordination); the Fundação de Amparo à Pesquisa do Estado de São Paulo (FAPESP - São Paulo Research Foundation); and the Conselho Nacional de Desenvolvimento Científico e Tecnológico (CNPq - Brazilian National Council for Scientific and Technological Development). Daniel da Silva Tonon thanks CNPq, for the research grants 132726/2016-5, 141288/2018-3 and 141837/2019-5, and Avibras, for the PhD program support.
Nomenclature
| CFD | Computational Fluid Dynamics |
| ITA | Aeronautics Institute of Technology |
| LH2 | Liquid Hydrogen |
| LPOTP | Low Pressure Oxidizer Turbopump |
| LOX | Liquid Oxygen |
| LPREs | Liquid Propellant Rocket Engines |
| NASA | National Aeronautics and Space Administration |
| PDE | Partial Differential Equations |
| RANS | Reynolds-Averaged Navier-Stokes |
| SST | Shear Stress Transport |
| SSME | Space Shuttle Main Engine |
| TP | Turbopump |
| N | Rotational Frequency |
| ṁ | Mass Flow |
| p | Pressure |
| i | Inlet Condition |
| o | Outlet Condition |
| T | Total Condition |
| W | Turbine Shaft Power |
| τ | Turbine Torque |
| η | Turbine Efficiency |
| ρ | Density |
| UCasing | Peripheral Velocity |
| U/C0 | Blade-Jet-Speed Ratio |
| R | Turbine Rotor Blade Tip Radius |
References
- De Oliveira Silva, G.P.; Tomita, J.T.; Bringhenti, C.; Whitacker, L.H.L.; Da Silva Tonon, D. Interactive Learning Platform for the Preliminary Design of Axial Turbines and Its Use for Graduate Courses. In Proceedings of the Proceedings of the ASME Turbo Expo; Rotterdam, Netherlands, 2022; Vol. 5.
- Oliveira, I.; Silva, G.P.; Tonon, D.; Bringhenti, C.; Tomita, J.T. Interactive Learning Platform for Turbine Design Using Reduced Order Methods. In Proceedings of the Proceedings of the ASME Turbo Expo; Virtual, Online, 2020; Vol. 6.
- da Silva, L.M.; Tomita, J.T.; Bringhenti, C. Numerical Investigation of a HPT with Different Rotor Tip Configurations in Terms of Pressure Ratio and Efficiency. Aerosp. Sci. Technol. 2017, 63, 33–40. [CrossRef]
- L.M. Silva, J.T. Tomita, J.R. Barbosa. A Study of the Influence of the Tip-Clearance on the Tip-Leakage Flow Using CFD Techniques. In: Brazilian Congress of Mechanical Engineering – COBEM, 2011.
- Schabowski, Z.; Hodson, H.; Giacche, D.; Power, B.; Stokes, M.R. Aeromechanical Optimization of a Winglet-Squealer Tip for an Axial Turbine. J. Turbomach. 2014, 136, 1–15. [CrossRef]
- Wang, T.; Xuan, Y. A Novel Approach for Suppressing Leakage Flow through Turbine Blade Tip Gaps. Propuls. Power Res. 2022, 11, 431–443. [CrossRef]
- Kong, X.; Liu, G.; Liu, Y.; Zheng, L. Experimental Testing for the Influences of Rotation and Tip Clearance on the Labyrinth Seal in a Compressor Stator Well. Aerosp. Sci. Technol. 2017, 71, 556–567. [CrossRef]
- Gao, Y.; Liu, Y. A Flow Model for Tip Leakage Flow in Turbomachinery Using a Square Duct with a Longitudinal Slit. Aerosp. Sci. Technol. 2019, 95, 105460. [CrossRef]
- Booth, T.C.; Dodge, P.R.; Hepworth, H.K. Rotor-Tip Leakage: Part I Basic Methodology. J. Eng. Power 1982, 104, 154–161.
- Krishnababu, S.K.; Newton, P.J.; Dawes, W.N.; Lock, G.D.; Hodson, H.P.; Hannis, J.; Whitney, C. Aerothermal Investigations of Tip Leakage Flow in Axial Flow Turbines-Part i: Effect of Tip Geometry and Tip Clearance Gap. J. Turbomach. 2009, 131, 1–14. [CrossRef]
- Bringhenti, C.; Barbosa, J.R. Effects of Turbine Tip Clearance on Gas Turbine Performance. In Proceedings of the ASME Turbo Expo; ASME, Ed.; ASME Turbo Expo: Berlin, 2008.
- Moustapha, H.; Zelesky, M.F.; Baines, N.C.; Japikse, D. Axial and Radial Turbines; Concepts NREC: Vermont, 2003.
- Kim, J.; Song, S.J. Visualization of Rotating Cavitation Oscillation Mechanism in a Turbopump Inducer. J. Fluids Eng. Trans. ASME 2019, 141, 1–11. [CrossRef]
- Kim, D.J.; Sung, H.J.; Choi, C.H.; Kim, J.S. Cavitation Instabilities of an Inducer in a Cryogenic Pump. Acta Astronaut. 2017, 132, 19–24. [CrossRef]
- Lindquist Whitacker, L.H.; Tomita, J.T.; Bringhenti, C. An Evaluation of the Tip Clearance Effects on Turbine Efficiency for Space Propulsion Applications Considering Liquid Rocket Engine Using Turbopumps. Aerosp. Sci. Technol. 2017, 70, 55–65. [CrossRef]
- Whitacker, L.H.L.; Tomita, J.T.; Bringhenti, C. Turbopump Booster Turbine Performance: Comparison Between Monophase and Multiphase Flows Using CFD.; ASME, Ed.; ASME Turbo Expo: Oslo, 2018; pp. 1–9.
- Tonon, D. da S.; Tomita, J.T.; Garcia, E.C.; Bringhenti, C.; Almeida, L.E.N. A Parametric Study of Squealer Tip Geometries Applied in a Hydraulic Axial Turbine Used in a Rocket Engine Turbopump. Aerosp. Sci. Technol. 2022, 122, 107426. [CrossRef]
- Saha, A.K.; Acharya, S.; Bunker, R.; Prakash, C. Blade Tip Leakage Flow and Heat Transfer with Pressure-Side Winglet. Int. J. Rotating Mach. 2006, 2006, 1–15. [CrossRef]
- Zamiri, A.; Choi, M.; Chung, J.T. Effect of Blade Squealer Tips on Aerodynamic Performance and Stall Margin in a Transonic Centrifugal Compressor with Vaned Diffuser. Aerosp. Sci. Technol. 2022, 123, 107504. [CrossRef]
- Chen, Y.; Cai, L.; Jiang, D.; Li, Y.; Du, Z.; Wang, S. Experimental and Numerical Investigations for Turbine Aerodynamic Performance with Different Pressure Side Squealers and Incidence Angles. Aerosp. Sci. Technol. 2023, 136, 108234. [CrossRef]
- He, X.; Zou, Z.; Yao, L.; Fu, C. Refined Flow Organization in Squealer Tip Gap and Its Impact on Turbine Aerodynamic Performance. Aerosp. Sci. Technol. 2023, 138, 108331. [CrossRef]
- Tonon, D. da S.; Tomita, J.T.; Garcia, E.C.; Bringhenti, C.; Díaz, R.B.; Whitacker, L.H.L. Comparative Study Between Structured and Unstructured Meshes Applied in Turbopump’s Hydraulic Turbine.; ASME, Ed.; ASME Turbo Expo: Online, 2020; pp. 1–13.
- Tonon, D. da S.; Tomita, J.T.; Garcia, E.C.; Bringhenti, C.; Almeida, L.E.N. Effects of a Squealer-Winglet Geometry on the Aerodynamic Performance of a Hydraulic Axial Turbine Used in Turbopumps.; ISABE, Ed.; 25th International Symposium on Air Breathing Engines: Ottawa, Canada, 2022.
- Barbosa, D.F.C.; Tonon, D. da S.; Luiz Henrique, L.W.; Tomita, J.T.; Bringhenti, C. Evaluation of Different Turbulence Models Applied in Turbopump’s Hydraulic Turbine. In Proceedings of the Proceedings of the ASME Turbo Expo; Virtual, Online, 2021; Vol. 2C-2021.
- Boynton, J.L.; Rohlik, H.E. Effect of Tip Clearance on Performance of Small Axial Hydraulic Turbine; Cleveland, Ohio, 1976.
- Sieverding, C.H. Recent Progress in the Understanding of Basic Aspects of Secondary Flows in Turbine Blade Passages. J. Eng. Gas Turbines Power 1985, 107, 248–257. [CrossRef]
- Langston, L.S. Secondary Flows in Axial Turbines - A Review. Ann. N. Y. Acad. Sci. 2001, 934, 11–26. [CrossRef]
- Ainley, D.G.; Mathieson, C.R. A Method of Performance Estimation for Axial-Flow Turbines. Aeronaut. Res. Counc. reports Memo. N. 2974 1951, 2974.
- Dunham, J.; Came, P.M. Improvements to the Ainley-Mathieson Method of Turbine Performance Prediction. J. Eng. Gas Turbines Power 1970, 92, 252–256. [CrossRef]
- Kacker, S.C.; Okapuu, U. A Mean Line Prediction Method for Axial Flow Turbine Efficiency. J. Eng. Gas Turbines Power 1982, 104, 111–119. [CrossRef]
- Moustapha, H.; Kacker, S.C.; Traemblay, B. An Improved Incidence Losses Prediction Method for Turbine Airfoils. J. Turbomach. 1990, 112, 267–276.
- da Silva, L.M. Cálculo Do Escoamento Em Uma Turbina Axial de Alta Pressão Com Diferentes Configurações Na Geometria Do Topo Do Rotor Utilizando Técnicas de CFD, Instituto Tecnológico de Aeronáutica, 2012.
- Lee, S.W.; Jeong, J.S.; Hong, I.H. Chord-Wise Repeated Thermal Load Change on Flat Tip of a Turbine Blade. Int. J. Heat Mass Transf. 2019, 138, 1154–1165. [CrossRef]
- Bunker, R.S.; Bailey, J.C.; Ameri, A.A. Heat Transfer and Flow on the First Stage Blade Tip of a Power Generation Gas Turbine Part 1: Experimental Results. In Proceedings of the Proceedings of the ASME Turbo Expo; ASME/NASA, Ed.; 44th Gas Turbine and Aeroengine Congress: Indianapolis, IN, 1999; Vol. 3.
- Han, J.C.; Dutta, S.; Ekkad, S. Gas Turbine Heat Transfer and Cooling Technology; 2nd ed.; CRC Press: Boca Raton, FL, 2013; ISBN 0791835332.
- Dey, D.; Camci, C. Aerodynamic Tip Desensitization of an Axial Turbine Rotor Using Tip Platform Extensions. In Proceedings of the Proceedings of the ASME Turbo Expo; ASME, Ed.; ASME Turbo Expo: New Orleans, LA, 2001.
- Langston, L.S.; Nice, M.L.; Hooper, R.M. Three-Dimensional Flow Within a Turbine Cascade Passage. Am. Soc. Mech. Eng. 1976, 21–28.
- Yamamoto, A. Interaction Mechanisms between Tip Leakage Flow and the Passage Vortex in a Linear Turbine Rotor Cascade. J. Turbomach. 1988, 110, 329–338. [CrossRef]
- Cao, L.; Si, H.; Wang, J.; Li, P. Effects of Leakage Vortex on Aerodynamic Performance and Loss Mechanism of Steam Turbine. Proc. Inst. Mech. Eng. Part A J. Power Energy 2019, 233, 866–876. [CrossRef]
- Passmann, M.; Aus Der Wiesche, S.; Joos, F. An Experimental and Numerical Study of Tip-Leakage Flows in an Idealized Turbine Tip Gap at High Mach Numbers. Proc. ASME Turbo Expo 2018, 2B-2018, 1–12. [CrossRef]
- Arakeri, V.H. Contributions to Some Cavitation Problems in Turbomachinery. Sadhana - Acad. Proc. Eng. Sci. 1999, 24, 453–483. [CrossRef]
- Whitacker, L.H.L. Determinação Da Influência Da Folga de Topo Na Eficiência de Uma Turbina Axial Multiestágio Utilizada Em Booster de Motor Foguete Para Operação Com LOX, Instituto Tecnológico de Aeronáutica, 2017.
- A. J. Acosta, An Experimental Study of Cavitating Inducers " . 2 Nd Symposium on Naval Hydrodynamics, Hydrodynamic Noise, Cavity Flow, Pp.25-29, 1958.
- Whitacker, L.H.L.; Tomita, J.T.; Bringhenti, C. Effect of Tip Clearance on Cavitating Flow of a Hydraulic Axial Turbine Applied in Turbopump. Int. J. Mech. Sci. 2022, 213, 106855. [CrossRef]
- Lindau, R.F.; Kunz, J.W.; Venkateswaran, S.; Boger, D. a Application of Preconditioned , Multiple-Species , Navier-Stokes Models To Cavitating Flows. Cav2001 2001, 1–14.
- Pinho, J.; Peveroni, L.; Vetrano, M.R.; Buchlin, J.M.; Steelant, J.; Strengnart, M. Experimental and Numerical Study of a Cryogenic Valve Using Liquid Nitrogen and Water. Aerosp. Sci. Technol. 2019, 93, 105331. [CrossRef]
- Piscaglia, F.; Giussani, F.; Hèlie, J.; Lamarque, N.; Aithal, S.M. Vortex Flow and Cavitation in Liquid Injection: A Comparison between High-Fidelity CFD Simulations and Experimental Visualizations on Transparent Nozzle Replicas. Int. J. Multiph. Flow 2021, 138. [CrossRef]
- Balz, R.; Nagy, I.G.; Weisser, G.; Sedarsky, D. Experimental and Numerical Investigation of Cavitation in Marine Diesel Injectors. Int. J. Heat Mass Transf. 2021, 169, 120933. [CrossRef]
- Pouffary, B.; Patella, R.F.; Reboud, J.L.; Lambert, P.A. Numerical Simulation of 3D Cavitating Flows: Analysis of Cavitation Head Drop in Turbomachinery. J. Fluids Eng. Trans. ASME 2008, 130, 0–10. [CrossRef]
- Rossetti, A.; Pavesi, G.; Ardizzon, G.; Santolin, A. Numerical Analyses of Cavitating Flow in a Pelton Turbine. J. Fluids Eng. Trans. ASME 2014, 136, 1–10. [CrossRef]
- Zhang, H.; Zhang, L. Numerical Simulation of Cavitating Turbulent Flow in a High Head Francis Turbine at Part Load Operation with OpenFOAM. Procedia Eng. 2012, 31, 156–165. [CrossRef]
- Sun, L.; Guo, P.; Luo, X. Numerical Investigation of Inter-Blade Cavitation Vortex for a Francis Turbine at Part Load Conditions. IET Renew. Power Gener. 2021, 15, 1163–1177. [CrossRef]
- Ghenaiet, A.; Bakour, M. Hydrodynamic Characterization of Small-Size Kaplan Turbine. J. Hydraul. Eng. 2021, 147, 06020019. [CrossRef]
- Sivolella, D. The Space Shuttle Program; Springer: Cham, Switzerland, 2017; ISBN 9783319549446.
- United States. Main Propulsion System. Shuttle Press Kit.Com, Boeing, NASA & United Space Alliance, 1998.
- United States. Space Transportation System Training Data, Space Shuttle Main Engine Orientation. Boeing, June 1998.
- You, Y.; Ding, L. Numerical Investigation of Unsteady Film Cooling on Turbine Blade Squealer Tip with Pressure Side Coolant. Int. Commun. Heat Mass Transf. 2023, 143, 106720. [CrossRef]
- Huang, M.; Li, Z.; Li, J. Investigations on the Aerothermal Performance of the Turbine Blade Winglet Squealer Tip within an Uncertainty Framework. Aerosp. Sci. Technol. 2022, 123, 107506. [CrossRef]
- Bi, S.; Mao, J.; Chen, P.; Han, F.; Wang, L. Effect of Multiple Cavities and Tip Injection on the Aerothermal Characteristics of the Squealer Tip in Turbine Stage. Appl. Therm. Eng. 2023, 220, 119631. [CrossRef]
- Kim, J.H.; Lee, S.Y.; Chung, J.T. Numerical Analysis of the Aerodynamic Performance & Heat Transfer of a Transonic Turbine with a Partial Squealer Tip. Appl. Therm. Eng. 2019, 152, 878–889. [CrossRef]
- Harvey, N.W.; Newman, D.A.; Haselbach, F.; Willer, L. An Investigation Into a Novel Turbina Rotor Winglet Part 1: Design and Model Rig Test Results.; ASME, Ed.; ASME Turbo Expo: Barcelona, 2006.
- Lee, S.W.; Choi, M.Y. Tip Gap Height Effects on the Aerodynamic Performance of a Cavity Squealer Tip in a Turbine Cascade in Comparison with Plane Tip Results: Part 2-Aerodynamic Losses. Exp. Fluids 2010, 49, 713–723. [CrossRef]
- da Silva Tonon, D.; Tomita, J.T.; Bringhenti, C.; Barbosa, D.F.C.; Whitacker, L.H.L.; Almeida, L.E.N. Effects of Two Winglet Tip Geometries on the Flow and Aerodynamic Performance of a Hydraulic Axial Turbine. 33rd Congr. Int. Counc. Aeronaut. Sci. ICAS 2022 2022, 4, 2402–2418.
- Camci, C.; Dey, D.; Kavurmacioglu, L. Tip Leakage Flows Near Partial Squealer Rims in an Axial Flow Turbine Stage.; ASME, Ed.; ASME Turbo Expo: Atlanta, GE, 2003.
- Zhou, C.; Hodson, H.; Tibbott, I.; Stokes, M. Effects of Winglet Geometry on the Aerodynamic Performance of Tip Leakage Flow in a Turbine Cascade. J. Turbomach. 2013, 135, 1–10. [CrossRef]
- Seo, Y.C.; Lee, S.W. Tip Gap Flow and Aerodynamic Loss Generation in a Turbine Cascade Equipped with Suction-Side Winglets. J. Mech. Sci. Technol. 2013, 27, 703–712. [CrossRef]
- Jeong, J.S.; Bong, S.W.; Lee, S.W. An Efficient Winglet Coverage for Aeroengine Turbine Blade Flat Tip and Its Loss Map. Energy 2022, 260, 125153. [CrossRef]
- Chen, S.; Li, W. Effects of Combined Sweeping Jet Actuator and Winglet Tip on Aerodynamic Performance in a Turbine Cascade. Aerosp. Sci. Technol. 2022, 131, 107956. [CrossRef]
- O’Dowd, D.O.; Zhang, Q.; He, L.; Oldfield, M.L.G.; Ligrani, P.M.; Cheong, B.C.Y.; Tibbott, I. Aerothermal Performance of a Winglet at Engine Representative Mach and Reynolds Numbers. J. Turbomach. 2011, 133, 1–8. [CrossRef]
- Cheon, J.H.; Lee, S.W. Winglet Geometry Effects on Tip Leakage Loss over the Plane Tip in a Turbine Cascade. J. Mech. Sci. Technol. 2018, 32, 1633–1642. [CrossRef]
- Coull, J.D.; Atkins, N.R.; Hodson, H.P. Winglets for Improved Aerothermal Performance of High Pressure Turbines. J. Turbomach. 2014, 136, 1–11. [CrossRef]
- Rhie, C.M.; Allison, D.D.; Asme, A.; Thermoph, J.; Louis, S. A Numerical Study of the Turbulent Flow Past an Isolated Airfoil With Trailing Edge Separation Fluids , Plasma and Heat Trans Er Conference A NUMERICAL STUDY OF THE TURBULENT FLOW PAST AN ISOLATED. 1982.
- da Silva, L.M.; Tomita, J.T.; Bringhenti, C.; Whitacker, L.H.L.; Almeida, L.E.N.; Cavalca, D.F. A Small Jet Engine Preliminary Design and Its Performance Calculations.; ISABE, Ed.; 24th International Symposium on Air Breathing Engines: Canberra, Australia, 2019.
Figure 1.
Tip clearance leakage flow in a cascade (modified from [36]). S1 and s2 regions represents, respectively, the scrapping and leakage vortexes. B1 and b2 bubbles are generated through the attachment of the fluid in the blade and casing. The location of the streamline on the endwall is indicated by region D.
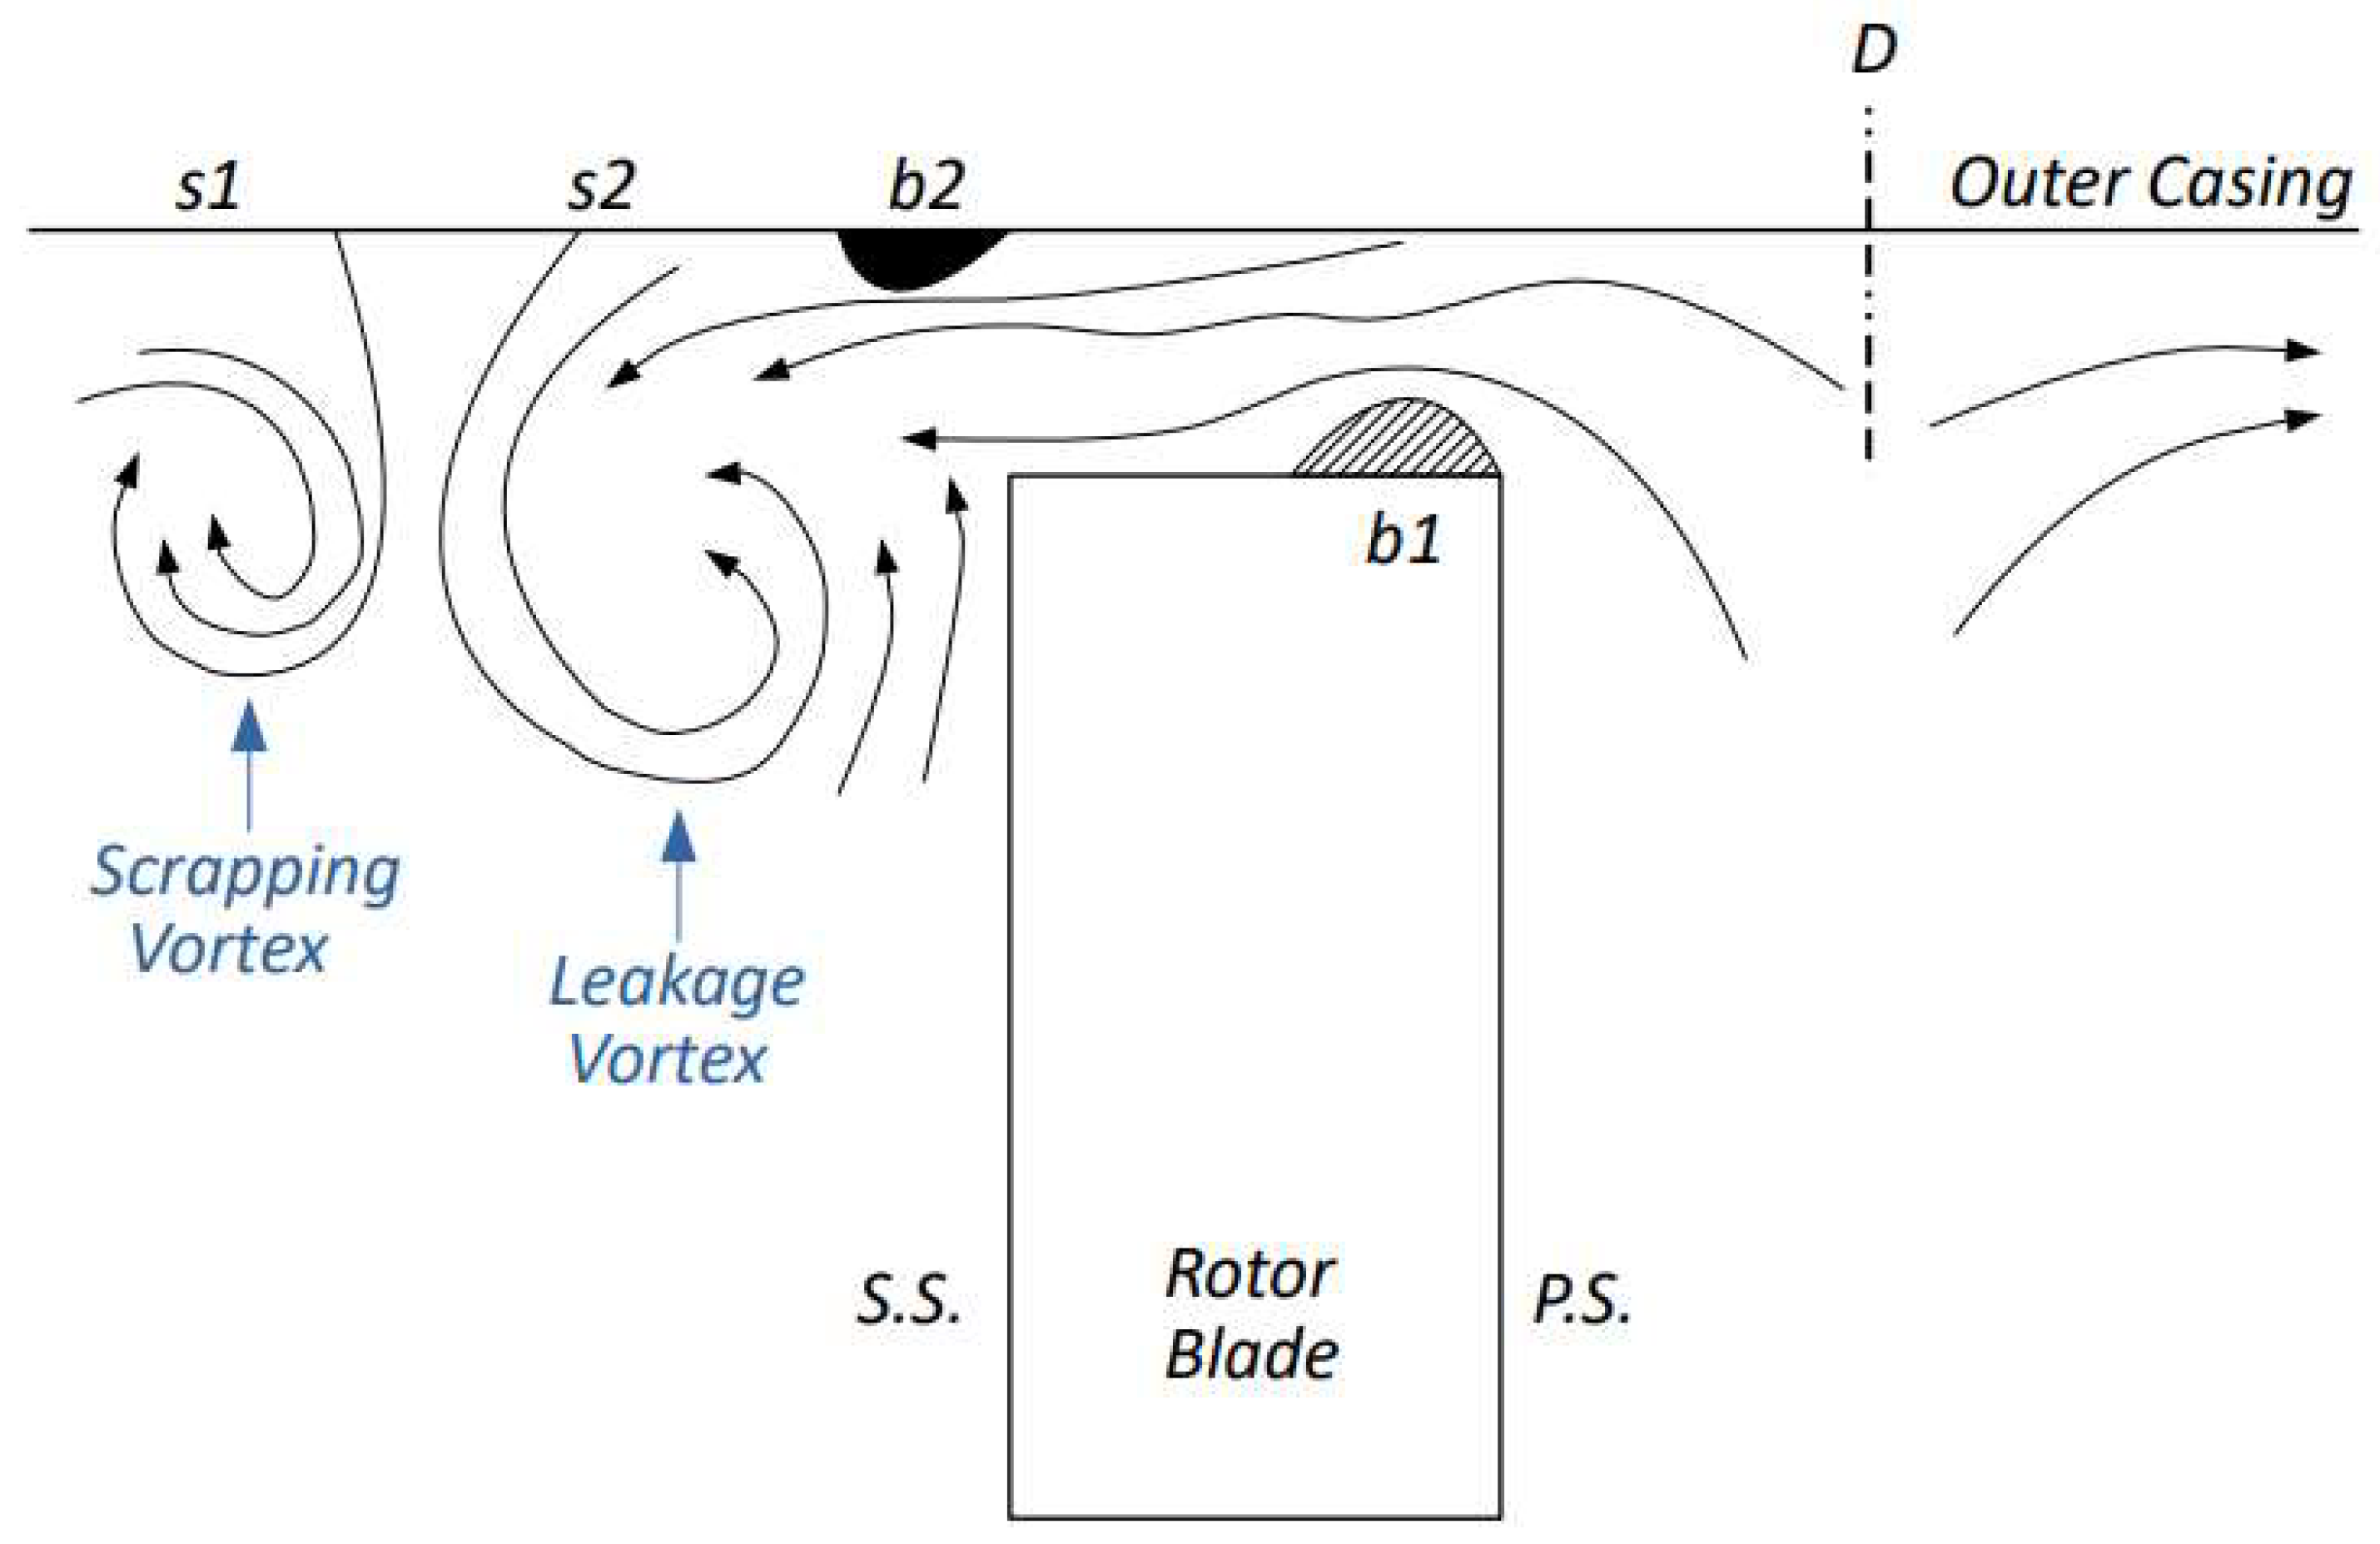
Figure 2.
Tip clearance leakage flow in a turbine rotor (modified from [36]). Stagnation region is represented by line A1-A2. The behavior of the leakage vortex and the attachment of fluid on the blade (bubble b1) is also represented.
Figure 2.
Tip clearance leakage flow in a turbine rotor (modified from [36]). Stagnation region is represented by line A1-A2. The behavior of the leakage vortex and the attachment of fluid on the blade (bubble b1) is also represented.
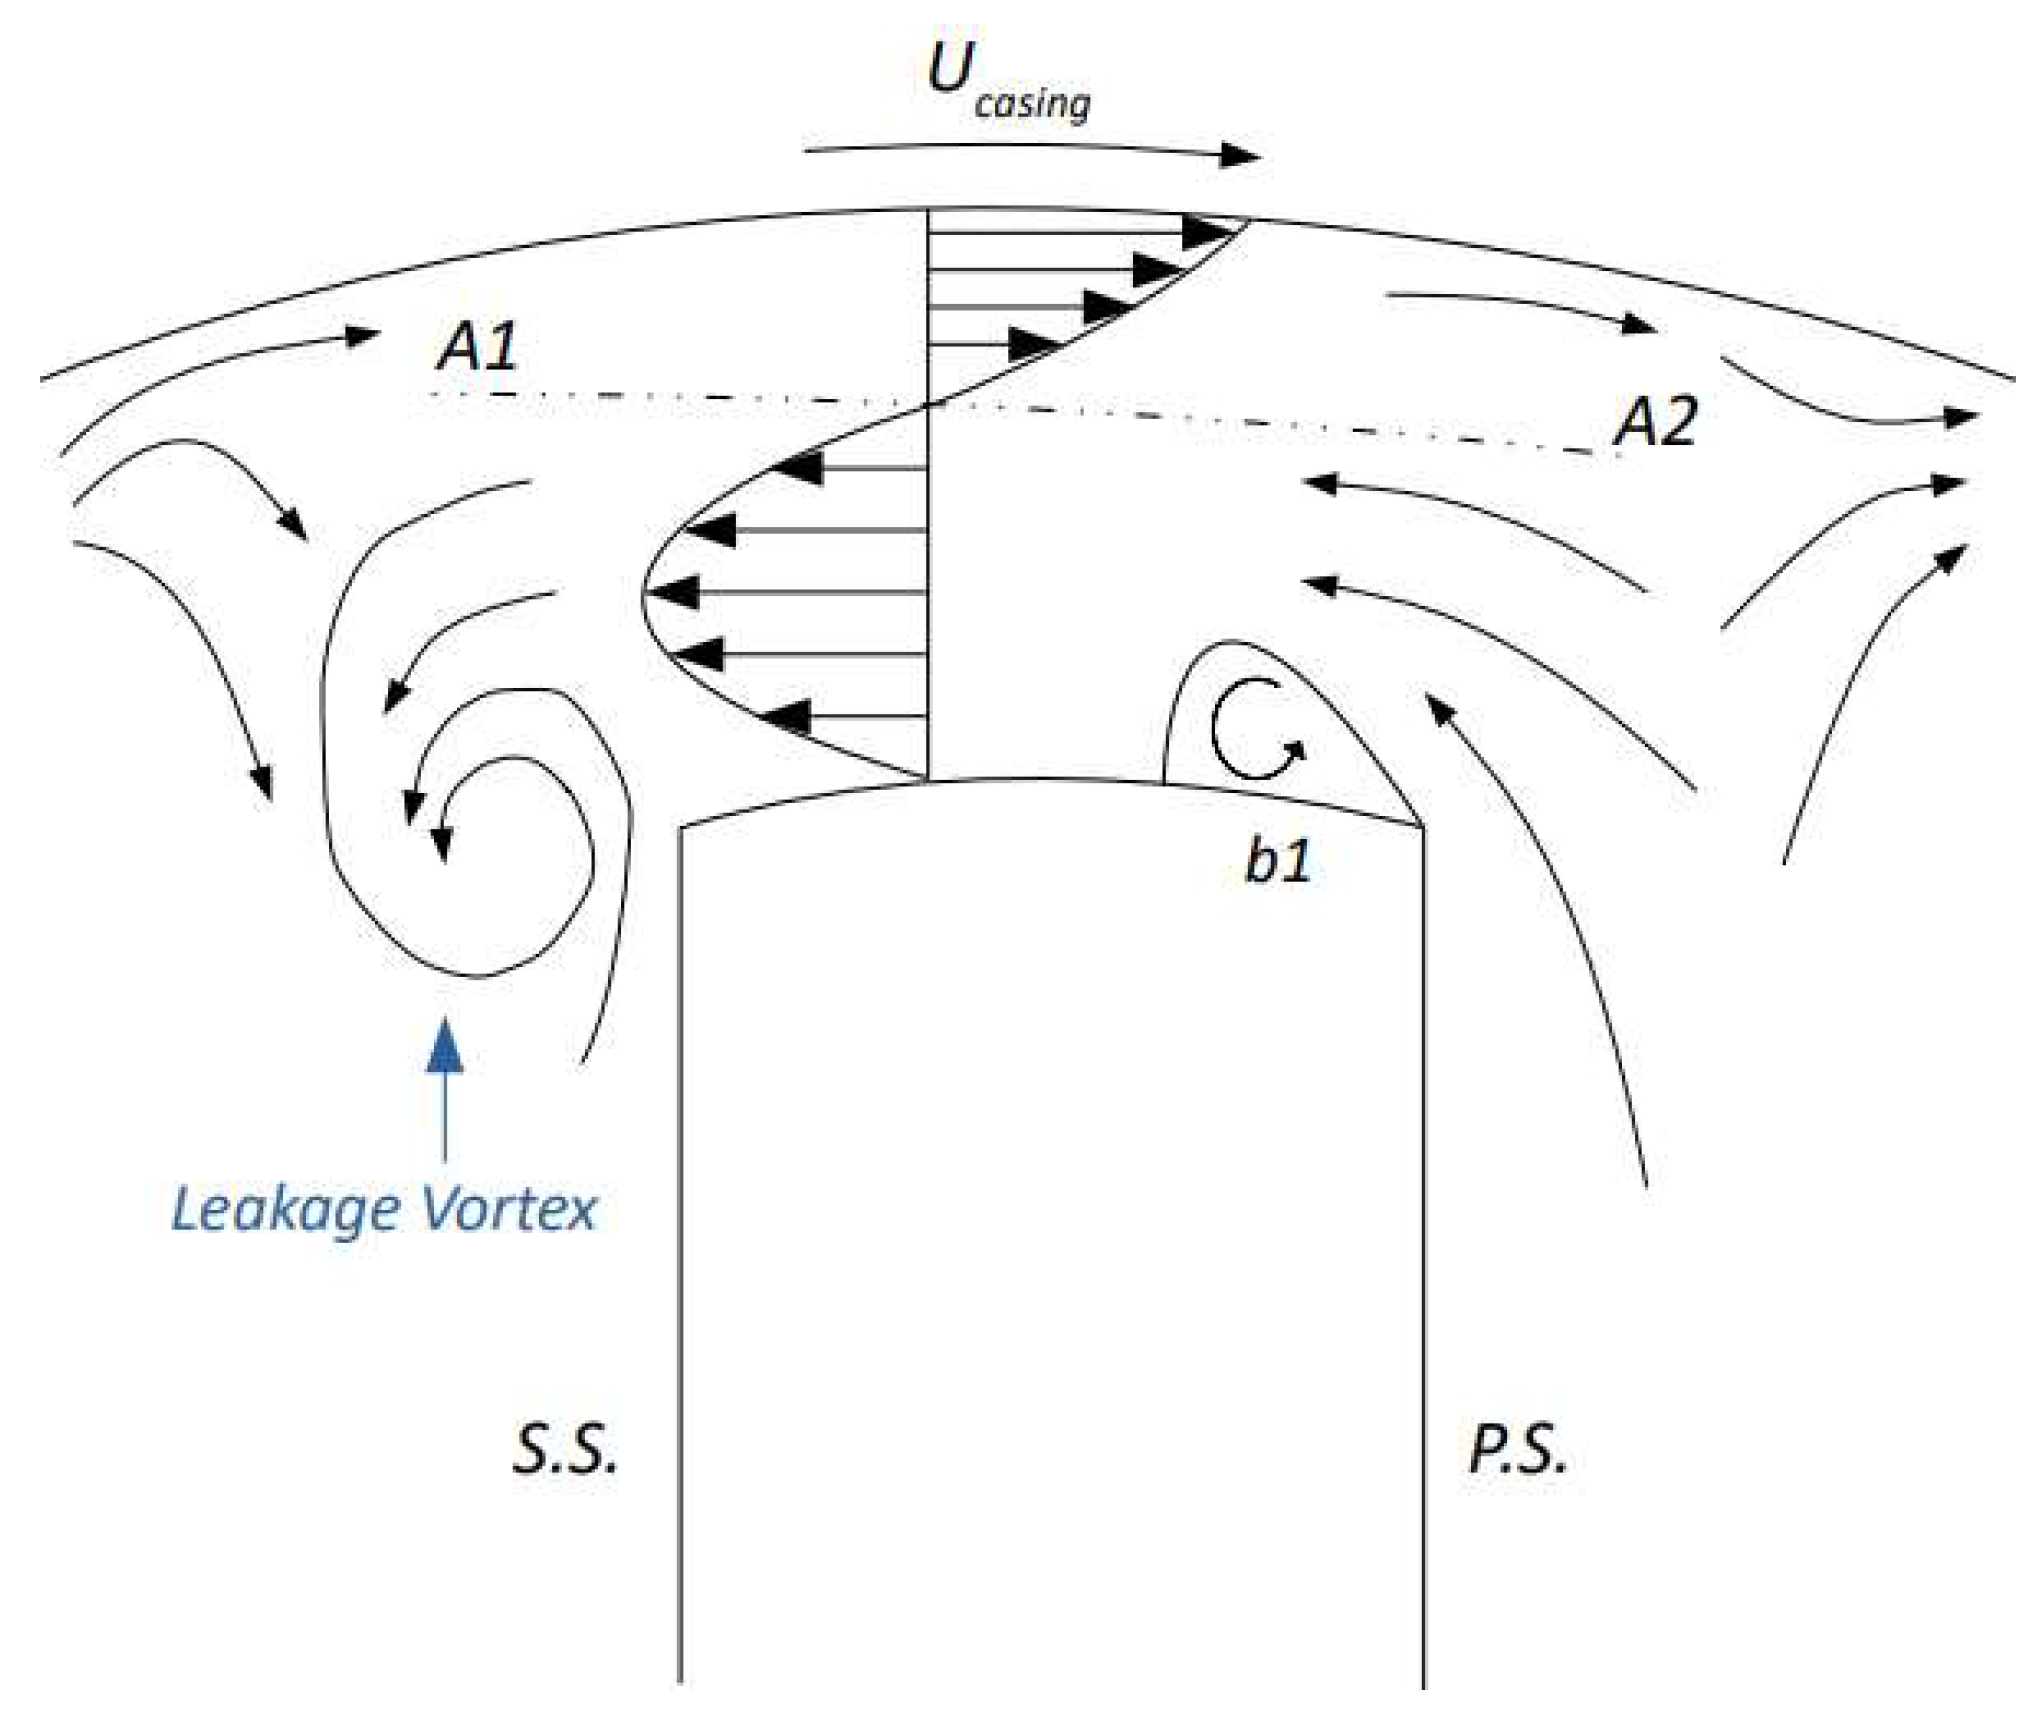
Figure 3.
SSME Simplified thermodynamic cycle (modified from [55]). LOX and LH2 paths are indicated by blue and red colors respectively. There are a main and a booster TP for each propellant. The LOX booster TP is highlighted on this figure by a red circle.
Figure 3.
SSME Simplified thermodynamic cycle (modified from [55]). LOX and LH2 paths are indicated by blue and red colors respectively. There are a main and a booster TP for each propellant. The LOX booster TP is highlighted on this figure by a red circle.
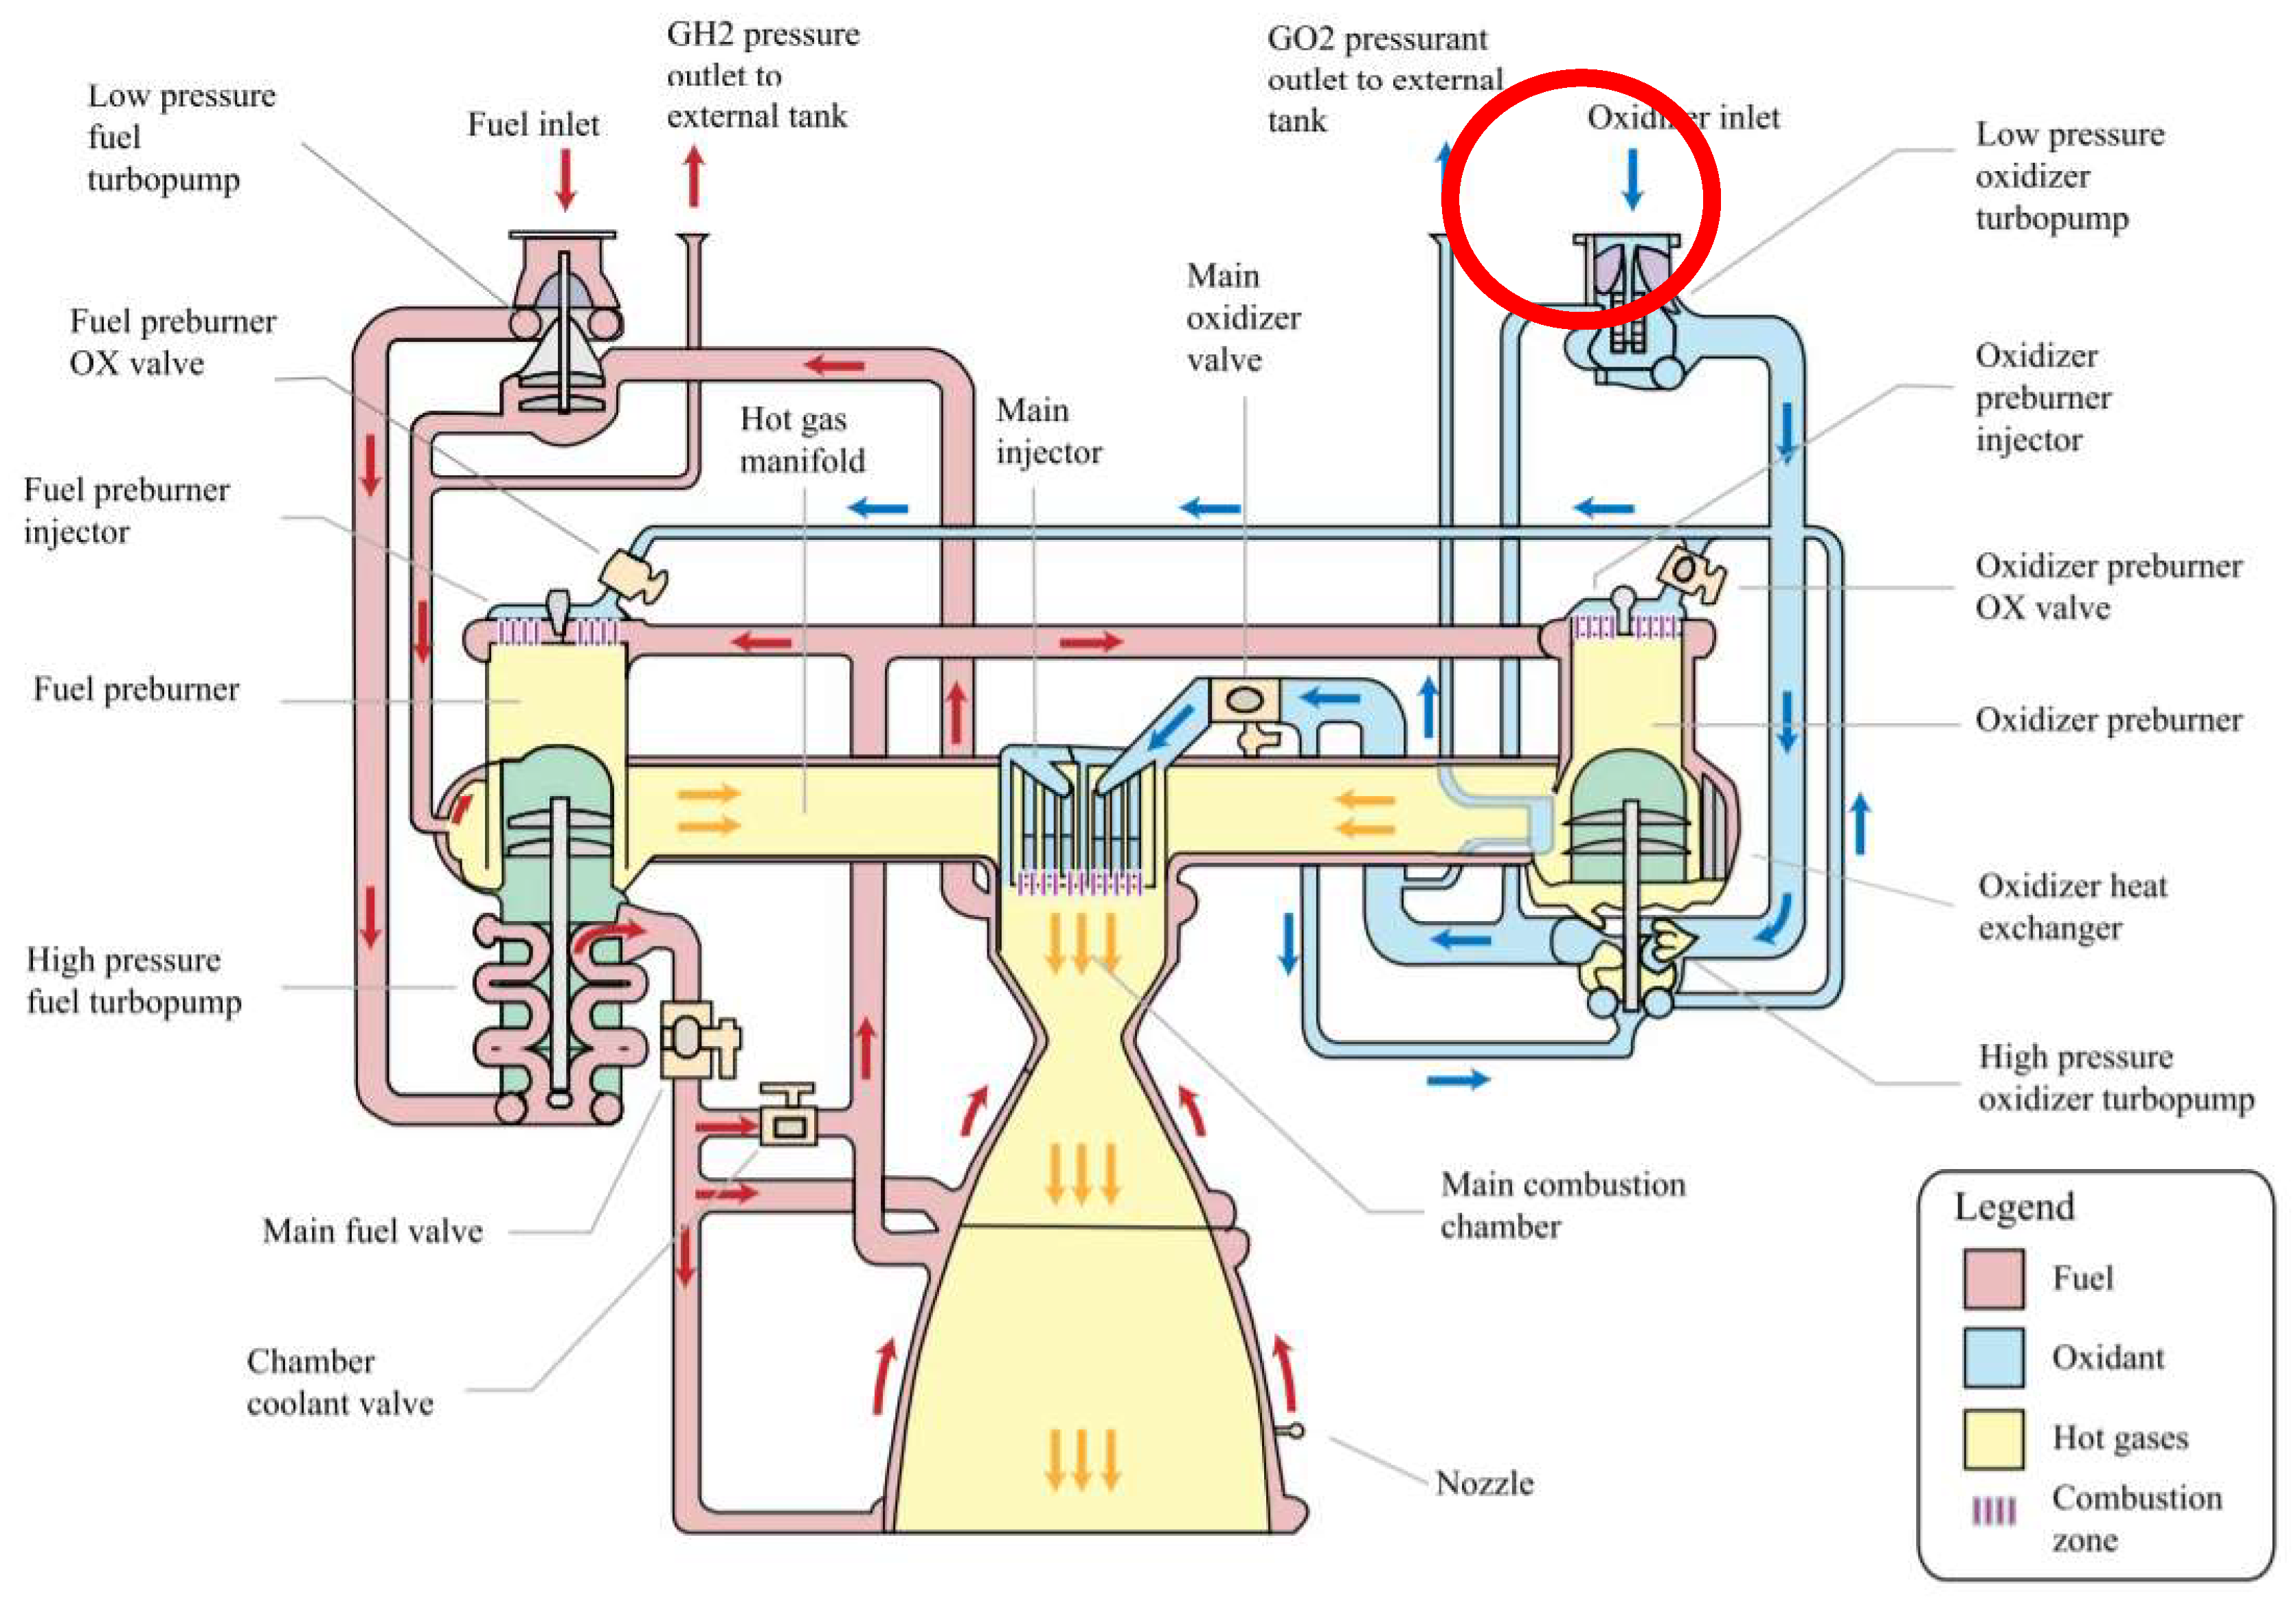
Figure 4.
Cutaway view of the SSME LOX booster TP (modified from [56]). The 6-stage hydraulic axial turbine is represented in red while the pump is represented in blue. Bearings, turbine inlet duct and the pump inlet duct are highlighted in gray, orange and green respectively.
Figure 4.
Cutaway view of the SSME LOX booster TP (modified from [56]). The 6-stage hydraulic axial turbine is represented in red while the pump is represented in blue. Bearings, turbine inlet duct and the pump inlet duct are highlighted in gray, orange and green respectively.
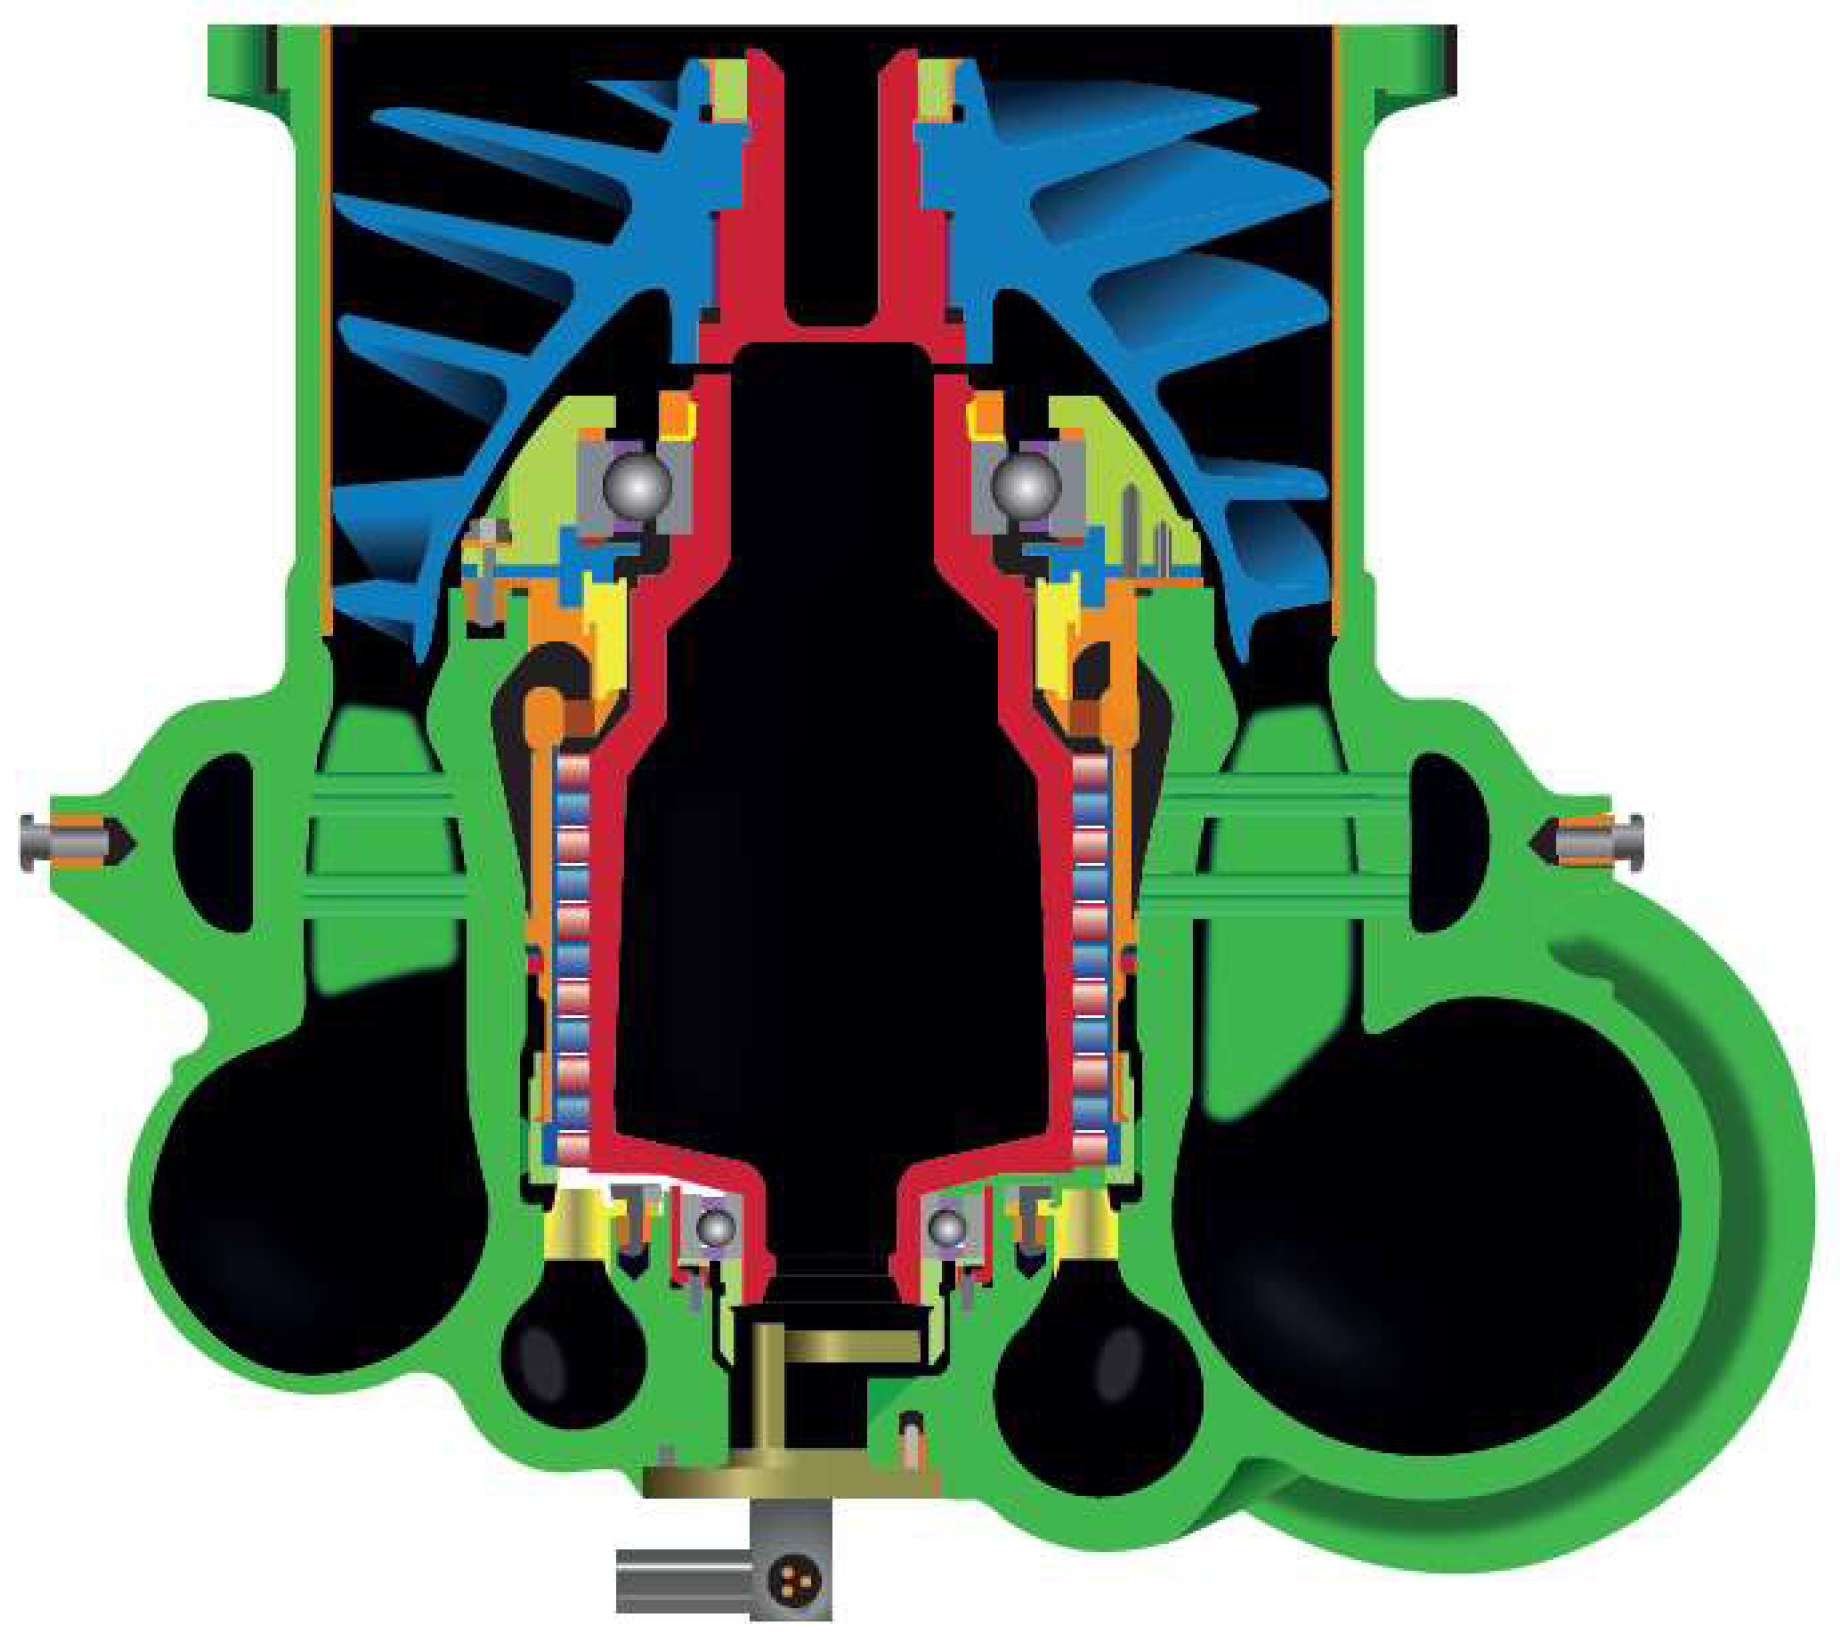
Figure 5.
Comparison between different tip geometries.
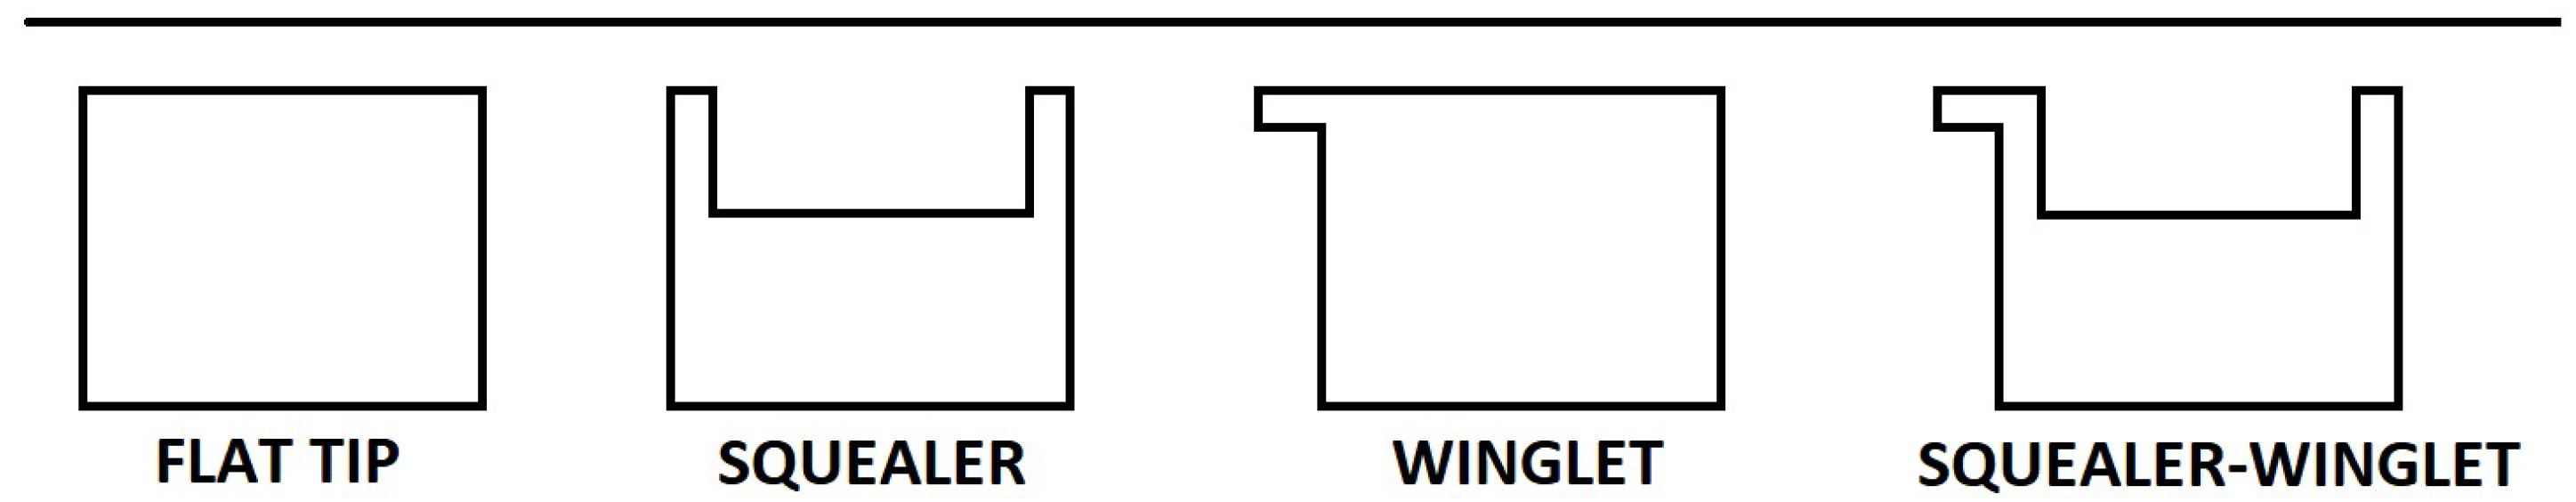
Figure 6.
Leakage behavior over a winglet tip geometry (modified from [36]). The flow characteristic is similar to the one in a flat tip geometry, however, the geometric extension on the pressure side, created by the insertion of the desensitization technique, is able to weak the leakage vortex.
Figure 6.
Leakage behavior over a winglet tip geometry (modified from [36]). The flow characteristic is similar to the one in a flat tip geometry, however, the geometric extension on the pressure side, created by the insertion of the desensitization technique, is able to weak the leakage vortex.
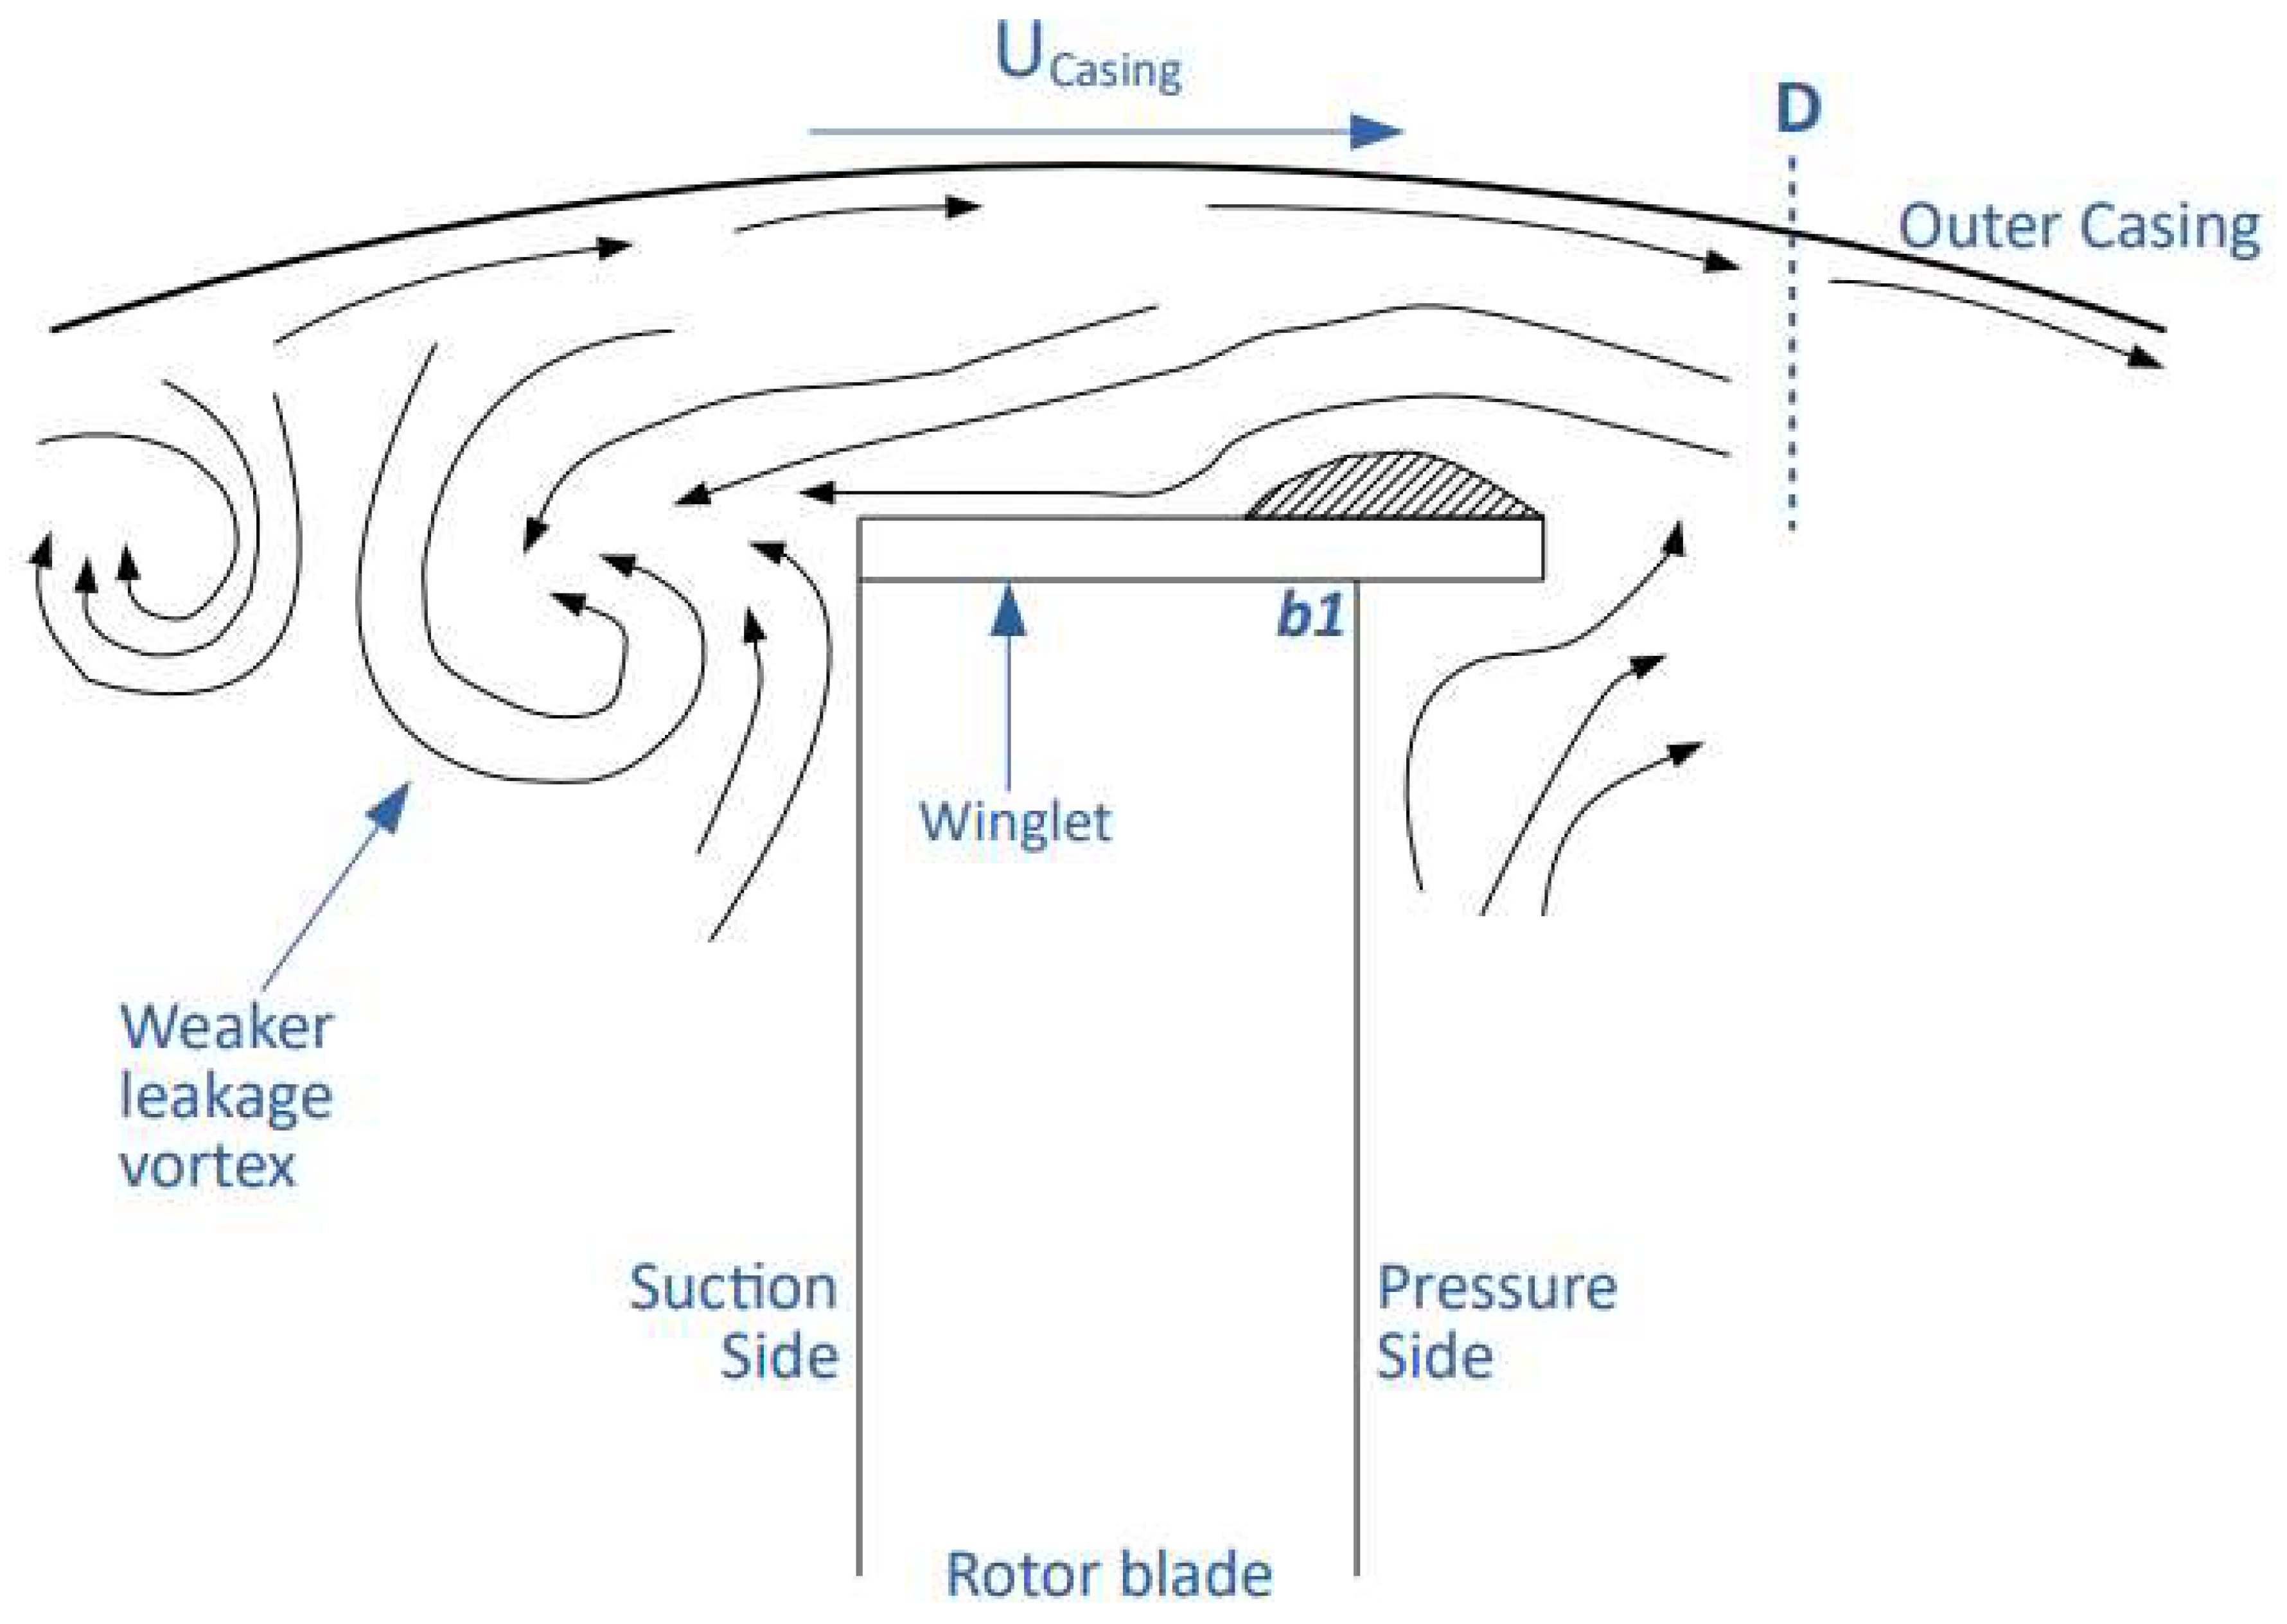
Figure 7.
Winglet modification parameters (modified from [63]). Thickness and width parameters are defining by following the same directions as the blade thickness and height respectively.
Figure 7.
Winglet modification parameters (modified from [63]). Thickness and width parameters are defining by following the same directions as the blade thickness and height respectively.
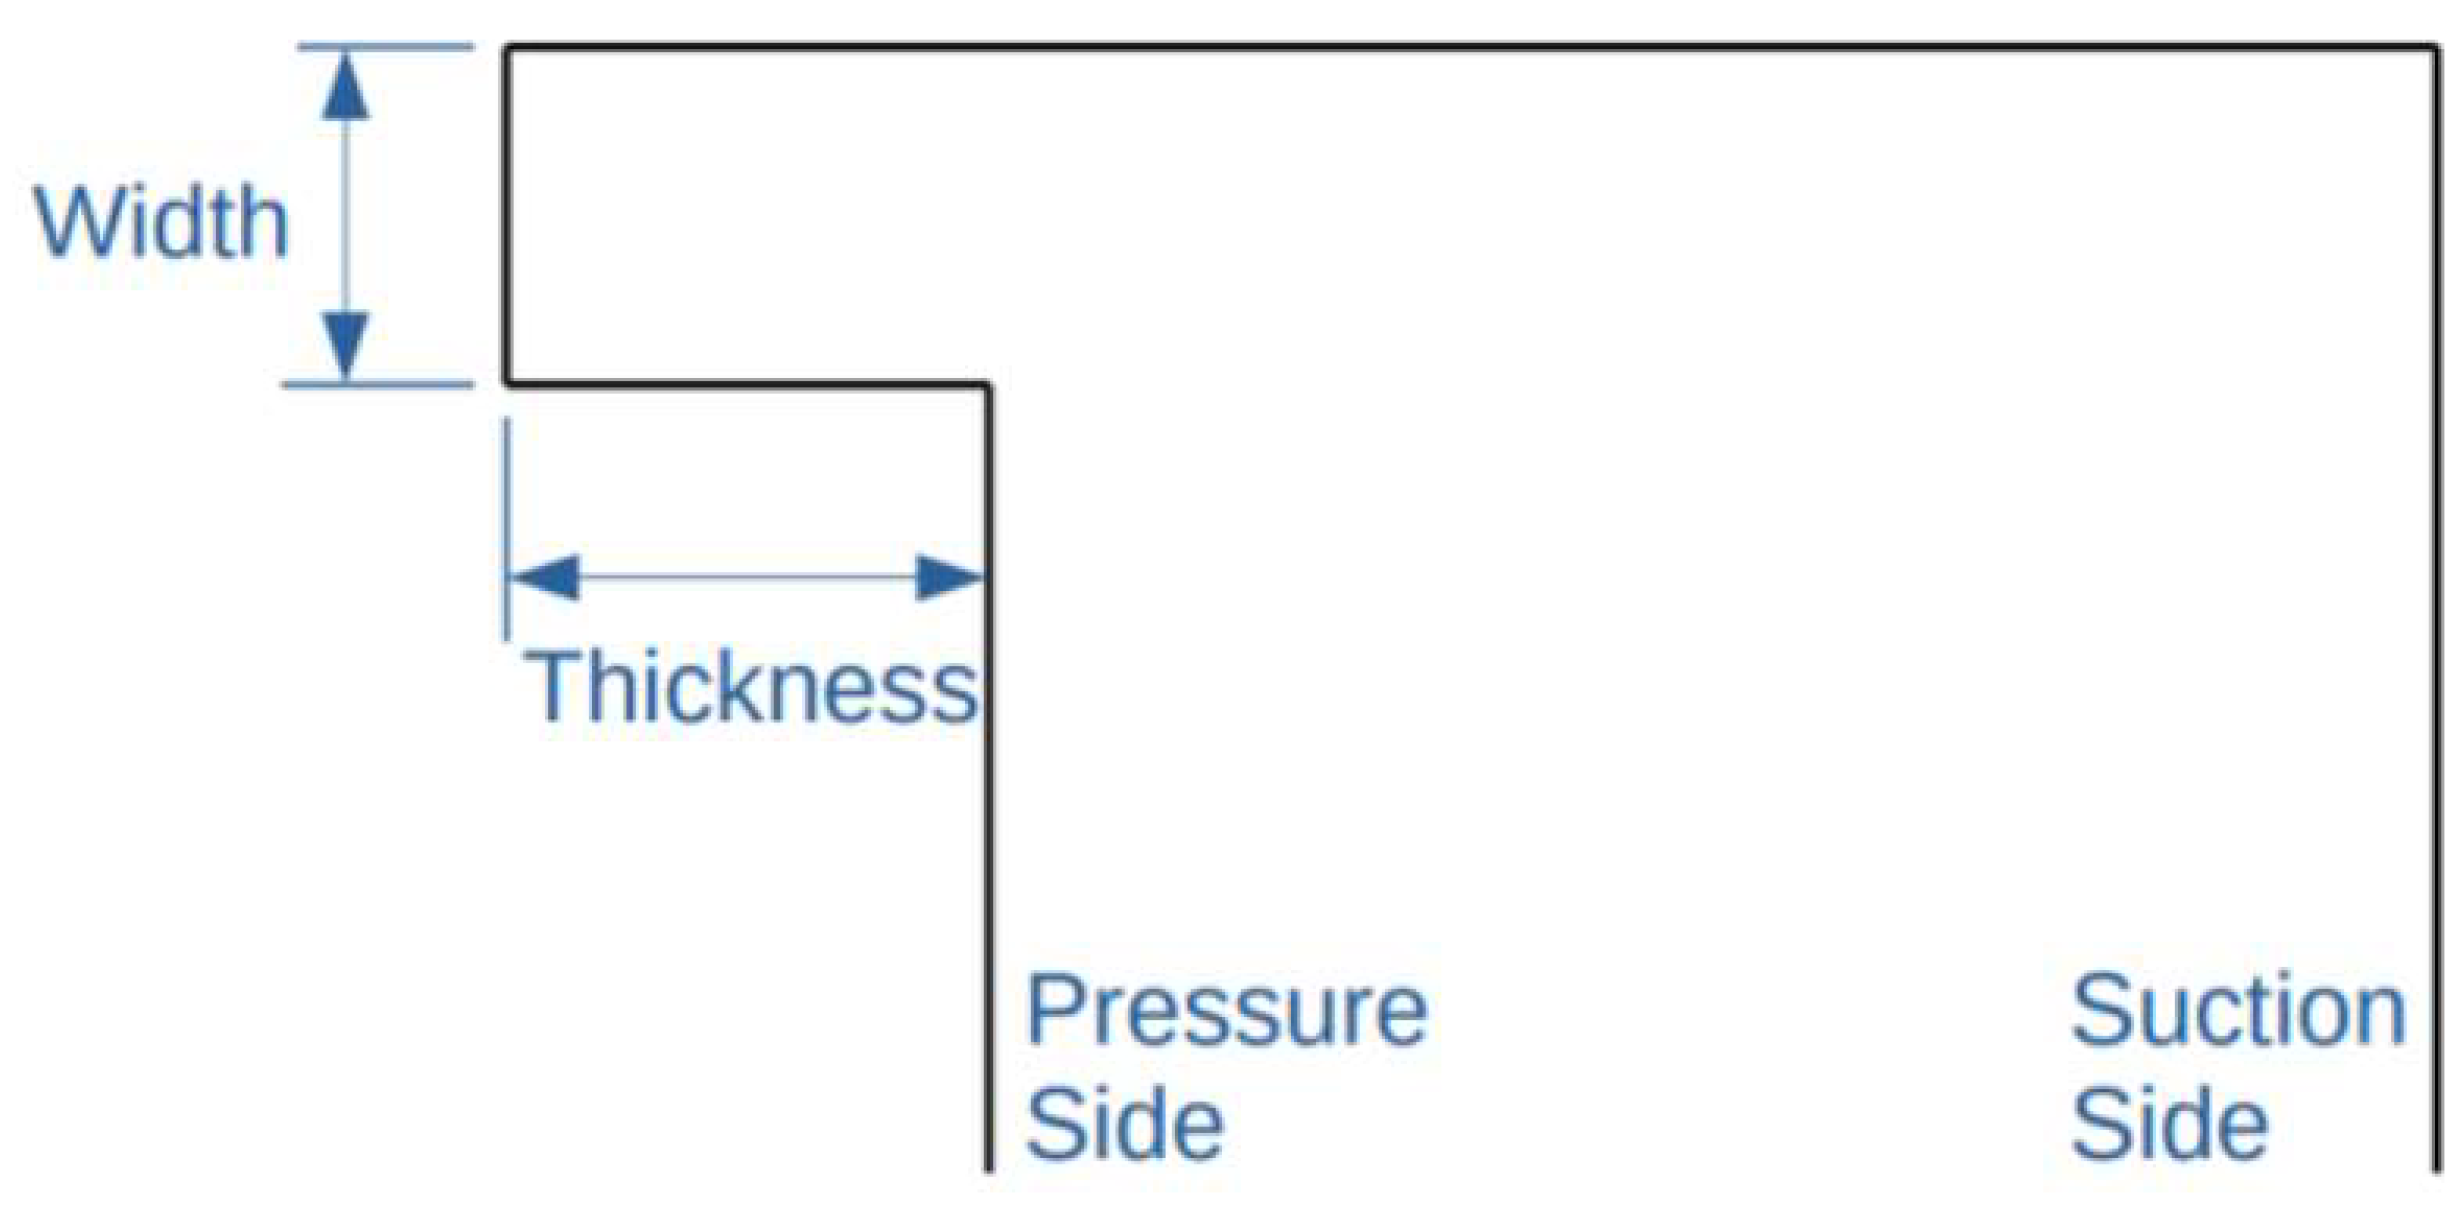
Figure 8.
Comparison between the winglet geometries analyzed by Tonon et al. (modified from [63]). Although geometry (a) generates a larger wake region, it also provides a greater increase on the performance in comparison with (b).
Figure 8.
Comparison between the winglet geometries analyzed by Tonon et al. (modified from [63]). Although geometry (a) generates a larger wake region, it also provides a greater increase on the performance in comparison with (b).
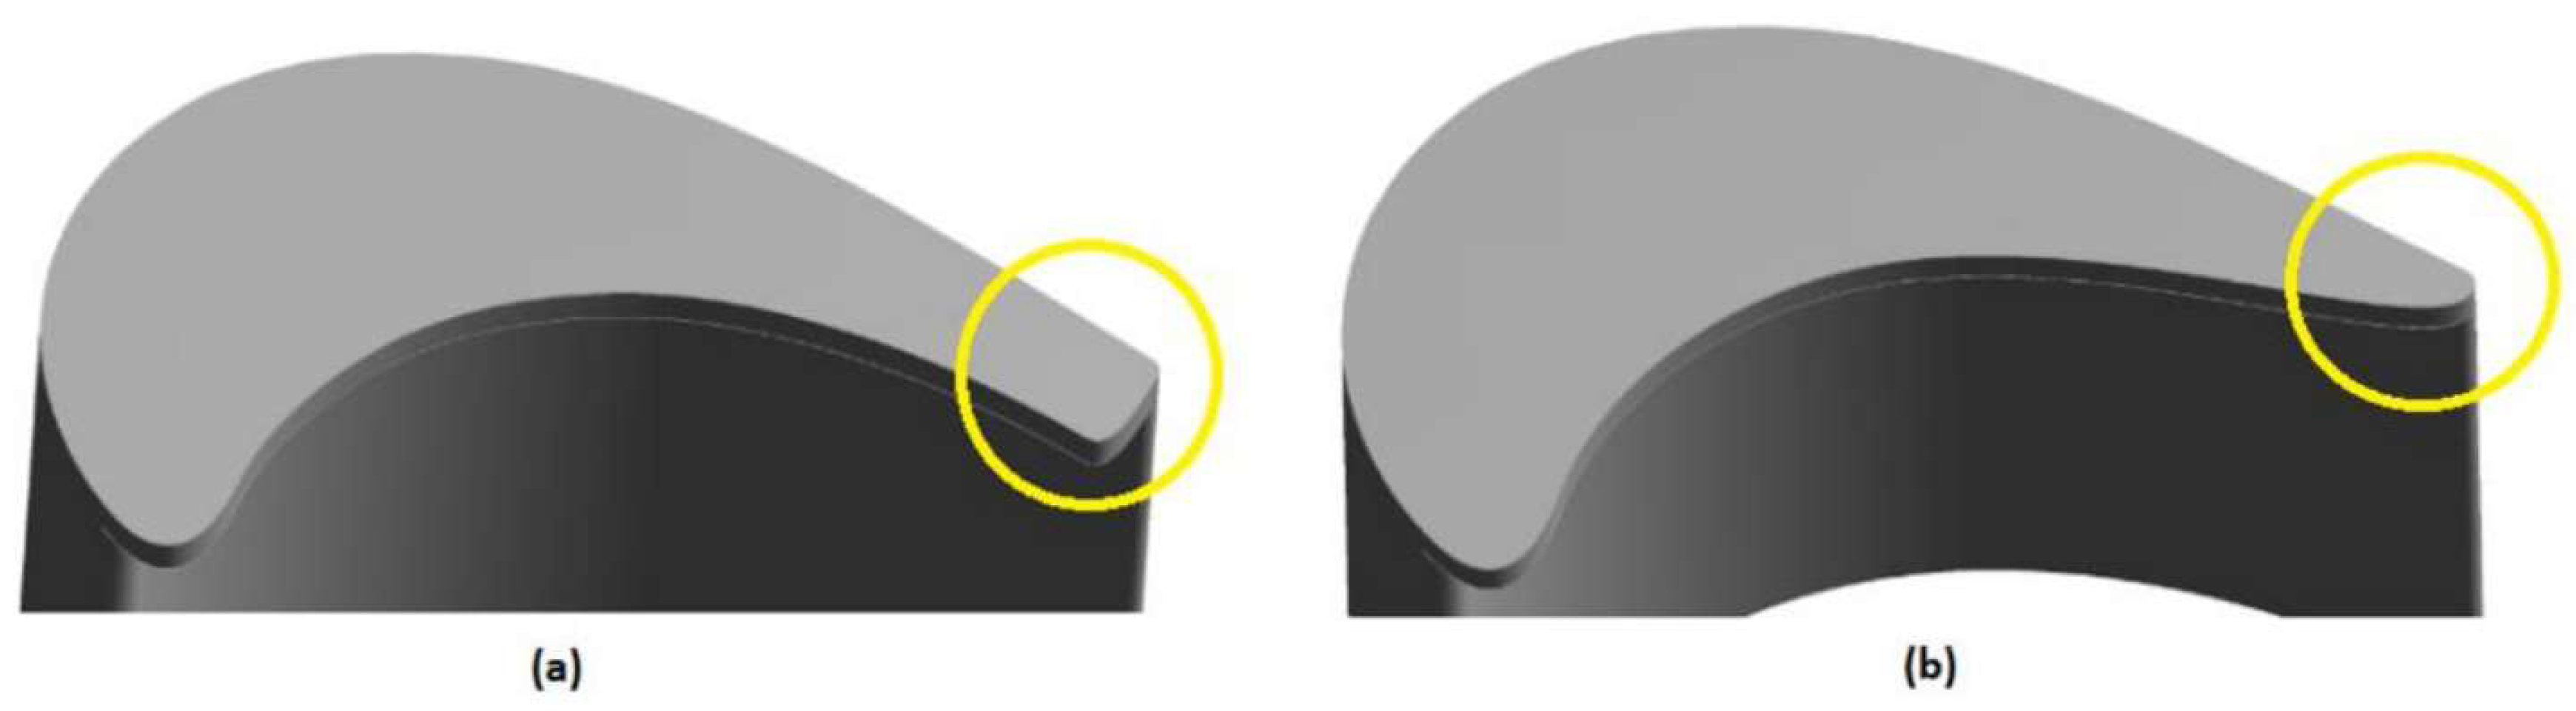
Figure 9.
Representation of the used mesh in the computational domain.
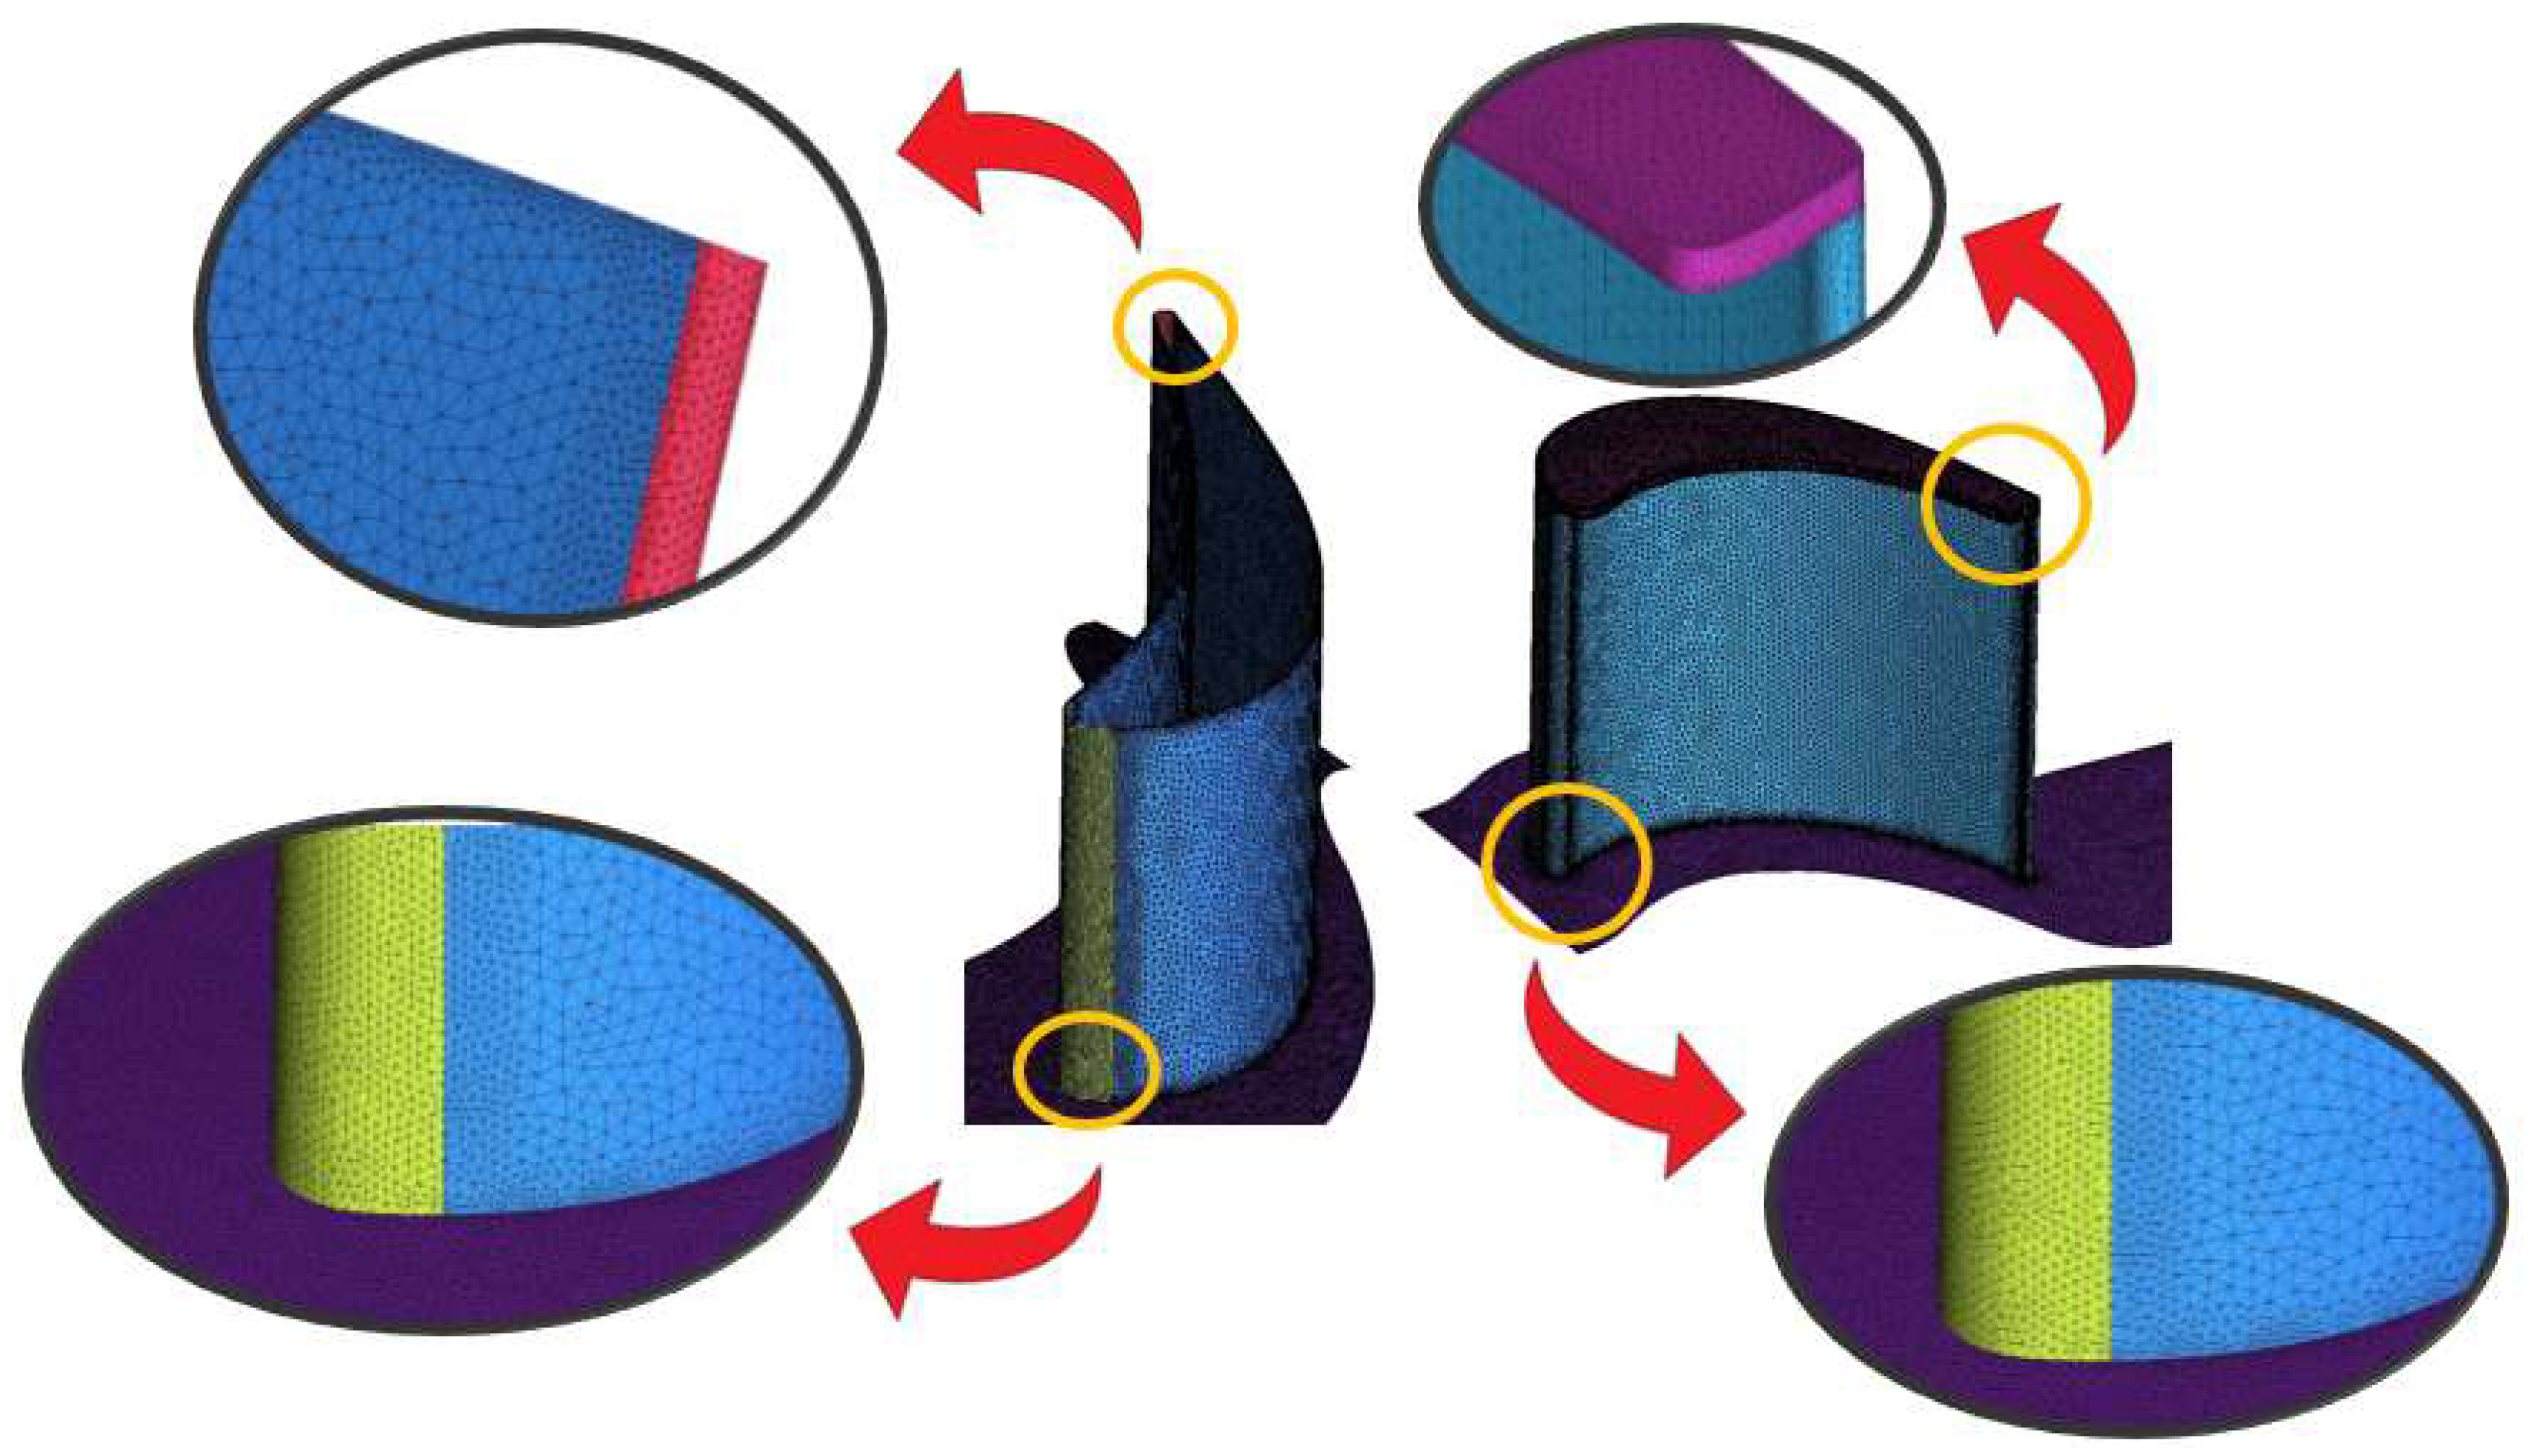
Figure 10.
Mesh independency study: (a) 8.70% thickness and 5.40% width winglet; (b) 2.90% thickness and 2.70% width winglet.
Figure 10.
Mesh independency study: (a) 8.70% thickness and 5.40% width winglet; (b) 2.90% thickness and 2.70% width winglet.
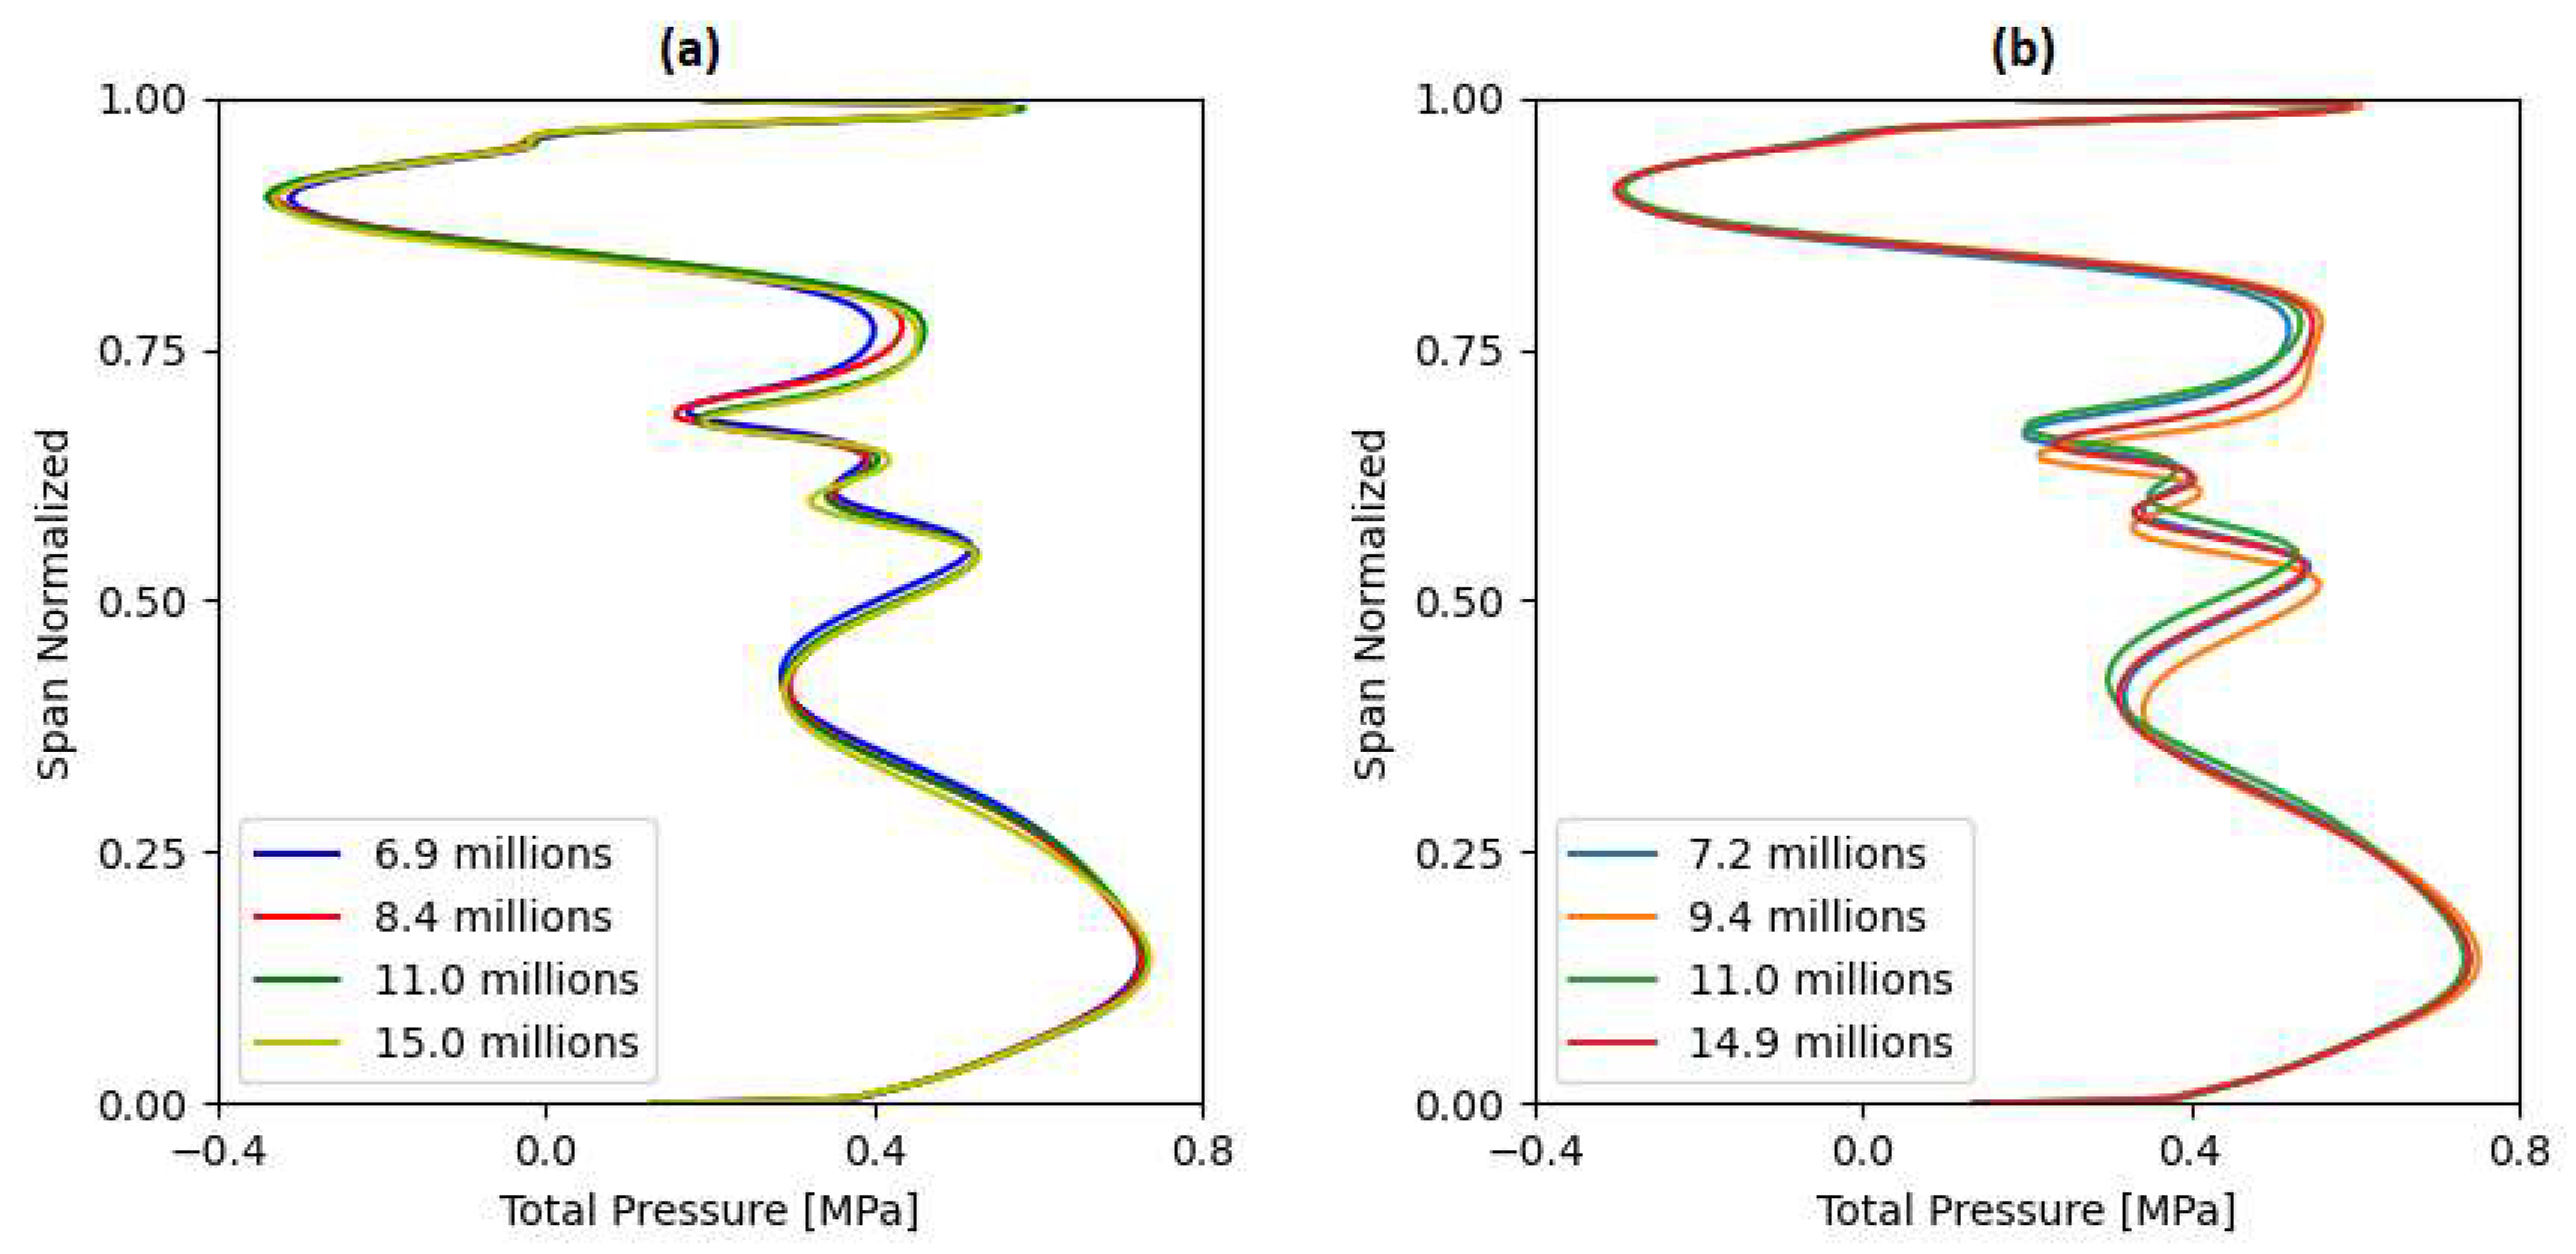
Figure 11.
Residual behavior for simulations at 3,600 rpm. Figure shows the stabilization of the residues associated with mass conservation and momentum equations. The residues shown some pick values; these are associated with some sensible boundary conditions modifications made to keep inlet and outlet total pressure results close to that established in the tests report.
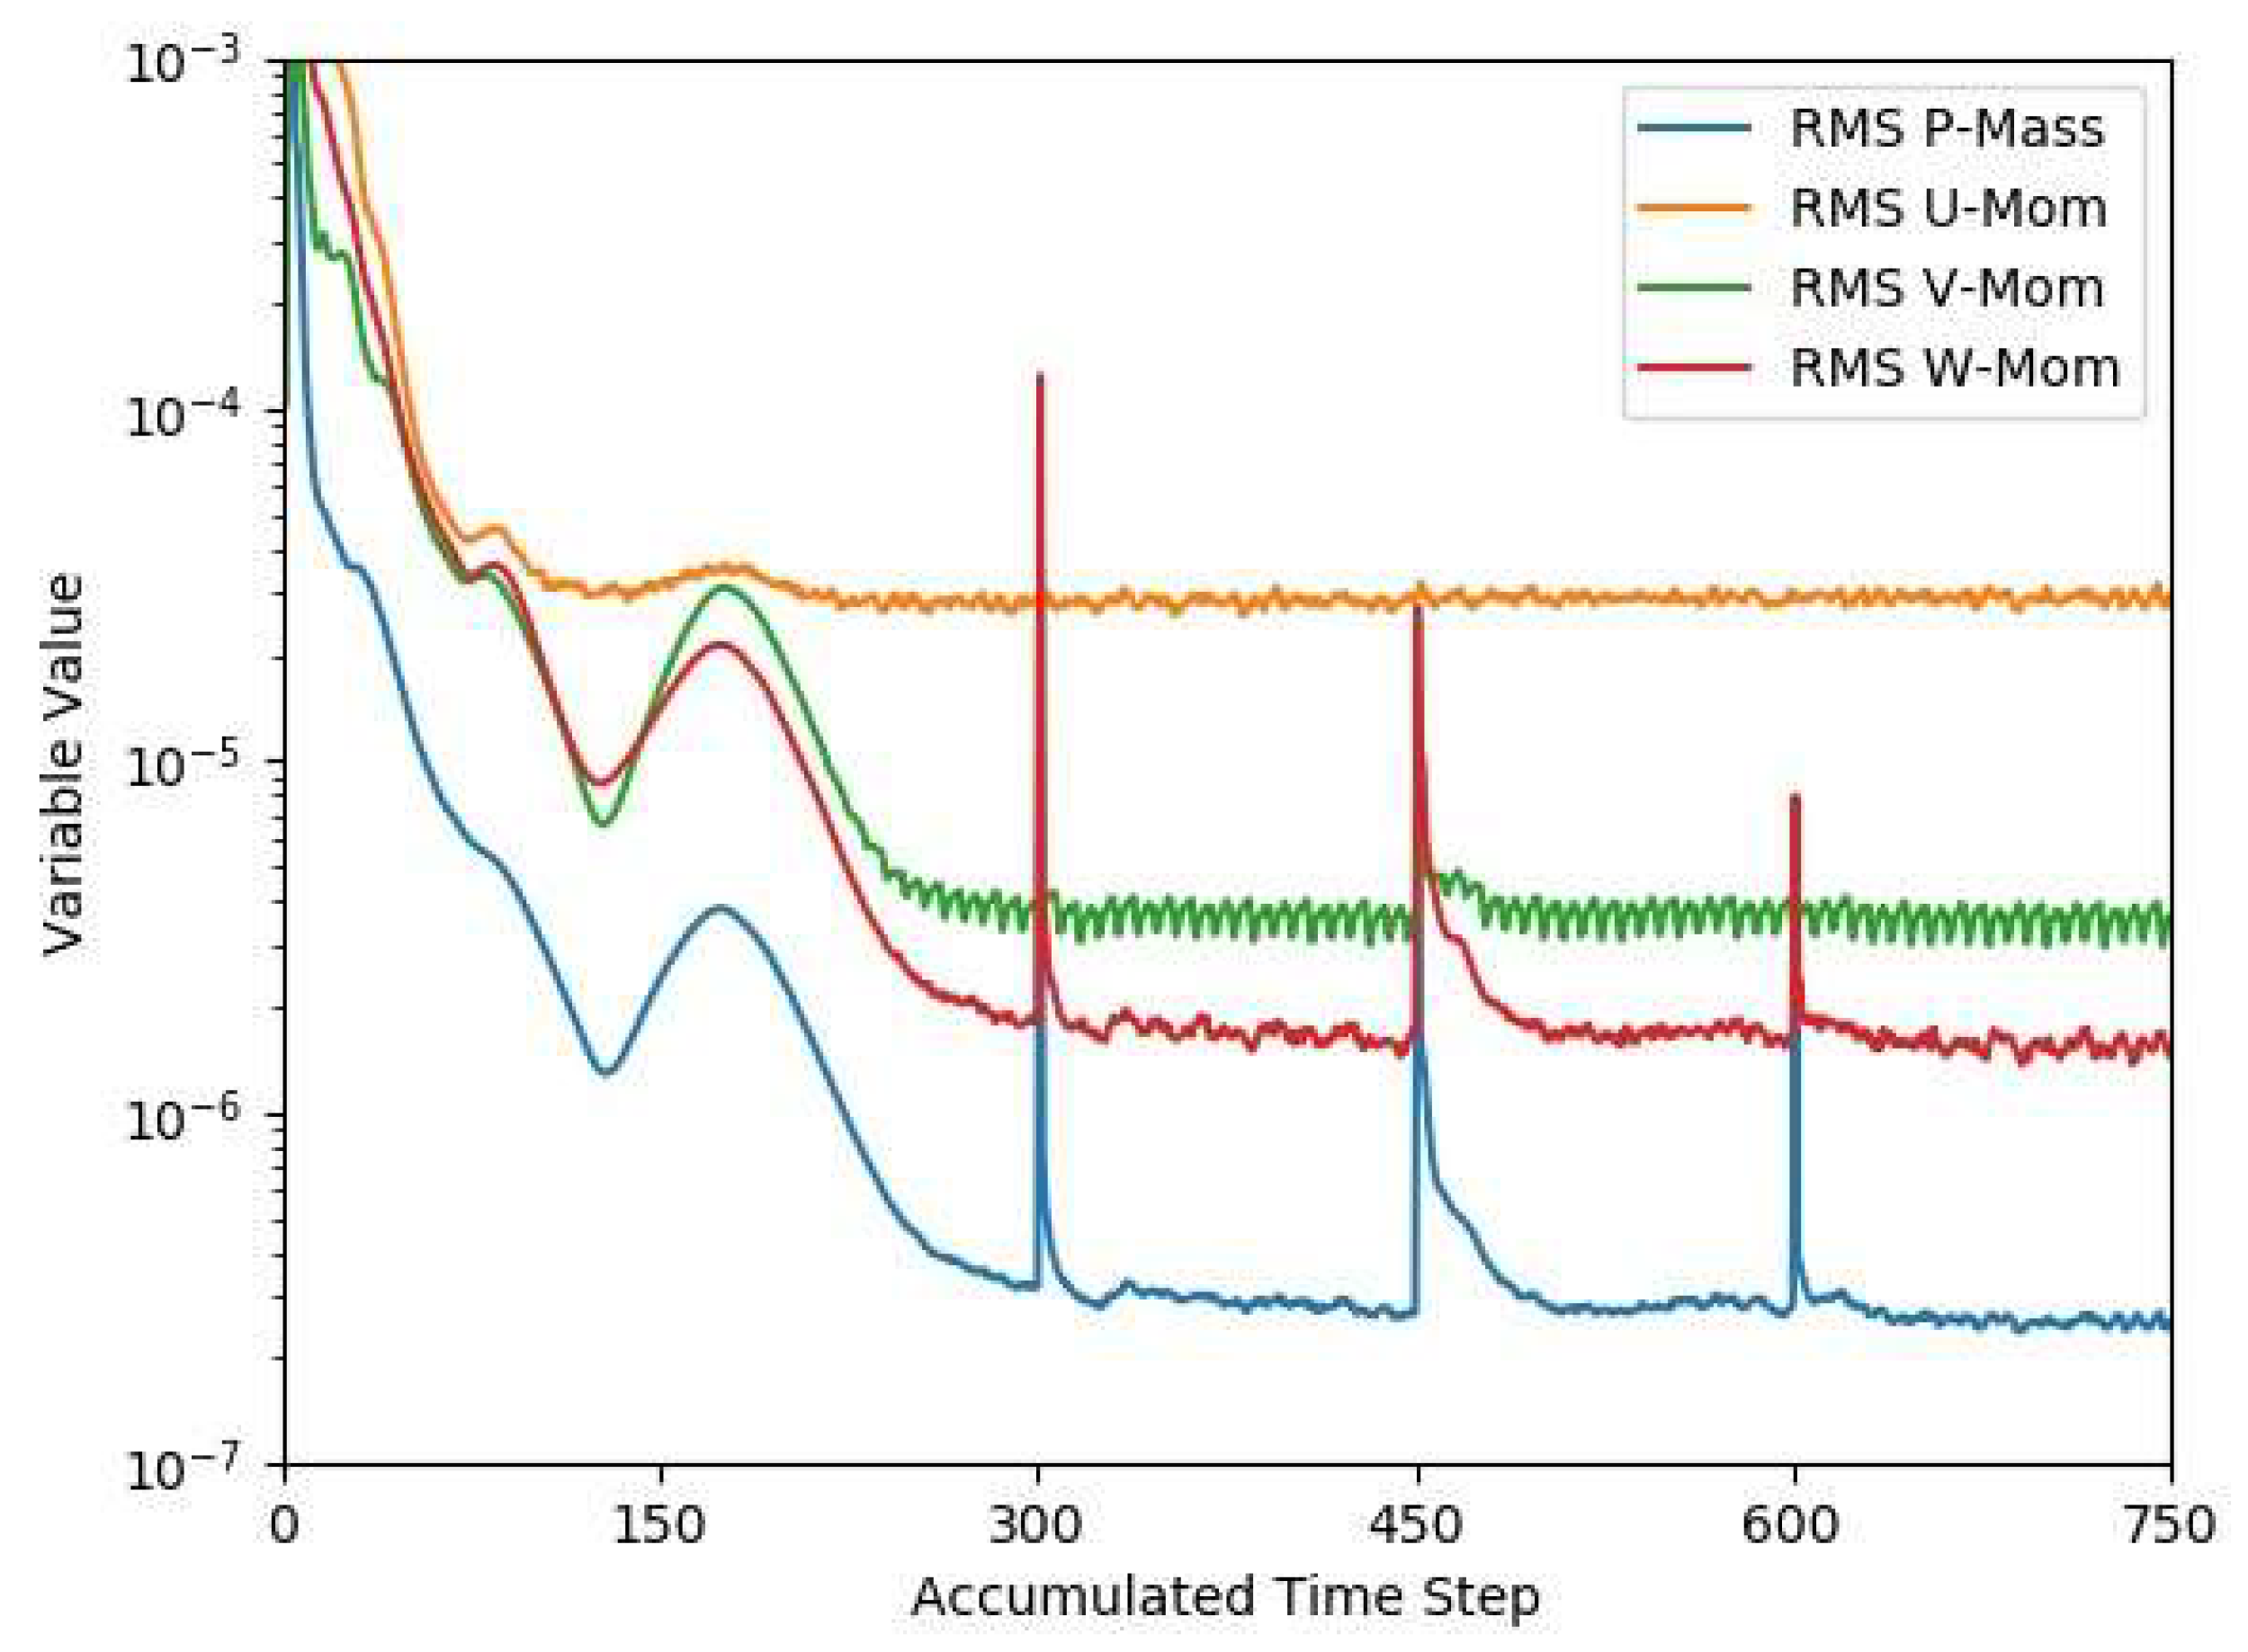
Figure 12.
Variables monitored total pressure at inlet, total pressure at outlet and pressure ratio.
Figure 12.
Variables monitored total pressure at inlet, total pressure at outlet and pressure ratio.
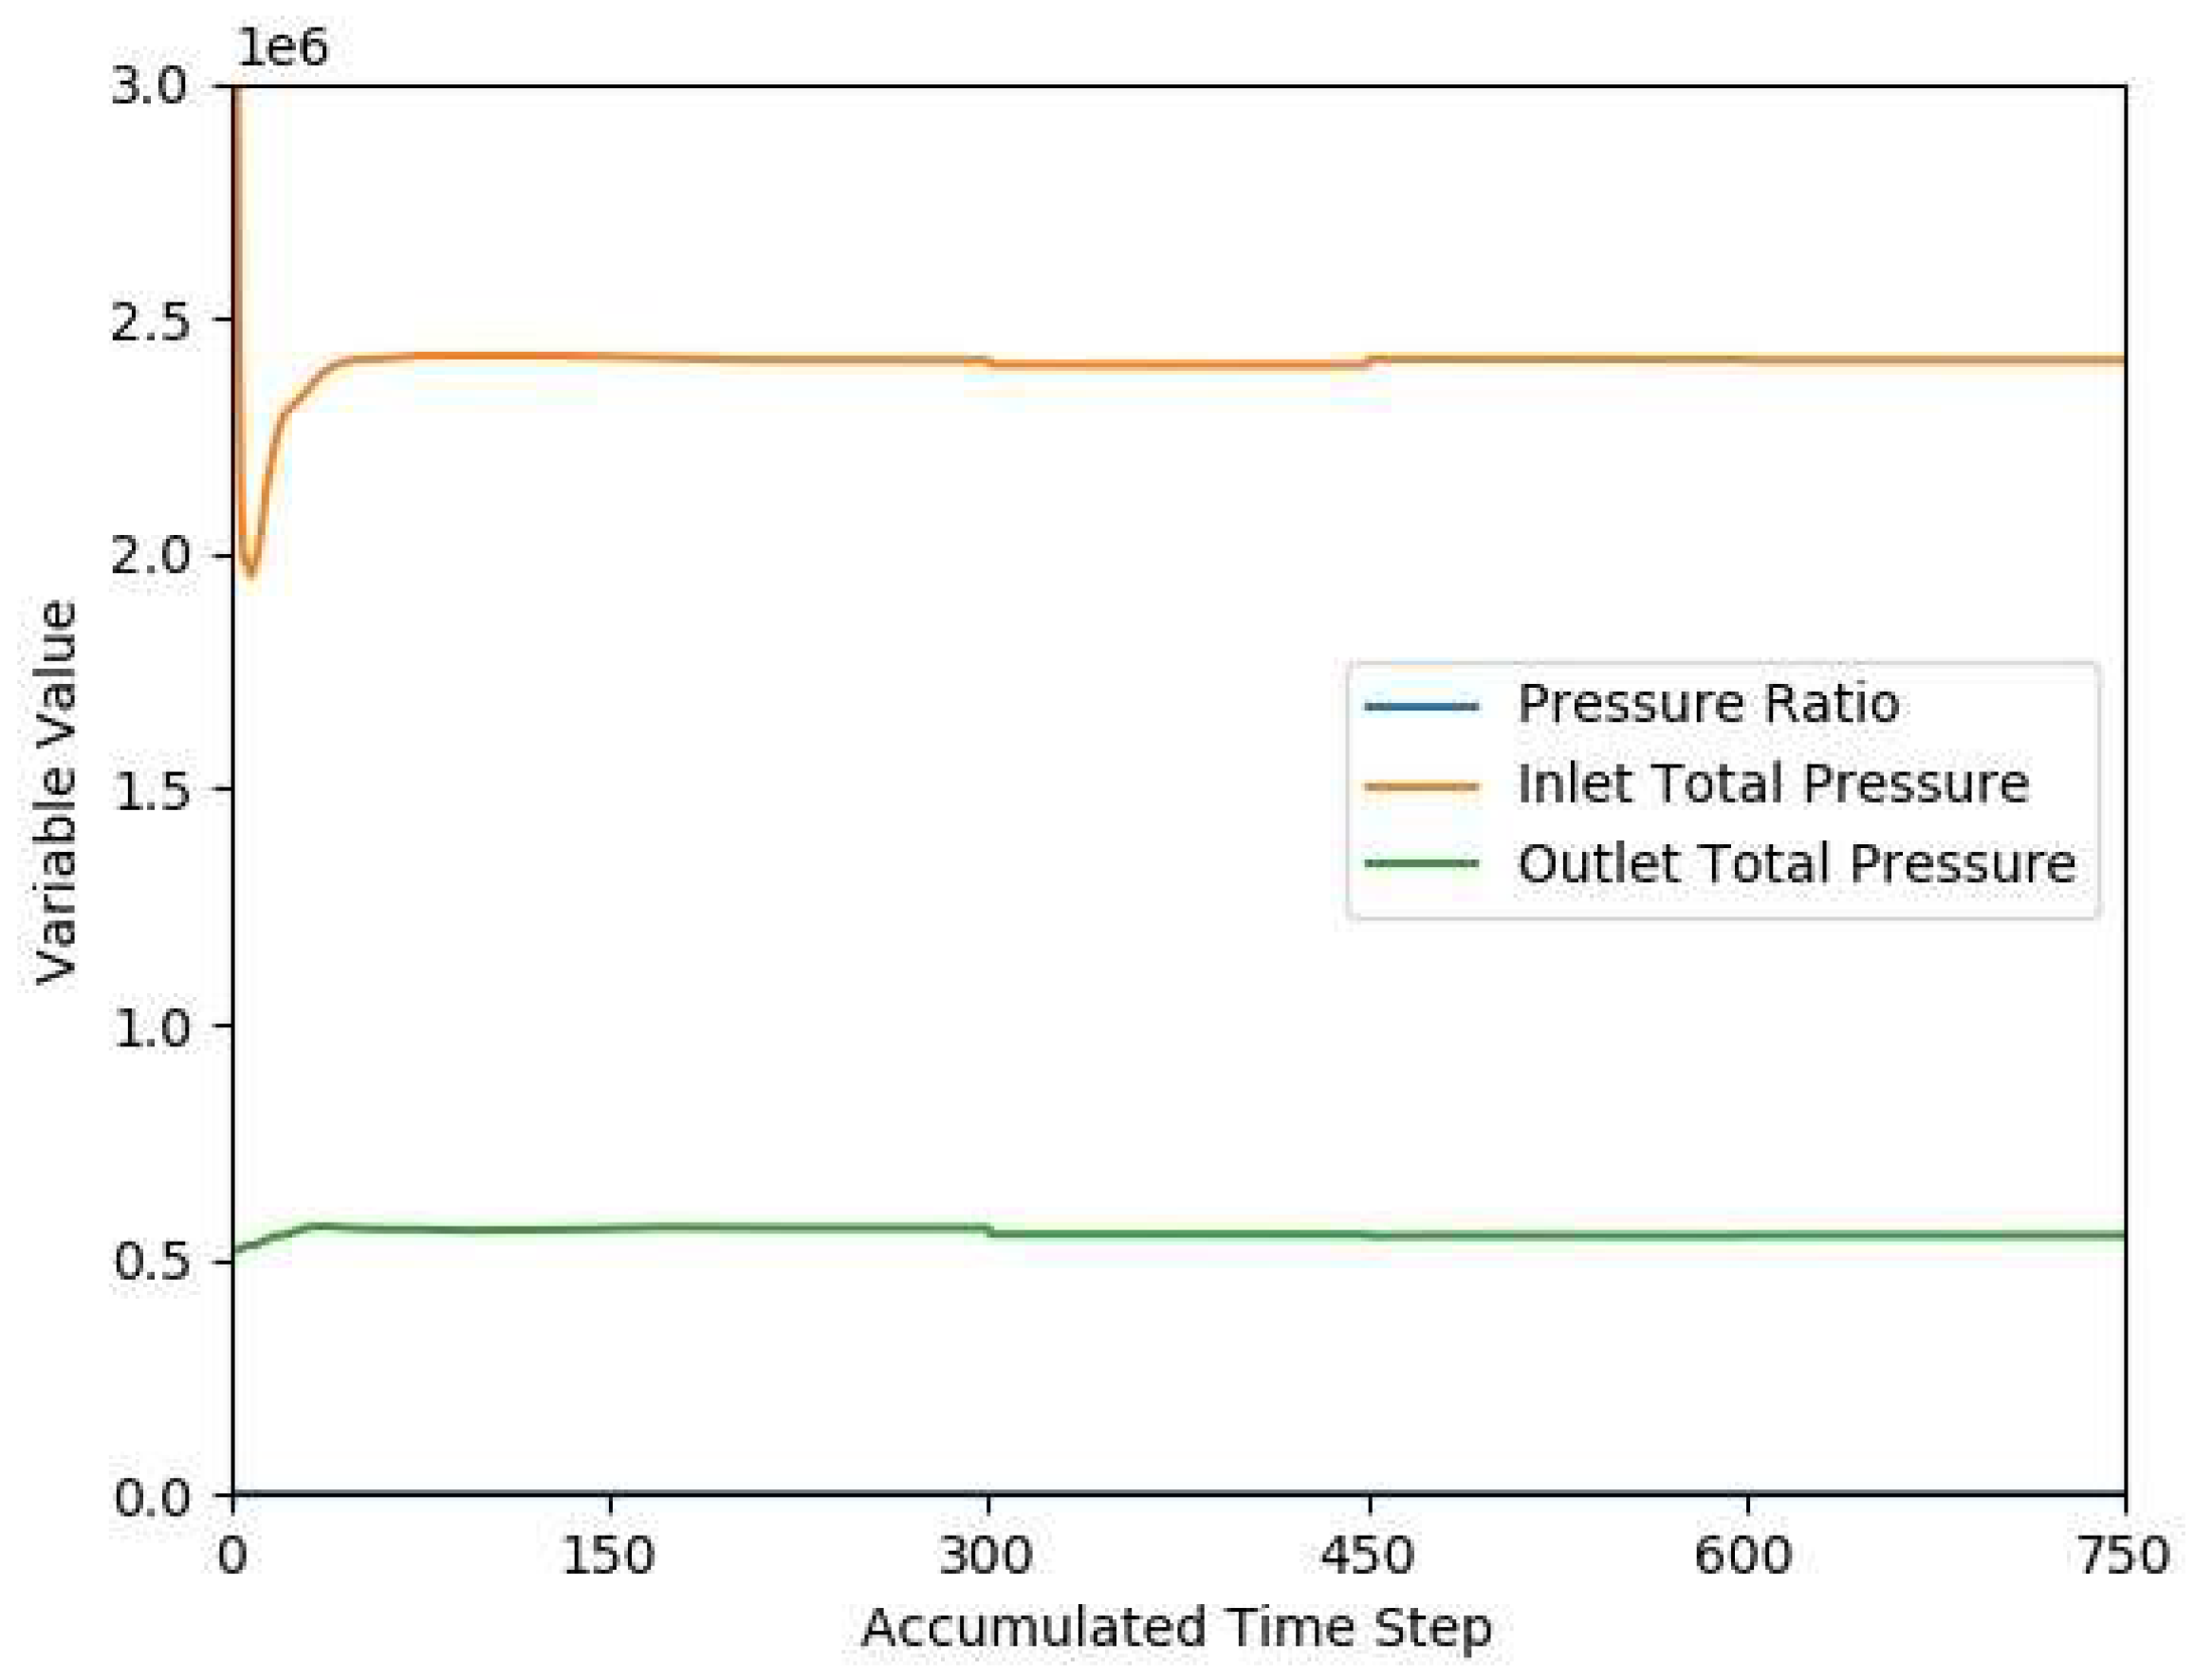
Figure 13.
Total pressure fluctuation at inlet for 2,454 rpm operational condition. The discontinuity shown at iteration 400 is associated with some sensible boundary conditions modifications made to keep inlet and outlet total pressure results close to that established in the experimental tests.
Figure 13.
Total pressure fluctuation at inlet for 2,454 rpm operational condition. The discontinuity shown at iteration 400 is associated with some sensible boundary conditions modifications made to keep inlet and outlet total pressure results close to that established in the experimental tests.
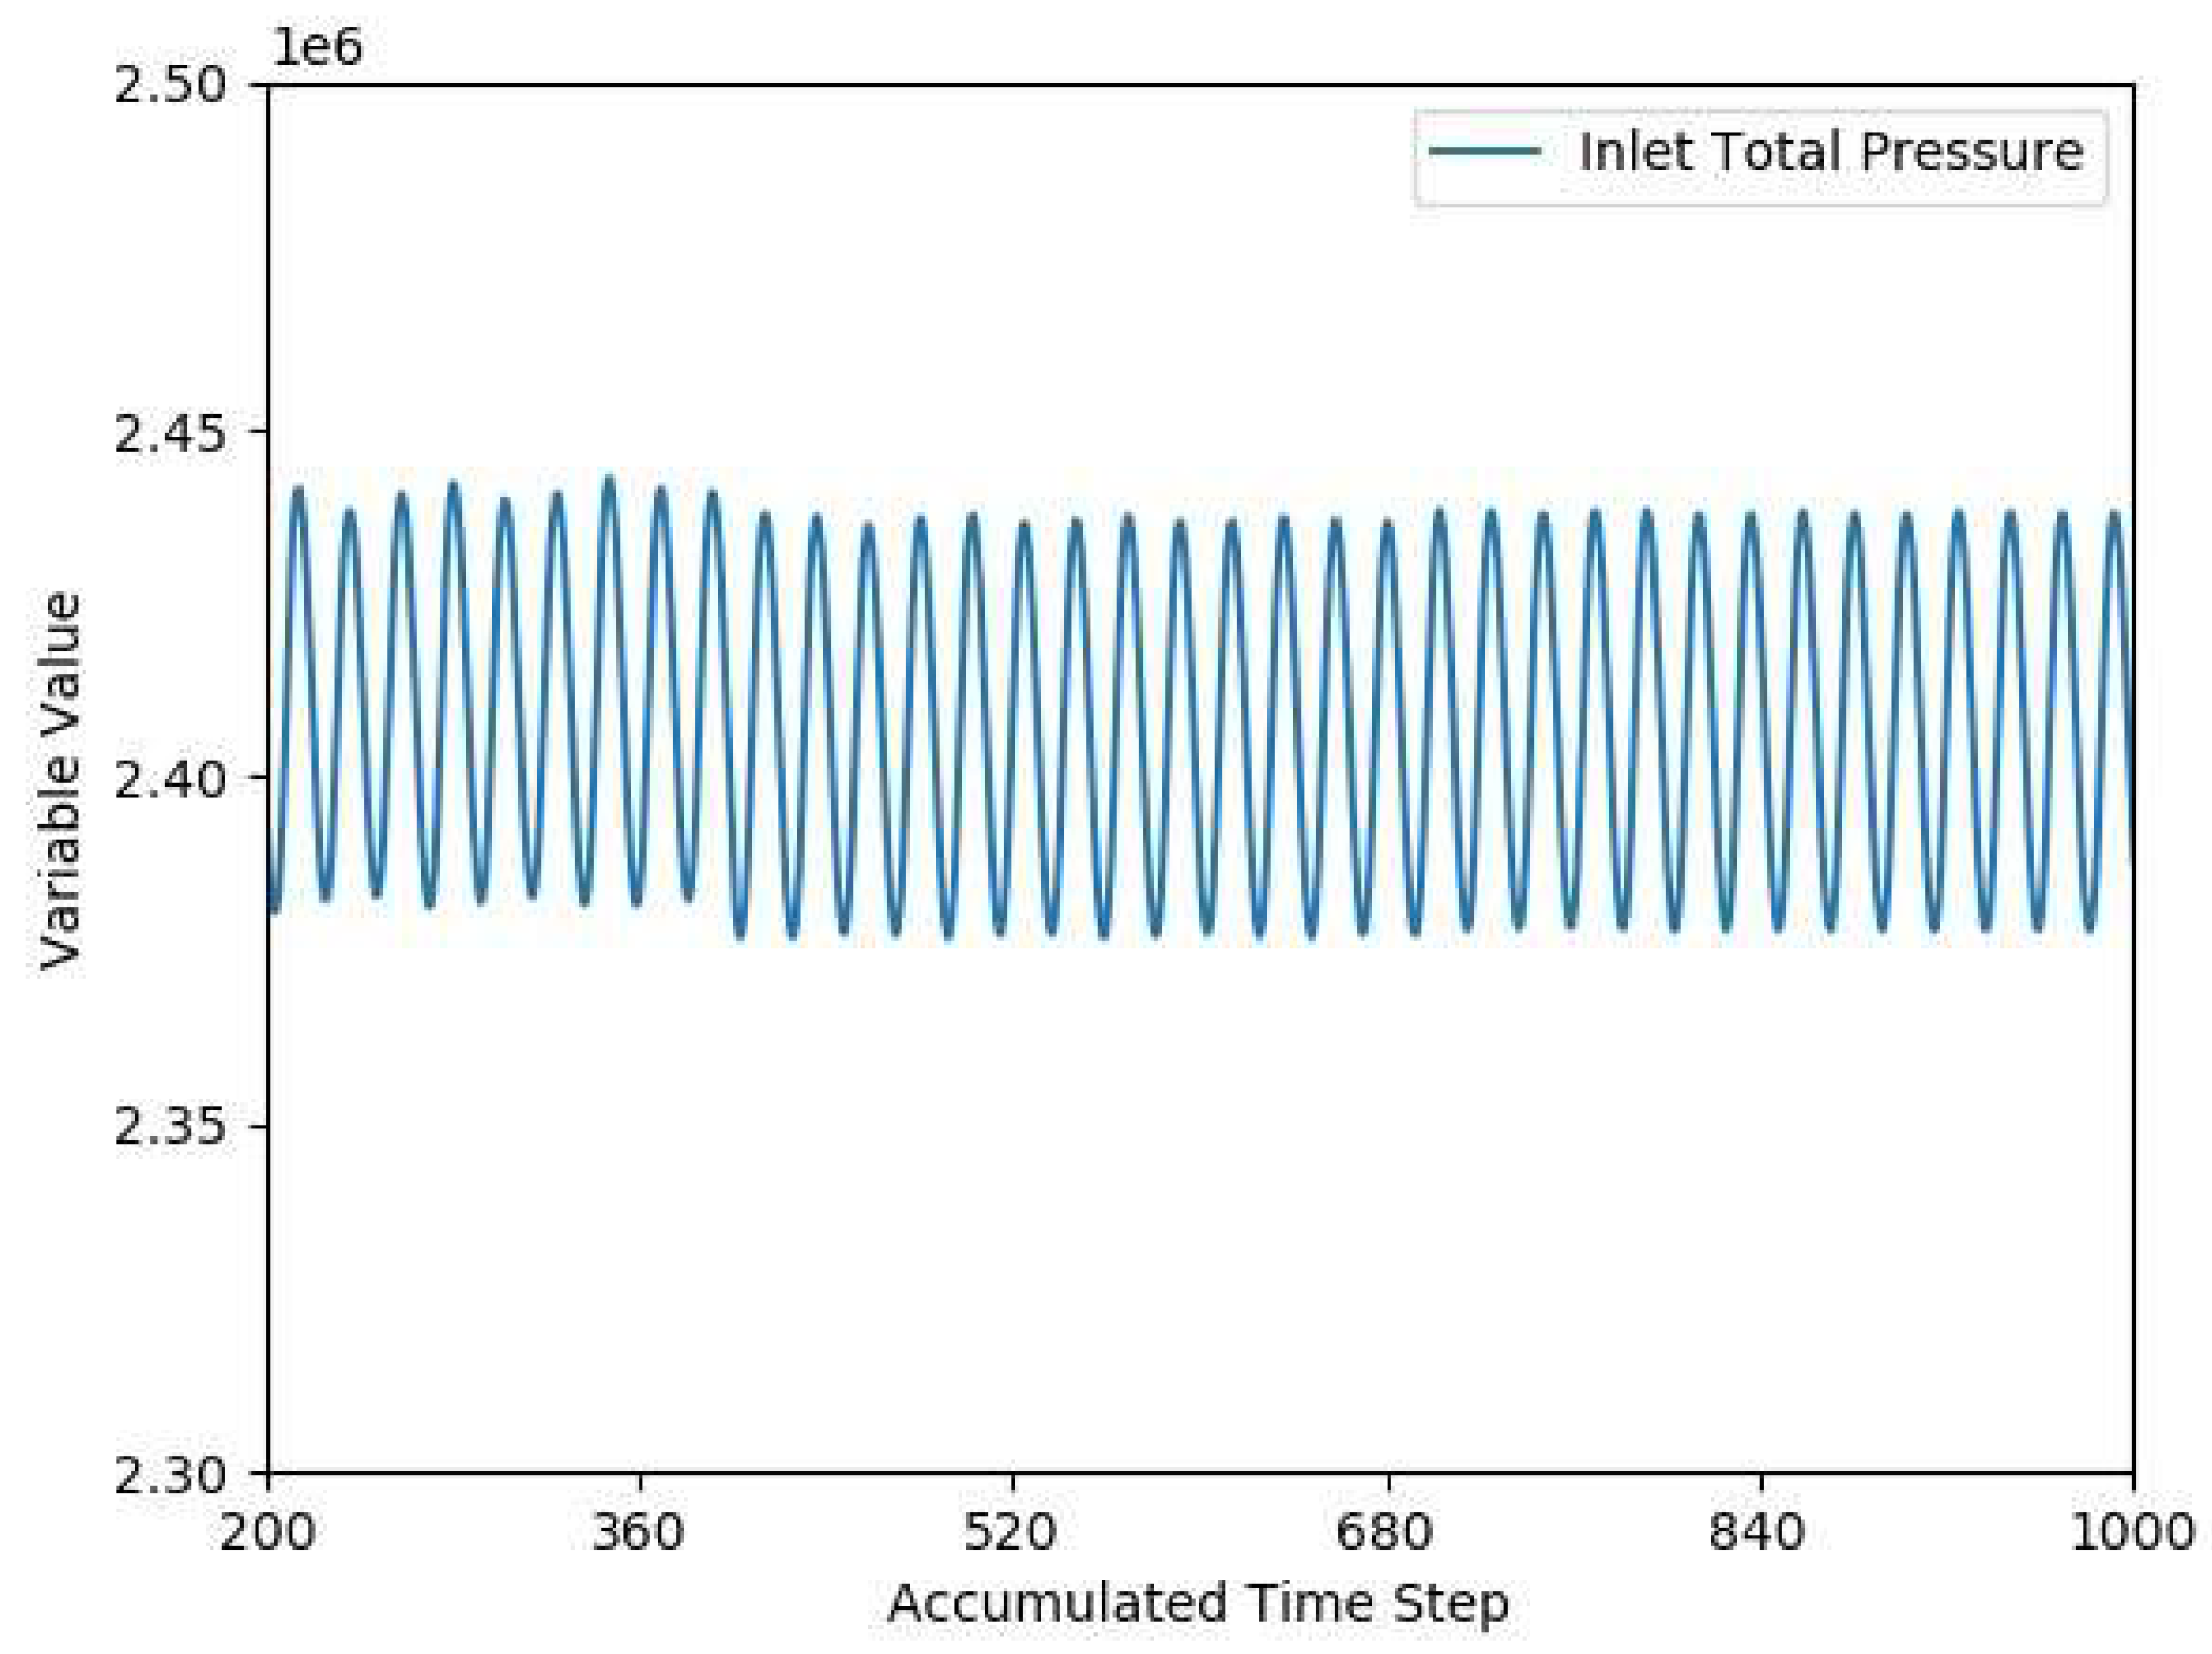
Figure 14.
Efficiency as function of the blade-jet-speed ratio for different winglet geometries: (a) different widths with 2.90% thickness; (b) different widths with 5.80% thickness; (c) different widths with 8.90% thickness; (d) different thicknesses with 5.40% width. These graphics also compare the CFD results with those presented in NASA report [25]. Dashed lines represent the polynomial regressions of each winglet geometry.
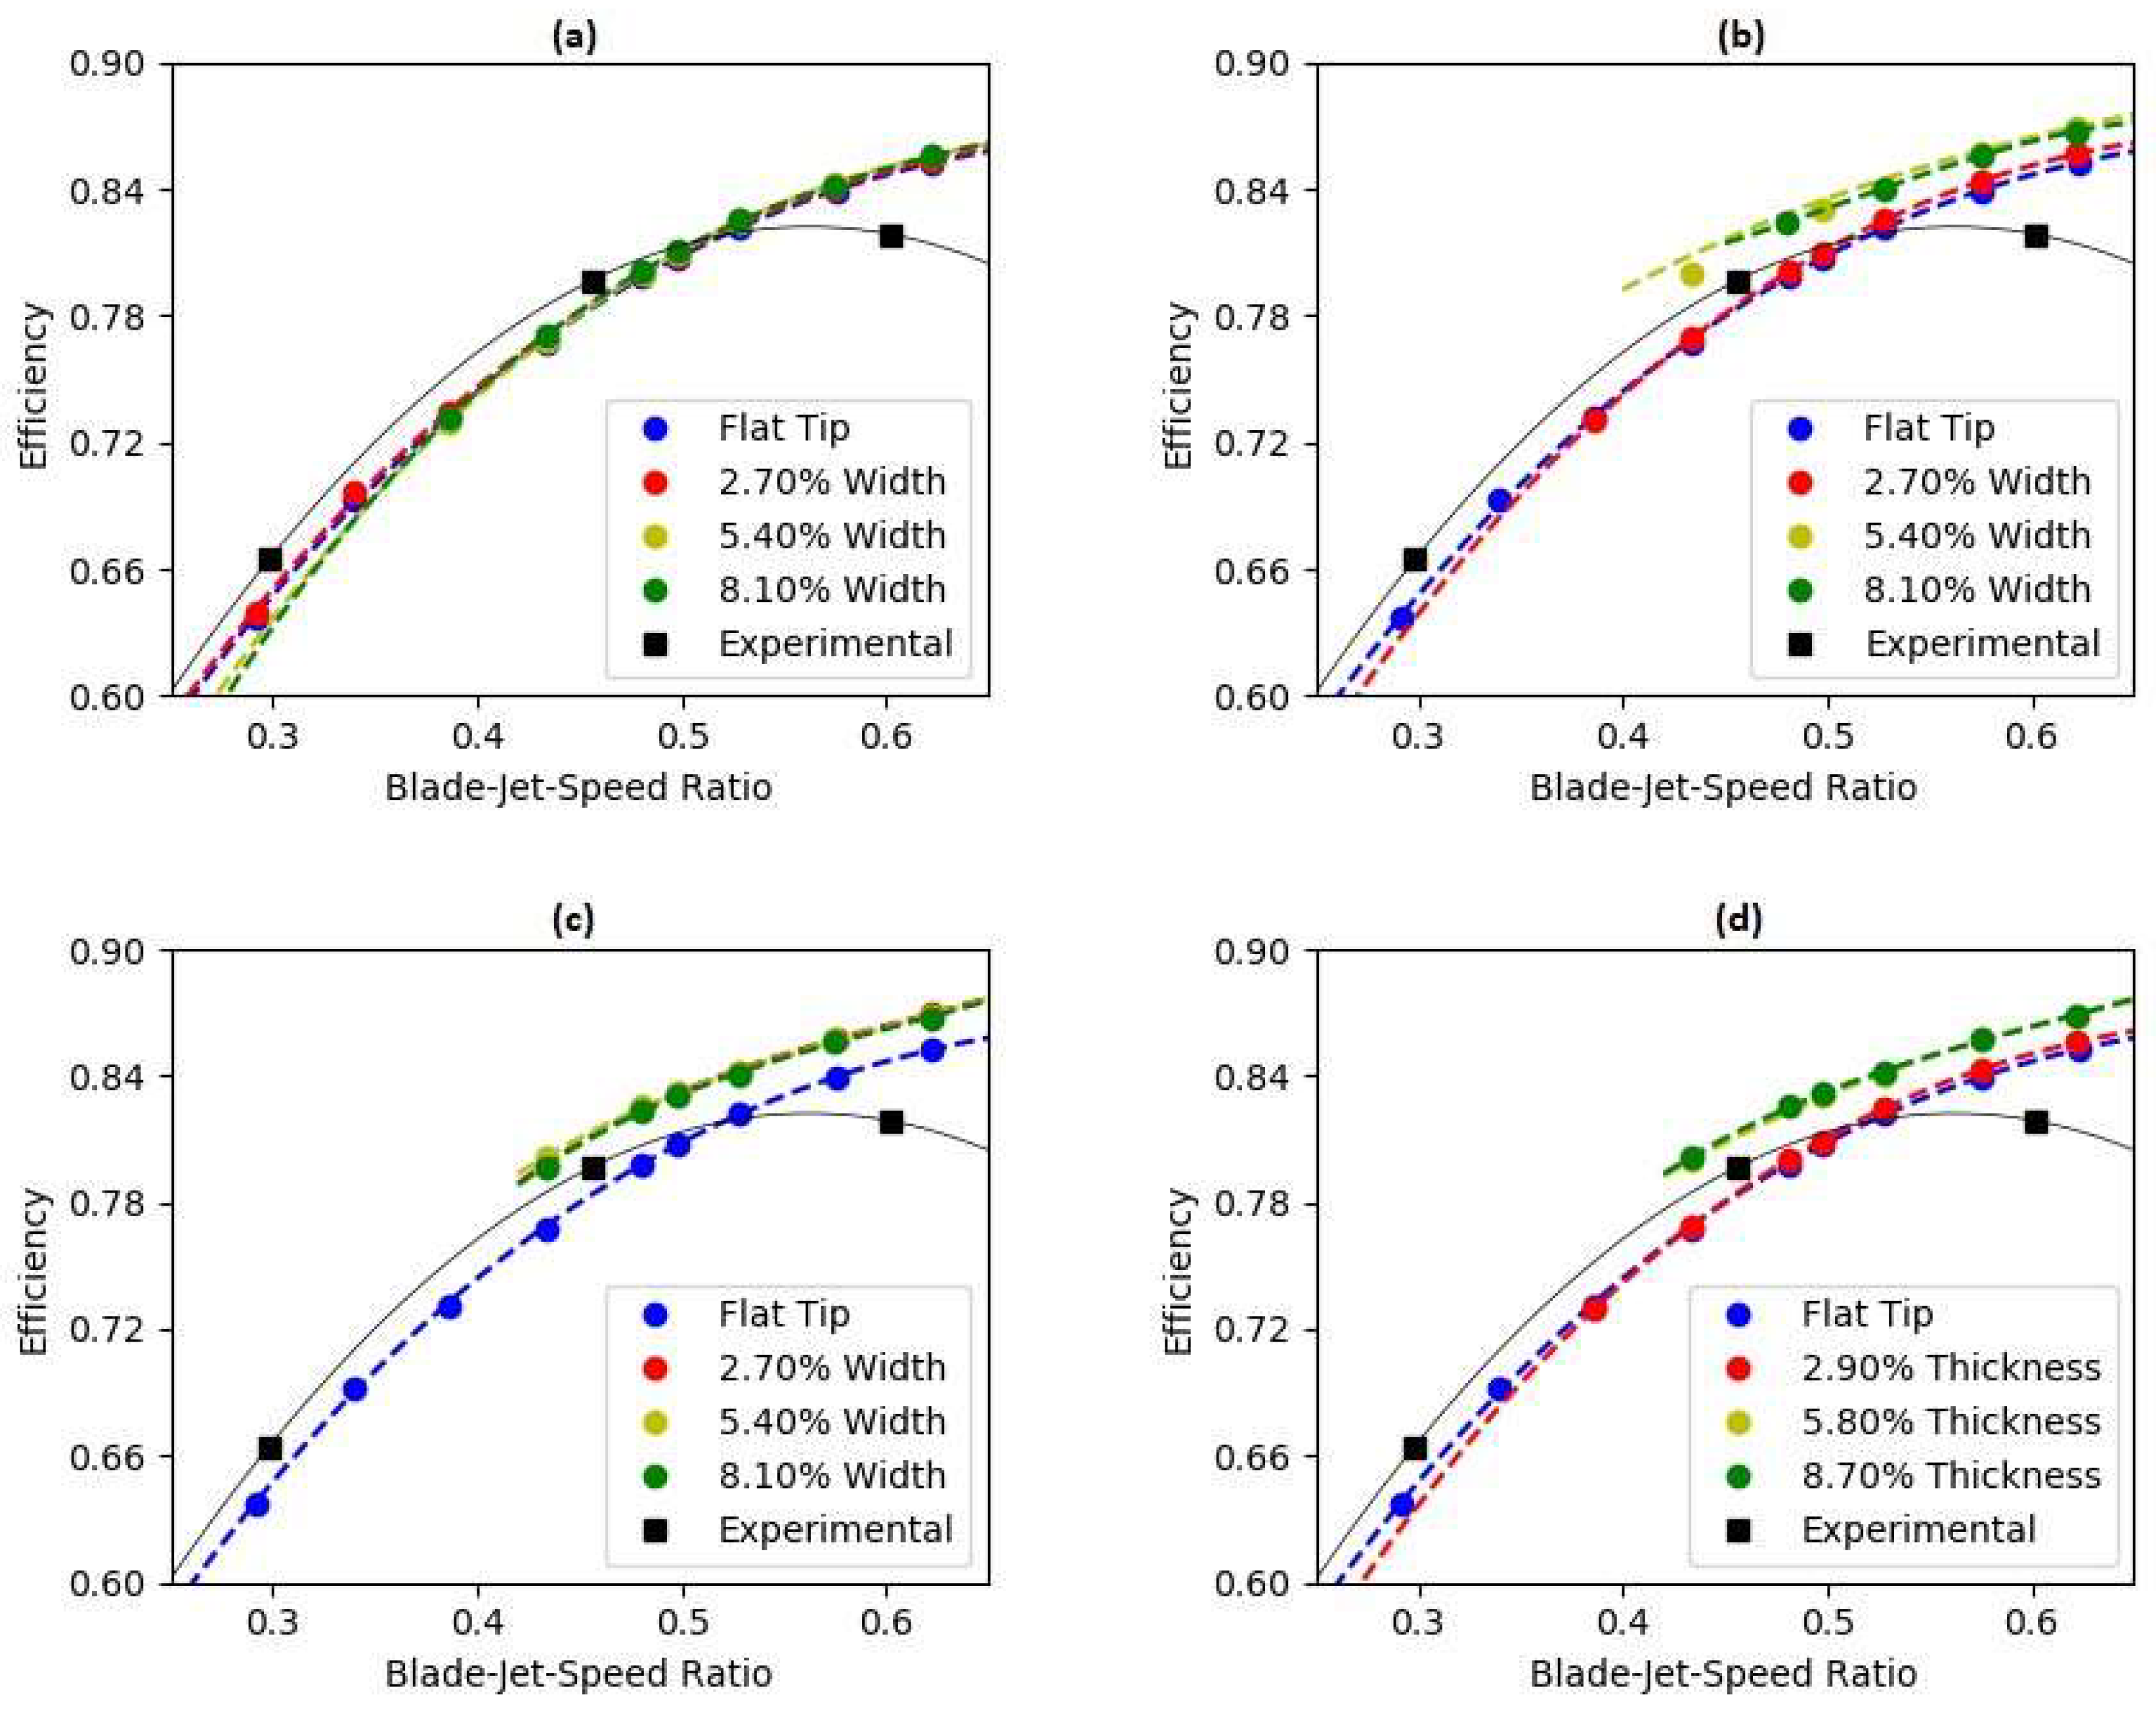
Figure 15.
Streamlines at blade tip: (a) flat tip geometry; (b) 2.90% thickness and 5.40% width winglet geometry; (c) 5.80% thickness and 5.40% width winglet geometry; (d) 8.70% thickness and 5.40% width winglet geometry. These results correspond to 3,600 rpm operational condition.
Figure 15.
Streamlines at blade tip: (a) flat tip geometry; (b) 2.90% thickness and 5.40% width winglet geometry; (c) 5.80% thickness and 5.40% width winglet geometry; (d) 8.70% thickness and 5.40% width winglet geometry. These results correspond to 3,600 rpm operational condition.
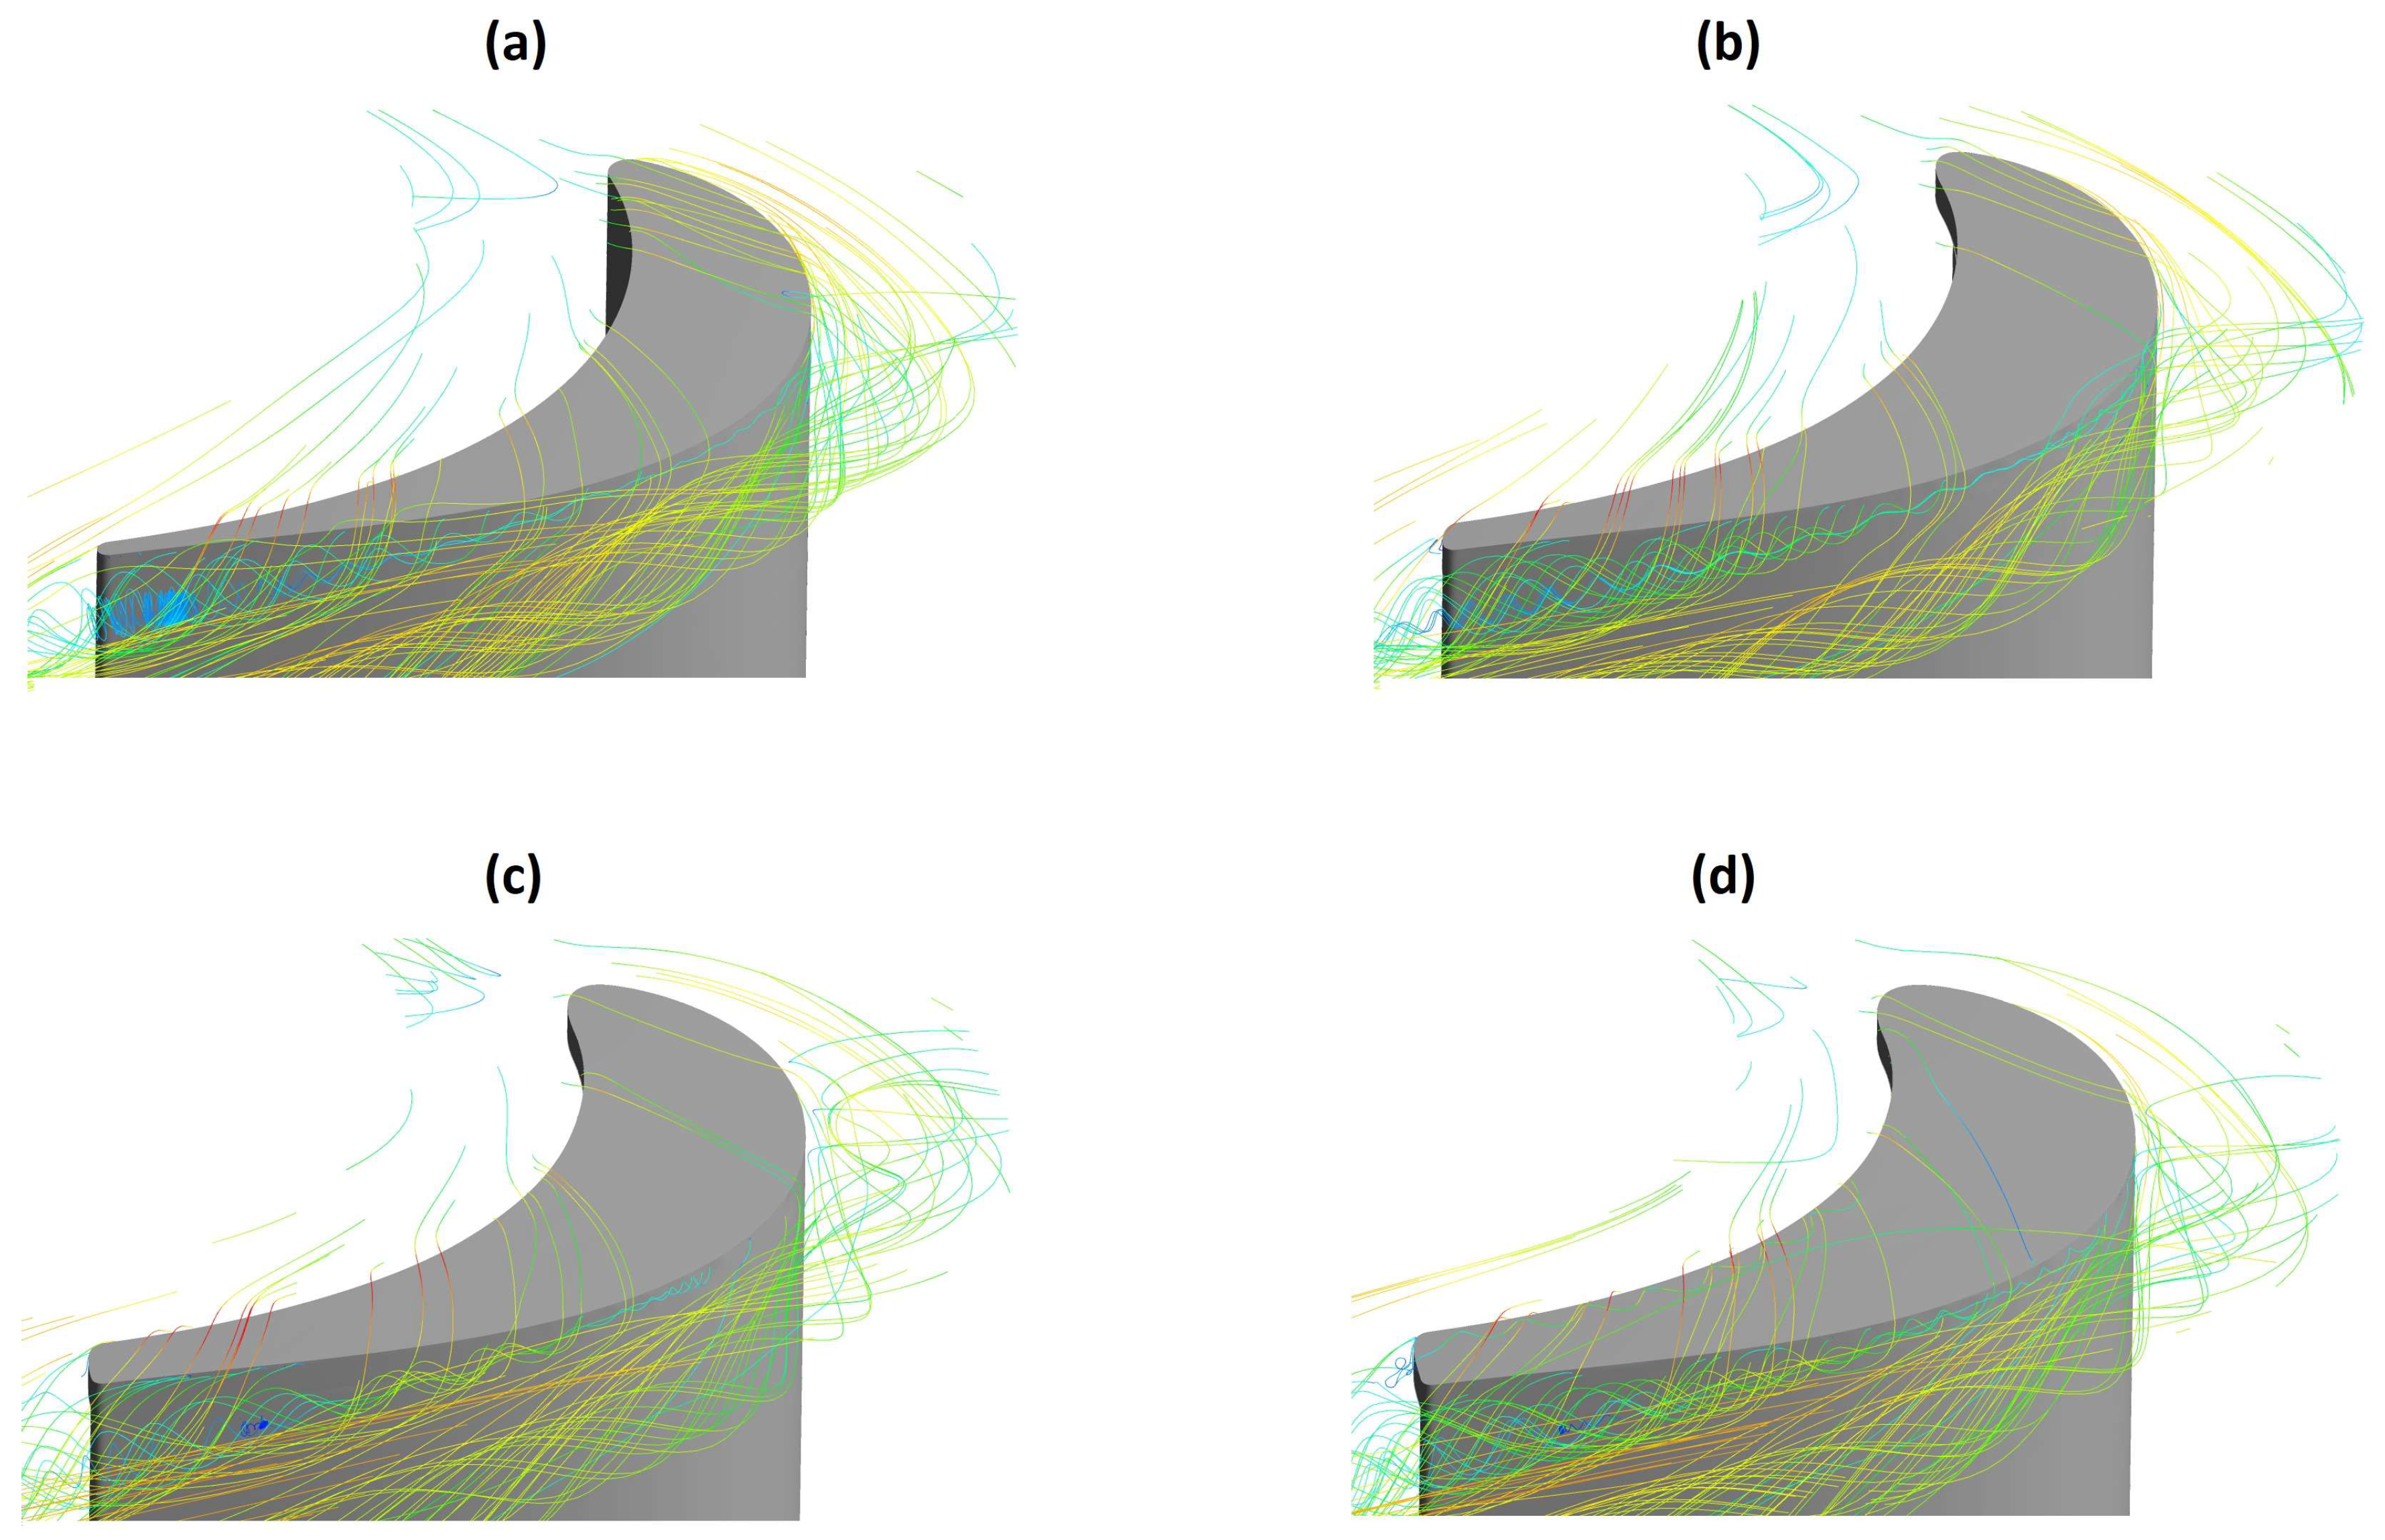
Figure 16.
Static entropy contours: (a) flat tip geometry; (b) 2.90% thickness and 5.40% width winglet geometry; (c) 5.80% thickness and 5.40% width winglet geometry; (d) 8.70% thickness and 5.40% width winglet geometry. These results correspond to 3,600 rpm operational condition. The figure shows that the winglet geometries are able to reduce this property at the blade mid chord, which corroborate to the reduction of the generated region.
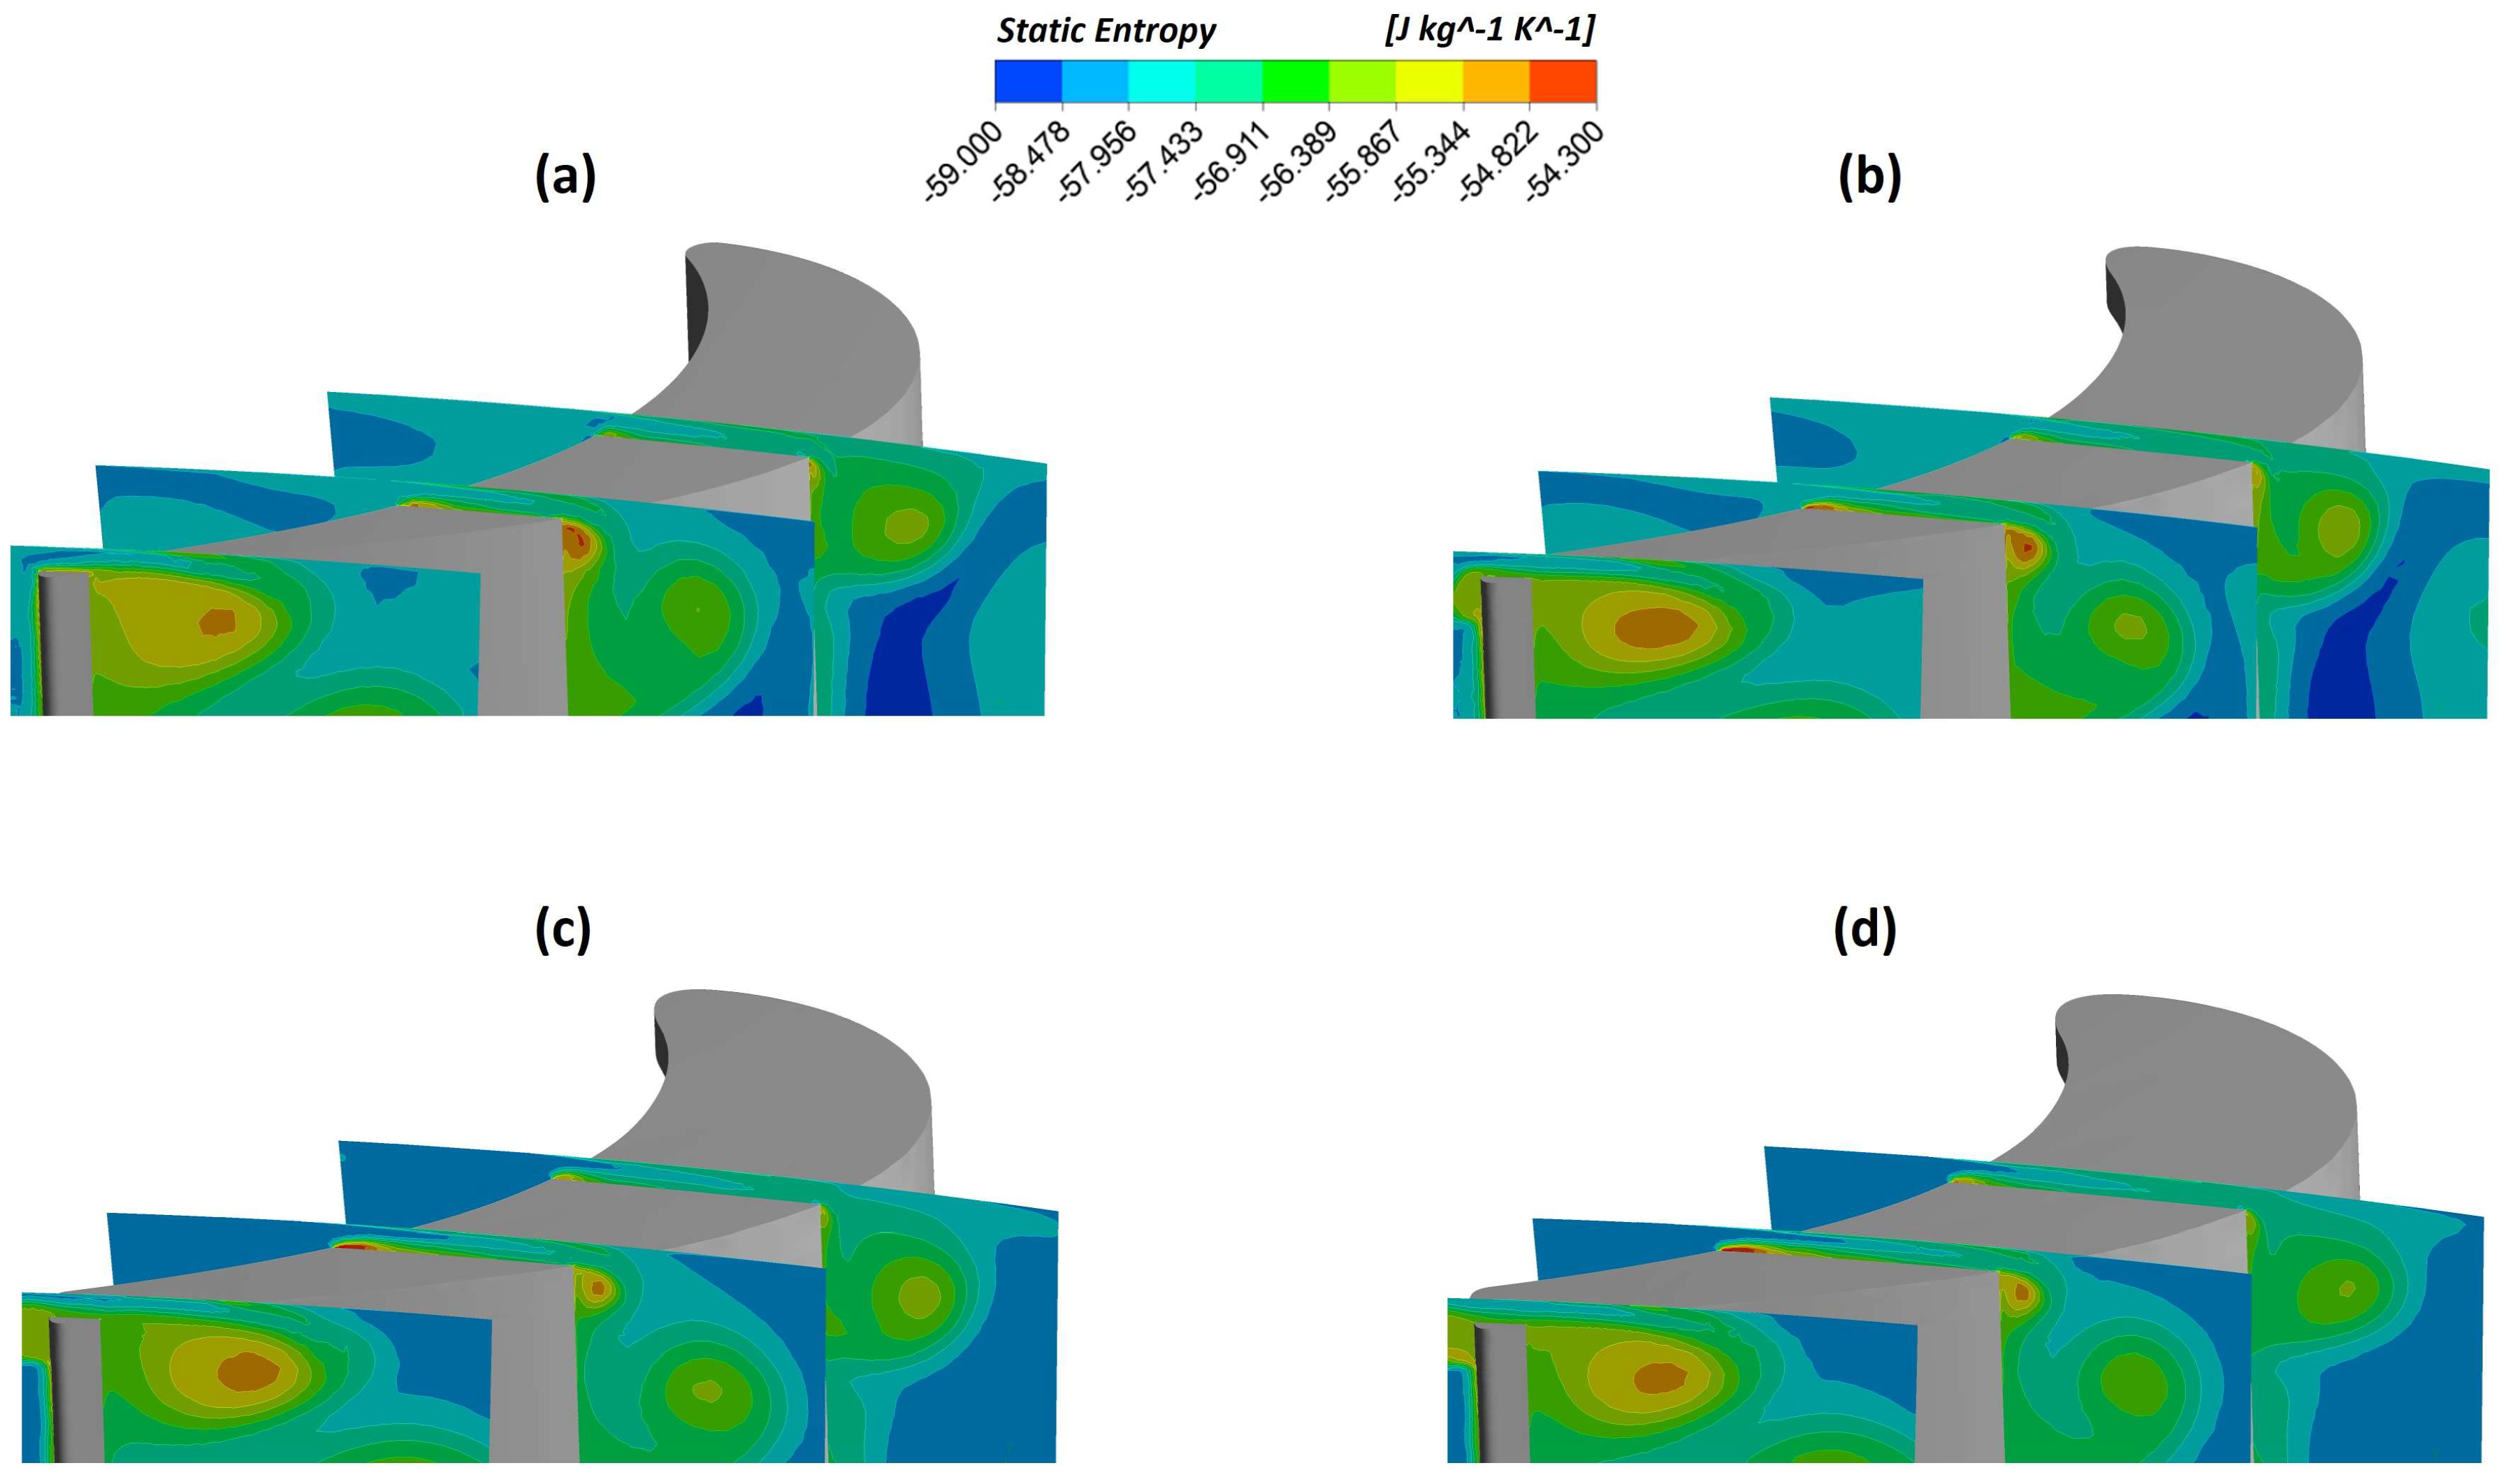
Figure 17.
Vortex view in stationary frame: (a) flat tip geometry; (b) 2.90% thickness and 5.40% width winglet geometry; (c) 5.80% thickness and 5.40% width winglet geometry; (d) 8.70% thickness and 5.40% width winglet geometry. The figure shows that the leakage and scrapping vortex rotate with different orientations. This is a positive characteristic since they will decelerate each other, reducing losses in the tip region. The figure also shows that the scrapping vortex is displaced in relation to the flat tip case. .
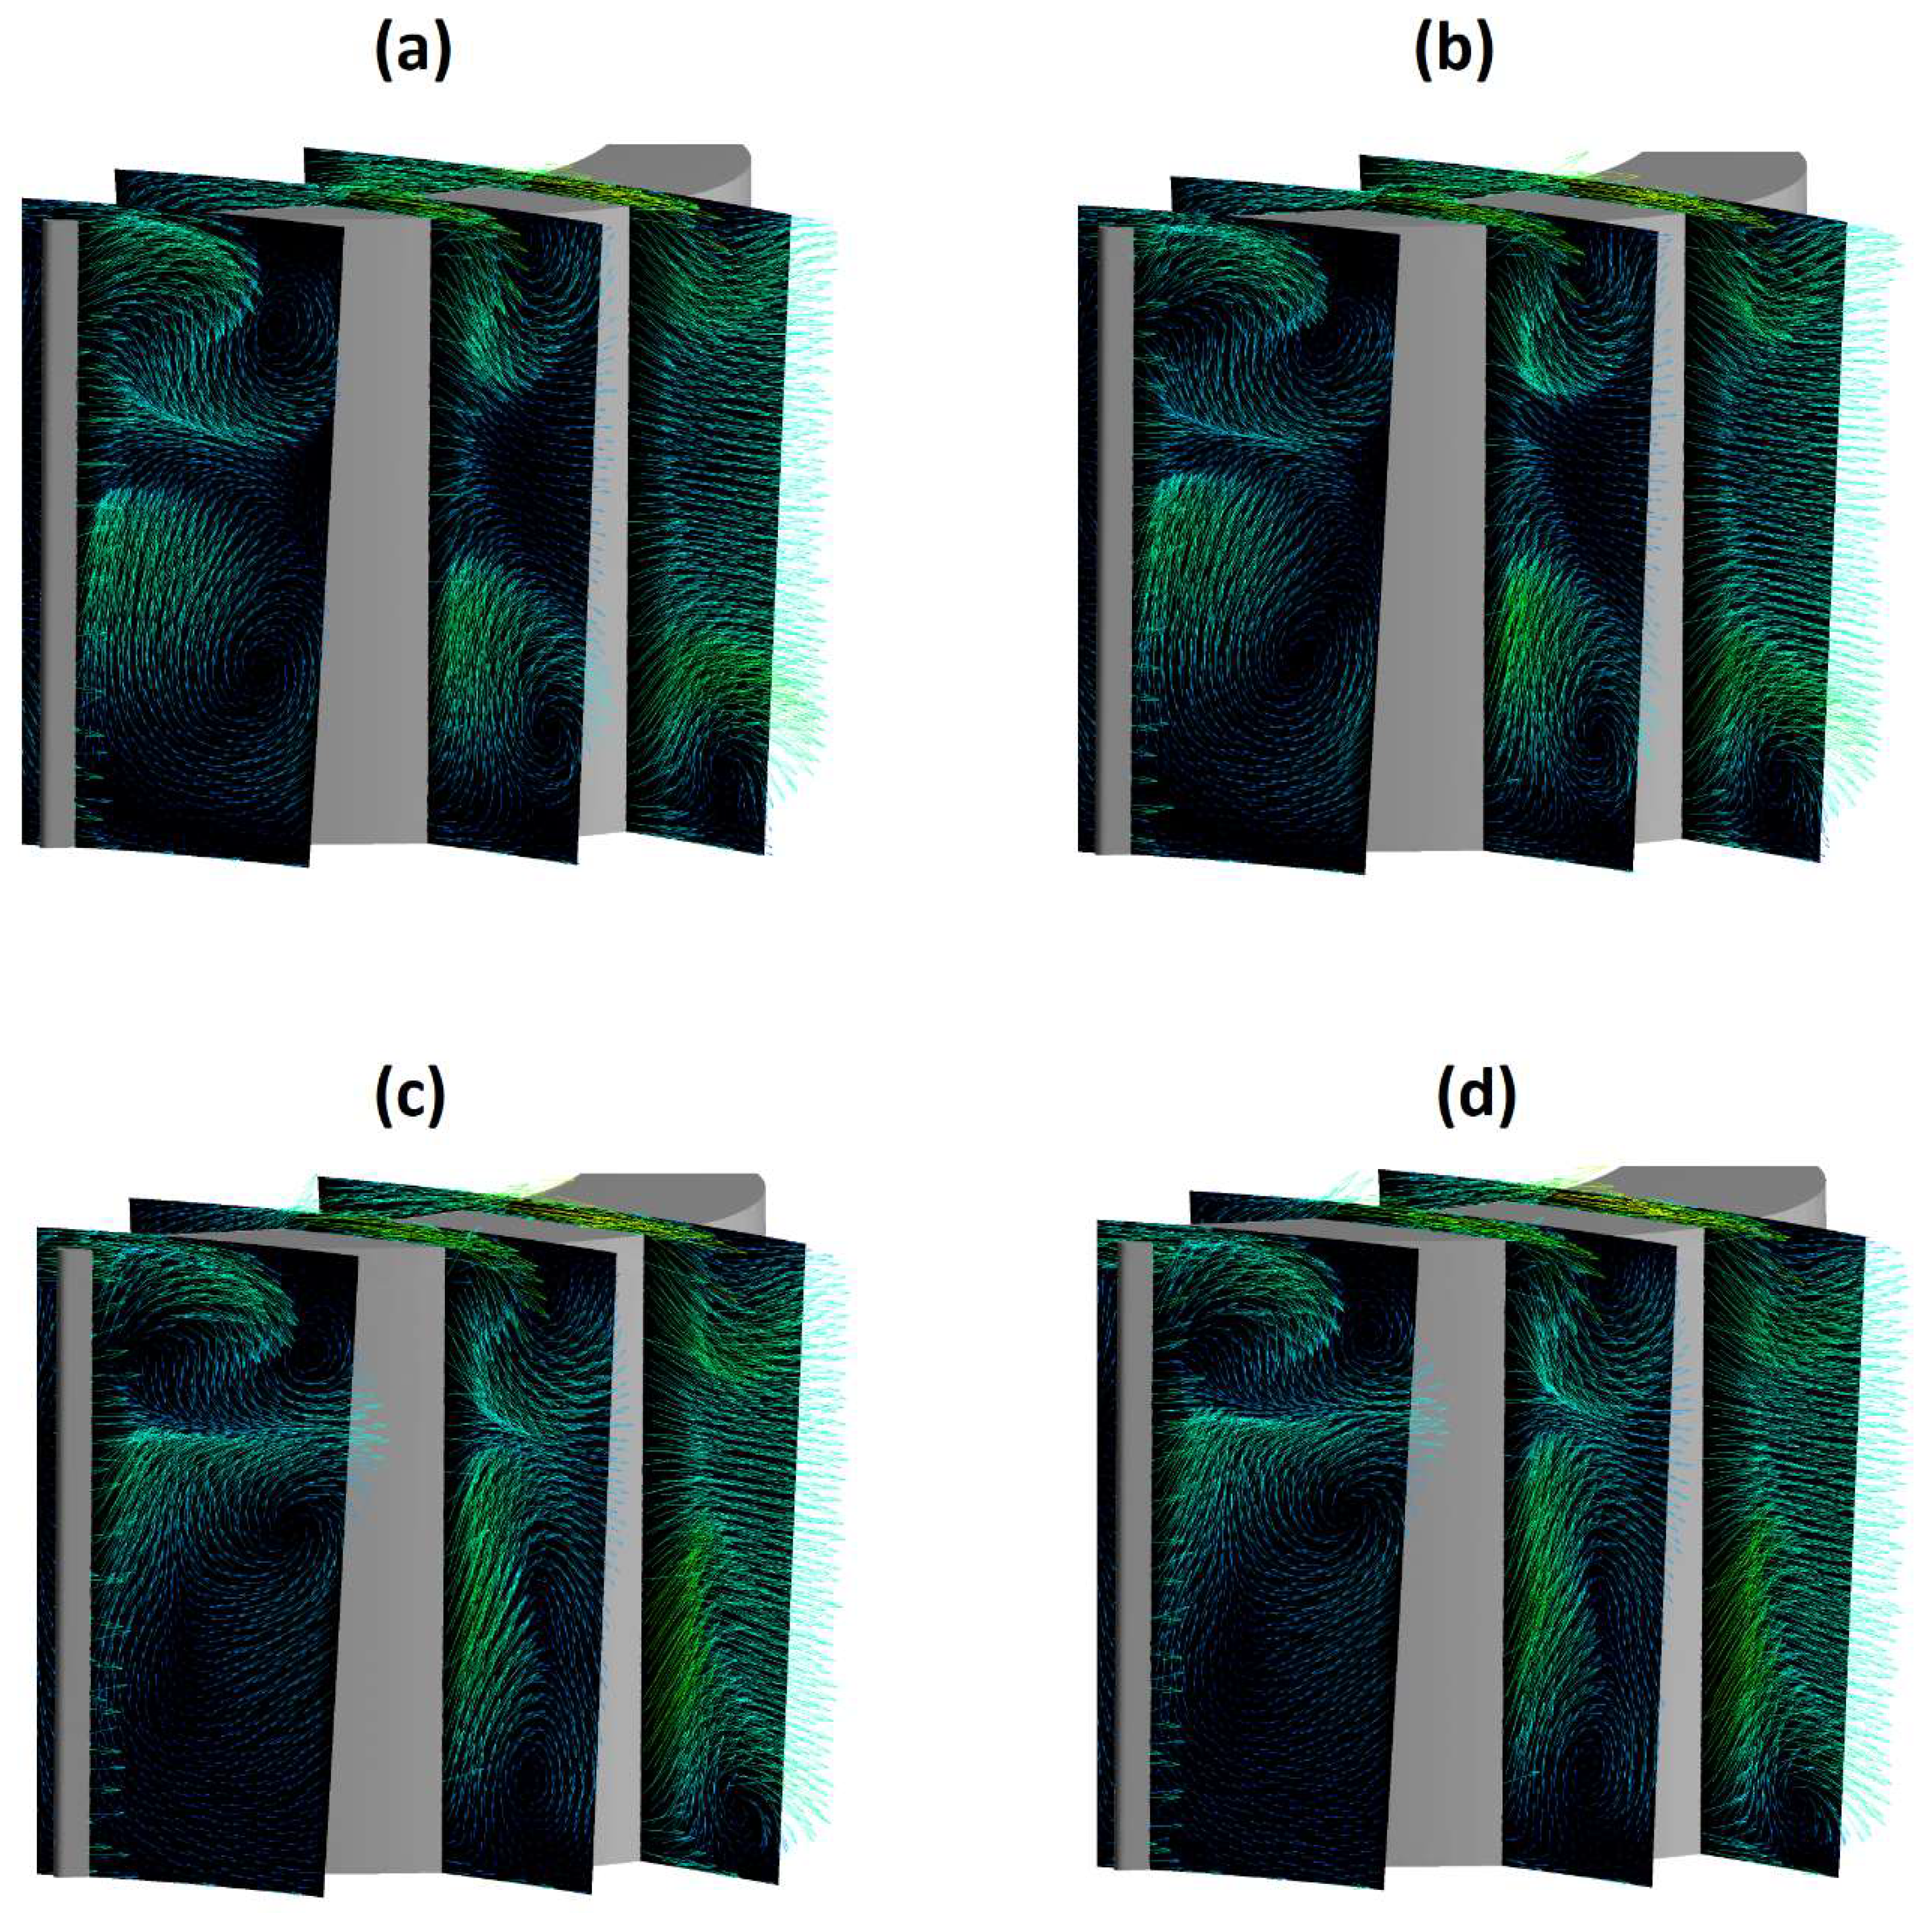
Figure 18.
Cavitation regions: (a) flat tip geometry; (b) 2.90% thickness and 5.40% width winglet geometry; (c) 5.80% thickness and 5.40% width winglet geometry; (d) 8.70% thickness and 5.40% width winglet geometry.
Figure 18.
Cavitation regions: (a) flat tip geometry; (b) 2.90% thickness and 5.40% width winglet geometry; (c) 5.80% thickness and 5.40% width winglet geometry; (d) 8.70% thickness and 5.40% width winglet geometry.
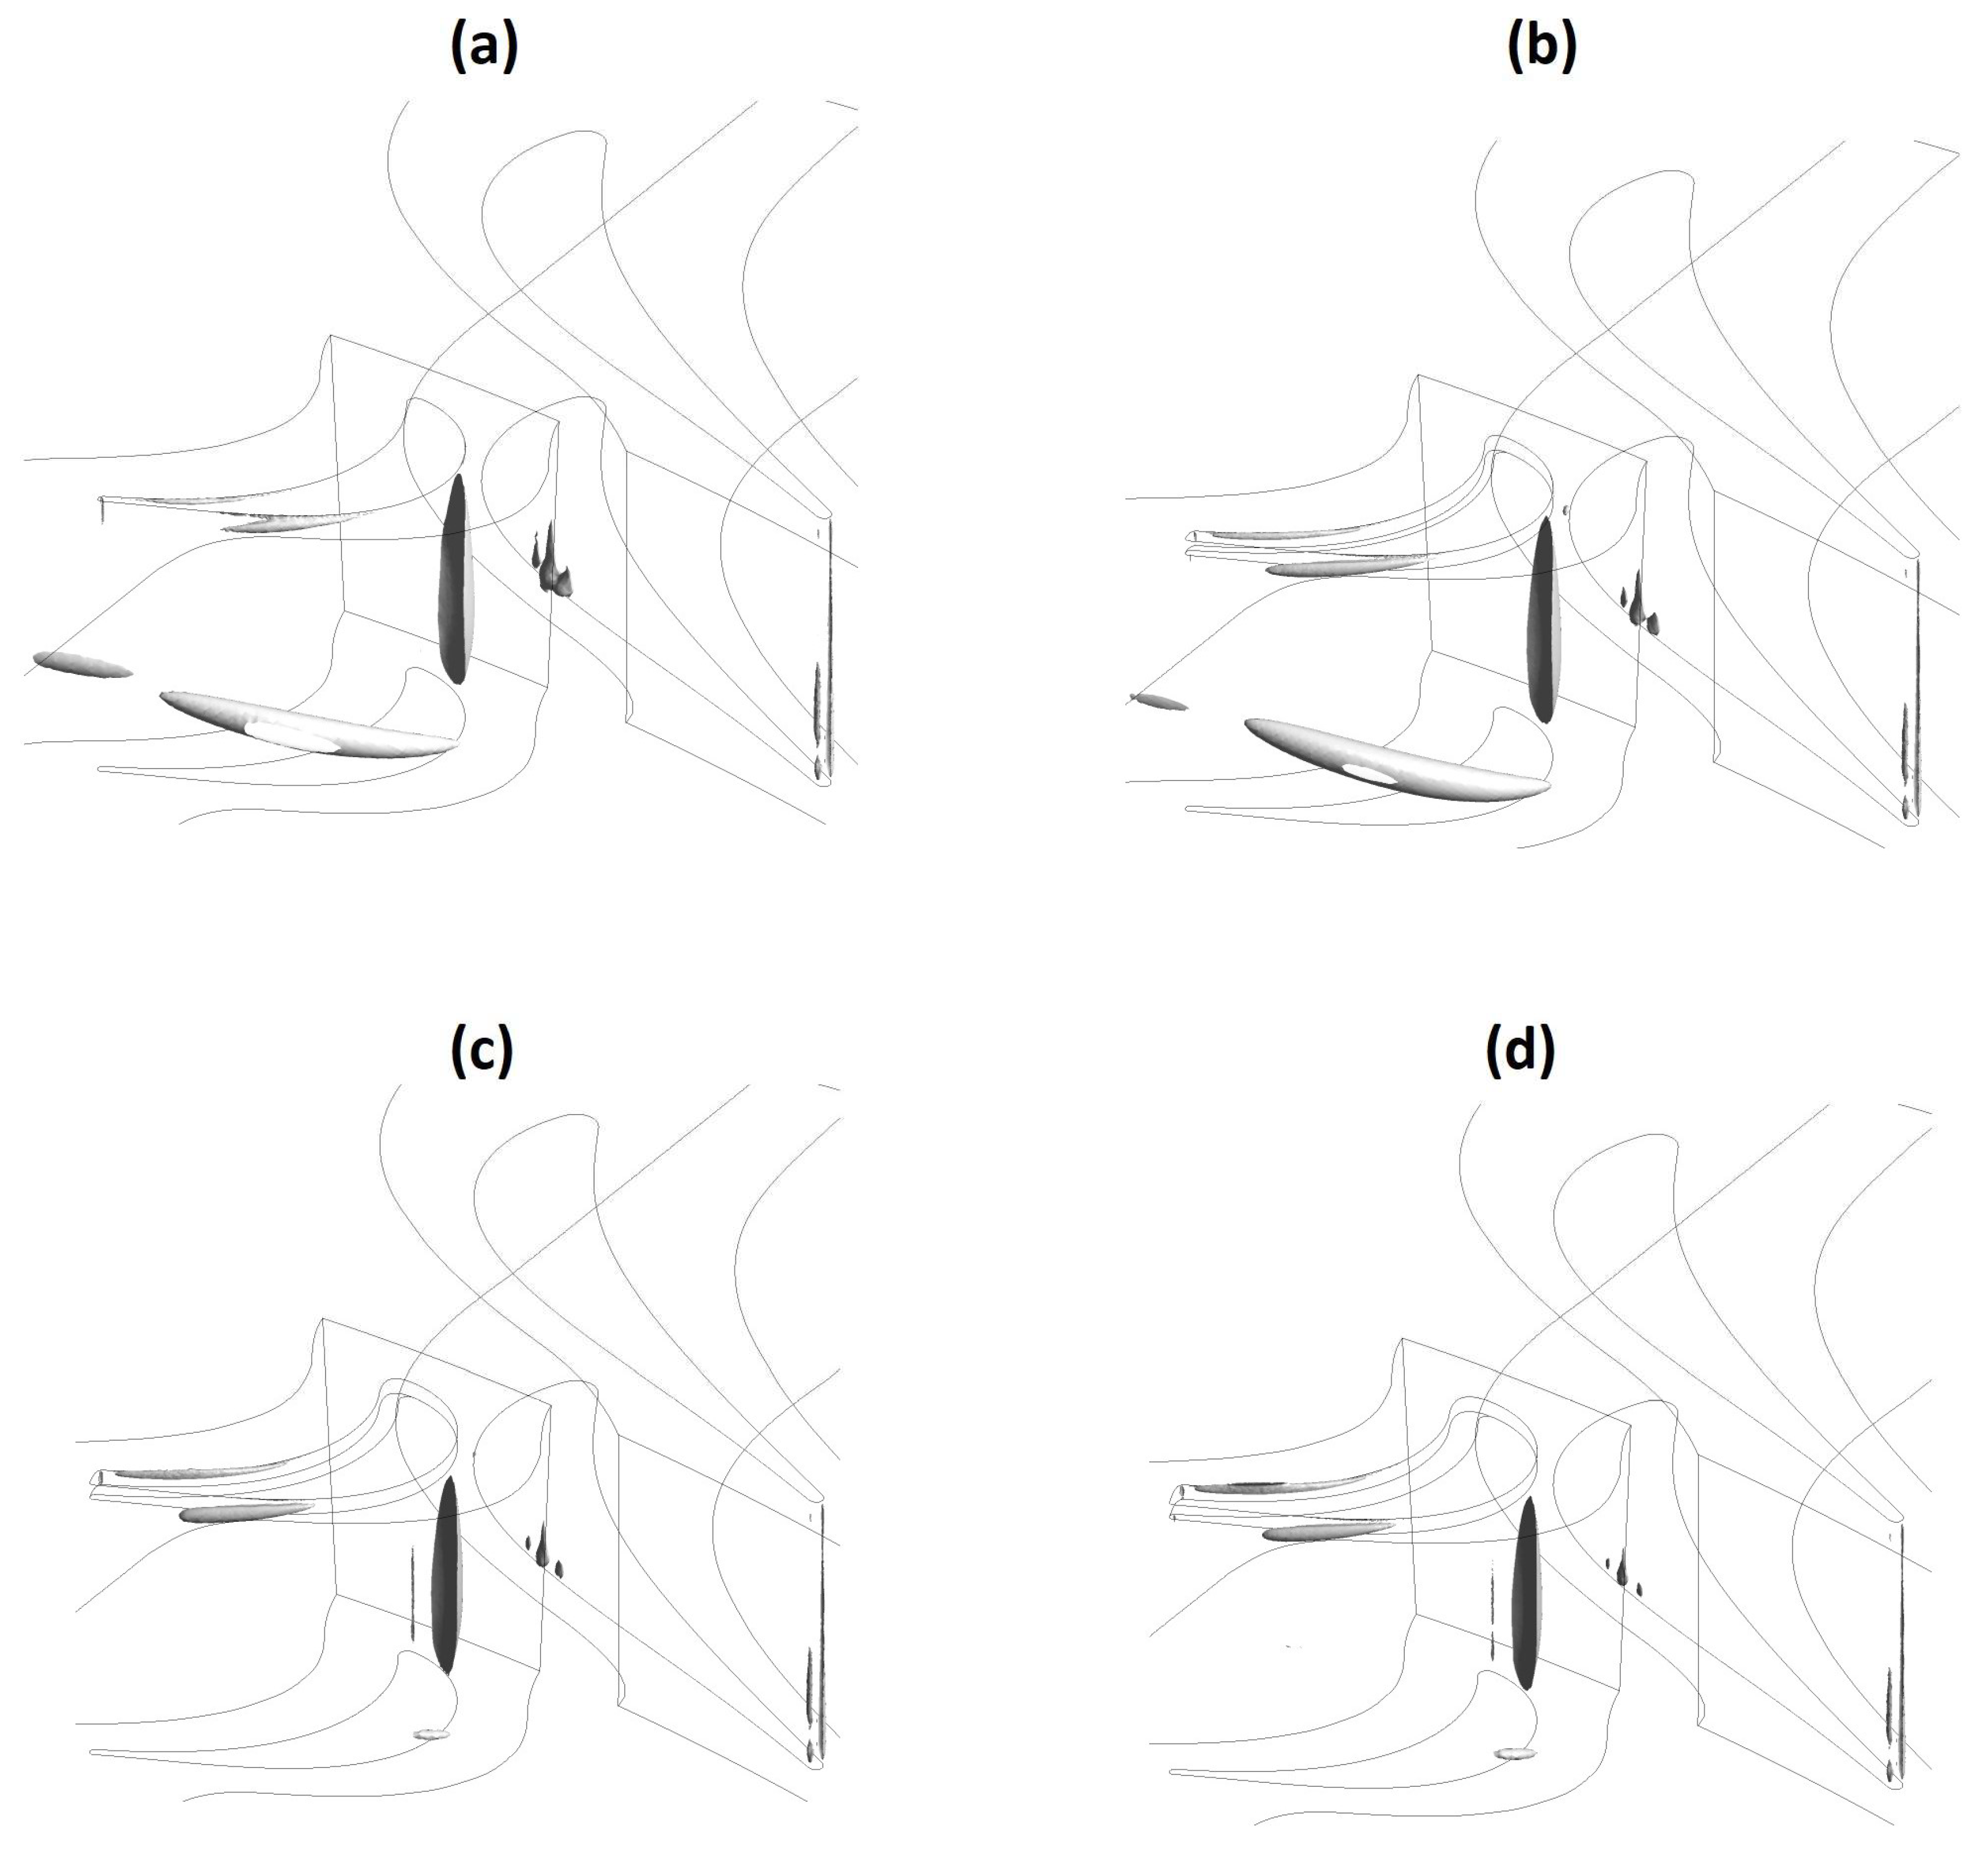

Table 1.
Number of elements of each winglet geometry analyzed in the work (millions of elements).
| Thickness (%) | Width (%) | Mesh 1 | Mesh 2 | Mesh 3 | Mesh 4 |
|---|---|---|---|---|---|
| 2.90 | 2.70 | 7.2 | 9.4 | 11.0 | 14.9 |
| 2.90 | 5.40 | 7.2 | 8.2 | 10.7 | 15.8 |
| 2.90 | 8.10 | 6.9 | 8.2 | 11.3 | 15.1 |
| 5.80 | 2.70 | 6.6 | 8.9 | 11.6 | 15.7 |
| 5.80 | 5.40 | 7.1 | 8.9 | 11.6 | 15.2 |
| 5.80 | 8.10 | 8.6 | 11.0 | 13.1 | 18.3 |
| 8.70 | 2.70 | 7.7 | 9.6 | 11.6 | 15.5 |
| 8.70 | 5.40 | 6.9 | 8.4 | 11.0 | 15 |
| 8.70 | 8.10 | 8.7 | 11.0 | 13.5 | 17.7 |
Table 2.
Coefficients of the polynomial regressions of each winglet geometry.
 |
|||||
| Thickness [%] | Width [%] | A | B | C | D |
| 2.90 | 2.70 | 1.0339 | -2.8360 | 2.5599 | 0.1098 |
| 2.90 | 5.40 | 1.1505 | -3.1993 | 2.8677 | 0.0330 |
| 2.90 | 8.10 | 2.3079 | -4.9466 | 3.7219 | -0.1012 |
| 5.80 | 2.70 | 0.9700 | -2.9132 | 2.7195 | 0.05874 |
| 5.80 | 5.40 | 1.1260 | -2.5565 | 2.1145 | 0.2718 |
| 5.80 | 8.10 | -4.0937 | 6.2653 | -2.8493 | 1.2008 |
| 8.70 | 2.70 | 4.3434 | -7.9066 | 5.0558 | -0.2616 |
| 8.70 | 5.40 | 3.2998 | -6.0235 | 3.9295 | -0.0389 |
| 8.70 | 8.10 | 4.2550 | -7.7215 | 4.9318 | -0.2362 |
Table 3.
– Efficiency comparison between flat tip and 2.90% thickness winglet.
| Percentage differences relative to flat tip [%] | ||||
|---|---|---|---|---|
| Parameters | U/C0 | 2.70% width | 5.40% width | 8.10% width |
| Average | - | 0.1624 | 0.1760 | 0.2403 |
| DP | 0.4706 | 0.1708 | 0.1483 | 0.2909 |
| Experimental | 0.2983 | 0.2898 | - | - |
| 0.4559 | 0.1803 | 0.0899 | 0.2610 | |
| 0.6017 | 0.1315 | 0.3600 | 0.2898 | |
| 0.3860 | 0.2307 | -0.3068 | -0.1352 | |
| 0.4193 | 0.2060 | -0.0921 | 0.1143 | |
| 0.4526 | 0.1825 | 0.0757 | 0.2522 | |
| 0.4859 | 0.1617 | 0.2006 | 0.3084 | |
| 0.5192 | 0.1450 | 0.2868 | 0.3125 | |
| 0.5525 | 0.1340 | 0.3384 | 0.2943 | |
| 0.5858 | 0.1303 | 0.3595 | 0.2836 | |
Table 4.
Efficiency comparison between flat tip and 5.80% thickness winglet.
| Percentage differences relative to flat tip [%] | ||||
|---|---|---|---|---|
| Parameters | U/C0 | 2.70% width | 5.40% width | 8.10% width |
| Average | - | 0.3504 | 2.0292 | 2.0485 |
| DP | 0.4706 | 0.2025 | 2.5643 | 2.8442 |
| Experimental | 0.2983 | - | - | - |
| 0.4559 | 0.1431 | 2.7607 | 3.2627 | |
| 0.6017 | 0.4431 | 1.6614 | 1.5760 | |
| 0.4500 | 0.1174 | 2.8446 | 3.4556 | |
| 0.4726 | 0.2100 | 2.5390 | 2.7937 | |
| 0.4953 | 0.2875 | 2.2759 | 2.3189 | |
| 0.5179 | 0.3491 | 2.0586 | 2.0000 | |
| 0.5405 | 0.3953 | 1.8871 | 1.7997 | |
| 0.5632 | 0.4262 | 1.7621 | 1.6824 | |
| 0.5858 | 0.4415 | 1.6857 | 1.6140 | |
Table 5.
Efficiency comparison between flat tip and 8.70% thickness winglet.
| Percentage differences relative to flat tip [%] | ||||
|---|---|---|---|---|
| Parameters | U/C0 | 2.70% width | 5.40% width | 8.10% width |
| Average | - | 2.2178 | 2.2336 | 2.0803 |
| DP | 0.4706 | 2.6896 | 2.7865 | 2.5686 |
| Experimental | 0.2983 | - | - | - |
| 0.4559 | 2.8038 | 2.9793 | 2.6967 | |
| 0.6017 | 1.6917 | 1.6386 | 1.5419 | |
| 0.4300 | 2.9451 | 3.3082 | 2.8694 | |
| 0.4560 | 2.8031 | 2.9780 | 2.6959 | |
| 0.4819 | 2.5902 | 2.6389 | 2.4604 | |
| 0.5079 | 2.3405 | 2.3129 | 2.1955 | |
| 0.5339 | 2.0901 | 2.0258 | 1.9368 | |
| 0.5598 | 1.8755 | 1.8031 | 1.7197 | |
| 0.5858 | 1.7304 | 1.6676 | 1.5771 | |
Disclaimer/Publisher’s Note: The statements, opinions and data contained in all publications are solely those of the individual author(s) and contributor(s) and not of MDPI and/or the editor(s). MDPI and/or the editor(s) disclaim responsibility for any injury to people or property resulting from any ideas, methods, instructions or products referred to in the content. |
© 2025 by the authors. Licensee MDPI, Basel, Switzerland. This article is an open access article distributed under the terms and conditions of the Creative Commons Attribution (CC BY) license (http://creativecommons.org/licenses/by/4.0/).
Copyright: This open access article is published under a Creative Commons CC BY 4.0 license, which permit the free download, distribution, and reuse, provided that the author and preprint are cited in any reuse.


