Submitted:
10 March 2025
Posted:
11 March 2025
You are already at the latest version
Abstract
Experiments and computational fluid dynamics (CFD) have been utilized to study the operating characteristics of a high performance single stage transonic axial compressor at both peak operating efficiency and at the onset of stall. A single path CFD simulation of the Transonic Compressor Rig (TCR) was created to model transonic operations at 85% rated speed and was validated against experimental data collected from the TCR in the same configuration. Detailed analysis of the CFD model identified the mechanism responsible for stall in this compressor and why simple slot and groove casing treatments were previously ineffective at extending stall margin.
Keywords:
CFD
; Stall Margin Improvement
; Flow Control
1. Introduction
The demand on single-stage axial compressors utilized by military aircraft has increased in recent years due to the increased pressure demand per stage, and subsequent increased blade loading required. When combined with variations in the angles of attack and potential steam ingestion during carrier takeoffs, mass flow rates are often unstable and can rapidly lower to the point of compressor stall. The operational envelope of gas turbine engines is constrained by the stability limit of the compression system [1]. The consequences of exceeding the limit include the potential for engine failure leading to loss of aircraft and lives [1]. The development of a passive, low profile design to extend the margin to stall would improve safety and extend the operational envelope of both current flight craft as well as future designs.
The investigation of the mechanism by which transonic compressors stall has been studied since the 1950s. The requirement for a power dense design suitable for employment on jet aircraft requires a high pressure ratio, resulting in high blade loading and a supersonic relative tip speed that produces a complex flow field with a passage shock. Furthermore, the flow field features highly three-dimensional inviscid/viscous structures, strong shock-boundary layer interaction, and intense tip clearance effects that negatively influence compressor efficiency [2]. These complications are further exacerbated during partial loading or sudden drops in air mass flow when stall is more likely to occur. Low momentum fluid in the compression system creates the potential for an unstable balance between the low momentum fluid, the shear forces, and the adverse pressure gradient [1]. For typical well-designed modern compression systems, the most critical region of low momentum fluid is located in the rotor tip clearance region, primarily associated with the tip leakage vortex (TLV) [1].
Kuang et al.[3] distinguished two different types of stall phenomenon based on CFD modeling of NASA Rotor 67. Tip blockage stall results from flow blockage near the leading edge as a result of TLV interaction with the passage shock [3]. Blade tip stall results from boundary layer separation caused by low momentum, high pressure regions resulting from the passage shock [3], Stator potential raising effects can further amplify this type of stall [3] and a simple slot or groove casing treatment is typically not able to extend operable range [3].
Hembera and Johann [4] also characterized these two types of stall and which methods of flow control would be more effective at treating each. A compressor that experiences tip blockage stall could be stabilized with a slot or groove type casing treatment [4] by modifying the tip leakage flow until the mechanisms of blade tip stall finally dominated the aerodynamics [4]. For blade tip stall, the local mass flow near the blade tip had to be increased significantly by the treatment method [4]. This mechanism is more loss-intensive in order to stabilize the compressor stage and in the end, the compressor efficiency is negatively influenced [4].
Casing treatments are one method used since the 1950s of enhancing compressor stability and delaying the onset of stall. In general, they are simple and relatively streamlined which makes them well suited for use in aircraft compressors to achieve stall margin improvement (SMI). They tend to fall into two configurations [4,5]: circumferential or axial slots. Casing treatments however do not always lead to stall margin enhancement on all rotors, and in some cases have a negative impact on performance [4,6].
Wang et al. [6] investigated the mechanism by which an optimized slot type casing treatment failed to improve performance on a highly loaded two-stage compressor at three separate test speeds. The study found that while axial slots could remove the TLV blockage, the flow circulation in the slot could not impact the boundary layer separation induced by the passage shock [6], resulting in compressor instability and stall. A coupled casing treatment combining axial slots and a recirculation passage was proposed as a possible solution. A later CFD study was conducted by Chen et al. [7] of the coupled casing treatment proposed by Wang et al. [6]. The key findings were that the coupling effect reduced the amount of tip leakage flow, depressed the development of the TLV, and greatly decreased the blockage in the rotor tip induced by the interaction of the shock wave and the boundary layer on the blade suction surface [7]. For the rotor under investigation in this paper, previous attempts at enhancing stall margin and extending stable operating range at transonic speeds with simple casing treatments were unsuccessful. Multiple axial slot configurations were investigated in the manner of Koley et al. [8] at transonic speeds with results typically being a degradation to stall margin and overall performance. Recently, there has been some success employing self-recirculating flow control to extend stall margin on this rotor, but the mechanisms by which both stall and enhancement occurs was not fully understood.
In order to achieve a greater understanding of the stall mechanics of this rotor and the mechanism by which self-recirculating flow control impacts operation near stall, a single passage model of the TCR was created and validated against actual TCR test data. Unsteady Reynolds-Averaged Navier-Stokes (URANS) CFD simulations were performed to study the flow profile in the compressor tip region, both at the best efficiency point (BEP) and near stall. This data was then compared to results obtained from the same CFD model of the TCR with a successful self-recirculating flow control system installed.
The rotor was found to exhibit blade tip stall as a result of a large low momentum build-up of fluid from the boundary layer separating at an approximately 40-50% chord. The large vortex present in this region created further blockage by combining with the TLV, resulting in large areas of negative axial flow near the compressor blade tips that extended radially inward down the span of the blade. Self-recirculating flow control mitigated these effects by minimizing TLV and boundary layer vortex tangential growth, and delaying the separation of the boundary layer where previous axial slot and groove casing treatments could not.
2. Materials and Methods
2.1. Transonic Compressor Rig
The rotor under investigation is a one quarter scale model of a military transonic axial compressor. It is a 20 bladed disk with forward swept blades with operating characteristics at 90% speed shown in Table 1. Early experiments utilizing both slotted casings as well as continuous circumferential grooves were the subject of previous investigations. While axial slot casing treatments and circumferential grooves have been used to improve operations at subsonic speeds, these techniques were found to be ineffective at extending stall margin in the transonic regime.
The TCR was designed to test the performance of the rotor under various operating conditions. The test rig, represented by Figure 1, consists of an atmospheric bell-mouth followed by a digitally encoded adjustable throttle and flow straightening section prior to the compressor components shown in Figure 2.
Flow travels through a stage of 17 inlet guide vanes (IGVs) with adjustable flap angles, the 20-bladed rotor, and finally a 29-bladed stator prior to exhaust to the atmosphere. The rig’s drive turbine is supplied by an external source of compressed air. The stress on the drive turbine limits the overall speed of the compressor rig allowing for operation of up to 90% of the design speed of 30,000 RPM. In order to prolong the life of the TCR and minimize component wear, the rig is operated at a maximum of 85% rated speed, or 25,500 RPM. The IGV flaps can be manually adjusted to a desired angle prior to TCR startup but cannot be modified during operation. The electric throttle valve downstream of the atmospheric inlet is used to adjust compressor mass flow throughout TCR operation, thus simulating the variability of inlet flow conditions consistent with high performance aircraft operations.
Reid and Moore [9] conducted performance tests of a rotor with similar characteristics at speeds of 70%, 90%, and 100% at five mass flow points. TCR tests were conducted primarily at three similar speed/IGV configurations but over approximately 20 mass flow points due to the fine controls of the electronic throttle. Prior to each test run, the IGV flaps are set to an angle corresponding to a typical angle used in flight commensurate with compressor speed, referred to here as in accordance with testing schedule (IAWS).
Mass flow is scaled to ISO standards as follows:
Where Patm is 101325 Pa, Tatm is 288.15 K, and Po1 and To1 are the mass averaged total pressure and mass averaged total temperature at the IGV inlet. Additional scaling to standard reference conditions is performed using the specific heat ratio and gas constant to account for the moisture content of air. The total pressure ratio (PR) for the stage is determined by:
Where Po3 is the mass average total pressure at the stator outlet. Stage isentropic efficiency, is defined by:
Where To3 is the mass averaged total temperature at the stator outlet and is the specific heat ratio of air. The efficiency value is then mass averaged utilizing the X-formulation method employed by Hobson et al. [10]. Using these definitions and equations, the stage PR, and stage isentropic efficiency are used to evaluate compressor performance over mass flows ranging from near compressor choke to compressor stall. The measurement accuracy of the instrumentation installed in the TCR is ± 10 Pa for pressure probes and ± .6 K for temperature probes. The resulting absolute error in the isentropic efficiency calculations can range from 1.5 to 5% depending on the speed and operating conditions of the compressor.
Self-recirculating flow control methods were tested on the TCR by fitting casings that were additively manufactured from ULTEM containing the recirculating flow geometry around the rotor. Specific details concerning the design and performance of these casings are the subject of another investigation. Due to the increased diameter of the rotor outer casing, a smooth inner casing was inserted to restore nominal tip gap when obtaining test data on TCR operation without a flow control system installed. This smooth casing was also additively manufactured from ULTEM in order to match the thermal conductivity and roughness of the material that the flow control casings were made from.
2.2. Transonic Compressor Rig CFD Model
A single blade passage model of the TCR was created, with the final IGV/rotor/stator gas path model shown in Figure 3. The gas path domain was left extended both upstream and downstream of the TCR for better flow stabilization. The IGV angle was set to correspond to 85% compressor speed to analyze transonic compressor operations.
All CFD analysis was performed using ANSYS CFX. Both steady and unsteady RANS simulations were run using the SST (k-omega) turbulence model with an average y+ value of less than 1. Unsteady RANS modeling was conducted with an average time step of 4x10⁻⁷s. The final mesh contained approximately 3.4x10⁷ elements and 1.5x10⁷ nodes and was based on a mesh refinement sensitivity study.
Prior to utilizing the TCR model to study stall characteristics, the single passage model needed to be validated against actual TCR performance data to understand its capabilities and limitations. The CFD RANS model was run with a strategy similar to that used in the actual testing performed on the TCR to generate operating curves. Instead of directly controlling mass flow with a throttle, the relative inlet pressure was lowered in 2000 Pa increments starting at 0 and stopping when stall was achieved. Once stall was achieved, the model was backed up to the last pre-stall design point, and was lowered in 50 Pa increments to approach stall more deliberately and thus more accurately determine the stall point. The output parameter most significantly impacted at stall was mass flow, and like other studies [11,12] stall was identified as a sharp drop in mass flow beyond the physical limits of the compressor as iterations increased. The output from each point was used to create stage operating curves that were compared to the same curves generated from the reduced data collected during actual TCR performance runs.
Due to their computational intensity, URANS simulations were run at compressor choke, BEP, and near stall to validate the RANS data. URANS simulations were allowed to run for a total simulation time of greater than five residence times of the entire TCR model prior to evaluating their stability and recording data. Figure 4 shows a comparison of the CFD model to TCR data taken at 85% speed with IGVs IAWS.
The RANS PR and TR predictions matched the TCR data closely, with an average PR error of 0.78% and an average TR error of 0.47%. Although the RANS model conservatively predicted the mass flow at stall, this prediction was improved to within 0.15% of mass flow through unsteady modeling. With errors on the order of less than 1%, this model was deemed an acceptable representation of TCR operation.
2.3. Self Recirculating Flow Control CFD Model
Multiple self recirculating flow control casings have been designed and tested in the TCR and are the subject of a separate investigation [13]. The RGV-60 casing was a design that provided positive results to both SMI and stable range extension (SRE). An SMI calculation utilized by Kumar et al. [14] to assess flow control performance is given by:
Where FC denotes results with a flow control casing installed, and SC denotes results with a smooth casing installed. Another useful criteria introduced by Dinh and Kim [15] for evaluating the effectiveness of a flow control system is the SRE of the operating compressor given by:
The RGV-60 casing bleeds a portion of air from downstream of the trailing edge of the rotor blades, through a channel containing 53 recirculation guide vanes (RGVs) and gets injected just upstream of the leading edge of the rotor blade. Figure 5 depicts a cross section of the channel geometry.
A single passage model of this flow control casing was created and added to the TCR gaspath geometry developed from Section 2.2 to observe the effect it had on the TCR model near stall. Steady RANS model operating curves were made using the same procedure outlined in Section 2.2 and the RGV-60 CFD model was compared to the smooth casing CFD simulation to determine the predicted SMI and SRE. Figure 6 shows the predicted enhancement to operations with this flow control method installed.
The RGV-60 CFD model predicted an SMI of 5.7% and an SRE of 20.6%. The actual enhancement from this casing when tested in the TCR was an SMI of 7.1% and an SRE of 22.1%. Although CFD returned a more conservative performance of the RGV-60 flow control, it still predicted a significant enhancement to performance and stability, making the model acceptable for use in this study.
3. Results and Discussion
3.1. Stall Mechanism Analysis with Smooth Casing
The smooth casing URANS model was analyzed at both BEP and near stall to observe the changes in flow patterns that occurred between these two operating points. All graphical and numerical data was recorded after the model had stabilized. At BEP, fluctuations in mass flow, total pressure, and total temperature were all less than 0.1% of their mean values. Operating the model near stall proved more challenging and resulted in more variance in physical parameters, similar to the operating behavior of the actual TCR near stall. Peak fluctuations in mass flow, total pressure, and total temperature were all still less than 1% of their mean values.
Figure 7 is a comparison of the relative Mach number distribution in the rotor domain at BEP and near stall at 99% compressor blade span. Overall, the Mach distribution is fairly uniform throughout the blade passage at BEP with more variability and lower speed as the compressor operates near stall. At both BEP and near stall, there is a lower Mach region identified on Figure 7 that is associated with the TLV that emerges from the tip of the rotor blade leading edge (LE). Near stall, there is a large region that appears to be stagnant on the blade suction side at 40-50% chord length that is not present at BEP. This low velocity region is an indication that the rotor exhibits the blade stall mechanism discussed by Kuang at al. [3] and Hembera and Johann [4] and that the low momentum region is from flow separation on the rotor blade.
To further characterize the low momentum regions in the passage, axial velocity was plotted in Figure 8 to locate areas of flow reversal associated with large eddy zones. These large vortices were also identified in three dimensions by displaying the second invariant of the velocity gradient, Q on isosurfaces colored by Mach number in Figure 9, Figure 10 and Figure 11.
At BEP, no axial flow reversal was identified in the 99% blade span, indicating that the TLV seen in Figure 7, Figure 9, Figure 10 and Figure 11 is traveling down stream and being swept from the passage by the high momentum axial flow. There is little expansion in the radial and tangential directions, and the vortex is well entrained. Near stall however, there are two large areas where reverse axial flow occurs. The first is the TLV near the LE which nearly crosses the entire channel. This is the type of blockage that can typically be dissipated by axial slots or casing grooves [1,3,4] as discussed in the introduction.
The second large negative velocity area along the suction side of the blade is due to the same boundary layer separation reported by Wang et al. [6] and is the primary reason why slot and groove treatments have been ineffective in increasing the stall margin of this particular rotor. The boundary layer separation results in a large, low momentum eddy that can be seen by plotting Invariant Q in Figure 9, Figure 10, and Figure 11. In the first half of the blade chord, this vortex merges with the TLV on the blade suction side as seen in Figure 9 and Figure 10. The resulting large, low momentum region extends radially inward from the blade tip to as far as 60% of the blade span, increasing the passage blockage on the inlet side. In the downstream half of the blade chord, the large eddy becomes axially stagnant and flows tangentially across the suction side of the passage. It spills over the rotor blade and onto the pressure side, merging with the TLV again and blocking the passage outlet as seen in Figure 11.
3.2. Stall Mechanism Analysis with Self Recirculating Flow Control
Although they come at a larger penalty to efficiency at BEP, self recirculating flow control has improved stall margin in the TCR where slot and groove casing treatments failed. The RGV-60 flow control casing URANS model was analyzed at the same near stall point to observe the changes in flow patterns that occurred with flow control applied. All graphical and numerical data was again recorded after the model had stabilized. An initial observation was that peak fluctuations in mass flow, total pressure, and total temperature were all reduced from approximately 1% of their mean value to less than 0.4% of their mean value near stall with flow control applied.
Figure 12 is a comparison of the relative Mach number while operating near stall with a smooth casing installed, and with flow control installed. The recirculated air from the flow control casing significantly increases the mass of high speed flow entering the blade passage, and has two primary effects that result in an enhancement to both SMI and SRE. The first is that the high momentum flow increases the axial velocity of the TLV, minimizing its growth and travel in the tangential direction thereby reducing its ability to cause passage blockage. The second and perhaps more significant is that it delays the onset of boundary layer separation and reduces the size of the resulting vortex, again reducing its ability to cause channel blockage at the passage outlet.
The effects of the high momentum flow on both the TLV and the boundary layer separation vortex can also be seen in the axial velocity plot in Figure 13. The magnitude of the negative velocity in the TLV is significantly reduced, as is the tangential distance it spans across the passage. There is also greater separation between the two zones of negative velocity flow resulting in less interaction and merging of these two vortices and less low momentum blockage of the blade passage. Although there is still some merging of the TLV and the boundary layer separation vortex observed in Figure 15, the top view and trailing edge (TE) view in Figure 14 and Figure 16 of the channel show significantly less interaction and blockage.
Figure 14 shows that the boundary layer separation vortex is significantly smaller with flow control applied. In the TE view of Figure 16, there is not as much tangential spill over of this vortex onto the pressure side of the blade. Additionally, it no longer merges with the TLV, resulting in no large momentum deficit at the exit of the blade passage. The TLV maintains a high axial velocity as it exits the channel, and is well contained in the tangential direction.
4. Conclusion
A highly detailed and refined CFD simulation of the TCR was used to conduct both RANS and URANS modeling of the compressor at BEP and at the onset of stall. The model agreed within 1% of PR and TR values obtained from experimental TCR data and was an accurate representation of the TCR. An analysis of the flow field at BEP and near stall showed that the stall mechanism of this rotor was primarily due to passage blockage from a large mass of low momentum fluid that formed due to boundary layer separation at the suction side of the blade tip. This effect is similar to that observed by Wang et al. [6] and explains why axial slot and circumferential groove type casing treatments were previously ineffective at improving stall margin on this rotor.
A CFD model of a self recirculating flow control design proven to enhance stall margin on the rotor was added to the TCR model to observe the reason for its effectiveness where simple casing treatments previously failed. CFD predicted SMI and SRE enhancements comparable to those observed in actual experimental TCR test runs using the same flow control design. The high momentum fluid re-injected by the flow control casing had two primary effects. The first was that it accelerated the axial velocity of the TLV and minimized its tangential growth, lowering the potential for passage blockage. The second was that it delayed the onset of boundary layer separation to further down the blade chord, and reduced the tangential growth of this vortex once separation did occur. Both effects resulted in less interaction between the two vortices, and less passage blockage from low momentum fluid.
A separate flow control casing performance study [13] found that most self recirculating flow control casings provided diminished SMI and SRE when speed was increased to the 100% speed test configuration of the TCR. This is likely due to the interaction of a much stronger passage shock with the TLV and boundary layer similar to that characterized by Wang et al. [6] and Chen et al. [7] causing reduced performance of the high momentum fluid injected by flow control. Stall mechanism investigation at 100% speed is the subject of an ongoing study.
Author Contributions
Conceptualization, W.S., A.G. and G.H.; methodology, D.A., W.S., A.G. and G.H.; software, D.A., W.S, A.G. and G.H.; validation, D.A., W.S., A.G. and G.H.; formal analysis, D.A., W.S, A.G. and G.H.; investigation, D.A., W.S, A.G.; resources, W.S., A.G. and G.H.; data curation, D.A., W.S., A.G. and G.H.; writing—original draft preparation, D.A.; writing—review and editing, W.S., A.G., and G.H.; visualization, D.A., W.S., A.G. and G.H.; supervision, W.S., A.G. and G.H.; project administration, W.S., A.G. and G.H.; funding acquisition, W.S., A.G. and G.H. All authors have read and agreed to the published version of the manuscript
Funding
This research was funded by the Office of Naval Research, Code 35
Institutional Review Board Statement
Not applicable
Informed Consent Statement
Not applicable
Data Availability Statement
Data will be available upon request
Acknowledgments
The authors thank the Naval Postgraduate School for the use of their transonic compressor test rig and military fan. The authors also thank Dr. Steve Martens at the Office of Naval Research Code 35 for funding much of the testing and research that contributed to the findings of this paper.
Conflicts of Interest
The authors declare no conflicts of interest.
Abbreviations
The following abbreviations are used in this manuscript:
| BEP | Best Efficiency Point |
| CFD | Computational Fluid Dynamics |
| IAWS | In Accordance With Schedule |
| IGV | Inlet Guide Vane |
| LE | Leading Edge |
| PR | Total Pressure Ratio |
| RGV | Recirculation Guide Vane |
| SMI | Stall Margin Improvement |
| SRE | Stable Range Extension |
| TCR | Transonic Compressor Rig |
| TE | Trailing Edge |
| TLV | Tip Leakage Vortex |
| URANS | Unsteady Reynolds-Averaged Navier-Stokes |
References
- Hathaway, M.D. Passive Endwall Treatments for Enhancing Stability. Technical Report NASA Technical Memorandum 214409, National Aeronautics and Space Administration, 2007.
- Biollo, R.; Benini, E. Recent Advances in Transonic Axial Compressor Aerodynamics. Progress in Aerospace Sciences 2013, 56, 1–18. [Google Scholar] [CrossRef]
- Kuang, H.; Wuli Chu, S.; Zhang, H.; Ma, S. Flow Mechanism for Stall Margin Improvement via Axial Slot Casing Treatment on a Transonic Axial Compressor. Journal of Applied Fluid Mechanics 2017, 10, 703–712. [Google Scholar] [CrossRef]
- Hembera, M.; Kau, H.P.; Johann, E. Simulation of Casing Treatments of a Transonic Compressor Stage. International Journal of Rotating Machinery 2008, 2008, 657202. [Google Scholar] [CrossRef]
- Zhu, G.; Yang, B. Optimization of Slots-Groove Coupled Casing Treatment for an Axial Transonic Compressor. Journal of Turbomachinery 2020, 142, 081003. [Google Scholar] [CrossRef]
- Wang, W.; Lu, J.l.; Luo, X.q.; Huang, R.; Chu, W.l. Failure Mechanism of Casing Treatment in Improving Stability of a Highly Loaded Two-Stage Axial Compressor. Aerospace Science and Technology 2020, 105, 105979. [Google Scholar] [CrossRef]
- Chen, Y.; Lin, A.; Zhang, H.; Chu, W. Method of Improving Stability of a Highly-Loaded Axial Compressor Stage by Coupling Different Casing Treatments. Journal of Applied Fluid Mechanics 2022, 15, 645–657. [Google Scholar] [CrossRef]
- Koley, S.S.; Chen, H.; Saraswat, A.; Katz, J. Effect of Axial Casing Groove Geometry on Rotor-Groove Interactions in the Tip Region of a Compressor. Journal of Turbomachinery 2021, 143, 091010. [Google Scholar] [CrossRef]
- Reid, L.; Moore, D.M. Performance of Single-Stage Axial-Flow Transonic Compressor with Rotor and Stator Aspect Ratios of 1.19 and 1.26, Respectively, and with Design Pressure Ration of 1.82. Technical Report NASA Technical Paper 1338, National Aeronautics and Space Administration, Scientific and Technical Information Office, 1978.
- Hobson, G.V.; Gannon, A.; Holmes, W.; McCormick, M.; Capece, V. Experimental and Numerical Performance Characterization of a Transonic Compressor Rotor Operating Behind an Inlet-Guide Vane with Variable Flap Angles. In Proceedings of the Turbo Expo: Power for Land, Sea, and Air. American Society of Mechanical Engineers, 2014, V02AT37A056, Vol. 45608.
- Vo, H.D.; Tan, C.S.; Greitzer, E.M. Criteria for Spike Initiated Rotating Stall. Journal of Turbomachinery 2008, 130, 1–9. [Google Scholar] [CrossRef]
- Hathaway, M.D. Self-Recirculating Casing Treatment Concept for Enhanced Compressor Performance. In Proceedings of the Turbo Expo: Power for Land, Sea, and Air, 2002, Vol. 3610, pp. 411–420.
- Ahmadi, D.V.; Smith, W.C.; Gannon, A.J.; Hobson, G.V. Stall Margin Improvement in a Transonic Axial Compressor Using Passive Flow Control. In Proceedings of the AIAA SCITECH 2025 Forum, 2025, p. 2619.
- Kumar, S.S.; Alone, D.B.; Thimmaiah, S.M.; Mudipalli, J.R.R.; Kumar, L.; Ganguli, R.; Kandagal, S.; Jana, S. Aerodynamic Behavior of a Transonic Axial Flow Compressor Stage with Self-Recirculating Casing Treatment. Aerospace Science and Technology 2021, 112, 106587. [Google Scholar] [CrossRef]
- Dinh, C.; Kim, K. Effects of Non-Axisymmetric Casing Grooves Combined with Airflow Injection on Stability Enhancement of an Axial Compressor. International Journal of Turbo & Jet-Engines 2019, 36, 283–296. [Google Scholar] [CrossRef]
Figure 1.
Transonic compressor rig overview.
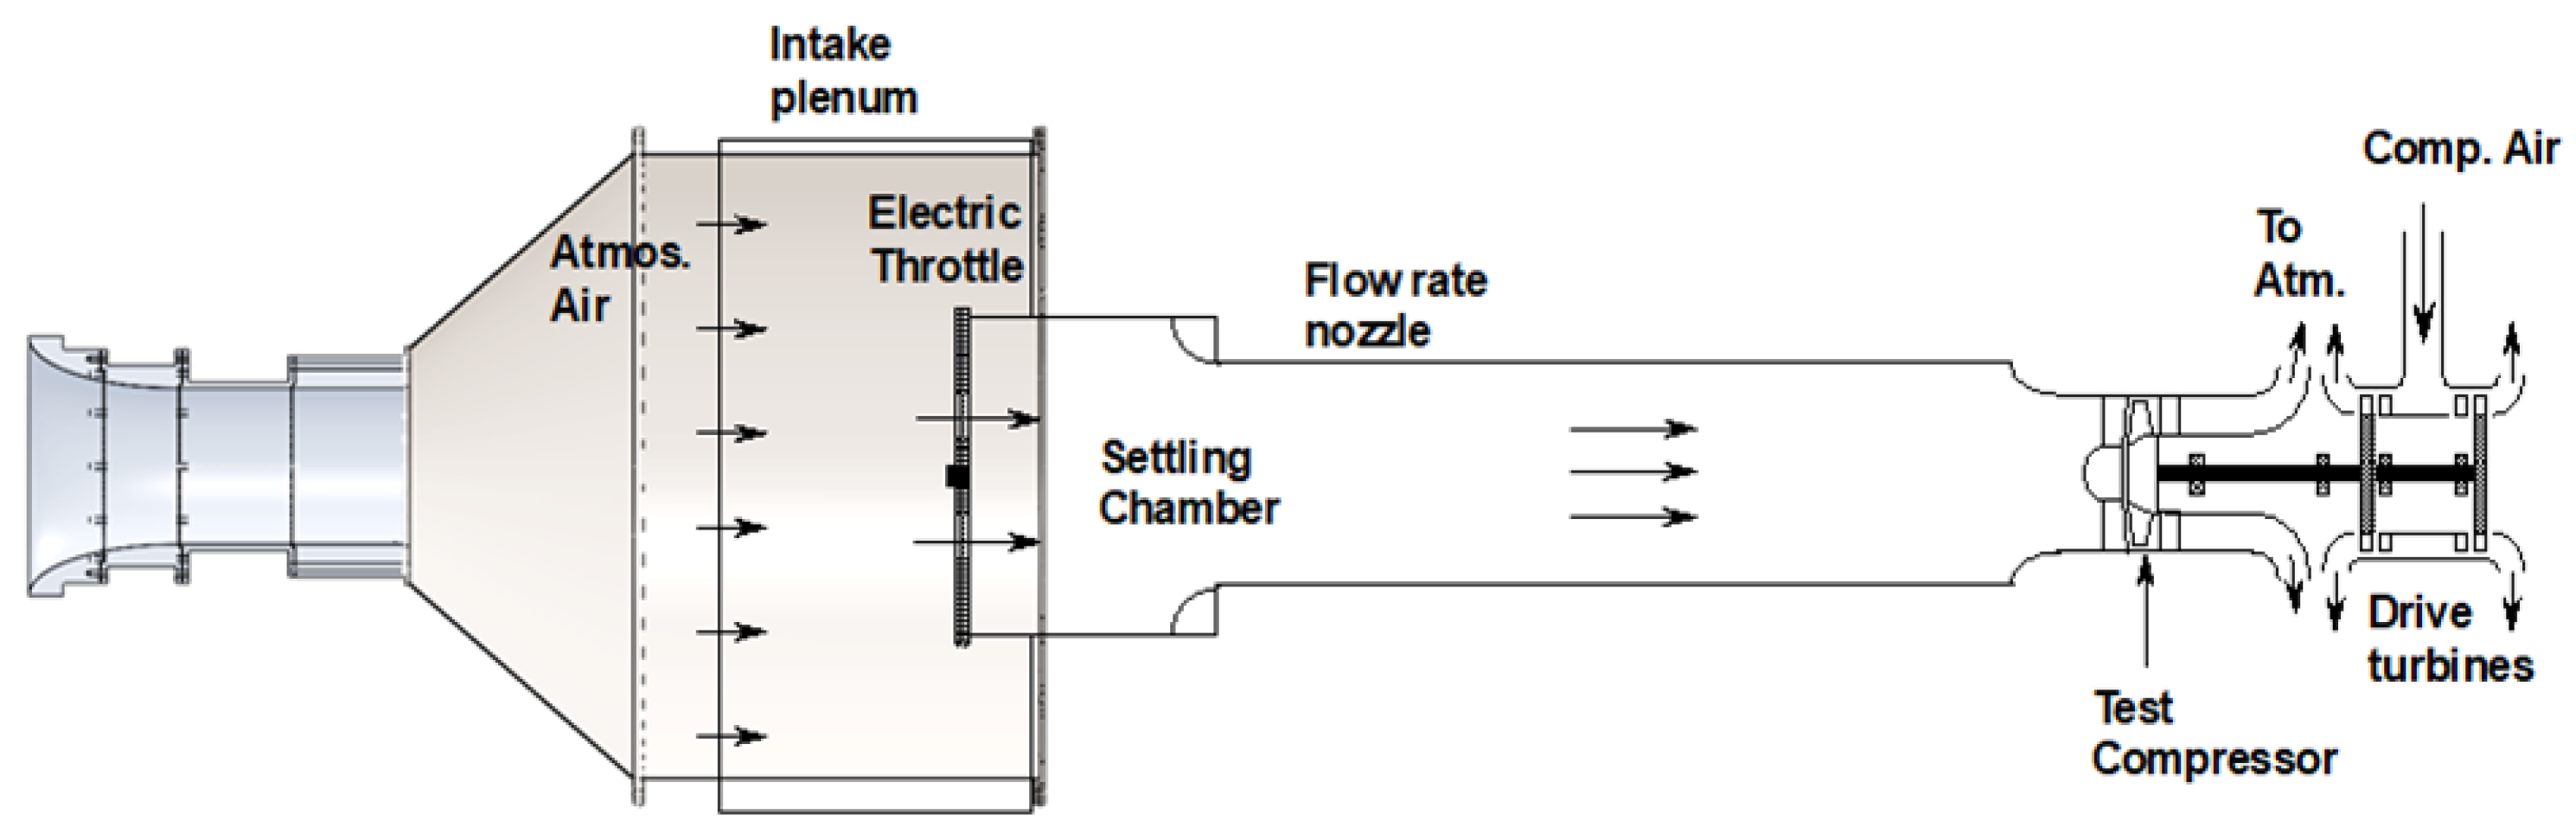
Figure 2.
Transonic compressor rig configuration.
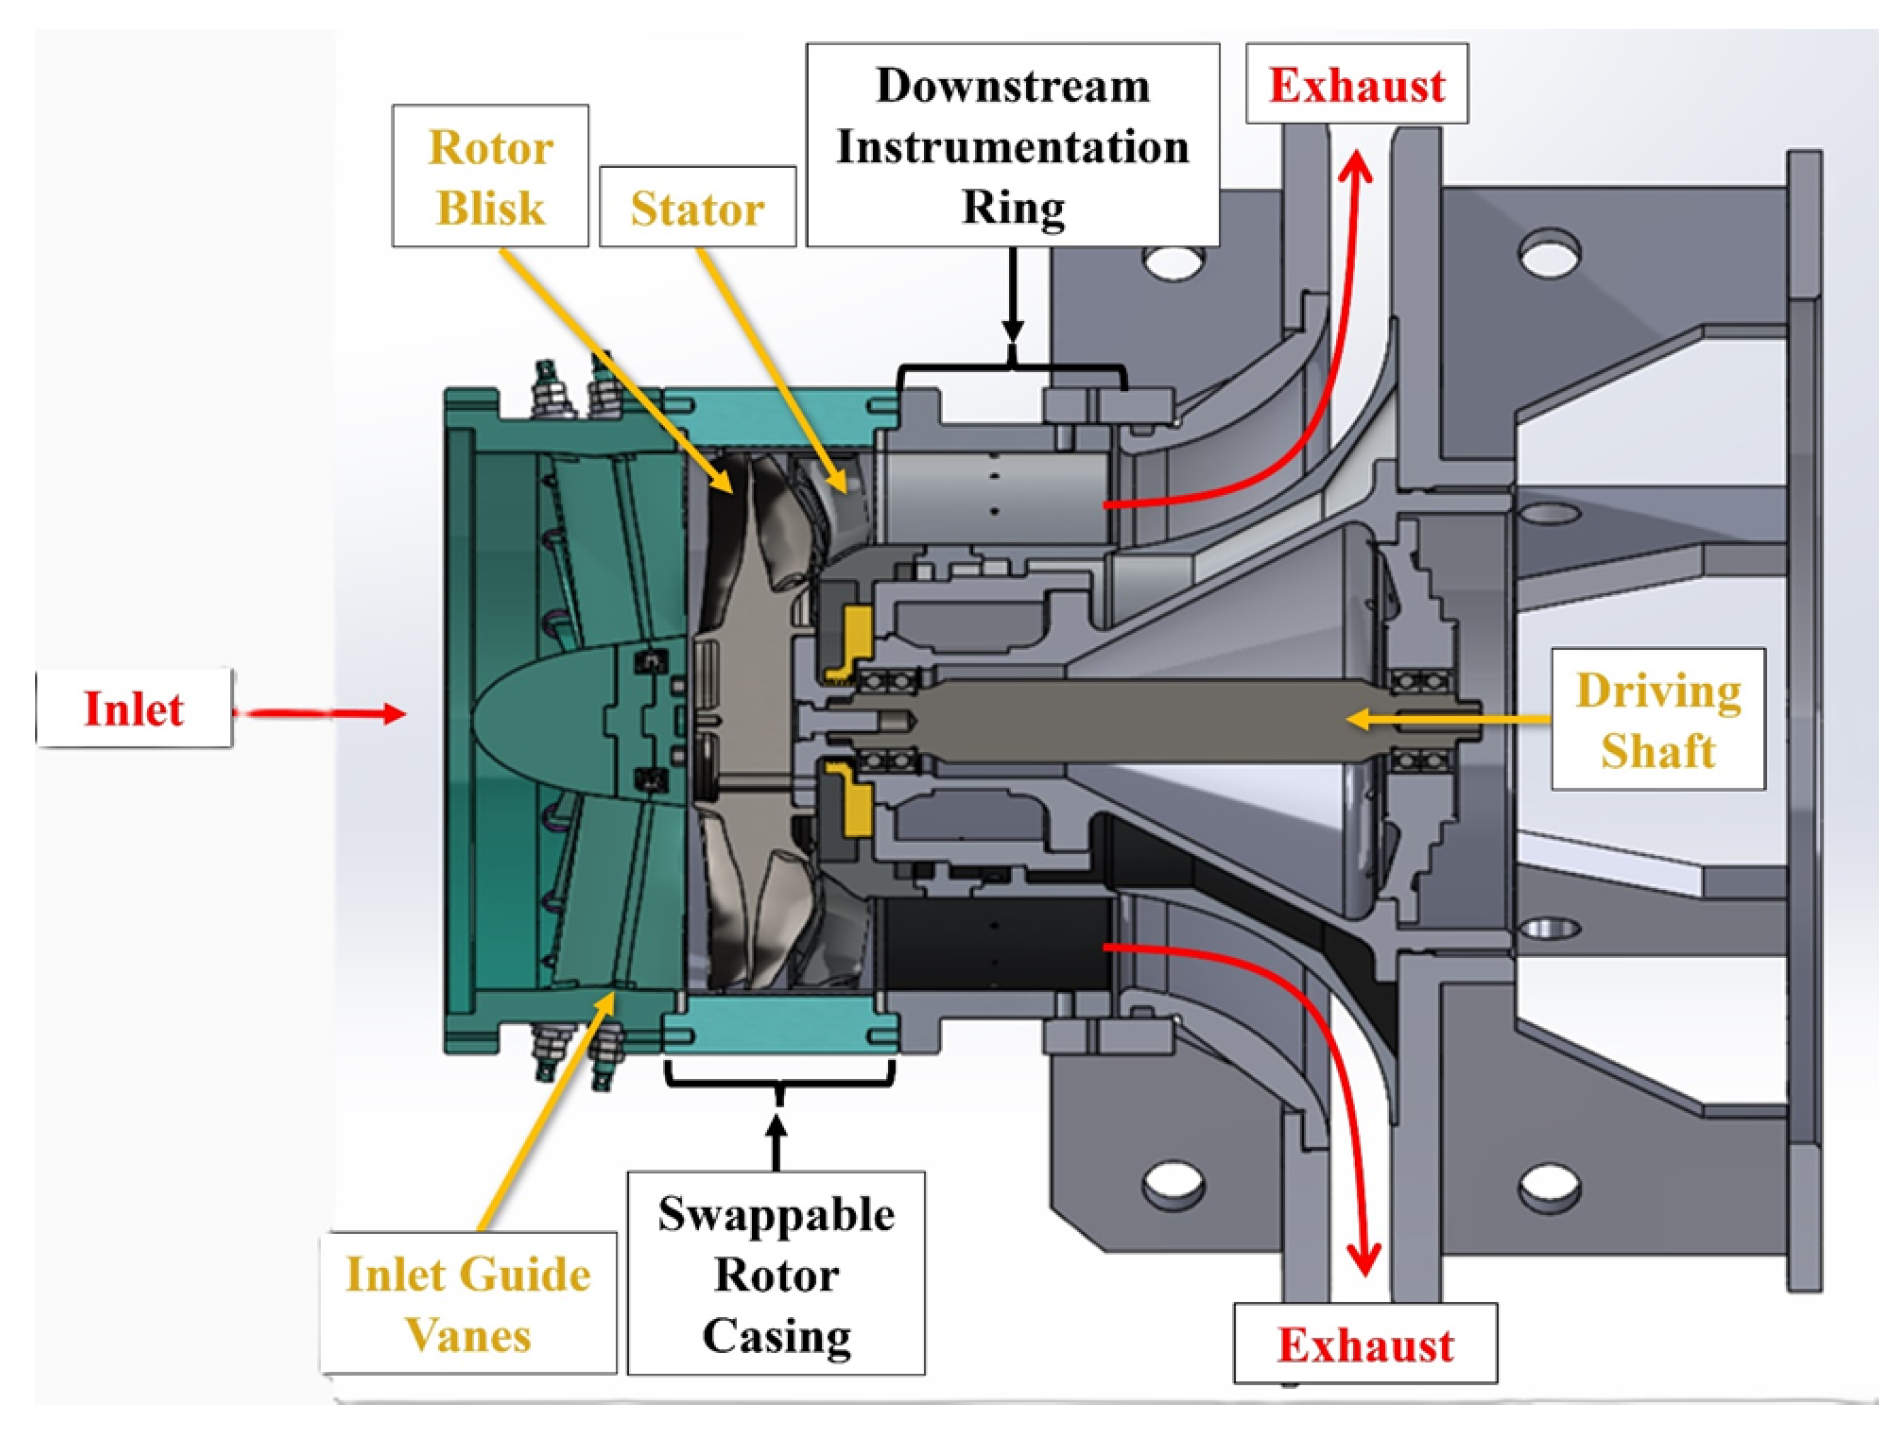
Figure 3.
Single passage gas path of the TCR, viewed from the side.
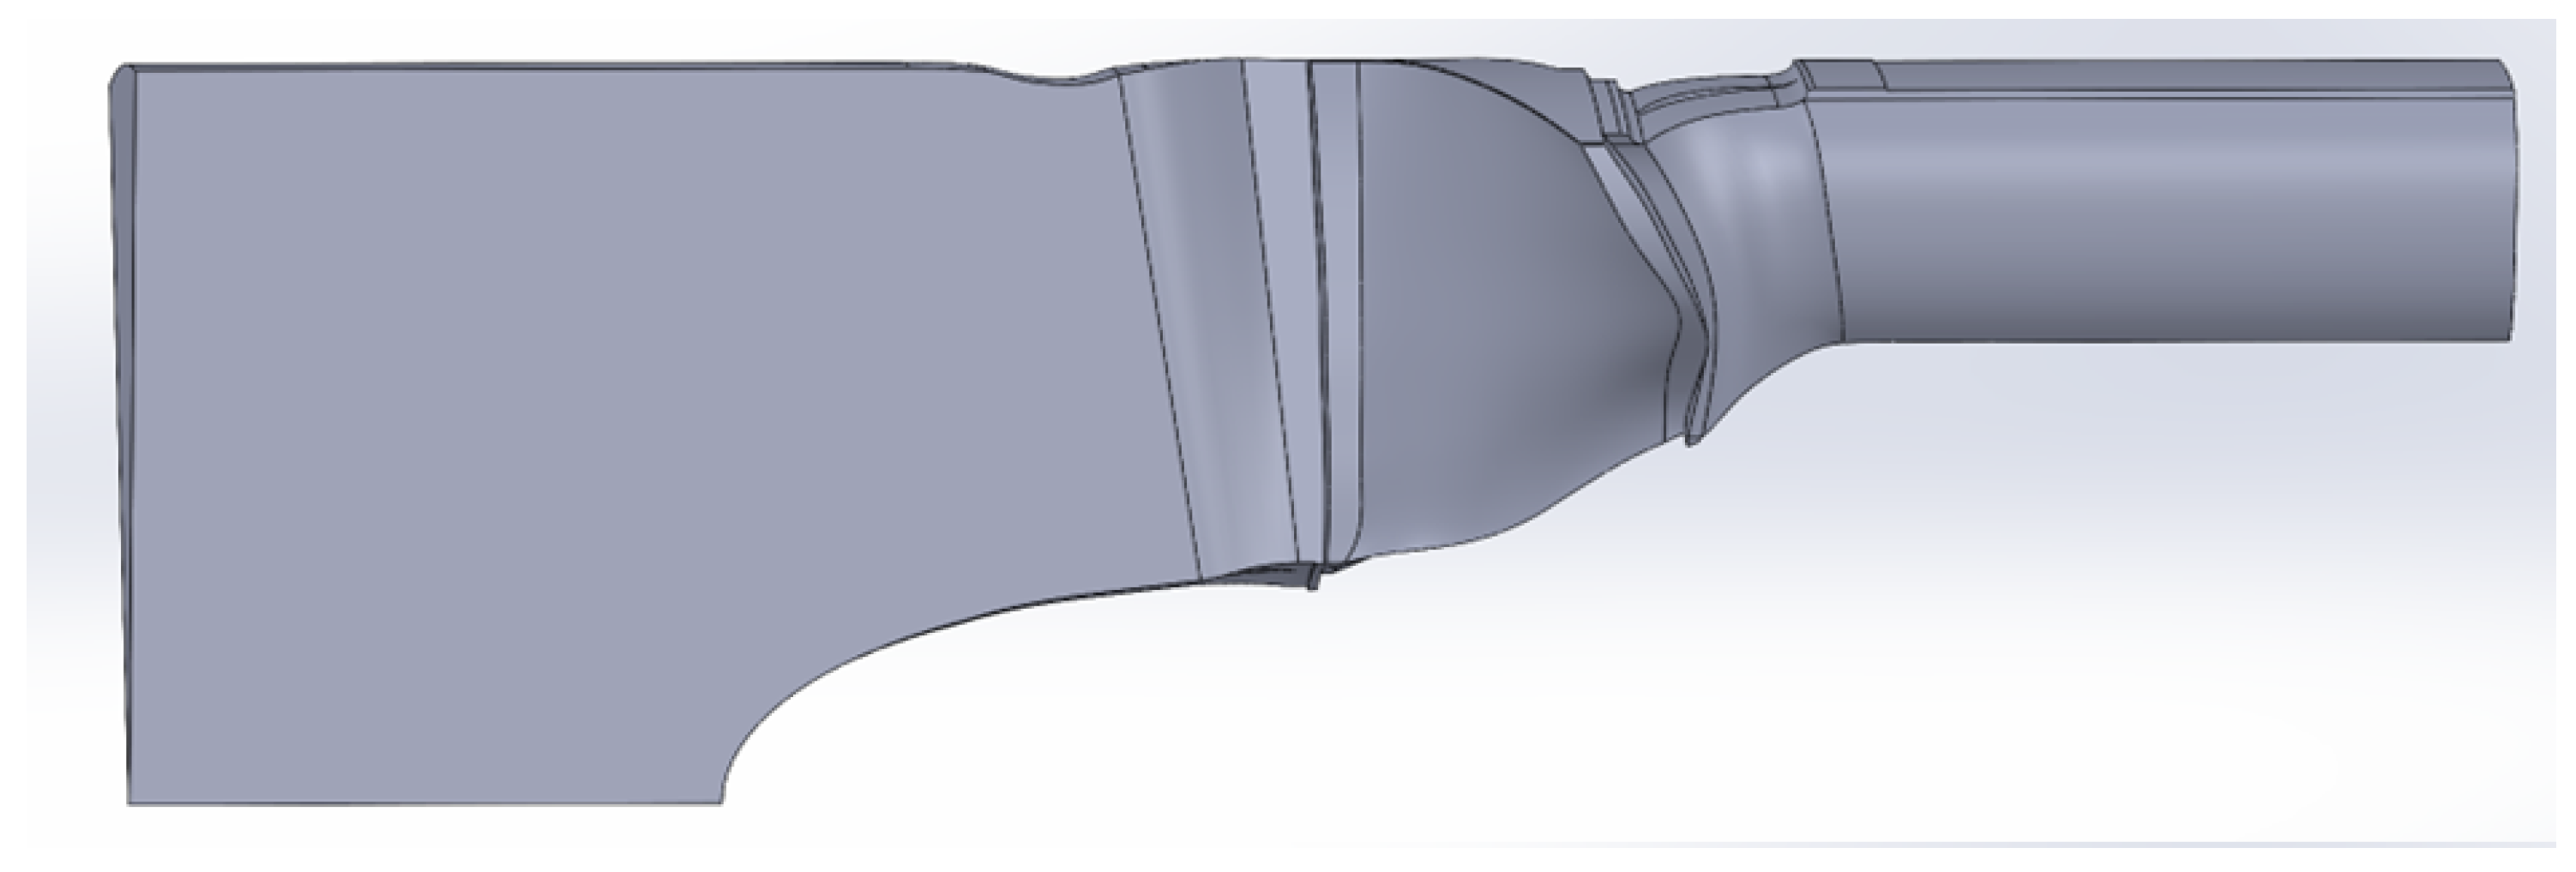
Figure 4.
CFD model pressure ratio and temperature ratio comparison to TCR data at 85% speed.
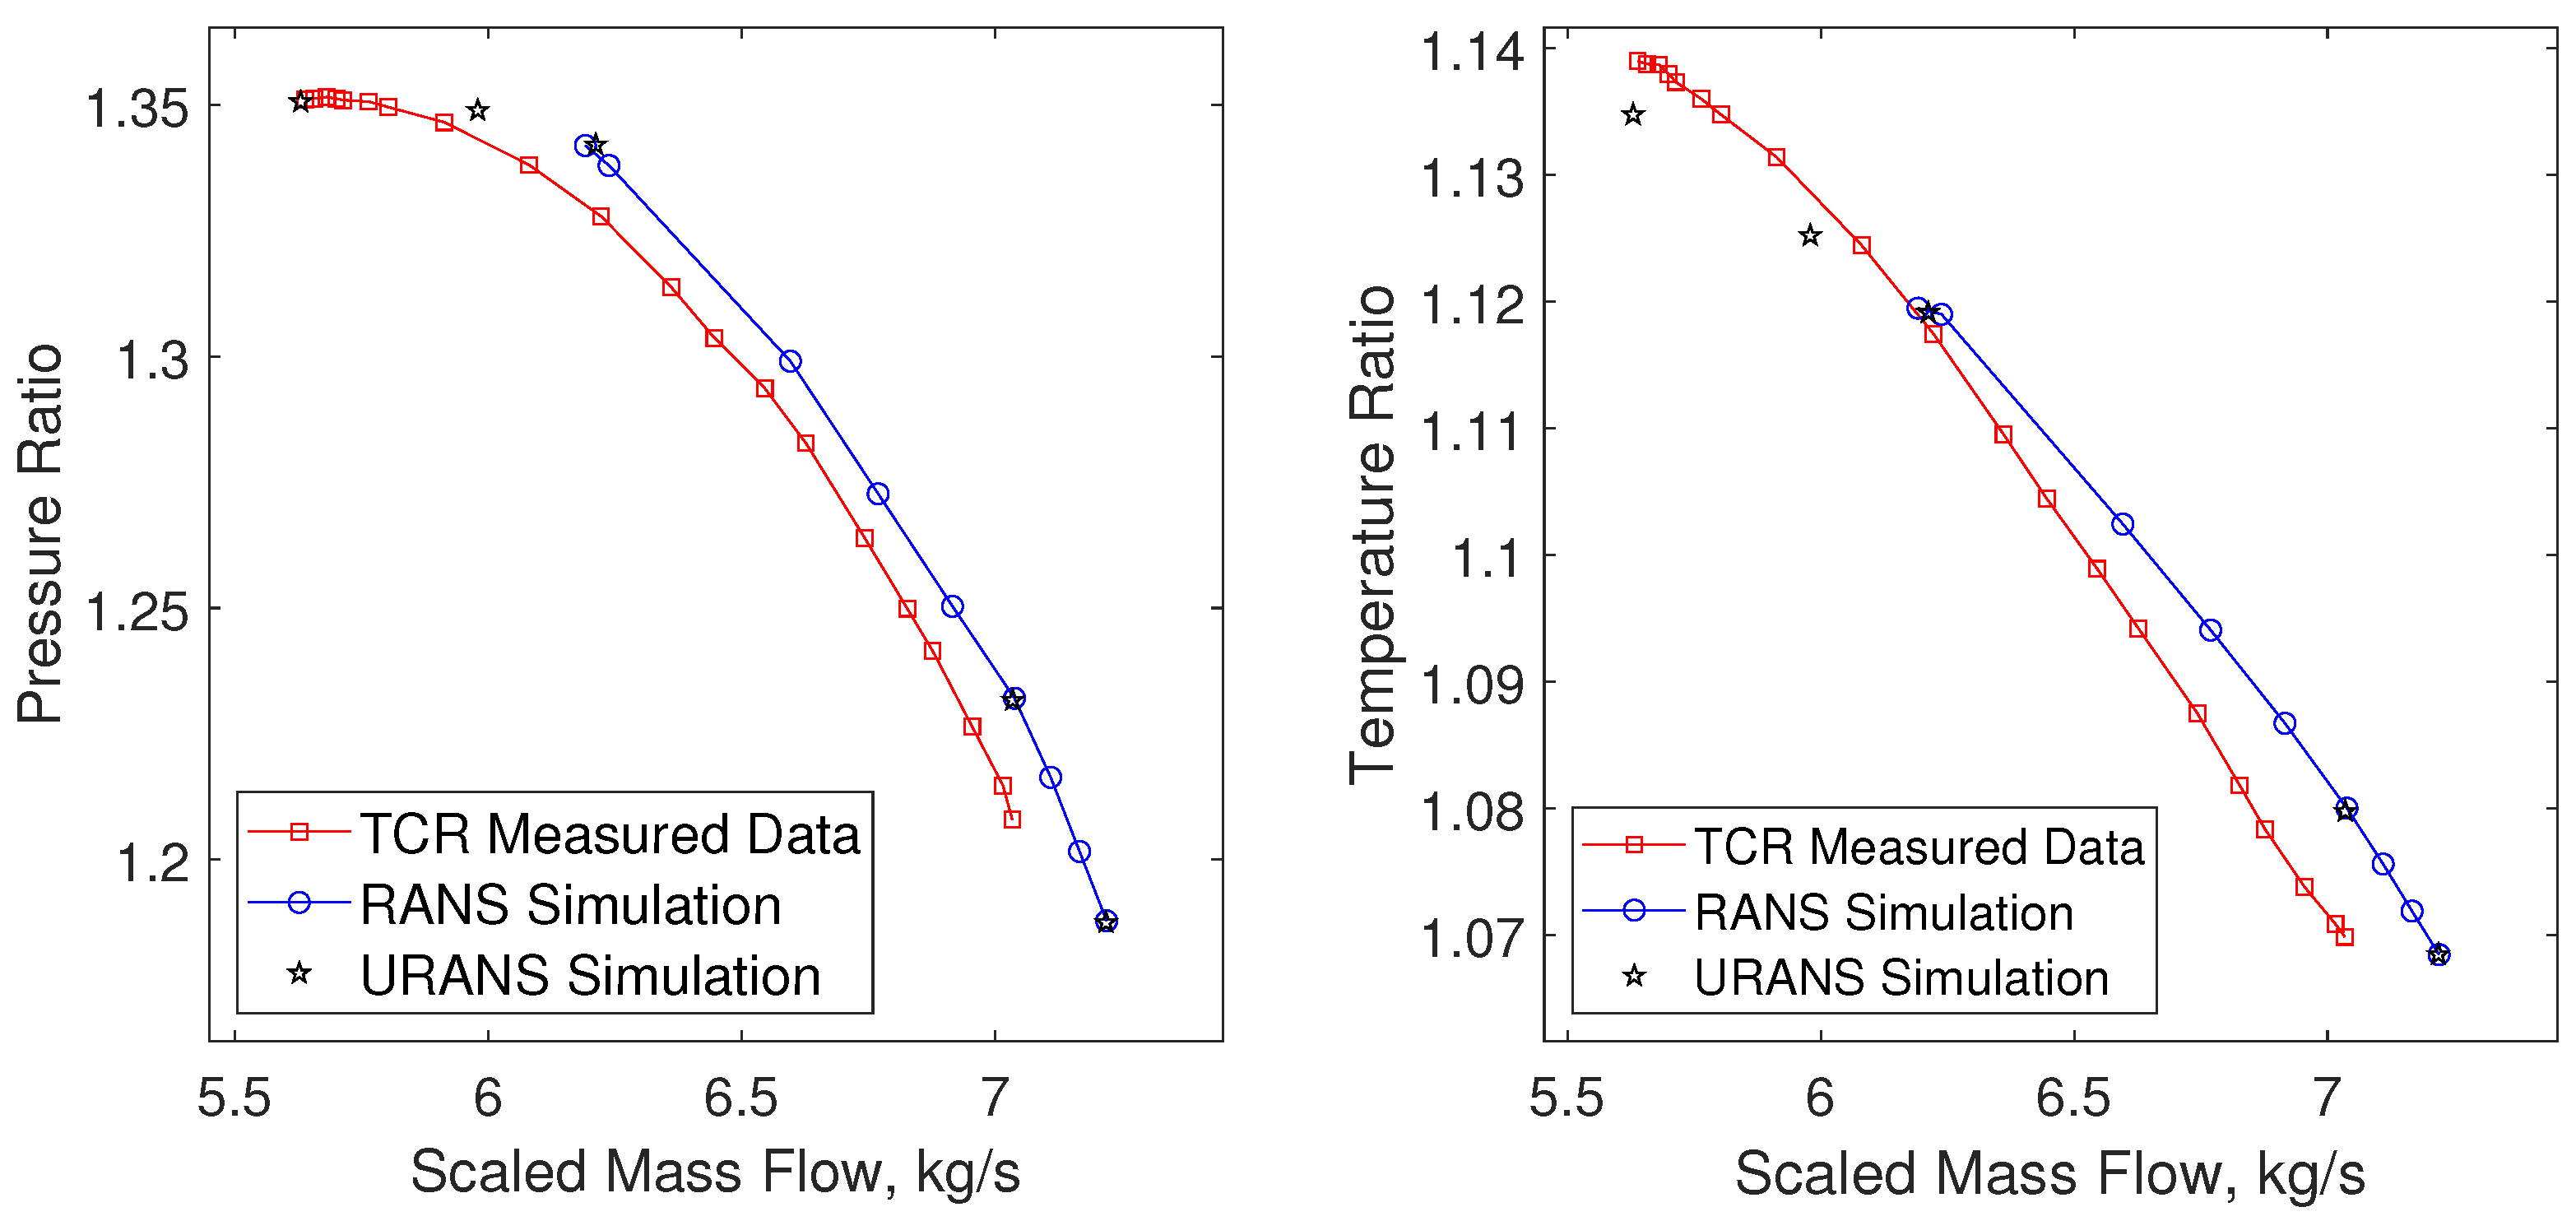
Figure 5.
Cross section view of the TCR with flow control casing installed.
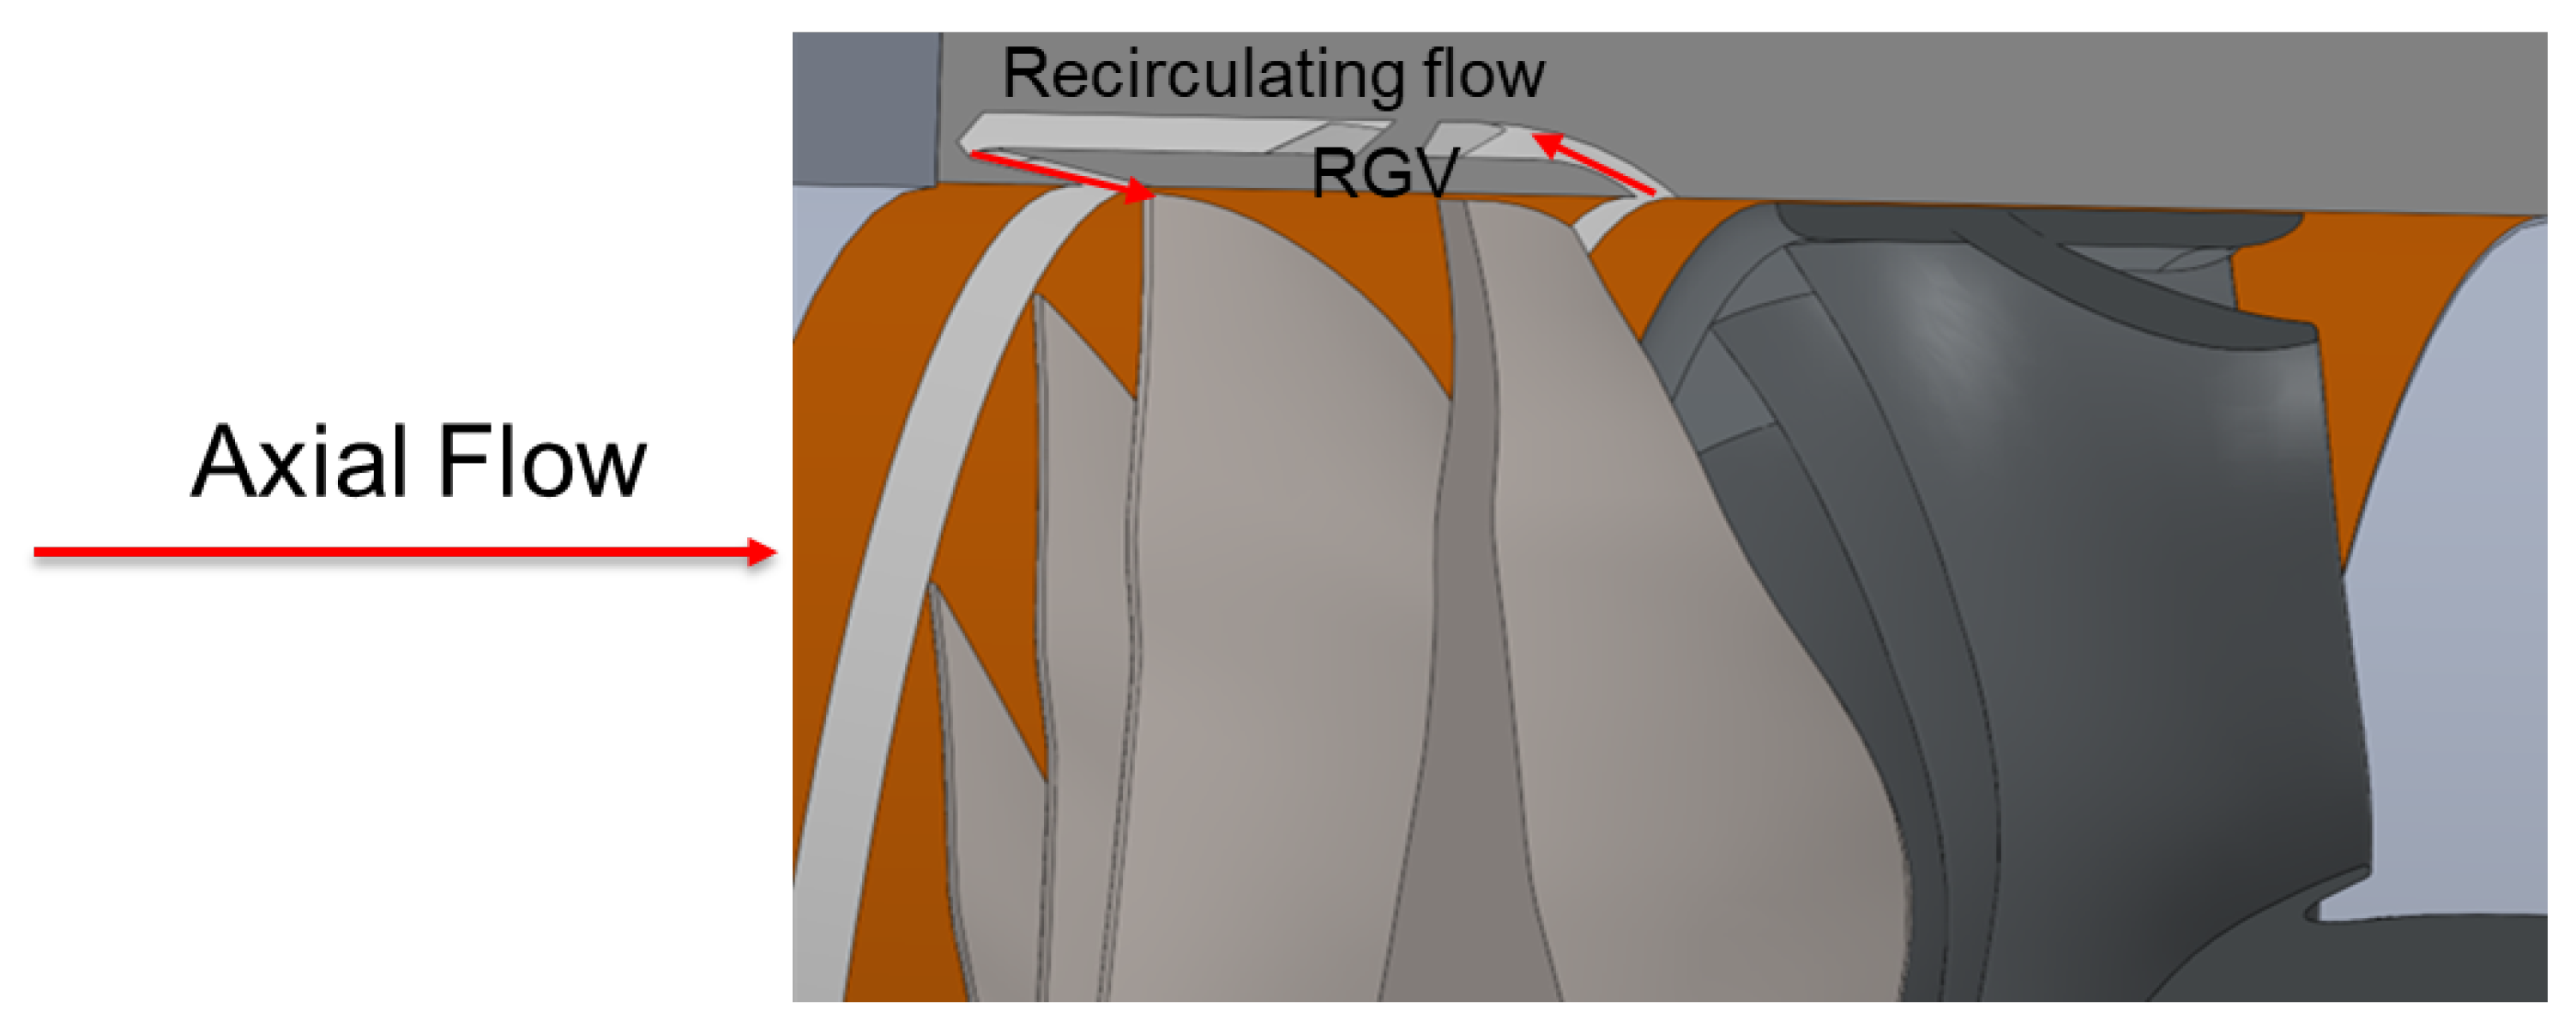
Figure 6.
Refined RGV-60 model pressure ratio and temperature ratio enhancement at 85% speed, IGV IAWS.
Figure 6.
Refined RGV-60 model pressure ratio and temperature ratio enhancement at 85% speed, IGV IAWS.
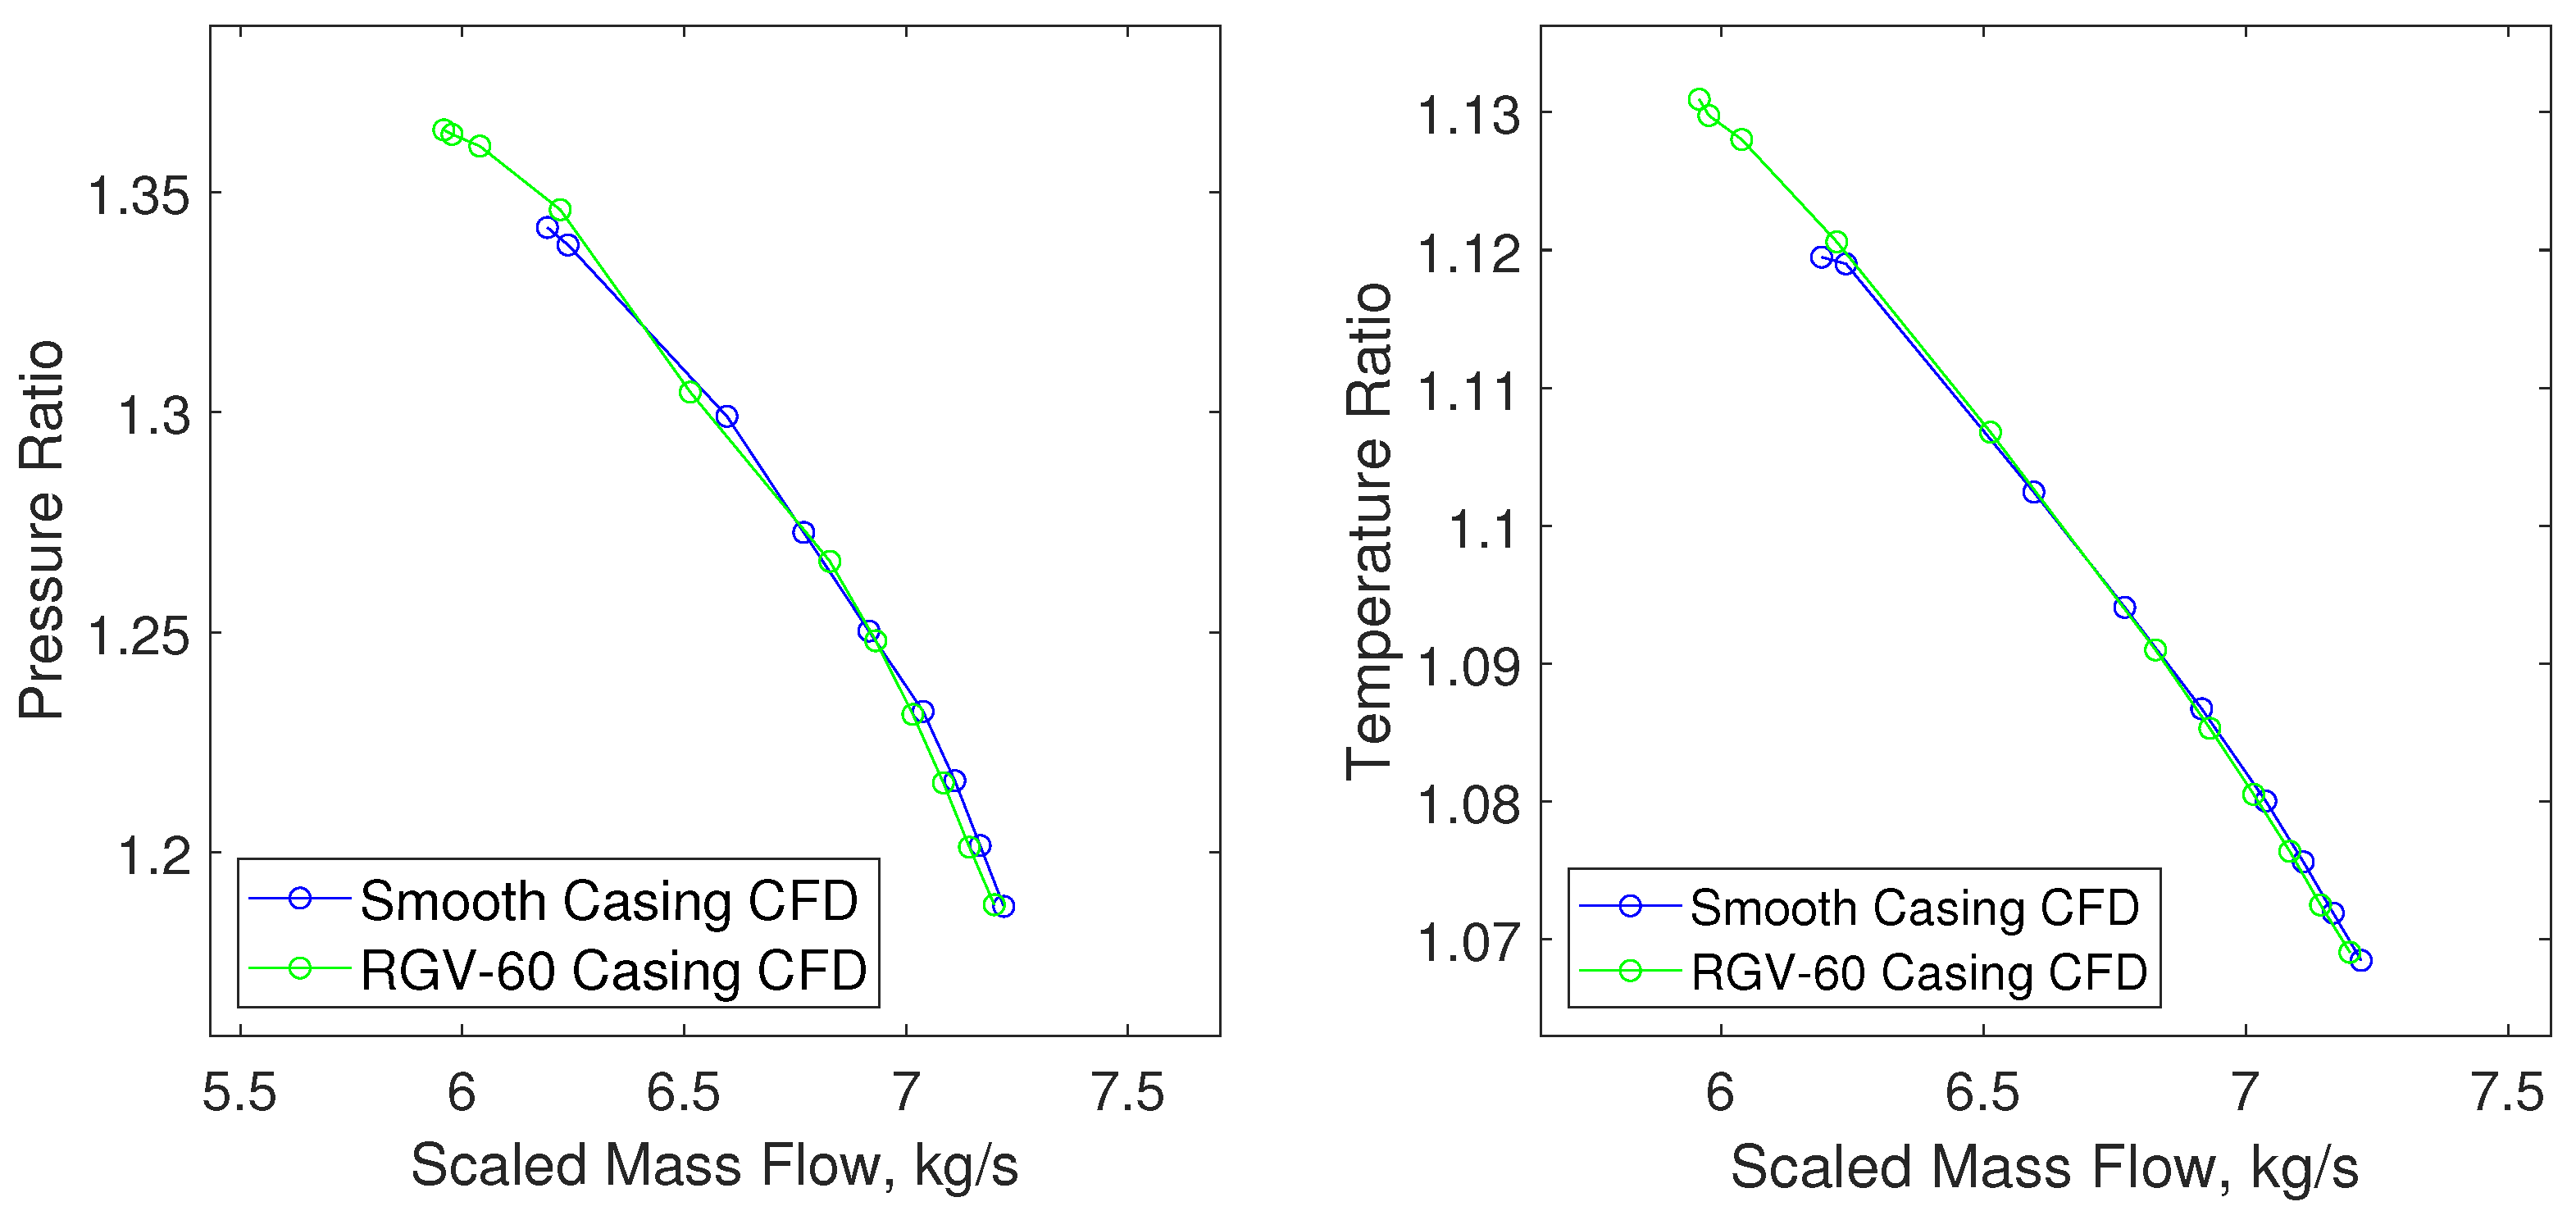
Figure 7.
Relative Mach distribution at BEP (left) and near stall (right) at 99% span.
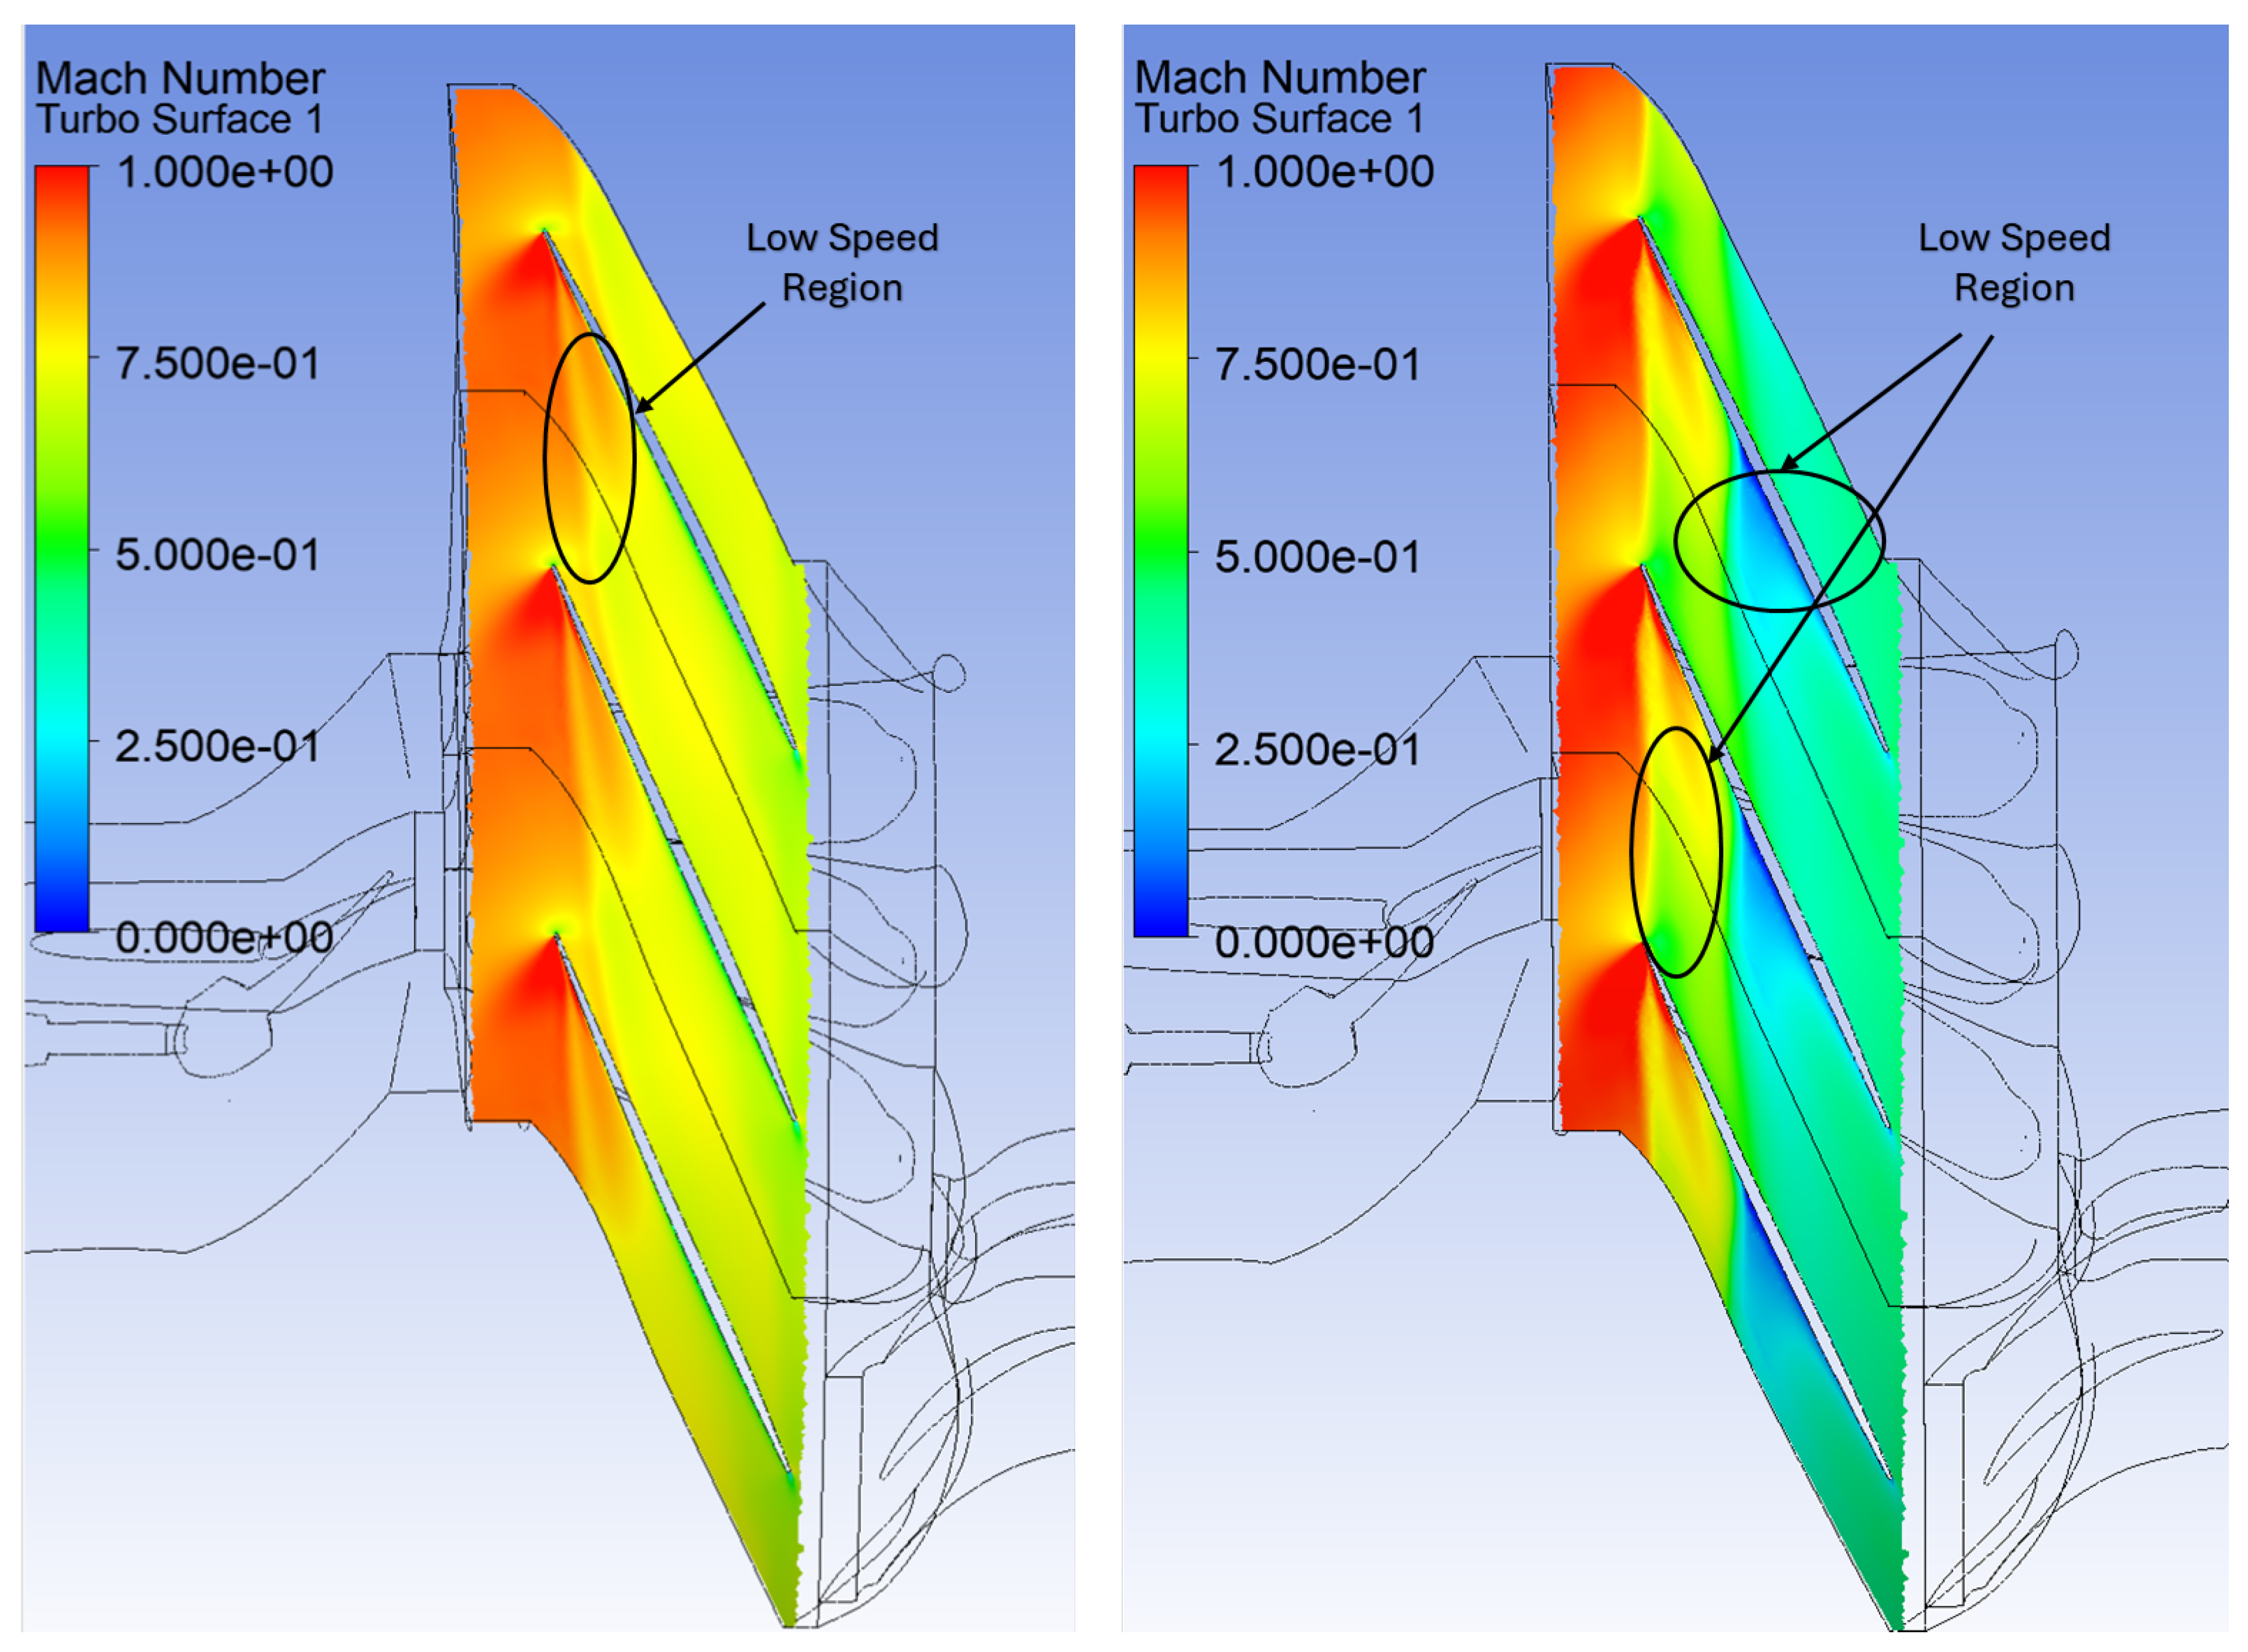
Figure 8.
Axial velocity reversal at BEP (left) and near stall (right) at 99% span.
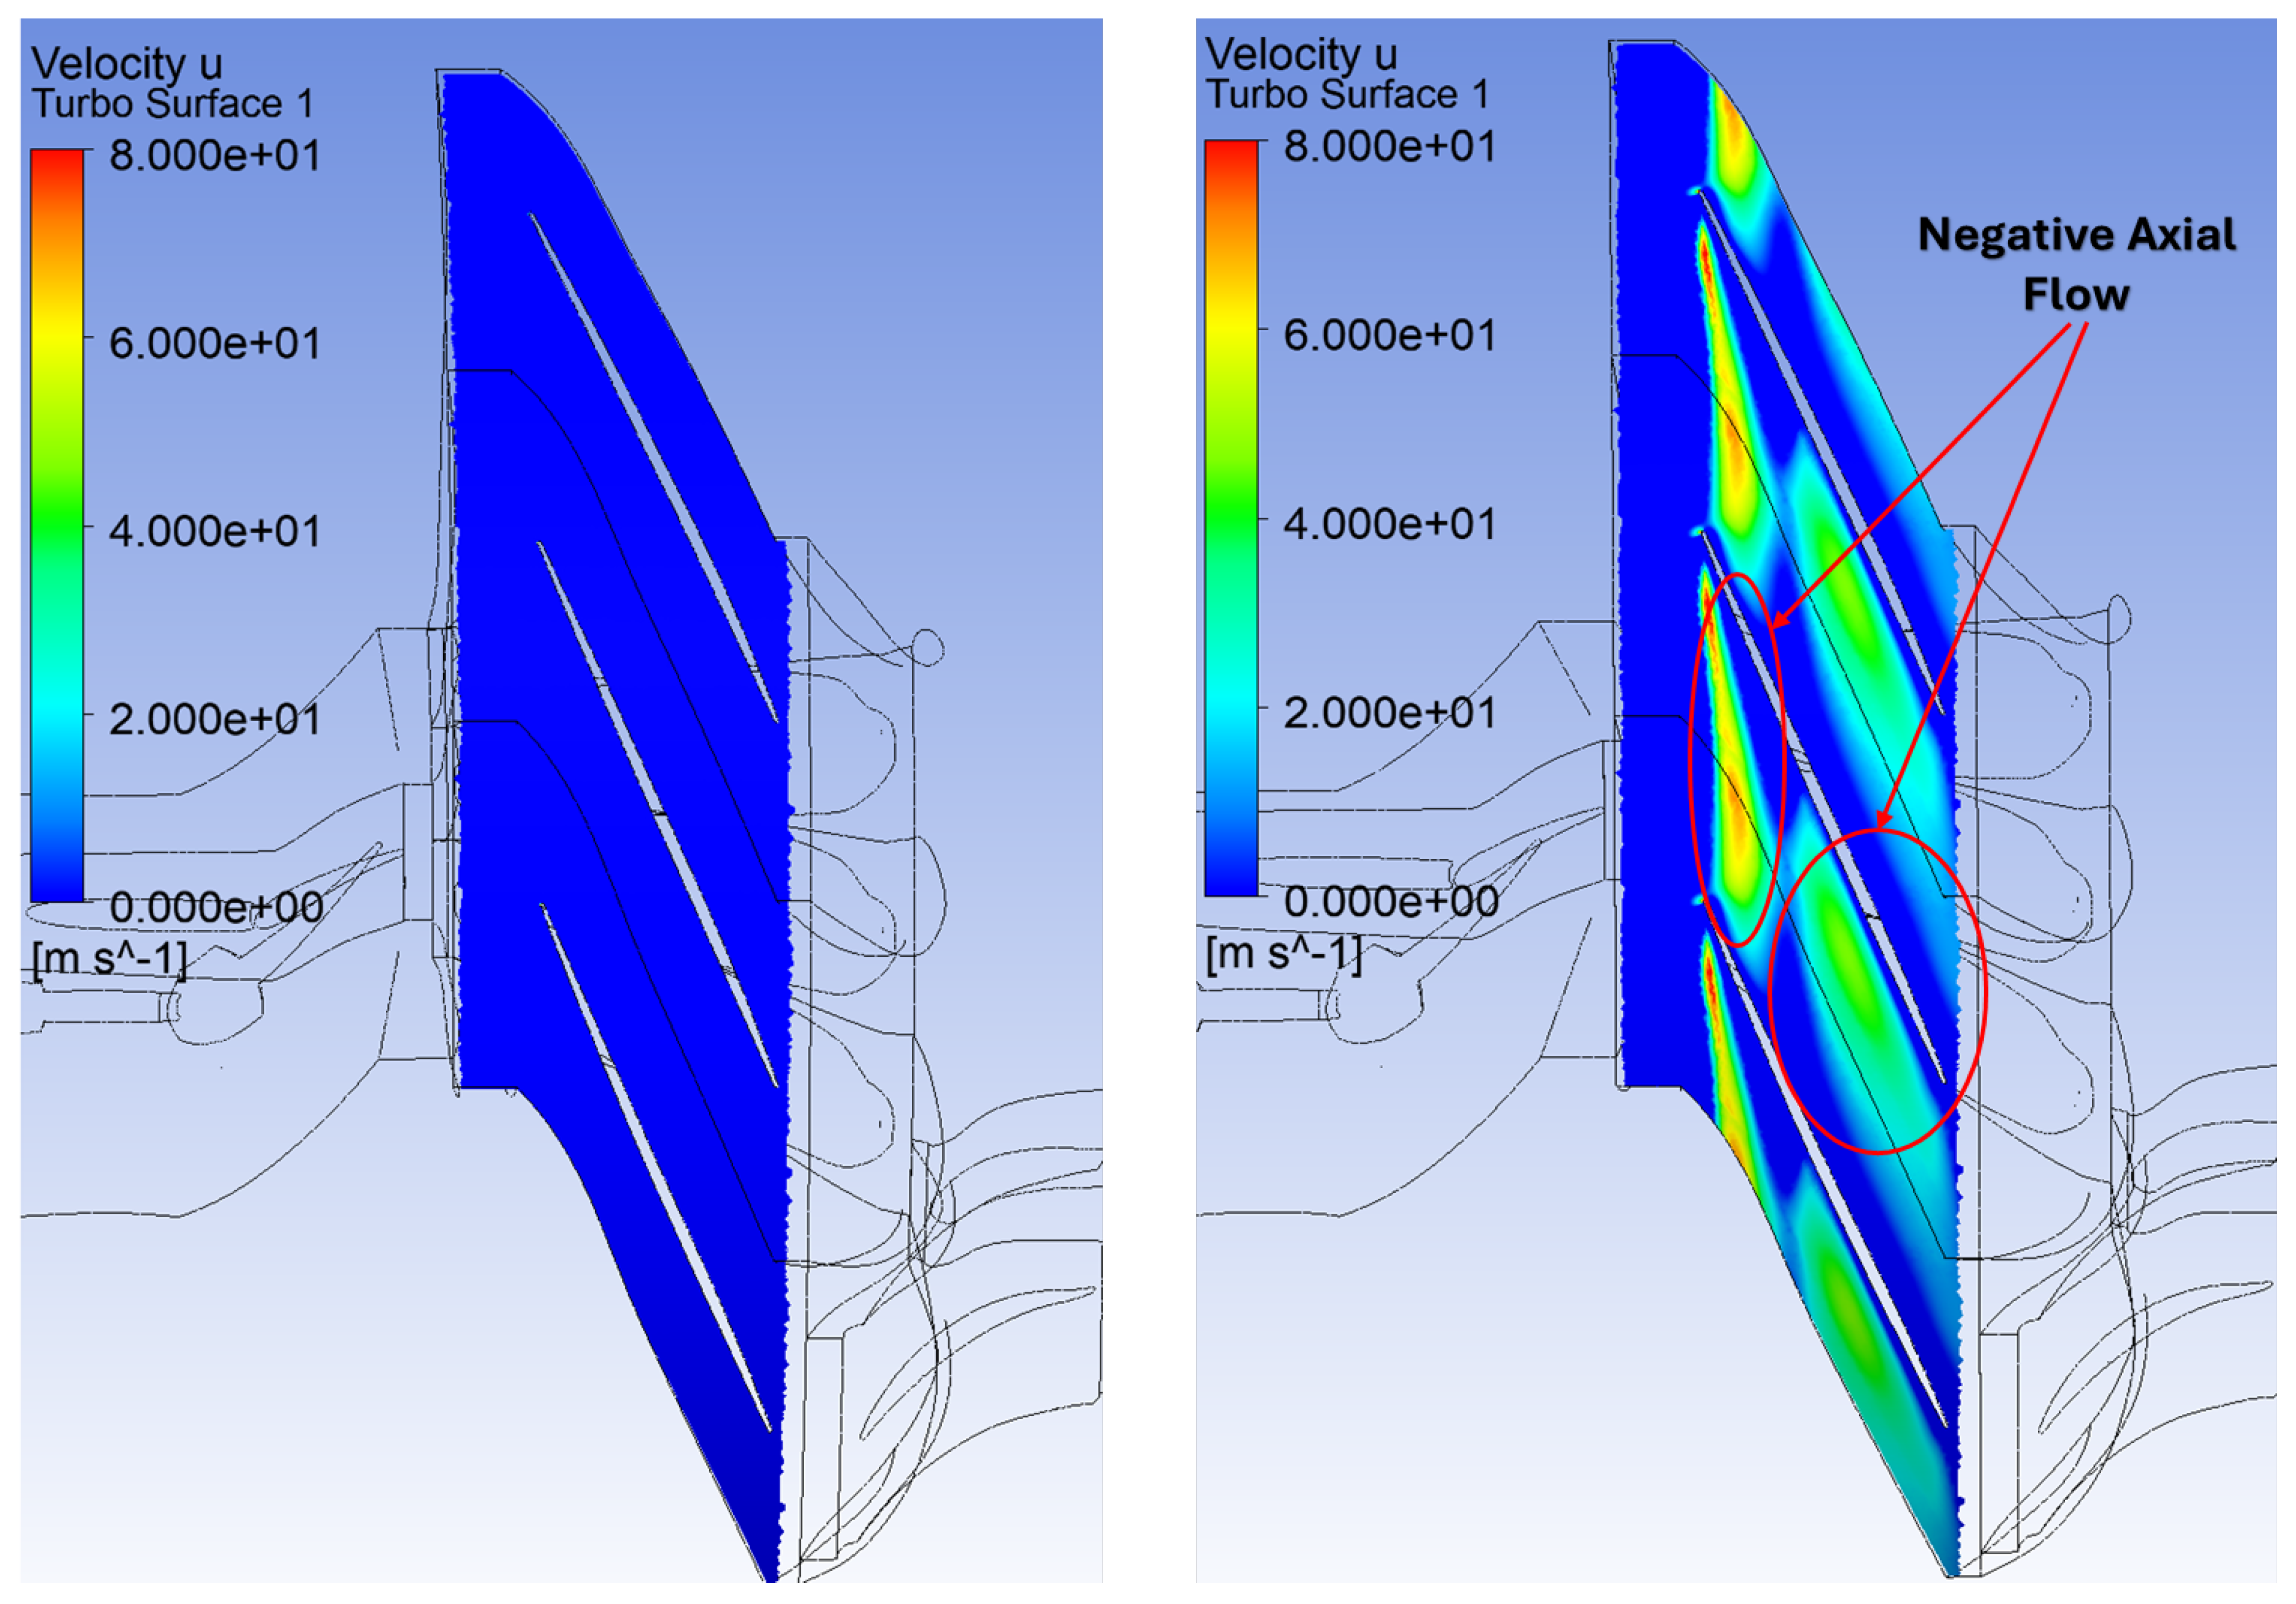
Figure 9.
Vortex locations at BEP (left) and near stall (right) at 99% span. Overhead view.
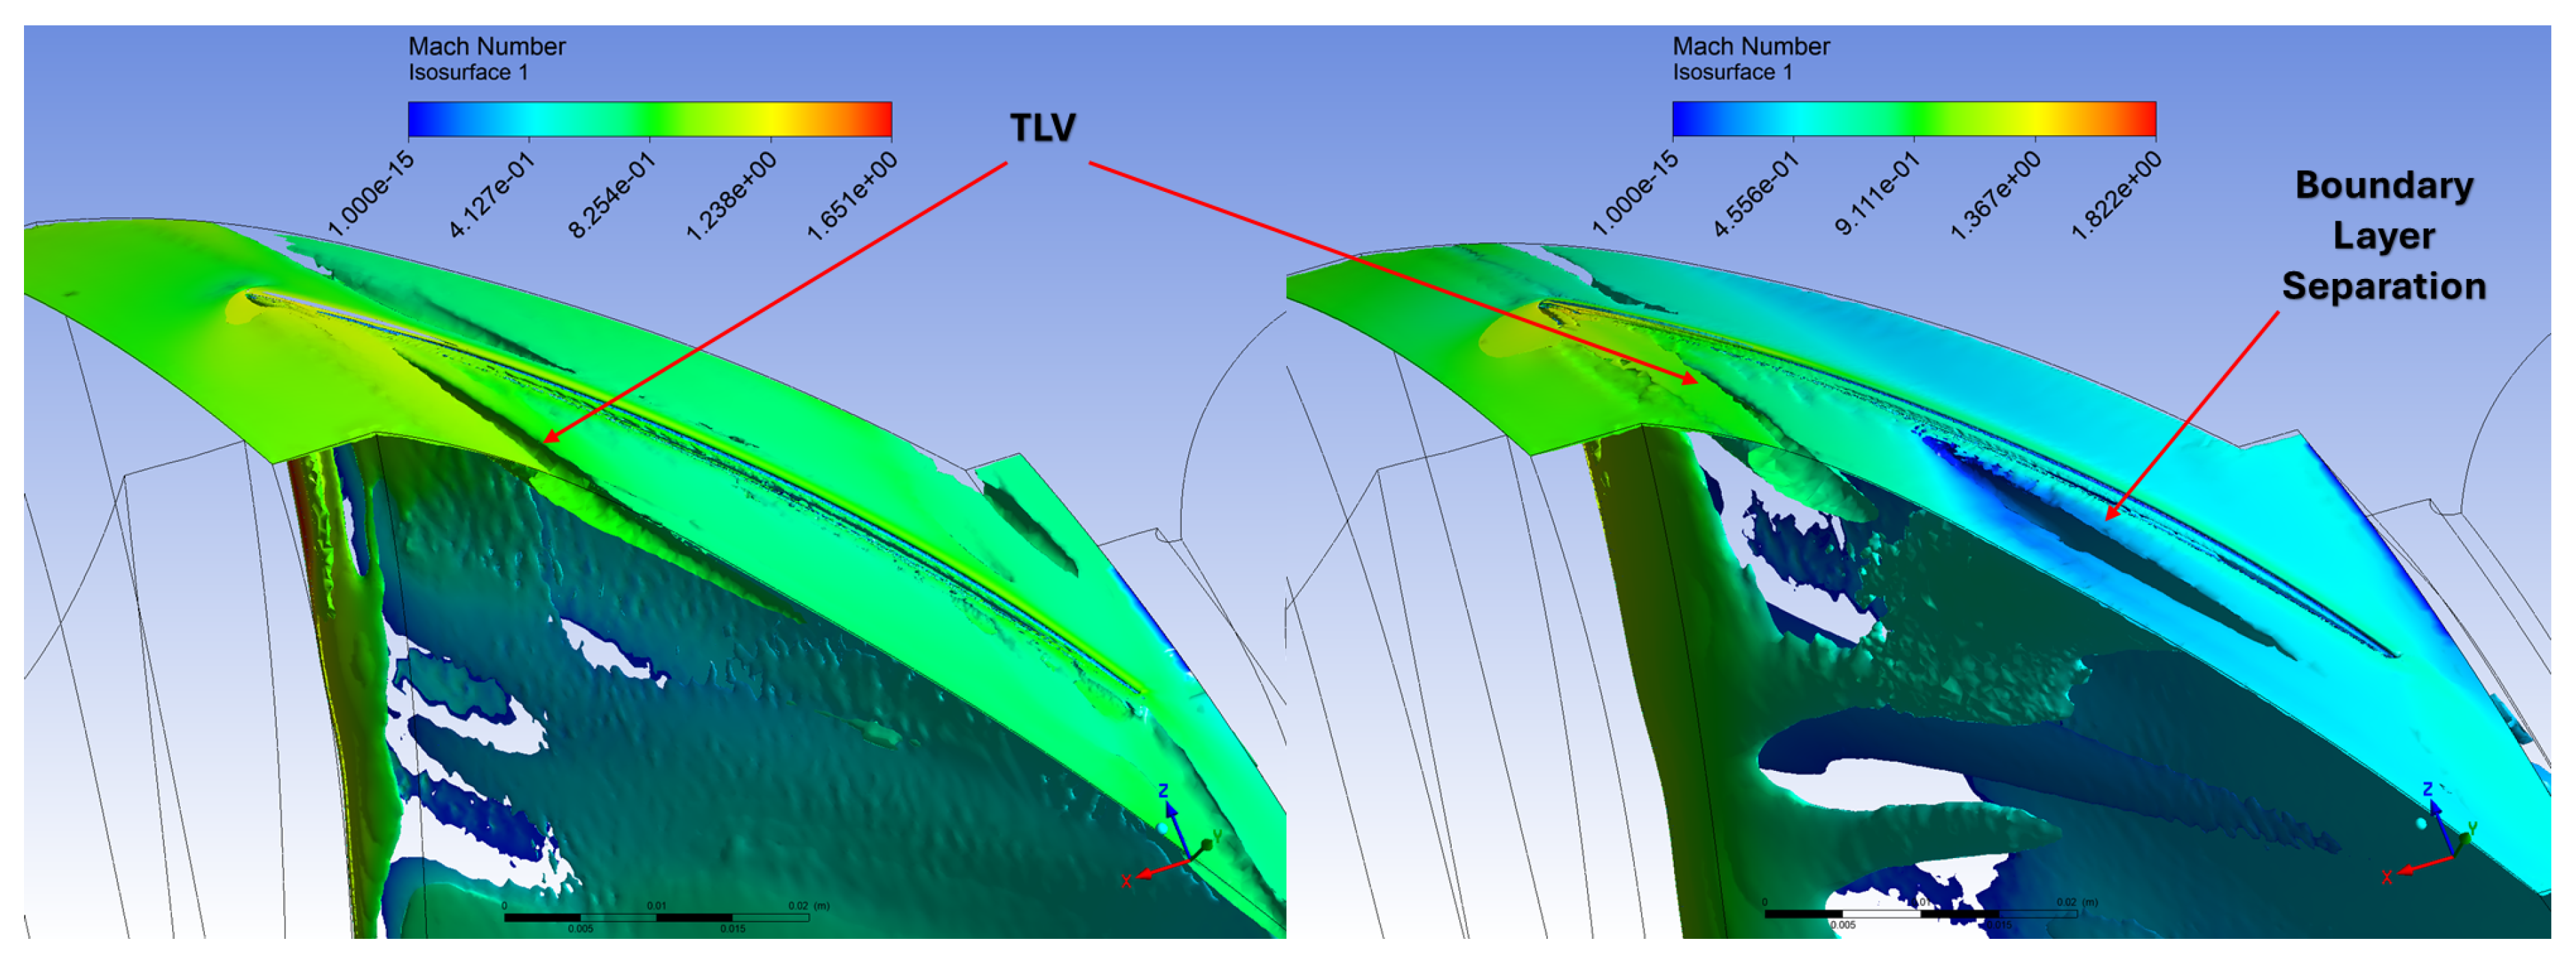
Figure 10.
Vortex locations at BEP (left) and near stall (right) at 99% span. Side view.
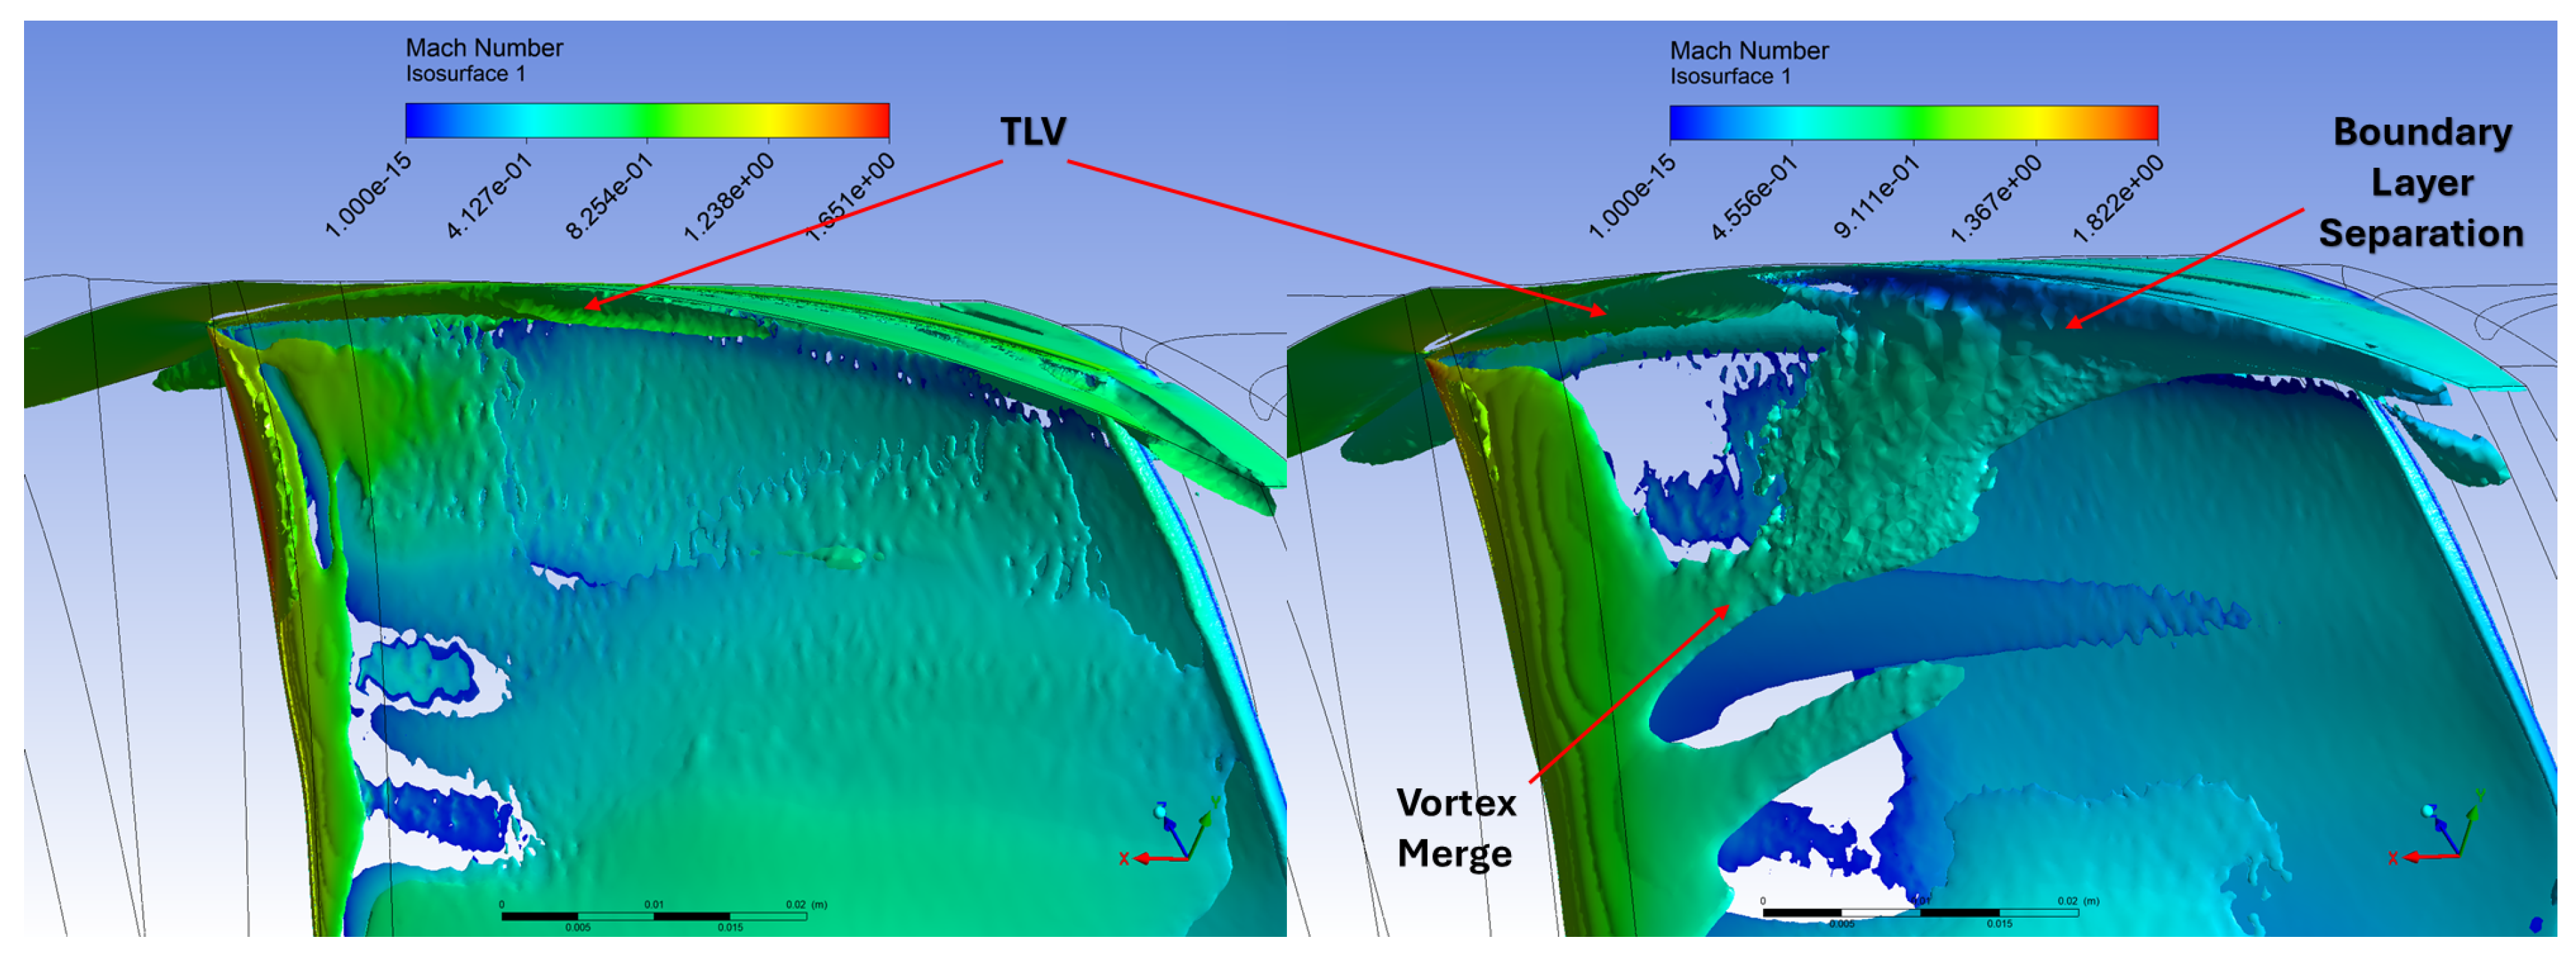
Figure 11.
Vortex locations at BEP (left) and near stall (right) at 99% span. Trailing edge view.
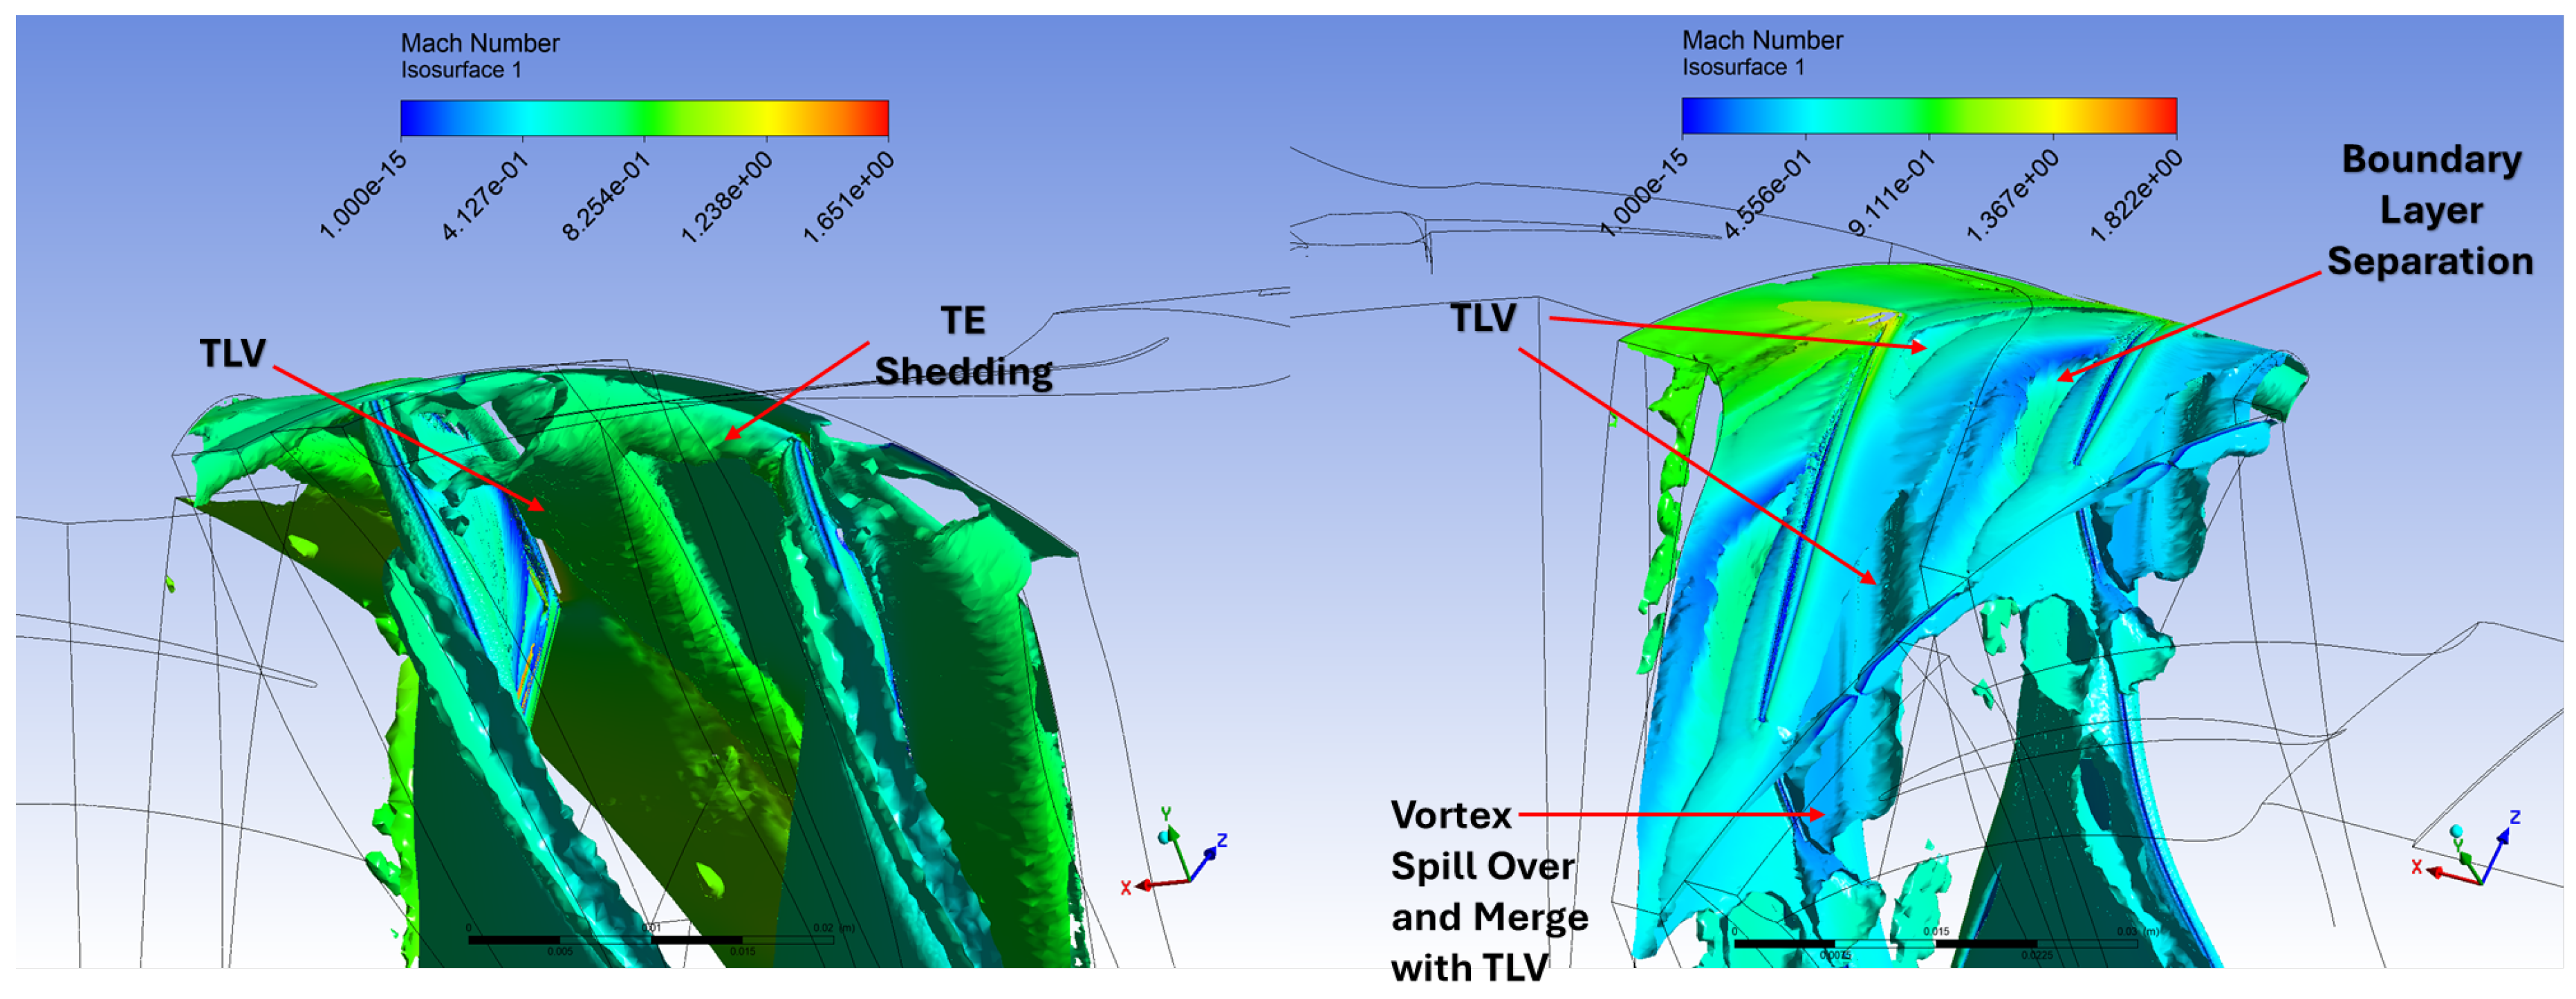
Figure 12.
Relative Mach distribution near stall with smooth casing (left) and flow control casing (right) installed at 99% span.
Figure 12.
Relative Mach distribution near stall with smooth casing (left) and flow control casing (right) installed at 99% span.
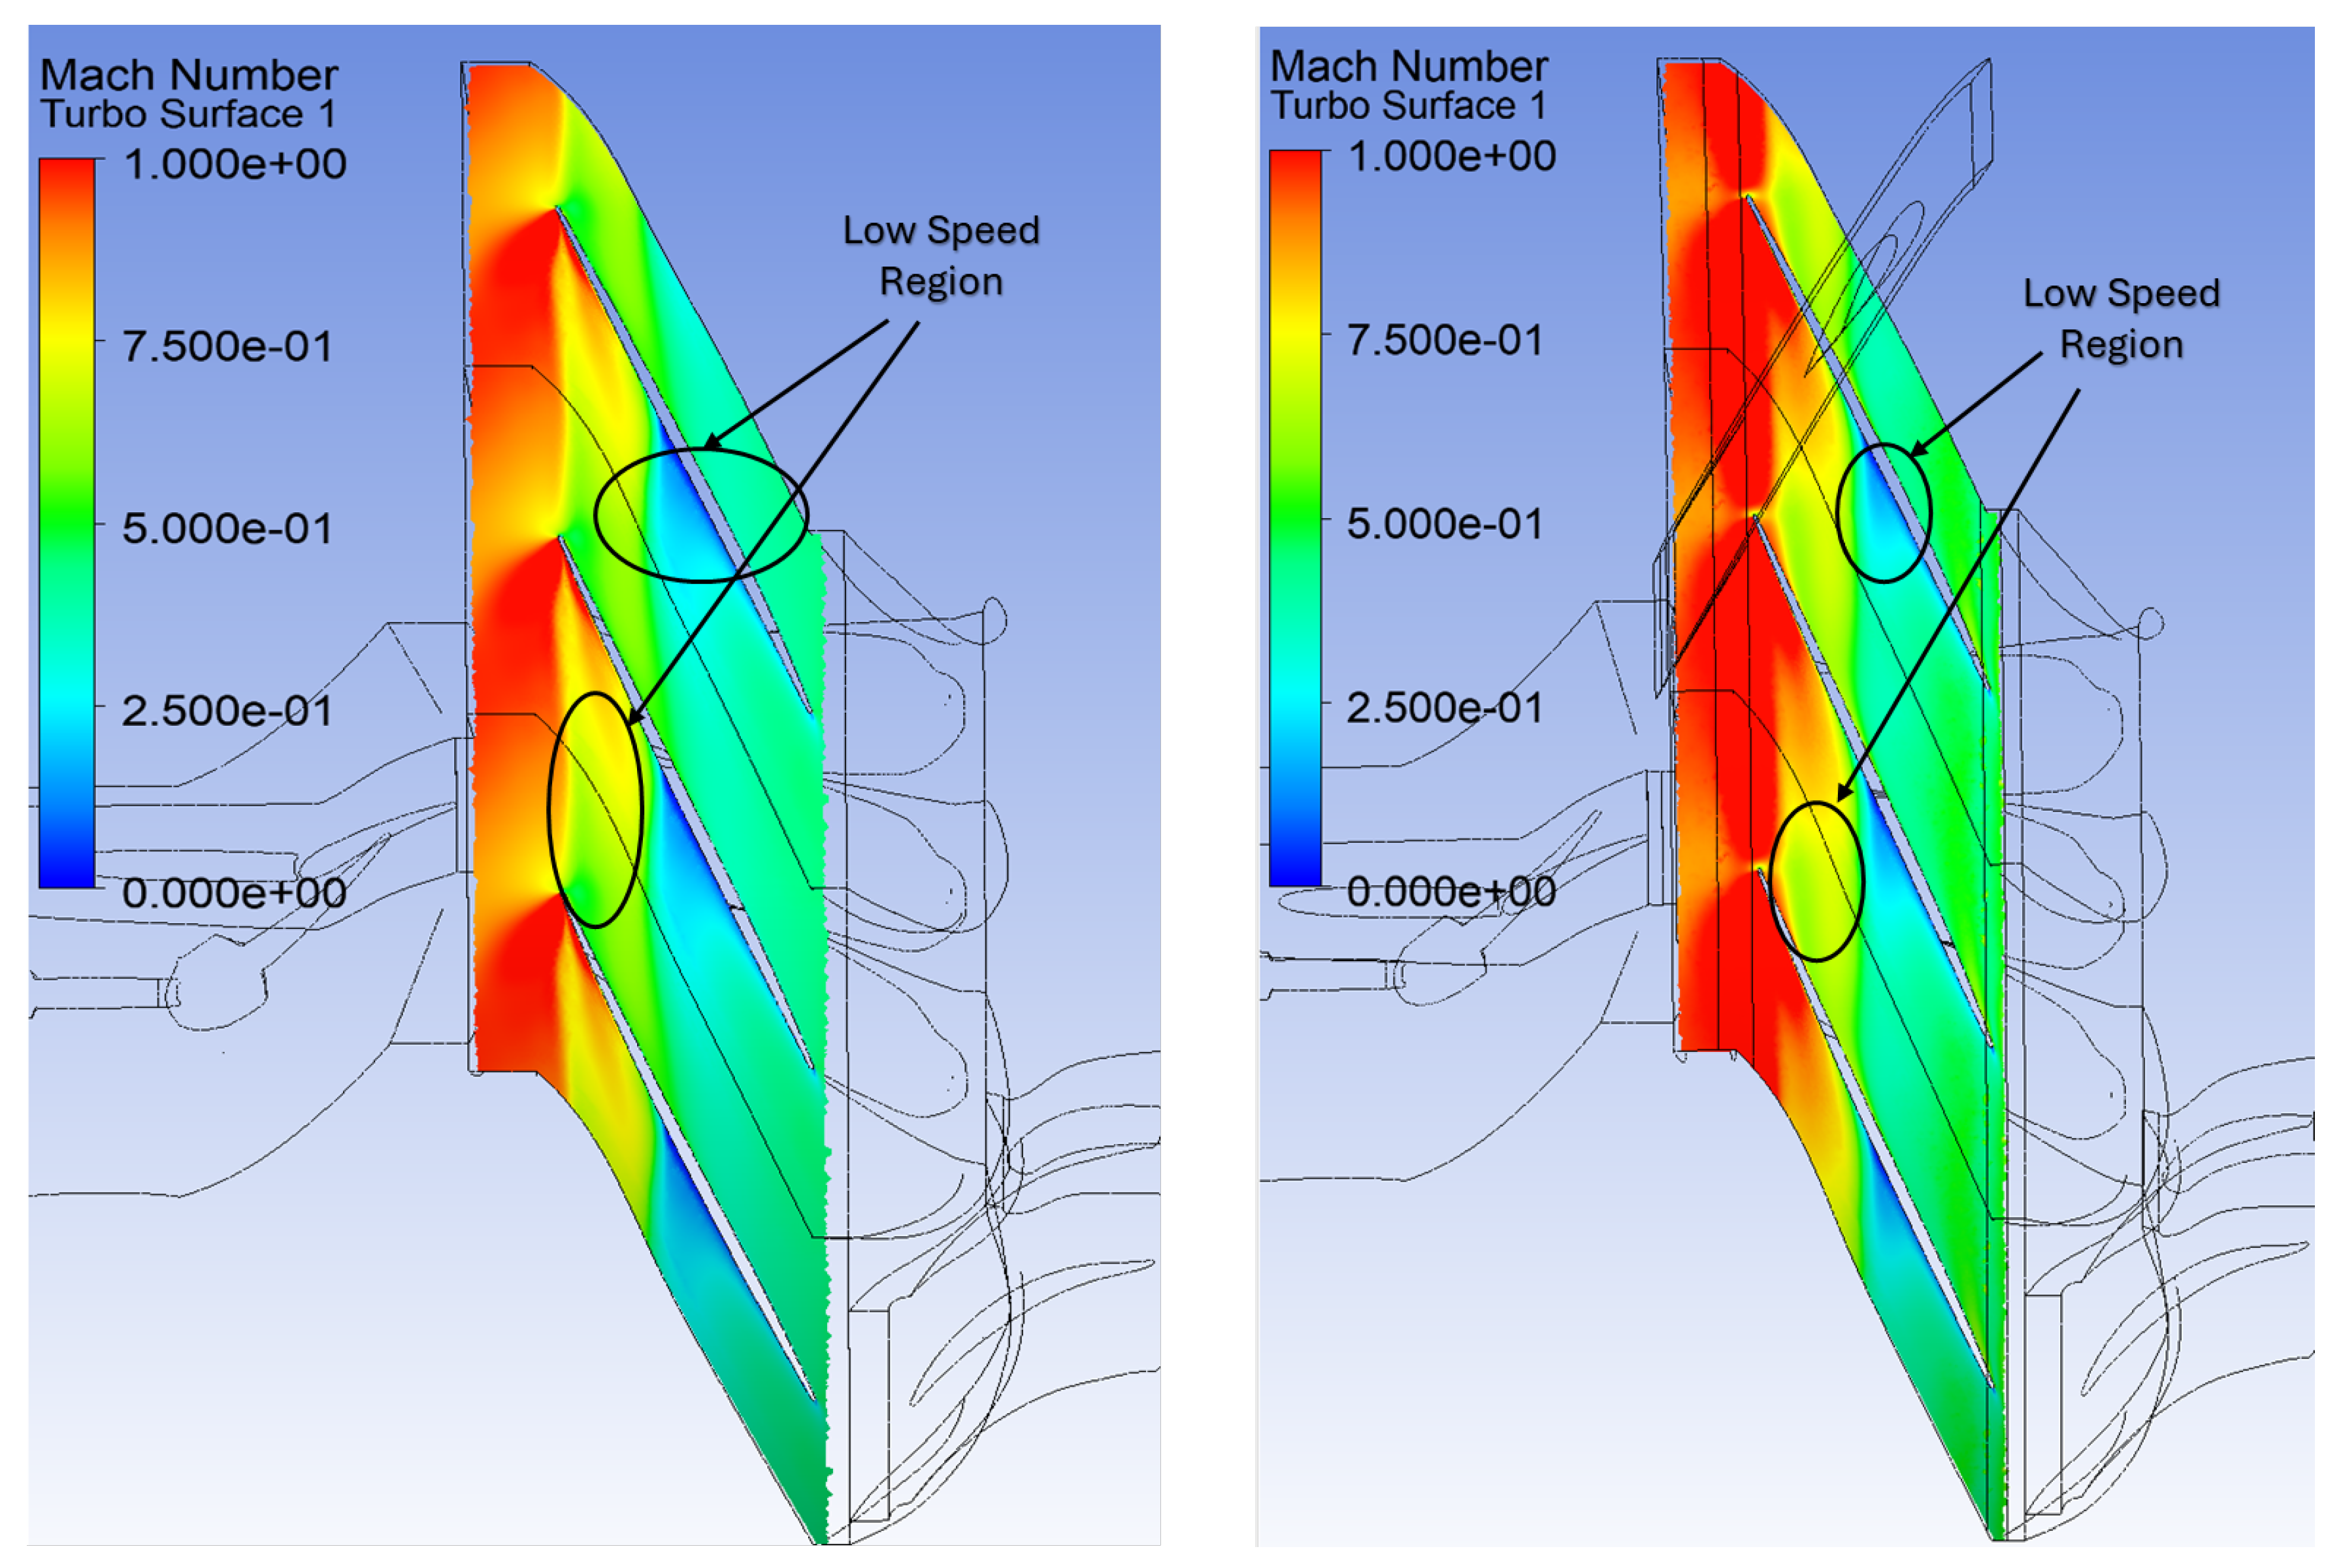
Figure 13.
Axial velocity reversal near stall with smooth casing (left) and flow control casing (right) installed at 99% span.
Figure 13.
Axial velocity reversal near stall with smooth casing (left) and flow control casing (right) installed at 99% span.
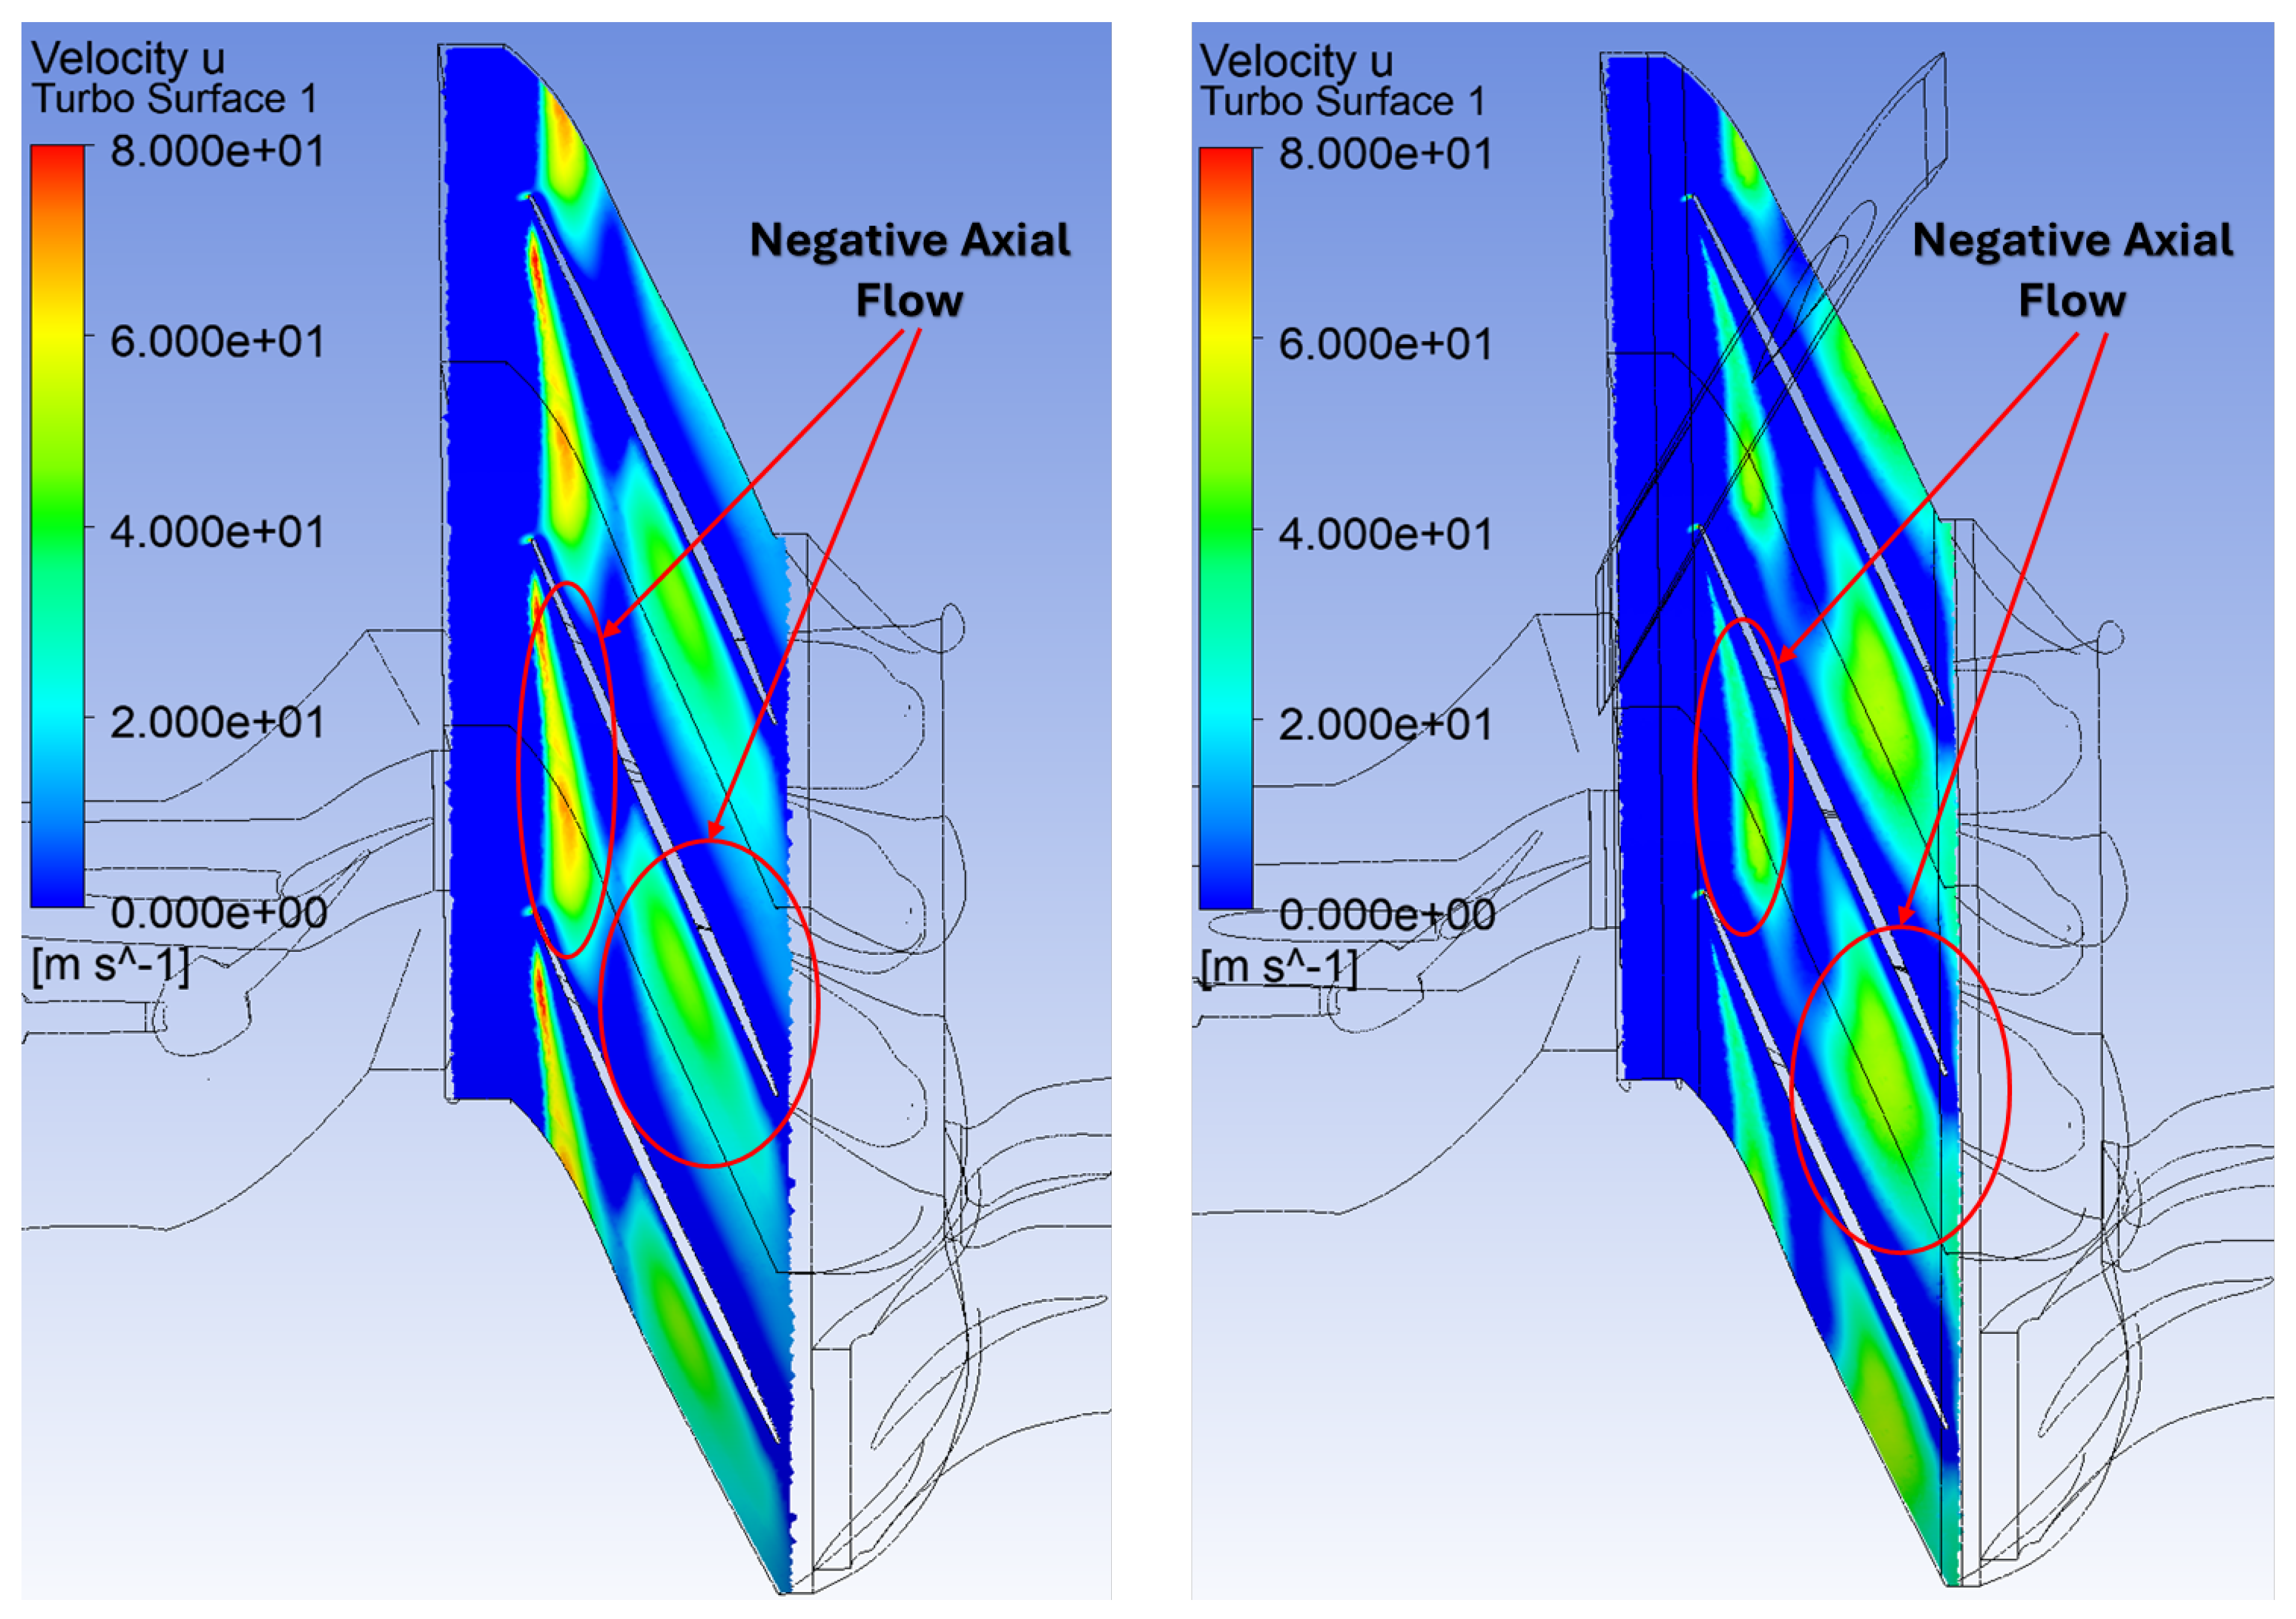
Figure 14.
Vortex locations near stall with smooth casing (left) and flow control casing (right) installed at 99% span. Overhead view.
Figure 14.
Vortex locations near stall with smooth casing (left) and flow control casing (right) installed at 99% span. Overhead view.
Figure 15.
Vortex locations near stall with smooth casing (left) and flow control casing (right) installed at 99% span. Side view.
Figure 15.
Vortex locations near stall with smooth casing (left) and flow control casing (right) installed at 99% span. Side view.
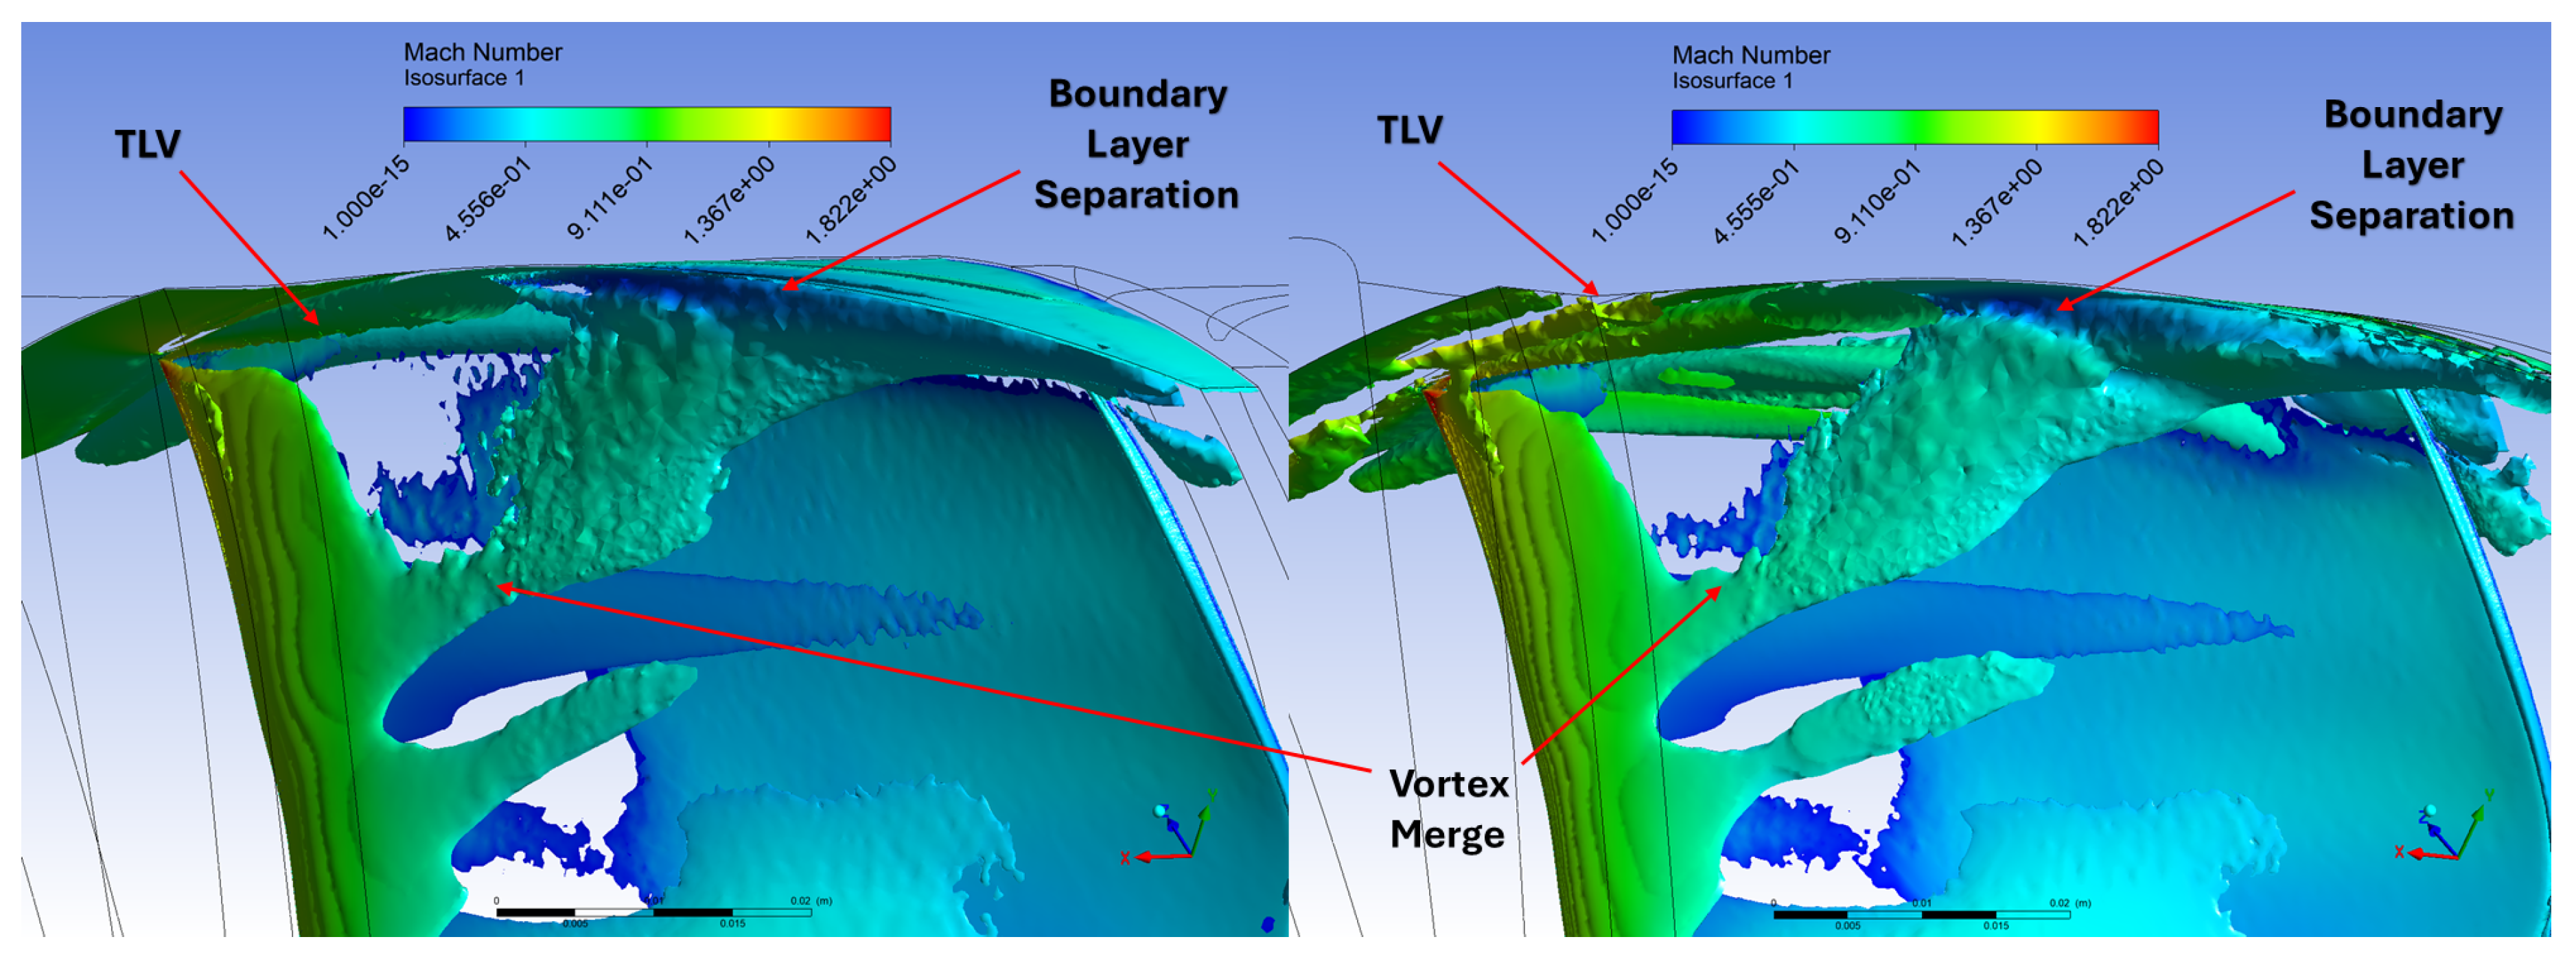
Figure 16.
Vortex locations near stall with smooth casing (left) and flow control casing (right) installed at 99% span. Trailing edge view.
Figure 16.
Vortex locations near stall with smooth casing (left) and flow control casing (right) installed at 99% span. Trailing edge view.
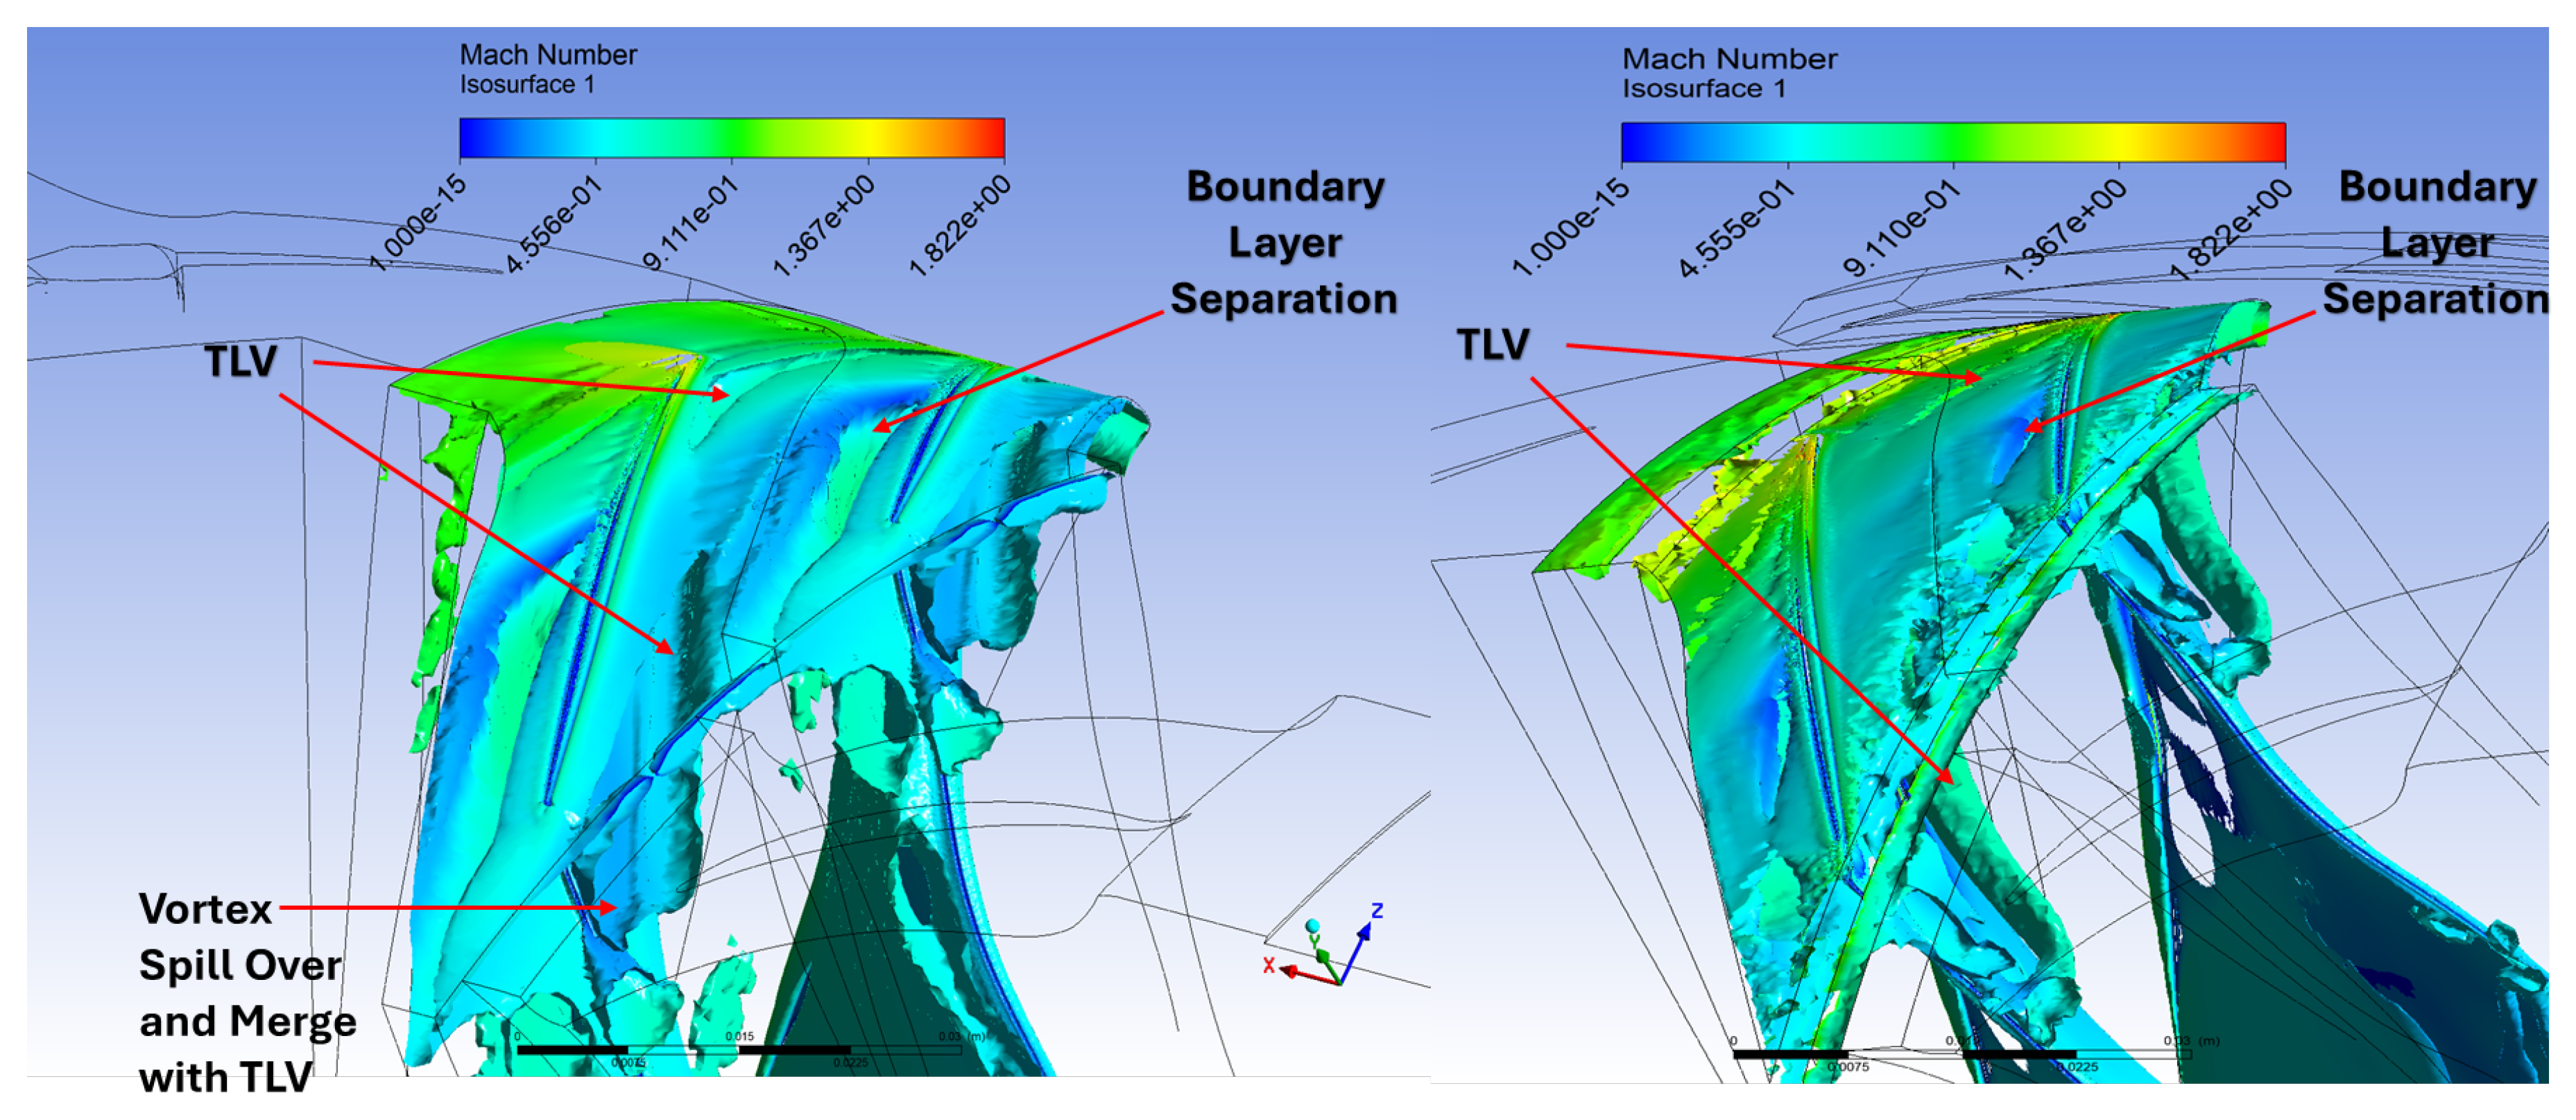

Table 1.
Rotor characteristics at 90% rated speed.
| Operating Speed | 27000 RPM |
| Radius | 143.51 mm |
| Tip Speed | 406 m/sec |
| Maximum Mass Flow Rate | 10.14 kg/sec |
| Tip Inlet Relative Mach Number | 1.52 |
| Maximum Pressure Ratio | 1.70 |
Disclaimer/Publisher’s Note: The statements, opinions and data contained in all publications are solely those of the individual author(s) and contributor(s) and not of MDPI and/or the editor(s). MDPI and/or the editor(s) disclaim responsibility for any injury to people or property resulting from any ideas, methods, instructions or products referred to in the content. |
© 2025 by the authors. Licensee MDPI, Basel, Switzerland. This article is an open access article distributed under the terms and conditions of the Creative Commons Attribution (CC BY) license (http://creativecommons.org/licenses/by/4.0/).
Copyright: This open access article is published under a Creative Commons CC BY 4.0 license, which permit the free download, distribution, and reuse, provided that the author and preprint are cited in any reuse.


