
Submitted:
10 March 2025
Posted:
11 March 2025
You are already at the latest version
Abstract
With the increasing occurrence of bacterial resistance, it is now essential to look for new alternatives to protect antibiotics curative utilization in One Health concept. Here we adapt and optimize a broth microdilution method and compare it against the broth macrodilution method for evaluating the antibacterial activity of a complex essential oils mix (EO mix) against 4 livestock pathogens Escherichia coli (E. coli), Bacillus cereus (B. cereus), Pseudomonas aeruginosa (P. aeruginosa) and Staphylococcus aureus (S. aureus. Microdilution method performance (final volume well: 300 µL; inoculum: 106 CFU/mL), was evaluated following CLSI recommendations, by comparing each MIC of each 4 strains, with each MIC’s obtained with macrodilution method (final volume tube: 2 mL; inoculum 106 CFU/mL). Microdilution was performed with automated plate reeder (Bioscreen C) and 3 bacterial growth parameters (OD max, lag phase, and growth rate) were calculated (Dmfit software). EO Mix MICs were determined for E. coli, S. aureus and B. cereus. Our results emphasize the importance of ensuring the accuracy of MIC results by performing 3 technical and 3 biological replicates, and combining OD max, lag phase, and growth rate to assess the impact of an EO mix at sub-MIC levels.
Keywords:
Essential oils
; plants extracts
; antibacterial
; microplate screening method
1. Introduction
Antibiotics have revolutionized modern medicine, enabling treatment for life-threatening infections. However, with the increasing occurrence of bacterial resistance against current antibiotics, it has now become essential to look for newer substances or even alternative methods to compensate for decrease in antibiotic power [1] . In fact, the European Union Summary Report on Antimicrobial Resistance reported worrying proportions of multidrug-resistant Escherichia coli isolated from broilers (37.7%), turkeys (47.6%), pigs (28.8%), and veal calves (18.8%) in 2020–2021[1]. The use of individual or mixed essential oils (EOs) or other natural plant extracts emerges as a sustainable alternative solution to limit the use of antibiotics.
EOs have natural antibacterial, antimicrobial, antiviral, and antifungal activities that help protect the host plant [2,3]. However, little is known about the potential use of EOs in livestock. Findings in the relevant literature concern the effects of medicinal plant species in livestock disease without going deeper into the isolated effects of their individual bioactive compounds. There is also only limited data on EOs [4]. However, it is important to study the efficacy of EOs on livestock pathogens, as EOs have been proposed for use as an alternative treatment to antibiotics in order slow the emergence of resistant bacteria [5,6]. Livestock animals are vulnerable to intestinal infections, especially during the weaning period, but the available antibiotic treatments are losing efficacy due to rising antibiotic resistance.
Escherichia coli (E. coli), Staphylococcus aureus (S. aureus), Bacillus aureus (B. cereus) and Pseudomonas aeruginosa (P. aeruginosa) are commonly used as model organisms due to their diversity in cell morphologies and respiratory types, as well as their involvement in foodborne and/or zoonotic diseases. Several recent in vitro studies have demonstrated antibacterial action of EOs on many major foodborne pathogenic bacteria, e.g. E. coli [7], S. aureus [8], Salmonella [9], and Listeria spp. [10], that are also involved in diseases of livestock. P. aeruginosa is among the most abundant infectious microorganisms for animals and humans [4], causing respiratory infections such as pneumonia and enteric infections. Chickens are particularly vulnerable to intestinal infections caused by this zoonotic pathogen, and chicken carcasses and retail poultry products are a major vector of P. aeruginosa transmission to humans, especially after processing in abattoirs. Antibiotic resistance has made P. aeruginosa infection extremely difficult to treat [11]. B. cereus was identified as a sporulated model organism, as it is a known foodborne pathogen that produces enterotoxigenic toxins and has zoonotic potential due to its ubiquitous presence in soils [12]. S. aureus and E. coli cause diseases in monogastric animals from respiratory or intestinal infections to severe systemic infections [13] and have various implications in the processing and production of meat products [14]. Moreover, the formation of biofilms by S. aureus makes infections more challenging to treat [14].
Natural plant extracts are also widely used as nutritional additives to enhance growth parameters such as feed conversion, average daily gain, carcass quality, or milk yield [15], to decrease oxidative stress and inflammation, and to strengthen immunity [4]. In addition, all these mentioned effects work concomitantly with the prevention of enteropathies in farm animals [7]. The antibacterial and especially bacteriostatic action of phytogenic compounds have been demonstrated in vitro [16]. In vivo, their antimicrobial effect works by modifying the microflora ecosystem. Some EO compounds may selectively influence gut microflora. Cinnamaldehyde, for instance, was shown in vitro to be strongly inhibitory for coliform bacteria and E. coli [17].
Although many studies have explored the antibacterial effects of EOs, there is no standardized reference method, and no universally accepted indicators for repeatability and reproducibility. Tools for rapid and high-throughput screening of antibacterial natural plant extracts provide the means to quickly target livestock bacterial pathogens.
The CLSI [18,19] has standardized the agar dilution method to determine quantitative bactericidal activity of antibiotics. The CLSI has also issued recommended broth dilution methods for the determination of minimal inhibitory concentrations (MIC) [20] that use different principles to assess microbial growth or inhibition. MIC is defined as the lowest concentration of an antimicrobial agent that prevents visible growth of a microorganism in an agar or broth dilution susceptibility test [20]. Conventional methods such as disc diffusion method and dilution tube method can prove time-consuming and require large quantities of test materials, along with other problems. Furthermore, plants extracts such as EOs are barely miscible in aqueous solution, since sedimentation quickly becomes a problem, and the interpretation of test results remains subjective and sometimes complicated by the colored plants extracts.
A number of other antibacterial assays only give an approximation of bacterial growth as they are based on visual observation of turbidity [8], which give subjective results that may not be reproducible between different laboratories. To overcome these drawbacks, different methods were compared and an assay with modified dilution and agitation parameters to yield a ‘true’ MIC value was proposed along with more information on target-strain growth parameters. By challenging the substance tests and bacterial targets with standardized parameters of the MIC method, our protocol can give reproducible and meaningful results. In this study, a detailed description of the modified method of MIC determination that is sensitive, rapid, robust, reliable and automatable wqs presented, and it can be successfully used to assess the antibacterial properties of natural plant extracts/EOs. The aims of this study were: (i) to evaluate the antibacterial activity of a complex mix of EOs (EO mix) as an MIC based on by macrodilution and microdilution methods for Gram-positive (S. aureus, B. cereus) and Gram-negative bacteria (E. coli, P. aeruginosa), and (ii) to discuss and suggest recommendations for the use of the most appropriate or complementary methods and indicators for MIC determination by the microdilution method.
2. Materials and Methods
2.1. Composition of the EO Mix
The EO mix was provided by Phytosynthese (Mozac, France). It is a blend of natural EOs with antimicrobial activity against Gram-negative pathogens. Its composition was analyzed in triplicate using aThermo Fisher Trace 1300 gas chromatography (GC) system (Thermo Fischer Scientific, Waltham, MA) coupled to a Thermo Fisher ISQ LT mass spectrometry (MS) system (Thermo Fischer Scientific, Waltham, MA). Carrier gas was helium used at a flowrate of 1.5 mL/min. Column temperature was initially 40°C then gradually ramped up at 4.7°C/min to 250°C. Diluted 0.5 µL samples were injected. The components of the EO mix were identified by comparing their mass spectra against the NIST 5 library of mass spectra (National Institut of Standards and Technology, Gaithersburg, MD)
2.2. Bacterial Strains
The bacteria were obtained from the of VetAgro Sup (France) research-school collection. Four strains of Gram-negative bacteria [Escherichia coli (CIP 59.8T), Pseudomonas aeruginosa (ATCC 27853)] and two strains of gram-positive bacteria [Bacillus cereus (wild strain) and Staphylococcus aureus (ATCC 25923)] were used. Cultures of the bacteria were maintained in aliquots of MHB broth with glycerol (concentration?) at -80°C throughout the study, and used as stock cultures.
2.3. MIC by the Dilution Tube Method
All bacterial strains were tested for MIC determination using a broth dilution method following NCCLS protocols. Briefly, triplicate tubes containing 5 mL of MHB medium were added with EO mix diluted as follows: progressive dilutions of EO mix were prepared 2:1 in Mueller–Hinton (MH) broth from 1⁄2 (v/v) to 1/16384. An overnight culture of strain grown in MHB broth at 37°C was added to target a final concentration of 106 CFU/mL. Tubes were tightly capped, incubated at 37°C, and mixed by inversion. After 24h of incubation, the tubes were examined for visual inhibition of growth and a lack of color change of the MHB medium. MIC was defined as the lowest concentration of EO showing inhibition of visible growth (turbidity) and a lack of color change in the MHB medium compared with color of the controls.
2.4. MIC by the Automated Turbidimeter Measurements
The MIC of EO mix against E. coli, B. cereus, P. aeruginosa and S. aureus strains were determined using the broth microdilution method according to Kwieciński et al. (2009) [21]. All bacterial strains were incubated at 37°C in MH broth until the stationary growth phase was reached. A diluted bacterial suspension was added to a 100-well microtiter plate (Honeycomb microplate, Oy Growth Curves AB Ltd., Helsinki, Finland) at a final concentration of 106 CFU/mL based on spectrophotometric absorbance measured at 600 nm (Shimadzu, 1280 UV-VIS, China). Serial twofold dilutions of EO mix were prepared and added to each well to obtain a final concentration range from 5.0 to 0.005 μL/mL. All wells contained from 1% to 5% DMSO (v/v) to enhance the solubility of the EO mix. In addition, there were solvent controls (test bacteria and MH broth containing from 1% to 5% DMSO), bacterial controls (test bacteria and MH broth), blank controls (MH broth containing from 1% to 5% DMSO and corresponding concentrations of EO mix), blank solvent controls (MH broth containing from 1% to 5% DMSO) and blank medium controls (MH broth). All plates were incubated at 37°C for 24 h, and growth was evaluated by an automated turbidimeter (Bioscreen C, Labsystems, Helsinki, Finland). Optical density (OD) measurement at the 420–580 nm wavelength band was performed every 15 min after shaking for 20 s. MIC was defined as the lowest concentration of each antimicrobial agent for which there was no detectable growth for 24 h in liquid broth at 37°C.
Growth curves data were processed using the free DMFit curve-fitting software (v2.1; courtesy of the Institute of Food Research, Norwich, UK) and the function developed by Baranyi et al (1993) [22]. EO mix MIC/2 was the EO mix concentration where we observed bacterial growth recovery. Mathematical analysis enabled the determination of three growth parameters: ODmax data, which gives the maximum increases in OD during incubation, maximum growth rate (μmax), which occurs in the early exponential growth phase, and lag time (Lag T), which is time lapse before an OD increase as per Baranyi et al.’s (1993) function [22]. Extension of the lag time was calculated using the formula given in Hayouni et al. (2008)[23].
2.5. Statistical Processing
For each bacteria strain, the comparison of the 3 growth parameters between EO mix MIC/2 assays versus negative controls were analyzed in XLStat® premium software v2023.3.1.1416 (Addinsoft, France) using non-parametric Mann-Whitney and Kruskal-Wallis tests (0.05 significant level).
3. Results
3.1. Composition of the EO Mix
The EO mix was composed of 15 natural components. The main components were thymol (37.29%), carvacrol (28.4%), geranial (8.33%), neral (5.43%), p-cymene
3.2. Comparison of the Macrodilution vs Microdilution Methods for the Determination of EO Mix MIC
EO mix MIC values were determined according to macrodilution and microdilution method for 3 out of 4 bacteria strains (Table 1). No EO mix MIC was determined for P. aeruginosa.
MIC values were not significantly different between the macrodilution and microdilution methods (p>0.05) except for the B. cereus strain (Table 1). MIC values were between 2.17x10² µg/mL and 1.39x10³ µg/mL (Table 1). Bacterial strains showed different susceptilities to the EO mix: S. aureus was the most EO mix-susceptible strain (EO mix MIC between 3.69x10² µg/mL and 3.92x10² µL/mL) and E. coli had the highest EO mix MIC (EO mix MIC between 5.21x10² µg/mL and 1.39E+03 µg/mL).
3.3. Growth Parameters of the Microdilution Method
Bacterial strains growth parameters, obtained with microdilution method were presented in Table 2 :
3.3.1. µmax
B. cereus, E. coli and S. aureus exposed to EO mix exhibited a significant decrease in growth rate (p<0.05) compared to their respective negative control (0.394 h-1 vs 3.457 h-1 for B. cereus, 0.660 h-1 vs 4.657 h-1 for E. coli and 0.579 h-1 vs 2.146 h-1 for S. aureus). For P. aeruginosa, no MIC could be determined and so no µmax could be calculated for sub-MIC. P. aeruginosa exhibited growth in all of the conditions tested. We were able to determine a µmax for P. aeruginosa in all of the conditions tested (see Appendix A Table 1). The µmax values of P. aeruginosa in technical replicates for each EO mix dilution were statistically compared against the controls (P. aeruginosa without EO mix): µmax values from dilution 1/10 to dilution 1/1280 were significantly different to µmax values of controls (p<0.005).
According to the means of the biological replicates (Table 2), there was no significant difference between µmax values of the 3 bacterial strains tested. However, E. coli tended to have higher µmax values than S. aureus and B. cereus.
3.3.2. lagT
B. cereus, E. coli and S. aureus exposed to EO mix exhibited a significantly higher lag time (p<0.05) compared to their respective negative controls (0.630 h vs 0.087 h for B. cereus, 0.546 h vs 0.068 h for E. coli, and 0.632 h vs 0.150 h for S. aureus) (Table 3). For P. aeruginosa, no MIC could be determined, and so no lagT could be calculated at sub-MIC. There was no significant difference in P. aeruginosa lag phase between EO mix assays and controls without EO mix (see Appendix A Table 1).
According to the means of the biological replicates (Table 2), the lag phase was longer for S. aureus than B. cereus and E. coli, but the between-strain differences were not statistically significant.
3.3.3. ODmax
After 24 h of the experiment, OD max values for B. cereus, E. coli and S. aureus exposed to EO mix were significantly lower (p<0.05) than their respective negative control OD max values (Table 3). OD max values for B. cereus and E. coli decreased more than two-fold (0.300 vs 0.730 for B. cereus and 0.179 vs 0.864 for E. coli; Table 2). For P. aeruginosa, no MIC was determined and so no OD max could be calculated at sub-MIC. P. aeruginosa exhibited growth in all of the conditions tested. P. aeruginosa OD max values for 1/10, 1/80, 1/320, 1/640 and 1/1280 dilutions of EO mix were significantly different to control OD max (p<0.005; see Appendix A Table 1)
According to the means of biological replicates, OD max was higher for B. cereus than S. aureus and E. coli. OD max values were significantly different between E. coli and B. cereus (p<0.005) but not between E. coli and S. aureus or between B. cereus and S. aureus.
3.4. Technical and Statistical Comparison of the Two MIC Methods
3.4.1. Microdilution Method
Repeatability was -described based on the SD of technical replicates calculated for each growth parameter. The SD values for technical replicates ranged from 0.000 to 4.265 (Table 2).
For the lag phase of negative controls, SD values for technical replicates ranged from 0.000 to 0.053.
For the growth rate of negative controls, SD values for technical replicates ranged from 0.002 to 4.265. For the OD max of negative controls, SD values for technical replicates ranged from 0.001 to 0.127.
The DMFit model showed a low SD for technical replicates of all negative controls except the P. aeruginosa strain.
For the lag phase of strains with EO mix, SD values for technical replicates ranged from 0000 to 0515.
For the growth rate of strains with EO mix, SD values for technical replicates ranged from 0.006 to 3.306. For the OD max of strains with EO mix, SD values for technical replicates ranged from 0.001 to 0.343.
The R² values for growth-model technical replicates ranged from 31.48% to 99.50%. R² values for growth-model technical replicates of positive controls ranged from 81.72% to 99.53%. R² values for growth-model technical replicates of strains with EO mix ranged from 31.38% to 99.22%.
Reproducibility was evaluated based on the SD of biological replicates calculated for each growth parameter. The SD values for biological replicates ranged 0.011 to 2.509 (Table 2).
For the lag phase of negative controls, SD values for biological replicates ranged from 0.011 to 0.027. For the growth rate of negative controls, SD values for biological replicates ranged from 0.322 to 2.509. For the OD max of negative controls, SD values for biological replicates ranged from 0.023 to 0.071.
For the lag phase of strains with EO mix, SD values for biological replicates ranged from 0.083 to 0.407. For the growth rate of strains with EO mix, SD values for biological replicates ranged from 0.557 to 1.122. For the OD max of strains with EO mix, SD values for biological replicates ranged from 0.091 to 0.257.
The R² values for growth-model biological replicates ranged from 57.44% to 99.20%. R² values for growth-model biological replicates of positive controls ranged from 92.50% to 99.20%. R² values for growth-model biological replicates of strains with EO mix ranged from 57.44% to 87.90%.
3.4.2. Macrodilution Method
The reading of MIC results was determined by visible turbidity and by a spectrophotometer set to 600 nm. The high turbidity due to the EO mix affected the OD measurement. The MHB medium + EO mix of each dilution was used as blank to determine MIC, but it was higher than 1 unit for dilutions between 1/10 and 1/80, and so the turbidity due to bacterial growth could not be not well determined by spectrophotometry readings at a single wavelength for the dilutions between 1/10 and 1/80. However, for the following dilutions tested (i.e. from 1/160 to 1/ 10240), the OD of MHB medium + EO mix with MHB as blank was lower than 1 unit, making it possible to determine the turbidity due to bacterial growth based on spectrophotometry readings.
3.4.3. Comparison of the Macrodilution Method vs Microdilution Method
MIC values between the macrodilution method and the microdilution method were only significantly different for B. cereus.
3.5. Evaluation of the Effect of DMSO on Bacterial Growth
We investigated several effects of DMSO concentration on bacterial growth using 24h OD measurements (Figure 1). DMSO at 5% concentration impacted the growth of all bacterial strains (see Figure 1A, 1B, 1C and 1D). The growth rates of E. coli, S. aureus and P aeruginosa were less impacted by DMSO at 3% (Figure 1A, 1B, 1C). The growth of B. cereus was not impacted compared to B. cereus control at 3% DMSO concentration (Figure 1D). With DMSO 1%, the growth curves of E. coli and S. aureus were not different from their respective controls (Figure 1A and 1B). For P. aeruginosa with DMSO 1%, the growth curve exhibited the same OD max values as the control curve (up to 1.5 OD unit) (Figure 1C) but exponential-phase growth rate was greater in the control condition (Figure 1C). DMSO impacted all bacterial growth rates in a concentration-dependent manner.
4. Discussion
The EO mix MIC values found in this study had SDs from 65.3 to 795 for MIC values ranging from 217 µg/mL and 1390 µg/mL (Table 1). MIC determination by the eye could be difficult with the macrodilution method, especially with a colored antibacterial solution such as EO mix. This method would likely lead to different results between operators and biological replicates. Coloration and incomplete dissolution of the EO mix could also lead to increasing SDs with OD reads. Both dilution methods showed limits for MIC determination with colored antibacterial substances.
Nevertheless, the automated microdilution method allowed to calculate additional bacterial growth parameters such as growth rate, lag phase, and maximal OD value. DMFit was suitably able to determine the MIC and to give further information on strain growth in the presence of EO mix. The high R² from positive controls confirmed the robustness of the DMFit model in these cases. Maximal OD value and lag phase parameters were efficient when there is a significant growth (µmax>0).
DMSO was used in this study to solubilize the EO mix in MHB. DMSO impacted the growth of all model bacteria studied in a concentration-dependent manner (from 1% to 5%; Figure 1). The bacterial MICs found were from 217 to 1390 µL/mL for E. coli, B. cereus and S. aureus (Table 1). In these experimental conditions, DMSO proportions were between 0.001% and 0.008%: the effect of DMSO on bacterial growth did not affect the MIC results.
MIC values were only significantly different between the macrodilution method and the microdilution method for B. cereus (Table 1). The difference could be explained by several technical and/or biological reasons. Several technical and/or biological factors could explain this difference. B. cereus is a spore-forming, anaerobic, facultative, rod-shaped bacterium. Type of metabolism may impact the growth and thus the MIC of B. cereus depending on whether it is grown on the surface of an agar medium or in a tube in a broth medium. In previous experiments, we showed that B. cereus strains did not use the same metabolism for growth and are able to produce high concentrations of ethanol by metabolizing excess carbon (data not shown, personal source). B. cereus could potentially react differently to the EO mixture when it is grown in a microplate well than when it is grown in the microtube, as the microtube has a greater anaerobic zone.
The turbidity due to bacterial growth was not as visible as the color due to the EO mix, especially for dilutions between 1/10 and 1/80. Same problem occurred with spectrophotometer at a single wavelength; i.e. the color of the EO mix disturbed the OD measurement in dilutions from 1/10 to 1/80 (data not shown) [24,25]
The Bioscreen C reader measured OD in the 420–580 nm wavelength band and was able to detect bacterial growth more easily despite the high color of the EO mix. It thus enabled us to monitor P. aeruginosa growth in all dilutions tested and to determine all of the corresponding growth parameters.
The literature has identified other technical parameters that can affect MIC results (reference?). The adherence of EO to the polypropylene pipette tips could also affect the results (reference?). The emulsion of EO was critical and the agar microdilution, sonication and/or the use of emulsification agents such as DMSO, Tween 80, or Tween 20 were proposed to improve it. Hood et al (2003) [26] established an optimized broth dilution method, using 0.02% Tween 80 to emulsify the oils, and showed that it is as the most accurate method for testing the antimicrobial activity of hydrophobic and viscous EOs. The insolubility of EOs causes variability and instability of the OD measurement and the mixture [27]. With the microdilution method, we observed a decrease in OD during the first 2 hours that probably reflected partial sedimentation of the EO mix, but this phenomenon has no impact on MIC results. Zdoga. et al. (2001) [28] first observed this phenomenon when they mixed natural plant extracts with sterile water to make up a 2.5% DMSO/water/extract solution and found that the extracts precipitated from the solution. To overcome this problem, 100 mg of solid extract were prepared from aliquots on a separate polypropylene 96-well plate. The extracts were then dissolved in pure DMSO at an appropriate concentration and added to 95 µL sterile water on a sterile 96-well bioassay plate. We compared the MIC results after runs with continuous shaking vs discontinuous shaking and found no difference between the MIC results (data not shown). This was no agreement with Vanegas et al (2021) [29] who observed that constant agitation guaranteed continuous contact of oil with bacteria and improved the MIC results. This divergence between findings may be due to one of two reasons. First, we used DMSO whereas Vanegas et al (2021) [29] used Tween 80 that could be more efficient in terms of producing an emulsion. Second, the constant agitation may not have been high enough to limit sedimentation and thus did not modify our MIC results. Donadu et al (2021) [30] and Li et al (2015) [31] used Tween 80 in broth and Tween 20 in agar with concentrations of 0.5% (v/v) and observed good dispersion of the oils in liquid medium. Tan et al. (2015) [25] reported that the addition of Tween 80 may be a limitation to using solvents, and that the concentration of Tween 80 used could tend to be low, ranging from “a few drops” to 0.02% and up to 5% for less-polar polyphenols like flavonoids. Oils may require up to 10% Tween 80. Ghosh et al (2013) [32] applied sonication to the emulsion for 30 min and observed a reduction in droplet size and an incremental increase in stability of the emulsion. However, Chen et al. (2023) [27] found that the agar dilution method had better repeatability than microbroth dilution but some operations caused some deviation of repeatability for agar dilution. They concluded that the microbroth dilution method was suitable for determining MICs for EOs. Tan et al. (2015) [25] added that the agar dilution assay could be an alternative to broth microdilution for testing less-polar natural extracts.
Chen et al. (2023) [27] showed that different EOs have different solvent requirements for tests against different bacteria, are so the limit of the solvents should be evaluated before use. Here we tested graduated concentrations of DMSO on the target strains and found that, in our experimental conditions, between 0.001% and 0.008% DMSO had no impact on the growth of the bacterial strains, and that DMSO could be used to dissolve the EO mix.
EOs are hydrophobic and have high viscosity. These properties may reduce dilutability or cause unequal distribution of the oil through the medium, which would lead to separation of the oil–water phases [33] and the formation of micelles [34]. The antimicrobial activity of EOs could be related to their ability to form micelles, which is a microbially-inactive form [35]. By opposition, Man et al (2019) [36] showed that some formulas of colloid or micelle suspensions of EOs such as oregano, thyme or lemon oil, can have some antimicrobial activity. This suggests that size of the micelles is a critical factor for the antimicrobial action of EOs. Man, et al (2019) [36] proposed a protocol for preparing EOs in solution without emulsion solvents and only with water mixed overnight and sonicated.
The volatility of the EOs tested is a factor that could affect the MIC results. Indeed, EOs are very complex mixtures of volatile components, and so long incubation times may result in evaporation or decomposition of some of the components during the testing period, which makes it important to set up specific experimental conditions to avoid these phenomena [37]. It may also be useful quantify the active EO residues at the end of the incubation period, which could serve to evaluate the proportion of EO potentially complexed with the culture medium.
The culture medium is also a factor that could significantly affect the MIC results. In this study, we used MH broth because it is the medium most commonly used for broth and agar dilutions for the standardized (internationally accepted) method for the MIC determination of natural substances. However, Hulankova (2022)[38]compared BHI, TSB and MHB and concluded that the MHB is far from ideal for determining the antimicrobial properties of EOs. EOs MIC values were significantly lower in MHB for all the pathogens. This was probably due to an interaction of EOs components with starch and to reduced ability of the bacteria to repair cell damage in a nutrient-deficient medium. TSB seems to be the most suitable candidate reference medium for any future standard broth dilution method for Eos antimicrobial testing.
The literature has clearly identified the most important factors causing variance in MIC between studies, which included incubation conditions, culture media, and the use of emulsifiers or solvents . Balouiri et al. (2016) [39] also mentioned other factors, such as inoculum size and the end-points determined.
Several authors have shown that bacterial inoculum size affects MIC determination. Koutsoumanis. et al. (2005) [40] and Lambert et al. (2000) [35] showed that the level of inhibitor factor decreases with size of the inoculum. This suggests that MICs may depend on the concentration of the bacterial target encountered in the real situations [41]. Based on our results, the weak R² and high SD between the technical replicates and biological replicates for each bacterial strains MIC/2 (Table 2) could be explained by variability due to all of the factors listed above, but inoculum size could also play a major role. The heterogeneity of bacterial physiological state in the inoculum could also have an impact on the growth/no-growth boundary [42]. Tan et al. 2015 [25] added that regardless of the inoculum size used, the bacterial suspension should be used within 30 min after it has been adjusted, to avoid significant changes in cell numbers.
Of course, the growth/no-growth boundary is examined for the determined MIC, it is also possible to calculate the non-inhibitory concentration (NIC). Lambert et al. (2000) [35] defined NIC as the smallest concentration of inhibitory substance that observably slows normal growth. NIC is only observable with the automated method and it is an important indicator for evaluating the stage and timing of the bacteriostatic effect. In Supplementary data, we showed that the EO mix had an impact on the growth rate (µmax) of P. aeruginosa but not on the duration of its lag phase. Indeed, the lag phase of P. aeruginosa with the EO mix (at all concentrations tested) was not significantly different from the lag phase of P. aeruginosa controls (i.e. without EO mix). In addition, the growth of ps. aeruginosa in the presence of EO at dilutions from 1/10 to 1/320 was similar to that of the control without EO. Its growth rate decreased from 1/320th dilution of the EO mixture.
Microdilution-method MIC determination for EOs and plant extracts in general is a complex process. Many authors have worked with the CLSI recommendations and developed modified methods, with most of the effort focused on improving technical parameters. Other authors have focused on calculating parameters based on the OD, such as growth rate, compared to controls [41]. Vanegas et al. (2021) [29] reported that there are currently various in vitro approaches for evaluating the antimicrobial activity (MIC) of natural compounds, but despite the number of studies published, results fail to converge due to the fact that studies have used different methods that are not internationally standardized. Here we did not propose a new method per se, but rather a methodology for standardizing an antimicrobial screening method in each laboratory that could contribute to ultimately develop an international consensus method.
This study made it possible to determine the MIC of EOs via a reproducible and convenient high-throughput, time- and cost-effective method, as well as and the measurement uncertainty of MIC by microdilution method compared to macrodilution method. Moreover, we provided tools for characterizing the action of EO on bacterial growth, especially at sub-MIC EO concentrations. The combination of lag-phase duration, µmax and OD max values effectively detected growth or no-growth and identified which growth parameter(s) were affected by the EOs. Future experiments could focus on validation of the microdilution method on an anaerobic bacterial model. We also intend to explore other screening methods to prevent color issues of the EO mix and plant extracts.
The EO mix showed activity against 3 of the 4 model bacteria strains tested. Its composition was a blend of thymol, carvacrol, citral,p-cymene. Thymol and carvacrol, two phenolic isomers, have strong antibacterial activity against several bacterial strains [3,43,44]. At sub-MIC, carvacrol impacted both E. coli and B. cereus growth-curve kinetics that translated into lower OD max values [45]. These results are consistent with our study. In contrast, for calculated growth parameters, such as bacteriostatic effect, Pedreira et al (2024) [7] found a higher susceptibility to carvacrol for E. coli than B. cereus. Thymol and carvacrol have mainly been studied for their action against P. aeruginosa by inhibiting biofilm adherence and formation [46,47]. Maggini et al (2017) [48] found MICs values over than 0.5% (v:v) for P. aeruginosa exposed to oregano oil, with an oregano-oil composition of carvacrol >70% and thymol 21.5%. Given the composition of the EO mix studied here (see 3.1.), oregano MIC found by Maggini et al (2017) [48] was much higher than for the strongest EO mix concentration that we could have tested in our study, which explains why we were unable to find a EO mix MIC against P. aeruginosa. Citral also has well known antibacterial effects [49,50,51]. Citral inhibits bacterial growth in a species-dependent manner: B. cereus was shown to be more susceptible to lemongrass containing more than 70% citral compared to E. coli or S. aureus [52,53]. Furthermore, Gram-positive bacteria were found to be more susceptible to lemongrass than Gram-negative bacteria [54]. These results are consistent with our study, as the Gram-positive bacteria (B. cereus and S. aureus) showed higher susceptibility to the EO mix than the Gram-negative E. coli (Table 1). Our study is also consistent with the conclusions of Murbach et al (2014) [55]. Nevertheless, we were unable to determine MIC values for P. aeruginosa. P. aeruginosa is known to demonstrate greater tolerance to volatile compounds than other Gram-negative bacteria such as E. coli [56]. Note too that among several volatile compounds tested by Cox & Marckham (2007) [56], P. aeruginosa was susceptible to trans-cinnamaldehyde, which was absent from the EO mix tested here. The absence of exposure to trans-cinnamaldehyde could explain why P. aeruginosa showed no growth and gave no MIC here. In addition, Naik et al. (2010) [54] found no susceptibility of P. aeruginosa to citral-rich lemongrass. Interestingly, Liu et al (2021) [57] showed that thymol inhibits P. aeruginosa growth by permeabilization of the outer and inner membrane at an MIC of 0.25 mg/mL. The fact that we failed to find any MIC for P. aeruginosa in this experiment may be due to the fact that the EO mix only contained 37.29% of thymol.
However, exposure to the EO mix from 0.005 μL/mL to 5 μL/mL affected P. aeruginosa growth parameters in a heterogeneous way. Growth parameters showed lag phases of P. aeruginosa from 0.15±0.04 h to 0.42±0.09 h (Appendix A, Table 1) and OD max values that varied from 0.99±0.11 to 1.25±0.10. However, the lag-phase values and OD max values were not always significantly different (p<0.05) from control values, and differences were not proportional to EO mix dilutions. This suggested a heterogeneous adaptation of P. aeruginosa to different. Nevertheless, all concentrations of the EO mix led to a decrease in growth rate (from 4.01±0.60 h-1 to 1.03±0.20 h-1) compared to control growth rate (7.51±2.51 h-1). This proved that the EO mix was able to reduce P. aeruginosa growth at all concentrations even if its antibacterial effect was not enough to completely inhibit bacterial growth. Consequently, we were unable to determine a MIC for P. aeruginosa. P. aeruginosa is well known to be able to adapt and survive to various environmental stressors via a broad range of resistance mechanisms, often present in the same clinical isolate [58]. P. aeruginosa can mobilize molecular mechanisms, efflux pumps, transcription regulation, and quorum sensing in various ways to counteract the effects of antibacterial drugs. These capabilities confer P. aeruginosa various potential strategies for surviving against EOs, even when they are blended with various other molecules.
The modes of action of various EOs against various bacterial strains are well documented, but little is known about the complex effects of EO mixes on bacterial cells. In previous work using flow cytometry, we demonstrated the mode of action of another EO blend (similar to the EO mix her but containing cinnamaldehyde) against Gram-negative E. coli [16]. The association of about 9% thymol and 8% carvacrol in the mix demonstrated bacteriostatic activity against E. coli by membrane permeabilization and pH perturbations. Thymol and carvacrol are known to inactivate bacterial enzymes and proteins and they also have a global effect on DNA and protein synthesis at sub-MIC levels [59]. This mode of action could also explain the decrease in bacterial growth rate found with sub-MIC EO mix in this study (Table 2), as DNA and protein synthesis are key for cell growth. Furthermore, the sustained loss of ions or metabolites due to exposure to an EO can compromise microbial metabolism and lead to cell death [60]. This same mechanism may have led to the reduced growth rate and OD max values found here. Thymol and citral have been reported to target bacterial membranes and disrupt bacterial homeostasis in a Gram-negative strain [61,62]. In particular, exposure to thymol led to cell membrane depolarization, decreased intracellular ATP concentrations and lower pHi. Cell membrane depolarization was also studied in our previous work exposing E. coli to the complex EO mix [16] and confirmed thymol action on cell membrane depolarization. Several terpenes such as thymol, carvacrol, and p-cymene targeted membrane integrity in another way against Gram-negative strain: the effect reported is an increase in the level of reactive oxygen species (ROS) [63]. ROS are known to cause lipid peroxidation in cell membranes, which affects membrane permeabilization. This mechanism could also explain the decrease in OD max with exposure to the EO mix compared to control (Table 2), as OD max is directly correlated with bacterial concentration.
This study focused on the antibacterial activity of the EO mix rather than individual EO components. This choice was motivated by the fact that it would be too hard to unravel the complex synergistic, antagonist and/or additive effects of interactions between individual EO components [64], even with different essential oils [65]. There is increasing evidence of synergism between major and minor components within one EO but also between the major components themselves [66]. EO blends are expected to have synergies that will exert stronger antibacterial effects than individual EOs or their individual components [59,67]. In particular, thymol, carvacrol and eugenol at different combinations exhibit synergism or moderate synergism depending on their respective ratios [68,69]. In general, phenolic monoterpenes increase the bioactivities of other components in mixtures [70]. In particular, thymol and carvacrol exhibit antibacterial synergism or additive antibacterial effects against Gram-negative strains including E. coli, S. aureus, and P. aeruginosa [35,71]. A blend of carvacrol and p-cymene, which was one of the components of the EO mix studied here, exhibited synergistic effects against B. cereus [72], as did oregano oil associated with thymus oil [73]. Our study is consistent with this literature, as we found MIC values for these same bacterial strains with our EO mix composed of these related individual oils. This study points to the utility of exploring the activity of complex EO blends against several pathogenic bacterial strains.
5. Conclusions
This study statistically compared two in vitro methods, i.e. the macrodilution method and the microdilution method, for determining the MIC of a specific EO mix against 4 model pathogenic strains. Our experiments contribute to refining rules and tools for MIC interpretation, as well as providing further information on the effect of EOs on bacterial growth. This study represents one of the first attempts to specify the statistical parameters of a microdilution method to determine bacterial growth parameters (OD max, lag phase, and growth rate) and below the MIC of an EO mix. Our experiments clarified key technical specifications for determining the MIC of an EO mix. Our study emphasizes the importance of ensuring the accuracy of MIC results by:
- Performing three technical and three biological replicates using an automated system for accuracy
- Combining three growth parameters (OD max, lag phase, and growth rate) to assess the impact of an EO mix, particularly at sub-MIC levels.
We validated the in vitro antibacterial action on E. coli, B. cereus, S. aureus and P. aeruginosa of a specific EO mix that did not contain cinnamon oil, which is an oil known to have strong antimicrobial action. With our method, this EO mix showed bacterial inhibition on 3 out of 4 strains (based on MIC values) and exhibited significant action against growth of all 4 pathogens growth (based on growth parameters). In sub-MIC EO-mix conditions, E. coli, B. cereus and S. aureus showed increased lag phases and E. coli, B. cereus, S. aureus and P. aeruginosa showed decreased µmax. Analysis of bacterial growth parameters with our screening method helped to quantify the antibacterial effect of the EO mix. This work thus contributes to efforts to study the antibacterial effects of EOs via a robust and repeatable in vitro method. Repeatable methods that include combined growth parameters for screening pathogenic bacteria can help to discover new natural molecules and better formulate products of interest in phytogenics science. This effort could be crucial to help address the major global health challenges caused by antimicrobial resistance.
Supplementary Materials
The following supporting information can be downloaded at: Preprints.org, Table S1
Author Contributions
Conceptualization: Sylvain Kerros, Karine Fayolle and Claire Girard; Methodology, Karine Fayolle and Claire Girard.; Validation, Sylvain Kerros; Formal analysis: Pauline Lasfargues, Sahar Koteich, Karine Fayolle and Claire Girard; Investigation: Pauline Lasfargues, Sahar Koteich, Karine Fayolle and Claire Girard; Writing—original draft: Karine Fayolle and Claire Girard; Writing—review and editing: Sylvain Kerros, Karine Fayolle and Claire Girard; Funding acquisition: Sylvain Kerros, Karine Fayolle and Claire Girard. All authors have read and agreed to the published version of the manuscript.
Funding
This research was funded by PHYTOSYNTHESE (Mozac, France) with participation from Vegepolys.
Acknowledgments
This work is the result of a scientific collaboration between VetAgro Sup University (Lempdes, France) and PHYTOSYNTHESE (Mozac, France)
Conflicts of Interest
The authors declare that they have no known competing financial interests or personal relationships that could have appeared to influence the work reported in this paper
References
- Helmy, Y.A.; Taha-Abdelaziz, K.; Hawwas, H.A.E.-H.; Ghosh, S.; AlKafaas, S.S.; Moawad, M.M.M.; Saied, E.M.; Kassem, I.I.; Mawad, A.M.M. Antimicrobial Resistance and Recent Alternatives to Antibiotics for the Control of Bacterial Pathogens with an Emphasis on Foodborne Pathogens. Antibiotics 2023, 12, 274. [Google Scholar] [CrossRef] [PubMed]
- Faleiro, M.L. The Mode of Antibacterial Action of Essential Oils; 2011; Vol. 2. [Google Scholar]
- Burt, S. Essential Oils: Their Antibacterial Properties and Potential Applications in Foods—a Review. International Journal of Food Microbiology 2004, 94, 223–253. [Google Scholar] [CrossRef] [PubMed]
- Nehme, R.; Andrés, S.; Pereira, R.B.; Ben Jemaa, M.; Bouhallab, S.; Ceciliani, F.; López, S.; Rahali, F.Z.; Ksouri, R.; Pereira, D.M.; et al. Essential Oils in Livestock: From Health to Food Quality. Antioxidants 2021, 10, 330. [Google Scholar] [CrossRef] [PubMed]
- Mittal, R.P.; Rana, A.; Jaitak, V. Essential Oils: An Impending Substitute of Synthetic Antimicrobial Agents to Overcome Antimicrobial Resistance. CDT 2019, 20, 605–624. [Google Scholar] [CrossRef]
- Yap, P.S.X.; Yiap, B.C.; Ping, H.C.; Lim, S.H.E. Essential Oils, A New Horizon in Combating Bacterial Antibiotic Resistance. TOMICROJ 2014, 8, 6–14. [Google Scholar] [CrossRef]
- Franz, C.; Baser, K.; Windisch, W. Essential Oils and Aromatic Plants in Animal Feeding – a European Perspective. A Review. Flavour & Fragrance J 2010, 25, 327–340. [Google Scholar] [CrossRef]
- Bai, J.; Li, J.; Chen, Z.; Bai, X.; Yang, Z.; Wang, Z.; Yang, Y. Antibacterial Activity and Mechanism of Clove Essential Oil against Foodborne Pathogens. LWT 2023, 173, 114249. [Google Scholar] [CrossRef]
- Ojha, S.; Pandey, A.K.; Singh, P. Citrus Aurantifolia Essential Oil Composition, Bioactivity, and Antibacterial Mode of Action on Salmonella Enterica, a Foodborne Pathogen. Food Science and Engineering 2023, 75–88. [Google Scholar] [CrossRef]
- Milagres De Almeida, J.; Crippa, B.L.; Martins Alencar De Souza, V.V.; Perez Alonso, V.P.; Da Motta Santos Júnior, E.; Siqueira Franco Picone, C.; Prata, A.S.; Cirone Silva, N.C. Antimicrobial Action of Oregano, Thyme, Clove, Cinnamon and Black Pepper Essential Oils Free and Encapsulated against Foodborne Pathogens. Food Control 2023, 144, 109356. [Google Scholar] [CrossRef]
- Abd El-Ghany, W.A. Pseudomonas Aeruginosa Infection of Avian Origin: Zoonosis and One Health Implications. Vet World 2021, 2155–2159. [Google Scholar] [CrossRef]
- Hong, H.A.; To, E.; Fakhry, S.; Baccigalupi, L.; Ricca, E.; Cutting, S.M. Defining the Natural Habitat of Bacillus Spore-Formers. Research in Microbiology 2009, 160, 375–379. [Google Scholar] [CrossRef]
- Shtylla Kika, T.; Cocoli, S.; Ljubojević Pelić, D.; Puvača, N.; Lika, E.; Pelić, M. Colibacillosis in Modern Poultry Production. J Agron Technol Eng Manag 2023, 6, 975–987. [Google Scholar] [CrossRef]
- Song, M.; Tang, Q.; Ding, Y.; Tan, P.; Zhang, Y.; Wang, T.; Zhou, C.; Xu, S.; Lyu, M.; Bai, Y.; et al. Staphylococcus Aureus and Biofilms: Transmission, Threats, and Promising Strategies in Animal Husbandry. J Animal Sci Biotechnol 2024, 15, 44. [Google Scholar] [CrossRef] [PubMed]
- Niranjan, D.; Sridhar, N.B.; Chandra, U.S.; Manjunatha, S.S.; Borthakur, A.; Vinuta, M.H.; Mohan, B.R. Recent Perspectives of Growth Promoters in Livestock: An Overview. JLivestSci 2023, 14, 53–64. [Google Scholar] [CrossRef]
- Girard, C.; Fayolle, K.; Kerros, S.; Leriche, F. Flow Cytometric Assessment of the Antimicrobial Properties of an Essential Oil Mixture against Escherichia Coli. Journal of Animal and Feed Sciences 2019, 28, 187–198. [Google Scholar] [CrossRef]
- Michiels, J.; Missotten, J.; Dierick, N.; Fremaut, D.; Maene, P.; De Smet, S. In Vitro Degradation and in Vivo Passage Kinetics of Carvacrol, Thymol, Eugenol and Trans -cinnamaldehyde along the Gastrointestinal Tract of Piglets. J Sci Food Agric 2008, 88, 2371–2381. [Google Scholar] [CrossRef]
- National Committee for Clinical Laboratory Standards, Wayne, PA Methods for Dilution Antimicrobial Susceptibility Tests for Bacteria That Grow Aerobically: Approved Standard 23; USA, 2003.
- MIC Testing Supplemental Tables: Approved Standard M100; USA.
- National Committee for Clinical Laboratory Standards, Wayne, PA Methods for Dilution Antimicrobial Susceptibility Tests for Bacteria That Grow Aerobically; Approved Standard M7-A6; USA, 2003.
- Kwieciński, J.; Eick, S.; Wójcik, K. Effects of Tea Tree (Melaleuca Alternifolia) Oil on Staphylococcus Aureus in Biofilms and Stationary Growth Phase. International Journal of Antimicrobial Agents 2009, 33, 343–347. [Google Scholar] [CrossRef]
- Baranyi, J.; McClure, P.J.; Sutherland, J.P.; Roberts, T.A. Modeling Bacterial Growth Responses. Journal of Industrial Microbiology 1993, 12, 190–194. [Google Scholar] [CrossRef]
- Hayouni, E.A.; Bouix, M.; Abedrabba, M.; Leveau, J.-Y.; Hamdi, M. Mechanism of Action of Melaleuca Armillaris (Sol. Ex Gaertu) Sm. Essential Oil on Six LAB Strains as Assessed by Multiparametric Flow Cytometry and Automated Microtiter-Based Assay. Food Chemistry 2008, 111, 707–718. [Google Scholar] [CrossRef]
- Ncube, N.S.; Afolayan, A.J.; Okoh, A.I. Assessment Techniques of Antimicrobial Properties of Natural Compounds of Plant Origin: Current Methods and Future Trends. Afr. J. Biotechnol. 2008, 7, 1797–1806. [Google Scholar] [CrossRef]
- Tan, C.; Wei, H.; Sun, H.; Ao, J.; Long, G.; Jiang, S.; Peng, J. Effects of Dietary Supplementation of Oregano Essential Oil to Sows on Oxidative Stress Status, Lactation Feed Intake of Sows, and Piglet Performance. BioMed Research International 2015, 2015, 1–9. [Google Scholar] [CrossRef]
- Hood, J.R.; Wilkinson, J.M.; Cavanagh, H.M.A. Evaluation of Common Antibacterial Screening Methods Utilized in Essential Oil Research. Journal of Essential Oil Research 2003, 15, 428–433. [Google Scholar] [CrossRef]
- Chen, Q.; You, N.; Liang, C.; Xu, Y.; Wang, F.; Zhang, B.; Zhang, P. Effect of Cellulose Nanocrystals-Loaded Ginger Essential Oil Emulsions on the Physicochemical Properties of Mung Bean Starch Composite Film. Industrial Crops and Products 2023, 191, 116003. [Google Scholar] [CrossRef]
- Zgoda, J.R.; Porter, J.R. A Convenient Microdilution Method for Screening Natural Products Against Bacteria and Fungi. Pharmaceutical Biology 2001, 39, 221–225. [Google Scholar] [CrossRef]
- Vanegas, D.; Abril-Novillo, A.; Khachatryan, A.; Jerves-Andrade, L.; Peñaherrera, E.; Cuzco, N.; Wilches, I.; Calle, J.; León-Tamariz, F. Validation of a Method of Broth Microdilution for the Determination of Antibacterial Activity of Essential Oils. BMC Res Notes 2021, 14, 439. [Google Scholar] [CrossRef]
- Donadu, M.G.; Peralta-Ruiz, Y.; Usai, D.; Maggio, F.; Molina-Hernandez, J.B.; Rizzo, D.; Bussu, F.; Rubino, S.; Zanetti, S.; Paparella, A.; et al. Colombian Essential Oil of Ruta Graveolens against Nosocomial Antifungal Resistant Candida Strains. JoF 2021, 7, 383. [Google Scholar] [CrossRef]
- Li, W.; Chen, H.; He, Z.; Han, C.; Liu, S.; Li, Y. Influence of Surfactant and Oil Composition on the Stability and Antibacterial Activity of Eugenol Nanoemulsions. LWT - Food Science and Technology 2015, 62, 39–47. [Google Scholar] [CrossRef]
- Ghosh, V.; Saranya, S.; Mukherjee, A.; Chandrasekaran, N. Cinnamon Oil Nanoemulsion Formulation by Ultrasonic Emulsification: Investigation of Its Bactericidal Activity. j. nanosci. nanotech. 2013, 13, 114–122. [Google Scholar] [CrossRef]
- Golus, J.; Sawicki, R.; Widelski, J.; Ginalska, G. The Agar Microdilution Method - a New Method for Antimicrobial Susceptibility Testing for Essential Oils and Plant Extracts. J Appl Microbiol 2016, 121, 1291–1299. [Google Scholar] [CrossRef]
- Kalemba, D.; Kunicka, A. Antibacterial and Antifungal Properties of Essential Oils. CMC 2003, 10, 813–829. [Google Scholar] [CrossRef]
- Lambert, R.J.W.; Skandamis, P.N.; Coote, P.J.; Nychas, G.-J.E. A Study of the Minimum Inhibitory Concentration and Mode of Action of Oregano Essential Oil, Thymol and Carvacrol. J Appl Microbiol 2001, 91, 453–462. [Google Scholar] [CrossRef] [PubMed]
- Man, A.; Santacroce, L.; Iacob, R.; Mare, A.; Man, L. Antimicrobial Activity of Six Essential Oils Against a Group of Human Pathogens: A Comparative Study. Pathogens 2019, 8, 15. [Google Scholar] [CrossRef]
- Reyes-Jurado, F.; Franco-Vega, A.; Ramírez-Corona, N.; Palou, E.; López-Malo, A. Essential Oils: Antimicrobial Activities, Extraction Methods, and Their Modeling. Food Eng Rev 2015, 7, 275–297. [Google Scholar] [CrossRef]
- Hulankova, R. The Influence of Liquid Medium Choice in Determination of Minimum Inhibitory Concentration of Essential Oils against Pathogenic Bacteria. Antibiotics 2022, 11, 150. [Google Scholar] [CrossRef]
- Balouiri, M.; Sadiki, M.; Ibnsouda, S.K. Methods for in Vitro Evaluating Antimicrobial Activity: A Review. Journal of Pharmaceutical Analysis 2016, 6, 71–79. [Google Scholar] [CrossRef]
- Koutsoumanis, K.P.; Sofos, J.N. Effect of Inoculum Size on the Combined Temperature, pH and Aw Limits for Growth of Listeria Monocytogenes. International Journal of Food Microbiology 2005, 104, 83–91. [Google Scholar] [CrossRef] [PubMed]
- Guillier, L.; Nazer, A.I.; Dubois-Brissonnet, F. Growth Response of Salmonella Typhimurium in the Presence of Natural and Synthetic Antimicrobials: Estimation of MICs from Three Different Models. Journal of Food Protection 2007, 70, 2243–2250. [Google Scholar] [CrossRef]
- Pascual, C.; Robinson, T.P.; Ocio, M.J.; Aboaba, O.O.; Mackey, B.M. The Effect of Inoculum Size and Sublethal Injury on the Ability of Listeria Monocytogenes to Initiate Growth under Suboptimal Conditions. Lett Appl Microbiol 2001, 33, 357–361. [Google Scholar] [CrossRef]
- Nostro, A.; Roccaro, A.S.; Bisignano, G.; Marino, A.; Cannatelli, M.A.; Pizzimenti, F.C.; Cioni, P.L.; Procopio, F.; Blanco, A.R. Effects of Oregano, Carvacrol and Thymol on Staphylococcus Aureus and Staphylococcus Epidermidis Biofilms. Journal of Medical Microbiology 2007, 56, 519–523. [Google Scholar] [CrossRef]
- Coccimiglio, J.; Alipour, M.; Jiang, Z.-H.; Gottardo, C.; Suntres, Z. Antioxidant, Antibacterial, and Cytotoxic Activities of the Ethanolic Origanum Vulgare Extract and Its Major Constituents. Oxidative Medicine and Cellular Longevity 2016, 2016, 1–8. [Google Scholar] [CrossRef]
- Pedreira, A.; Martínez-López, N.; Vázquez, J.A.; García, M.R. Modelling the Antimicrobial Effect of Food Preservatives in Bacteria: Application to Escherichia Coli and Bacillus Cereus Inhibition with Carvacrol. Journal of Food Engineering 2024, 361, 111734. [Google Scholar] [CrossRef]
- Tapia-Rodriguez, M.R.; Hernandez-Mendoza, A.; Gonzalez-Aguilar, G.A.; Martinez-Tellez, M.A.; Martins, C.M.; Ayala-Zavala, J.F. Carvacrol as Potential Quorum Sensing Inhibitor of Pseudomonas Aeruginosa and Biofilm Production on Stainless Steel Surfaces. Food Control 2017, 75, 255–261. [Google Scholar] [CrossRef]
- El, A.S.; Ibnsouda, K.S.; Latrache, H.; Zineb, G.; Mouradi, H.; Remmal, A. Carvacrol and Thymol Components Inhibiting Pseudomonas Aeruginosa Adherence and Biofilm Formation. Afr. J. Microbiol. Res. 2011, 5, 3229–3232. [Google Scholar] [CrossRef]
- Maggini, V.; Pesavento, G.; Maida, I.; Nostro, A.L.; Calonico, C.; Sassoli, C.; Perrin, E.; Fondi, M.; Mengoni, A.; Chiellini, C.; et al. Exploring the Effect of the Composition of Three Different Oregano Essential Oils on the Growth of Multidrug-Resistant Cystic Fibrosis Pseudomonas Aeruginosa Strains. Natural Product Communications 2017, 12, 1934578X1701201. [Google Scholar] [CrossRef]
- Adukwu, E.C.; Bowles, M.; Edwards-Jones, V.; Bone, H. Antimicrobial Activity, Cytotoxicity and Chemical Analysis of Lemongrass Essential Oil (Cymbopogon Flexuosus) and Pure Citral. Appl Microbiol Biotechnol 2016, 100, 9619–9627. [Google Scholar] [CrossRef] [PubMed]
- Alagawany, M.; El-Saadony, M.T.; Elnesr, S.S.; Farahat, M.; Attia, G.; Madkour, M.; Reda, F.M. Use of Lemongrass Essential Oil as a Feed Additive in Quail’s Nutrition: Its Effect on Growth, Carcass, Blood Biochemistry, Antioxidant and Immunological Indices, Digestive Enzymes and Intestinal Microbiota. Poultry Science 2021, 100, 101172. [Google Scholar] [CrossRef] [PubMed]
- Sharma, S.; Habib, S.; Sahu, D.; Gupta, J. Chemical Properties and Therapeutic Potential of Citral, a Monoterpene Isolated from Lemongrass. MC 2020, 17, 2–12. [Google Scholar] [CrossRef]
- Aiemsaard, J.; Aiumlamai, S.; Aromdee, C.; Taweechaisupapong, S.; Khunkitti, W. The Effect of Lemongrass Oil and Its Major Components on Clinical Isolate Mastitis Pathogens and Their Mechanisms of Action on Staphylococcus Aureus DMST 4745. Research in Veterinary Science 2011, 91, e31–e37. [Google Scholar] [CrossRef]
- Zulfa, Z.; Chia, C.T.; Rukayadi, Y. In Vitro Antimicrobial Activity of Cymbopogon Citratus (Lemongrass) Extracts against Selected Foodborne Pathogens. International Food Research Journal 2016, 23, 1262. [Google Scholar]
- Naik, M.I.; Fomda, B.A.; Jaykumar, E.; Bhat, J.A. Antibacterial Activity of Lemongrass (Cymbopogon Citratus) Oil against Some Selected Pathogenic Bacterias. Asian Pacific Journal of Tropical Medicine 2010, 3, 535–538. [Google Scholar] [CrossRef]
- Murbach Teles Andrade, B.F.; Nunes Barbosa, L.; Da Silva Probst, I.; Fernandes Júnior, A. Antimicrobial Activity of Essential Oils. Journal of Essential Oil Research 2014, 26, 34–40. [Google Scholar] [CrossRef]
- Cox, S.D.; Markham, J.L. Susceptibility and Intrinsic Tolerance of Pseudomonas Aeruginosa to Selected Plant Volatile Compounds. Journal of Applied Microbiology 2007, 103, 930–936. [Google Scholar] [CrossRef] [PubMed]
- Liu, T.; Kang, J.; Liu, L. Thymol as a Critical Component of Thymus Vulgaris L. Essential Oil Combats Pseudomonas Aeruginosa by Intercalating DNA and Inactivating Biofilm. LWT 2021, 136, 110354. [Google Scholar] [CrossRef]
- Moradali, M.F.; Ghods, S.; Rehm, B.H.A. Pseudomonas Aeruginosa Lifestyle: A Paradigm for Adaptation, Survival, and Persistence. Front. Cell. Infect. Microbiol. 2017, 7. [Google Scholar] [CrossRef] [PubMed]
- Barbosa, L.N.; Alves, F.C.B.; Andrade, B.F.M.T.; Albano, M.; Rall, V.L.M.; Fernandes, A.A.H.; Buzalaf, M.A.R.; Leite, A.D.L.; De Pontes, L.G.; Dos Santos, L.D.; et al. Proteomic Analysis and Antibacterial Resistance Mechanisms of Salmonella Enteritidis Submitted to the Inhibitory Effect of Origanum Vulgare Essential Oil, Thymol and Carvacrol. Journal of Proteomics 2020, 214, 103625. [Google Scholar] [CrossRef]
- Nazzaro, F.; Fratianni, F.; De Martino, L.; Coppola, R.; De Feo, V. Effect of Essential Oils on Pathogenic Bacteria. Pharmaceuticals 2013, 6, 1451–1474. [Google Scholar] [CrossRef]
- Tian, L.; Wang, X.; Liu, R.; Zhang, D.; Wang, X.; Sun, R.; Guo, W.; Yang, S.; Li, H.; Gong, G. Antibacterial Mechanism of Thymol against Enterobacter Sakazakii. Food Control 2021, 123, 107716. [Google Scholar] [CrossRef]
- Zhang, Y.; Wei, J.; Chen, H.; Song, Z.; Guo, H.; Yuan, Y.; Yue, T. Antibacterial Activity of Essential Oils against Stenotrophomonas Maltophilia and the Effect of Citral on Cell Membrane. LWT 2020, 117, 108667. [Google Scholar] [CrossRef]
- Luo, K.; Zhao, P.; He, Y.; Kang, S.; Shen, C.; Wang, S.; Guo, M.; Wang, L.; Shi, C. Antibacterial Effect of Oregano Essential Oil against Vibrio Vulnificus and Its Mechanism. Foods 2022, 11, 403. [Google Scholar] [CrossRef]
- Huang, X.; Lao, Y.; Pan, Y.; Chen, Y.; Zhao, H.; Gong, L.; Xie, N.; Mo, C.-H. Synergistic Antimicrobial Effectiveness of Plant Essential Oil and Its Application in Seafood Preservation: A Review. Molecules 2021, 26, 307. [Google Scholar] [CrossRef]
- Ji, J.; Shankar, S.; Fernandez, J.; Juillet, E.; Salmieri, S.; Lacroix, M. A Rapid Way of Formulation Development Revealing Potential Synergic Effects on Numerous Antimicrobial Combinations against Foodborne Pathogens. Microbial Pathogenesis 2021, 158, 105047. [Google Scholar] [CrossRef] [PubMed]
- Harris, R. Synergism in the Essential Oil World. International Journal of Aromatherapy 2002, 12, 179–186. [Google Scholar] [CrossRef]
- Singh, B.R.; Singh, V.; Singh, R.K.; Ebibeni, N. Antimicrobial Activity of Lemongrass (Cymbopogon Citratus) Oil against Microbes of Environmental, Clinical and Food Origin.
- Vale, L.; De Paula, L.G.F.; Vieira, M.S.; Alves, S.D.G.A.; Junior, N.R.D.M.; Gomes, M.D.F.; Teixeira, W.F.P.; Rizzo, P.V.; Freitas, F.M.C.; Ferreira, L.L.; et al. Binary Combinations of Thymol, Carvacrol and Eugenol for Amblyomma Sculptum Control: Evaluation of in Vitro Synergism and Effectiveness under Semi-Field Conditions. Ticks and Tick-borne Diseases 2021, 12, 101816. [Google Scholar] [CrossRef]
- Swetha, T.K.; Vikraman, A.; Nithya, C.; Hari Prasath, N.; Pandian, S.K. Synergistic Antimicrobial Combination of Carvacrol and Thymol Impairs Single and Mixed-Species Biofilms of Candida Albicans and Staphylococcus Epidermidis. Biofouling 2021, 1–16. [Google Scholar] [CrossRef]
- Bassolé, I.H.N.; Juliani, H.R. Essential Oils in Combination and Their Antimicrobial Properties. Molecules 2012, 17, 3989–4006. [Google Scholar] [CrossRef] [PubMed]
- Pei, R.; Zhou, F.; Ji, B.; Xu, J. Evaluation of Combined Antibacterial Effects of Eugenol, Cinnamaldehyde, Thymol, and Carvacrol against E. Coli with an Improved Method. Journal of Food Science 2009, 74. [Google Scholar] [CrossRef]
- Ultee, A.; Slump, R.A.; Steging, G.; Smid, E.J. Antimicrobial Activity of Carvacrol toward Bacillus Cereus on Rice. Journal of Food Protection 2000, 63, 620–624. [Google Scholar] [CrossRef]
- Ayari, S.; Shankar, S.; Follett, P.; Hossain, F.; Lacroix, M. Potential Synergistic Antimicrobial Efficiency of Binary Combinations of Essential Oils against Bacillus Cereus and Paenibacillus Amylolyticus-Part A. Microbial Pathogenesis 2020, 141, 104008. [Google Scholar] [CrossRef]
Figure 1.
24-h growth curves (OD) of (A) E. coli, (B) S. aureus, (C) P. aeruginosa, and (D) B. cereus at different DMSO concentrations (5%, 3%, 2%, 1%).
Figure 1.
24-h growth curves (OD) of (A) E. coli, (B) S. aureus, (C) P. aeruginosa, and (D) B. cereus at different DMSO concentrations (5%, 3%, 2%, 1%).
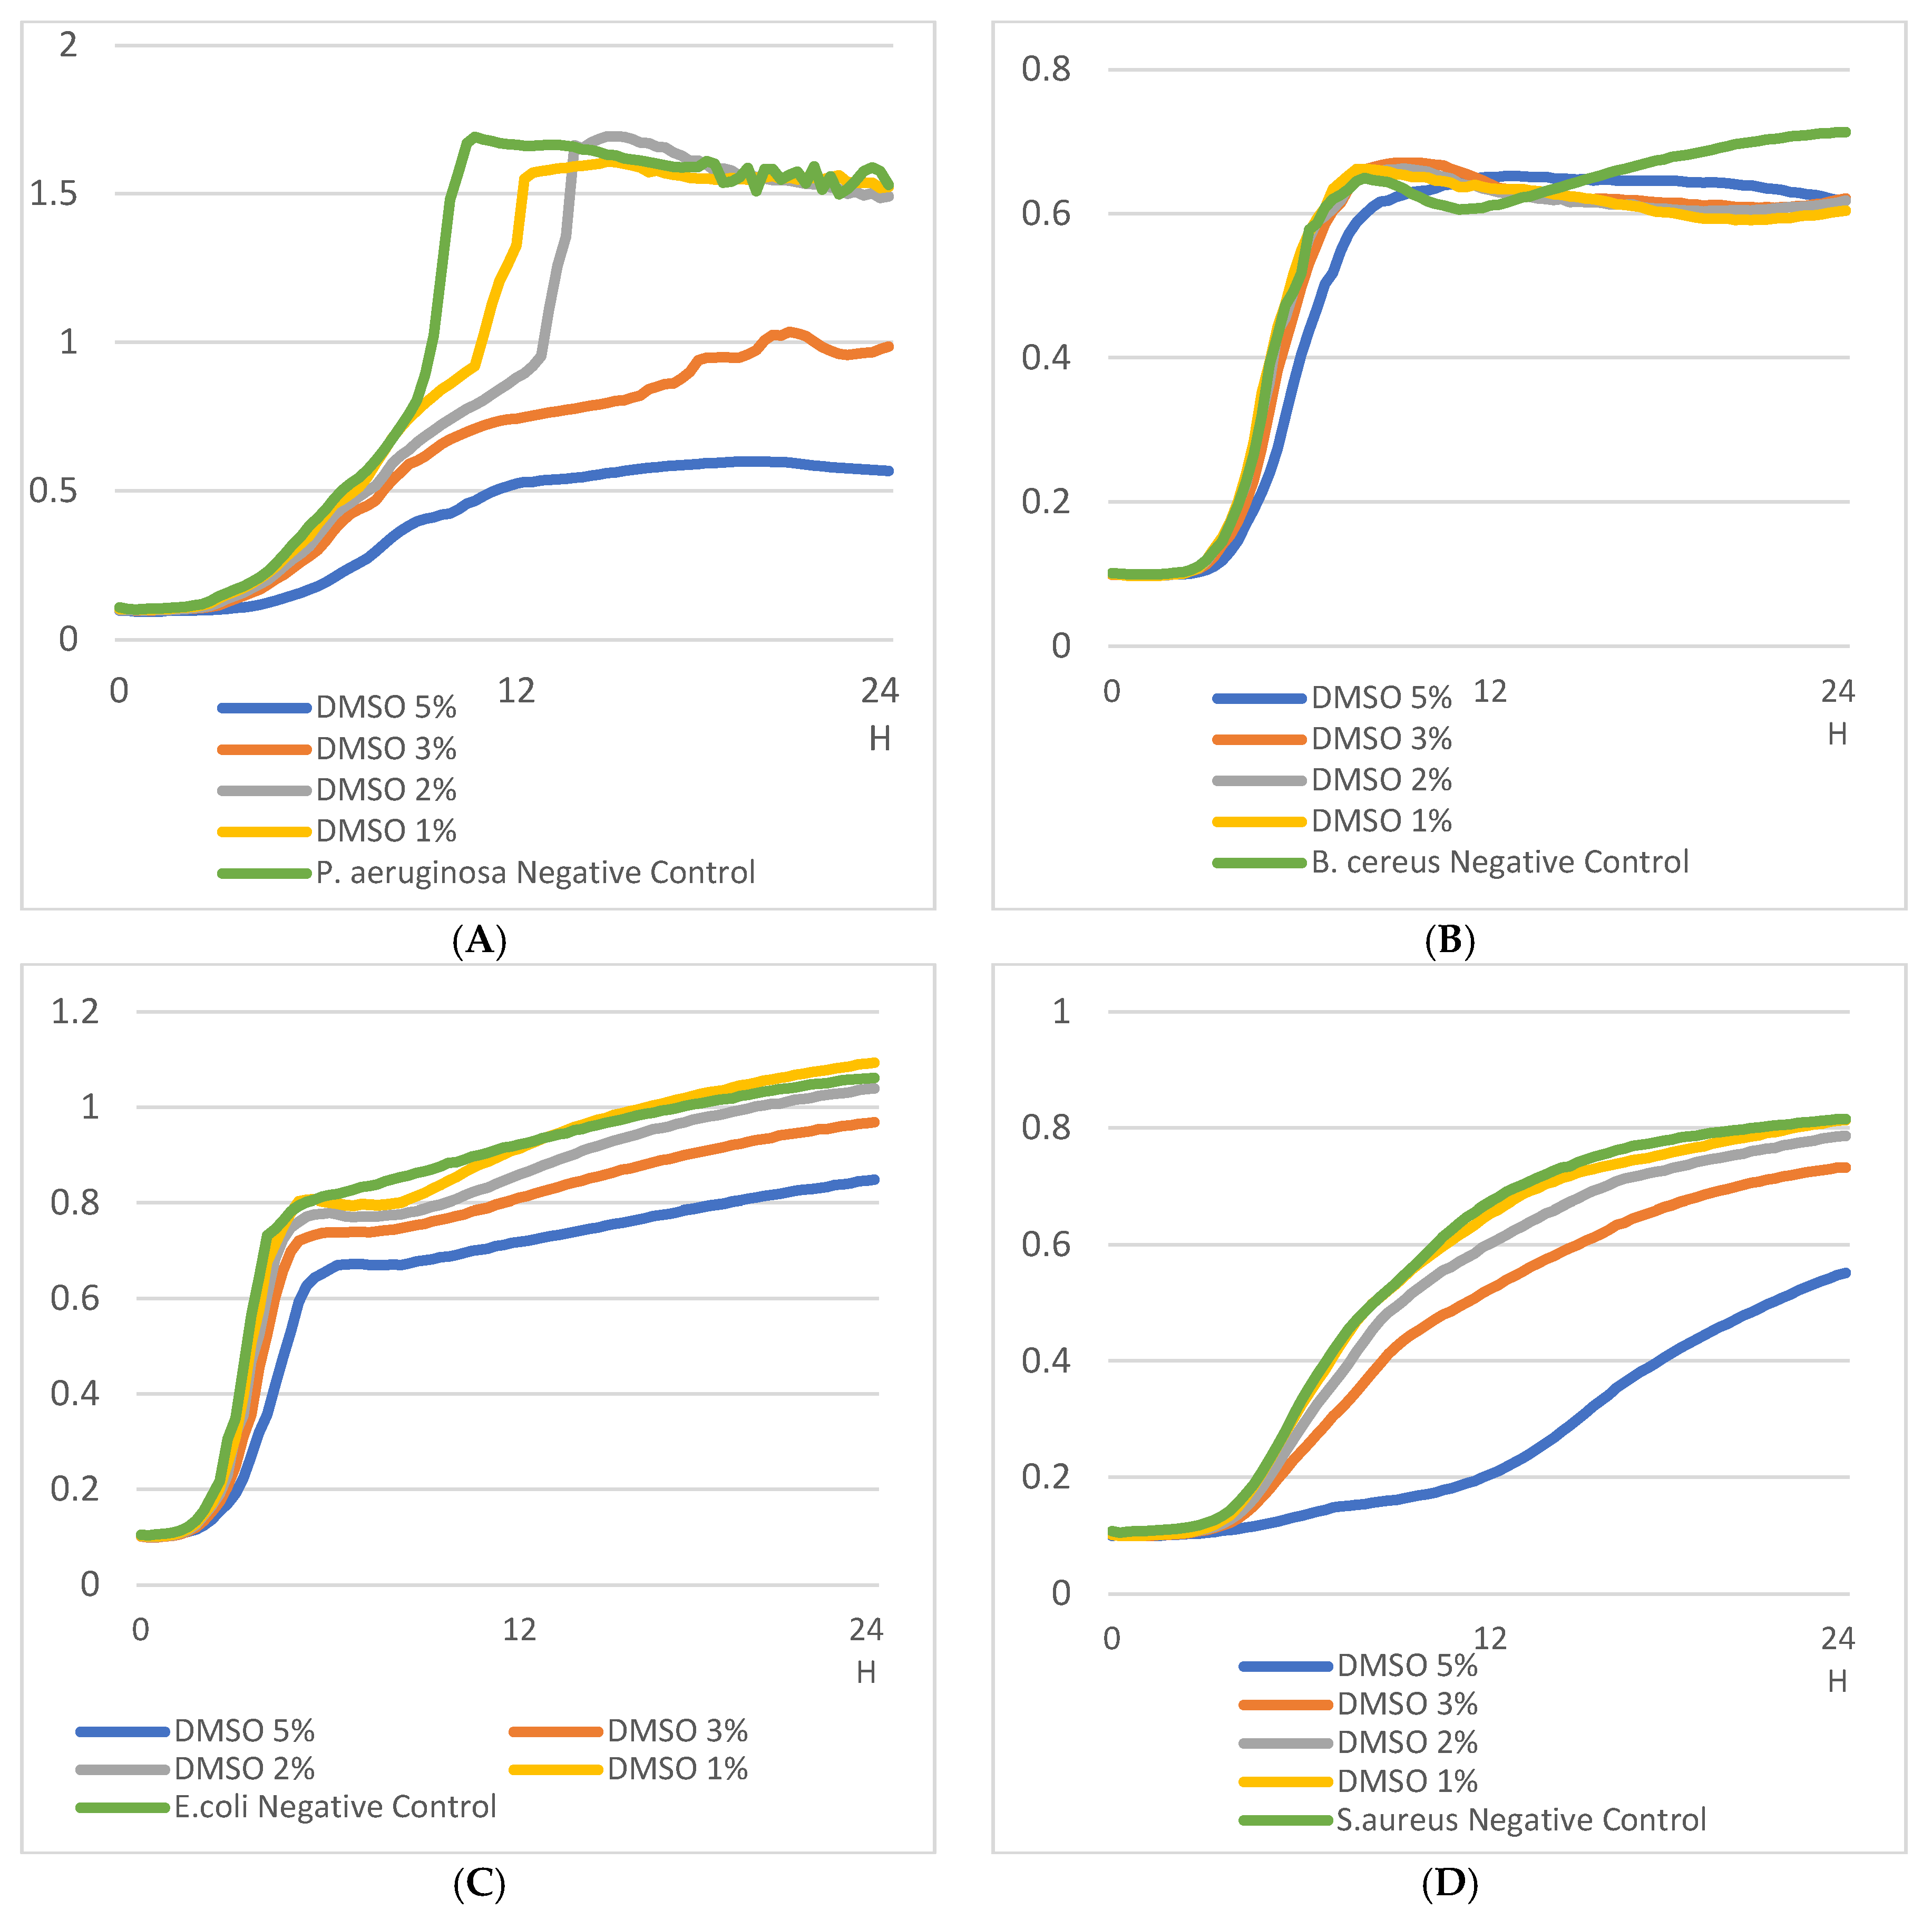

Table 1.
Comparison of the EO mix MIC (µL/mL) between microdilution and macrodilution methods for E. coli, B. cereus, P. aeruginosa and S. aureus.
Table 1.
Comparison of the EO mix MIC (µL/mL) between microdilution and macrodilution methods for E. coli, B. cereus, P. aeruginosa and S. aureus.
| Bacterial Strain | Macrodilution Method EO Mix MIC (µL/mL) | Microdilution Method EO Mix MIC (µL/mL) |
|---|---|---|
| B. cereus | 6.08x10² ± 2.06x10²a | 2.17x10² ± 6.53x101b |
| P. aeruginosa | N.D. | N.D. |
| S. aureus | 3.92x10² ± 2.41x10²a | 3.69x10² ± 6.53x101a |
| E. coli | 1.39x10³ ± 7.59x10²a | 5.21x10² ± 1.95x10²a |
N.D: not determined. Values are means of 9 replicates (3 biological replicates and 3 technical replicates in one biological replicate); values in a row with the same letter are not significantly different (p>0.05).
Table 2.
Growth parameters (µmax, lagT, and OD max) of E. coli, B. cereus, P. aeruginosa and S. aureus cultured with EO mix at progressive 2:1 dilution. Values with different letters between two growth conditions of the same bacterial strain are significantly different (p<0.005). ‘Negative control’: bacterial strain in MHB; mt: Mean of three technical replicates ± SD; mb: Mean of 9 growth-condition replicates (3 biological replicates of 3 technical replicates) ± SD; N.D. not determined. .
| Bacterial Strains Growth Conditions (with or Without EO Mix) | EO Mix MIC/2 (µL/mL) | Lag Phase (h) | Growth Rate (h-1) | OD Max (uOD) | R2 | |||||
|---|---|---|---|---|---|---|---|---|---|---|
| mt* | mb** | mt | mb | mt | mb | mt | mb | mt | mb | |
| B. cereus negative control | mt1 | - | 0.093 ± 0.011 | 0.087a ± 0.026 | 3.728 ± 0.335 | 3.457a ± 0.897 | 0.737 ± 0.001 | 0.730 ± 0.039 | 81.72% | 92.50% |
| mt2 | 0.110 ± 0.000 | 4.269 ± 0.020 | 0.684 ± 0.008 | 99.50% | ||||||
| mt3 | 0.059 ± 0.022 | 2.373 ± 0.309 | 0.771 ± 0.008 | 96.31% | ||||||
| B. cereus with EO mix | mt1 | 108.39 ± 32.67 | 0.672 ± 0.515 | 0.630b ± 0.407 | 0.052 ± 0.037 | 0.394b ± 0.557 | 0.112 ± 0.002 | 0.300b ± 0.140 | 91.59% | 87.90% |
| mt2 | 0.250 ± 0.071 | 1.110 ± 0.293 | 0.388 ± 0.031 | 77.75% | ||||||
| mt3 | 0.969 ± 0.000 | 0.022 ± 0.006 | 0.109 ± 0.001 | 93.49% | ||||||
| mt1 | - | 0.079 ± 0.001 | 0.068a ± 0.011 | 5.358 ± 0.256 | 4.657a ± 0.628 | 0.862 ± 0.008 | 0.864a ± 0.023 | 98.04% | 97.50% | |
| E. coli negative control | mt2 | 0.063 ± 0.004 | 4.420 ± 0.408 | 0.873 ± 0.018 | 96.46% | |||||
| mt3 | 0.061 ± 0.014 | 4.194 ± 0.467 | 0.857 ± 0.044 | 97.00% | ||||||
| E. coli with EO mix | mt1 | 260.50 ± 97.50 | 0.268 ± 0.248 | 0.546b ± 0.083 | 2.015 ± 3.306 | 0.660b ± 1.122 | 0.332 ± 0.270 | 0.179b ± 0.091 | 89.90% | 82.67% |
| mt2 | 0.969 ± 0.000 | (-)0.006 ± 0.035 | 0.102 ± 0.001 | 70.18% | ||||||
| mt3 | 0.402 ± 0.000 | (-)0.029 ± 0.025 | 0.103 ± 0.002 | 87.93% | ||||||
| P. aeruginosa negative control | mt1 | - | 0.233 ± 0.016 | 0.029 ± 0.023 | 7.216 ± 0.557 | 7.513 ± 2.509 | 1.546 ± 0.008 | 1.618 ± 0.071 | 98.00% | 98.00% |
| mt2 | 0.242 ± 0.036 | 9.405 ± 4.265 | 1.629 ± 0.068 | 98.00% | ||||||
| mt3 | 0.213 ± 0.011 | 5.918 ± 0.749 | 1.679 ± 0.052 | 98.00% | ||||||
| P. aeruginosa with EO mix | mt1 | ind | ind | ind | ind | ind | ind | ind | ind | ind |
| mt2 | ind | ind | ind | ind | ||||||
| mt3 | ind | ind | ind | ind | ||||||
| S. aureus negative control | mt1 | - | 0.165 ± 0.053 | 0.150a ± 0.027 | 2.368 ± 0.606 | 2.146a ± 0.322 | 0.893 ± 0.127 | 0.940a ± 0.068 | 99.53% | 99.20% |
| mt2 | 0.139 ± 0.006 | 2.035 ± 0.002 | 0.955 ± 0.007 | 99.02% | ||||||
| mt3 | 0.144 ± 0.007 | 2.035 ± 0.049 | 0.971 ± 0.018 | 99.06% | ||||||
| S. aureus with EO mix | mt1 | 184.61 ± 32.67 | 0.184 ± 0.108 | 0.632b ± 0.405 | 1.507 ± 1.289 | 0.579b ± 0.975 | 0.500 ± 0.343 | 0.253b ± 0.257 | 99.22% | 57.44% |
| mt2 | 0.742 ± 0.393 | 0.233 ± 0.403 | 0.155 ± 0.087 | 41.63% | ||||||
| mt3 | 0.969 ± 0.000 | (-)0.004 ± 0.006 | 0.105 ± 0.002 | 31.48% | ||||||
The different letters indicate significant difference (p-value < 0.05) per strain between negative control (without EO mix) and with EO mix.
Disclaimer/Publisher’s Note: The statements, opinions and data contained in all publications are solely those of the individual author(s) and contributor(s) and not of MDPI and/or the editor(s). MDPI and/or the editor(s) disclaim responsibility for any injury to people or property resulting from any ideas, methods, instructions or products referred to in the content. |
© 2025 by the authors. Licensee MDPI, Basel, Switzerland. This article is an open access article distributed under the terms and conditions of the Creative Commons Attribution (CC BY) license (http://creativecommons.org/licenses/by/4.0/).
Copyright: This open access article is published under a Creative Commons CC BY 4.0 license, which permit the free download, distribution, and reuse, provided that the author and preprint are cited in any reuse.


