
Submitted:
10 March 2025
Posted:
10 March 2025
You are already at the latest version
Abstract
In this study we present an application of wood biomass - alder wood char as the carbon precursor for the synthesis of novel and sustainable nitrogen-doped activated carbon supported nickel nanoparticle catalyst (AWC-Ni-N) for hydrazine oxidation. For comparison, the wood-based carbon material doped with nitrogen only (AWC-N) was also synthesized. Extensive characterization, including SEM, Raman spectroscopy, XPS, and XRD revealed the catalysts' microstructure and properties. Electrochemical testing demonstrated that the AWC-Ni-N catalyst significantly enhanced the efficiency of the hydrazine oxidation reaction. In addition, direct N2H4-H2O2 single fuel cell tests were conducted using the prepared AWC-N and AWC-Ni-N catalysts as the anodes and cathodes. Peak power densities of up to 10.8 mW cm⁻² were achieved at 25 °C, corresponding to a current density of 27 mA cm⁻² and a cell voltage of 0.4 V when the AWC-Ni-N catalyst was used as both the anode and cathode. Furthermore, the peak power density increased by approximately 1.6 and 2.9 times, respectively, when the operating temperature was raised from 25 °C to 55 °C for the AWC-N and AWC-Ni-N catalysts. Overall, the AWC-N and AWC-Ni-N catalysts demonstrate significant potential as anode and cathode materials in direct N2H4-H2O2 fuel cells.
Keywords:
biomass
; nitrogen-doped carbon
; nickel
; hydrazine oxidation
; fuel cells
1. Introduction
Recently, there has been a growing interest in carbon-based catalysts due to their unique properties and sustainability. These catalysts are becoming increasingly attractive to various industries and researchers. Activated carbon and nanostructured carbon materials, such as graphene, doped carbon, and carbon nanotubes, have a large surface area. This allows them to adsorb reagents more efficiently and catalyze reactions effectively [1,2]. Carbon-based catalysts are versatile and can be used in electrochemical reactions, water purification, organic compound synthesis, and other processes. Since they are often produced from biomass or waste, they are both economically attractive and affordable, reducing dependence on expensive metals such as platinum or palladium. The use of biomass waste for catalyst synthesis also contributes to waste reduction and supports the development of a circular economy [3,4].
Biomass is a hot carbon precursor in terms of its renewability, earth-abundance, environmental friendliness, low-cost, non-toxicity, sustainability, ease of production, and the variety of heteroatoms (N, P, S etc.) in its intrinsic composition. In addition, biomass-derived carbons have emerged as promising potential alternatives to conventionally produced carbon-based catalysts. They hold great promise as a renewable source of sustainable carbon materials for the next generation of energy storage and conversion systems. Carbon can be doped with nitrogen, sulfur, or metals, or it can be treated with chemicals. This makes it more active, conductive, and selective. For instance, the nitrogen doping of carbon materials has been shown to improve their electrical conductivity and reaction selectivity. Similarly, the incorporation of metal particles has been demonstrated to enable better control of reaction mechanisms [5,6,7]. Furthermore, nitrogen and metal (Ni, Co, Cu, Mo) doping creates a synergistic effect that is particularly important in electrocatalytic reactions, such as hydrazine oxidation reaction (HzOR), by improving the reaction rate, selectivity, and energy efficiency. Nitrogen atoms are incorporated into the carbon lattice to form nitrogen-containing structures (e.g., pyridine or pyrrole). This increases the electron density on the catalyst surface, facilitating electron transfer during the reaction. Nitrogen doping generates more active sites on the catalyst surface, enabling easier adsorption of reactants such as hydrazine (N2H4). It also modifies the catalyst's surface properties, making it more selective for the desired reaction and reducing the likelihood of side reactions [8,9,10]. On the other hand, metals (Ni, Co, Cu, Mo) also act as redox centers and assist in the HzOR. It can rapidly transition between oxidation states and efficiently participate in redox reactions. Nickel particles on the catalyst surface enhance the adsorption of N2H4 molecules, stabilize intermediate states, and accelerate the reaction rate. The interaction between nitrogen doping and nickel atoms enhances the stability and efficiency of nickel during the reaction. Together, nitrogen and nickel reduce the activation energy of the reaction, enabling for faster and more efficient processes. In addition, doping improves the chemical and structural stability of the catalyst, ensuring long-lasting catalytic activity. This makes nitrogen and nickel-doped catalysts a cost-effective and sustainable alternative for various catalytic applications [11,12,13,14,15]. The use of nickel as the active metal allows the avoidance of more expensive noble metals, such as platinum, palladium, and ruthenium without compromising catalytic efficiency [16,17,18]. The importance of the HzOR lies in its applications in sustainable energy production, environmental solutions, and the development of advanced catalysts. N2H4 serves as a fuel source in direct hydrazine fuel cells (DHFCs) [19,20], where its oxidation reaction enables efficient electricity generation with high energy density and low emissions. This makes it particularly relevant for powering vehicles and portable devices. The DHFC is based on the HzOR in an alkaline medium, which occurs at the anode (Eq. 1) and the reduction of oxygen (O2) at the cathode (Eq. 2):
N2H4 + 4OH−→ N2 + 4H2O + 4 e− E0 =−1.16 V vs. SHE
2O2 + 4H2O + 8e– → 8OH– E0 = 0.40 V vs. SHE
The HzOR produces only H2O and N2 as by-products (Eq. 1) [23,24]. From this point of view, N2H4 can act as a carbon dioxide (CO2) reducer because its oxidation produces nitrogen and water without contributing to atmospheric CO₂ levels. This property highlights its potential role in mitigating carbon emissions. The HzOR, a critical reaction in applications such as DHFCs, rocket fuels, and carbon-neutral energy systems, relies heavily on the development of advanced catalytic materials [25,26]. Moreover, N2H4 as a fuelthe photon coherence length lc=32 nm has many advantages, including its wide availability, a high theoretical potential of 1.56 V of DHFC – higher than many other fuels such as hydrogen (1.24 V) or methanol (1.19 V) – resulting in high power density, and the absence of the greenhouse gas CO2 or carbon-based intermediates that could poison the electrocatalyst [21,27,28]. Typically, O2 is used as the oxidant in fuel cells, but fuel cells using hydrogen peroxide (H2O2) as the oxidant have also been proposed and are finding various potential applications [21,29,30,31]. The reduction of H2O2 at the cathode in an acidic medium is given by Equation 4:
4H2O2 + 8e– + 8H+ → 8H2O E0 = 1.77 V vs. SHE
The theoretical cell voltage of 2.93 V of the direct hydrazine-hydrogen peroxide (N2H4-H2O2) fuel cell (Eq. 5) is significantly higher than that of the DHFC (1.56 V), which uses O2 as the oxidant.
N2H4 + 2H2O2 → N2 + 4H2O E = 2.93 V
The fact that H2O2 is a liquid oxidant at ambient temperature and pressure makes it easier to transport, store, and handle than O2. It has the additional advantage of being good to use in a small volume single stack fuel cell. The development of electrocatalysts with reasonable cost and high electroactivity for fuel oxidation is of industrial importance. In this study, we present the synthesis of novel nitrogen-doped biomass-based catalyst supported nickel nanoparticles with the aim of improving the HzOR efficiency while maintaining high activity and durability. The results highlight the novelty of biomass-derived catalysts in the advancement of green catalytic technologies and their potential for energy and environmental applications. In addition, it introduces a novel sustainable catalyst, that provides a cost-effective alternative to noble metals. By enhancing the efficiency of HzOR, it supports carbon-neutral energy systems and is consistent with green chemistry principles, demonstrating the relevance of addressing both environmental and energy challenges. The energy released during HzOR can be harnessed for various energy systems, offering potentially higher efficiencies compared to traditional fuel sources. The study of the HzOR provides valuable insights into the activity, selectivity, and durability of catalysts, which are key to optimizing the process.
2. Results
2.1. Microstructure and Morphology Studies
In this study, we propose a simple strategy for synthesizing an efficient non-noble metal-based carbon catalysts. The SEM images in Figure 1 illustrate the morphological differences between AWC-N (a) and AWC-Ni-N (b) catalysts at different magnifications. AWC-N (Figure 1a) has a highly porous structure with irregular, rough particles. At higher magnifications, micro- and mesopores are visible, along with sharp edges and a layered morphology, indicating effective chemical activation. In contrast, AWC-Ni-N (Figure 1b) exhibits more compact and interconnected particles. At higher magnifications (Figure 1b), wire-like or fibrous nanostructures are observed, likely due to the catalytic effect of nickel during the co-doping process. These web-like carbon fibers are absent in AWC-N and may enhance surface area and conductivity.
To characterize the porous structure of the obtained doped carbon materials, the surface area and pore size distribution of materials under study were determined from nitrogen adsorption–desorption isotherms at 77 K (Figure 2).
The porous structure parameters (Table 1) indicate differences in the textural properties of AWC-N and AWC-Ni-N catalysts. AWC-N has a slightly higher specific surface area (BET: 2217 m² g–1) compared to AWC-Ni-N (2050 m² g–1), as well as a larger pore volume (1.6 cm³ g–1 vs. 1.3 cm³ g–1).
The average pore width of AWC-N (2.9 nm) is marginally larger than that of AWC-Ni-N (2.5 nm). Additionally, the mesopore contribution to the total pore volume is higher in AWC-N (56.6%) compared to AWC-Ni-N (49.7%). This difference suggests that co-doping slightly reduces the porosity and the proportion of mesopores while potentially increasing the density of micropores or smaller pores. The main reason for this change is an increase of material density due to metal/metal oxide particles introduction into the structure as well as blockage of number of pores as the result of this process.
Figure 3 compares the 532-nm excited Raman spectra of AWC-N, and AWC-Ni-N catalysts. Both samples show two strong bands visible at 1349–1360 cm–1 and 1585–1586 cm–1, corresponding to prominent D and G modes of graphite, respectively.
In addition, a well-defined feature at 2690–2694 cm–1 is visible in the both samples. This feature belongs to the prominent 2D band and indicates an increase in the structural ordering of this carbon-based sample [32]. The important structural parameter in sp2-hybridized layered carbon material is the average in-plane crystallite size La [33,34]. The experimentally obtained FWHM(G) value can be used to determine the La [33,35,36]:
where the photon coherence length lc=32 nm, C=95 cm–1, and FWHM(G) and FWHM(G0) are the widths of the G band of sample under investigation and undoped pristine graphene (15 cm–1), respectively. The equation is valid for measuring the La between the 32 and 2.8 nm [33]. To estimate the FWHM(G) value, the experimental spectra in the frequency region from 1000 to 1800 cm−1 were fitted with 5 Gaussian or Lorentzian form components. The prominent D and G bands were fitted with with Lorentzian form and the aditional D* (1275 cm−1) and D'' (1520 cm−1) bands with Gaussian form functions. The presence of D'' band was associated with the amorphisation of carbon material [2,36]. The reliatevely narow disorder-induced band D' near 1624 cm−1 was also introduced into the fitting procedure. The FWHM(G) and estimated La values are given in Table 2.
In the case of AWC-N and AWC-Ni-N, the La varies from 13.6 to 16.1 nm, respectively. The larger in-plane crystallite size value was obtained for AWC-Ni-N. Another important structural parameter is the relative intensity of the D'' band, measured as the intensity ratio I(D'')/I(G) [2]. This parameter probes the amorphization of the carbon material. The higher ratio was found for the AWC-Ni-N catalyst indicating the higher amount of amorphous phase in this material.
The XRD analysis (Figure 4) shows that nickel incorporation into AWC-Ni-N leads to the formation of crystalline nickel-based phases and promotes the partial graphitization of the carbon material. The broad peaks around 2θ ≈ 20–30°, characteristic of amorphous carbon or partially graphitized carbon, observed in both AWC-N and AWC-Ni-N, suggest that both materials retain an overall porous structure with significant disorder.
However, the addition of nickel during co-doping leads to the formation of new crystalline features while slightly reducing the disorder in AWC-Ni-N (Figure 4b). The AWC-Ni-N catalyst displays additional sharper peaks at higher angles, particularly around 2θ ≈ 44° and 51°, indicating the presence of crystalline phases. These peaks can be attributed to metallic nickel or nickel-based compounds (e.g., Ni or NiO), formed during the co-doping process. Differences in peak positions and intensities between AWC-N and AWC-Ni-N indicate the successful incorporation of nickel species into the carbon framework of AWC-Ni-N. These structural modifications may enhance the material's electrical conductivity and catalytic activity, making AWC-Ni-N more suitable for applications such as catalysis or energy storage.
XPS was used to analyze the elemental composition and bonding configurations of the AWC-N and AWC-Ni-N catalysts. Figure 5 shows the survey (a) and deconvoluted C 1s (b), N 1s (c), O 1s (d), and Ni 2p (e,f) high-resolution XPS spectra of the AWC-N and AWC-Ni-N catalysts. The presence and percentages of carbon, nitrogen, oxygen and nickel species (Figure 5a) are observed in the survey XPS spectra. These are consistent with the XRD patterns. The high-resolution XPS C 1s spectra for the both catalysts were divided into four major peaks that appear at 284.2 (Csp2), 284.7 (Csp3), 285.3 (N-sp2-C), and 286.2 ± 0.1 (N-sp3-C) (Figure 5b) [37]. Notably, the most of carbon exists in the sp3-hybridized state (Table 3) [38,39]. The N 1 s spectra are deconvoluted into two main pyridinic-N (∼399 eV) and graphitic-N (∼401 eV) peaks, respectively, for the AWC-N and AWC-Ni-N catalysts, respectively (Figure 5c). Most of the nitrogen is present in the catalytically active pyridinic-N form, which is higher (~65%) for the AWC-Ni-N catalyst prepared by a one-step doping of N and Ni compared to the AWC-N catalyst doped with N only (~48%) (Table 3).
The Ni 2p3/2 spectrum can be deconvoluted to three–component peaks, one at 853.0 eV, corresponding to Ni0, and the other two at 854.6 eV and 856.0 eV, corresponding to Ni2+ like as NiO (Figure 5e) [40,41,42]. The Ni metal 2p3/2 peak position of 853.0 eV is within the literature value range of 852.7eV± 0.4 eV [43]. The binding energy of O 1s for the AWC-Ni-N catalyst was fitted as 530.6 eV (C–O–C, 10.91%), 531.8 eV (C-O-Ni, 31.82%), 532.1 eV (C = O/O-Ni, 37.26%), 533.7 eV (C-OH/C-O-C, 20.0%), respectively (Table 3).
2.2. Determination of Electroactivity of Catalysts for HzOR
The electrocatalytic activity of the AWC-N and AWC-Ni-N catalysts was evaluated toward the HzOR in alkaline media. The activity of the prepared AWC-N and AWC-Ni-N catalysts was evaluated by cyclic voltammetry by recording CVs in 1 M KOH solution containing different concentrations of N2H4 in the potential range of –1.2 V to 0.2 V (vs. SCE) at an electrode potential scan rate of 50 mV s–1 (Figure 6).
In 1 M KOH solutions (Figure 6, black line), the current density remains relatively low, indicating limited electrochemical activity when using the AWC-N and AWC-Ni-N catalysts. The current density increases significantly when 0.05 M N₂H₄ is added, especially in the positive potential region, indicating that the HzOR (Eq. 1) occurs on both AWC-N (Figure 6a, blue line) and AWC-Ni-N (Figure 6b, red line) catalysts. Both catalysts show characteristic oxidation peaks in the presence of N₂H₄, with sharper and higher peaks observed for AWC-Ni-N. This indicates that the incorporation of nickel enhances the kinetics of the oxidation reaction. The onset potential for the HzOR occurs at potentials of –0.4 and –0.5 V for AWC-Ni-N and AWC-N, respectively. The peak HzOR values on the AWC-Ni-N catalyst are obtained at more negative potentials of –0.3 V (Figure 6b) as compared with that for AWC-N (–0.1 V) (Figure 6a), indicating it’s a superior electrocatalytic activity for hydrazine oxidation. The enhanced electrocatalytic activity of the AWC-Ni-N catalyst for hydrazine oxidation can be attributed to the formation of nickel-based active sites, such as metallic Ni or NiO, which improve hydrazine adsorption and activation. In addition, the AWC-Ni-N catalyst, which was doped with both nitrogen and nickel, exhibits a more compact structure with interconnected particles and distinctive wire-like nanostructures. These wire-like nanostructures likely formed due to the catalytic influence of nickel during the co-doping process, are absent in the AWC-N catalyst. These web-like carbon fibers might contribute to an increased surface area and enhanced conductivity. In contrast, the AWC-N catalyst, doped with nitrogen only, displays a highly porous, rough, and irregular morphology. The inclusion of nickel significantly enhances the efficiency of the oxidation process.
Figure 7 shows the LSVs recorded on the both catalysts in 1 M KOH solution containing different amounts of N2H4. The measured current density increases with increasing N2H4 concentration (0.025–0.10 M) in 1 M KOH solution on both AWC-N (Figure 7a) and AWC-Ni-N (Figure 7b) catalysts.
In addition, the current density values increase by approximately 2 and 3 times as the N2H4 concentration increases from 25 to 100 mM recorded on the AWC-N and AWC-Ni-N catalysts, respectively. The insets in both graphs show a linear relationship between the peak current density and N2H4 concentration, indicating that the reaction kinetics follow a concentration-dependent behavior, which is likely governed by a diffusion-controlled mechanism. AWC-Ni-N exhibits significantly higher current densities than AWC-N under identical conditions, highlighting the enhanced catalytic performance of the nickel-doped material.
The dependence of the HzOR current densities for the AWC-N and AWC-Ni-N catalysts, recorded in a solution of 0.05 M N2H4 and 1 M KOH, on different potential scan rates is shown in Figure 8. The AWC-Ni-N catalyst (Figure 8b) exhibits a higher current density compared to the AWC-N catalyst (Figure 8a) under similar conditions, indicating that the incorporation of Ni enhances the catalytic activity. For both catalysts, as the scan rate increases from 10 to 50 mV s–1, the peak current density increases by approximately 3 times for the AWC-N catalyst and 2 times for the AWC-Ni-N catalyst. The insets in both graphs show a linear relationship between the peak current density and the scan rate, with R2>0.99. This strong correlation suggests that the electrochemical reactions at the electrode for both catalysts are diffusion-controlled. Overall, the AWC-Ni-N catalyst demonstrates superior catalytic performance compared to AWC-N, making it more suitable for applications involving the HzOR.
2.3. Performance of Direct N2H4-H2O2 Fuel Cell
The performance and stability of the AWC-N and AWC-Ni-N catalysts were evaluated for potential application in a direct N2H4-H2O2 fuel cell. A direct N2H4-H2O2 single fuel cell was constructed using the AWC-N and AWC-Ni-N catalysts as both anodes and cathodes. The performance of the N2H4-H2O2 system is strongly influenced by the choice of electrode materials, the membrane separator, and the electrolyte composition. Based on previous studies of different catholyte and anolyte compositions, a catholyte consisting of 5 M H₂O₂ + 1.5 M HCl and an anolyte of 1 M N2H4 + 1 M KOH were used in the present study. A standard Nafion® N117 membrane was used as the separator. Figure 9 presents the fuel cell polarization and corresponding power density curves for the AWC-N and AWC-Ni-N catalysts at temperatures of 25, 35, 45, and 55 °C.
The polarization curves were run in triplicate, and no noticeable loss of activity was observed. The overlapping curves across repetitions demonstrate that the AWC-N and AWC-Ni-N electrocatalysts exhibit excellent stability. The key fuel cell performance parameters determined from these tests are summarized in Table 4. The fuel cell displayed an open circuit voltage of approximately 1.25 V and 1.7 V using AWC-N and AWC-Ni-N as the anode and cathode catalysts, respectively. It was observed that the power density achieved with the AWC-Ni-N catalyst was significantly higher than that obtained with the AWC-N catalyst (Figure 9, Table 4). Peak power densities of up to 10.8 mW cm-2 were achieved at 25 °C, corresponding to a current density of 27 mA cm-2 and a cell voltage of 0.4 V (Figure 9), when the AWC-Ni-N catalyst was used as both anode and cathode. Furthermore, the peak power density values increased by approximately 1.6 times and 2.9 times when the operating temperature was raised from 25 °C to 55 °C for the AWC-N and AWC-Ni-N catalysts, respectively.
3. Materials and Methods
3.1. Preparation of Nitrogen-Doped Activated Carbon Supported Nickel Particles
Activated carbon material (AWC) was synthesized using alder wood char (Ltd. “Fille”, Valmiera district, Latvia) by mixing 50 g of char with 150 g of NaOH, following an activation procedure at a temperature of 800°C for 2 hours in an argon (Ar) atmosphere using a muffle furnace. After cooling, the AWC material was demineralized by treatment with a 10% hydrochloric acid (HCl) solution for 2 hours. The material was washed with demineralized water until the pH stabilized at 5–6 and then dried in an oven at 105 ± 2°C for 12 hours.
Doping of the obtained activated carbon (AWC) with nickel and nitrogen was per-formed in a single step and the resulting material was designated as AWC-Ni-N. The mixture of 2 g AWC, 40 g dicyandiamide (DCDA), and 0.62 g nickel acetate (Ni(CH3COO)2) was soaked in 250 mL dimethylformamide (DMF) for two hours, followed by evaporation of DMF in rotary evaporator and treatment of the resulting solid residue at a temperature of 800°C for 1 hour under an Ar atmosphere in muffle oven. Nitrogen-doped activated carbon (AWC-N) was synthesized for the comparison using the similar approach. AWC was doped with nitrogen by dispersing it in a solution of DCDA and DMF, with the same mass ratio of carbon to DCDA of 1:20. After solvent removal with a rotary evaporator, the resulting mixture was treated at 800°C for 1 hour in an Ar atmosphere in muffle oven.
3.2. Characterization of Catalysts
The morphology and composition of the materials were investigated by scanning electron microscopy (SEM) using a Helios NanoLab 650 SEM/FIB workstation with an INCA Energy 350 X-Max 20 energy dispersive X-ray (EDX) spectrometer (Oxford Instruments, Abingdon, UK).
The porous structure, including specific surface area, total volumes of micro- and mesopores and pore size distribution, was determined from isotherms of low-temperature adsorption–desorption of nitrogen at 77 K using Nova 4200e device (Quantachrome, Boynton Beach, FL, USA).
Raman spectra were recorded using an inVia Raman (Renishaw, New Mills, UK) spectrometer equipped with a thermoelectrically cooled (−70 ◦C) CCD camera and microscope. Raman spectra were excited with 532 nm radiation from a pumped solid state (DPSS) laser (Renishaw, UK). The 20×/0.40 NA objective lens and 1800 lines/mm grating were used to record the Raman spectra. The accumulation time was 40 s. To avoid damaging the sample, the laser power at the sample was restricted to 0.4 mW. The Raman frequencies were calibrated using the polystyrene standard. The parameters of the bands were determined by fitting the experimental spectra with Gaussian and Lorentzian shape components using GRAMS/A1 8.0 software (Thermo Scientific, East Grinstead, UK).
The chemical composition of the samples was analyzed using the X-ray photoelectron spectroscopy (XPS) method with the Kratos AXIS Supra+ spectrometer (Kratos Analytical, UK, Manchester, 2019) with monochromatic Al Kα (1486.6 eV) X-ray radiation powered at 225 W. The binding energy scale was calibrated by setting the adventitious carbon peak at 284.8 eV and the XPS data were converted to the VAMAS format and processed using the Avantage software (Thermo Scientific, East Grinstead, UK). The base pressure in the analysis chamber was less than 1 x 10⁻⁸ mbar, and a low electron flood gun was used as a charge neutralizer. The survey spectra for each sample were recorded at a pass energy of 80 eV with a 1 eV energy step, and high-resolution spectra (pass energy—10 eV, in 0.1 eV steps) were recorded over individual element peaks.
X-ray diffraction (XRD) analysis was performed using a D2 PHASER (Bruker, Karlsruhe, Germany) diffractometer with Cu-K-alpha as the X-ray source. Measurements were conducted in the 2θ range from 10◦ to 90◦.
3.3. Electrochemical Measurements
All electrochemical measurements were carried out in a conventional three-electrode setup of 100 mL combined with a PGSTAT302 potentiostat (Metrohm Autolab B.V., Utrecht, The Netherlands) and operated with the Nova 2.1.4 software. The working electrodes utilized in this study were the AWC-N and AWC-Ni-N catalysts, which were coated on the glassy carbon (GC) electrode with a geometric area of 0.2 cm2. The ink was prepared by dispersing an appropriate amount of the catalysts in 1 ml of a C2H5OH : H2O (vol 1:1) solution and 8 μl of a 5wt.% Nafion solution. Subsequently, 8 μl of the obtained ink was deposited on a pre-prepared GC electrode surface, with a catalyst loading of 0.8764 mgcat cm−2.
A Pt sheet was used as the counter electrode, and a saturated calomel electrode (SCE) served as the reference electrode. The HzOR studies were performed by recording cyclic voltammograms (CVs) in an Ar-deaerated solution of 0.05 M N2H4 and 1 M KOH, as well as in the background solution of 1 M KOH at room temperature. The potential was cycled in the range of −1.2 to 0.6 V (versus SCE) at various scan rates from 10 to 50 mV s−1. Additionally, CVs were recorded for different concentrations of N2H4 in the range from 25 to 100 mM at a fixed scan rate of 50 mV s−1.
3.4. Fuel Cell Test Experiments
The N2H4-H2O2 fuel cell tests were carried out by employing the optimum AWC-N and AWC-Ni-N catalysts with a geometric area of 1 cm2 as the anode and as the cathode. The anolyte was composed of an alkaline mixture of 1 M N2H4 and 1 M KOH, while the catholyte contained 5 M H2O2 and 1.5 M HCl. Each compartment of the cell was filled with 100 mL of the appropriate aqueous electrolyte. The test solutions were prepared immediately before the measurements. A Nafion N117 membrane was used to separate the anodic and cathodic compartments of the single direct N2H4-H2O2 fuel cell. The presented current densities are normalized with respect to the geometric area of catalysts. All electrochemical measurements were performed with a Zennium electrochemical workstation (ZAHNER-Elektrik GmbH & Co. KG). The performance of the fuel cell was evaluated through the recording of cell polarization and obtaining the corresponding power density curves. Cell polarization curves were recorded at temperatures between 25 and 55 ℃.
4. Conclusions
In this study, an efficient biomass-derived carbon catalysts were synthesized. It was found that nitrogen and nickel doping profoundly affect the properties of biomass-derived carbon catalysts. Nitrogen doping introduces a porous structure and a high surface area, while nickel co-doping further modifies the morphology, enhances the structural ordering, and significantly improves the electrocatalytic activity for both hydrazine oxidation. The AWC-Ni-N catalyst, which was doped with both nitrogen and nickel, demonstrates higher electrocatalytic activity for hydrazine oxidation compared to the AWC-N catalyst, doped with nitrogen only. The oxidation of N2H4 over these catalysts is controlled by the diffusion of reactants to the catalyst surface. Overall, the AWC-N and AWC-Ni-N catalysts show promise as anode/cathode materials for N2H4-H2O2 fuel cells. The fuel cell exhibited voltages of approximately 1.25 V and 1.7 V, employing AWC-N and AWC-Ni-N as the anode and cathode catalysts, respectively. The fuel cell incorporating AWC-Ni-N as both the anode and cathode achieves a significantly higher power density than the fuel cell using AWC-N. This improved performance is attributed to the superior catalytic activity of AWC-Ni-N for hydrazine oxidation. Nickel- and nitrogen-co-doped carbon catalysts are promising materials for energy conversion applications. The use of nickel as the active metal avoids the need for more expensive noble metals, such as platinum, palladium, and ruthenium without compromising catalytic efficiency.
Author Contributions
Conceptualization, L.T.-T., A.B. and E.N.; methodology, V.U.; validation, A.Z., L.T-T. and E.N.; formal analysis, A.V. and G.D.; investigation, V.U., A.P., A.V., G.N. and D.U.; data curation, A.V.; writing—original draft preparation, A.B., D.U., A.P.; writing—review and editing, L.T.-T., A.P., and G.N.; visualization, V.U., A.P., A.B. and G.N.; supervision, G.D., A.Z., and E.N. All authors have read and agreed to the published version of the manuscript.
Funding
This research was supported by the grant from Iceland, Liechtenstein, and Norway through the EEA Grants according to the project contract with the Research Council of Lithuania (LMTLT) No. S-BMT-21-12 (LT08-2-LMT-K-01-055).
Data Availability Statement
Not applicable.
Acknowledgments
The authors would like to thank Dr. Vitalija Jasulaitienė for characterizing the samples by X-ray photoelectron spectroscopy (XPS).
Conflicts of Interest
The authors declare no conflicts of interest.
References
- Kong, Z.; Zhang, H.; Zhou, T.; Xie, L.; Wang, B.; Jiang, X. Biomass-derived functional materials: Preparation, functionalization, and applications in adsorption and catalytic separation of carbon dioxide and other atmospheric pollutants. Sep. Purif. Technol. 2025, 354(5), 129099. [Google Scholar] [CrossRef]
- Upskuvienė, D.; Balčiūnaitė, A.; Drabavičius, A.; Jasulaitienė, V.; Niaura, G.; Talaikis, M.; Plavniece, A.; Dobele, G.; Volperts, A.; Zhurinsh, A. Lin, Y-Ch.; Chen, Y-W.; Tamašauskaitė-Tamašiūnaitė, L.; Norkus, E. Synthesis of nitrogen-doped carbon catalyst from hydrothermally carbonized wood chips for oxygen reduction. Catal. Commun. 2023, 184, 106797. [CrossRef]
- Zhang, X.; Li, S.; Zhao, G.; Zhao, H.; Zhou, M. Single-atom catalysts toward electrochemical water treatment. Appl. Catal. B: Environ. Energy 2025, 363, 124783. [Google Scholar] [CrossRef]
- Zhu, Z.; Men, Y.; Zhang, W.; Yang, W.; Wang, F.; Zhang, Y.; Zhang, Y.; Zeng, X.; Xiao, J.; Tang, Ch.; Li, X.; Zhang, Y. Versatile carbon-based materials from biomass for advanced electrochemical energy storage systems. eSci. 2024, 4(5), 100249. [Google Scholar] [CrossRef]
- Fu, Q.; Li, N.; Lu, K.; Dong, Z.; Yang, Y. The emerging development of nitrogen and sulfur co-doped carbon dots: Synthesis methods, influencing factors and applications. Mater. Today Chem. 2024, 37, 102032. [Google Scholar] [CrossRef]
- Palm, I.; Kibena-Põldsepp, E.; Mooste, M.; Kozlova, J.; Käärik, M.; Kikas, A.; Treshchalov, A.; Leis, J.; Kisand, V.; Tamm, A.; Holdcroft, S.; Tammeveski, K. Nitrogen and sulphur co-doped carbon-based composites as electrocatalysts for the anion-exchange membrane fuel cell cathode. Int. J. Hydrogen Energy 2024, 55, 805–814. [Google Scholar] [CrossRef]
- Volperts, A.; Upskuvienė, D.; Balčiūnaitė, A.; Jasulaitienė, V.; Niaura, G.; Drabavičius, A.; Plavniece, A.; Dobele, G.; Zhurinsh, A.; Lin, Y-Ch.; Chen, Y-W.; Tamašauskaitė-Tamašiūnaitė, L.; Norkus, E. Copper-nitrogen dual-doped activated carbon derived from alder wood as an electrocatalyst for oxygen reduction. Catal. Commun. 2023, 182, 106743. [CrossRef]
- Pereira, G.M.; Cellet, T.S.P.; Winkler, M.E.G.; Rubira, A.F.; Silva, R. Printing specific active sites for ORR and hydrazine oxidation on N-doped carbon. Mater. Chem. Phys. 2023, 307, 128102. [Google Scholar] [CrossRef]
- Song, S.; Li, Y.; Shi, Y.; Xu, Y.; Niu, Y. Oxygen-doped MoS2 nanoflowers with sulfur vacancies as electrocatalyst for efficient hydrazine oxidation. J. Electroanal. Chem. 2022, 906, 115986. [Google Scholar] [CrossRef]
- Taghaddosi, S.; Rezaee, S.; Shahrokhian, S. Facile synthesis of N-doped hollow carbon nanospheres wrapped with transition metal oxides nanostructures as non-precious catalysts for the electro-oxidation of hydrazine. J. Electroanal. Chem. 2020, 873, 114437. [Google Scholar] [CrossRef]
- Wei, X.; Wang, T.; Dai, H.; Li, S. Multifold nanotwin-enhanced catalytic activity of Ni-Zn-Cu for hydrazine oxidation. J. Alloys Compd. 2024, 997, 174898. [Google Scholar] [CrossRef]
- Zhao, Y,; Sun, Y.; Li, H.; Zeng, S.; Li, R.; Yao, Q.; Chen, H.; Zheng, Y.; Qu, K. Highly enhanced hydrazine oxidation on bifunctional Ni tailored by alloying for energy-efficient hydrogen production. J. Colloid Interf. Sci 2023, 652(B), 1848–1856. [CrossRef]
- Guo, R.; Zhang, Y.; Zhang, X.; Ma, M.; Hu, T. Enhanced catalytic oxidation of hydrazine of CoO/Co3O4 heterojunction on N-doped carbon. Electrochim. Acta 2023, 458, 142537. [Google Scholar] [CrossRef]
- Filanovsky, B.; Granot, E.; Presman, I.; Kuras, I.; Patolsky, F. Long-term room-temperature hydrazine/air fuel cells based on low-cost nanotextured Cu–Ni catalysts. J. Power Sources 2014, 246, 423–429. [Google Scholar] [CrossRef]
- Liu, H.; Liu, Y.; Li, M.; Liu, X.; Luo, J. Transition-metal-based electrocatalysts for hydrazine-assisted hydrogen production. Mater. Today Adv. 2020, 7, 100083. [Google Scholar] [CrossRef]
- Hu, X.; Wang, X.; Liu, T.; Liang, Z.; Zhang, X.; Tian, J. Fine-tuning catalytic performance of ultrafine bimetallic nickel-platinum on metal-organic framework derived nanoporous carbon/metal oxide toward hydrous hydrazine decomposition. Int. J. Hydrogen Energy 2023, 48(42), 16001–16006. [Google Scholar] [CrossRef]
- Men, Y.; Su, J.; Wang, X.; Cai, P.; Cheng, G.; Luo, W. NiPt nanoparticles supported on CeO2 nanospheres for efficient catalytic hydrogen generation from alkaline solution of hydrazine. Chinese Chem. Lett. 2019, 30(3), 634–637. [Google Scholar] [CrossRef]
- Khan, S.; Shah, S.S.; Ahmad, A.; Yurtcan, A.B.; Jabeen, E.; Alshgari, R.A.; Janjua, N.K. Ruthenium and palladium oxide promoted zinc oxide nanoparticles: Efficient electrocatalysts for hydrazine oxidation reaction. J. Electroanal. Chem. 2022, 917, 116422. [Google Scholar] [CrossRef]
- Hanindriyoa, A.T.; Prawiraa, TB.M.Y.Y.; Agustaa, M.K.; Maezonob, R.; Dipojono, H.K. Computational design of Ni-Zn based catalyst for direct hydrazine fuel cell catalyst using density functional theory. Procedia Engineer. 2017, 170, 148–153. [Google Scholar] [CrossRef]
- Tamašauskaitė-Tamašiūnaitė, L.; Šimkūnaitė, D.; Nacys, A.; Balčiūnaitė, A.; Zabielaitė, A.; Norkus, E. Chapter 11-Direct hydrazine fuel cells (DHFCs). Direct Liquid Fuel Cells Fundamentals, Advances and Future 2021, pp. 233–248. [CrossRef]
- Ma, J.; Choudhury, N.A.; Sahai, Y. A comprehensive review of direct borohydride fuel cells. Renew. Sust. Energy Rev. 2010, 14, 183–199. [Google Scholar] [CrossRef]
- Abdolmaleki, M.; Ahadzadeh, I.; Goudarziafshar, H. Direct hydrazine-hydrogen peroxide fuel cell using carbon supported Co@Au core-shell nanocatalyst. Int. J. Hydrogen Energy 2017, 42, 15623–15361. [Google Scholar] [CrossRef]
- Bedin, K.C.; Cazetta, A.L.; Souza, I.P.A.F.; Spessato, L.; Zhang, T.; Araújo, R.A.; Silva, R.; Asefa, T.; Almeida, V.C. N-doped spherical activated carbon from dye adsorption: Bifunctional electrocatalyst for hydrazine oxidation and oxygen reduction. J. Environ. Chem. Engineer. 2022, 10(3), 107458. [Google Scholar] [CrossRef]
- Serov, A.; Kwak, Ch. Direct hydrazine fuel cells: A review. App. Catal. B-Environ. 2010, 98, 1–9. [Google Scholar] [CrossRef]
- Vorms, E.A.; Papaefthymiou, V.; Faverge, T.; Bonnefont, A.; Chatenet, M.; Savinova, E.R.; Oshchepkov, A.G. Mechanism of the hydrazine hydrate electrooxidation reaction on metallic Ni electrodes in alkaline media as revealed by electrochemical methods, online DEMS and ex situ XPS. Electrochim. Acta 2024, 507, 145056. [Google Scholar] [CrossRef]
- Sakamoto, T.; Asazawa, K.; Martinez, U.; Halevi, B.; Suzuki, T.; Arai, S.; Matsumura, D.; Nishihata, Y.; Atanassov, P.; Tanaka, H. Electrooxidation of hydrazine hydrate using Ni–La catalyst for anion exchange membrane fuel cells. J. Power Sources 2013, 234, 252–259. [Google Scholar] [CrossRef]
- Ong, B.C.; Kamarudin, S.K.; Basri, S. Direct liquid fuel cells: A review. Int. J. Hydrogen Energy 2017, 42, 10142–10157. [Google Scholar] [CrossRef]
- Dekel, D.R. Review of cell performance in anion exchange membrane fuel cells. J. Power Sources 2018, 375, 158–169. [Google Scholar] [CrossRef]
- Hosseini, M.G.; Rashidi, N.; Mahmoodi, R.; Omer, M. Preparation of Pt/G and PtNi/G nanocatalysts with high electrocatalytic activity for borohydride oxidation and investigation of different operation condition on the performance of direct borohydride-hydrogen peroxide fuel cell. Mater. Chem. Phys. 2018, 208, 207–219. [Google Scholar] [CrossRef]
- Oliveira, R.C.P.; Vasić, M.; Santos, D.M.F.; Babić, B.; Hercigonja, R.; Sequeira, C.A.C.; Šljukić, B. Performance assessment of a direct borohydride-peroxide fuel cell with Pd-impregnated faujasite X zeolite as anode electrocatalyst. Electrochim. Acta 2018, 269, 517–525. [Google Scholar] [CrossRef]
- Mayuri, P.; Huang, S.-T.; Mani, V.; Kumar, A.S. A new organic redox species-indole tetraone trapped MWCNT modified electrode prepared by in-situ electrochemical oxidation of indole for a bifunctional electrocatalysis and simultaneous flow injection electroanalysis of hydrazine and hydrogen peroxide. Electrochim. Acta 2018, 268, 150–162. [Google Scholar] [CrossRef]
- Cançado, L.G.; Jorio, A.; Fereira, E.H.M.; Stavale, F.; Achete, C.A.; Capaz, R.B.; Moutinho, M.V.O.; Lombardo, A.; Kulmala, T.S.; Ferrari, A.C. Quantifying defects in graphene via Raman spectroscopy at different excitation energies. Nano Lett. 2011, 11, 3190–3196. [Google Scholar] [CrossRef]
- Ribeiro-Soares, J.; Oliveros, M.E.; Garin, C.; David, M.V.; Martins, L.G.P.; Almeida, C.A.; Martins-Ferreira, E.H.; Takai, K.; Enoki, T.; Margalhães-Paniago, R.; Malachias, A.; Jorio, A.; Archanjo, B.S.; Achete, C.A.; Cançado, L.G. Structural analysis of polycrystalline graphene by Raman spectroscopy. Carbon 2015, 95, 646–652. [Google Scholar] [CrossRef]
- Jorio, A.; Cançado, L.G. Perspectives on Raman spectroscopy of graphene-based systems: from the perfect two-dimensional surface to charcoal. Phys. Chem. Chem. Phys. 2012, 14, 15246–15256. [Google Scholar] [CrossRef] [PubMed]
- Jorio, A.; Filho, A.G.S. Raman studies of carbon nanostructures. Annu. Rev. Mater. Res. 2016, 46, 357–382. [Google Scholar] [CrossRef]
- Trusovas, R.; Ratautas, K.; Račiukaitis, G.; Niaura, G. Graphene layer formation in pinewood by nanosecond and picosecond laser. Appl. Surf. Sci. 2019, 471, 154–161. [Google Scholar] [CrossRef]
- Biesinger, M.C. Accessing the robustness of adventitious carbon for charge referencing (correction) purposes in XPS analysis: Insights from a multi-user facility data review. Appl. Surf. Sci. 2022, 597, 153681. [Google Scholar] [CrossRef]
- Baccile, N.; Laurent, G.; Babonneau, F.; Fayon, F.; Titirici, M.M.; Antonietti, M. Structural characterization of hydrothermal carbon spheres by advanced solid-state MAS 13C NMR investigations. J. Phys. Chem. C 2009, 113, 9644–9654. [Google Scholar] [CrossRef]
- Xue, Y.; Gao, B.; Yao, Y.; Inyang, M.; Zhang, M.; Zimmerman, A.R.; Ro, K.S. Hydrogen peroxide modification enhances the ability of biochar (hydrochar) produced from hydrothermal carbonization of peanut hull to remove aqueous heavy metals: Batch and column tests. Chem. Eng. J. 2012, 200–202, 673–680. [Google Scholar] [CrossRef]
- Gonçalves, L.P.L.; Serov, A.; McCool, G.; Dicome, M.; Sousa, J.P.S.; Soares, O.S.G.P.; Bondarchuk, O.; Petrovykh, D.Y.; Lebedev, O.I.; Pereira, M.F.R.; Kolen’ko, Y.V. New opportunity for carbon-supported Ni-based electrocatalysts: gas-phase CO2 methanation. ChemCatChem 2021, 13, 4770–4779. [Google Scholar] [CrossRef]
- Biesinger, M.C.; Payne, B.P.; Lau, L.W.M.; Gerson, A.; Smart, R.S.C. X-ray photoelectron spectroscopy chemical state quantification of mixed nickel metal, oxide and hydroxide system. Surf. Interf. Anal. 2009, 41, 324–332. [Google Scholar] [CrossRef]
- Biesinger, M.C.; Payne, B.P.; Grosvenor, A.P.; Lau, L.W.M.; Gerson, A.R.; Smart, R.St.C. Resolving surface chemical states in XPS analysis of first row transition metals, oxides and hydroxides: Cr, Mn, Fe, Co and Ni. Appl. Surf. Sci. 2011, 257, 2717–2730. [Google Scholar] [CrossRef]
- Naumkin, A.V.; Kraut-Vass, A.; Gaarenstroom, S.W.; Powel, C.J. NIST X-ray Photoelectron Spectroscopy Database (SRD 20),Version 5.0 (Web Version), 2023. http:/srdata.nist.gov/xps/.
Figure 1.
SEM images of AWC-N (a) and AWC-Ni-N (b) catalysts at different magnifications.
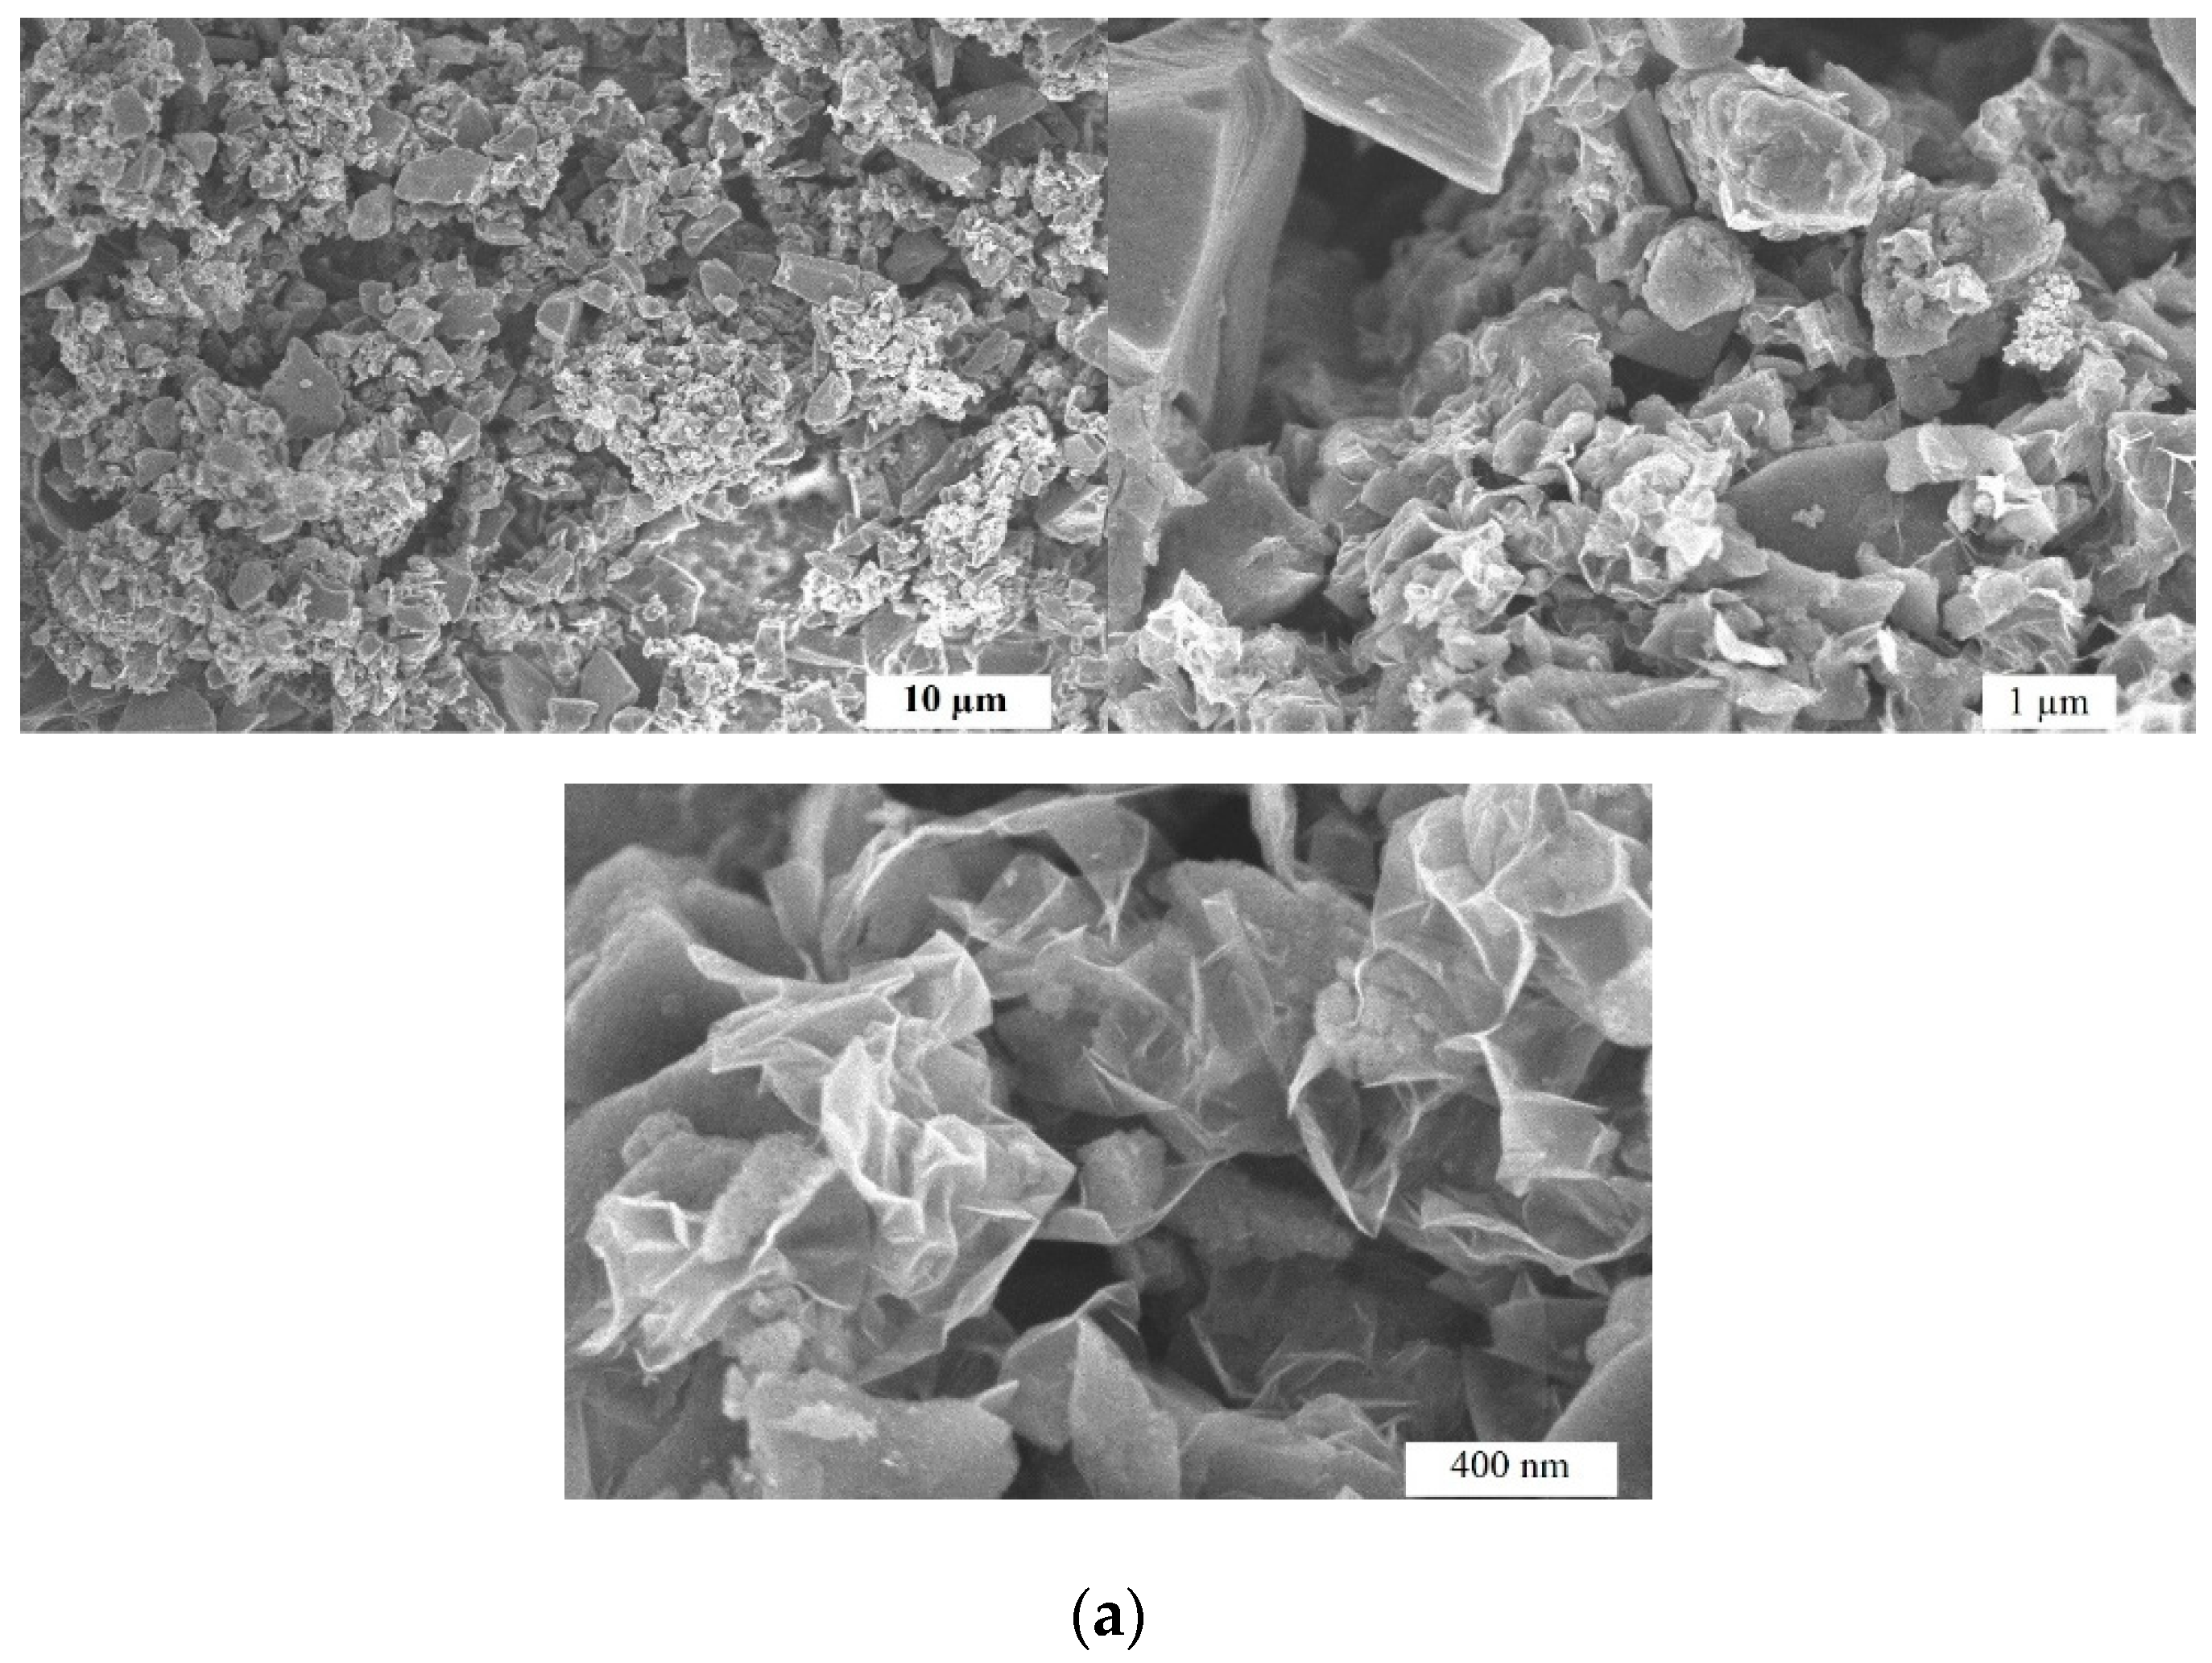
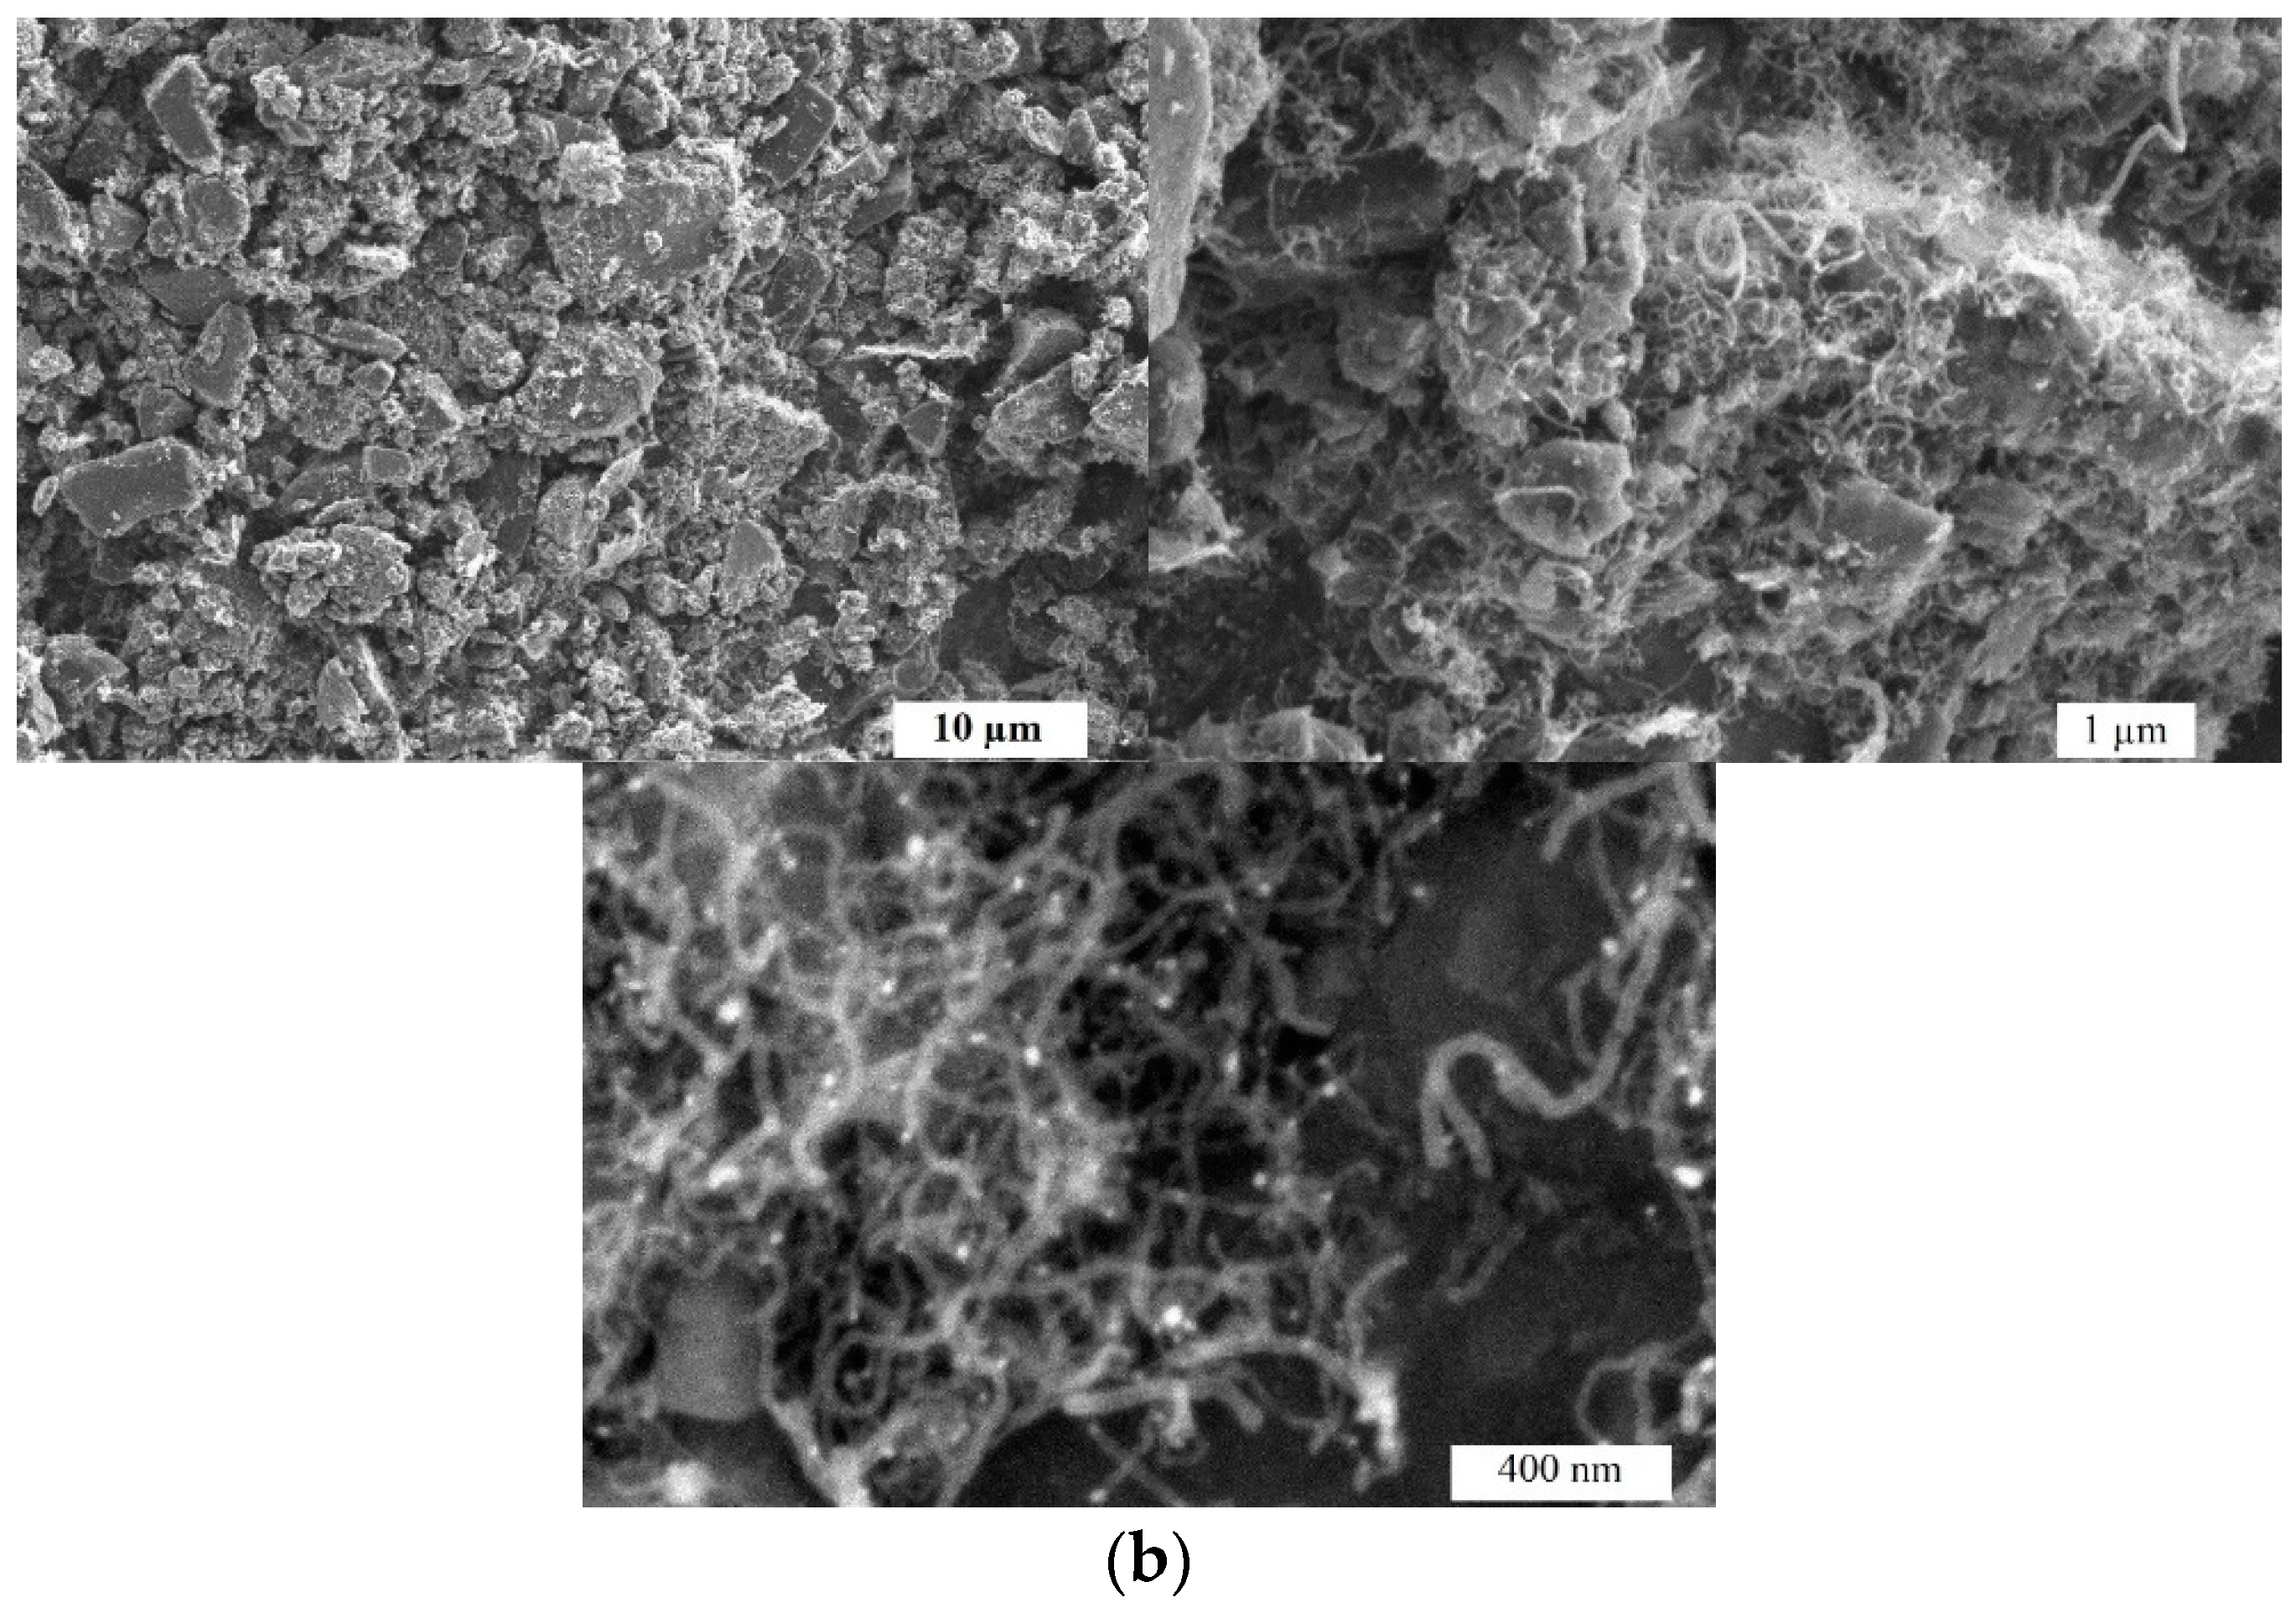
Figure 2.
N2 adsorption–desorption isotherms at 77 K (a) and pore size distribution curves calculated from the corresponding isotherms by the Density Function Theory (DFT) method (b) of nitrogen-doped activated carbon and nitrogen-doped activated carbon supported nickel particles.
Figure 2.
N2 adsorption–desorption isotherms at 77 K (a) and pore size distribution curves calculated from the corresponding isotherms by the Density Function Theory (DFT) method (b) of nitrogen-doped activated carbon and nitrogen-doped activated carbon supported nickel particles.
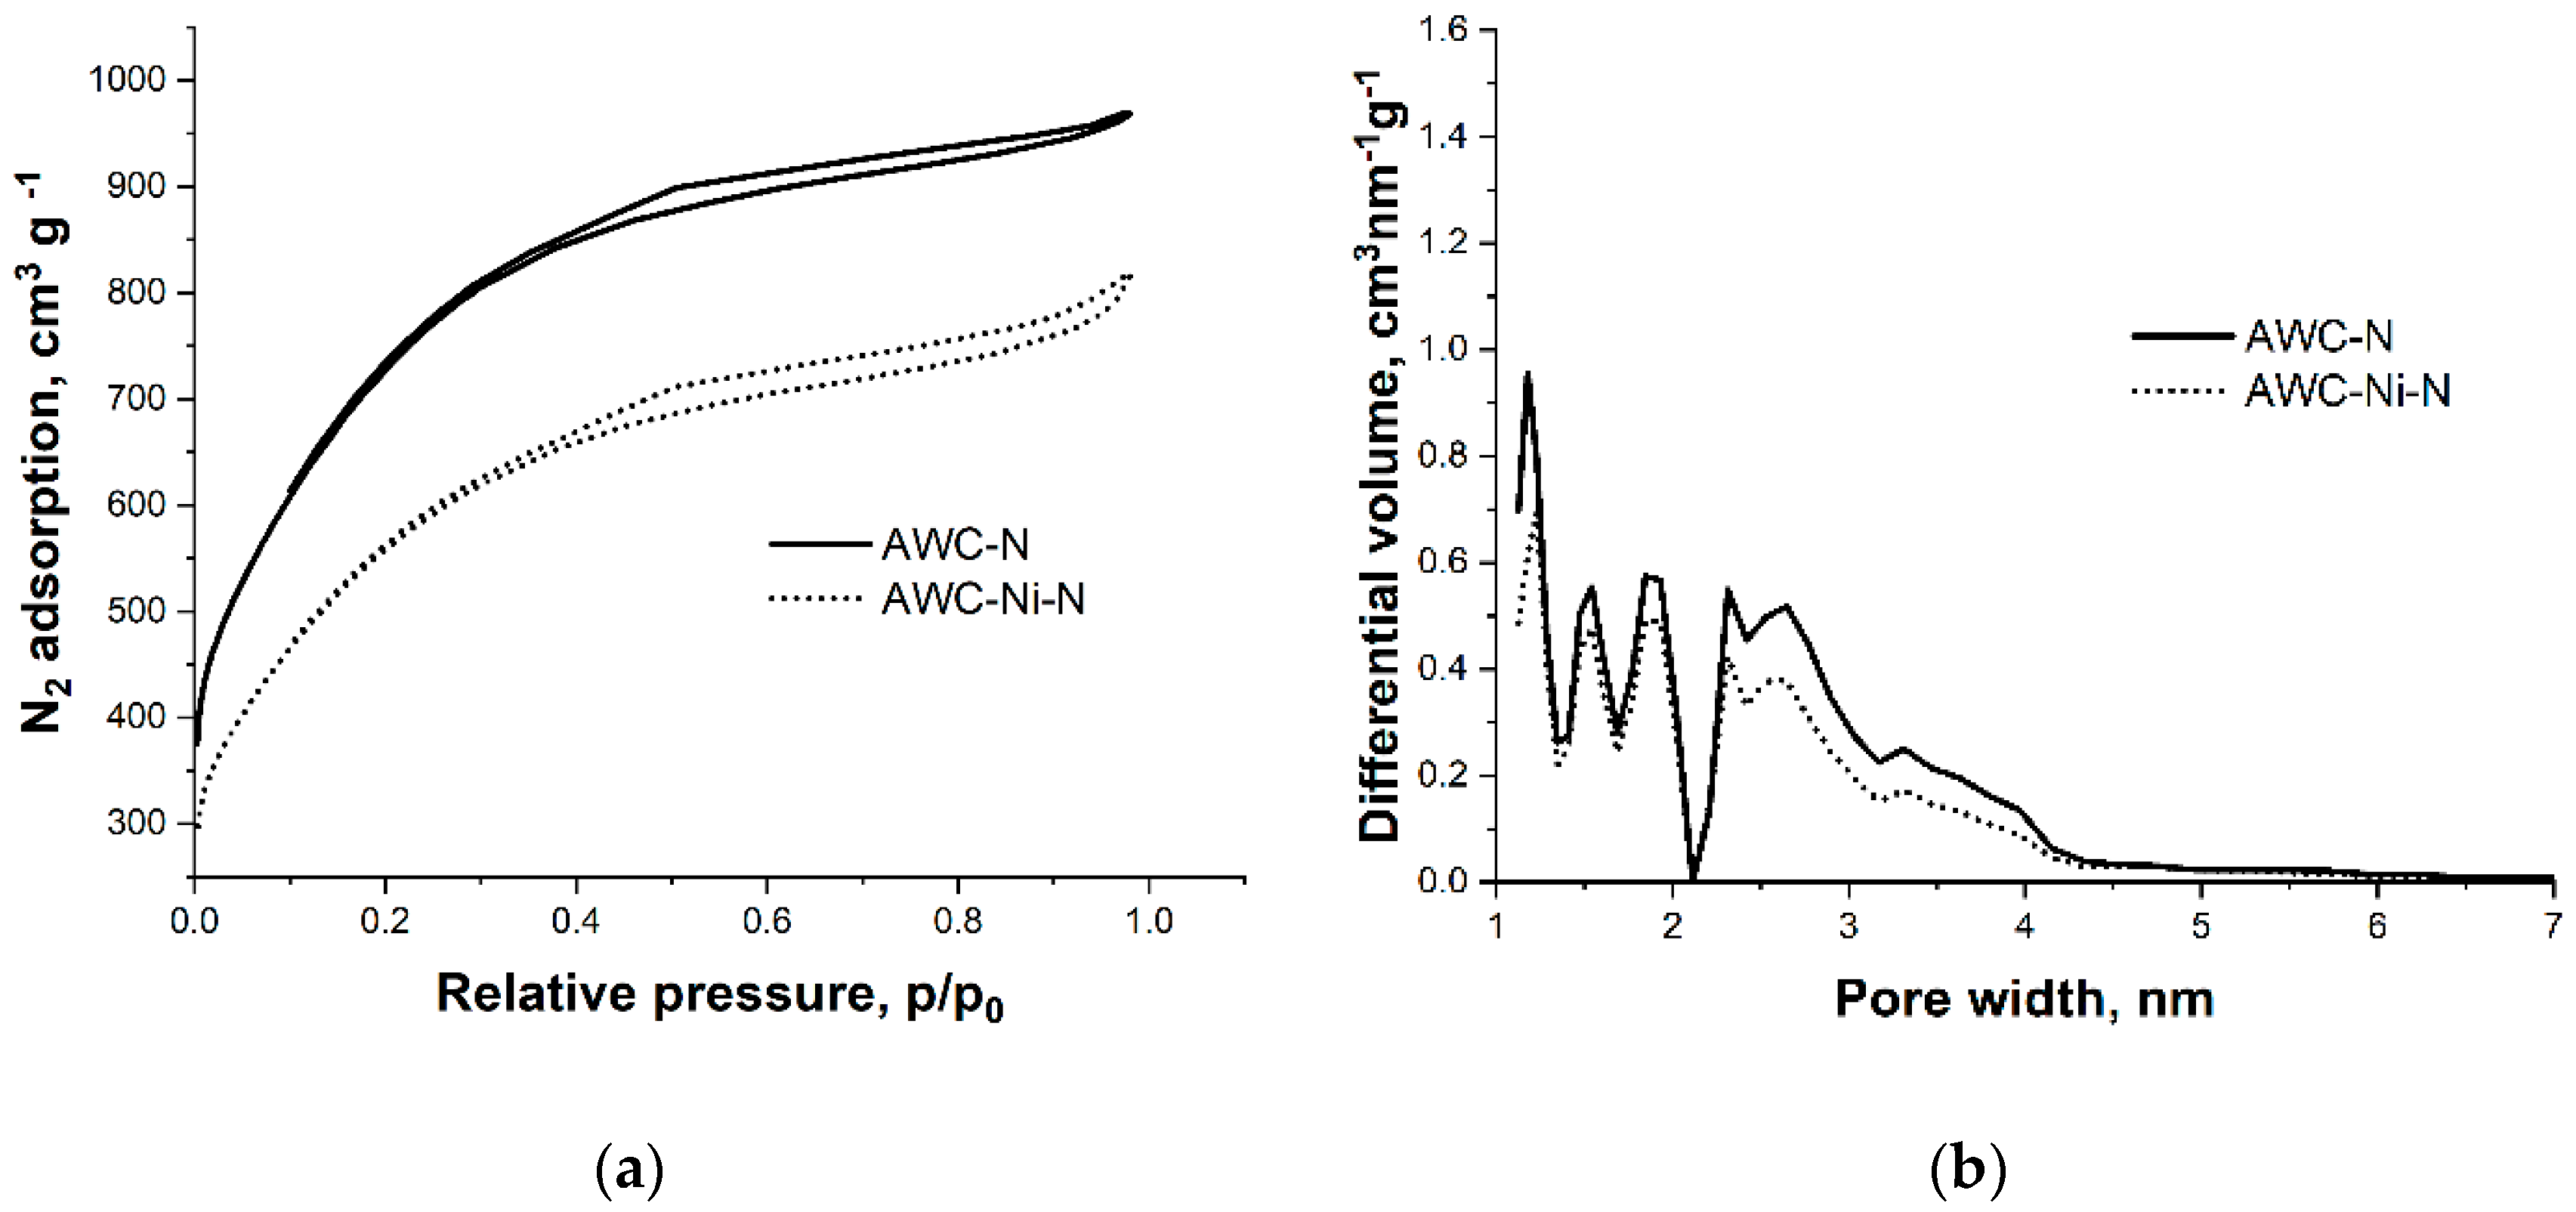
Figure 3.
Raman spectra of carbon-based (a) AWC-N, and (b) AWC-Ni-N catalysts. Intensities are normalized to the intensity of G band. Spectra are shifted vertically for clarity. Excitation wavelength is 532 nm (0.4 mW).
Figure 3.
Raman spectra of carbon-based (a) AWC-N, and (b) AWC-Ni-N catalysts. Intensities are normalized to the intensity of G band. Spectra are shifted vertically for clarity. Excitation wavelength is 532 nm (0.4 mW).
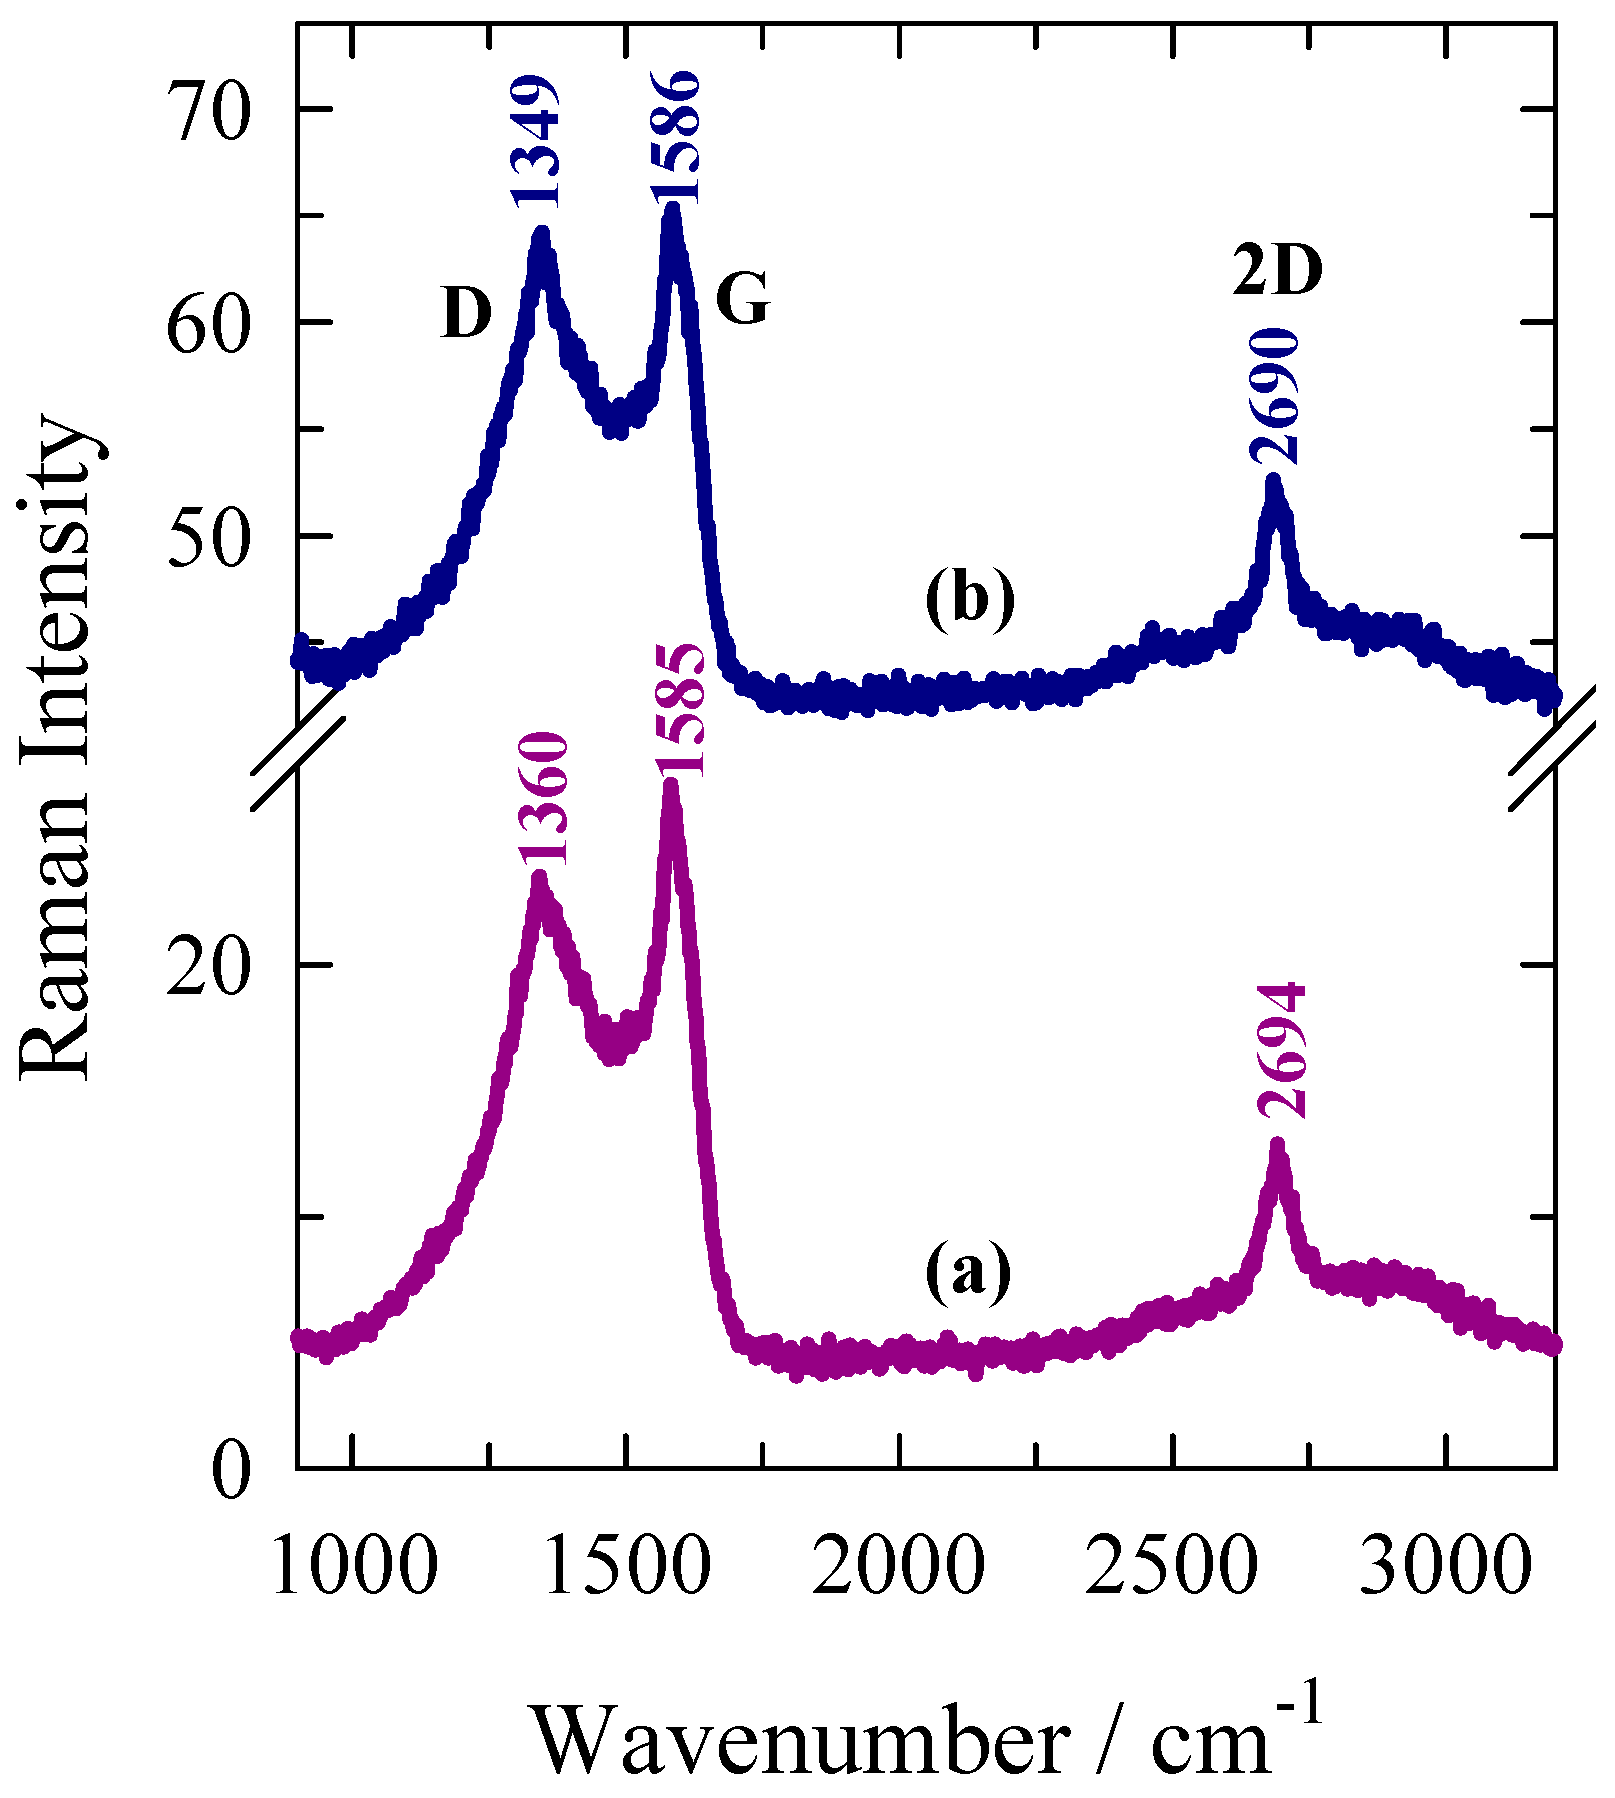
Figure 4.
XRD patterns for the AWC-N (a) and AWC-Ni-N (b) catalysts.
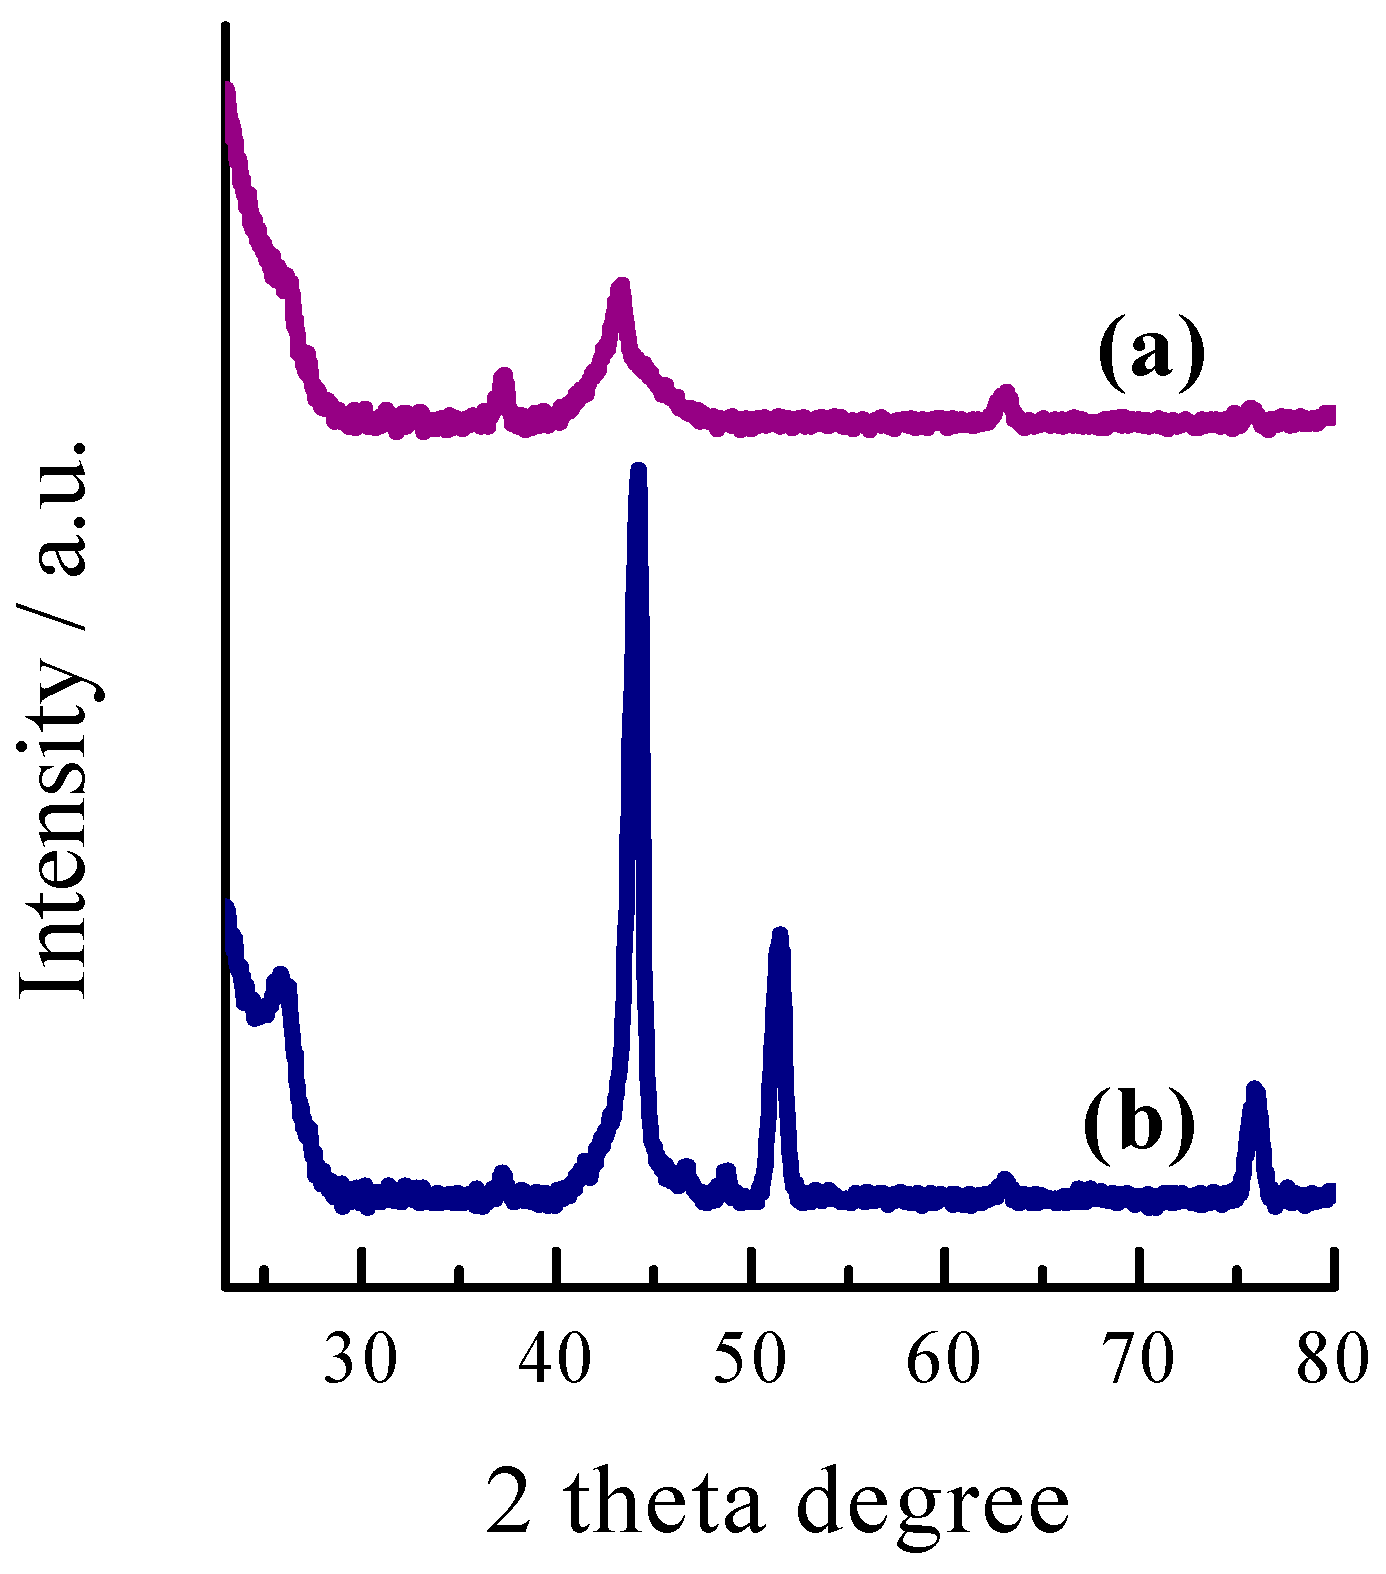
Figure 5.
XPS (a) survey, (b) C 1s, (c) N 1s, (d) O 1s, and (e) Ni 2p spectra of nitrogen-doped activated carbon (AWC-N) and nitrogen-doped activated carbon supported nickel nanoparticles (AWC-Ni-N).
Figure 5.
XPS (a) survey, (b) C 1s, (c) N 1s, (d) O 1s, and (e) Ni 2p spectra of nitrogen-doped activated carbon (AWC-N) and nitrogen-doped activated carbon supported nickel nanoparticles (AWC-Ni-N).
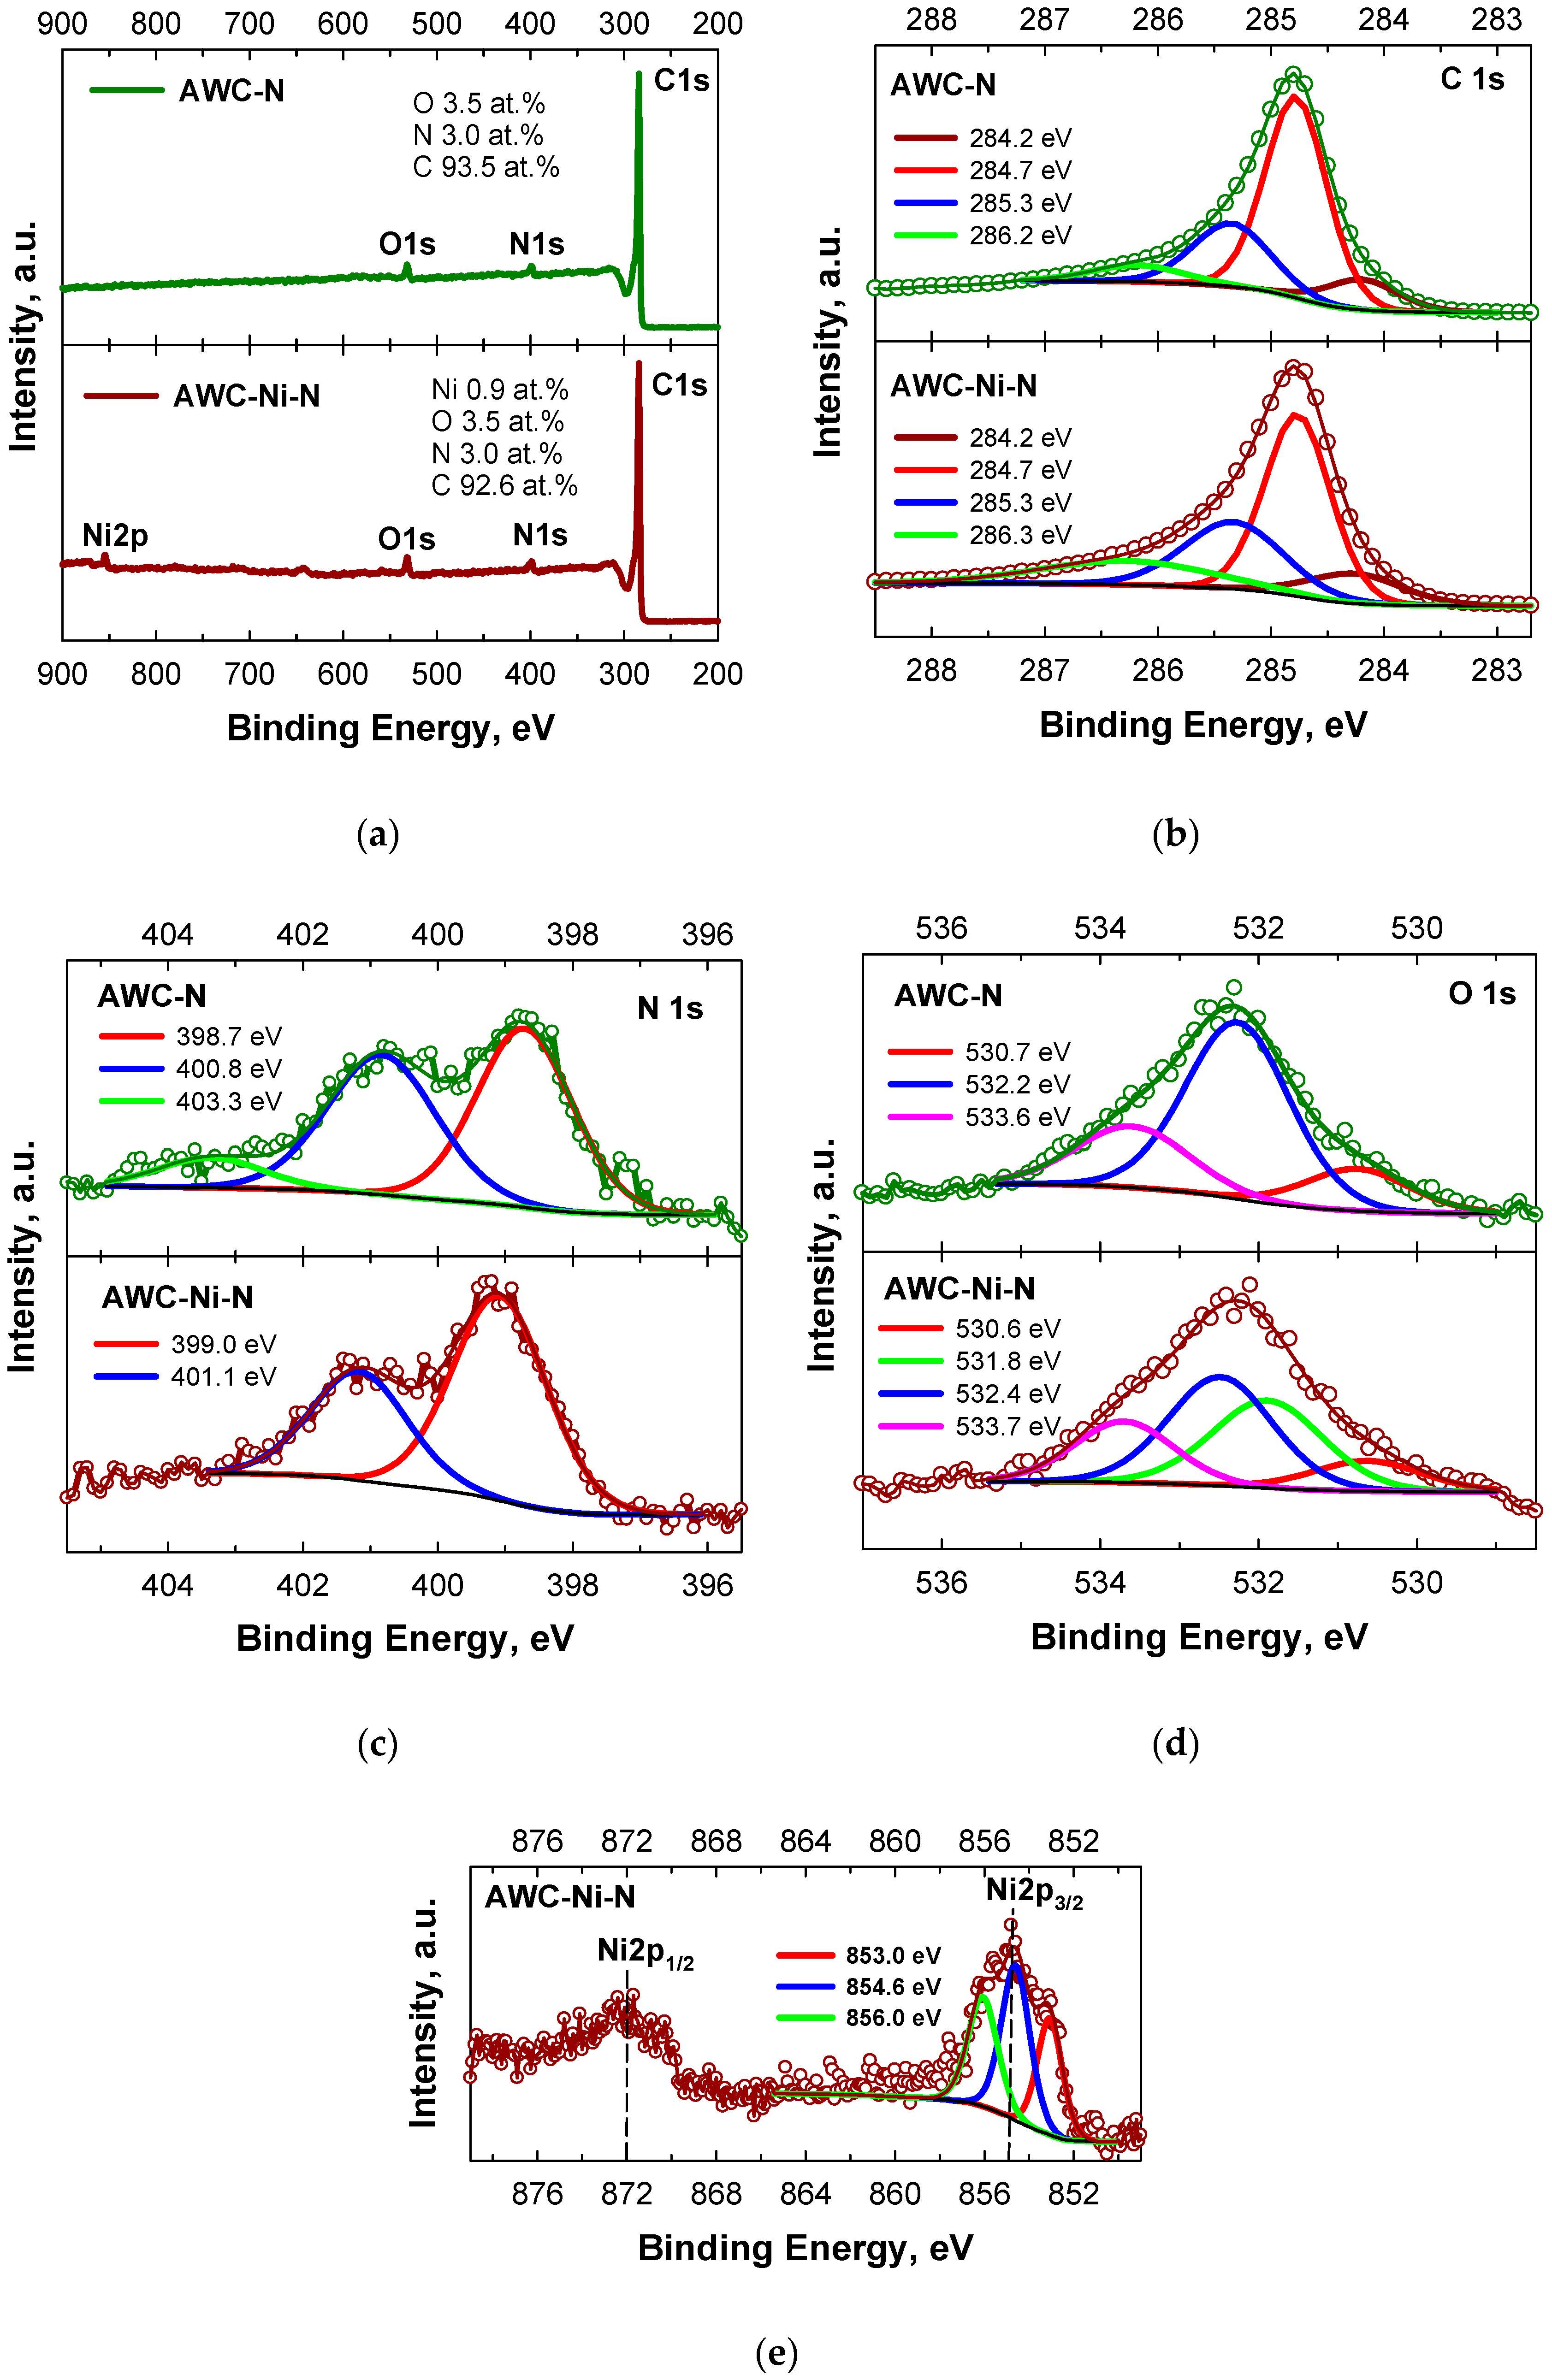
Figure 6.
CVs of AWC-N (a) and AWC-Ni-N (b) catalysts recorded in 1 M KOH and 0.05 M N2H4 + 1 M KOH at 50 mV s–1, T = 25°C.
Figure 6.
CVs of AWC-N (a) and AWC-Ni-N (b) catalysts recorded in 1 M KOH and 0.05 M N2H4 + 1 M KOH at 50 mV s–1, T = 25°C.
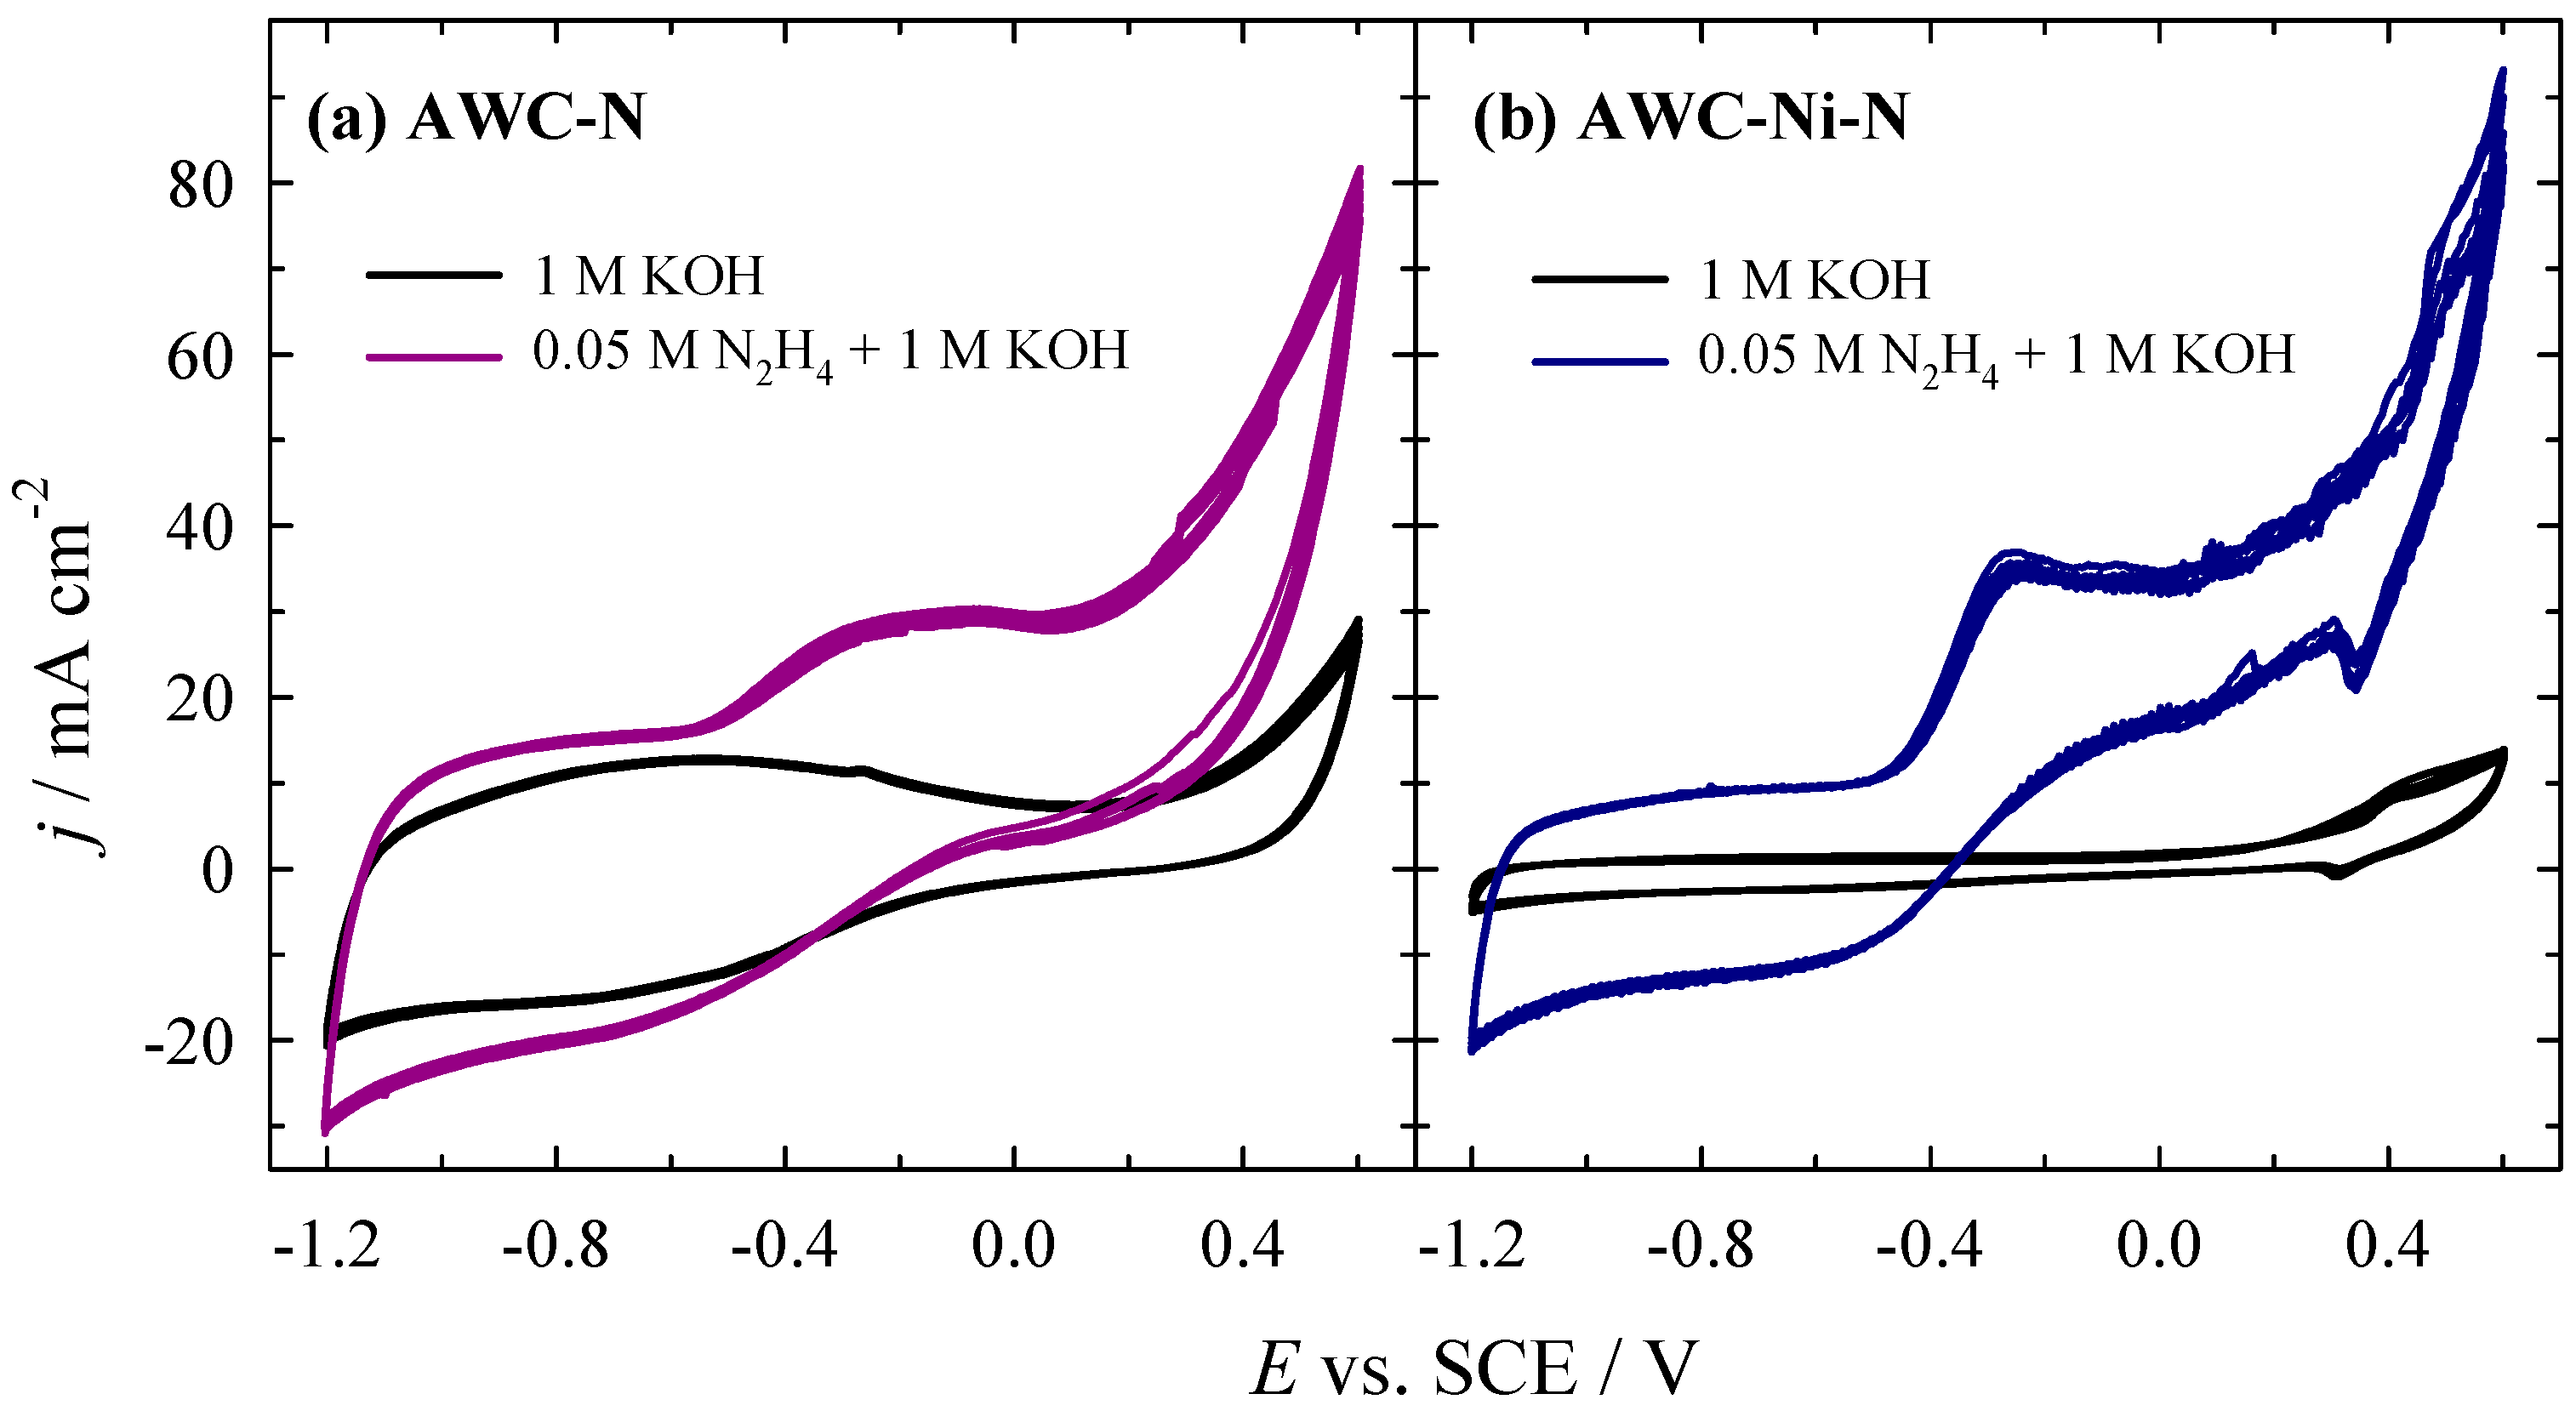
Figure 7.
LSVs of AWC-N (a) and AWC-Ni-N (b) catalysts recorded in 0.025-0.10 M N2H4 + 1 M KOH at 50 mV s–1, T = 25°C.
Figure 7.
LSVs of AWC-N (a) and AWC-Ni-N (b) catalysts recorded in 0.025-0.10 M N2H4 + 1 M KOH at 50 mV s–1, T = 25°C.
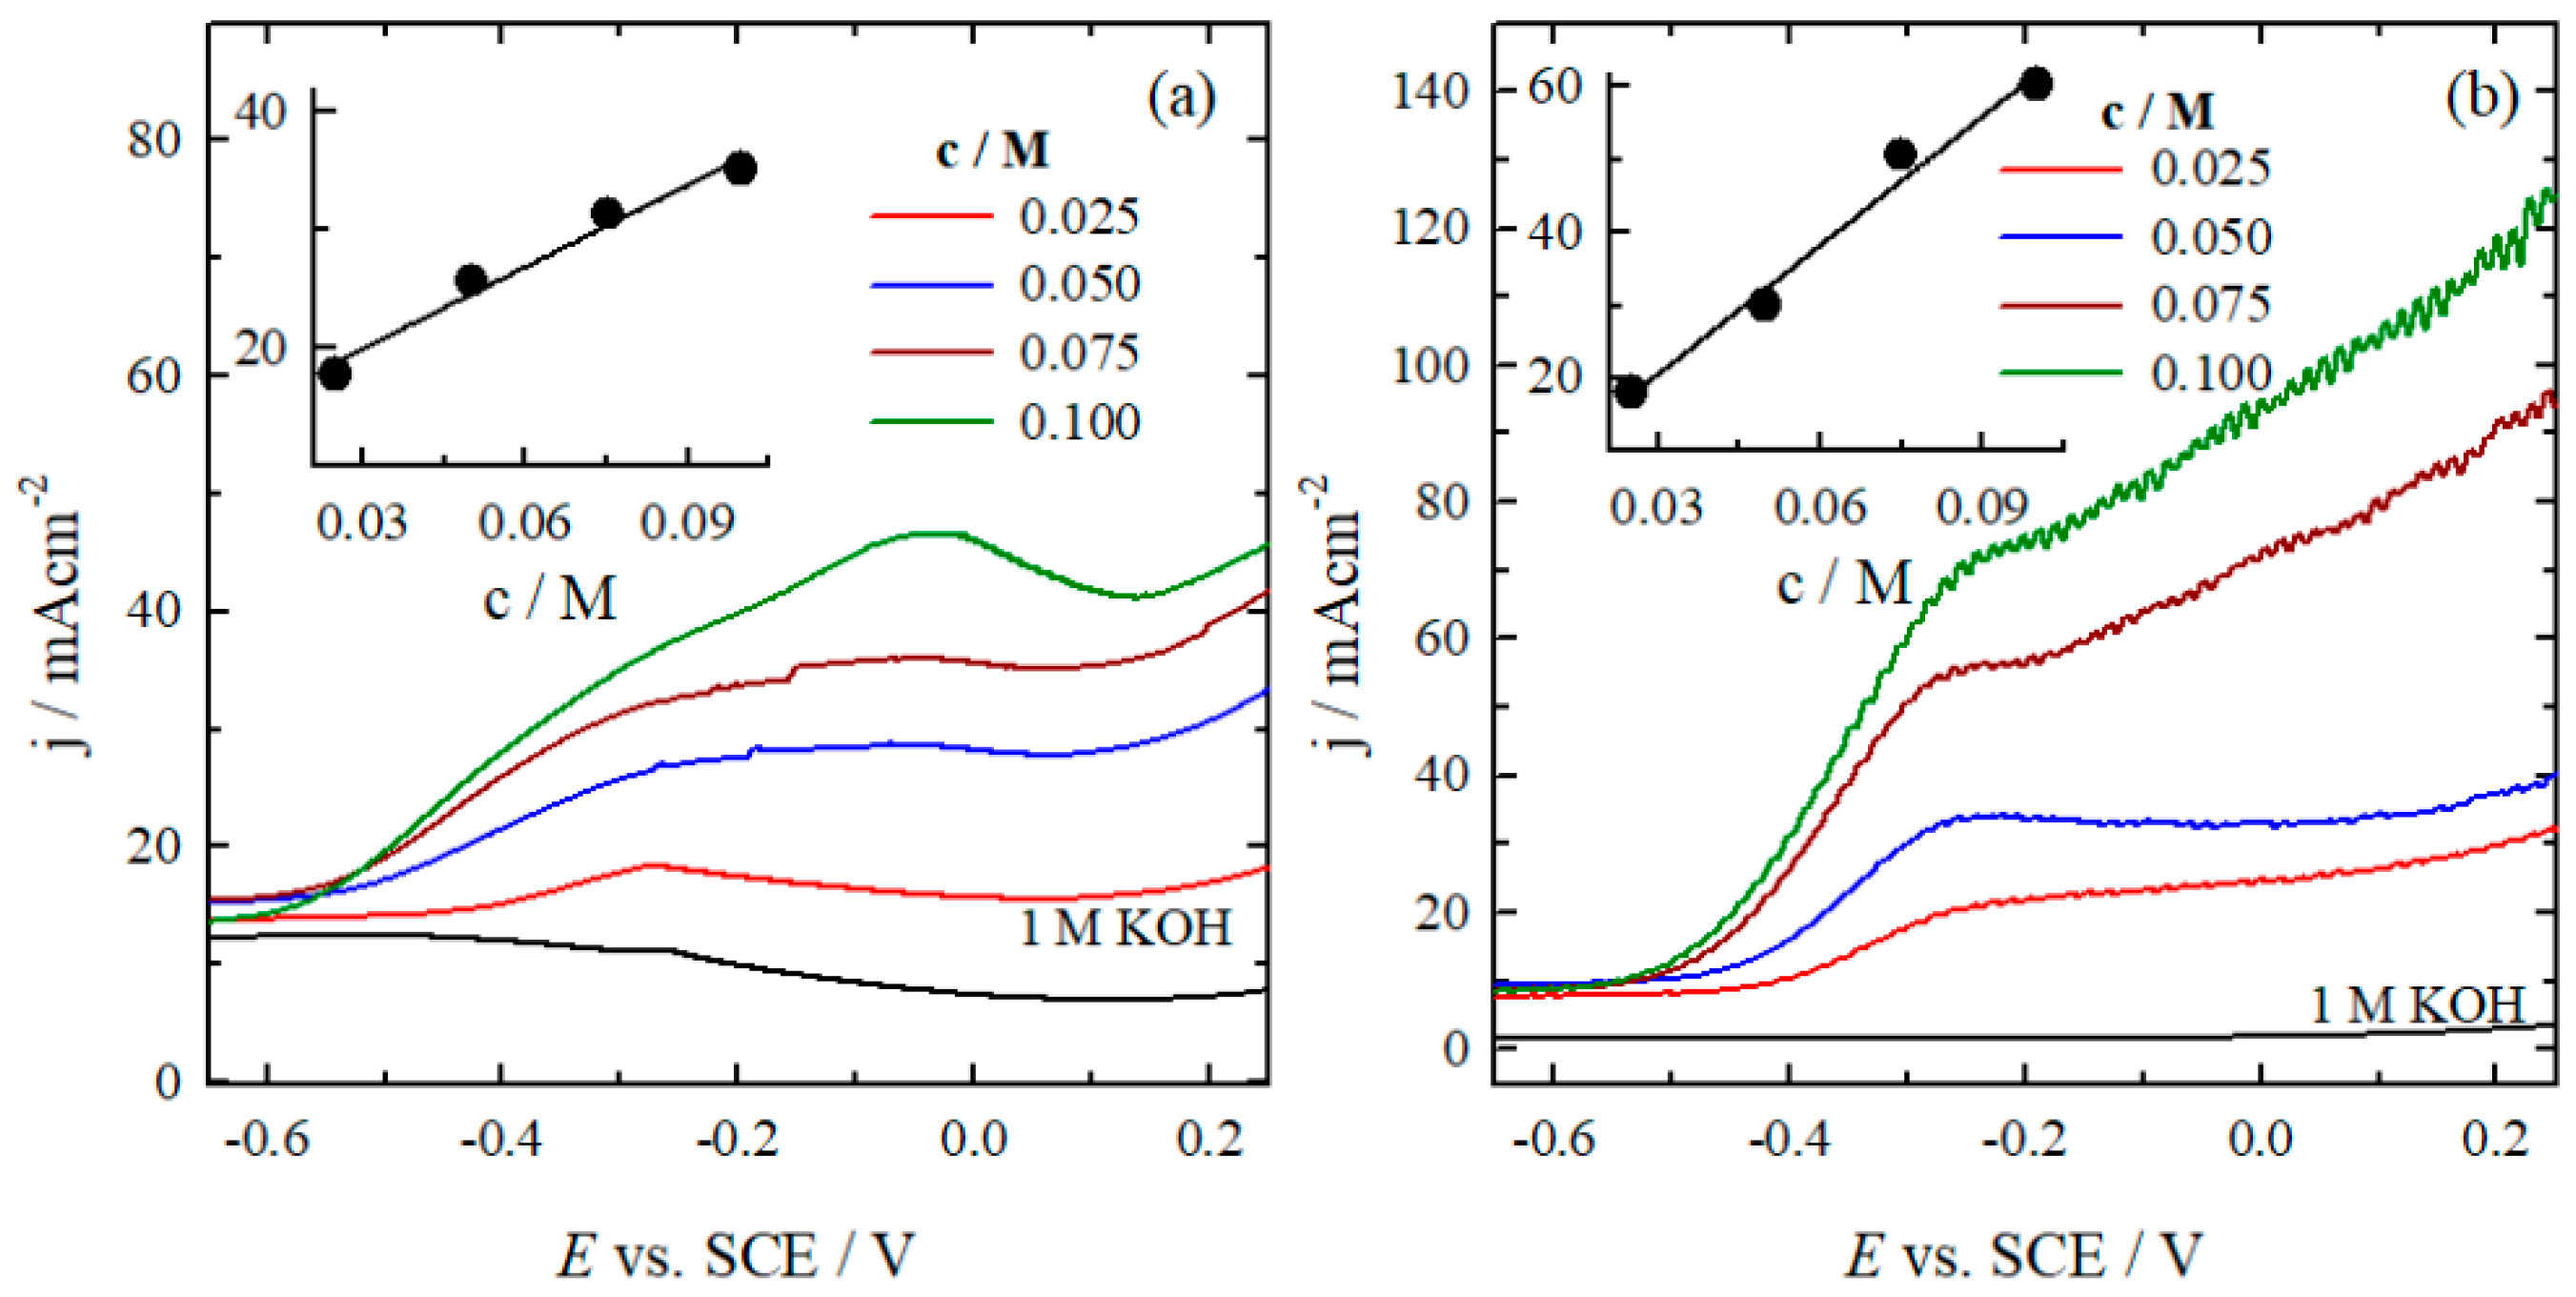
Figure 8.
LSVs of AWC-N (a) and AWC-Ni-N (b) catalysts recorded in 0.05 M N₂H₄ + 1 M KOH at different potential scan rates, T = 25°C.
Figure 8.
LSVs of AWC-N (a) and AWC-Ni-N (b) catalysts recorded in 0.05 M N₂H₄ + 1 M KOH at different potential scan rates, T = 25°C.
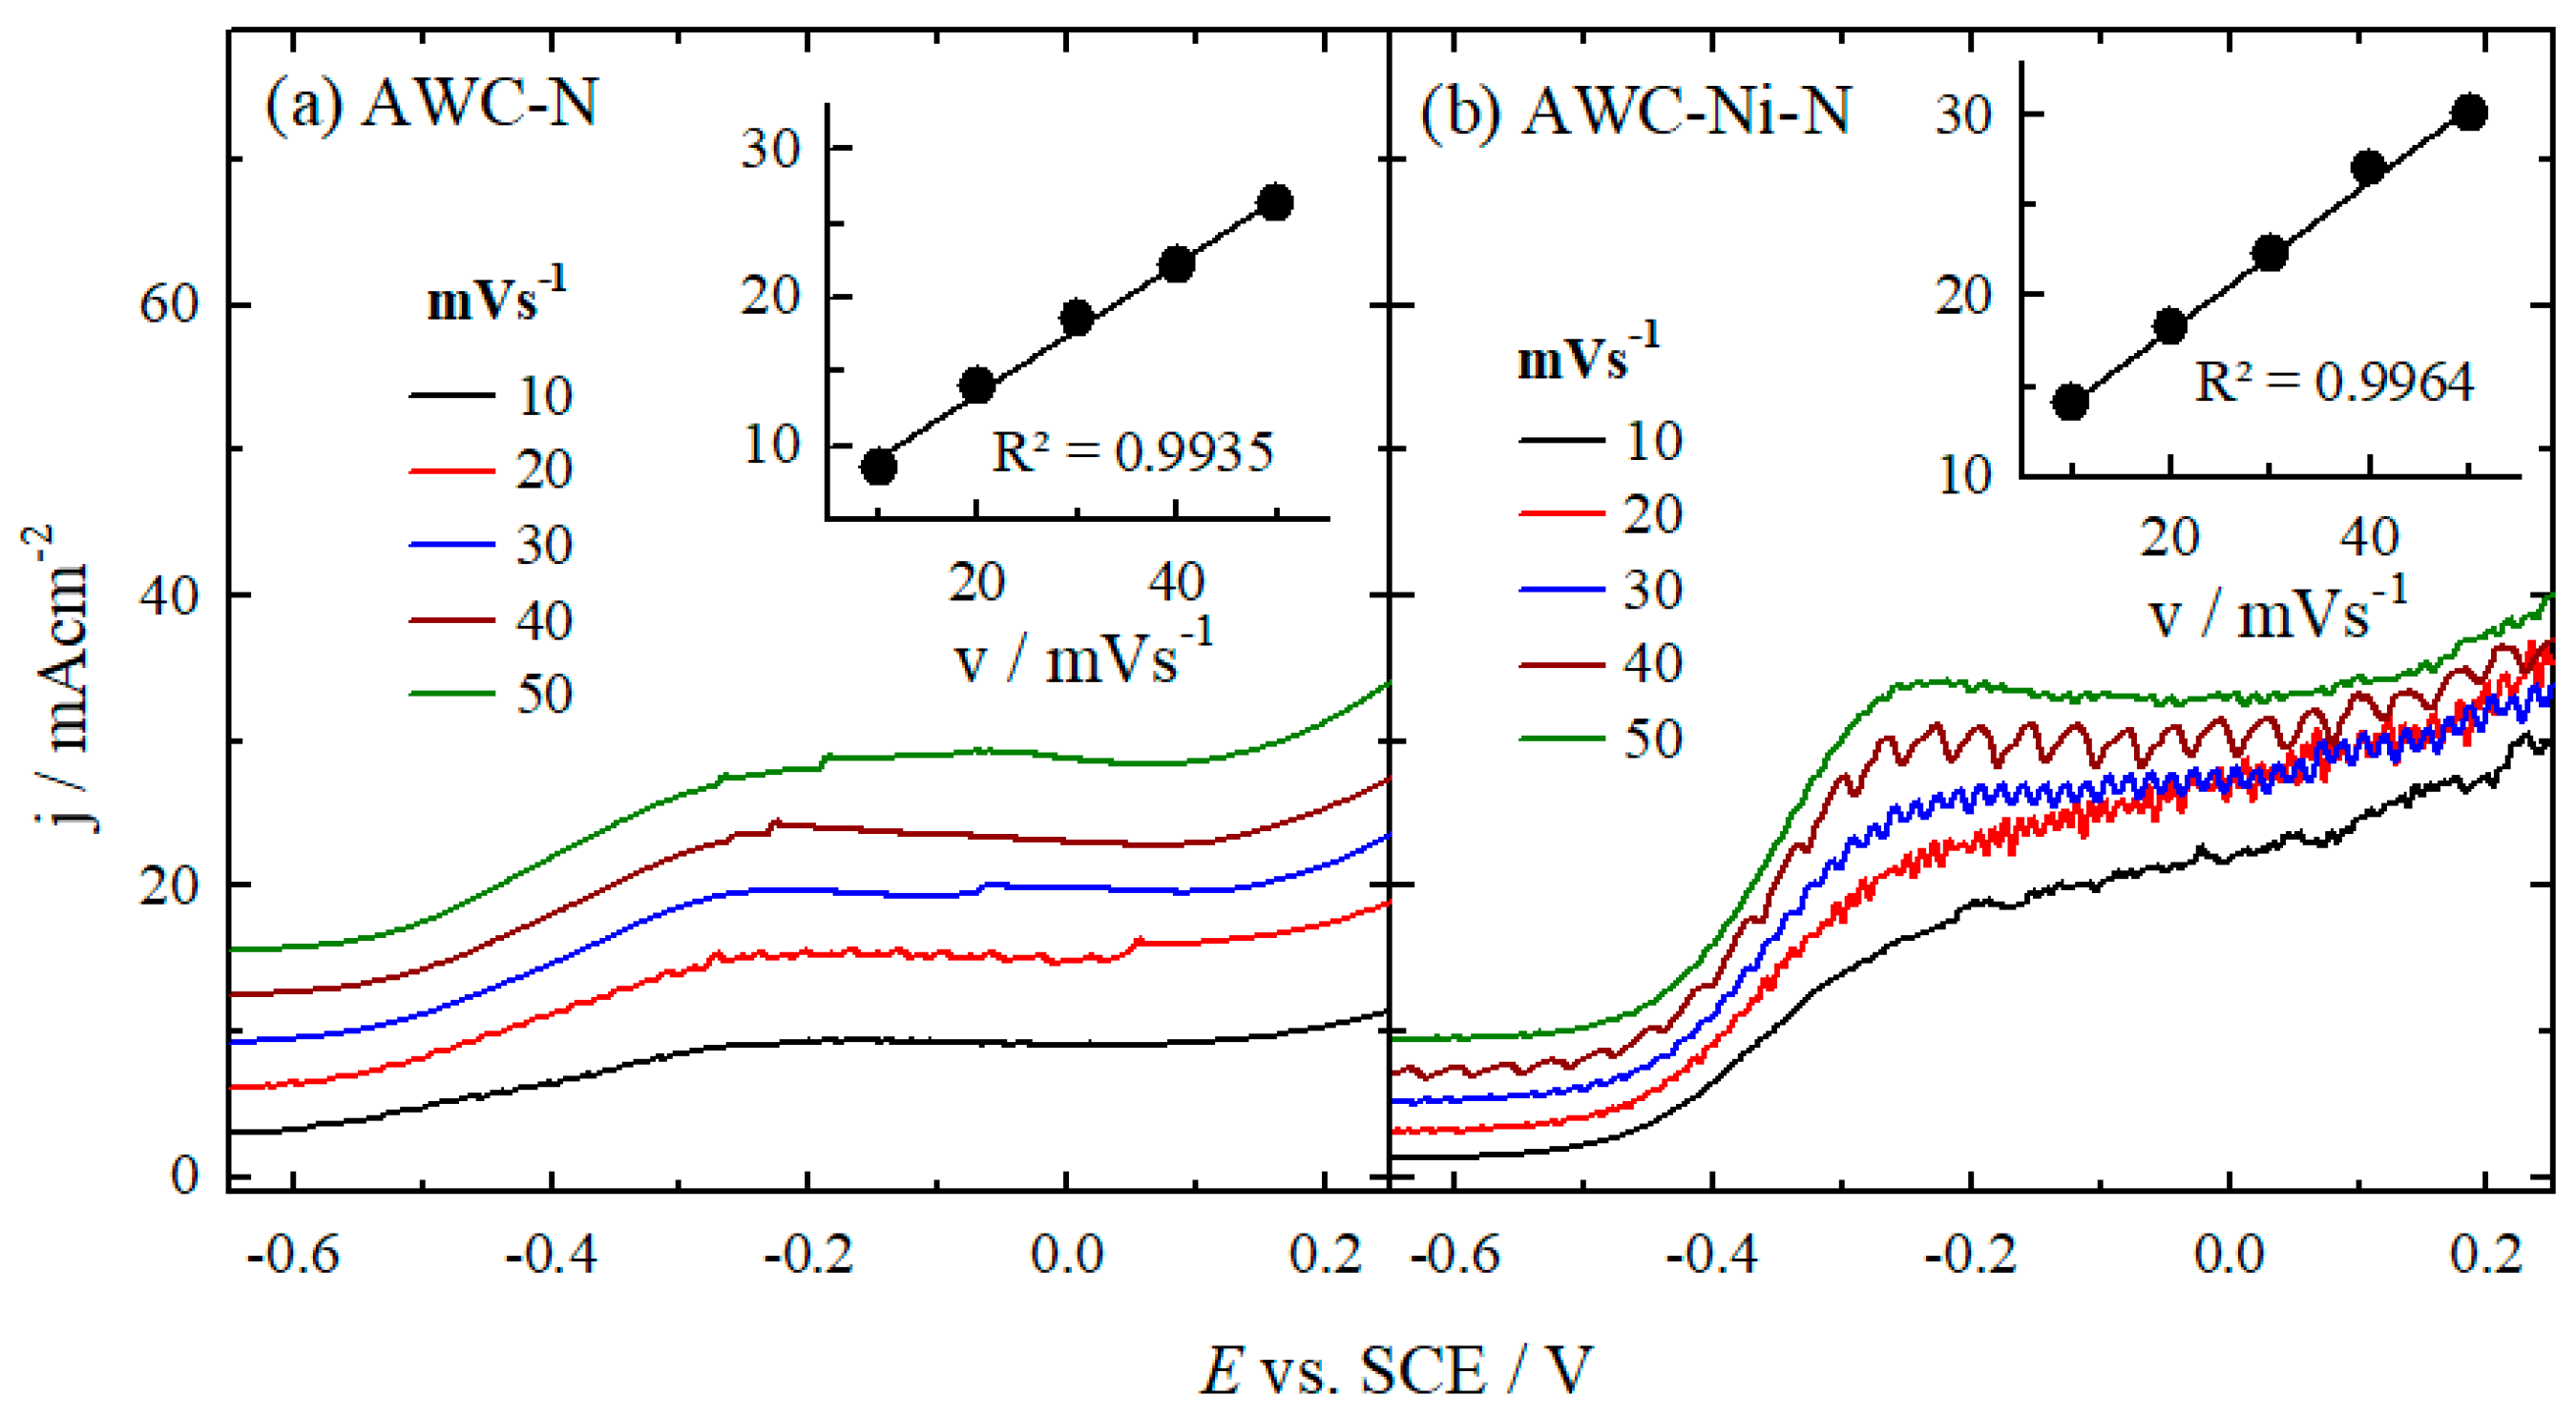
Figure 9.
Cell polarization and power density curves for the direct N2H4-H2O2 fuel cell using (a) AWC-N and (b) AWC-Ni-N catalysts as the anodes/cathodes with anolyte consisting of 1 M N2H4 and 1 M KOH and 5 M H2O2 and 1.5 M HCl catholyte at different temperatures.
Figure 9.
Cell polarization and power density curves for the direct N2H4-H2O2 fuel cell using (a) AWC-N and (b) AWC-Ni-N catalysts as the anodes/cathodes with anolyte consisting of 1 M N2H4 and 1 M KOH and 5 M H2O2 and 1.5 M HCl catholyte at different temperatures.
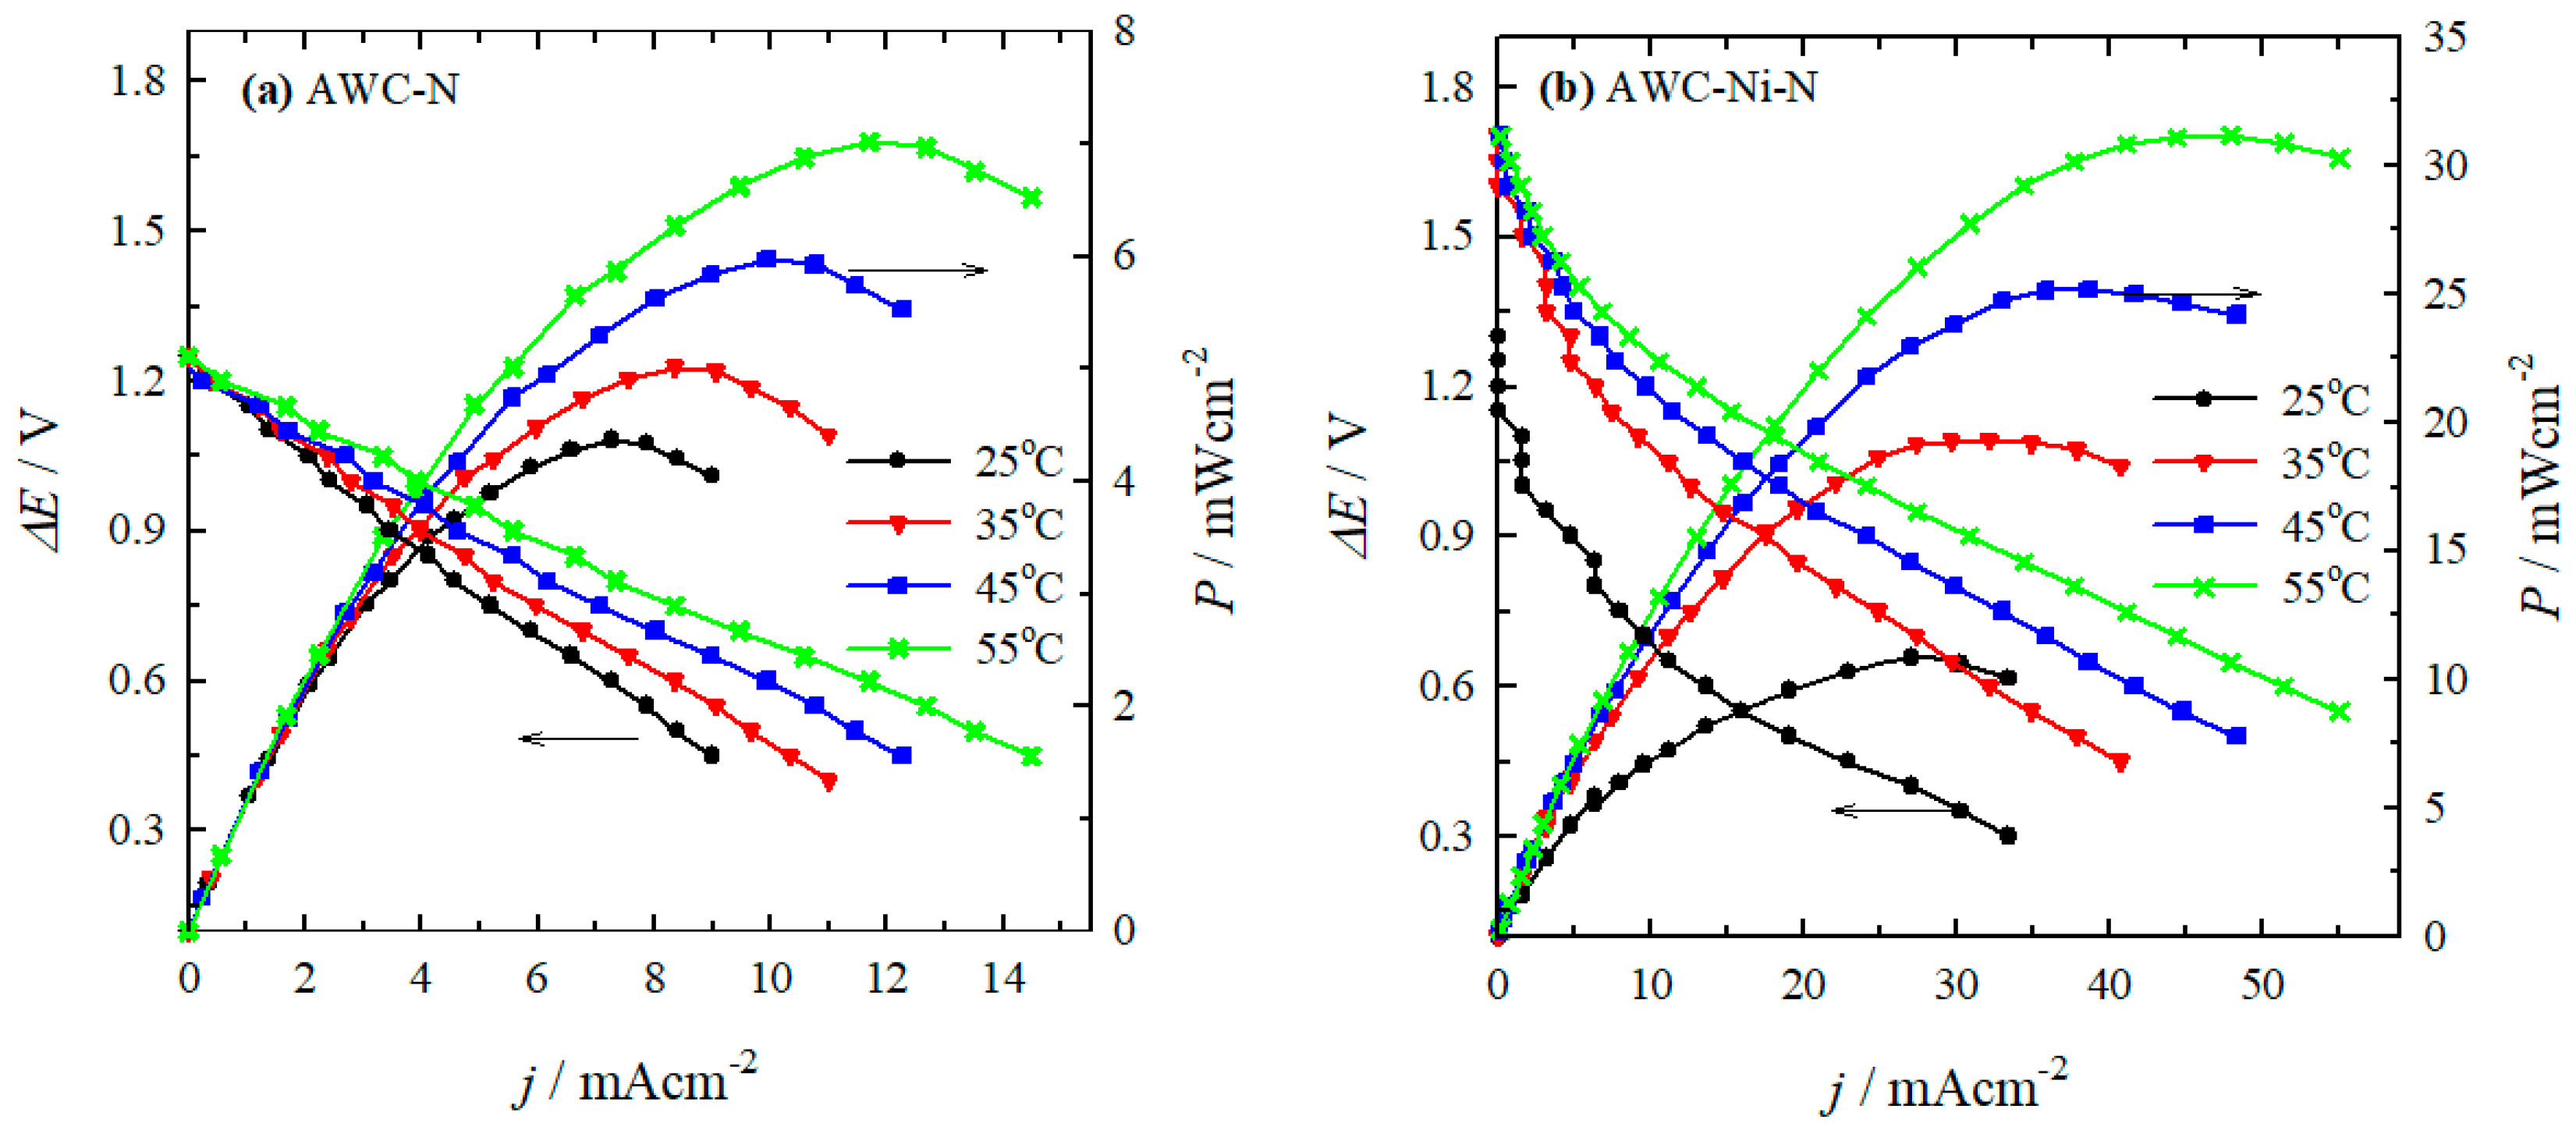

Table 1.
Porous structure parameters of the AWC-N and AWC-Ni-N catalysts.
| Sample | Specific surface area, m2 g–1 | Pore volume, cm3 g–1 | Average pore width, nm | Mesopores from Vt, % |
||||
|---|---|---|---|---|---|---|---|---|
| BET | DR | DFT | total | micro | meso | |||
| AWC-N | 2217 | 1921 | 1496 | 1.6 | 0.7 | 0.9 | 2.9 | 56.6 |
| AWC-Ni-N | 2050 | 1791 | 1387 | 1.3 | 0.6 | 0.6 | 2.5 | 49.7 |
Table 2.
G-peak full width at half maximum FWHM(G), average crystallite size La, and intensity ratio I(D'')/I(G) of carbon-based samples.
Table 2.
G-peak full width at half maximum FWHM(G), average crystallite size La, and intensity ratio I(D'')/I(G) of carbon-based samples.
| Sample | FWHM(G) (cm–1) | La (nm) | I(D'')/I(G) |
|---|---|---|---|
| AWC-N | 55.7 | 13.6 | 0.51 |
| AWC-Ni-N | 49.8 | 16.1 | 0.55 |
Table 3.
XPS analysis of the elemental composition of AWC-N and AWC-Ni-N.
| Sample | C 1s | N 1s | O 1s | Ni 2p3/2 | ||||
|---|---|---|---|---|---|---|---|---|
| Eb, eV | at. % | Eb, eV | at. % | Eb, eV | at. % | Eb, eV | at. % | |
| AWC-N | 284.2 | 10.49 | 398.7 | 48.38 | 530.7 | 14.89 | ||
| 284.7 | 59.27 | 400.8 | 42.72 | 532.2 | 61.86 | |||
| 285.3 | 23.13 | 403.3 | 8.90 | 533.5 | 23.25 | |||
| 286.2 | 7.11 | |||||||
| AWC-Ni-N | 284.2 | 11.02 | 399.0 | 64.79 | 530.6 | 10.91 | 853.0 | 27.71 |
| 284.7 | 46.92 | 401.1 | 35.21 | 531.8 | 31.82 | 854.6 | 41.55 | |
| 285.3 | 26.00 | 532.4 | 37.26 | 856.0 | 30.75 | |||
| 286.3 | 16.06 | 533.7 | 20.00 | |||||
Table 4.
Electrochemical parameters of the N2H4-H2O2 employing the AWC-N and AWC-Ni-N аnode/cathode catalysts.
Table 4.
Electrochemical parameters of the N2H4-H2O2 employing the AWC-N and AWC-Ni-N аnode/cathode catalysts.
| Catalyst | T (oC) | Peak power density (mW cm–2) |
j at peak power density (mA cm–2) | E at peak power density (V) |
|---|---|---|---|---|
| AWC-N | 25 | 4.4 | 7.3 | 0.60 |
| 35 | 5.0 | 8.4 | 0.60 | |
| 45 | 6.0 | 9.9 | 0.60 | |
| 55 | 7.0 | 11.7 | 0.60 | |
| AWC-Ni-N | 25 | 10.8 | 27.0 | 0.40 |
| 35 | 19.3 | 32.2 | 0.60 | |
| 45 | 25.1 | 38.6 | 0.65 | |
| 55 | 31.1 | 47.9 | 0.65 |
Disclaimer/Publisher’s Note: The statements, opinions and data contained in all publications are solely those of the individual author(s) and contributor(s) and not of MDPI and/or the editor(s). MDPI and/or the editor(s) disclaim responsibility for any injury to people or property resulting from any ideas, methods, instructions or products referred to in the content. |
© 2025 by the authors. Licensee MDPI, Basel, Switzerland. This article is an open access article distributed under the terms and conditions of the Creative Commons Attribution (CC BY) license (http://creativecommons.org/licenses/by/4.0/).
Copyright: This open access article is published under a Creative Commons CC BY 4.0 license, which permit the free download, distribution, and reuse, provided that the author and preprint are cited in any reuse.


