
Submitted:
08 March 2025
Posted:
10 March 2025
You are already at the latest version
Abstract
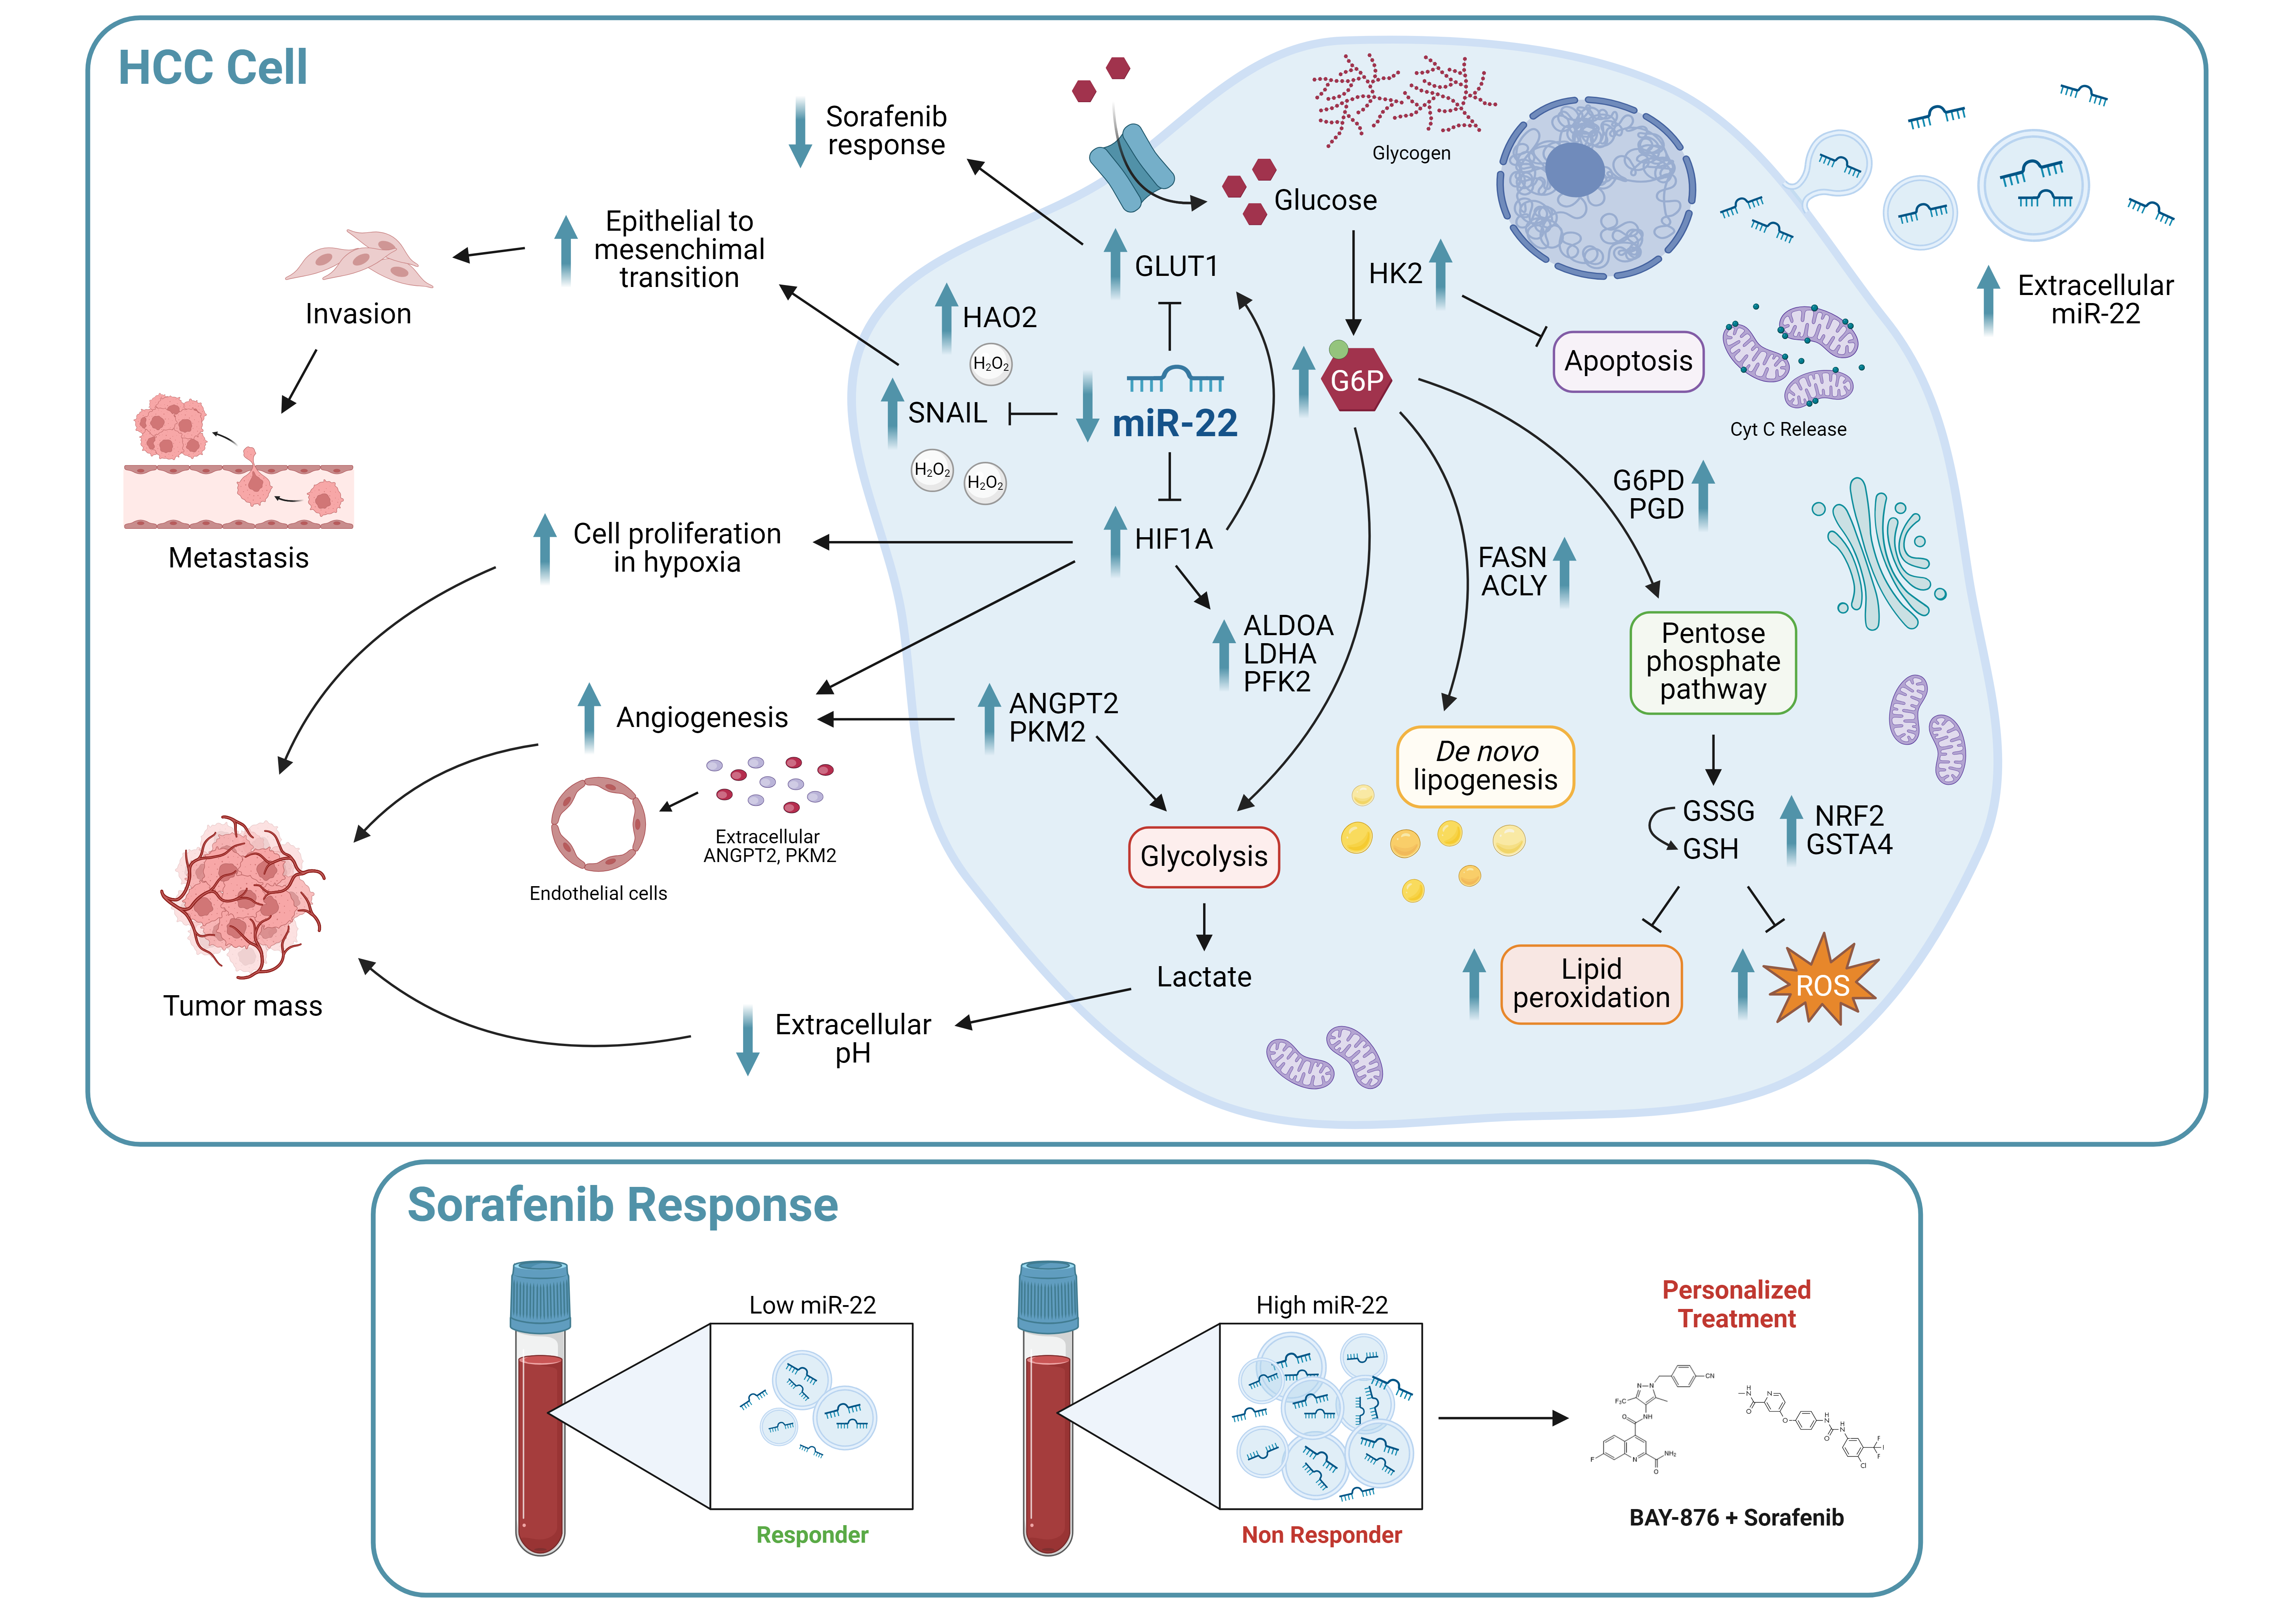
Immunotherapy approval has revolutionized the management of hepatocellular carcinoma (HCC) patients. Sorafenib remains a first-line therapeutic option for those patients who are ineligible for immunotherapy, but the onset of resistance compromises treatment efficacy, making the need for biomarkers more urgent. This study aims to investigate the role of miR-22 in metabolic reprogramming and as a possible candidate in HCC. QPCR analysis of miR-22 was performed in HCC patients and preclinical models. GLUT1 targeting by miR-22 was investigated in HCC cells by functional analysis. MiR-22/GLUT1 axis involvement in metabolic changes, tumor aggressiveness, and sorafenib response was evaluated by cellular and metabolic assays. Circulating miR-22 was analyzed in sorafenib-treated HCC patients and rats. MiR-22 is downregulated in HCCs and associates with aggressive tumor features. MiR-22 modulates HIF1A pathway and survival in stressful conditions. It induces glycolytic shift and enhances cancer cell plasticity and sorafenib resistance by GLUT1 targeting. High miR-22 serum levels associate with sorafenib resistance in HCC patients and rats. GLUT1 inhibition in low miR-22-expressing HCC cells ameliorates sorafenib efficacy. MiR-22 deserves attention as a predictive biomarker of sorafenib response. GLUT1 inhibition could be exploited in combination with sorafenib in HCC patients with high circulating miR-22 levels.
Keywords:
HCC
; miR-22
; GLUT1
; sorafenib
1. Introduction
The introduction should briefly place the study in a broad context and highlight why it is important. It should define the purpose of the work and its significance. The current state of the research field should be carefully reviewed and key publications cited. Please highlight controversial and diverging hypotheses when necessary. Finally, briefly mention the main aim of the work and highlight the principal conclusions. As far as possible, please keep the introduction comprehensible to scientists outside your particular field of research. References should be numbered in order of appearance and indicated by a numeral or numerals in square brackets—e.g., [1] or [2,3], or [4,5,6]. See the end of the document for further details on references.
Hepatocellular carcinoma (HCC) represents the third cancer-associated cause of mortality worldwide, with increasing prevalence of metabolic syndrome among HCC risk factors in western countries [1]. Although immunotherapy has revolutionized the management of HCC patients, improving overall survival at advanced stages [2,3], some patients are not eligible for treatment with immune checkpoint inhibitors (ICIs). In these cases, sorafenib and lenvatinb represent the first line treatments of choice [4]. Vascular disorders and arterial hypertension may prevent the use of ICIs, while HCCs arising in the setting of non-alcoholic steatohepatitis (NASH) or with aberrant WNT/β-catenin activation appear to be less responsive to immunotherapy [5,6], underlying the need for patient stratification for tailored treatments. As no biomarker predictive of drug response has yet entered the clinical practice, the recommendation of the most appropriate treatment and sequence choice relies only on patient’s clinical, radiological, and biochemical profile. One limitation of this approach is that it does not consider the genetic and molecular background of this heterogeneous tumor, increasing the risk of acquired resistance onset and ultimately leading to disease progression.
The aberrant expression of microRNAs (miRs) in HCC has been extensively documented [7], as well as their relevance in the modulation of drug response [8]. MiR-22 is frequently downregulated in cancers [9,10,11], including HCC [12], and is considered a tumor suppressor miRNA. Intriguingly, miR-22 not only exerts an autologous effect on tumor cells, but also modifies the tumor microenvironment (TME) [13,14], making it an interesting therapeutic target in association with TKIs or ICIs. Several miR-22 targets are involved in tumor-promoting processes, such as epithelial-to-mesenchymal transition (EMT), hypoxia signaling, and metastasis [15,16]. MiR-22 modulates key metabolic genes such as ATP citrate lyase (ACLY) and enolase 1 (ENO1) in different cancer types [17,18], suggesting its prominent role in modulating the so-called ‘Warburg effect’. Metabolic reprogramming is a cancer hallmark [19], an early event in HCC animal models [20] and is involved in sorafenib resistance [21]. Consistent with a glycolytic metabolism, the glucose transporter GLUT1 is overexpressed in many tumors and represents a critical player in HCC tumorigenesis [22].
In the last years, sorafenib was extensively explored in the preclinical setting and several molecular mechanisms, including metabolic aspects [23], associated with the onset of drug resistance, paving the way for the development of combined treatments based on metabolic inhibitors. Here, we investigated the role of the miR-22/GLUT1 axis in hepatocarcinogenesis, glycolytic shift, and sorafenib resistance, and evaluated miR-22 as a circulating biomarker of sorafenib response in HCC.
2. Results
This section may be divided by subheadings. It should provide a concise and precise description of the experimental results, their interpretation, as well as the experimental conclusions that can be drawn.
2.1. MiR-22 Is Downregulated in HCC and Associates with Aggressive Features and Poor Survival
We previously performed a genome-wide microarray analysis showing the downregulation of miR-22-3p (henceforth referred to as miR-22) in the DEN-HCC rat model [24], which we demonstrated to be a reliable preclinical tool for hepatocarcinogenesis [25]. Real Time PCR analysis confirmed the downregulation of miR-22 in tumor specimens from human (2.0-fold change, down in 74% of cases) and rat (1.4-fold change, down in 65% of cases) HCCs with respect to matched non-tumor livers (Figure 1A, B). A negative correlation between miR-22 and alpha-fetoprotein (AFP) was observed in the rat model (Figure 1C). Lower miR-22 levels associated with microvascular invasion (MVI), tumor grade and TP53 mutations (Figure 1D-F) and with worse overall survival (Figure 1G). Interestingly, more than half of analyzed genes resulted deregulated when comparing high versus low miR-22 expression in the “LIHC” dataset (Figure S1A, supplementary material). Pathways analysis and gene set enrichment analysis (GSEA) showed a positive enrichment for pathways associated with oxidative phosphorylation and lipid metabolism, and a negative one for cell cycle progression and cancer-associated pathways (Figure 1H, S1B, supplementary material). These findings highlight the tumor suppressor role of miR-22, its association with poor survival, and its involvement in the regulation of cancer metabolism in HCC.
2.2. MiR-22 Downregulation Increases 2D and 3D Cell Growth and Activates HIF-1A Signaling
We analyzed miR-22 expression in HCC cell lines and observed similar miRNA levels with respect to liver tumors, suggesting that our cell lines are representative of HCC (Figure S2A). We generated HCC cell clones stably silencing or overexpressing miR-22. Specifically, miR-22 was silenced in TP53 WT HepG2 cells (MZIP-22) and overexpressed in TP53 mutated Huh-7 cells (pMXs-22). The modulation of miR-22 expression was confirmed by qPCR analysis (Figure 2A). Silencing of miR-22 increased HepG2 cell growth, whereas its overexpression impaired Huh-7 cell growth, compared to controls. WB analysis showed a decrease in apoptotic markers in miR-22-silenced HepG2 cells, and an upregulation in miR-22-overexpressing Huh-7 cells (Figure 2B).
When grown in 3D, miR-22-silenced HepG2 cells displayed increased sphere number and size, decreased apoptotic genes, and increased monospheroids volume (Figure 2C, S2B, S2C). In contrast, miR-22-overexpressing Huh-7 cells showed decreased spheroid dimensions and the activation of the apoptotic cascade (Figure 2C). The stem-associated markers SOX2 and PROM1/CD133 showed an opposite behavior between the two cell lines suggesting their involvement in spheroid formation (Figure 2D). Consistently, SOX2 expression was upregulated in low miR-22-expressing HCCs and associated with a shorter overall survival in the “LIHC” cohort (Figure S2D, E).
In HCC patients, we observed that high HIF-1A levels associate with low miR-22 expression and poor survival (Figure S2F, G). We therefore investigated whether miR-22 modulates the HIF-1A pathway, as reported in colon cancer [15], by analyzing the expression of metabolic target genes. Increased HIF-1A levels and transcriptional activity were detected in miR-22-silenced HepG2 cells and spheroids, whereas the opposite was observed in miR-22-overexpressing Huh-7 cells and spheroids (Figure 2E, S2H). Higher nuclear HIF-1A levels were identified in miR-22-silenced HepG2 cells, whereas lower levels were found in miR-22-overexpressing Huh-7 cells (Figure 2F), confirming the activation of this pathway. The cell growth advantage was maintained by miR-22-silenced HepG2 cells under hypoxic conditions induced by CoCl2, whereas an impairment in cell growth was detected in miR-22-overexpressing Huh-7 cells with respect to controls. In the same setting, decreased caspase signaling was detected in miR-22-silenced HepG2 cells while the opposite was registered in miR-22-overexpressing Huh-7 cells (Figure 2G, H). In agreement, high levels of HIF-1A transcriptional targets were found in low miR-22-expressing HCC patients (Figure S2I). These findings demonstrate that miR-22 modulates 2D and 3D cell growth, stemness features, and HIF-1A signaling in HCC, conferring a cell survival advantage even under hypoxic conditions.
2.3. MiR-22 Downregulation Increases Cell Migration and In Vivo Tumorigenesis
We evaluated the involvement of miR-22 in cell migration and observed an increased migratory capacity in miR-22-silenced HepG2 cells, whereas a reduced wound closure was detected in miR-22-overexpressing Huh-7 cells. Higher expression of the EMT marker SNAIL was detected in miR-22-silenced HepG2 cells, which displayed a fibroblast-like phenotype (Figure S3A), whereas the opposite was observed in miR-22-overexpressing Huh-7 cells (Figure 3A). Regarding in vivo experiments, miR-22-silenced HepG2 cells resulted in larger tumor masses in xenograft mice, whereas miR-22-overexpressing Huh-7 cells resulted in smaller tumors (Figure 3B, S3B). Consistent with in vitro findings, an upregulation of HIF1A-related genes and SNAI1 was detected in tumors from miR-22-silenced HepG2 cells, whereas their downregulation was observed in tumors from miR-22-overexpressing Huh-7 cells (Figure 3C, D). A downregulation of apoptotic markers was observed in miR-22-silenced HepG2-derived tumors and an upregulation in miR-22-overexpressing Huh-7-derived tumors (Figure 3E, F). These findings prove that miR-22 influences cell migration, EMT characteristics and tumorigenesis in the preclinical setting of HCC.
2.4. MiR-22 Modulates Metabolic Reprogramming and Oxidative Stress in HCC Cells
We investigated the role of miR-22 in the metabolic reprogramming of HCC by evaluating the targeting of GLUT1, a hypothetical target gene detected by bioinformatics tools (Figure S4A). WB analysis confirmed the upregulation of GLUT1 expression in miR-22-silenced HepG2 cells and the downregulation in miR-22-overexpressing Huh-7 cells (Figure 4A). The reporter assay detected decreased luciferase activity following co-transfection of WT, but not mutant, GLUT1 3'UTR vector with miR-22 oligonucleotides in HCC cells (Figure 4B), demonstrating the direct targeting of GLUT1 by miR-22. To investigate whether miR-22 regulates GLUT1 expression independently of HIF1A-mediated transcription, we silenced HIF1A in miR-22-silenced and control HepG2 cells. HIF-1A silencing resulted in GLUT1 downregulation in control but not in miR-22-silenced HepG2 cells, proving that miR-22 contributes to both the direct and indirect regulation of GLUT1 (Figure S4B).
The crosstalk between GLUT1, extracellular pH and tumor growth is well documented [26] and we have consistently observed that low extracellular pH triggers GLUT1 expression in HCC cells (Figure S4C). When grown in an acidic environment, an opposite regulation of GLUT1 expression was observed in miR-22-silenced HepG2 cells and miR-22-overexpressing Huh-7 cells, indicating that miR-22 targets GLUT1 even under microenvironmental conditions that stimulate its expression (Figure 4C). In this setting, miR-22-silenced HepG2 cells showed a higher cell viability, which was partially impaired by treating cells with the GLUT1-specific inhibitor BAY-876. On the contrary, decreased cell viability was observed in miR-22-overexpressing Huh-7 cells (Figure 4D).
Given the influence of GLUT1 on glucose metabolism, we measured glucose uptake and lactate excretion in HCC cells. MiR-22-silenced HepG2 cells showed increased glucose uptake and extracellular lactate secretion over time (Figure 4E). On the contrary, miR-22-overexpressing Huh-7 cells showed lower intracellular lactate levels and no changes in glucose uptake and extracellular lactate content (Figure S4D). Regarding oxygen consumption, no significant modulation of cellular respiration rates was observed in miR-22-silenced HepG2 cells, whereas increased uncoupled respiration and citrate synthase activity were detected in miR-22-overexpressing Huh-7 cells (Figure S4E, F). Analyzing the glycolytic pathway, we observed increased expression of glycolytic genes in miR-22-silenced HepG2 cells and low miR-22-expressing HCC patients, while we detected reduced expression in miR-22-overexpressing Huh-7 cells (Figure S4G). Decreased levels of the key glycolytic metabolite fructose-1,6-biphosphate (F-1,6-BP) were detected in miR-22-silenced HepG2 cells, while the opposite was observed in miR-22-overexpressing Huh-7 cells (Figure S4H).
Together with alterations in the glycolytic pathway, increased glycogen accumulation was detected in miR-22-silenced HepG2 cells and xenografts. Notably, BAY-876 treatment reversed this effect, suggesting the role of GLUT1 in miR-22-mediated glycogen storage. On the contrary, decreased glycogen levels were found in miR-22-overexpressing Huh-7 cells and xenografts (Figure 4F, S4I). In addition, an accumulation of lipid droplets was detected in miR-22-silenced HepG2 cells, while a lower number was observed in miR-22-overexpressing Huh-7 cells (Figure 4G). In our cell models, the expression of fatty acid synthase (FASN) and ACLY was modulated accordingly (Figure 4H), highlighting the involvement of miR-22 in the regulation of lipid synthesis and storage in HCC cells. Live imaging analysis of cell growth showed that miR-22-silenced HepG2 cells respond better to glucose deprivation than control cells, supporting the hypothesis that glycogen/lipid accumulation may help survival in the short term. The opposite was observed in miR-22-overexpressing Huh-7 cells (Figure 4I). The inverse correlation between miR-22 and GLUT1 found in tumor specimens from two patient cohorts and in the rat model (Figure 4J) confirms these findings, which highlight the involvement of the miR-22/GLUT1 axis in metabolic plasticity of HCC cells.
Subsequently, we evaluated the redox homeostasis of HCC cells in response to miR-22 modulation. In miR-22-silenced HepG2 cells and miR-22-overexpressing Huh-7 cells we found increased and decreased H2O2 levels in comparison to controls, respectively; in agreement, hydroxyacid oxidase 2 (HAO2) expression reflected intracellular H2O2 levels (Figure S5A, B). Lower mitochondrial ROS levels were detected in miR-22-silenced HepG2 cells, while no changes were shown in miR-22-overexpressing Huh-7 cells (Figure S5C). Higher levels of lipid peroxidation were detected in miR-22-silenced HepG2 cells and lower levels in miR-22-overexpressing Huh-7 cells (Figure S5D), consistent with reduced and increased intracellular glutathione (GSH) levels (Figure S5E). Notably, the pentose phosphate pathway (PPP), which provides NADPH to the glutathione reductase, resulted activated in miR-22-silenced HepG2 cells, as proved by increased G6PD and PGD mRNA levels, and downregulated in miR-22-overexpressing Huh-7 cells (Figure S5F). In line, a decreased accumulation of the 6-phosphogluconate (6-PG) intermediate was detected in miR-22-silenced HepG2 cells, while the opposite was observed in miR-22-overexpressing Huh-7 cells (Figure S5G). As a result of the redox imbalance, a higher expression of genes involved in the redox control (GSTA4, NRF2) was observed in miR-22-silenced HepG2 cells, while a lower expression was detected in miR-22-overexpressing Huh-7 cells (Figure S5H). These preclinical data were confirmed by the TCGA dataset, where higher G6PD levels were detected in low miR-22-expressing patients (Figure S5I). These findings demonstrate that miR-22 modulates the antioxidant response, enabling highly proliferating cancer cells to cope with increased intracellular ROS and lipid peroxidation.
2.5. MiR-22/GLUT1 Axis Influences Sorafenib Resistance in HCC
We investigated whether the miR-22/GLUT1 axis could influence sorafenib response in HCC models. Cell growth of miR-22-silenced HepG2 cells was less affected by sorafenib treatment and GLUT1 resulted upregulated, whereas the co-treatment with the GLUT1 inhibitor BAY-876 partially reverted this result, proving GLUT1 involvement in miR-22-mediated sorafenib resistance. On the contrary, cell growth of miR-22-overexpressing Huh-7 cells was more affected by sorafenib and GLUT1 was downregulated (Figure 5A). Similarly, sorafenib-resistant HepG2 cells showed miR-22 downregulation and GLUT1 upregulation (Figure S6A). Increased cell viability and pAKT levels and decreased caspase signaling were registered in miR-22-silenced HepG2 cells under sorafenib treatment, while the opposite was observed in miR-22-overexpressing Huh-7 cells (Figure S6B).
We also assessed the role of the miR-22/GLUT1 axis in two sorafenib-treated HCC animal models. In the DEN-HCC rat model, a downregulation of miR-22 and an upregulation of GLUT1 expression were observed in tumor versus non-tumor tissues (Figure S6C). Remarkably, lower miR-22 and higher GLUT1 levels were detected in non-responder tumors, showing an opposite correlation with tumor size (Figure 5B, C). A negative correlation between miR-22 and GLUT1 and a positive correlation between miR-22 and apoptotic genes were identified (Figure 5D), highlighting the influence of the miR-22/GLUT1 axis on sorafenib response in this preclinical tool.
In the xenograft model, tumors from miR-22-silenced HepG2 cells were more sensitive to sorafenib treatment compared to controls (Figure 5E). We ascribed this unexpected result to the inhibitory activity of miR-22 on endothelial cells [13] and hypothesized a dual effect of this miRNA on both tumor proliferation and angiogenesis. Indeed, miR-22-silenced tumors retained HIF-1A signaling activation and GLUT1 and SNAI1 upregulation after sorafenib administration. In parallel, they overexpressed pro-angiogenic markers such as ANGPT2 and PKM2 (Figure 5F, G), suggesting tumor hyper-vascularization [27], which is the main target of the anti-angiogenic agent sorafenib. We also reported increased CD31 positivity in untreated miR-22-silenced HepG2 xenografts and ANGPT2 upregulation in human HCCs (Figure S6D, E). To verify our hypothesis, we performed a tube-formation assay. When grown in the presence of conditioned medium (CM) from miR-22-overexpressing cells, HUVEC cells made fewer nodes compared to controls and reduced the expression of endoglin (CD105), a marker of proliferating endothelial cells in tumors [28], demonstrating the anti-angiogenic effect of miR-22-derived CM (Figure S6F, G). In line, lower VEGFA and ANGPT2 levels were observed in high versus low miR-22 expressing HCC patients, although the latter being not statistically significant (Figure S6H). These findings demonstrate that miR-22 influences sorafenib resistance in preclinical models of HCC, but caution should be exercised in the choice of in vivo models.
2.6. MiR-22 Represents a Possible Biomarker of Sorafenib Response in HCC
The identification of biomarkers predictive of treatment response remains an unmet clinical need in HCC. Strikingly, higher GLUT1 expression in HCC tissues associated with higher extracellular miR-22 levels, suggesting that circulating miRNA levels may be informative of metabolic changes occurring in the tumor (Figure 6A). Furthermore, a negative correlation was detected between intracellular and extracellular miR-22 levels in the surgical cohort (Figure 6B), suggesting active extrusion mechanisms from cancer cells. We verified this hypothesis in in vitro models, where we observed an increase of extracellular miR-22 levels, with a parallel decrease in intracellular levels in most of HCC cell lines following sorafenib treatment (Figure 6C).
In the rat model treated with sorafenib, we confirmed the inverse correlation between tissue and serum miR-22 levels and showed a direct correlation between tumor size and serum miR-22 levels (Figure 6D, E). Higher serum miR-22 levels were detected in non-responder rats and negatively correlated with apoptotic markers (Figure 6F, G), suggesting that miR-22 extrusion could be a negative event during sorafenib treatment.
In agreement with preclinical findings, higher basal miR-22 levels were detected in non-responder patients from the sorafenib cohort at two-months follow-up (Figure 6H). Due to the small sample size, the predictive value of this miRNA is promising but not good enough as evaluated by ROC curve analysis (AUC= 0.725, p= 0.008, lower limit= 0.58, upper limit= 0.87) and needs further validation in larger cohorts. These data highlight the potential translational value of circulating miR-22 as a candidate for sorafenib response.
3. Discussion
MiR-22 is a tumor suppressor gene and associates with tumor aggressiveness and poor survival in HCC patients. We demonstrated that GLUT1, whose overexpression is a common feature of cancer [26,29], is a target of miR-22 in HCC cells. This is the first time that GLUT1 targeting by miR-22, previously identified in breast cancer [30] and in macrophages [31], is reported in liver cancer. In this scenario, we investigated the involvement of the miR-22/GLUT1 axis in metabolic reprogramming and sorafenib resistance in HCC.
Metabolic reprogramming is a critical event during tumorigenesis, enabling malignant cells to cope with increased energy demands and oxidative stress and to adapt to stressful conditions [32]. We reported that miR-22/GLUT1 axis promotes glycogen and lipid storage, giving HCC cells an advantage to survive in glucose-depleted medium. Similarly, Zhong and coworkers described the involvement of GLUT1 in the accumulation of glycogen following BMP4 overexpression in HCC models [22]. MiR-22 knockout mice fed a high-fat diet developed liver steatosis by increasing glycolytic enzymes and lipid uptake and exacerbated fat mass gain by accelerating lipid synthesis [33], showing a metabolic rearrangement similar to that observed in our miR-22-silenced cells. The authors reported opposite results when miR-22 was overexpressed in HCC cells. We believe that this discrepancy between in vitro and in vivo findings may be due to the fact that this miRNA gives different results when transiently or permanently modulated in vitro. Here, we used stable infection for miR-22 modulation in HCC cells, establishing appropriate preclinical tools that better reflect the human pathology where miRNA deregulation is maintained over time.
We also observed a downregulation of ACLY and FASN in miR-22-overexpressing cells together with reduced lipid droplet accumulation. Similarly, Koufaris et al. described that miR-22 inhibits de novo lipogenesis and fatty acid elongation by targeting ACLY and elongase (ELOVL6) in breast cancer [34]. Notably, blockade of de novo lipogenesis with ND-654 inhibitor synergized sorafenib effect by reducing tumor cell proliferation, serum triglyceride levels, preventing HCC incidence in DEN-treated rats [35].
In our models, miR-22 modulation induced changes in the expression of glycolytic enzyme HK2, which also exerts an anti-apoptotic function when localized in the outer mitochondrial membrane [36]. This may explain the reduced apoptosis observed in our miR-22-silenced cells. Notably HK2 inhibition also synergized with metformin or sorafenib to inhibit tumor growth [37].
Since no biomarkers stratify patients to TKIs, the choice between sorafenib and lenvatinib involves other factors such as treatment-associated toxicities, cost, patient’s preference, and expected treatment benefit [38]. Because of the long history of sorafenib use in HCC, which has led to the identification of well-defined mechanisms of resistance [39], we decided to focus on sorafenib to investigate combination treatments. Our data indicated that the miR-22/GLUT1 axis influences sorafenib response, suggesting GLUT1 inhibition as a potential combined strategy with sorafenib in HCC patients. In line with our findings, Zhang et al. reported an increase in glucose uptake and lactate production in sorafenib-treated HCC models. They showed that GLUT inhibition by phloretin reduces tumor growth and sorafenib sensitization in xenograft mice injected with CD133+ enriched Huh-7 cells, highlighting the beneficial effect of this combined strategy in stem cell-like HCCs [40]. Wang et al. described the antitumor potential of a dual inhibitor of GLUT1 and p-EGFR which simultaneously interferes with cancer cell metabolism and driver gene activation for the treatment of different cancer types [41]. Improved tissue release of a microcrystalline BAY-876 formulation after intratumor injection has been described in xenograft and orthotopic models, resulting in reduced tumor volume through inhibition of glycolysis and EMT pathways. [42]. Although intratumoral administration is not feasible in advanced cases, this study may pave the way for innovative locoregional treatments or for the discovery of new drug formulations. The overexpression of GLUT1 has been exploited to deliver sugar-coated drugs into cancer cells [43]. In HCC, Zhang and coworkers developed a formulation of mannose based nanomicelles transported by GLUT1 to introduce nitroimidazole groups into cancer cells, impairing their redox potential, reducing GSH levels and ultimately leading to ferroptosis [44]. This strategy is particularly intriguing for miR-22-silenced cells, which showed increased production of H2O2 and activated PPP, in part to cope with oxidative stress. Strikingly, we found higher expression of the EMT marker SNAIL in miR-22-silenced HepG2 cells, which is stimulated by H2O2 and is associated with metastatic phenotype [45]. We can speculate that interfering with the redox balance by GLUT1-mediated drug delivery may represent a tailored strategy to synergize sorafenib in low miR-22-expressing HCCs.
Interestingly, we found an inverse correlation between tissue and serum miRNA levels, suggesting an active extrusion by tumor cells to reduce intracellular levels. Although the predictive potential of circulating miR-22 was not good enough to stratify patients for sorafenib treatment, we believe these results are promising if confirmed in larger cohorts, as reported in different cancer types. In diffuse large B-cell lymphoma, circulating miR-22 represented an independent factor for progression-free survival [46] and a predictive biomarker for response to R-CHOP therapy [47]. The combination of multiple biomarkers was shown to improve the predictive value of circulating miRNAs [48]. In non-small cell lung cancer, miR-184, let-7b-5p and miR-22 showed a diagnostic potential [49]. Similarly, a two-miRNA signature (miR-22-3p and miR-34a-5p) identified treatment failure to adoptive cell transfer of tumor-infiltrating lymphocytes in melanoma patients [50]. Despite the potential of miR-22, the heterogeneity of HCC makes it difficult to translate preclinical findings into laboratory tests and needs further investigations.
Since high serum miR-22 levels associated with high GLUT1 expression, we can argue that therapeutic approaches combining metabolic inhibitors with sorafenib may increase treatment efficacy in this subgroup of HCCs. Considering miRNA-based therapeutic interventions, Zhang et al. demonstrated that miR-22 replacement by lentiviral vectors or injection of miR-22-overexpressing T cells can interfere with tumor formation in HCC models [51]. Similarly, Hu et al. performed miR-22 gene therapy in HCC mice and demonstrated a strong antitumor activity mediated by IL-17 signaling interference and cytotoxic T cells expansion [14]. Although promising, further preclinical studies are needed before testing miR-22-based strategies in clinical trials, especially when combinations with antiangiogenic drugs are considered.
In conclusion, we showed that circulating miR-22 is informative about GLUT1 intratumor expression, suggesting it may help identify patients with metabolic vulnerabilities to be enrolled in ad hoc clinical trials.
4. Materials and Methods
HCC patient cohorts
Tumor and surrounding tissues (N=28) were obtained from patients undergoing liver surgery for HCC at the Department of Surgery and Transplantation, IRCCS Azienda Ospedaliero-Universitaria of Bologna. The study protocol was approved by the local ethics committee (Comitato Etico Area Vasta Emilia Centro – AVEC – 528/2021/Sper/AUOBo). Tissue samples were collected at surgery and stored at -80°C. Clinical characteristics of patients are shown in Supplementary Table S1. Circulating miR-22 levels were tested in the sorafenib-treated HCC patient cohort (local ethics committee approval: 271/2012/O/Oss). The clinical characteristics of these patients (N=66) have been previously detailed [52]. Only 52 serum samples were available for this study. Blood samples were collected before treatment and processed as previously described [53]. Informed written consent was obtained from patients enrolled in the study. Bioinformatics analysis of data from The Cancer Genome Atlas Liver Hepatocellular Carcinoma project (TCGA-LIHC) cohort was detailed in Supplementary Materials.
HCC animal models
The diethylnitrosamine (DEN)-induced HCC rat model was established as previously detailed [54] and treated intragastrically with sorafenib (10 mg/kg) for 21 days (N=12). Untreated DEN-HCC rats (N=18) were analyzed for miR-22/GLUT1 expression. This protocol was approved by the Italian Minister of Health (N. 421/2016-PR). The xenograft mouse (NOD/SCID females) model was obtained by subcutaneous injection of 5.0 × 10⁶ Huh-7 cells and 6.0 x 10⁶ HepG2 cells into both animal flanks. HepG2-derived xenografts were also treated with sorafenib (60 mg/kg) for 21 days by gavage starting when the tumor volume was 30-50 mm3. Five animals per group were used. This protocol was approved by Italian Minister of Health (N. 38/2022-PR).
HCC cell lines and treatments
Stable infection with retroviral vectors was performed to overexpress miR-22 in Huh-7 cells as previously described [55]. MiR-22 precursor sequence (Supplementary Table S2) was cloned into pMXs-miR-GFP/Puro retroviral vector (Cell Biolabs) to obtain miR-22-overexpressing vector (pMXs-miR-22). Lentiviral vectors were used for miR-22-silencing in HepG2 cells. Lentivector expression system was used with miRZIP lentivector-based anti-microRNAs (MZIP-22-PA-1; System Biosciences) to produce lentiviral particles. The establishment of sorafenib resistant cell clones is detailed in Supplementary Material. HIF-1A silencing was obtained by using Dicer-substrate short interfering RNAs (DsiRNAs, IDT) as previously reported [52]. Cells were treated with 2.5-5.0 µM sorafenib tosylate (Bayer) or 2.5-5.0 µM GLUT1 inhibitor BAY-876 or 100 µM CoCl2 (Selleck Chemicals). Incucyte Live-Cell Analysis System (Sartorius) was used for real time monitoring of 2D and 3D cell growth as detailed in [52,56] and Supplementary Material.
Real Time PCR
TaqMan MicroRNA Assays (Applied Biosystems) were used to evaluate miR-22-3p expression (ID 000398). RNU6B (ID 001093) was used as housekeeping gene for intracellular miRNAs, while cel-miR-39 (ID 000200) was used as spike-in for circulating miRNAs [53]. SYBR-green (ThermoFisher) qPCR was used for gene expression analysis, using β-Actin and GAPDH as housekeeping genes (Supplementary Table S2). QPCR experiments were run in triplicate.
Western blotand Nuclear/Cytoplasmic Protein Extraction
Antibodies for Western blot (WB) analysis are reported in Supplementary Table S3. Digital images were quantified with ChemiDoc XRS+ (Image Lab Software, Bio-Rad). Two independent experiments were performed. Cytoplasmic and nuclear protein fractions were extracted using NE-PER Nuclear and Cytoplasmic Extraction Reagents (Thermofisher), as detailed in Supplementary Material.
Luciferase reporter assay
GLUT1 (SLC2A1, NM_006516) 3'-UTR vector (SC215980) was purchased from Origene. Mutagenesis of miR-22 site was performed using Phusion Site-Directed Mutagenesis Kit (ThermoFisher Scientific) and verified by Sanger sequencing. Primers are reported in Supplementary Table S2. Reporter assay was performed by using Dual-Glo luciferase assay (Promega).
Wound healing assay
The wound healing assay was performed by using Ibidi Culture-Insert 2 Well in μ-Dish. HepG2 and Huh-7 cells were seeded at a density of 21,000 and 7000 cells/well, respectively, in 70 µl of culture media and incubated at 37°C and 5% CO2. After confluent cell layer formation, the culture insert was removed by using sterile tweezers. The cells were washed with PBS and culture medium containing 2.5% FBS was added to avoid the confounding effect of cell proliferation. Pictures of the wound were taken every 12 hours using EVOS Cell Imaging System (ThermoFisher). Wound area was measured with the Image J plugin ‘Wound_healing_size_tool’ and analyzed as percentage of wound closure [57].
Metabolic and functional analyses in cultured cells
The characterization of metabolic profiles in HCC cells was performed according to Bergamini et al. [52] and detailed in Supplementary Material.
Glucose uptake assay
HepG2 and Huh-7 cells were seeded at a concentration of 1.5 × 10⁵ and 0.9 × 10⁵ in 6-well plates; after 24 hours, the medium was replaced and glucose concentration was measured by sampling 50 µl of medium every 24 hours up to 72 hours using an enzymatic assay based on β-d-glucose:oxygen 1-oxidoreductase (GOX) activity. The reaction was carried out in 1.6 ml of 50 mM sodium acetate buffer in the presence of 57 µg/ml GOX, pH 5.1, 30°C; the reaction was initiated by the addition of 50 µl cell culture medium, and the oxygen consumption rate was monitored in a thermostatically controlled oxygraphic chamber (Yellow Springs Instrument YSI 53). A titration curve was generated under the same conditions using different amounts of glucose or different volumes of fresh culture medium as standards. Cellular glucose uptake was calculated by subtracting the glucose measured in the tested medium from the total glucose measured in the fresh medium and normalized for protein content.
Analysis of cellular metabolites
HCC cells were grown in T75 flasks at a 70% confluence, washed twice with ice-cold PBS, trypsinized for 5 minutes, and centrifuged at 1500 rpm for 5 min at 4 °C. Cell pellets were obtained from 6.0 × 10⁶ cells and stored at -80°C for targeted analysis by LC-MS and NMR, as detailed in Supplementary Material.
Immunohistochemistry
The IHC of CD31 (1:50; Abcam) in xenograft tumors was assessed on formalin-fixed, paraffin-embedded sections as previously detailed [58]. Signal development was performed by using Novolink polymer detection system (Leica Biosystems, Germany). Positive staining was quantified by using Image J software (NIH) on 8 randomly selected consecutive fields (20X magnification).
Tube formation of HUVEC cells
Human umbilical vein endothelial cells (HUVEC, CRL-1730) were cultured in Endothelial Cell Basal Medium (EBM2; Lonza) added with supplemental kit (Lonza), 10% FBS, 2mM L-glutamine (Sigma-Aldrich), and 1% penicillin/streptomycin solution (Sigma-Aldrich). The cells were maintained at 37°C in 5% CO2, upon gelatine coating. To test their ability to form vessel-like structures, cells (2 × 10⁴/100 µl) were cultured in 96-well plates with 50 µl of Matrigel matrix (Corning) diluted 1:2 with endothelial medium. HUVEC were incubated with the conditioned media (CM) from control or miR-22-overexpressing Huh-7 cells in a 1:1 ratio with the endothelial growth medium. CM were collected from the same number of cells, centrifuged at 1500 rpm for 5 minutes at 4°C, filtered with 0.45 µm filter and stored at –80°C. After 10 hours, images were acquired using Leica DM IL LED microscope (4X magnification). The analysis was conducted with ImageJ software by counting the number of nodes given by the intersection of tubular structures. The experiments were performed twice in quadruplicate.
Statistical analysis
Differences between two or more groups were analyzed using unpaired Student’s t-test or ANOVA. Tukey’s post hoc test was used for comparisons among groups after ANOVA analysis. Pearson’s correlation coefficient was used to investigate relationships between two variables. Reported p-values were two-sided. Statistical calculations were executed using SPSS version 20.0 (SPSS inc) and GraphPad software version 8.0 (Dotmatics). * p<0.05, ** p<0.01, *** p<0.001, **** p<0.0001.
Data Availability
The bioinformatics analysis on the LIHC-TCGA cohort is available in Supplementary Material S4 and S5. MiRNAome analysis in the DEN-HCC rat model is detailed in Ref. 24.
Supplementary Materials
The following supporting information can be downloaded at the website of this paper posted on Preprints.org, Figure S1: High miR-22 expression associates with metabolic changes and cell cycle arrest; Figure S2: MiR-22 regulates 3D cell growth, stemness properties and HIF-1A pathway in HCC; Figure S3: MiR-22 regulates EMT and tumorigenesis in preclinical models; Figure S4: GLUT1 is a hypothetic target of miR-22 and regulates metabolic shift in HCC; Figure S5: MiR-22 modulates oxidative stress in HCC cells; Figure S6: MiR-22/GLUT1 axis modulates sorafenib response and angiogenesis in preclinical models of HCC; Table S1: Characteristics of the surgical cohort (N=28) of HCC patients (Bologna cohort); Table S2: Primer sequences for Real Time PCR; Table S3: Antibodies for WB analysis; Supplementary Material; Supplementary Bioinformatics: S4_DEA_miR22_3p_HighvsLow_Q25; Supplementary Bioinformatics: S5_fGSEA_fgseaResTidyALL_HvsL_mir22-3p.
Author Contributions
CB: FF: Conceptualization, data curation, formal analysis, supervision, methodology, writing original draft, project administration, fundings. IL, GG, EM, CV, FV, LP, AAG, MM, AP, VR, SM, GR, MP: experiment execution, data analysis, methodology; CAC: bioinformatics analysis. MB, MD, MR, MC, FV: provided clinical tissue samples and information. CG, MN, FP, RF, CS, LG: manuscript supervision. All Authors have read and agreed to the published version of the manuscript.
Funding
This research was funded by: AIRC under IG 2020 - ID 25187 – P.I. Francesca Fornari “Identification of circulating biomarkers for patient allocation to the best treatment in hepatocellular carcinoma”; Bando “Alma Idea 2022” University of Bologna to Francesca Fornari “Development of 3D models, preclinical tools preclinical and circulating biomarkers for the optimization of personalized treatment approaches in hepatocellular carcinoma (SIMPLEMEDICINE)”; The research leading to these results has received funding from the European Union - NextGenerationEU through the Italian Ministry of University and Research under PNRR - M4C2-I1.3 Project PE_00000019 "HEAL ITALIA" to Francesca Fornari, CUP of Institution: J33C22002920006. The views and opinions expressed are those of the authors only and do not necessarily reflect those of the European Union or the European Commission. Neither the European Union nor the European Commission can be held responsible for them; L.P.: Financed by the European Union - NextGenerationEU through the Italian Ministry of University and Research under PNRR - Mission 4 Component 2, Investment 3.3 "(DM 117/2023) and by Indena S.P.A. (Milano)"; F.V.: Financed by the European Union - NextGenerationEU through the Italian Ministry of University and Research under PNRR - Mission 4 Component 2, Investment 3.3 (DM 352/2022) and by Indena S.p.A. (Milano).
Institutional Review Board Statement
The study protocol for the surgically resected HCC cohort was approved by local ethics committee (Comitato Etico Area Vasta Emilia Centro – AVEC – 528/2021/Sper/AUOBo); The study protocol for the sorafenib-treated HCC cohort was approved by local ethics committee (271/2012/O/Oss); The study was conducted in accordance with the Declaration of Helsinki. The animal study protocols were approved by the Italian Minister of Health (N. 421/2016-PR; N. 38/2022-PR).
Informed Consent Statement
“Informed consent was obtained from all subjects involved in the study.”
Acknowledgments
The authors wish to acknowledge Prof. Marco Malaguti (University of Bologna, Italy) for the license to use BioRender.com for creating the graphical abstract. The authors Would like to acknowledge Centre for Applied Biomedica Research (CRBA), University of Bologna for the technical support.
Conflicts of Interest
The authors declare no conflicts of interest.
Abbreviations
The following abbreviations are used in this manuscript:
| GOX | β-d-glucose:oxygen 1-oxidoreductase |
| HCC | Hepatocellular Carcinoma |
| GLUT1 | Glucose Transporter 1 |
| ICIs | Immune Checkpoint Inhibitors |
| NASH | Non-Alcoholic SteatoHepatitis |
| MicroRNA | miR |
| TME | Tumor MicroEnvironment |
| TKIs | Tyrosine Kinase Inhibitors |
| EMT | Epithelial-to-Mesenchymal Transition |
| ACLY | ATP Citrate Lyase |
| ENO1 | Enolase 1 |
| DEN | Diethylnitrosamine |
| TCGA | The Cancer Genome Atlas |
| LIHC | Liver Hepatocellular Carcinoma |
| siRNAs | Short Interfering RNAs |
| shRNA | Short Hairpin RNA |
| CoCl2 | Cobalt Chloride |
| QPCR | quantitative PCR |
| WB | Western blot |
| PAS | Periodic Acid Schiff |
| AFP | Alpha-FetoProtein |
| HCV | Hepatitis C Virus |
| GSEA | Gene Set Enrichment Analysis |
| HIF1A | hypoxia-inducible factor |
| SNAI1 | Snail family transcriptional repressor 1 |
| 3’UTR | 3’-untranslated region |
| NMR | Nuclear Magnetic Resonance |
| PFK1 | Phosphofructokinase-1 |
| HK2 | Hexokinase 2 |
| PKM2 | Pyruvate Kinase M1/2 |
| F-1,6-BP | Fructose-1,6-Biphosphate |
| FASN | Fatty Acid Synthase |
| ETFDH | Electron Transfer Flavoprotein Dehydrogenase |
| ROS | reactive oxygen species |
| HAO2 | hydroxy acid oxidase 2 |
| GSH | reduced glutathione |
| NRF2 | NEFE2 related factor |
| GSTA4 | Glutathione S-Transferase Alpha 4 |
| PPP | pentose phosphate pathway |
| G6PD | Glucose-6 phosphate Dehydrogenase |
| PGD | 6-phosphogluconate dehydrogenase |
| 6-PG | 6-phosphogluconate |
| ANGPT2 | Angiopoietin 2 |
| VEGFA | Vascular Endothelial Growth Factor A |
| AUC | Area Under the Curve |
| FA | Fatty Acid |
| ELOVL6 | ELOVL Fatty Acid Elongase 6 |
| EGFR | Endothelial Growth Factor Receptor |
| GLcNAc | N-acetyl-d-glucosamine |
References
- Singal, A.G.; Kanwal, F.; Llovet, J.M. Global Trends in Hepatocellular Carcinoma Epidemiology: Implications for Screening, Prevention and Therapy. Nat. Rev. Clin. Oncol. 2023, 20, 864–884. [Google Scholar] [CrossRef]
- Finn, R.S.; Qin, S.; Ikeda, M.; Galle, P.R.; Ducreux, M.; Kim, T.-Y.; Kudo, M.; Breder, V.; Merle, P.; Kaseb, A.O.; et al. Atezolizumab plus Bevacizumab in Unresectable Hepatocellular Carcinoma. N. Engl. J. Med. 2020, 382, 1894–1905. [Google Scholar] [CrossRef]
- Abou-Alfa, G.K.; Chan, S.L.; Kudo, M.; Lau, G.; Kelley, R.K.; Furuse, J.; Sukeepaisarnjaroen, W.; Kang, Y.-K.; Dao, T.V.; De Toni, E.N.; et al. Phase 3 Randomized, Open-Label, Multicenter Study of Tremelimumab (T) and Durvalumab (D) as First-Line Therapy in Patients (Pts) with Unresectable Hepatocellular Carcinoma (uHCC): HIMALAYA. J. Clin. Oncol. 2022, 40, 379–379. [Google Scholar] [CrossRef]
- Reig, M.; Forner, A.; Rimola, J.; Ferrer-Fàbrega, J.; Burrel, M.; Garcia-Criado, Á.; Kelley, R.K.; Galle, P.R.; Mazzaferro, V.; Salem, R.; et al. BCLC Strategy for Prognosis Prediction and Treatment Recommendation: The 2022 Update. J. Hepatol. 2022, 76, 681–693. [Google Scholar] [CrossRef] [PubMed]
- Pfister, D.; Núñez, N.G.; Pinyol, R.; Govaere, O.; Pinter, M.; Szydlowska, M.; Gupta, R.; Qiu, M.; Deczkowska, A.; Weiner, A.; et al. NASH Limits Anti-Tumour Surveillance in Immunotherapy-Treated HCC. Nature 2021, 592, 450–456. [Google Scholar] [CrossRef]
- Harding, J.J.; Nandakumar, S.; Armenia, J.; Khalil, D.N.; Albano, M.; Ly, M.; Shia, J.; Hechtman, J.F.; Kundra, R.; El Dika, I.; et al. Prospective Genotyping of Hepatocellular Carcinoma: Clinical Implications of Next-Generation Sequencing for Matching Patients to Targeted and Immune Therapies. Clin. Cancer Res. Off. J. Am. Assoc. Cancer Res. 2019, 25, 2116–2126. [Google Scholar] [CrossRef] [PubMed]
- Gramantieri, L.; Giovannini, C.; Piscaglia, F.; Fornari, F. MicroRNAs as Modulators of Tumor Metabolism, Microenvironment, and Immune Response in Hepatocellular Carcinoma. J. Hepatocell. Carcinoma 2021, 8, 369–385. [Google Scholar] [CrossRef]
- Fang, Y.; Zhang, X.; Huang, H.; Zeng, Z. The Interplay between Noncoding RNAs and Drug Resistance in Hepatocellular Carcinoma: The Big Impact of Little Things. J. Transl. Med. 2023, 21, 369. [Google Scholar] [CrossRef]
- Liu, Y.; Chen, X.; Cheng, R.; Yang, F.; Yu, M.; Wang, C.; Cui, S.; Hong, Y.; Liang, H.; Liu, M.; et al. The Jun/miR-22/HuR Regulatory Axis Contributes to Tumourigenesis in Colorectal Cancer. Mol. Cancer 2018, 17, 11. [Google Scholar] [CrossRef]
- Yang, X.; Su, W.; Li, Y.; Zhou, Z.; Zhou, Y.; Shan, H.; Han, X.; Zhang, M.; Zhang, Q.; Bai, Y.; et al. MiR-22-3p Suppresses Cell Growth via MET/STAT3 Signaling in Lung Cancer. Am. J. Transl. Res. 2021, 13, 1221–1232. [Google Scholar]
- Xu, M.; Li, J.; Wang, X.; Meng, S.; Shen, J.; Wang, S.; Xu, X.; Xie, B.; Liu, B.; Xie, L. MiR-22 Suppresses Epithelial-Mesenchymal Transition in Bladder Cancer by Inhibiting Snail and MAPK1/Slug/Vimentin Feedback Loop. Cell Death Dis. 2018, 9, 209. [Google Scholar] [CrossRef] [PubMed]
- Zhang, D.-Y.; Zou, X.-J.; Cao, C.-H.; Zhang, T.; Lei, L.; Qi, X.-L.; Liu, L.; Wu, D.-H. Identification and Functional Characterization of Long Non-Coding RNA MIR22HG as a Tumor Suppressor for Hepatocellular Carcinoma. Theranostics 2018, 8, 3751–3765. [Google Scholar] [CrossRef] [PubMed]
- Gu, Y.; Pais, G.; Becker, V.; Körbel, C.; Ampofo, E.; Ebert, E.; Hohneck, J.; Ludwig, N.; Meese, E.; Bohle, R.M.; et al. Suppression of Endothelial miR-22 Mediates Non-Small Cell Lung Cancer Cell-Induced Angiogenesis. Mol. Ther. Nucleic Acids 2021, 26, 849–864. [Google Scholar] [CrossRef]
- Hu, Y.; Setayesh, T.; Vaziri, F.; Wu, X.; Hwang, S.T.; Chen, X.; Yvonne Wan, Y.-J. miR-22 Gene Therapy Treats HCC by Promoting Anti-Tumor Immunity and Enhancing Metabolism. Mol. Ther. J. Am. Soc. Gene Ther. 2023, 31, 1829–1845. [Google Scholar] [CrossRef] [PubMed]
- Yamakuchi, M.; Yagi, S.; Ito, T.; Lowenstein, C.J. MicroRNA-22 Regulates Hypoxia Signaling in Colon Cancer Cells. PLOS ONE 2011, 6, e20291. [Google Scholar] [CrossRef]
- Cui, S.; Chen, Y.; Guo, Y.; Wang, X.; Chen, D. Hsa-miR-22-3p Inhibits Liver Cancer Cell EMT and Cell Migration/Invasion by Indirectly Regulating SPRY2. PloS One 2023, 18, e0281536. [Google Scholar] [CrossRef]
- Xin, M.; Qiao, Z.; Li, J.; Liu, J.; Song, S.; Zhao, X.; Miao, P.; Tang, T.; Wang, L.; Liu, W.; et al. miR-22 Inhibits Tumor Growth and Metastasis by Targeting ATP Citrate Lyase: Evidence in Osteosarcoma, Prostate Cancer, Cervical Cancer and Lung Cancer. Oncotarget 2016, 7, 44252–44265. [Google Scholar] [CrossRef]
- Zhou, J.; Zhang, S.; Chen, Z.; He, Z.; Xu, Y.; Li, Z. CircRNA-ENO1 Promoted Glycolysis and Tumor Progression in Lung Adenocarcinoma through Upregulating Its Host Gene ENO1. Cell Death Dis. 2019, 10, 885. [Google Scholar] [CrossRef]
- Hanahan, D. Hallmarks of Cancer: New Dimensions. Cancer Discov. 2022, 12, 31–46. [Google Scholar] [CrossRef]
- Kowalik, M.A.; Guzzo, G.; Morandi, A.; Perra, A.; Menegon, S.; Masgras, I.; Trevisan, E.; Angioni, M.M.; Fornari, F.; Quagliata, L.; et al. Metabolic Reprogramming Identifies the Most Aggressive Lesions at Early Phases of Hepatic Carcinogenesis. Oncotarget 2016, 7, 32375–32393. [Google Scholar] [CrossRef]
- Fornari, F.; Giovannini, C.; Piscaglia, F.; Gramantieri, L. Elucidating the Molecular Basis of Sorafenib Resistance in HCC: Current Findings and Future Directions. J. Hepatocell. Carcinoma 2021, 8, 741–757. [Google Scholar] [CrossRef] [PubMed]
- Zhong, J.; Tian, L.; Gou, Y.; Zhao, P.; Dong, X.; Guo, M.; Zhao, G.; Li, A.; Hao, A.; He, T.-C.; et al. BMP4 Upregulates Glycogen Synthesis through the SMAD/SLC2A1 (GLUT1) Signaling Axis in Hepatocellular Carcinoma (HCC) Cells. Cancer Metab. 2023, 11, 9. [Google Scholar] [CrossRef]
- Xia, S.; Pan, Y.; Liang, Y.; Xu, J.; Cai, X. The Microenvironmental and Metabolic Aspects of Sorafenib Resistance in Hepatocellular Carcinoma. EBioMedicine 2020, 51, 102610. [Google Scholar] [CrossRef]
- Gramantieri, L.; Pollutri, D.; Gagliardi, M.; Giovannini, C.; Quarta, S.; Ferracin, M.; Casadei-Gardini, A.; Callegari, E.; De Carolis, S.; Marinelli, S.; et al. MiR-30e-3p Influences Tumor Phenotype through MDM2/TP53 Axis and Predicts Sorafenib Resistance in Hepatocellular Carcinoma. Cancer Res. 2020, 80, 1720–1734. [Google Scholar] [CrossRef]
- Fornari, F.; Gramantieri, L.; Callegari, E.; Shankaraiah, R.C.; Piscaglia, F.; Negrini, M.; Giovannini, C. MicroRNAs in Animal Models of HCC. Cancers 2019, 11, 1906. [Google Scholar] [CrossRef]
- Tian, X.-P.; Wang, C.-Y.; Jin, X.-H.; Li, M.; Wang, F.-W.; Huang, W.-J.; Yun, J.-P.; Xu, R.-H.; Cai, Q.-Q.; Xie, D. Acidic Microenvironment Up-Regulates Exosomal miR-21 and miR-10b in Early-Stage Hepatocellular Carcinoma to Promote Cancer Cell Proliferation and Metastasis. Theranostics 2019, 9, 1965–1979. [Google Scholar] [CrossRef] [PubMed]
- Azoitei, N.; Becher, A.; Steinestel, K.; Rouhi, A.; Diepold, K.; Genze, F.; Simmet, T.; Seufferlein, T. PKM2 Promotes Tumor Angiogenesis by Regulating HIF-1α through NF-κB Activation. Mol. Cancer 2016, 15, 3. [Google Scholar] [CrossRef] [PubMed]
- Dallas, N.A.; Samuel, S.; Xia, L.; Fan, F.; Gray, M.J.; Lim, S.J.; Ellis, L.M. Endoglin (CD105): A Marker of Tumor Vasculature and Potential Target for Therapy. Clin. Cancer Res. 2008, 14, 1931–1937. [Google Scholar] [CrossRef]
- Li, F.; He, C.; Yao, H.; Liang, W.; Ye, X.; Ruan, J.; Lin, L.; Zou, J.; Zhou, S.; Huang, Y.; et al. GLUT1 Regulates the Tumor Immune Microenvironment and Promotes Tumor Metastasis in Pancreatic Adenocarcinoma via ncRNA-Mediated Network. J. Cancer 2022, 13, 2540–2558. [Google Scholar] [CrossRef]
- Chen, B.; Tang, H.; Liu, X.; Liu, P.; Yang, L.; Xie, X.; Ye, F.; Song, C.; Xie, X.; Wei, W. miR-22 as a Prognostic Factor Targets Glucose Transporter Protein Type 1 in Breast Cancer. Cancer Lett. 2015, 356, 410–417. [Google Scholar] [CrossRef]
- Kang, Y.J. MicroRNA-22 Regulates the Pro-Inflammatory Responses and M1 Polarization of Macrophages by Targeting GLUT1 and 4-1BBL. J. Immunol. Res. 2023, 2023, 2457006. [Google Scholar] [CrossRef] [PubMed]
- Martínez-Reyes, I.; Chandel, N.S. Cancer Metabolism: Looking Forward. Nat. Rev. Cancer 2021, 21, 669–680. [Google Scholar] [CrossRef]
- Gjorgjieva, M.; Sobolewski, C.; Ay, A.-S.; Abegg, D.; Correia de Sousa, M.; Portius, D.; Berthou, F.; Fournier, M.; Maeder, C.; Rantakari, P.; et al. Genetic Ablation of MiR-22 Fosters Diet-Induced Obesity and NAFLD Development. J. Pers. Med. 2020, 10, 170. [Google Scholar] [CrossRef]
- Koufaris, C.; Valbuena, G.N.; Pomyen, Y.; Tredwell, G.D.; Nevedomskaya, E.; Lau, C.-H.; Yang, T.; Benito, A.; Ellis, J.K.; Keun, H.C. Systematic Integration of Molecular Profiles Identifies miR-22 as a Regulator of Lipid and Folate Metabolism in Breast Cancer Cells. Oncogene 2016, 35, 2766–2776. [Google Scholar] [CrossRef] [PubMed]
- Lally, J.S.V.; Ghoshal, S.; DePeralta, D.K.; Moaven, O.; Wei, L.; Masia, R.; Erstad, D.J.; Fujiwara, N.; Leong, V.; Houde, V.P.; et al. Inhibition of Acetyl-CoA Carboxylase by Phosphorylation or the Inhibitor ND-654 Suppresses Lipogenesis and Hepatocellular Carcinoma. Cell Metab. 2019, 29, 174–182.e5. [Google Scholar] [CrossRef] [PubMed]
- Ciscato, F.; Ferrone, L.; Masgras, I.; Laquatra, C.; Rasola, A. Hexokinase 2 in Cancer: A Prima Donna Playing Multiple Characters. Int. J. Mol. Sci. 2021, 22, 4716. [Google Scholar] [CrossRef] [PubMed]
- DeWaal, D.; Nogueira, V.; Terry, A.R.; Patra, K.C.; Jeon, S.-M.; Guzman, G.; Au, J.; Long, C.P.; Antoniewicz, M.R.; Hay, N. Hexokinase-2 Depletion Inhibits Glycolysis and Induces Oxidative Phosphorylation in Hepatocellular Carcinoma and Sensitizes to Metformin. Nat. Commun. 2018, 9, 446. [Google Scholar] [CrossRef]
- Gordan, J.D.; Kennedy, E.B.; Abou-Alfa, G.K.; Beal, E.; Finn, R.S.; Gade, T.P.; Goff, L.; Gupta, S.; Guy, J.; Hoang, H.T.; et al. Systemic Therapy for Advanced Hepatocellular Carcinoma: ASCO Guideline Update. J. Clin. Oncol. Off. J. Am. Soc. Clin. Oncol. 2024, JCO2302745. [Google Scholar] [CrossRef]
- Ladd, A.D.; Duarte, S.; Sahin, I.; Zarrinpar, A. Mechanisms of Drug Resistance in HCC. Hepatology. [CrossRef]
- Zhang, H.-L.; Wang, M.-D.; Zhou, X.; Qin, C.-J.; Fu, G.-B.; Tang, L.; Wu, H.; Huang, S.; Zhao, L.-H.; Zeng, M.; et al. Blocking Preferential Glucose Uptake Sensitizes Liver Tumor-Initiating Cells to Glucose Restriction and Sorafenib Treatment. Cancer Lett. 2017, 388, 1–11. [Google Scholar] [CrossRef]
- Wang, C.; Li, Z.; Zhai, H.; Shen, X.; Li, F.; Zhang, Q.; Li, D.; Hou, H. Targeted Blocking of EGFR and GLUT1 by Compound H Reveals a New Strategy for Treatment of Triple-Negative Breast Cancer and Nasopharyngeal Carcinoma. Eur. J. Pharm. Sci. Off. J. Eur. Fed. Pharm. Sci. 2024, 198, 106789. [Google Scholar] [CrossRef]
- Yang, H.; Zhang, M.-Z.-H.; Sun, H.-W.; Chai, Y.-T.; Li, X.; Jiang, Q.; Hou, J. A Novel Microcrystalline BAY-876 Formulation Achieves Long-Acting Antitumor Activity Against Aerobic Glycolysis and Proliferation of Hepatocellular Carcinoma. Front. Oncol. 2021, 11, 783194. [Google Scholar] [CrossRef] [PubMed]
- Jagdale, S.; Narwade, M.; Sheikh, A.; Md, S.; Salve, R.; Gajbhiye, V.; Kesharwani, P.; Gajbhiye, K.R. GLUT1 Transporter-Facilitated Solid Lipid Nanoparticles Loaded with Anti-Cancer Therapeutics for Ovarian Cancer Targeting. Int. J. Pharm. 2023, 637, 122894. [Google Scholar] [CrossRef]
- Zhang, C.; Liu, Z.; Wang, F.; Zhang, B.; Zhang, X.; Guo, P.; Li, T.; Tai, S.; Zhang, C. Nanomicelles for GLUT1-Targeting Hepatocellular Carcinoma Therapy Based on NADPH Depletion. Drug Deliv. 2023, 30, 2162160. [Google Scholar] [CrossRef] [PubMed]
- Radisky, D.C.; Levy, D.D.; Littlepage, L.E.; Liu, H.; Nelson, C.M.; Fata, J.E.; Leake, D.; Godden, E.L.; Albertson, D.G.; Nieto, M.A.; et al. Rac1b and Reactive Oxygen Species Mediate MMP-3-Induced EMT and Genomic Instability. Nature 2005, 436, 123–127. [Google Scholar] [CrossRef]
- Marchesi, F.; Regazzo, G.; Palombi, F.; Terrenato, I.; Sacconi, A.; Spagnuolo, M.; Donzelli, S.; Marino, M.; Ercolani, C.; Di Benedetto, A.; et al. Serum miR-22 as Potential Non-Invasive Predictor of Poor Clinical Outcome in Newly Diagnosed, Uniformly Treated Patients with Diffuse Large B-Cell Lymphoma: An Explorative Pilot Study. J. Exp. Clin. Cancer Res. CR 2018, 37, 95. [Google Scholar] [CrossRef]
- Rinaldi, F.; Marchesi, F.; Palombi, F.; Pelosi, A.; Di Pace, A.L.; Sacconi, A.; Terrenato, I.; Annibali, O.; Tomarchio, V.; Marino, M.; et al. MiR-22, a Serum Predictor of Poor Outcome and Therapy Response in Diffuse Large B-Cell Lymphoma Patients. Br. J. Haematol. 2021, 195, 399–404. [Google Scholar] [CrossRef]
- Moshiri, F.; Salvi, A.; Gramantieri, L.; Sangiovanni, A.; Guerriero, P.; De Petro, G.; Bassi, C.; Lupini, L.; Sattari, A.; Cheung, D.; et al. Circulating miR-106b-3p, miR-101-3p and miR-1246 as Diagnostic Biomarkers of Hepatocellular Carcinoma. Oncotarget 2018, 9, 15350–15364. [Google Scholar] [CrossRef] [PubMed]
- Vadla, G.P.; Daghat, B.; Patterson, N.; Ahmad, V.; Perez, G.; Garcia, A.; Manjunath, Y.; Kaifi, J.T.; Li, G.; Chabu, C.Y. Combining Plasma Extracellular Vesicle Let-7b-5p, miR-184 and Circulating miR-22-3p Levels for NSCLC Diagnosis and Drug Resistance Prediction. Sci. Rep. 2022, 12, 6693. [Google Scholar] [CrossRef]
- Galore-Haskel, G.; Greenberg, E.; Yahav, I.; Markovits, E.; Ortenberg, R.; Shapira-Fromer, R.; Itzhaki, O.; Schachter, J.; Besser, M.J.; Markel, G. microRNA Expression Patterns in Tumor Infiltrating Lymphocytes Are Strongly Associated with Response to Adoptive Cell Transfer Therapy. Cancer Immunol. Immunother. CII 2021, 70, 1541–1555. [Google Scholar] [CrossRef]
- Zhang, L.; Yang, P.; Wang, J.; Liu, Q.; Wang, T.; Wang, Y.; Lin, F. MiR-22 Regulated T Cell Differentiation and Hepatocellular Carcinoma Growth by Directly Targeting Jarid2. Am. J. Cancer Res. 2021, 11, 2159–2173. [Google Scholar]
- Bergamini, C.; Leoni, I.; Rizzardi, N.; Melli, M.; Galvani, G.; Coada, C.A.; Giovannini, C.; Monti, E.; Liparulo, I.; Valenti, F.; et al. MiR-494 Induces Metabolic Changes through G6pc Targeting and Modulates Sorafenib Response in Hepatocellular Carcinoma. J. Exp. Clin. Cancer Res. CR 2023, 42, 145. [Google Scholar] [CrossRef] [PubMed]
- Fornari, F.; Ferracin, M.; Trerè, D.; Milazzo, M.; Marinelli, S.; Galassi, M.; Venerandi, L.; Pollutri, D.; Patrizi, C.; Borghi, A.; et al. Circulating microRNAs, miR-939, miR-595, miR-519d and miR-494, Identify Cirrhotic Patients with HCC. PloS One 2015, 10, e0141448. [Google Scholar] [CrossRef]
- Fornari, F.; Pollutri, D.; Patrizi, C.; La Bella, T.; Marinelli, S.; Casadei Gardini, A.; Marisi, G.; Baron Toaldo, M.; Baglioni, M.; Salvatore, V.; et al. In Hepatocellular Carcinoma miR-221 Modulates Sorafenib Resistance through Inhibition of Caspase-3–Mediated Apoptosis. Clin. Cancer Res. 2017, 23, 3953–3965. [Google Scholar] [CrossRef]
- Fornari, F.; Milazzo, M.; Galassi, M.; Callegari, E.; Veronese, A.; Miyaaki, H.; Sabbioni, S.; Mantovani, V.; Marasco, E.; Chieco, P.; et al. P53/Mdm2 Feedback Loop Sustains miR-221 Expression and Dictates the Response to Anticancer Treatments in Hepatocellular Carcinoma. Mol. Cancer Res. 2014, 12, 203–216. [Google Scholar] [CrossRef] [PubMed]
- Gramantieri, L.; Pollutri, D.; Gagliardi, M.; Giovannini, C.; Quarta, S.; Ferracin, M.; Casadei-Gardini, A.; Callegari, E.; De Carolis, S.; Marinelli, S.; et al. MiR-30e-3p Influences Tumor Phenotype through MDM2/TP53 Axis and Predicts Sorafenib Resistance in Hepatocellular Carcinoma. Cancer Res. 2020, 80, 1720–1734. [Google Scholar] [CrossRef] [PubMed]
- Suarez-Arnedo, A.; Torres Figueroa, F.; Clavijo, C.; Arbeláez, P.; Cruz, J.C.; Muñoz-Camargo, C. An Image J Plugin for the High Throughput Image Analysis of in Vitro Scratch Wound Healing Assays. PloS One 2020, 15, e0232565. [Google Scholar] [CrossRef]
- Pollutri, D.; Patrizi, C.; Marinelli, S.; Giovannini, C.; Trombetta, E.; Giannone, F.A.; Baldassarre, M.; Quarta, S.; Vandewynckel, Y.P.; Vandierendonck, A.; et al. The Epigenetically Regulated miR-494 Associates with Stem-Cell Phenotype and Induces Sorafenib Resistance in Hepatocellular Carcinoma. Cell Death Dis. 2018, 9, 1–16. [Google Scholar] [CrossRef]
Figure 1.
Deregulated expression of miR-22 in human and rat HCCs and association with clinicopathological features. (A, B) Box plot graphs of miR-22 expression in HCC and surrounding livers from the Bologna cohort (N=28) and DEN-HCC rats (N=15). Y-axes report 2-ΔΔCt values corresponding to miR-22 expression. (C) Correlation graph between miR-22 and AFP mRNA levels in tumor nodules (N=24) of DEN-HCC rats. Axes report 2-ΔΔCt values corresponding to miR-22 and AFP levels transformed in a log2 form. (D) Box plot graph of miR-22 expression in HCCs from the Bologna cohort (N=25) divided according to the presence or absence of microvascular invasion (MVI). Y-axis reports 2-ΔΔCt values corresponding to miR-22 expression. (E) Box plot graph of miR-22 expression in HCCs from the Bologna cohort (N=28) according to Edmondson-Steiner tumor grade. The p-value relative to ANOVA is shown on top of the graph. Statistically significant comparisons between groups are G2 versus G3, p<0.05; G2 versus G4, p<0.01 (Tukey’s post hoc test). Y-axis reports 2-ΔΔCt values corresponding to miR-22 expression. (F) Box plot graph of miR-22 expression in HCCs from the Bologna cohort (N=25) divided according to the presence or absence of TP53 mutations. Y-axis reports 2-ΔΔCt values corresponding to miR-22 expression. (G) Kaplan-Meier curves of high and low miR-22-expressing HCCs from TCGA cohort. (H) Pathway enrichment analysis of high versus low miR-22-expressing HCCs from TCGA cohort. (A-F) U6RNA and GAPDH or Beta actin were used as housekeeping genes for miRNA and gene quantification, respectively. Real Time PCR was run in triplicate. Two-tailed unpaired Student's t-test and Pearson’s correlation were used for comparisons among two groups.
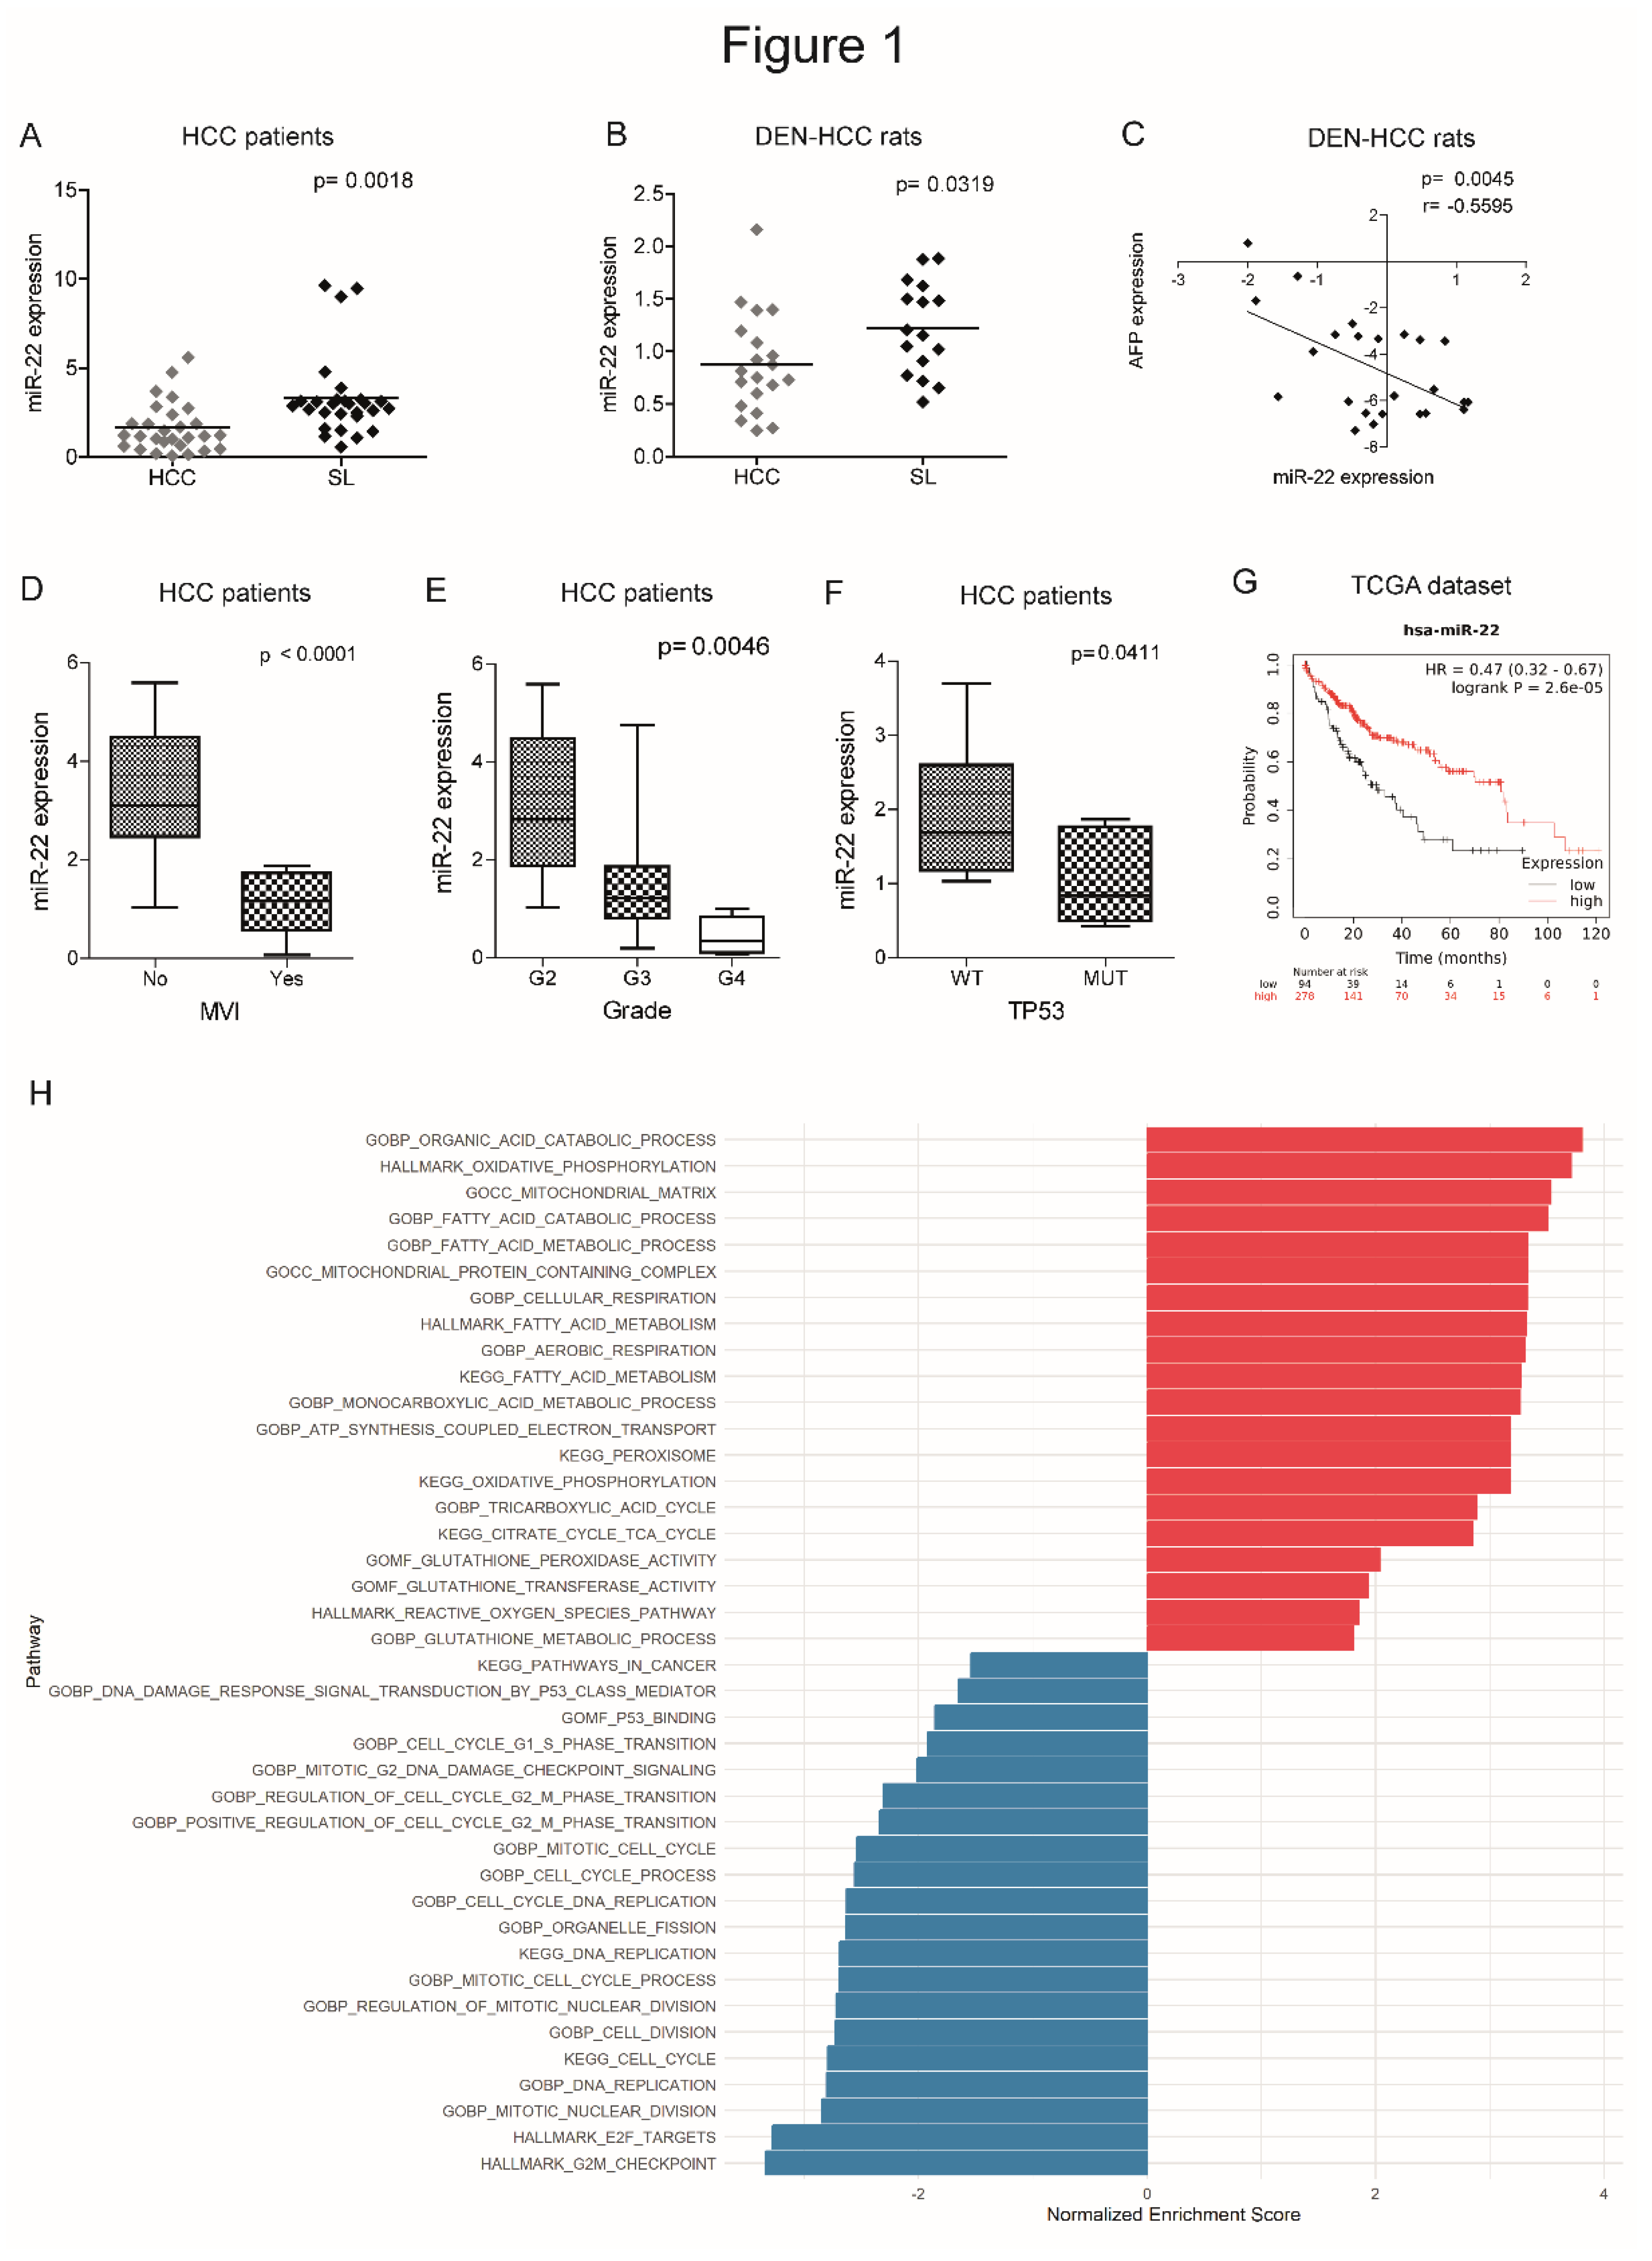
Figure 2.
MiR-22 regulates 2D and 3D cell growth and HIF-1A pathway in HCC cells. (A) Real Time PCR analysis of miR-22 expression in stably silenced (MZIP-22) and control (shRNA) HepG2 cells and in stably overexpressing (pMXs-22) and control (shRNA) Huh-7 cells. Y-axes report 2-Ct values corresponding to miR-22 expression normalized to controls. Mean ± SD values are displayed. U6RNA was used as housekeeping gene. Real Time PCR analysis was performed in two independent experiments in triplicate. (B) Growth curves of miR-22-silenced (MZIP-22) HepG2 cells and miR-22-overexpressing (pMXs-22) Huh-7 cells and related control (shRNA) cells. Growth curves were normalized to T0. Mean ± SD values are reported. Two independent experiments were performed in quadruplicate. WB analysis of apoptotic markers (CASP3, BAX) in the same cell lines. WB analysis was performed in two independent experiments, and GAPDH was used as housekeeping gene. (C) Representative images (4X magnification) and related histograms of miR-22-silenced (MZIP-22) HepG2 spheroids and miR-22-overexpressing (pMXs-22) Huh-7 spheroids and related controls (shRNA) at 96 and 48 hours, respectively. Y-axes report the Feret’s diameter (µm) normalized to controls. Thirty randomly selected spheroids were measured in two independent experiments. Mean ± SD values are displayed. Scale bars: 750 μm. WB analysis of apoptotic genes was performed in the same spheroids. GAPDH was used as housekeeping gene. WB analysis was performed in two independent experiments. (D) Real Time PCR and WB analyses of stemness-related genes in miR-22-silenced (MZIP-22) HepG2 cells (graph above) and miR-22-overexpressing (pMXs-22) Huh-7 cells (graph below) and related controls (shRNA). Y-axes report 2-Ct values corresponding to gene expression normalized to controls. Mean ± SD values are displayed. GAPDH was used as housekeeping gene. Real Time was performed twice in triplicate, WB was performed in two independent experiments. (E) Real Time PCR and WB analyses of HIF-1A pathway in miR-22-silenced (MZIP-22) HepG2 cells and miR-22-overexpressing (pMXs-22) Huh-7 cells and related controls (shRNA). Y-axes report 2-Ct values corresponding to gene expression normalized to controls. Mean ± SD values are displayed. GAPDH was used as housekeeping gene. Real Time PCR and WB analyses were performed in two independent experiments in triplicate and duplicate, respectively. (F) WB analysis of HIF-1A in subcellular compartments of miR-22-silenced (MZIP-22) HepG2 cells and miR-22-overexpressing (pMXs-22) Huh-7 cells and related controls (shRNA). Lamin B and GAPDH were used as housekeeping genes in nuclear and cytoplasmic compartments, respectively. The analysis was performed in two independent experiments. (G) Growth curves of miR-22-silenced (MZIP-22) HepG2 cells and miR-22-overexpressing (pMXs-22) Huh-7 cells and related controls (shRNA) treated with CoCl2 (100 nM). Growth curves were normalized to T0. Mean ± SD values are reported. Two independent experiments were performed in quadruplicate. (H) Cell viability and caspase assays in miR-22-silenced (MZIP-22) HepG2 cells and miR-22-overexpressing (pMXs-22) Huh-7 cells and related controls (shRNA) treated with CoCl2 (100 nM). Y-axes report chemiluminescent signals normalized to controls. Mean ± SD values are displayed. Two independent experiments were performed in quadruplicate. WB analysis of apoptotic genes was performed in the same cells. GAPDH was used as housekeeping gene. The analysis was performed in two independent experiments.
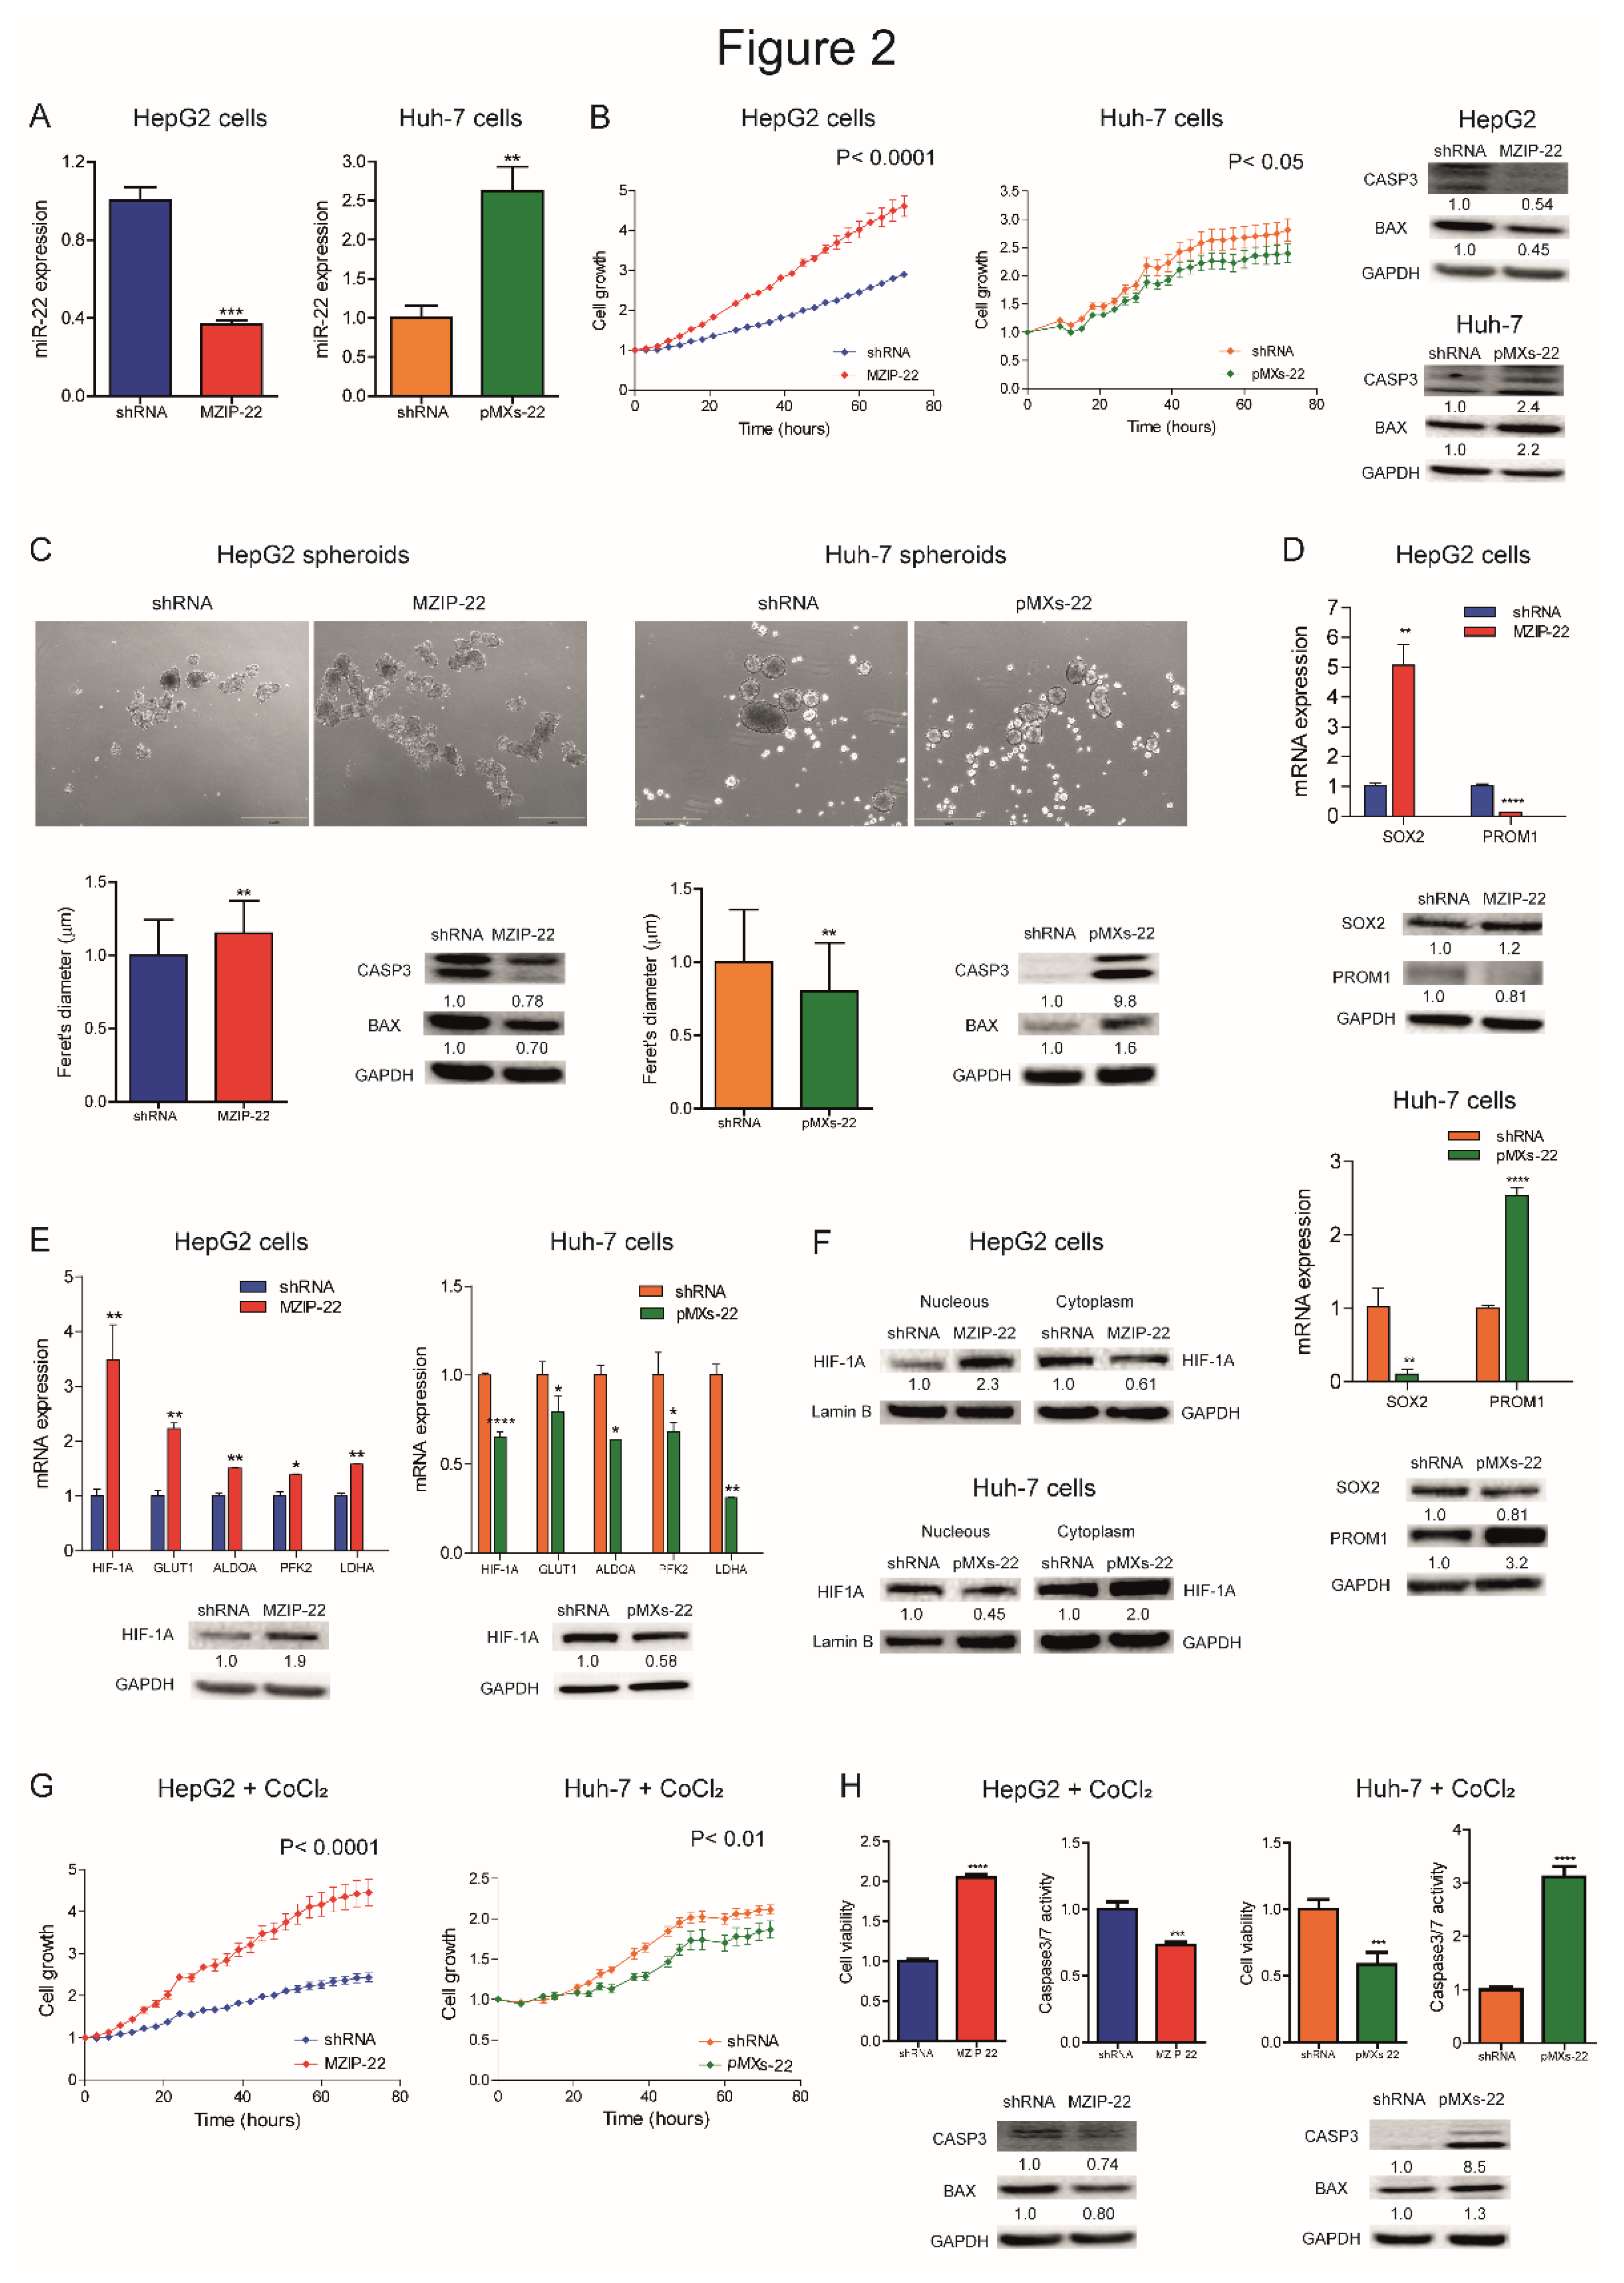
Figure 3.
MiR-22 regulates migration, tumorigenesis, and angiogenesis in preclinical models. (A) Wound healing assays and related histograms of miR-22-silenced (MZIP-22) HepG2 cells and miR-22-overexpressing (pMXs-22) Huh-7 cells and related controls (shRNA). Representative images at initial (T0) and final (T96 or T48 hours) times of wound closure are displayed. Y-axes report the percentage of wound closure at final times with respect to T0. Mean ± SD values are reported. Two independent experiments were performed in duplicate. Real Time PCR and WB analyses of SNAI1 in the same cell lines. Y-axes report 2-ΔΔCt values corresponding to gene expression normalized to controls. Mean ± SD values are displayed. GAPDH was used as housekeeping gene. Real Time PCR and WB analyses were performed in two independent experiments in triplicate and duplicate, respectively. (B) Box plot graphs representing in vivo tumorigenesis of miR-22-silenced (MZIP-22) HepG2 cells and miR-22-overexpressing (pMXs-22) Huh-7 cells and related controls (shRNA) in immunocompromised mice (N=5 per group) at intermediate timepoints (3 and 6 weeks after cells injection, respectively). Y-axes report the tumor volume (mm3) measured by caliper (1/2 D*d2). (C) Real Time PCR analysis of HIF1A pathway in xenograft mice obtained following subcutaneous injection of miR-22-silenced (MZIP-22) HepG2 cells and miR-22-overexpressing (pMXs-22) Huh-7 cells and related controls (shRNA). Y-axes report 2-ΔΔCt values corresponding to gene expression normalized to controls. Mean ± SD values are displayed. GAPDH was used as housekeeping gene. Real Time PCR analysis was performed in triplicate. (D) Real Time PCR analysis of SNAI1 in the same xenograft models. Y-axes report 2-ΔΔCt values corresponding to gene expression normalized to controls. Mean ± SD values are displayed. GAPDH was used as housekeeping gene. Real Time PCR analysis was performed in triplicate. (E) WB analysis of apoptotic markers (CASP3, BAX) in xenograft mice obtained following subcutaneous injection of miR-22-silenced (MZIP-22) HepG2 cells and miR-22-overexpressing (pMXs-22) Huh-7 cells and related controls (shRNA). GAPDH was used as housekeeping gene. Y-axes report 2-ΔΔCt values corresponding to protein expression normalized to controls. Mean ± SD values are displayed. (F) Real Time PCR analysis of CASP3 expression in the same xenograft models. Y-axes report 2-ΔΔCt values corresponding to gene expression normalized to controls. Mean ± SD values are displayed. GAPDH was used as housekeeping gene. Real Time PCR analysis was performed in triplicate.
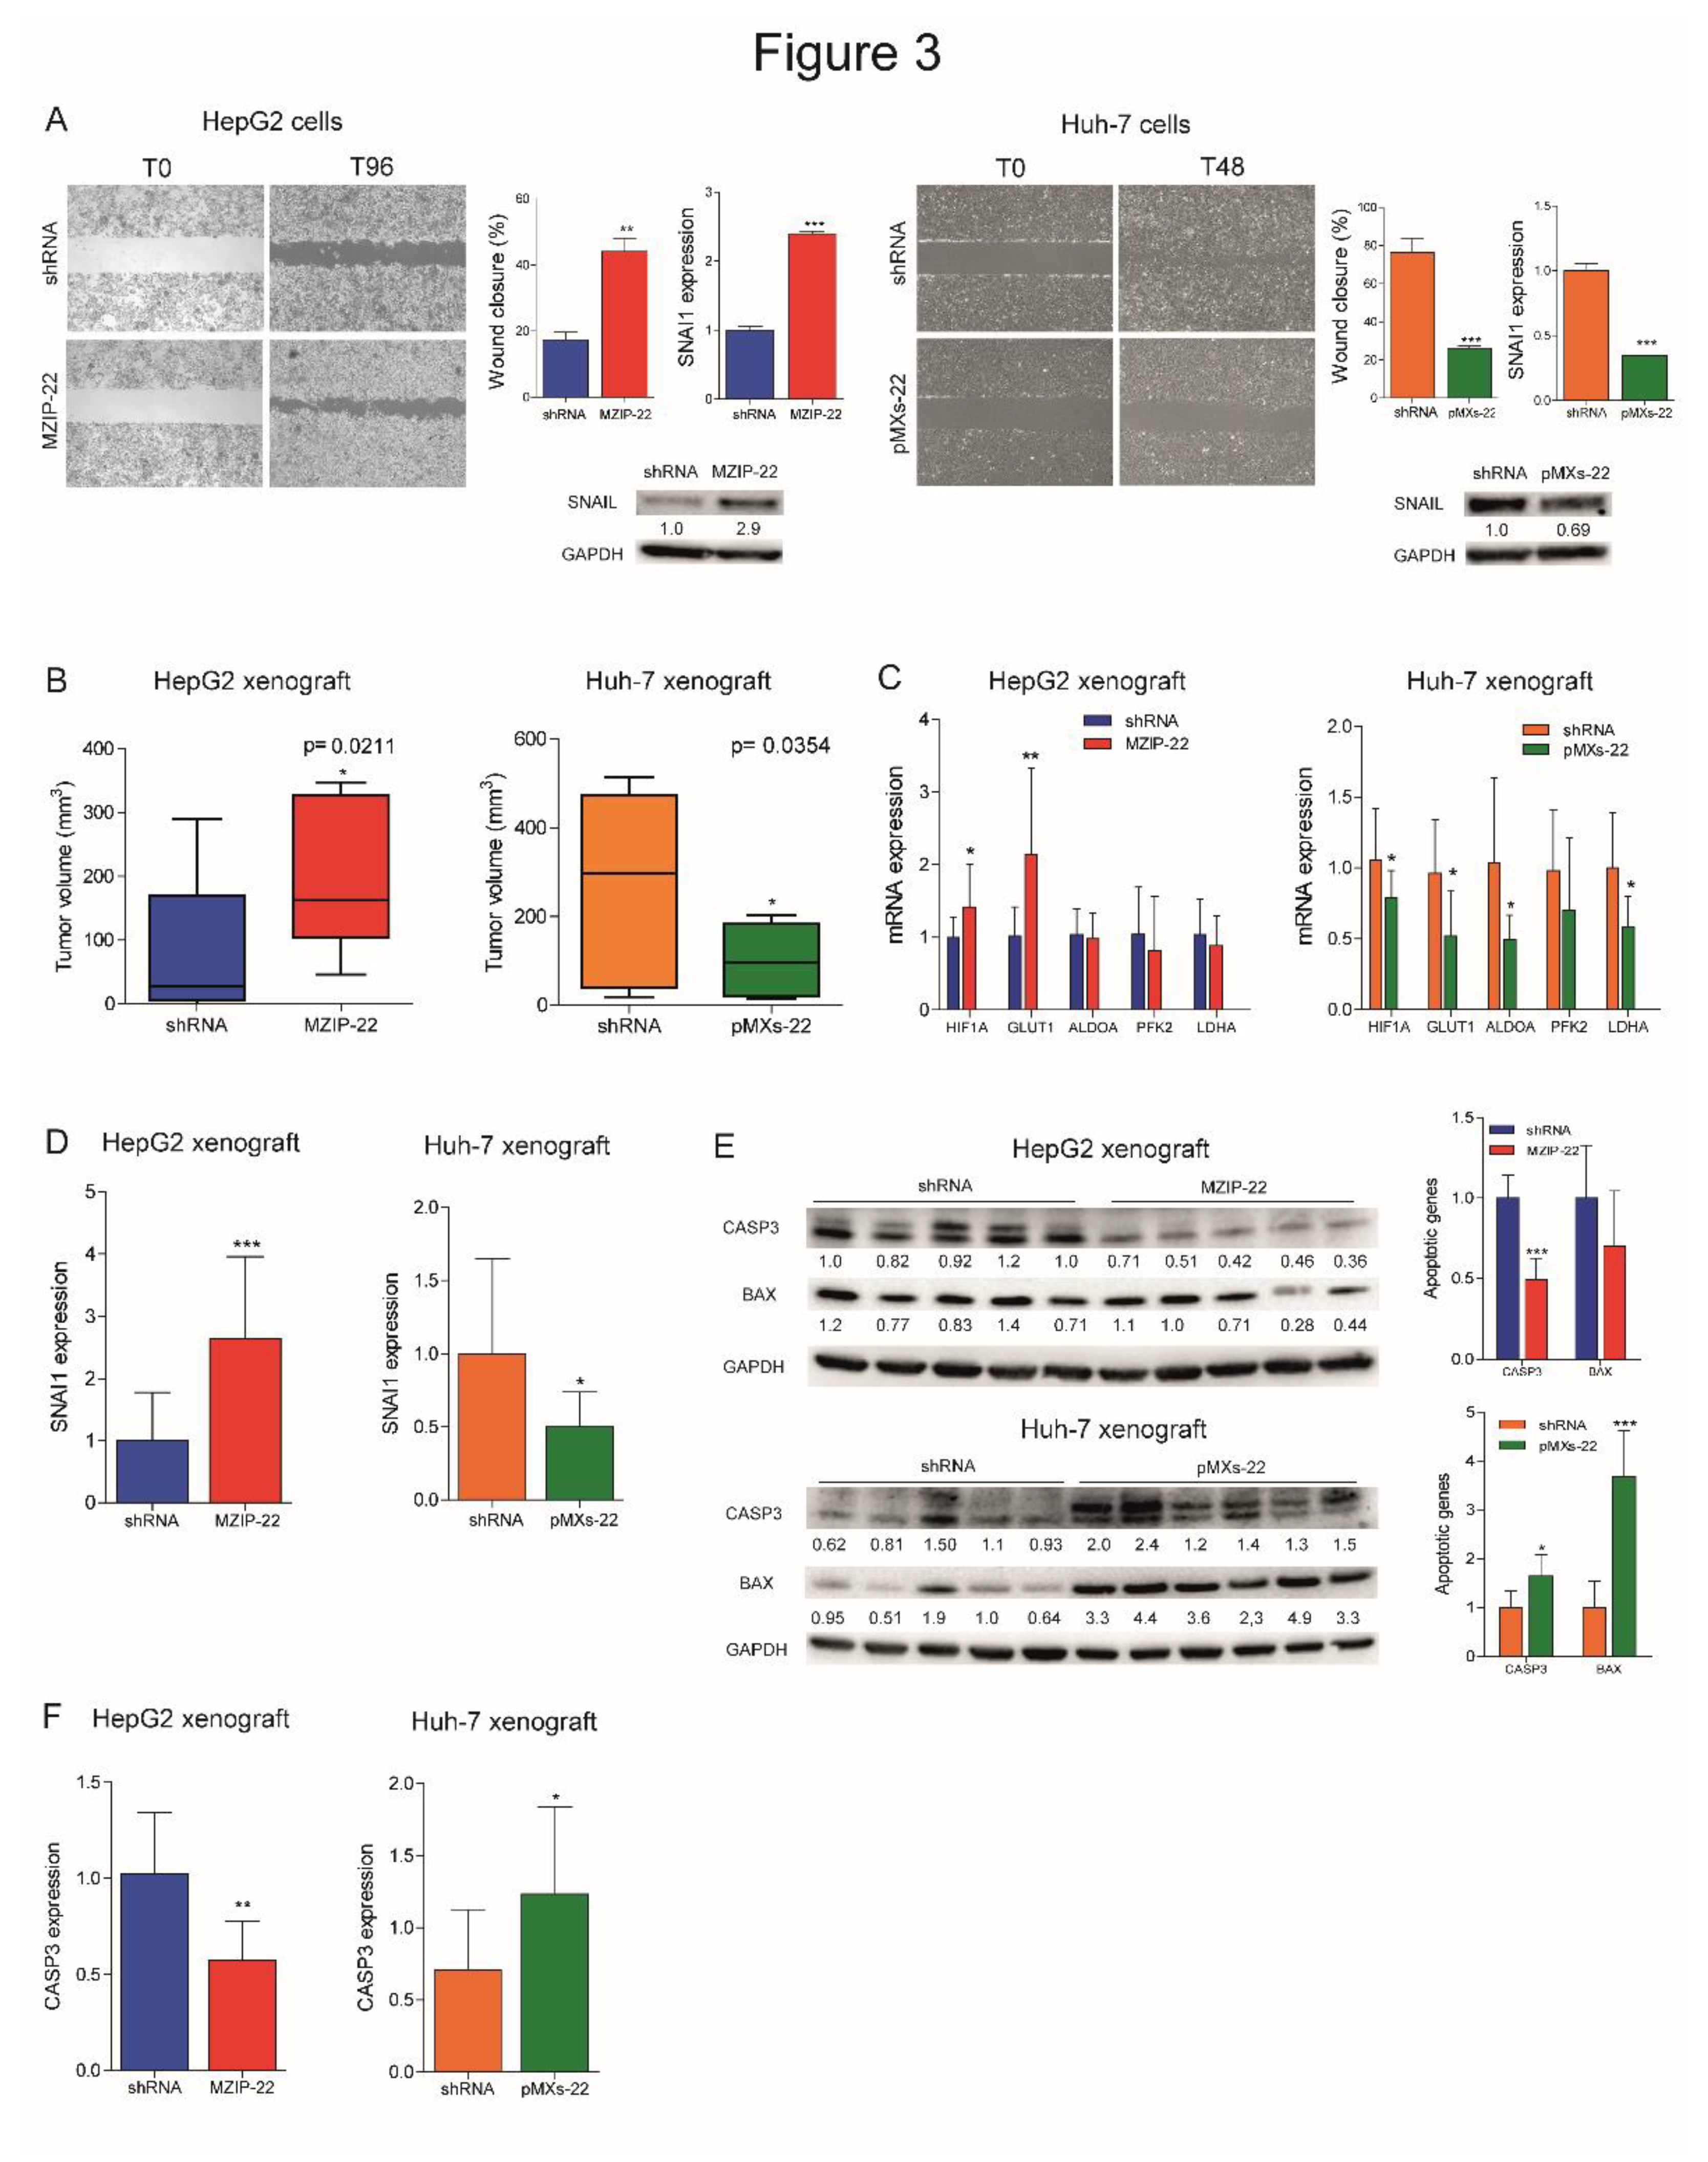
Figure 4.
GLUT1 is a target of miR-22 in HCC and regulates cell metabolism. (A) WB analysis of GLUT1 expression in miR-22-silenced (MZIP-22) HepG2 cells and miR-22-overexpressing (pMXs-22) Huh-7 cells and related controls (shRNA). GAPDH was used as housekeeping gene; WB analysis was performed in two independent experiments. (B) Dual-luciferase activity assay of wild type (WT) and mutant (MUT) GLUT1-3’UTR vectors co-transfected with miR-22 in HepG2 and Huh-7 cells. NC: negative control precursor miRNA. Y-axes report the firefly/renilla ratio normalized to controls (NC). Mean ± SD values are displayed. Analysis was performed in two independent experiments in triplicate. (C) WB analyses of GLUT1 expression in miR-22-silenced (MZIP-22) HepG2 cells and miR-22-overexpressing (pMXs-22) Huh-7 cells and related controls (shRNA) grown in acidic conditions (pH 6.8). GAPDH was used as housekeeping gene; WB analysis was performed in two independent experiments. (D) Cell viability assay of miR-22-silenced (MZIP-22) HepG2 cells and miR-22-overexpressing (pMXs-22) Huh-7 cells and related controls (shRNA) grown in acidic conditions (pH 6.8). Rescue experiment was performed in miR-22-silenced (MZIP-22) HepG2 cells treated with GLUT1-inhibitor BAY-876 (5 µM, 72 h) and grown in acidic conditions (pH 6.8). Vehicle: DMSO. Y-axes report chemiluminescent signals normalized to controls. Mean ± SD values are displayed. Two independent experiments were performed in quadruplicate. (E) Enzymatic assay measuring glucose uptake and HPLC analysis measuring extracellular lactate in control (shRNA) and miR-22-silenced HepG2 cells (MZIP-22) at different time points (24, 48, 72 hours). Data were normalized for protein content obtained at each time point. Mean ± SD values are displayed. Two independent experiments were analyzed in triplicate. (F) Representative images (40X magnification) and relative histograms of PAS staining in miR-22-silenced (MZIP-22) HepG2 cells and miR-22-overexpressing (pMXs-22) Huh-7 cells and related controls (shRNA). Rescue experiment was performed in miR-22-silenced (MZIP-22) HepG2 cells treated with GLUT1-inhibitor BAY-876 (5 µM, 48 h). Vehicle: DMSO. Y-axes report the percentage of PAS positive cell area normalized to control. Mean ± SD values are displayed. Ten randomly selected fields were analyzed from two independent experiments in triplicate. Scale bars: 50 μm. (G) Lipid droplets (LDs) accumulation in miR-22-silenced (MZIP-22) HepG2 cells and miR-22-overexpressing (pMXs-22) Huh-7 cells and related controls (shRNA) stained with Nile Red. Y-axes show the quantification of LDs number per cell normalized to control. Mean ± SD values are reported. Two independent experiments were performed in triplicate. (H) Real Time PCR analysis of FASN and ACLY in miR-22-silenced (MZIP-22) HepG2 cells and miR-22-overexpressing (pMXs-22) Huh-7 cells and related controls (shRNA). Y-axes report 2-ΔΔCt values corresponding to gene expression normalized to controls. Mean ± SD values are displayed. GAPDH was used as housekeeping gene. Real Time PCR analysis was performed in two independent experiments triplicate. (I) Growth curves of miR-22-silenced (MZIP-22) and control HepG2 cells (graph above) or miR-22-overexpressing (pMXs-22) and control Huh-7 cells (graph below) grown in culture medium without glucose. Growth curves were normalized to T0. Mean ± SD values are reported. Two independent experiments were performed in quadruplicate. (J) Correlation graphs between miR-22 and GLUT1 mRNA levels in HCC patients from Bologna and “LIHC” cohorts and in tumor nodules of DEN-HCC rats. Axes report 2-ΔΔCt values corresponding to miR-22 and GLUT1 levels transformed in a log2 form. U6RNA and GAPDH were used as housekeeping genes for miRNA and gene quantification, respectively. Real Time PCR analysis was run in triplicate.
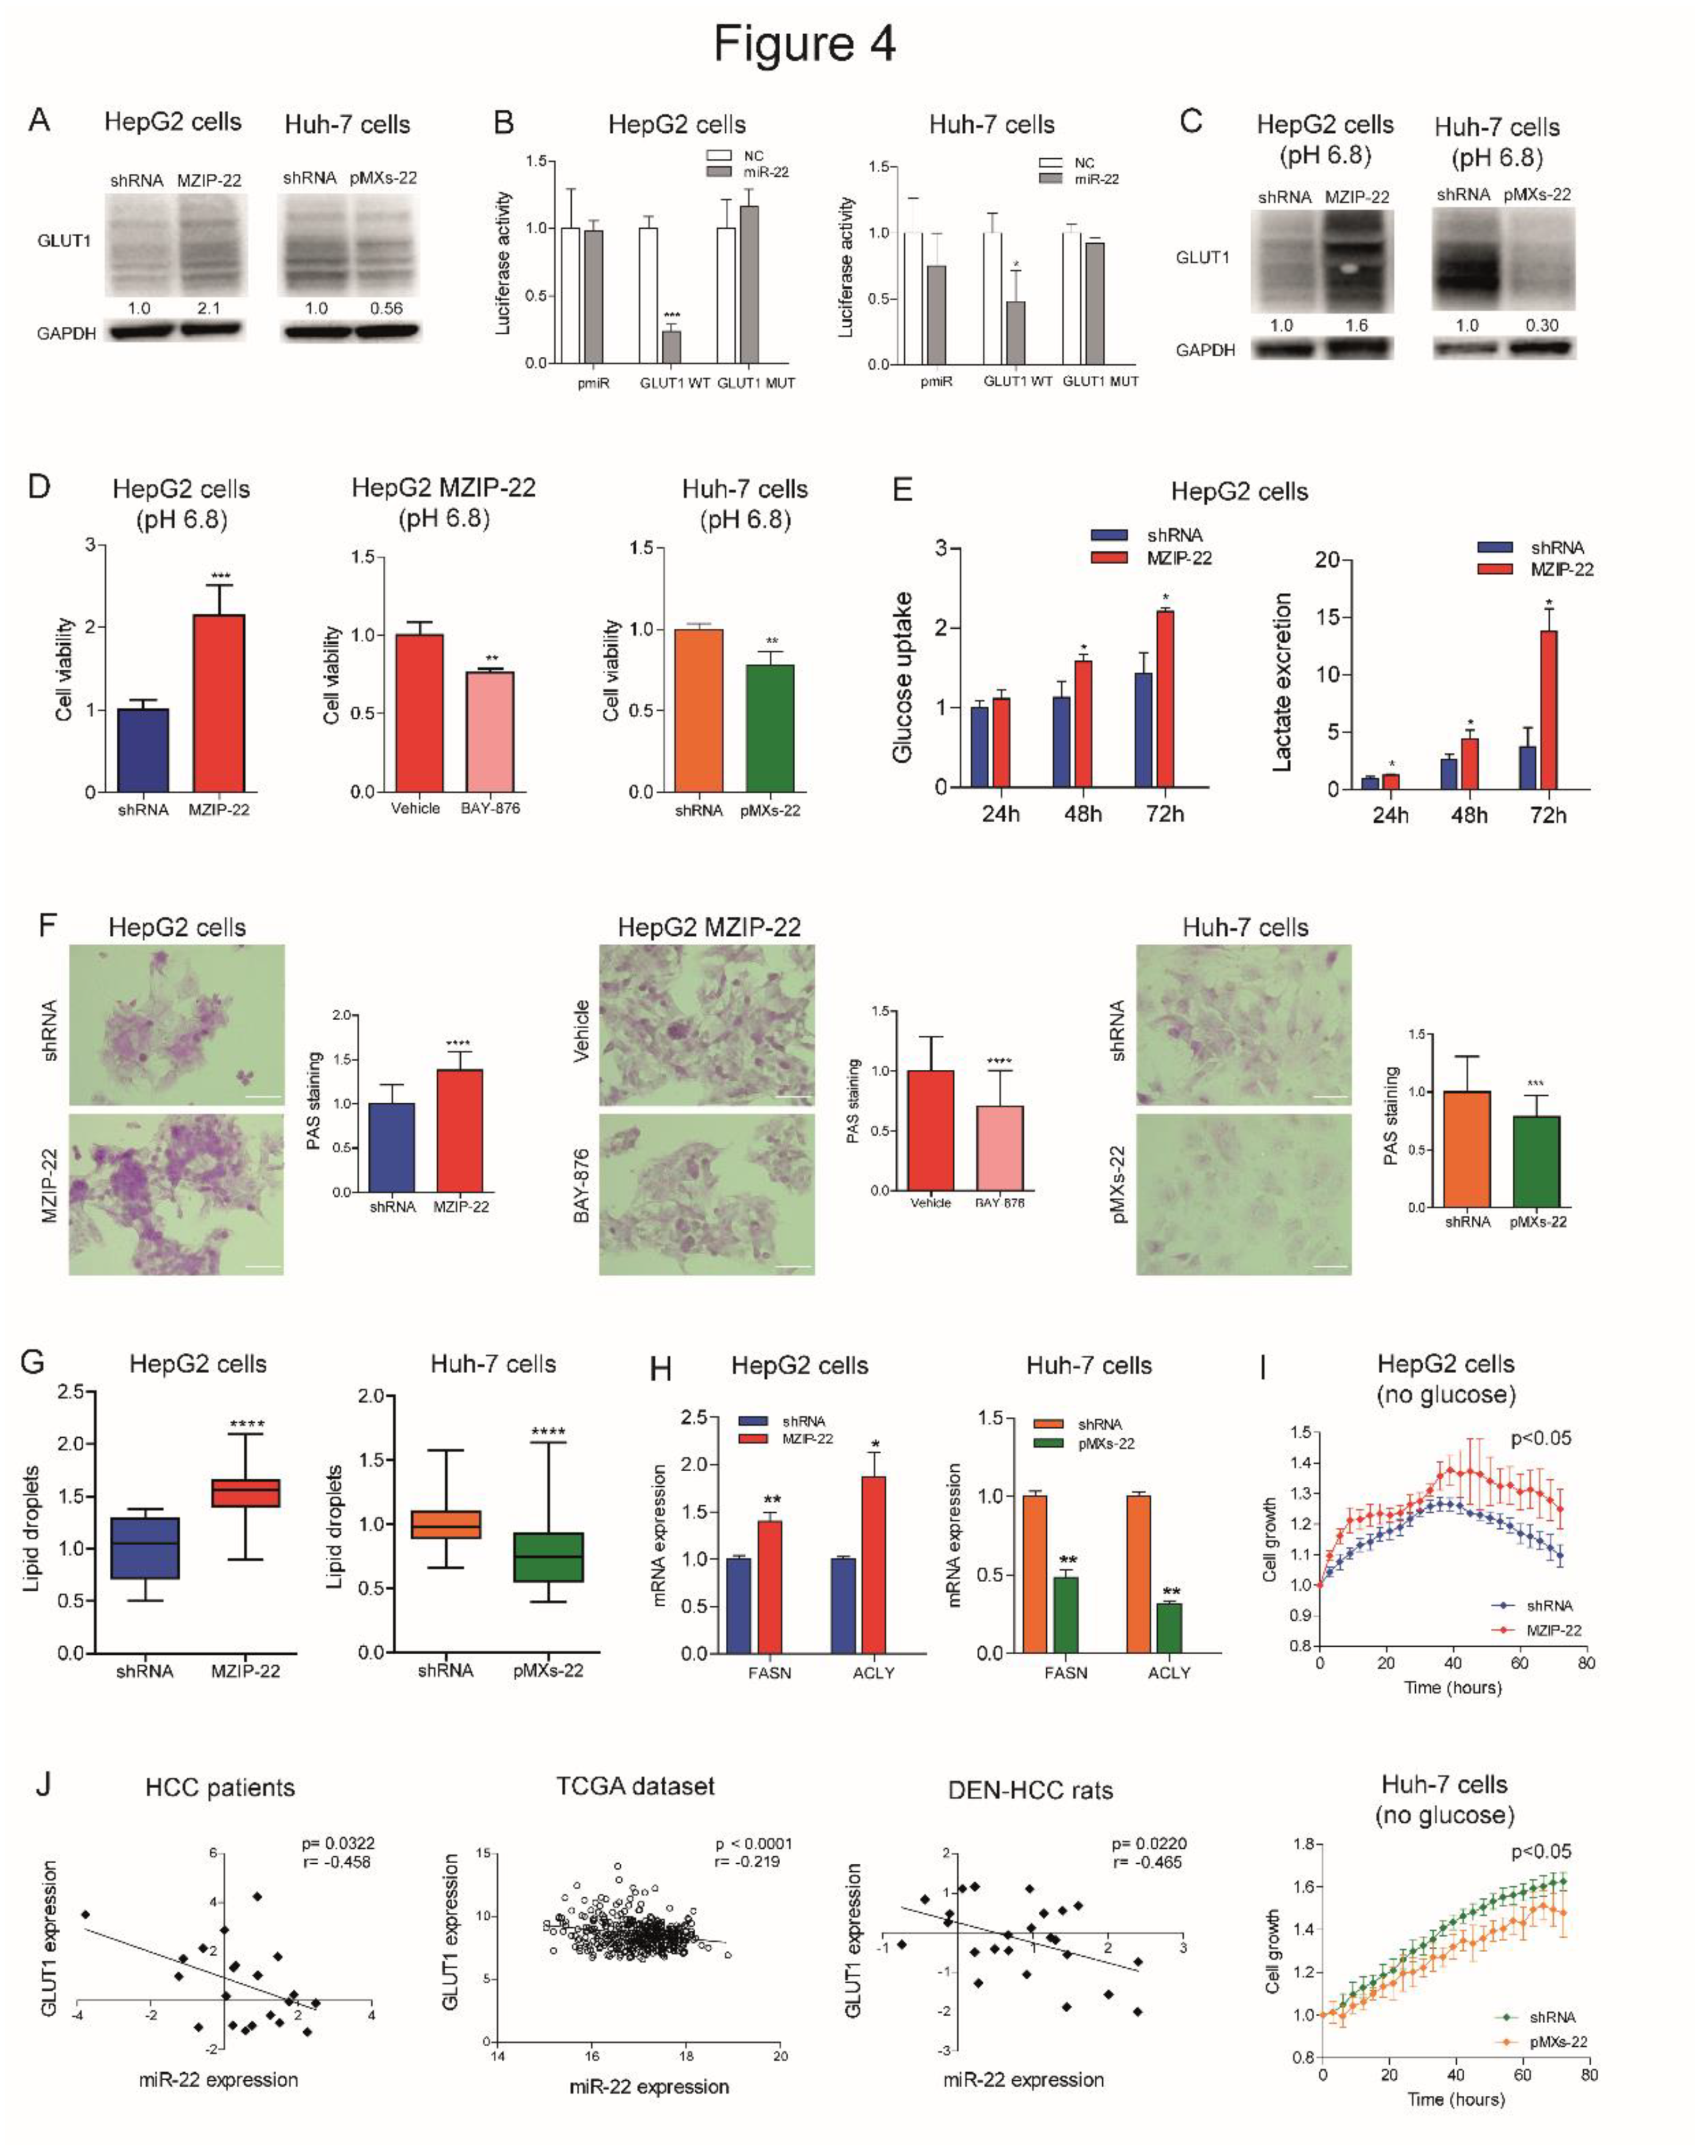
Figure 5.
MiR-22 downregulation is associated with sorafenib resistance in HCC. (A) Growth curves of miR-22-silenced (MZIP-22) HepG2 cells and miR-22-overexpressing (pMXs-22) Huh-7 cells and related controls (shRNA) under sorafenib treatment. Rescue experiment in miR-22-silenced (MZIP-22) HepG2 cells treated with the GLUT1-inhibitor BAY-876 or vehicle (DMSO) and sorafenib. Growth curves were normalized to T0. Mean ± SD values are reported. Two independent experiments were performed in quadruplicate. WB analysis of GLUT1 expression in the same setting. WB was performed in two independent experiments, and GAPDH was used as housekeeping gene. (B, C) Box plot graph of miR-22 (B) and GLUT1 (C) levels in responder (N=8) and non-responder (N=7) HCC nodules from sorafenib-treated rats. Y-axis reports 2-Ct values corresponding to miR-22 or GLUT1 levels. Correlation graph between miR-22 (B) or GLUT1 (C) expression and tumor volume of sorafenib-treated DEN-HCC rats. Axes report 2-Ct values corresponding to mRNA levels and tumor size (mm3) of HCC nodules transformed in a log2 form. Beta-actin or U6RNA were used as housekeeping genes. Real Time PCR analysis was run in triplicate. (D) Correlation graphs between miR-22 and GLUT1 or CASP3, PUMA and BMF mRNA levels in HCC nodules from DEN-HCC rats treated with sorafenib (N=15). Axes report 2-Ct values corresponding to mRNA levels transformed in a log2 form. Beta-actin or U6RNA were used as housekeeping genes. Real Time PCR analysis was run in triplicate. (E) Box blot graph of tumor volume in miR-22-silenced (MZIP-22) or control (shRNA) HepG2 xenograft mice (N=5 per group) treated with sorafenib (60 mg/kg). (F, G) Real Time PCR of HIF1A target genes, angiogenic markers (F) and SNAI1 (G) in the same animal model. Y-axes report 2-Ct values corresponding to gene expression normalized to controls. Mean ± SD values are displayed. GAPDH was used as housekeeping gene. Real Time PCR analysis was run in triplicate.
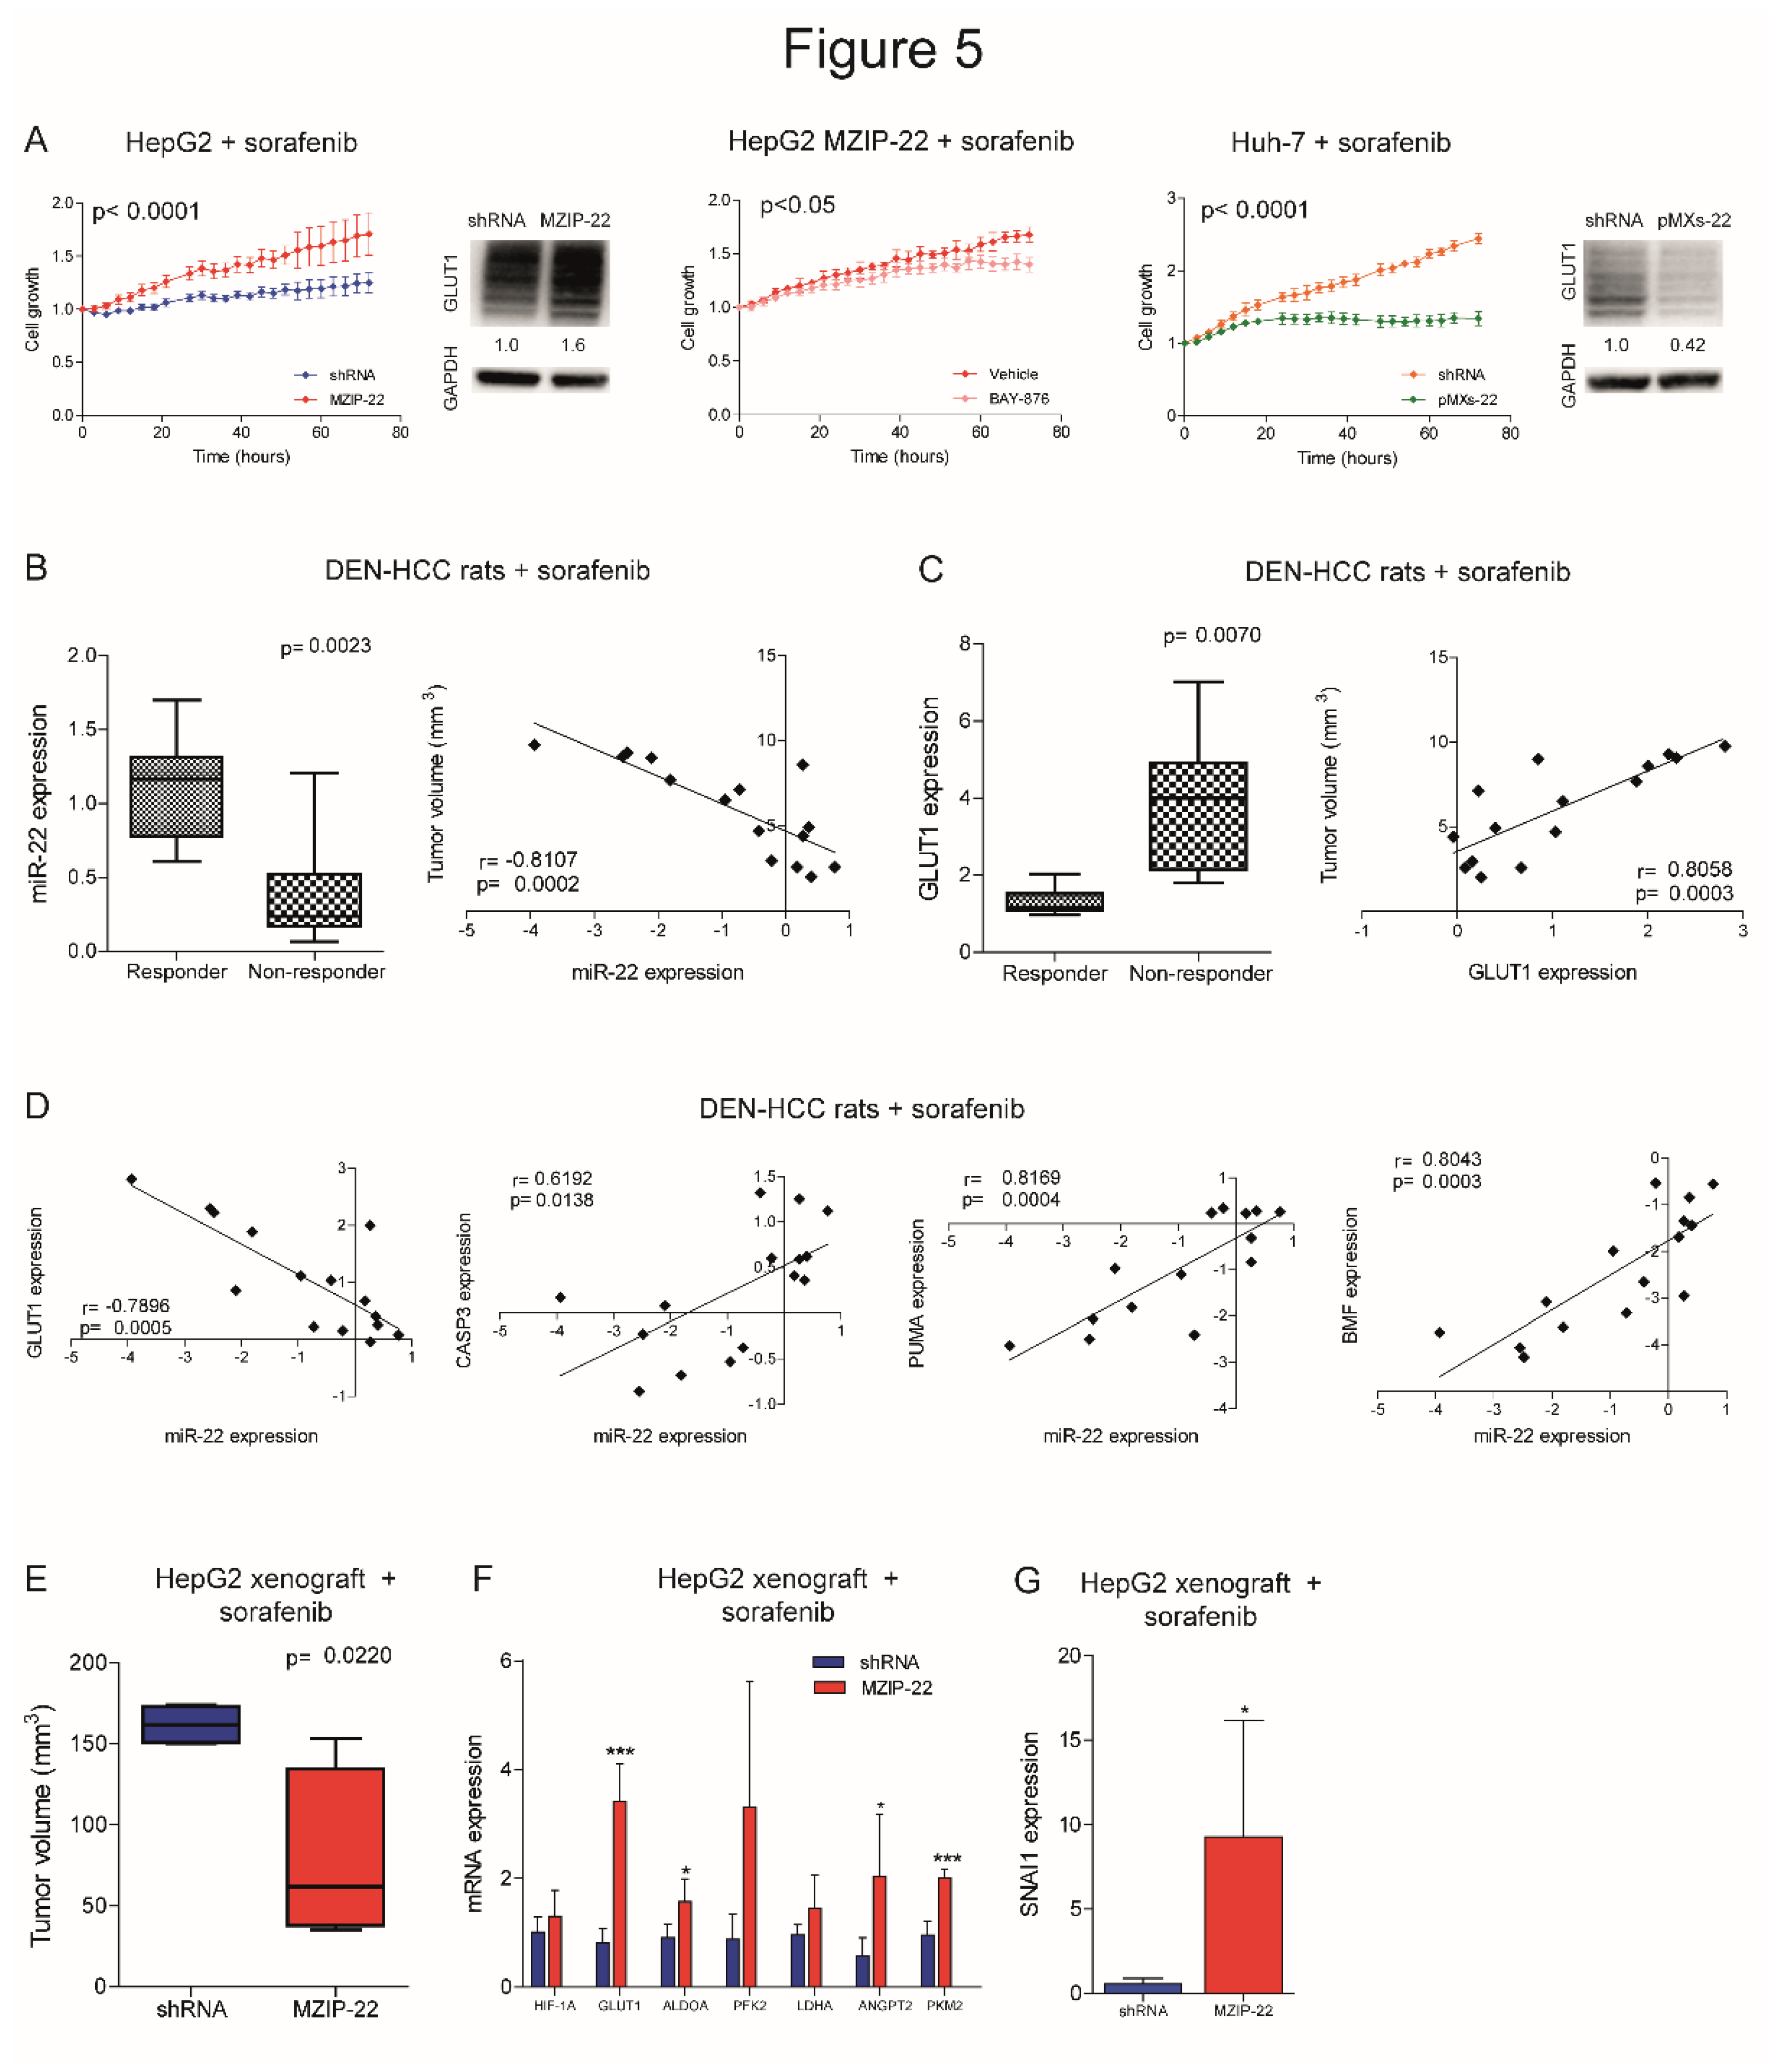
Figure 6.
MiR-22 circulating levels predict sorafenib resistance in human and rat HCCs. (A) Box plot graph of GLUT1 expression in early HCCs from the Bologna cohort divided based on serum miR-22 levels (high, N=11; low, N=10). Y-axis reports 2-ΔΔCt values. Mean ± SD values are displayed. GAPDH was used as housekeeping gene. (B) Correlation graph between tissue and serum miR-22 expression levels in early HCCs from the Bologna cohort. Axes report 2-ΔΔCt values corresponding to miR-22 tissue and serum levels. U6RNA or cel-miR-39 were used for data normalization. Real Time PCR analysis was run in triplicate. (C) Extracellular and intracellular miR-22 levels in HCC cell lines treated with sorafenib (5 µM, 48h). Y-axis reports the fold change of 2-ΔΔCt values between treated and untreated cells. Cel-miR-39 and U6RNA were used for data normalization. Real Time PCR analysis was run in triplicate. (D, E) Correlation graph between serum and tissue miR-22 levels (D) or tumor size (E) in DEN-HCC rats treated with sorafenib (N=12). Axes report 2-ΔΔCt values corresponding to miR-22 serum and tissue levels, or tumor volume (mm3) transformed in a log2 form. U6RNA and cel-miR-39 were used for data normalization. Real Time PCR analysis was run in triplicate. (F) Box plot graph of miR-22 levels in responder (N=6) and non-responder (N=6) HCC nodules from sorafenib-treated rats. Y-axis reports 2-ΔΔCt values corresponding to miR-22 levels. Cel-miR-39 was used as spike-in miRNA for data normalization. Real Time PCR analysis was run in triplicate. (G) Correlation graphs between serum miR-22 and CASP3, PUMA and BMF mRNA levels in HCC nodules from DEN-HCC rats treated with sorafenib (N=12). Axes report 2-ΔΔCt values corresponding to serum miR-22 and mRNA levels of HCC nodules transformed in a log2 form. Beta-actin or cel-miR-39 were used for data normalization. Real Time PCR analysis was run in triplicate. (H) Box plot graph of miR-22 serum levels in responder (N = 31) and non-responder (N = 21) sorafenib-treated patients from the Bologna cohort. Y-axis reports 2-ΔΔCt values corresponding to circulating miR-22 levels. Cel-miR-39 was used as spike-in miRNA for data normalization. Real Time PCR analysis was run in triplicate.
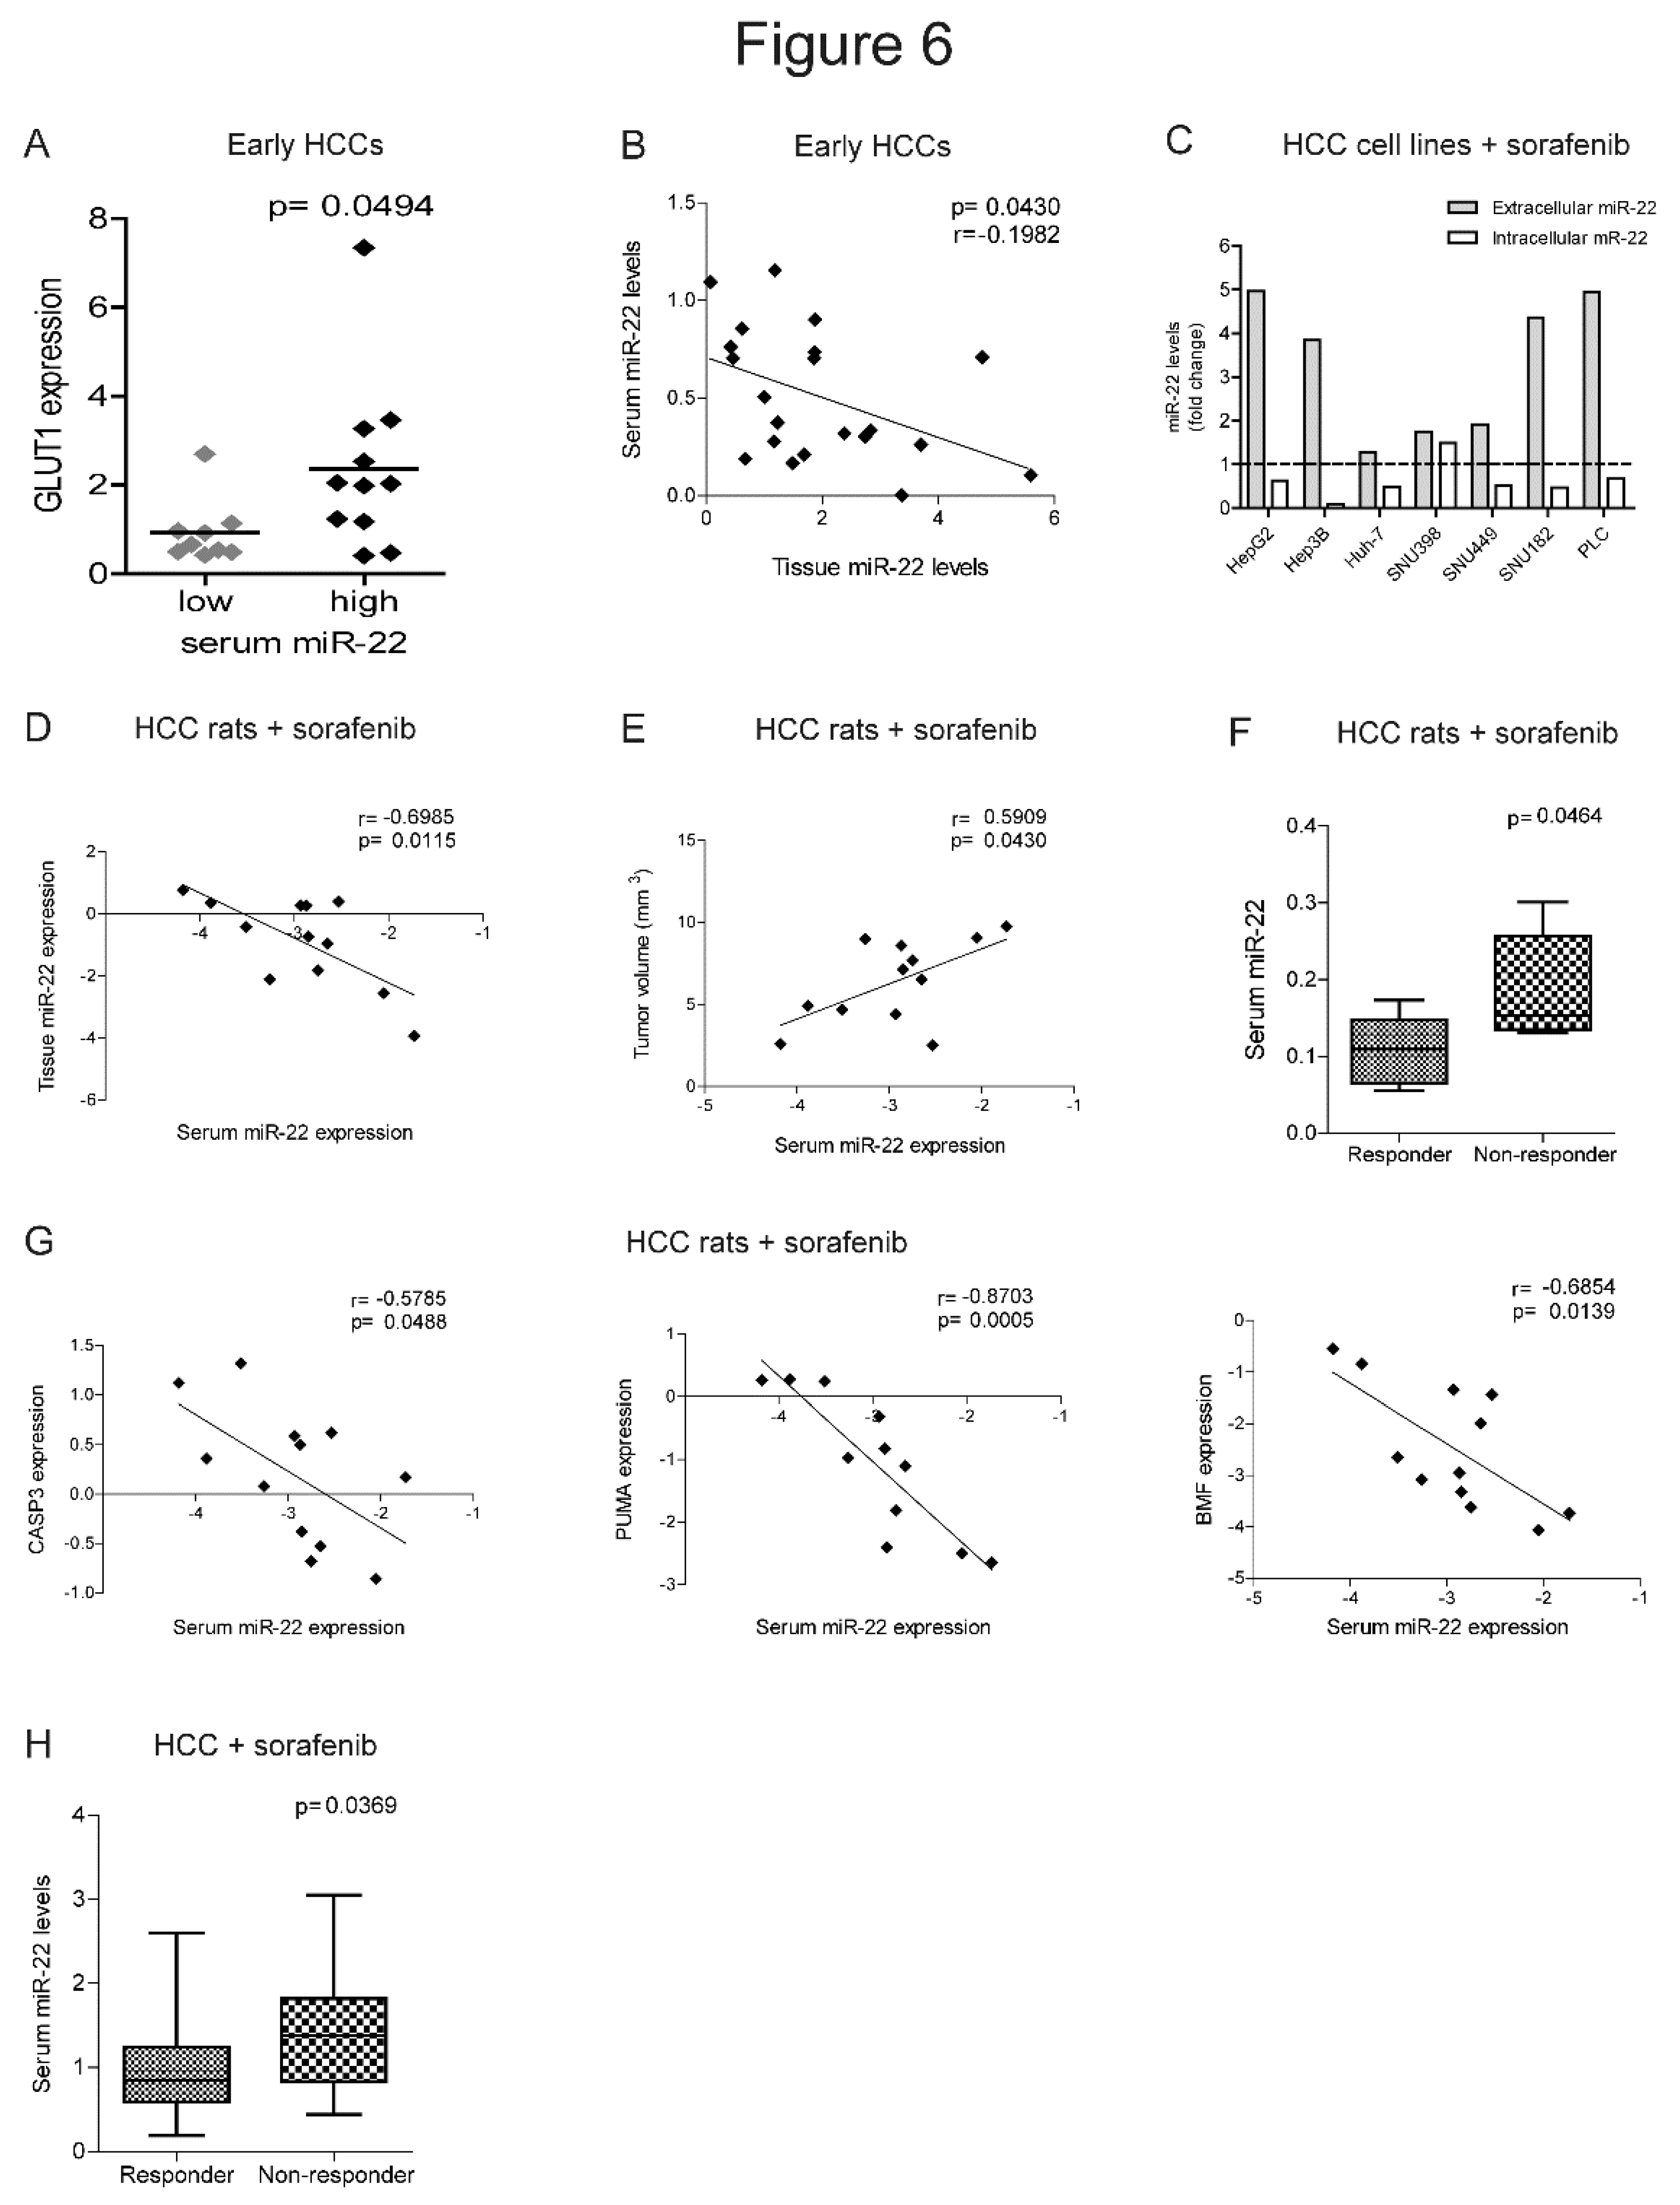
Disclaimer/Publisher’s Note: The statements, opinions and data contained in all publications are solely those of the individual author(s) and contributor(s) and not of MDPI and/or the editor(s). MDPI and/or the editor(s) disclaim responsibility for any injury to people or property resulting from any ideas, methods, instructions or products referred to in the content. |
© 2025 by the authors. Licensee MDPI, Basel, Switzerland. This article is an open access article distributed under the terms and conditions of the Creative Commons Attribution (CC BY) license (http://creativecommons.org/licenses/by/4.0/).
Copyright: This open access article is published under a Creative Commons CC BY 4.0 license, which permit the free download, distribution, and reuse, provided that the author and preprint are cited in any reuse.


