
Submitted:
07 March 2025
Posted:
10 March 2025
You are already at the latest version
Abstract
The aim of this study was to investigate the impact of the molecular structure of thermochromic liquid crystals (TLC) on colour change, with a particular focus on the application of TLC inks and bacterial nanocellulose (BNC) in smart packaging. The chiral nematic (cholesteric) structure of TLC pigments plays a critical role in their dynamic colour-changing properties, with a pronounced effect from red to blue as temperature increases, especially when applied to a black substrate. This research explores the compatibility of TLC inks and BNC through material interactions and colorimetric properties, focusing on smart packaging applications, indicator systems, and related fields. The results suggest potential use of TLC inks in intelligent and sustainable packaging solutions, where the combination of TLC inks with BNC, a natural, biodegradable, and eco-friendly material is favoured. In this study, TLC inks were screen-printed onto BNC based films and black uncoated paper. Spectrometric measurements were used to examine the influence of the chiral nematic structure of liquid crystal pigments on dynamic colour change. The results of the temperature-dependent colour play effect were validated using the communication mechanism developed in our previous research.
Keywords:
thermochromic liquid crystals (TLC)
; bacterial nanocellulose (BNC)
; smart packaging
; colour play effect
; chiral nematic structure
1. Introduction
The chiral nematic (cholesteric) structure of thermochromic liquid crystal (TLC) pigments plays a critical role in the dynamic colour-changing properties of TLC printing inks [1], [2]. The colour play effect, characterized by transitions from red to blue as temperature increases, is most effective when the inks are applied onto a black substrate [3]. This effect is attributed to the precise structural arrangement of the TLC pigments, which enables their functionality in intelligent applications. Thermochromic inks are widely used in graphic applications, including smart packaging, security printing, brand protection, marketing, and novelty printing, but also in medical application, toys and textile colouring [4], [5], [6], [7]. The TLC ink application to a print is to achieve added value by giving an indication of the product`s temperature, security (consumer protection) and/or design and marketing.
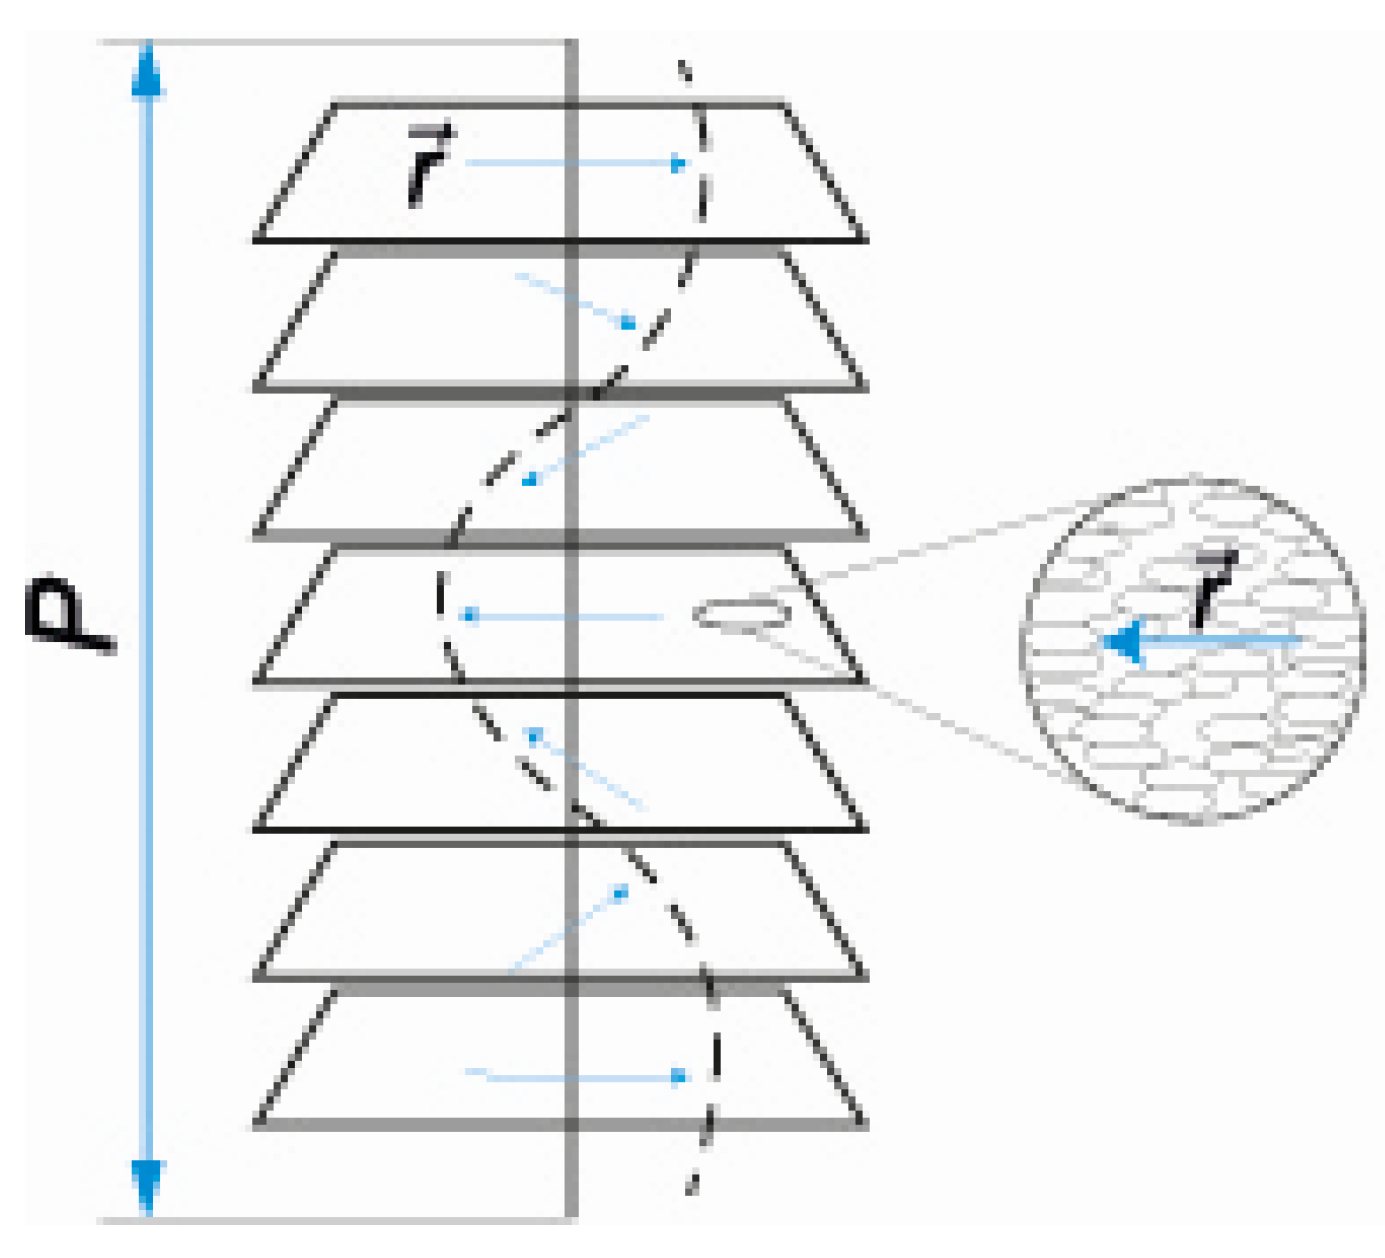
Thermochromic inks generally consist of microencapsulated thermoresponsive materials in a binder, with the colour change triggered by the activation temperature (TA) [4], [7]. Two primary types of thermoresponsive materials are used: leucodye-based composites (LD) and thermochromic liquid crystals (TLCs). In both types, the binder plays a critical role in defining the printing and curing processes, while the microencapsulated pigments determine the colour-changing behaviour [4], [6], [8]. In LD types, only two-colour states appear, coloured and uncoloured. TLC inks are especially notable for their colour play effect, which occurs within a narrow temperature bandwidth, transitioning from red, orange, yellow, green to blue as the temperature rises [9]. The colour play effect occurs within the activation region of the TLC ink, where the spectral colour of a given wavelength (λ) becomes visible when the elongated molecules of the active material inside the microcapsules form a helical superstructure with a pitch equal to λ. This material reflects only the light with the corresponding λ (Figure 2) [1], [4], [6]. In Figure 2 P represents the pitch length of the helix, which is formed by a 360° rotation of the elongated liquid crystal molecules. The pitch length varies with temperature and represents the length at which the vector r in the helix rotates by 360˚ (vector r represents the orientation of elongated TLCs molecules in monomolecular layer). The thermochromic effect of TLCs results from this temperature-dependent pitch: as the temperature increases, the helical pitch shrinks, causing the reflection of light with shorter wavelengths, and consequently, the material's colour shifts towards blue shades. The thermochromic effect of TLCs is, therefore, directly related to the ratio between the spiral length and the pitch of the helical structure, with each temperature corresponding to a distinct reflected wavelength and, consequently, a different colour.
Figure 1.
Helical superstructure of the TLCs [2].
Figure 1.
Helical superstructure of the TLCs [2].
Having in mind their working mechanism, thermoresponsive TLC inks offer significant advantages due to their ability to dynamically respond to temperature changes, making them ideal for intelligent packaging solutions. Besides giving added value to packaging solution, a modern packaging must tackle another important challenge – diminish the packaging’s environmental impact. One of the materials with significant potential is cellulose, a natural based polymer used in various applications. There are many types of cellulose developed, one of them is bacterial nanocellulose (BNC). Bacterial nanocellulose (BNC) is a type of nanocellulose produced by bacteria and has possible potential for the above purposes. It is a natural, biodegradable, and renewable material that has a variety of potential applications, including as a food additive, a pharmaceutical excipient, a cosmetic ingredient, and a reinforcement agent in composites. Bacterial nanocellulose can be used in smart packaging applications to improve the performance of packaging materials. It can be used to improve the barrier properties of packaging materials to keep food and other products fresh, and to improve the strength and toughness of packaging materials to prevent them from breaking or tearing. Additionally, bacterial nanocellulose can be used to create packaging materials that are biodegradable and environmentally friendly [10]. Having in mind positive properties of BNC and thermoresponsive TLC inks, this research focuses on determining the potential application of thermochromic liquid crystal (TLC) inks and bacterial nanocellulose (BNC) as materials for smart packaging. To enable that, investigation of the TLC and BNC compatibility, by analysing their material interactions and colorimetric properties was made.
For this study BNC based thin films was prepared, and carbon black was added into their structure to create a suitable printing substrate for TLC inks. The TLC inks were screen-printed on black BNC based films and black uncoated paper, which served as a reference material. Through spectrometric measurements of the printed TLC inks, the influence of the chiral nematic (cholesteric) structure of liquid crystal pigments on the dynamic colour change was examined. The results of the temperature dependent colour play effect are validated using the communication mechanism developed in our previous research [11]. The distinctive communication mechanism of TLC inks is defined by their temperature-dependent peak in the reflectance spectrum, which serves as a reliable indicator of their structure-induced behaviour. Independent of substrate properties and ink layering, this feature can validate the functionality and compatibility of TLC inks and BNC films [11]. The results of this research could show new possibilities for intelligent and sustainable indicator and packaging solutions. When combined TLC and BNC, which is a natural, biodegradable, and eco-friendly substrate, the material could gain additional value through its flexibility, UV protection, and printability.
2. Materials and Methods
2.1. Printing Inks and Printing Substrates
In this research, two water – based TLC printing inks for screen printing applications were used. The printing inks were denoted as TLC 14 and TLC 25 (LCR Hallcrest, UK) as they differ only in temperature at which the activation region is expected (all other properties are similar). The data are given in Table 1, supplied by the manufacturer. TLC 25 becomes red at 25°C, turns to green at 26°C and to blue at 30°C. Outside the temperature activation region TLC 25 ink is expected to gradually become colourless, with the complete colour loss at clearing point above 44°C. TLC 14 is activated at 14°C and develops the entire colour effect within the 5°C temperature region. The clearing point, where the ink reverts to a colourless state, is reported at about 50°C. The specifications of temperature dependent colour of both inks, according to producer’s specifications are presented in Table 1.
TLC inks were screen – printed on two types of substrates: black uncoated paper (UT), 200 g/m2, 630 µm thick, and prepared bacterial nanocellulose films (BNC), 243 µm thick. Both substrates were black, as TLC requires a minimum optical density (D) of 0.72 for the printing substrates to ensure the colour play effect is clearly visible [3]. Substrate UT is commercially available in black colour, while black colour of the BNC was achieved by adding carbon black to the base material.
2.2. BNC Preparation
Bacterial nanocellulose (BNC) was obtained from a by-product of the classical apple vinegar production process, as described by Lavrič, Medvešček, and Skočaj in 2020 [12], which has previously been successfully used for various applications [13], [14], [15]. Thin films were prepared by casting BNC onto a silicone substrate.
To create a suitable printing substrate for TLC inks, 20% (relative to the dry weight of BNC) PRINTEX 200 (Evonik Industries AG, Germany) carbon black pigment was added. To improve wetting and dispersion of carbon black powder, 8% (relative to the total water content) of OROTAN™ 165 Pigment Dispersant (Dow Chemical Company, USA) was incorporate [16]. The films were dried for 48 hours at 23 °C with constant air circulation.
2.3. Printing Process
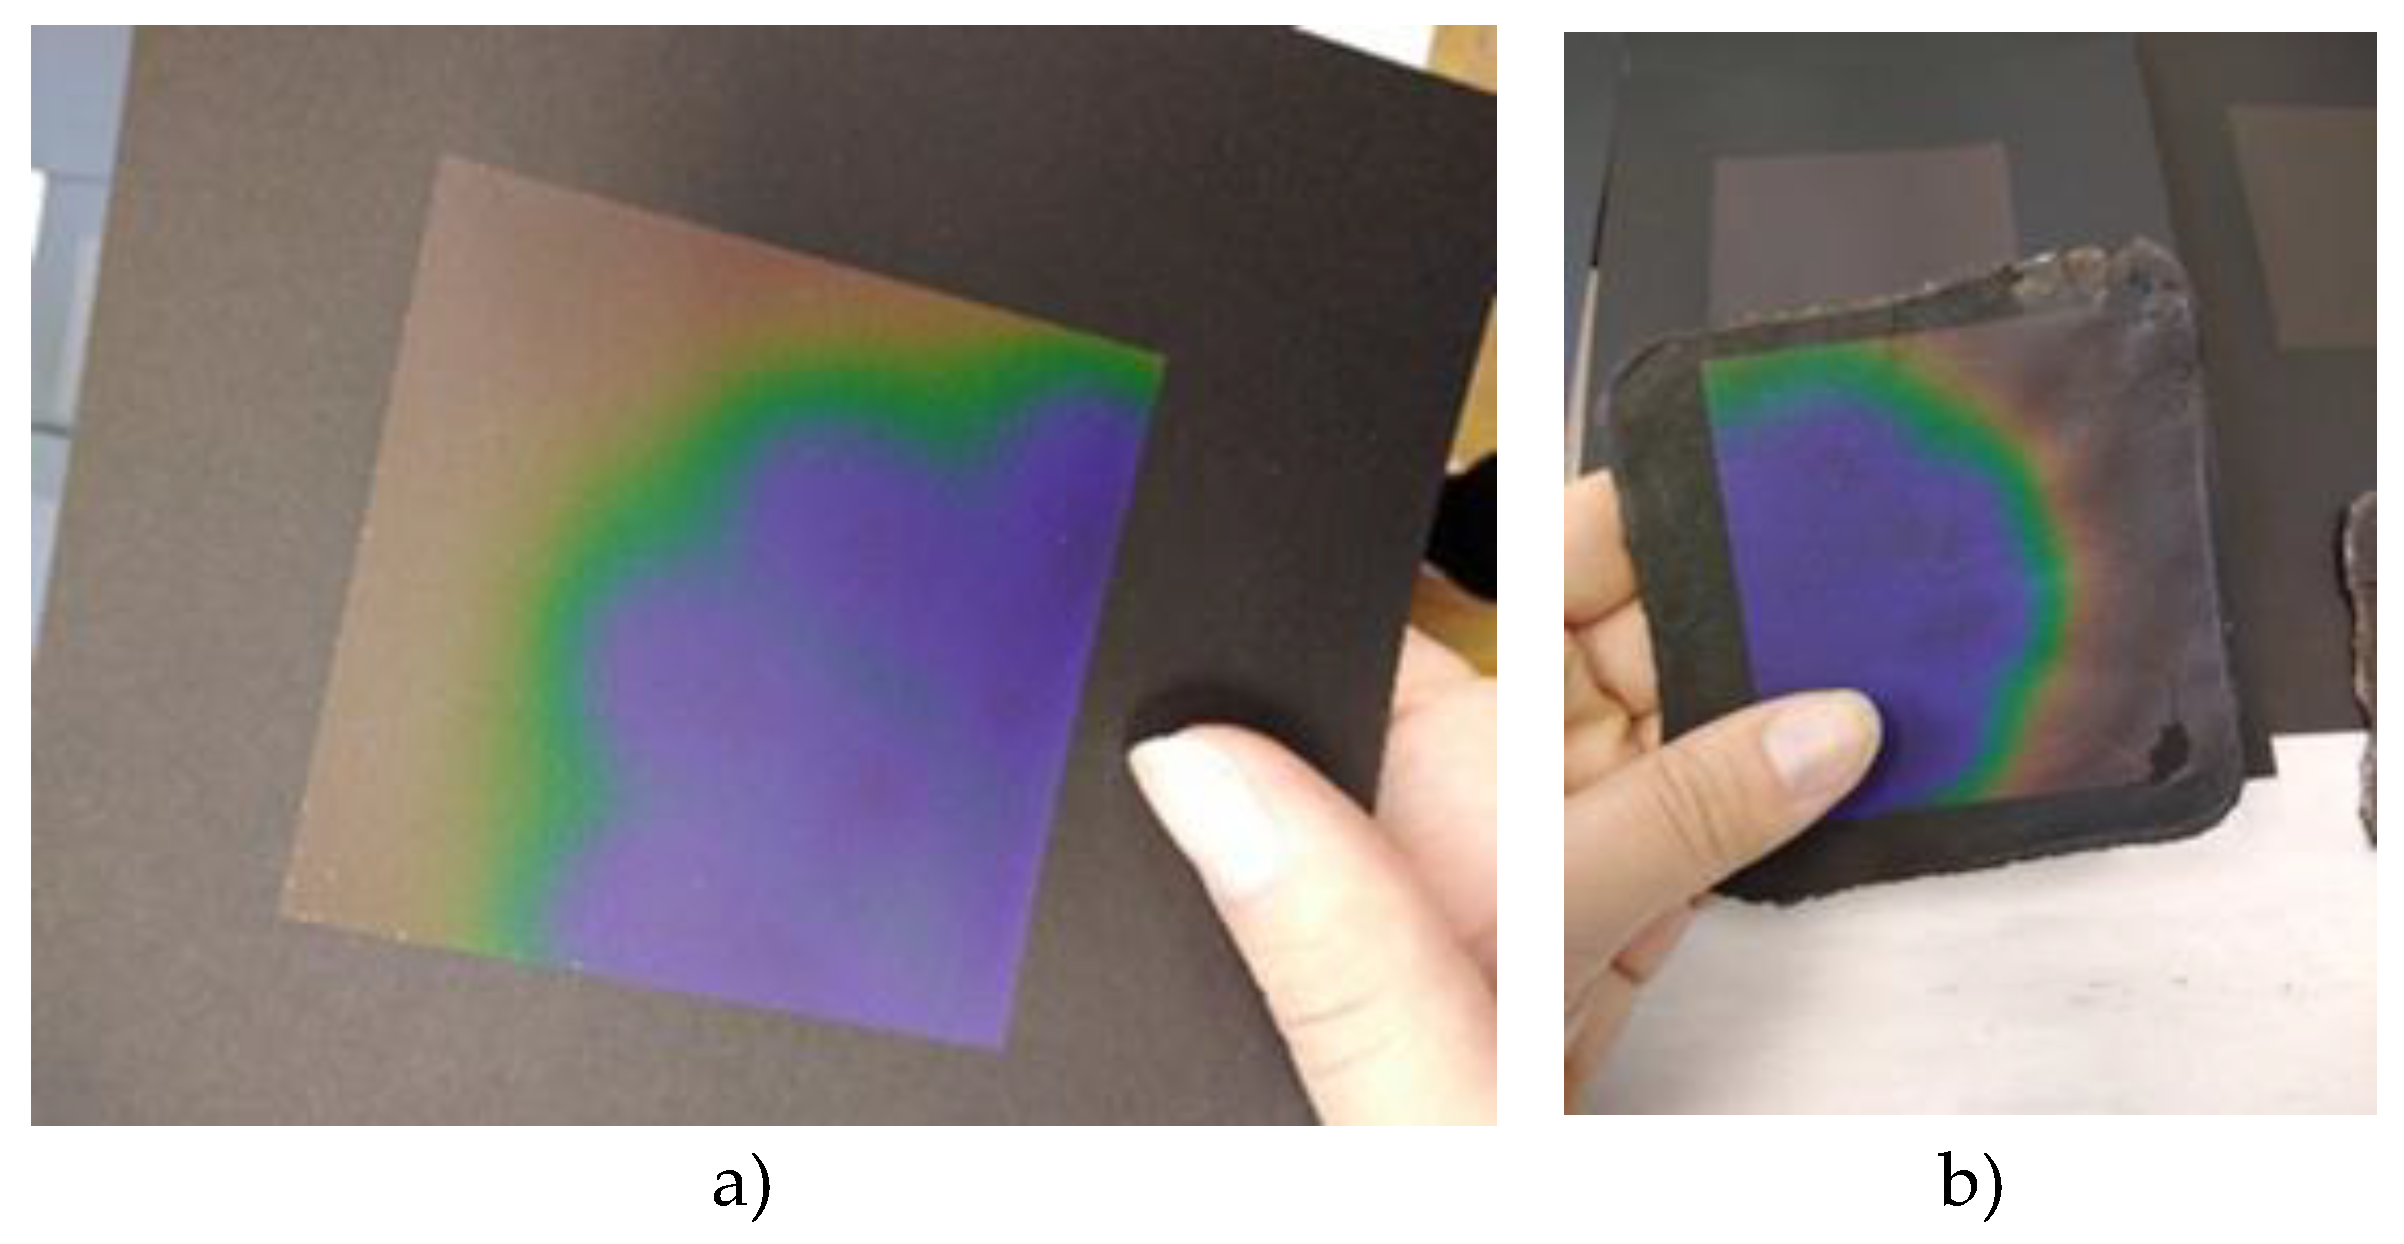
Both TLC 14 and TLC 25 were printed in one layer, using a semi – automatic screen – printing machine equipped with SEFAR® PET 1500 120/305-40 PW polyester mesh with mesh opening of 37μm [17]. The prints were air – dried before further testing. By activating the dry prints and conducting a visual assessment, the functionality of the temperature-dependent TLC 25 ink was confirmed on both types of substrates before further testing (Figure 2).
Figure 2.
Photographs of the TLC 25 ink printed on uncoated black paper (UT) (a) and bacterial nanocellulose (BNC) (b).
Figure 2.
Photographs of the TLC 25 ink printed on uncoated black paper (UT) (a) and bacterial nanocellulose (BNC) (b).
2.4. Characterisation of the Printing Substrates
Microscopy was used in order to determine surface morphology, roughness and average microcapsule size of all samples. For this purpose, Keyence VHX 7000 digital microscope was used, and the roughness parameters were determined according to ISO 25178:2016. Thickness of the substates was measured according to ISO 534 Paper and board — Determination of thickness, density and specific volume [18]. Measurement of absolute moisture content was performed according to TAPPI – T412 om-94 Moisture in pulp, paper and paperboard, using muffle furnace (Nabertherm L9/11 B180) at 105 °C for 60 minutes [19]. To determine the content of fillers in paper substrates and BNC films, the amount of inorganic residue was examined. Ash content was measured at 525°C and 900°C, for 60 minutes, according to standards TAPPI T 211 om - 02 Ash in Wood, Pulp, Paper, and Paperboard: Combustion at 525 °C and TAPPI T 413 om - 93 Ash in wood, pulp, paper and paperboard: combustion at 900 °C [20], [21].
2.5. Temperature Dependent Optical Properties of Printed TLC Inks
The optical properties of prints with TLC 14 ink were measured in a temperature range from 9 to 31°C, and of TLC 25 between 20 and 38°C. For this purpose, temperature-dependent spectral reflectance of the samples was measured inside the visible spectral region (400–700 nm) by fiber-based USB 2000+ spectrometer (Ocean Optics, USA) using 30 mm wide integrating sphere (ISP-30-6-R) with (8°: di) measuring geometry and 6 mm sampling port diameter. OceanView 2.0.18. – EZ software by Ocean Optics was used to calculate the CIELAB L*, a*, b* values, taking into account the D50 illuminant and 2° standard observer. The samples were heated on the surface of a water block (EK Water Blocks; EKWB d.o.o., Slovenia). In this device the thermostatically controlled water circulates through very thin acrylic channels inside the base plate. The base plate is made of copper, coated with a nickel layer and highly polished. Due to very short distances between the water channels and the surface of the plate, the heat from the water is quickly transferred through the plate to the sample. Thus, the temperature of the sample is practically the same as the temperature of the circulating water and measurements can be done as soon as the temperature of the water in the system reaches the value specified by the thermostat. The applied thermostatic circulator allows a heating rate of about 3.7 °C min- 1, and the water temperature is accurate up to a tenth of a degree [9], [22].
3. Results
3.1. Surface Morphology
Surface morphology of all samples was determined using a digital microscope with options for 3D surface profiling, measurement, and high-magnification imaging. 3D imaging and measurement was used for determination of surface topography and roughness (Figure 3 and Figure 4, Table 2). The roughness values presented in the table were obtained from topographical surface images of all samples. The measurements were recorded to quantify the surface texture characteristics, including average height, peak height, valley depth, and overall height variation. The results provide insight into the effects of using different printing substrates and TLC inks on surface roughness and helps in understanding the topographical features of each sample.
The results show lowest roughness Sa (the average surface height) for UT (2 µm) and slight increase for TLC 25 + UT (3 µm) (Table 2). The TLC 14 + UT displays the smallest height difference Sz (31 µm), which in combination with higher average roughness indicates more uniform structure with no extreme peaks/valleys on the observed surface (Figure 4c). On the other hand, TLC 25 + UT has lower average surface roughness that TLC 14 + UT, most probably due to the smaller diameter of microcapsules (Figure 5). It could be noted that applying ink film on the UT will increase its surface roughness, due to the very smooth initial roughness, where microcapsules on the surface increase roughness. On the other side, BNC has higher initial surface roughness and the ink film will fill some valleys, decrease height of the peaks, i.e. decrease surface roughness. It can be also seen that on BNC sample with TLC 25 has lower surface roughness, probably consequence of the microcapsules’ size.
High-magnification images were also used to determine the pigment morphology and distribution in the printed layer, as well as average size of individual pigment particles (Figure 5).
The size of the observed microcapsules of TLC 14 ink (Figure 5a) ranges from 12.04 µm to 19.25 µm, with an average size of 14.41 µm (std. dev. 4.33). The capsules are evenly distributed on the printing samples’ surface and exhibit a relatively spherical morphology with no significant agglomeration. The high degree of uniformity in size and shape indicates stable microencapsulation, which is crucial for maintaining the thermochromic performance of the pigment. TLC 25 (Figure 5b) resulted in measured microcapsule sizes from 5.63 µm to 19.07 µm (average of 10.5 µm, std. dev. 4.08), with a broader size distribution compared to TLC 14. This variation could be attributed to differences in the microencapsulation process. Although some smaller particles are visible, the majority maintain a spherical structure. The capsule sizes are within the optimal range for thermochromic applications, ensuring good dispersion in the final product and responsive colour transitions.
3.2. Determination of Fillers Content in UT and BNC Substrates
To determine the ash content, i.e., the amount of fillers in the printing substrates, the absolute moisture content of UT and BNC was measured, and the results are presented in Table 3. The absolute moisture content was later used to calculate the ash content at 525 and 900°C after the conducted tests. The values of absolute moisture of UT and BNC are nearly identical, indicating that both materials retain a similar amount of moisture before thermal treatment. The ash residue at 525°C represents the amount of inorganic components, such as fillers and mineral additives. At 525°C combustion, BNC shows a higher ash content than UT, indicating a higher percentage of inorganic substances, possibly as a residue from the synthesis process of bacterial nanocellulose (e.g., mineral remnants from the nutrient medium).
Further combustion at higher temperatures (900 °C) causes degradation of organic substances and potential decomposition of carbonate compounds. The decrease in ash content for BNC from 6.22% to 3.74% suggests the loss of carbonate or other thermally degradable mineral substances. UT also shows a reduction in ash content (from 5% to 4.57%), but to a much lesser extent, which may indicate that paper contains more thermally stable inorganic fillers, such as kaolin or titanium dioxide.
BNC exhibits a greater reduction in ash content from 525°C to 900°C, suggesting that its inorganic fraction contains more thermally decomposable or volatile components, likely originating from the bacterial synthesis process (Figure 6a,b). BNC samples after combustion at 525 °C results in solid black residue, which almost completely disappears at 900 °C, leaving only a few small greenish crystals. The reason for this result could be the addition of an emulsifier to the BNC during sample preparation. In this way, the surface energy of the BNC is changed, which allows greater miscibility with water. UT substrate retains more stable inorganic content at both temperatures, aligning with its composition of mineral fillers that persist after cellulose combustion (Figure 7a,b).
3.3. Temperature Dependent Colorimetric Properties of Printed TLC Inks
The results presented in Figure 8, Figure 9, Figure 10 and Figure 11 show the temperature – dependent colorimetric response of printed TLC inks. As mentioned above, with the increase in temperature, the helical pitch of thermochromic liquid crystals (TLCs) shrinks and results in the reflection of light with progressively shorter wavelengths. This structural transformation shows as a spectral colour change from red (longer wavelengths) to blue (shorter wavelengths). The thermochromic effect is directly linked to the ratio between the helical spiral length and pitch, with each temperature corresponding to a specific reflected wavelength and, consequently, a distinct observed colour. The spectral characteristic of the colour play effect is a relatively narrow single reflection peak that occurs when the functional material inside the pigments is in the chiral nematic/cholesteric phase. This peak moves across the visible range as a function of the temperature and is confirmed for both TLC inks and substates in this research (Figure 8, Figure 9, Figure 10 and Figure 11).
For TLC 14 ink printed on UT substrate, the chiral nematic phase of the liquid crystalline material is formed at 14°C, where a low and broad reflectance peak appears at the long wavelength limit of the visible (700 nm) (Figure 8). At 15°C, this peak shifts to 646 nm and the sample appears orange/red. A further increase in temperature shifts the peak throughout the visible spectrum to shorter wavelengths, making it slightly narrower and a bit more intense. These changes are not linearly dependent on the temperature, so that the blue part of the spectrum remains visible most of the time. This corresponds to the visual perception of the sample—its appearance is very distinctly blue and remains as such over the widest temperature range. As the temperature rises above 22°C, the peak becomes hardly visible. Further increase in temperature shifts the peaks outside of the visible region and disappears completely above the clearing point of 50°C, because the TLC turns into isotropic liquid. Similar results are noticed for TLC 14 printed on BNC, apart from the formation of chiral nematic phase, occurring at 13°C and 692 nm (Figure 9). This shift is most likely caused by the selection of printing substrate.
For TLC 25 ink printed on UT substrate, the chiral nematic phase of the liquid crystalline material is formed at 26°C and 665 nm (Figure 10). A further increase in temperature shifts the peak throughout the visible spectrum to shorter wavelengths, showing the full colour play effect. Similar as for TLC 14, the peak becomes hardly visible at higher temperatures, in this case above 32°C. Further increase in temperature gradually leads to turning TLC turns into isotropic liquid and the loss of colour play effect. The reflection maximum is similar for TLC 14 on UT and BNC substrates, while for TLC 25, they differ and have higher values for the prints on BNC, where the baseline is higher and more stable compared to TLC 25 on UT substrate (Figure 11). Additionally, the maximum of reflection spectra can be observed up to 35°C for TLC 25 on BNC, whereas on UT, only until 32°C. Both TLC 14 and TLC 25 exhibited a broader activation range than defined by the specifications (Table 1).
The chromaticity of the colour play effect is described using the a* (green-red) and b* (blue-yellow) CIELAB coordinates, derived from the corresponding reflectance spectra measured on the same samples (Figure 8, Figure 9, Figure 10 and Figure 11). Each point on the curve represents the chromaticity of the sample at a specific temperature (Figure 12). As the temperature increases (in the steps of 1 oC), the points move anticlockwise across the four quadrants of the (a*, b*) plane. This movement forms a closed loop, characteristic of the colour play effect observed in activation region of the TLCs. The red-green (a*) and yellow-blue (b*) values begin and end at nearly identical positions on the (a*, b*) graph for all samples, representing the isotropic phase of the TLC, where no colour is developed, i.e. at the point of printing substrate colour. At intermediate temperatures, where the chiral-nematic (cholesteric) phase generates a single reflection peak (Figure 8, Figure 9, Figure 10 and Figure 11), the complete loop is formed, illustrating the thermochromic effect. A similar curve shape across all samples demonstrates that each printed sample undergoes a colour change across the entire visible spectrum. Moreover, the results confirm that incorporating BNC does not diminish the optical properties of the TLC and enables the dynamic colour change caused by chiral-nematic (cholesteric) phase. Among the tested samples, however, TLC 14 + UT stands out by exhibiting the narrowest curve, particularly in the yellow – green region of the diagram, while the remaining samples show only minor differences from one another. The differences in the presented results are very small, confirming the visual appearance of the prints within the activation region of the inks (Figure 12).
In addition to the CIELAB chromatic values a* and b*, the colour values also include L* (lightness), as shown in Figure 13. Both TLC 14 + UT and TLC 14 + BNC spans a temperature range from 9 to 31 °C, while for TLC 25 + UT and TLC 25 + BNC range extends from 20 to 38 °C. The activation region of both inks occurs inside this ranges and corresponds with the reflection peaks in the visible spectrum (Figure 8, Figure 9, Figure 10 and Figure 11). Each L*(T) curve exhibits a single maximum in the green region, where the colour reaches its highest lightness (L*max) value (Table 4). The results indicate an increase in L* values within the activation range of the TLC ink, which, according to the manufacturer's specifications (Table 1), is between 14 and 19 °C for TLC 14 and between 15 and 30 °C for TLC 25. However, the results in Figure 13 reveal a shift in the activation range for the printed TLC inks to approximately 9–23 °C for TLC 14 and 21–35 °C for TLC 25. For the samples printed on BNC, L* has higher values compared to the samples printed on UT substrates. However, these differences are not significant, as the L* values for TLC 14 is 1.28, and for TLC 25 0.65 in favour of BNC. This result is most likely influenced by the colorimetric properties of the substrates themselves.
It is important to emphasize all selected combinations of TLC inks and substrates enable a full thermochromic effect, which is manifested through the colour play effect, characteristic reflectance spectra and CIELAB L*a*b* chromatic values (Figure 8, Figure 9, Figure 10, Figure 11 and Figure 12). These results describe the influence of the chiral nematic (cholesteric) structure of liquid crystal pigments on the dynamic colour change.
The so-called communication mechanism, the method used for describing temperature-dependent colour play effect of the TLCs is introduced in one of our previous research and applied here to verify structurally induced behaviour of TLC pigments [11]. The temperature-sensitive peak in the reflectance spectra can serve as a reliable indicator of TLC functionality and compatibility with selected substrates. The communication mechanism of all samples shown in Figure 14 demonstrates the temperature dependence of the peak in the reflectance spectra. As the temperature increases, these peaks shift to shorter wavelengths, which is the effect characteristic for TLC inks (commonly called colour play effect). To the best of our knowledge, TLC inks are the only type of printing inks that can be described using the proposed communication mechanism. The results in Figure 14 are presented in two diagrams due to different temperature ranges of TLC 14 and TLC 25, corresponding to the activation regions of the ink. These results are based on the extracted wavelengths at which the reflectance peaks appear - λmax and presented as variables of the temperature. The results show curves with similar trends, deviating for each TLC colour due to differences in the reflection spectra measured on UT and BNC substrates. It can be seen that the communication mechanism is almost the same for TLC25 ink on both substrates, but for TLC14, some differences appear at low temperatures. Despite these minor differences, the communication mechanism confirms the functionality of TLC inks through authentic characterization within the activation range. These results confirm the compatibility of TLC inks with the BNC substrate, which could contribute to the development of new intelligent and sustainable solutions in the future.
4. Conclusions
In this study, BNC based, thin films were prepared, with carbon black added to create a suitable printing substrate for TLC inks. The TLC inks were screen-printed onto BNC as well as black uncoated paper (UT), which was used as a reference. Microscopic images were taken and analysed to enable determination of the printed surface and microcapsules spread. Spectrometric measurements of the printed TLC 14 and TLC 25 inks were conducted to investigate the impact of the chiral nematic (cholesteric) structure of liquid crystal pigments on dynamic colour change.
The results of the measured roughness parameters showed significant difference between two substrates with BNC having higher roughness. These are transferred to the roughness of the printed samples, i.e. prints on the BNC show higher roughness than the ones on UT. Furthermore, prints made by applying TLC 14 have higher average roughness than the applied TLC 25.
Spectrometric measurements showed the observed colour transitions which confirm the structural behaviour of TLCs and demonstrate their precise and repeatable colour changes across a defined temperature range. This effect occurs for both TLC 14 and TLC 25 printed either on UT or on BNC. The results of the temperature dependent colour play effect are validated using the communication mechanism developed in our previous research. This distinctive feature of TLC inks is defined by their temperature-dependent peak in the reflectance spectrum, which serves as a reliable indicator of their structure-induced behaviour. The results validate the functionality and compatibility of TLC inks and BNC. It is essential to highlight that all selected combinations of TLC inks and substrates achieve a complete thermochromic effect, characterized by the colour play effect, shown in the results of reflectance spectra, and CIELAB L*a*b* chromatic values. These results describe the impact of the chiral nematic (cholesteric) structure of liquid crystal pigments on dynamic colour change. The results of CIELAB a*b* chromatic values describing colour play effect show the differences between all samples, but are not significant, while the results of CIELAB lightness values L* show the BNC exhibits slightly higher values compared to UT. These results are most likely influenced by the properties of the selected substrates.
Although the communication mechanism confirms the functionality and compatibility of the selected TLC inks and BNC, certain deviations occur when compared to the results measured on the UT. These differences are more pronounced in TLC 14 than in TLC 25, particularly at lower temperatures. Further research is needed to determine the factors influencing these minor discrepancies. Possible reasons for these variations may be related to specific characteristics of the printing substrates, such as surface roughness, as well as the distribution and size of the microcapsules on the dried TLC layer.
To conclude, bacterial nanocellulose was proven to be functional and compatible material for TLC inks and could present a promising solution for sustainable and dynamic packaging/indicator applications in the future. The advantages of the BNC material properties as a printing substrate, such as flexibility, UV protection, printability and biodegradability could offer added value to the packaging solutions and their interaction with TLCs should be studied in detail in the future.
Author Contributions
Conceptualization, M.S.J. and M.K.G.; methodology, M.S.J., M.K.G., G.L. and T.C.; validation, M.S.J., G.L. and T.C.; formal analysis, M.S.J., G.L. and T.C.; investigation, M.S.J., M.K.G., G.L. and T.C.; data curation, M.S.J., G.L. and T.C.; writing—original draft preparation, M.S.J. and M.K.G.; writing—review and editing, M.S.J., M.K.G., G.L. and T.C.; visualization, M.S.J., G.L. and T.C. All authors have read and agreed to the published version of the manuscript.
Conflicts of Interest
The authors declare no conflicts of interest.
References
- A. Taugerbeck and C. J. Booth, ‘Design and Synthesis of Chiral Nematic Liquid Crystals’, in Handbook of Liquid Crystals, Wiley, 2014, pp. 1–63. [CrossRef]
- LCR Hallcrest, ‘Hallcrest Handbook of Thermochromic Liquid Crystal Technology.pdf’. Accessed: Oct. 01, 2025. [Online]. Available: Chrome-extension://efaidnbmnnnibpcajpcglclefindmkaj/https://spotsee.io/wp-content/uploads/2021/05/RT006-Rev01-USA-Thermochromic-Handbook.pdf?srsltid=AfmBOoqBS9yrfgobRIj48S7Q0KwbZ3_zI2FCF3ukTqJNEUCaJuqjSR95.
- M. Strižić Jakovljević, B. Lozo, and M. Klanjšek Gunde, ‘The properties of printing substrates required for thermochromic liquid-crystal printing inks’, JPMTR, vol. 7, pp. 165–170, 2018. [CrossRef]
- A. Seeboth, D. Lötzsch, R. Ruhmann, and O. Muehling, ‘Thermochromic polymers - Function by design’, Mar. 12, 2014, American Chemical Society. [CrossRef]
- R. M. Christie, S. Robertson, and S. Taylor, ‘Design Concepts for a Temperature-sensitive Environment Using Thermochromic Colour Change’, Colour: Design & Creativity, vol. 1, pp. 1–11, 2007, Accessed: Mar. 06, 2013. [Online]. Available: http://jaic.jsitservices.co.uk/index.php/JAIC/article/view/80.
- M. A. White and M. LeBlanc, ‘Thermochromism in Commercial Products’, J Chem Educ, vol. 76, pp. 1201–1205, 1999.
- Smart Packaging Technologies for Fast Moving Consumer Goods. Wiley, 2008. [CrossRef]
- Sage, ‘Thermochromic liquid crystals’, Liq Cryst, vol. 38, no. 11–12, pp. 1551–1561, 2011. [CrossRef]
- M. Jakovljević, B. Lozo, and M. Klanjšek Gunde, ‘Spectroscopic evaluation of the colour play effect of thermochromic liquid crystal printing inks’, Coloration Technology, vol. 133, no. 1, pp. 81–87, Jan. 2017. [CrossRef]
- Š. Dermol, B. Borin, D. Gregor-Svetec, L. Slemenik Perše, and G. Lavrič, ‘The Development of a Bacterial Nanocellulose/Cationic Starch Hydrogel for the Production of Sustainable 3D-Printed Packaging Foils’, Polymers (Basel), vol. 16, no. 11, Jun. 2024. [CrossRef]
- M. S. Jakovljević, B. Lozo, and M. K. Gunde, ‘Identifying a unique communication mechanism of thermochromic liquid crystal printing ink’, Crystals (Basel), vol. 11, no. 8, Aug. 2021. [CrossRef]
- G. Lavrič, D. Medvešček, and M. Skočaj, ‘Papermaking properties of bacterial nanocellulose produced from mother of vinegar, a waste product after classical vinegar production’, Tappi J, vol. 19, pp. 197–203, 2020.
- G. Lavrič, A. Oberlintner, I. Filipova, U. Novak, B. Likozar, and U. Vrabič-Brodnjak, ‘Functional Nanocellulose, Alginate and Chitosan Nanocomposites Designed as Active Film Packaging Materials’, Polymers (Basel), vol. 13, no. 15, p. 2523, Jul. 2021. [CrossRef]
- S. Mahović Poljaček et al., ‘Starch-Based Functional Films Enhanced with Bacterial Nanocellulose for Smart Packaging: Physicochemical Properties, pH Sensitivity and Colorimetric Response’, Polymers (Basel), vol. 16, no. 16, p. 2259, Aug. 2024. [CrossRef]
- M. Pantić, M. Nowak, G. Lavrič, Ž. Knez, Z. Novak, and I. Zizovic, ‘Enhancing the properties and morphology of starch aerogels with nanocellulose’, Food Hydrocoll, vol. 156, p. 110345, Nov. 2024. [CrossRef]
- ‘OROTANTM 165 Pigment Dispersant Technical Data Sheet’. https://www.dow.com/en-us/document-viewer.html?randomVar=9061934643324210055&docPath=/content/dam/dcc/documents/843/843-02072-01-orotan-165-pigment-dispersant-tds.pdf.
- Sefar AG, ‘SEFAR® PET 1500’, chrome-extension://efaidnbmnnnibpcajpcglclefindmkaj/https://www.sefar.com/data/docs/zh/10855/PS-PDF-SEFAR-PET1500-AL-EN.pdf?v=1.8.
- ISO 534:2011 Paper and board — Determination of thickness, density and specific volume’.
- TAPPI – T412 om-94 Moisture in pulp, paper and paperboard’.
- [TAPPI T 211 om - 02 Ash in Wood, Pulp, Paper, and Paperboard: Combustion at 525°C’.
- TAPPI T 413 - 93 Ash in wood, pulp, paper and paperboard: Combustion at 900 °C’.
- R. Kulčar, M. Friškovec, N. Hauptman, A. Vesel, and M. K. Gunde, ‘Colorimetric properties of reversible thermochromic printing inks’, Dyes and Pigments, vol. 86, no. 3, pp. 271–277, Aug. 2010. [CrossRef]
Figure 3.
Microscopic 3D images of BNC printing substrates: unprinted (a, b); printed with TLC 14 (c); printed with TLC 25 (d).
Figure 3.
Microscopic 3D images of BNC printing substrates: unprinted (a, b); printed with TLC 14 (c); printed with TLC 25 (d).
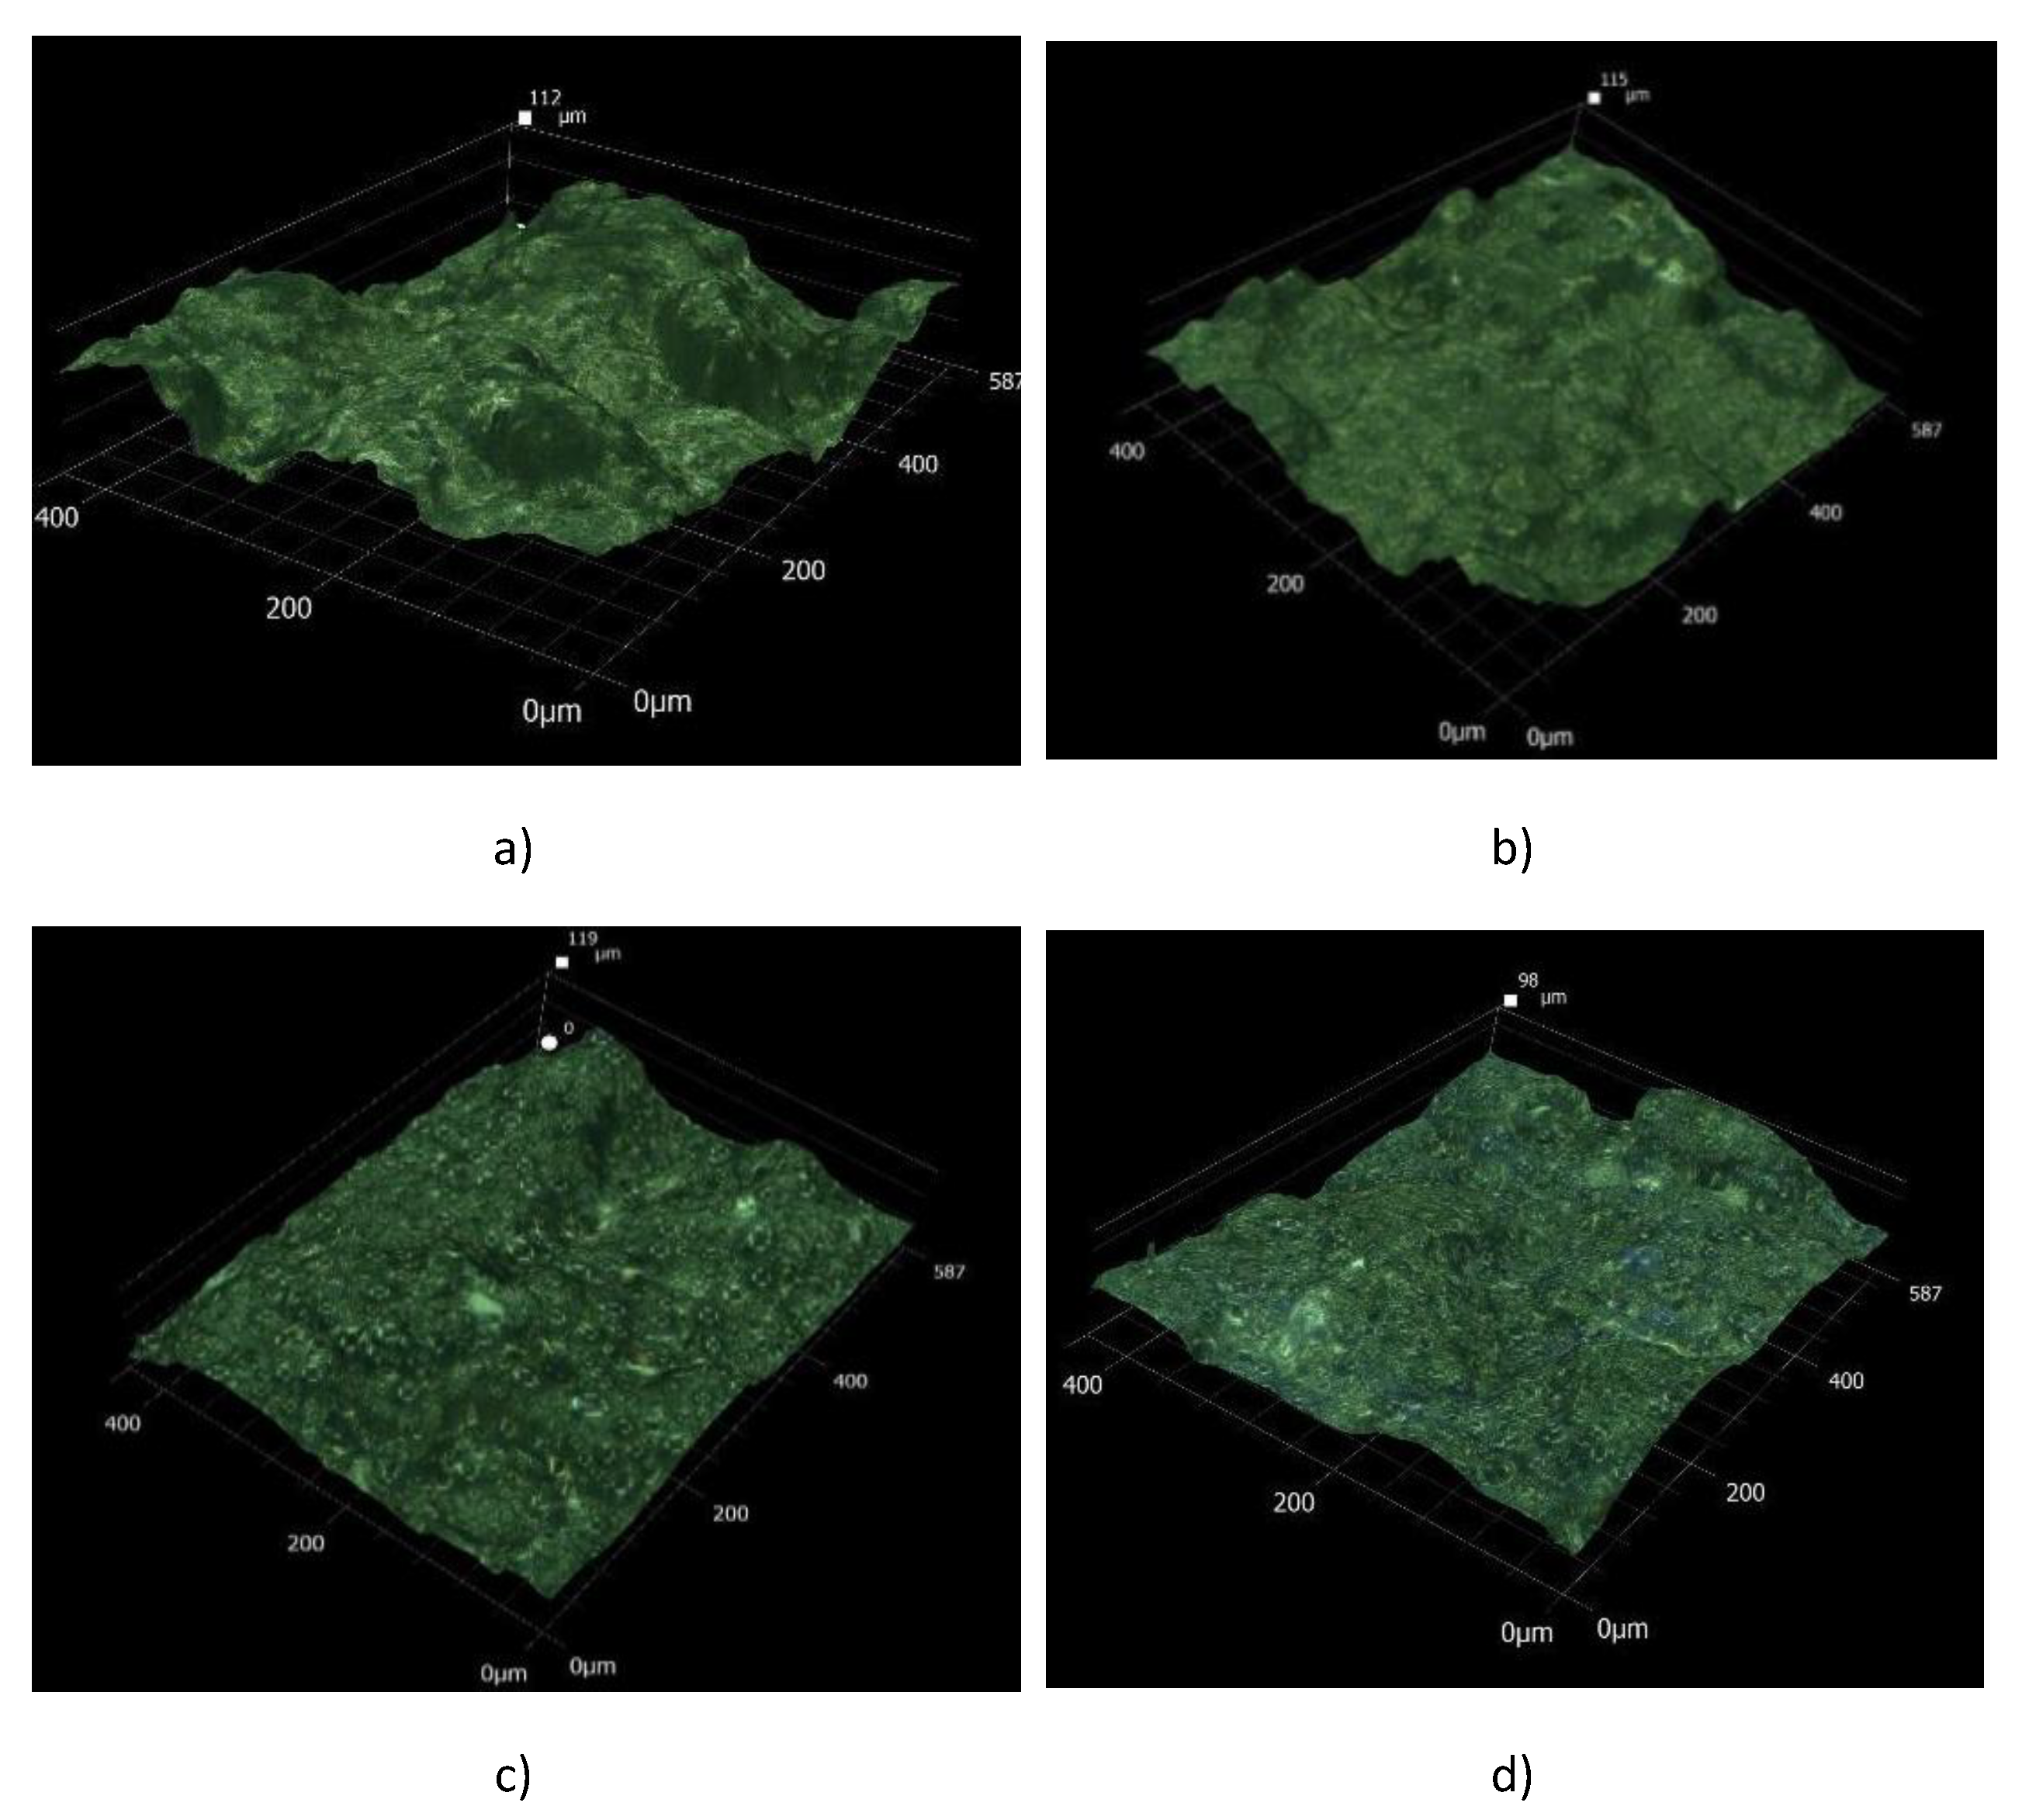
Figure 4.
Microscopic 3D images of UT printing substrates: unprinted (a); printed with TLC 14 (b); printed with TLC 25 (c).
Figure 4.
Microscopic 3D images of UT printing substrates: unprinted (a); printed with TLC 14 (b); printed with TLC 25 (c).
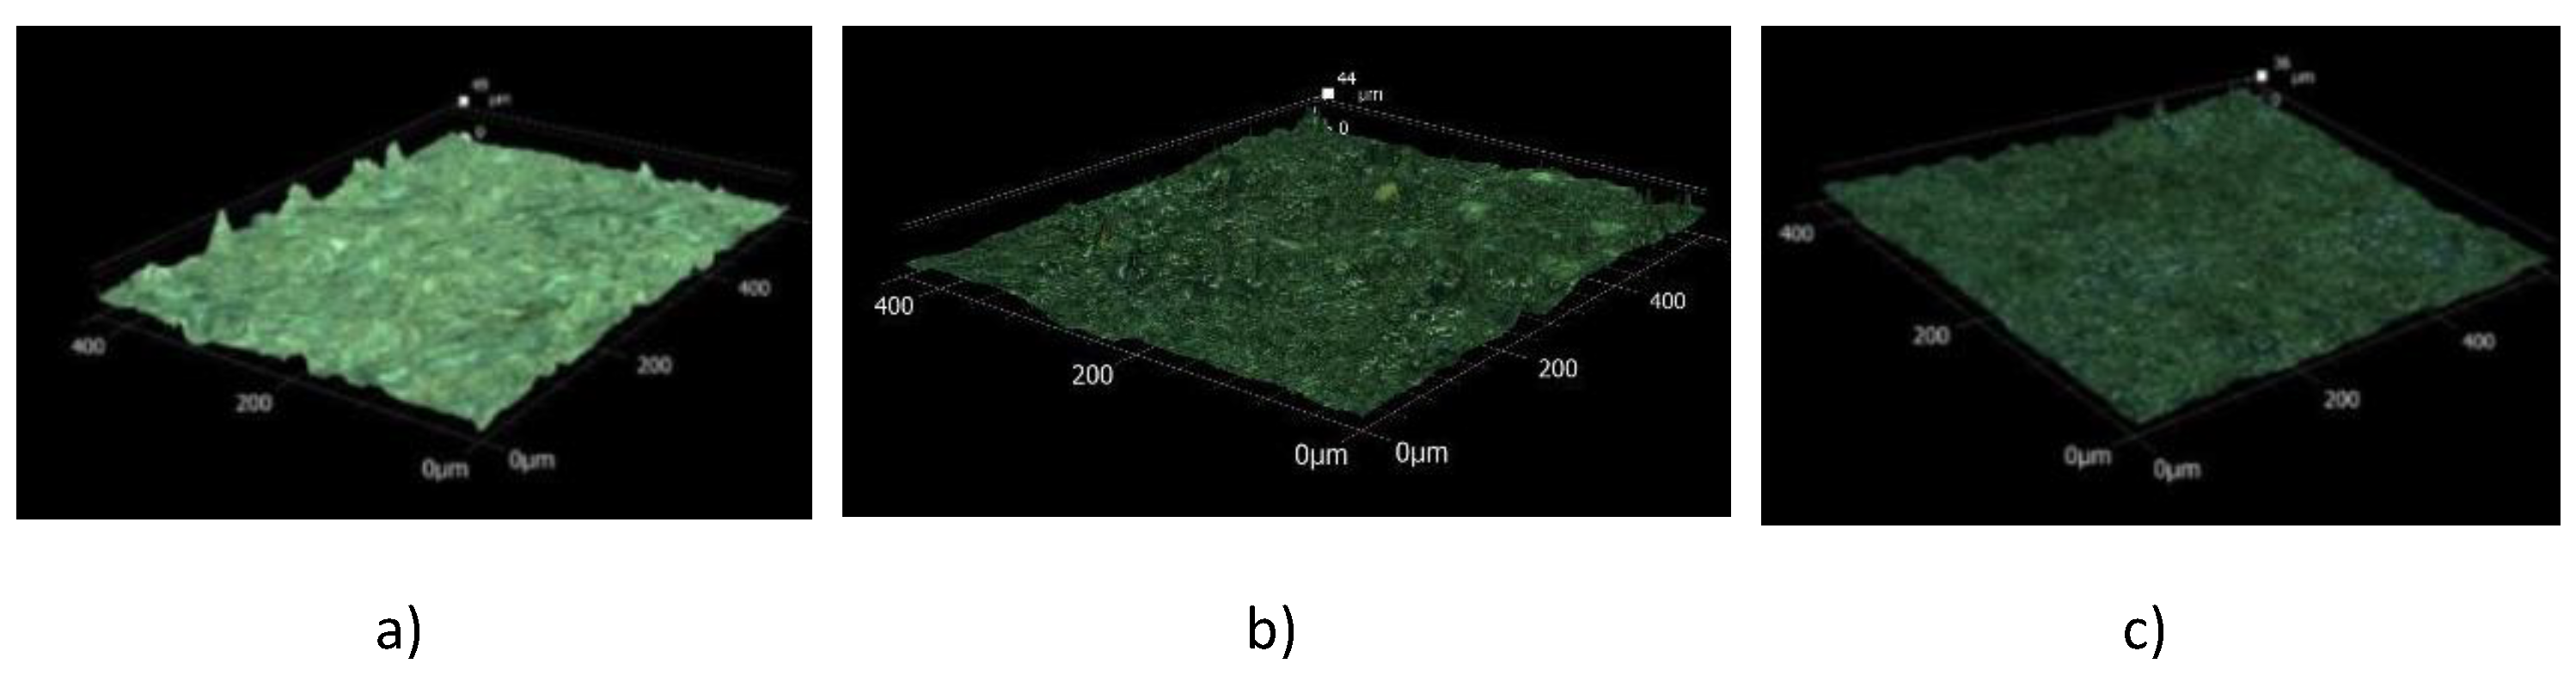
Figure 5.
Microscopic 3D images with marked pigment size of printed TLC 14 (a); and TLC 25 ink (b).
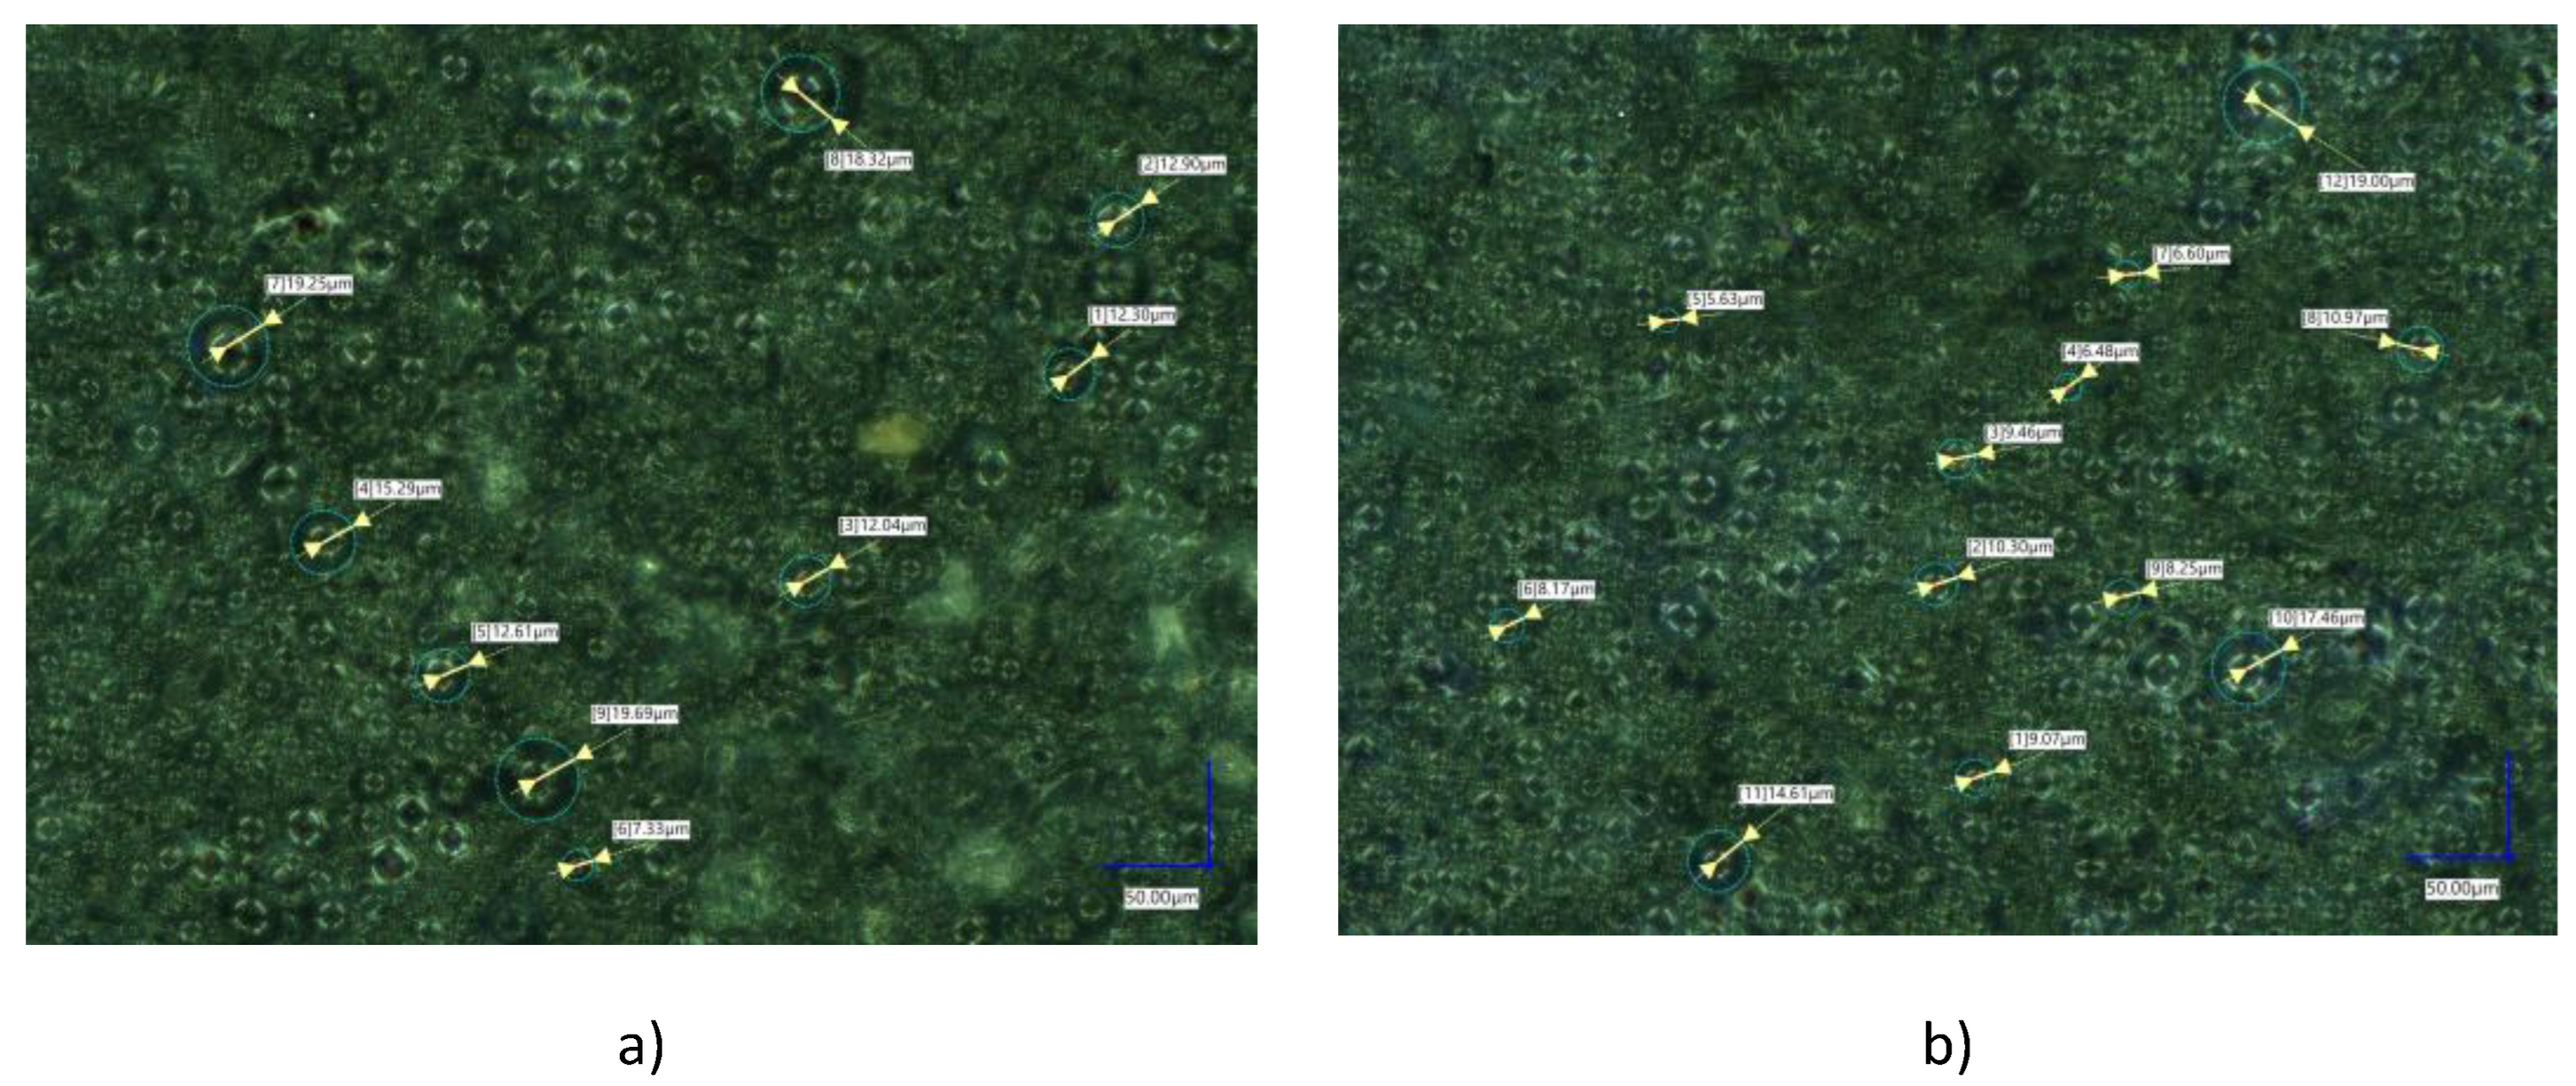
Figure 6.
Samples of BNC substrate after the combustion at 525 °C (a), and 900 °C (b).
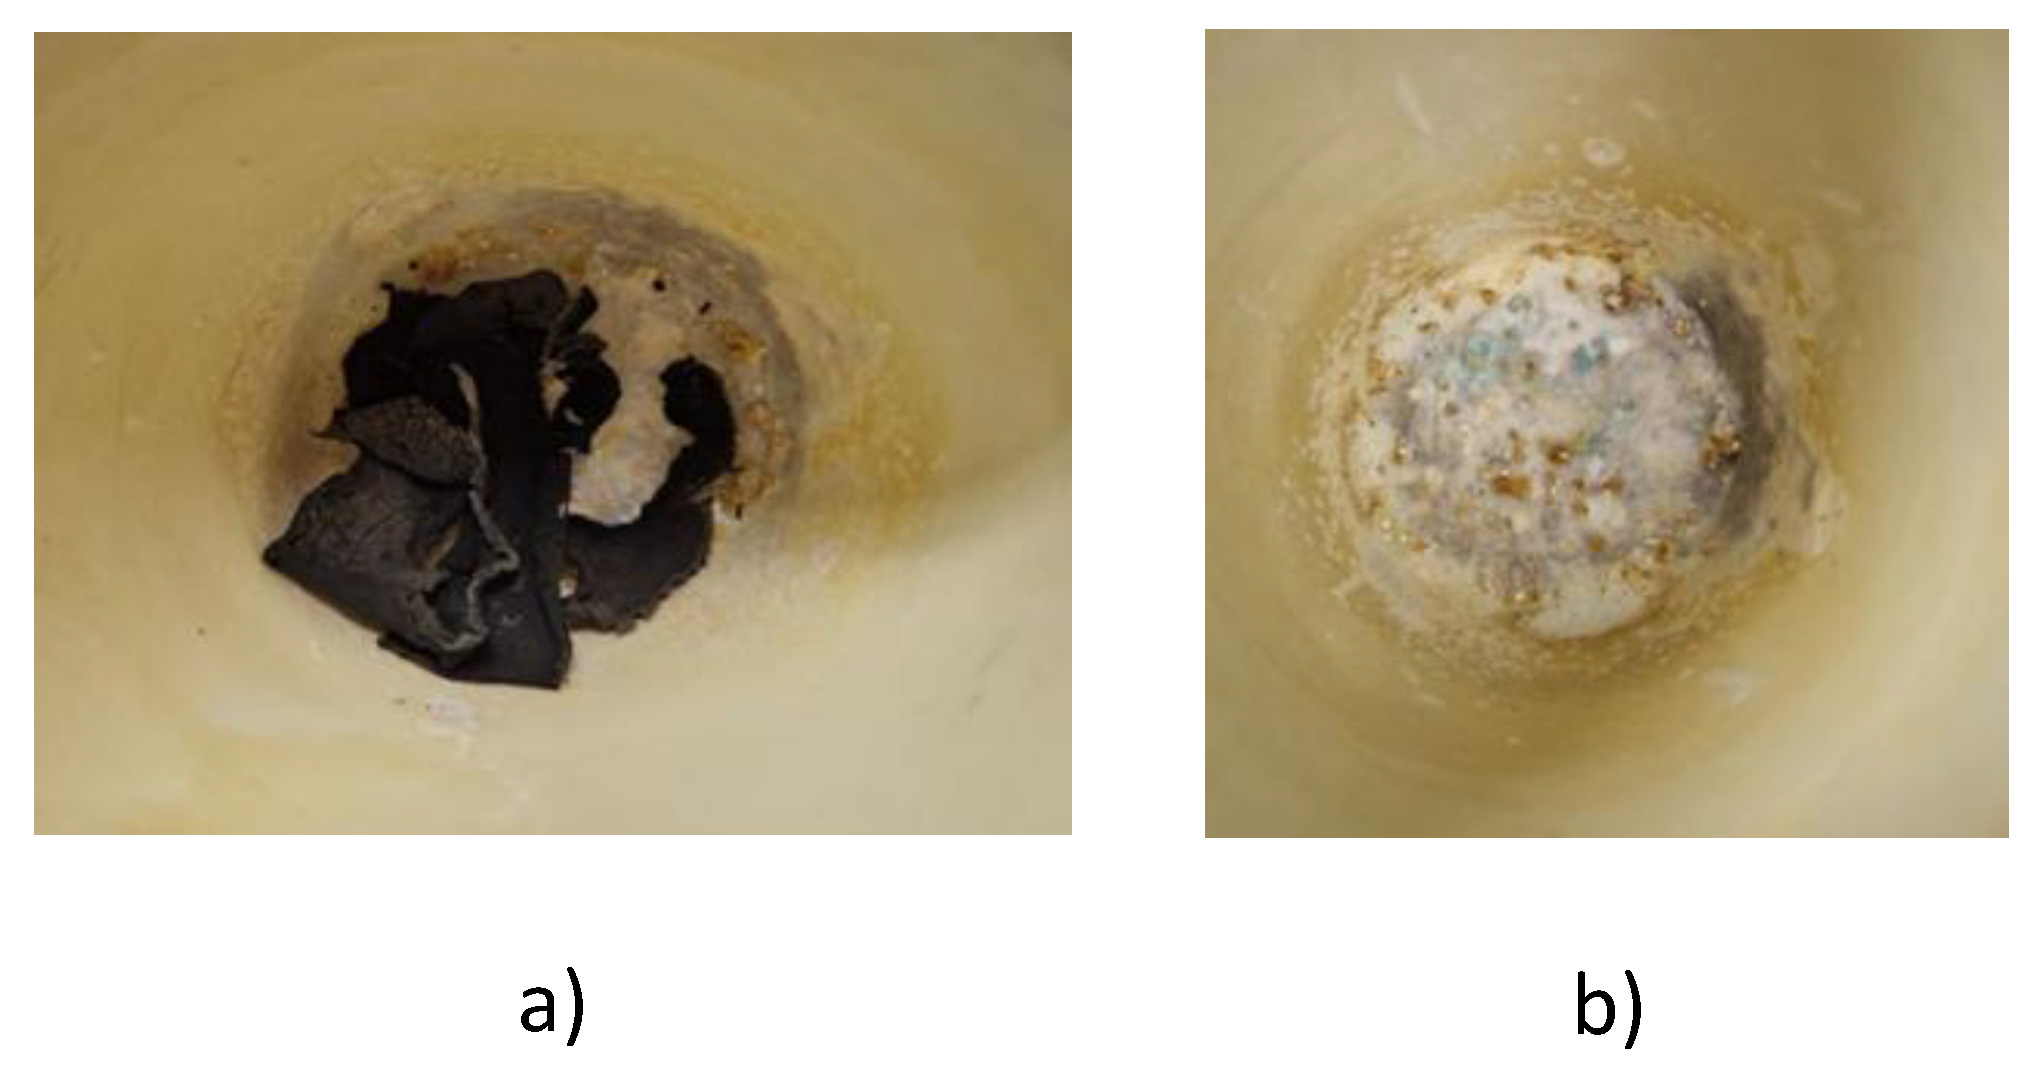
Figure 7.
Samples of UT substrate after the combustion at 525 °C (a), and 900 °C (b).
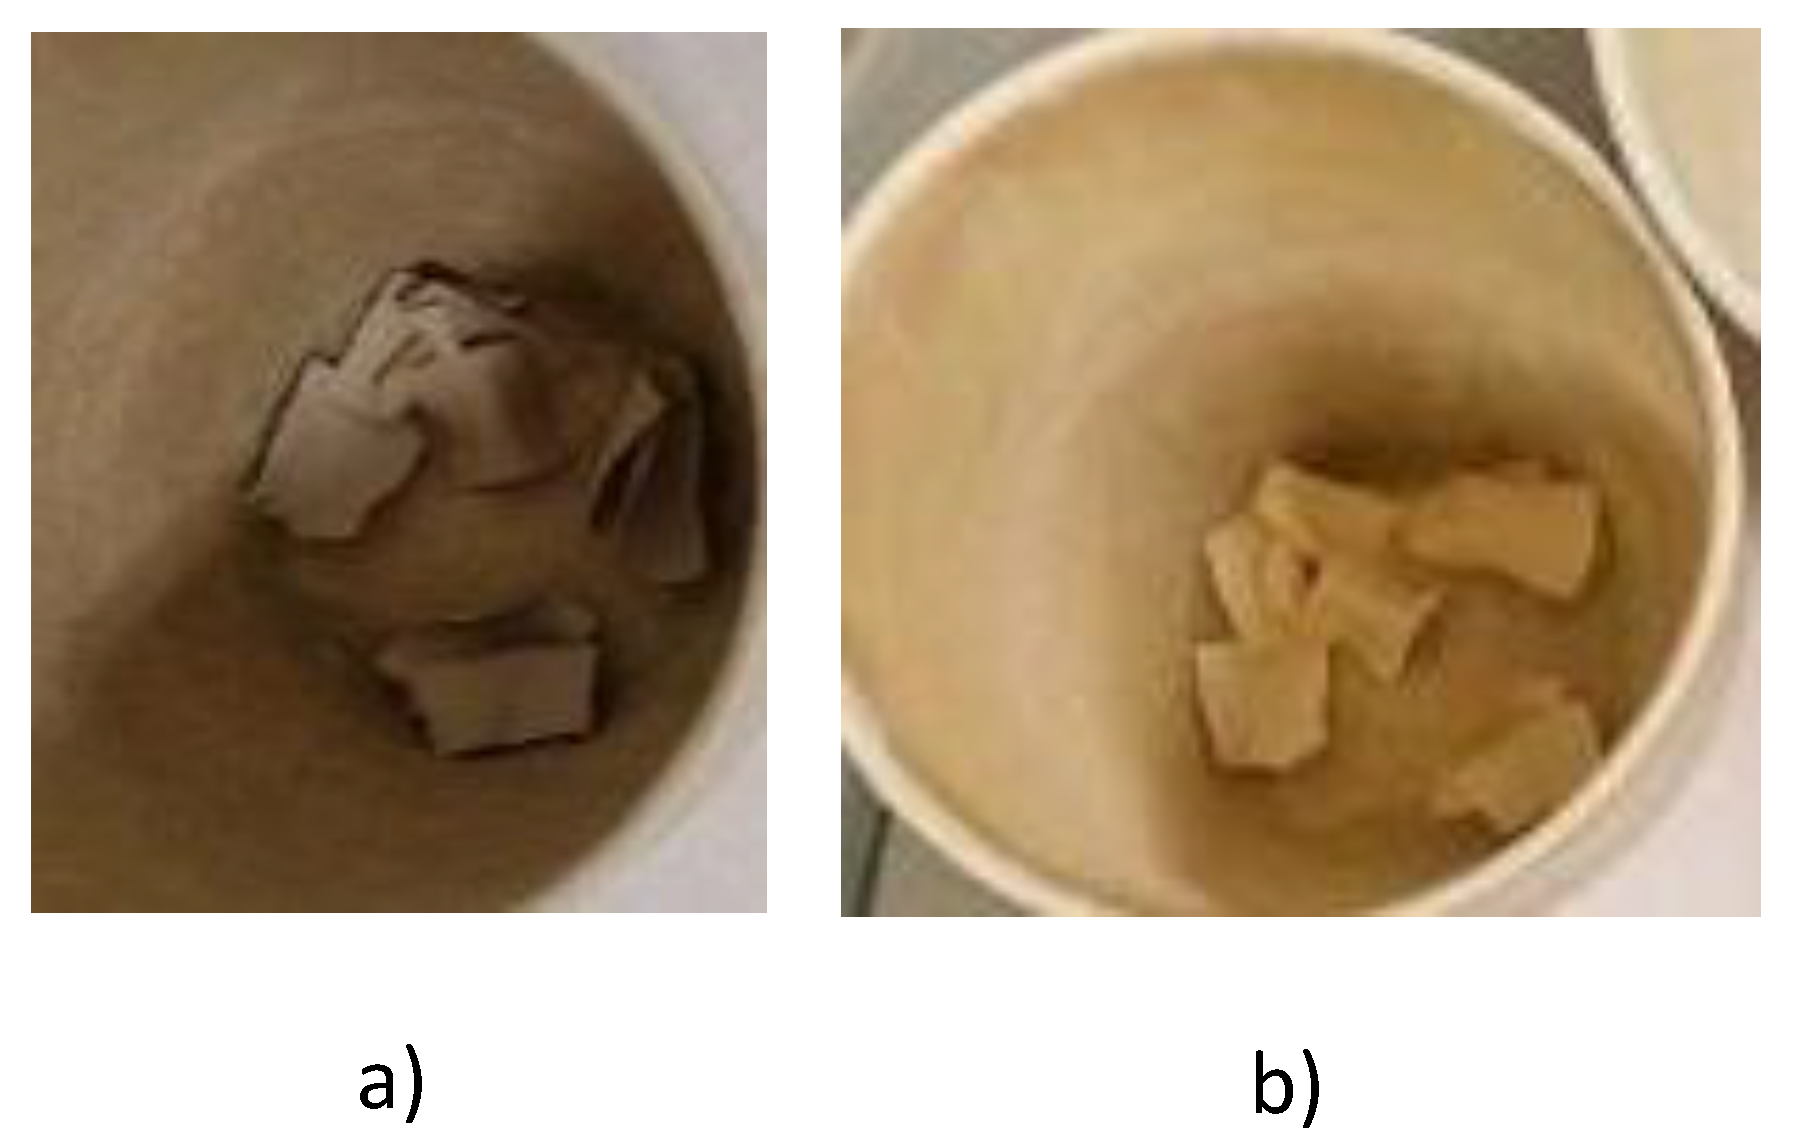
Figure 8.
Reflectance spectra of TLC 14 ink printed on UT substrate.
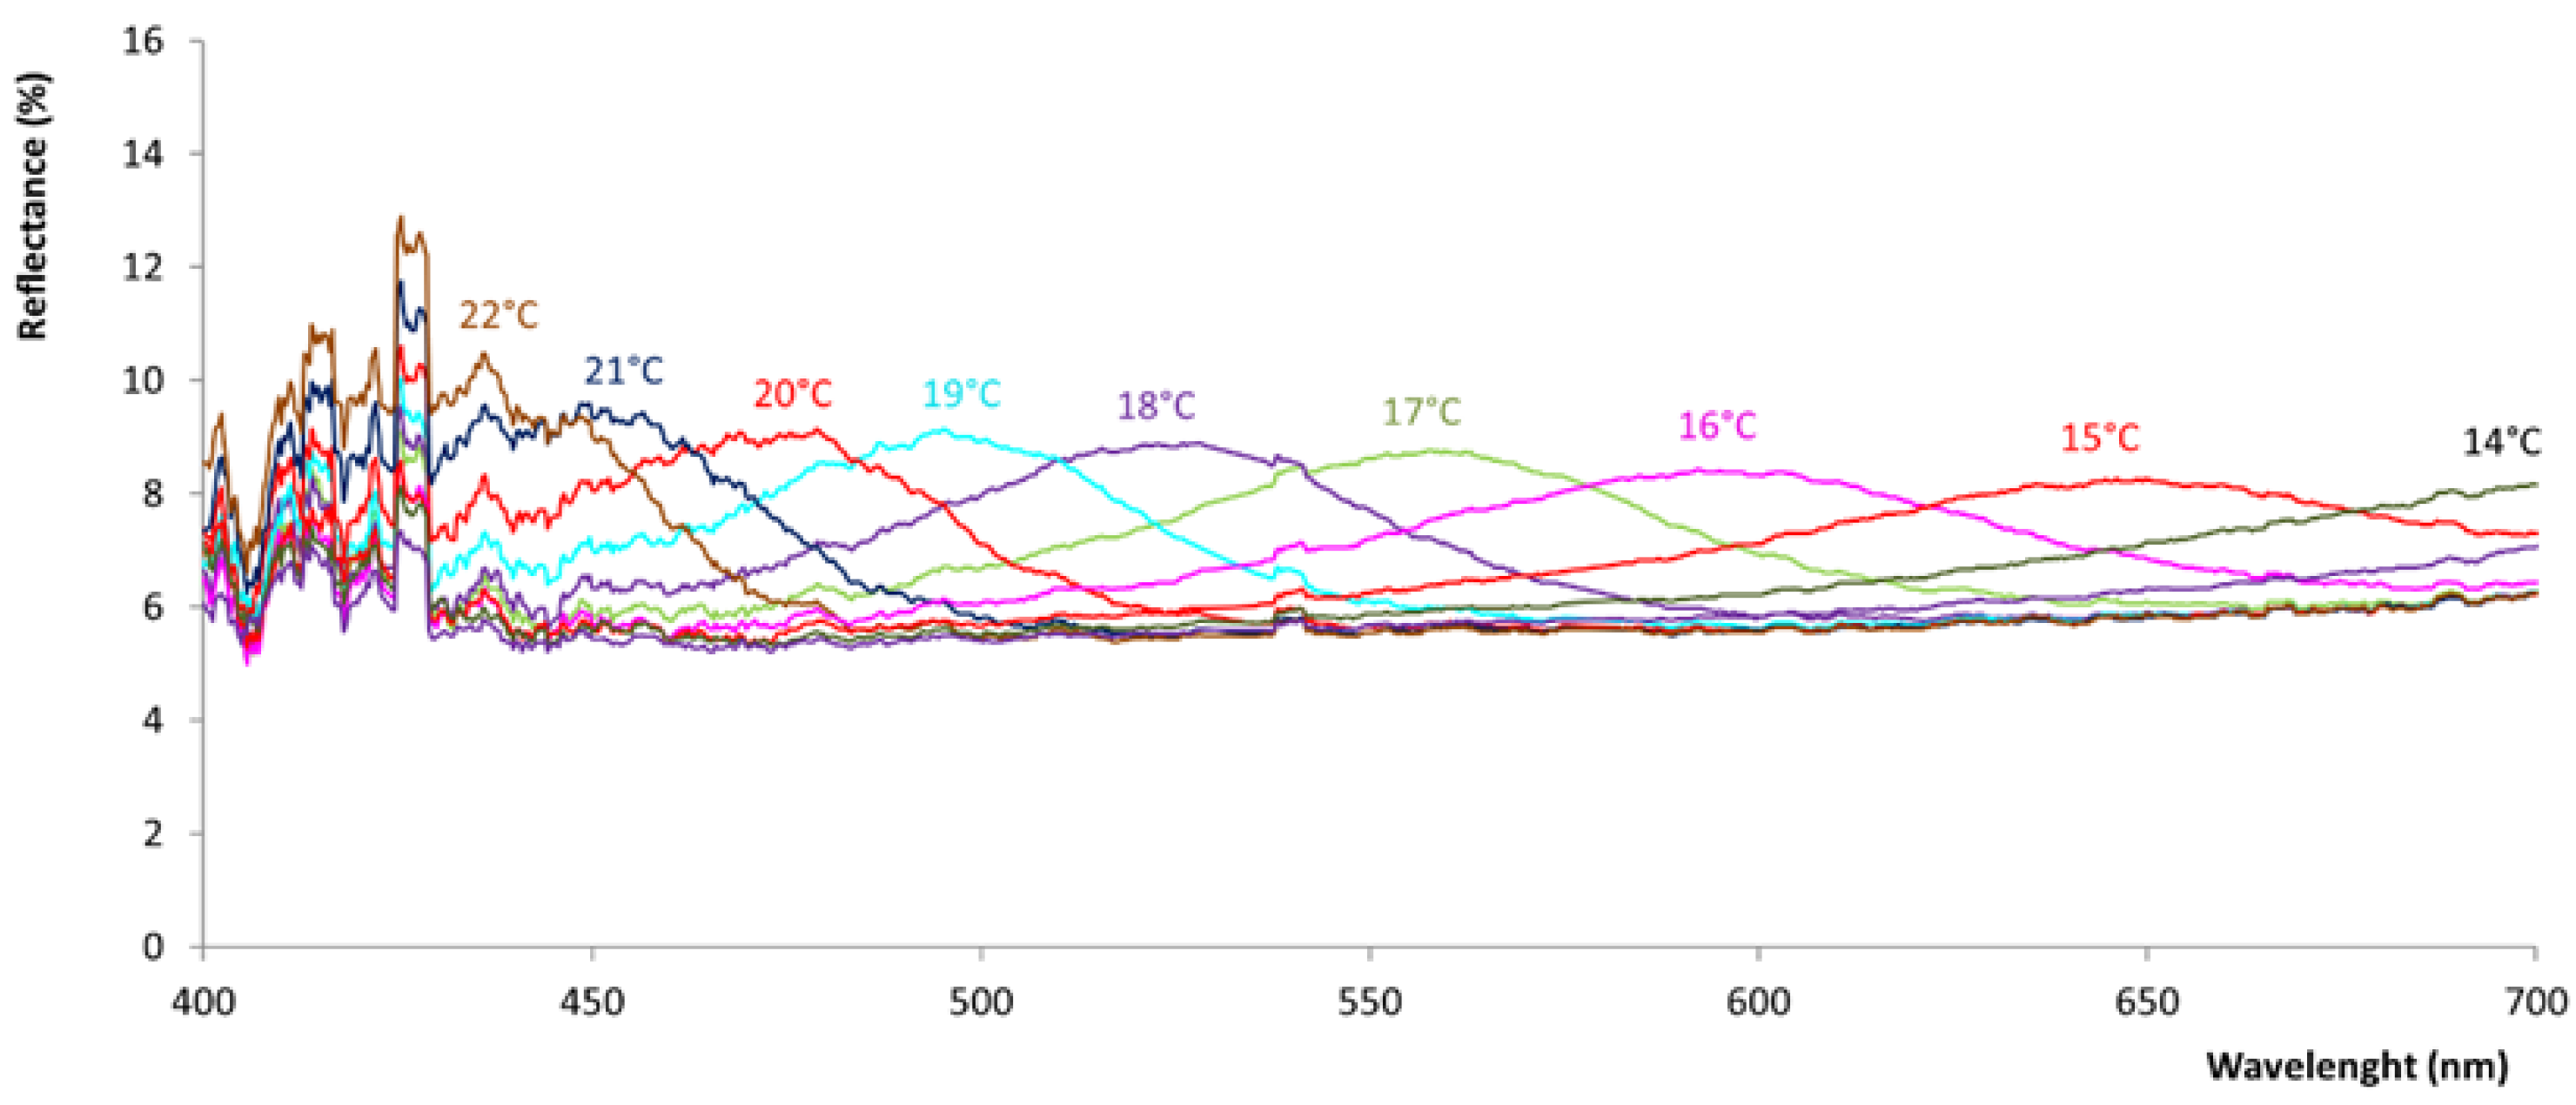
Figure 9.
Reflectance spectra of TLC 14 ink printed on BNC substrate.
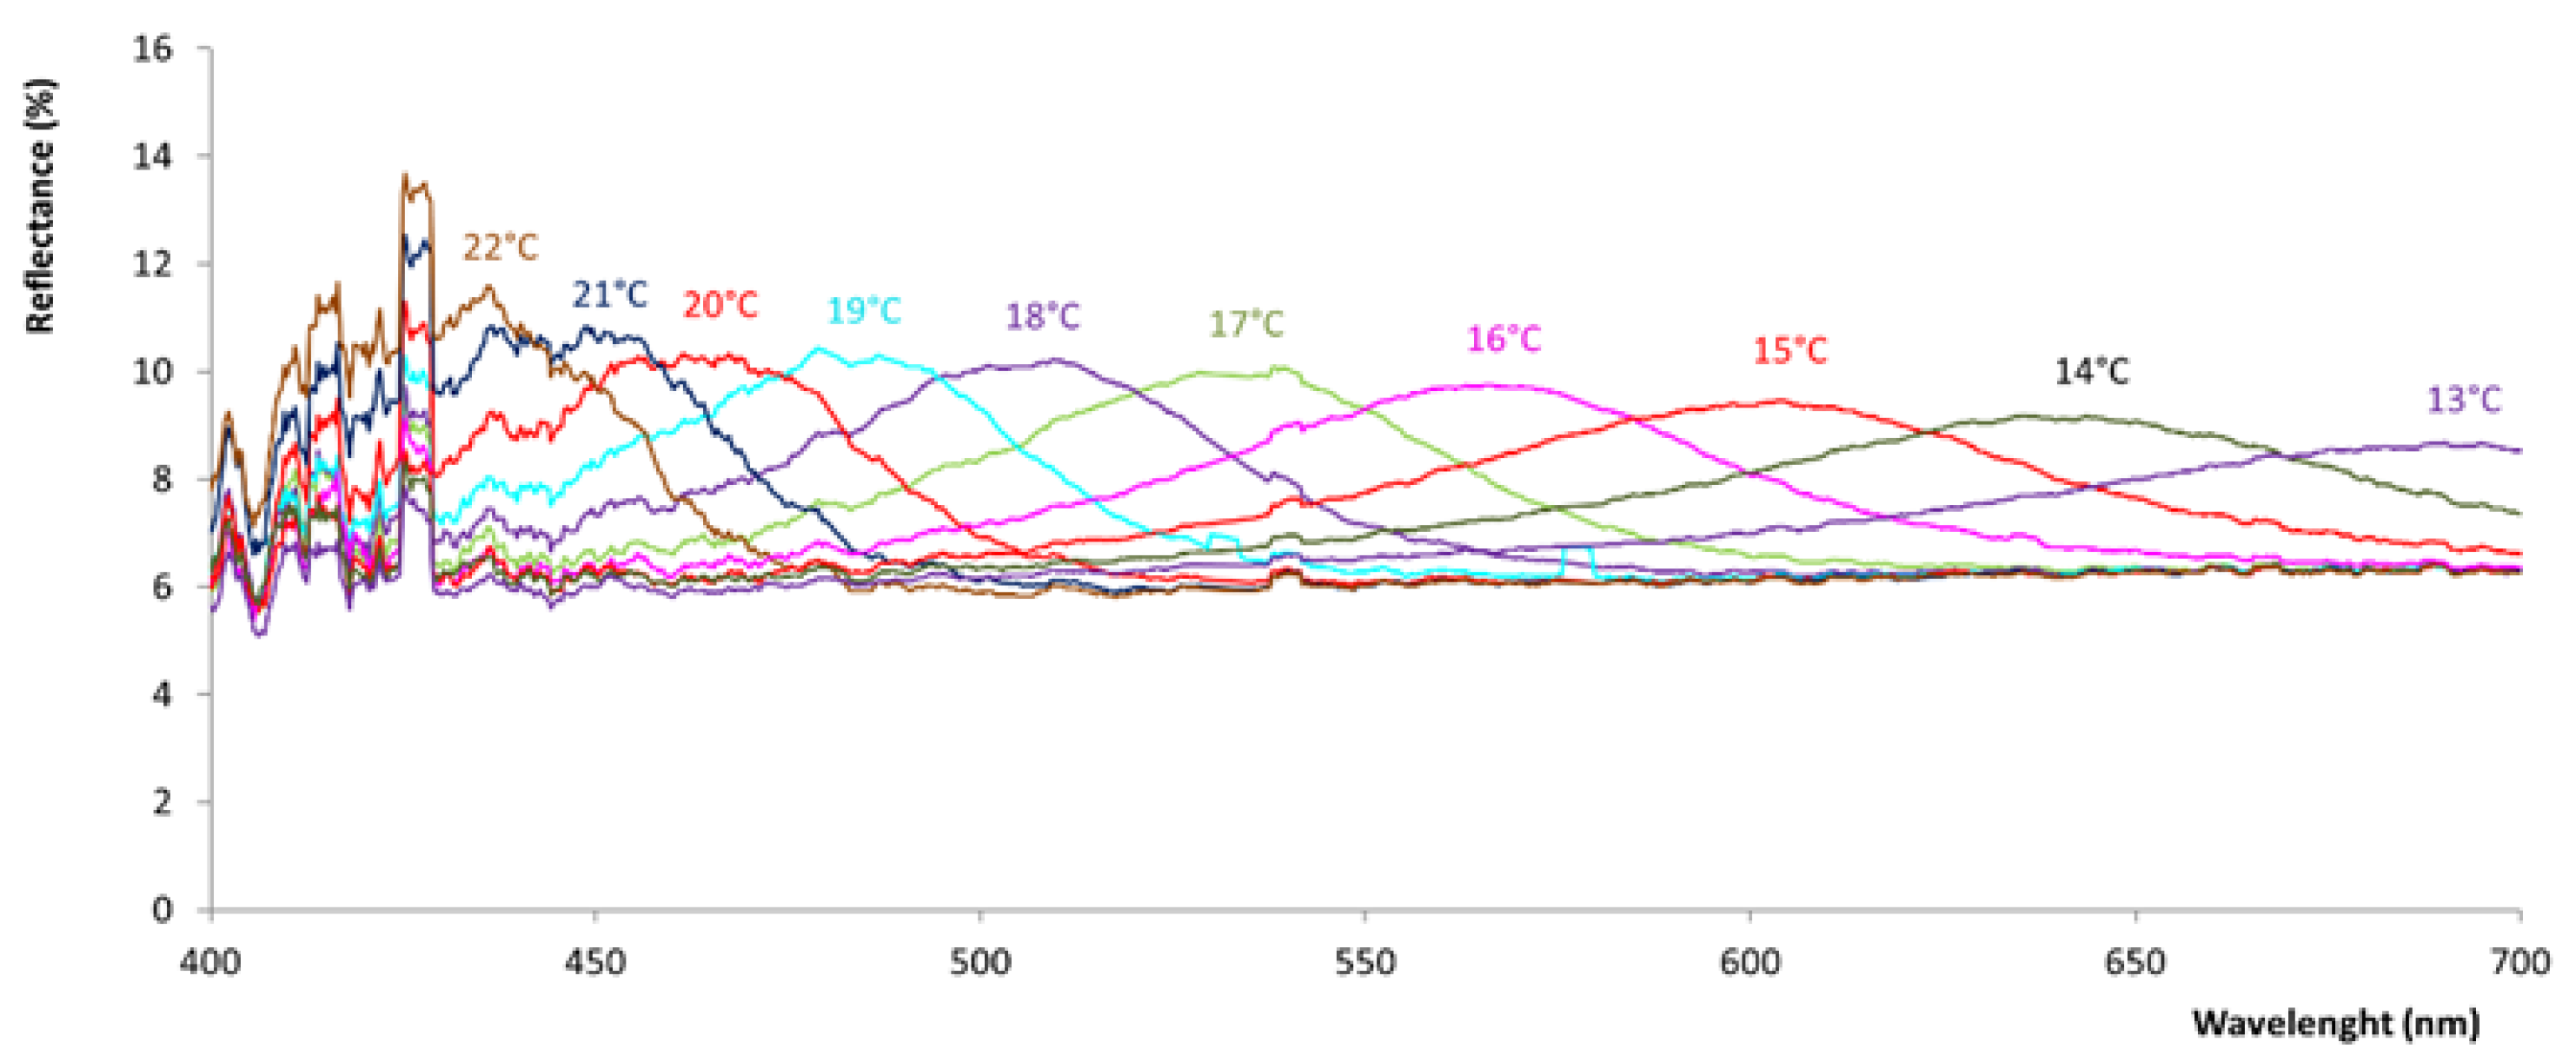
Figure 10.
Reflectance spectra of TLC 25 ink printed on UT substrate.
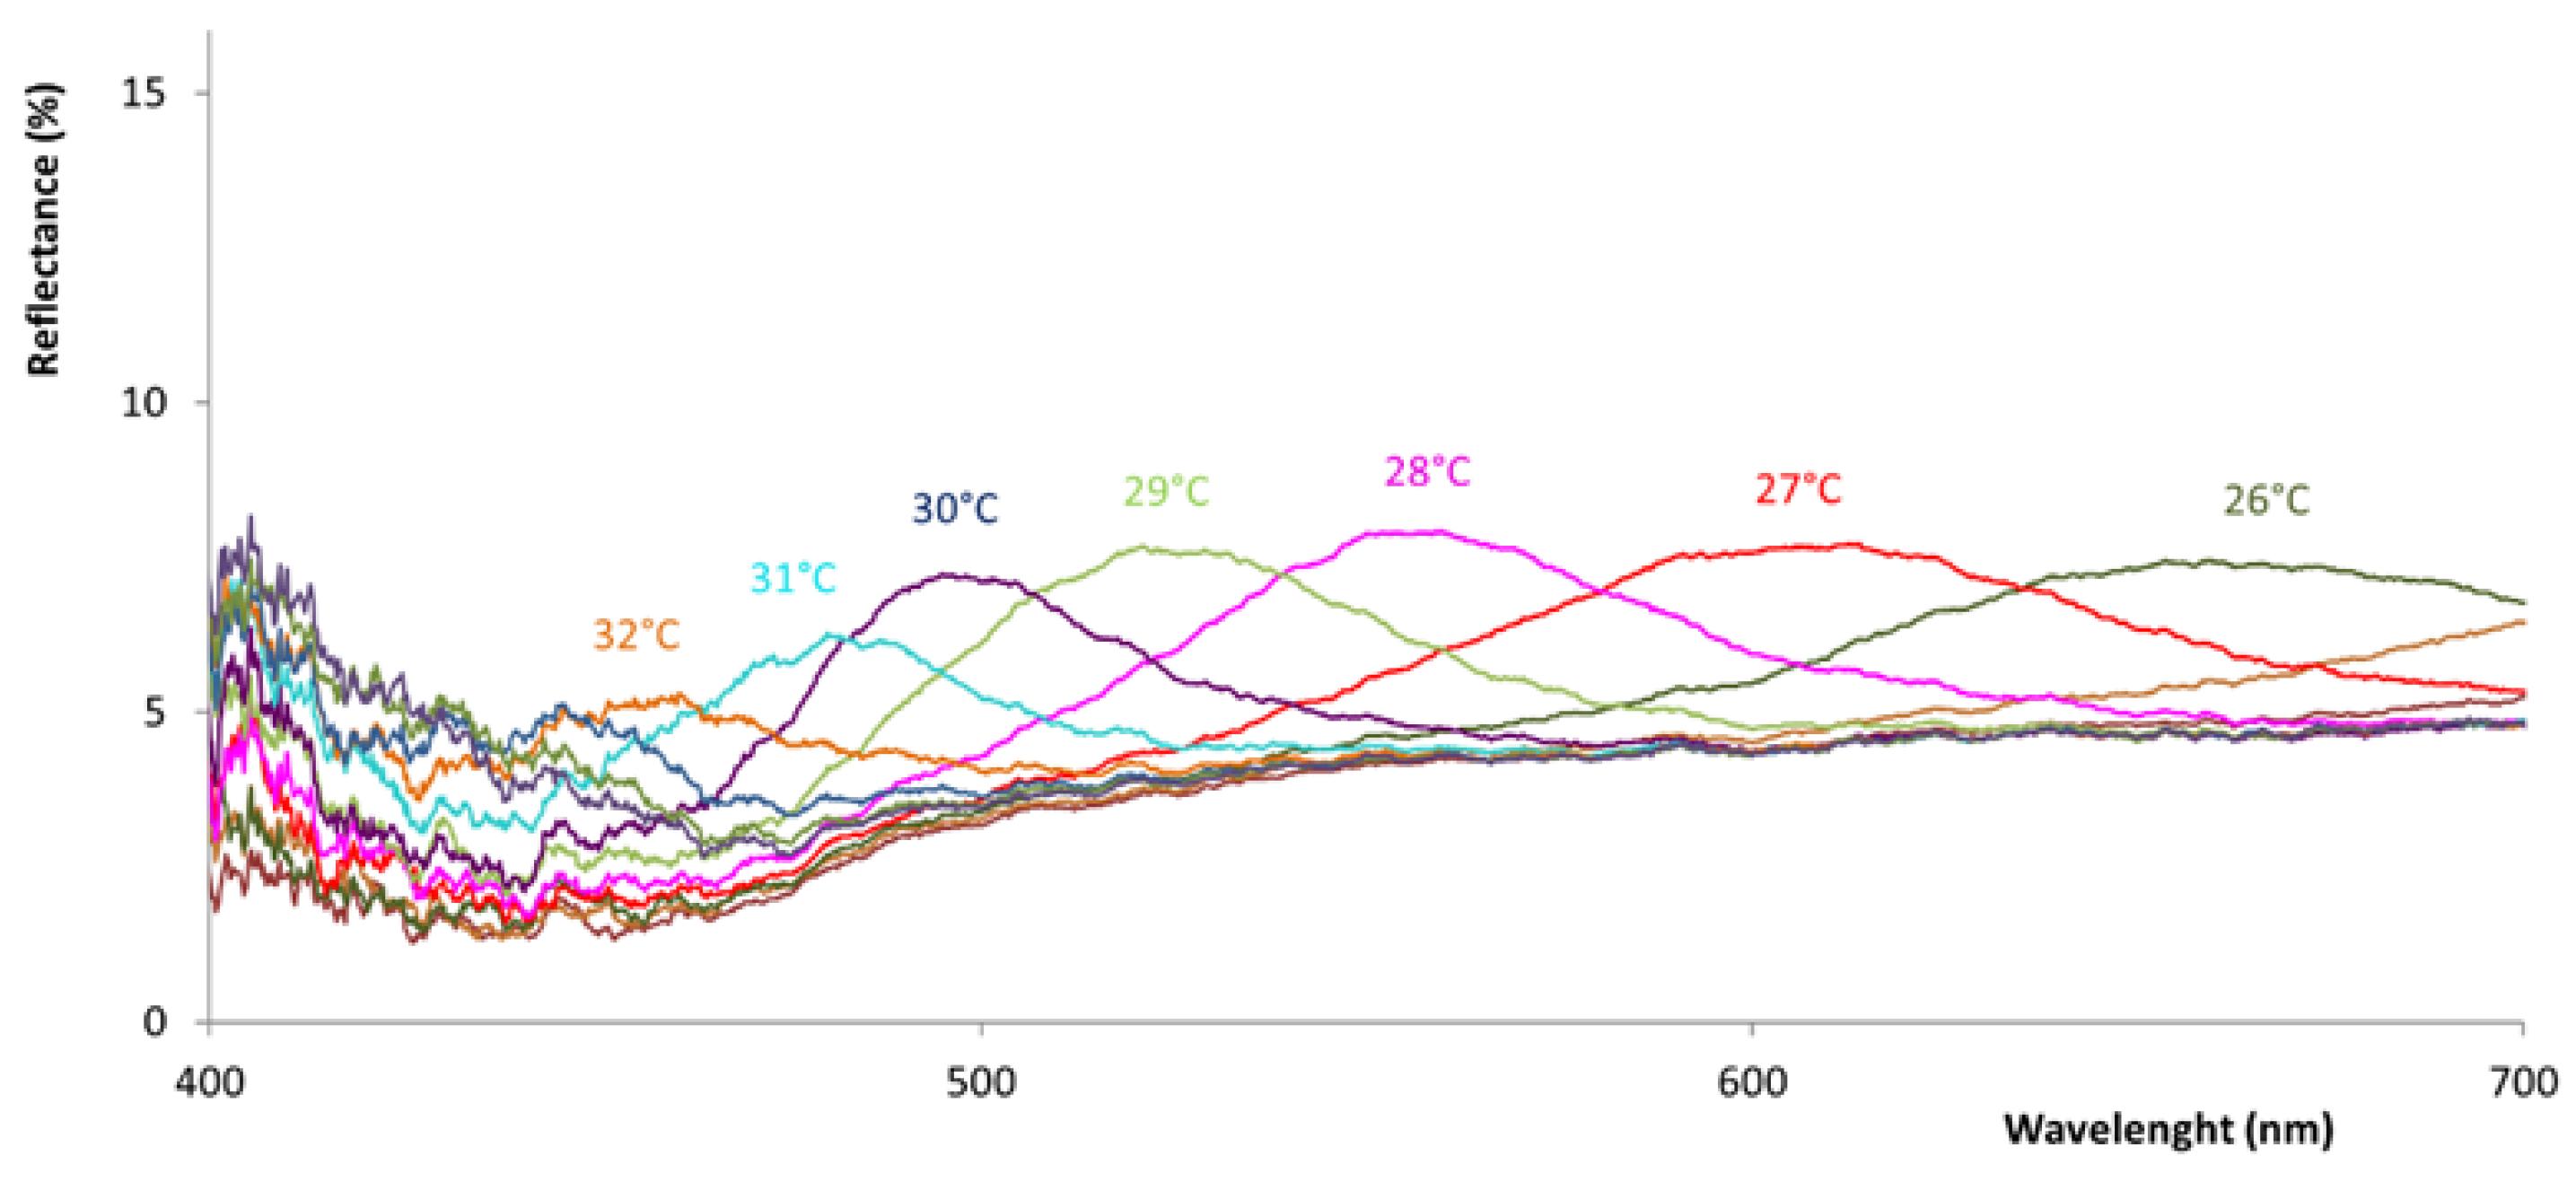
Figure 11.
Reflectance spectra of TLC 25 ink printed on BNC substrate.

Figure 12.
CIELAB colour values of the TLC 14 and TLC 25 ink printed on UT and BNC substrates, measured by spectrometer and presented in (a*, b*) diagram.
Figure 12.
CIELAB colour values of the TLC 14 and TLC 25 ink printed on UT and BNC substrates, measured by spectrometer and presented in (a*, b*) diagram.
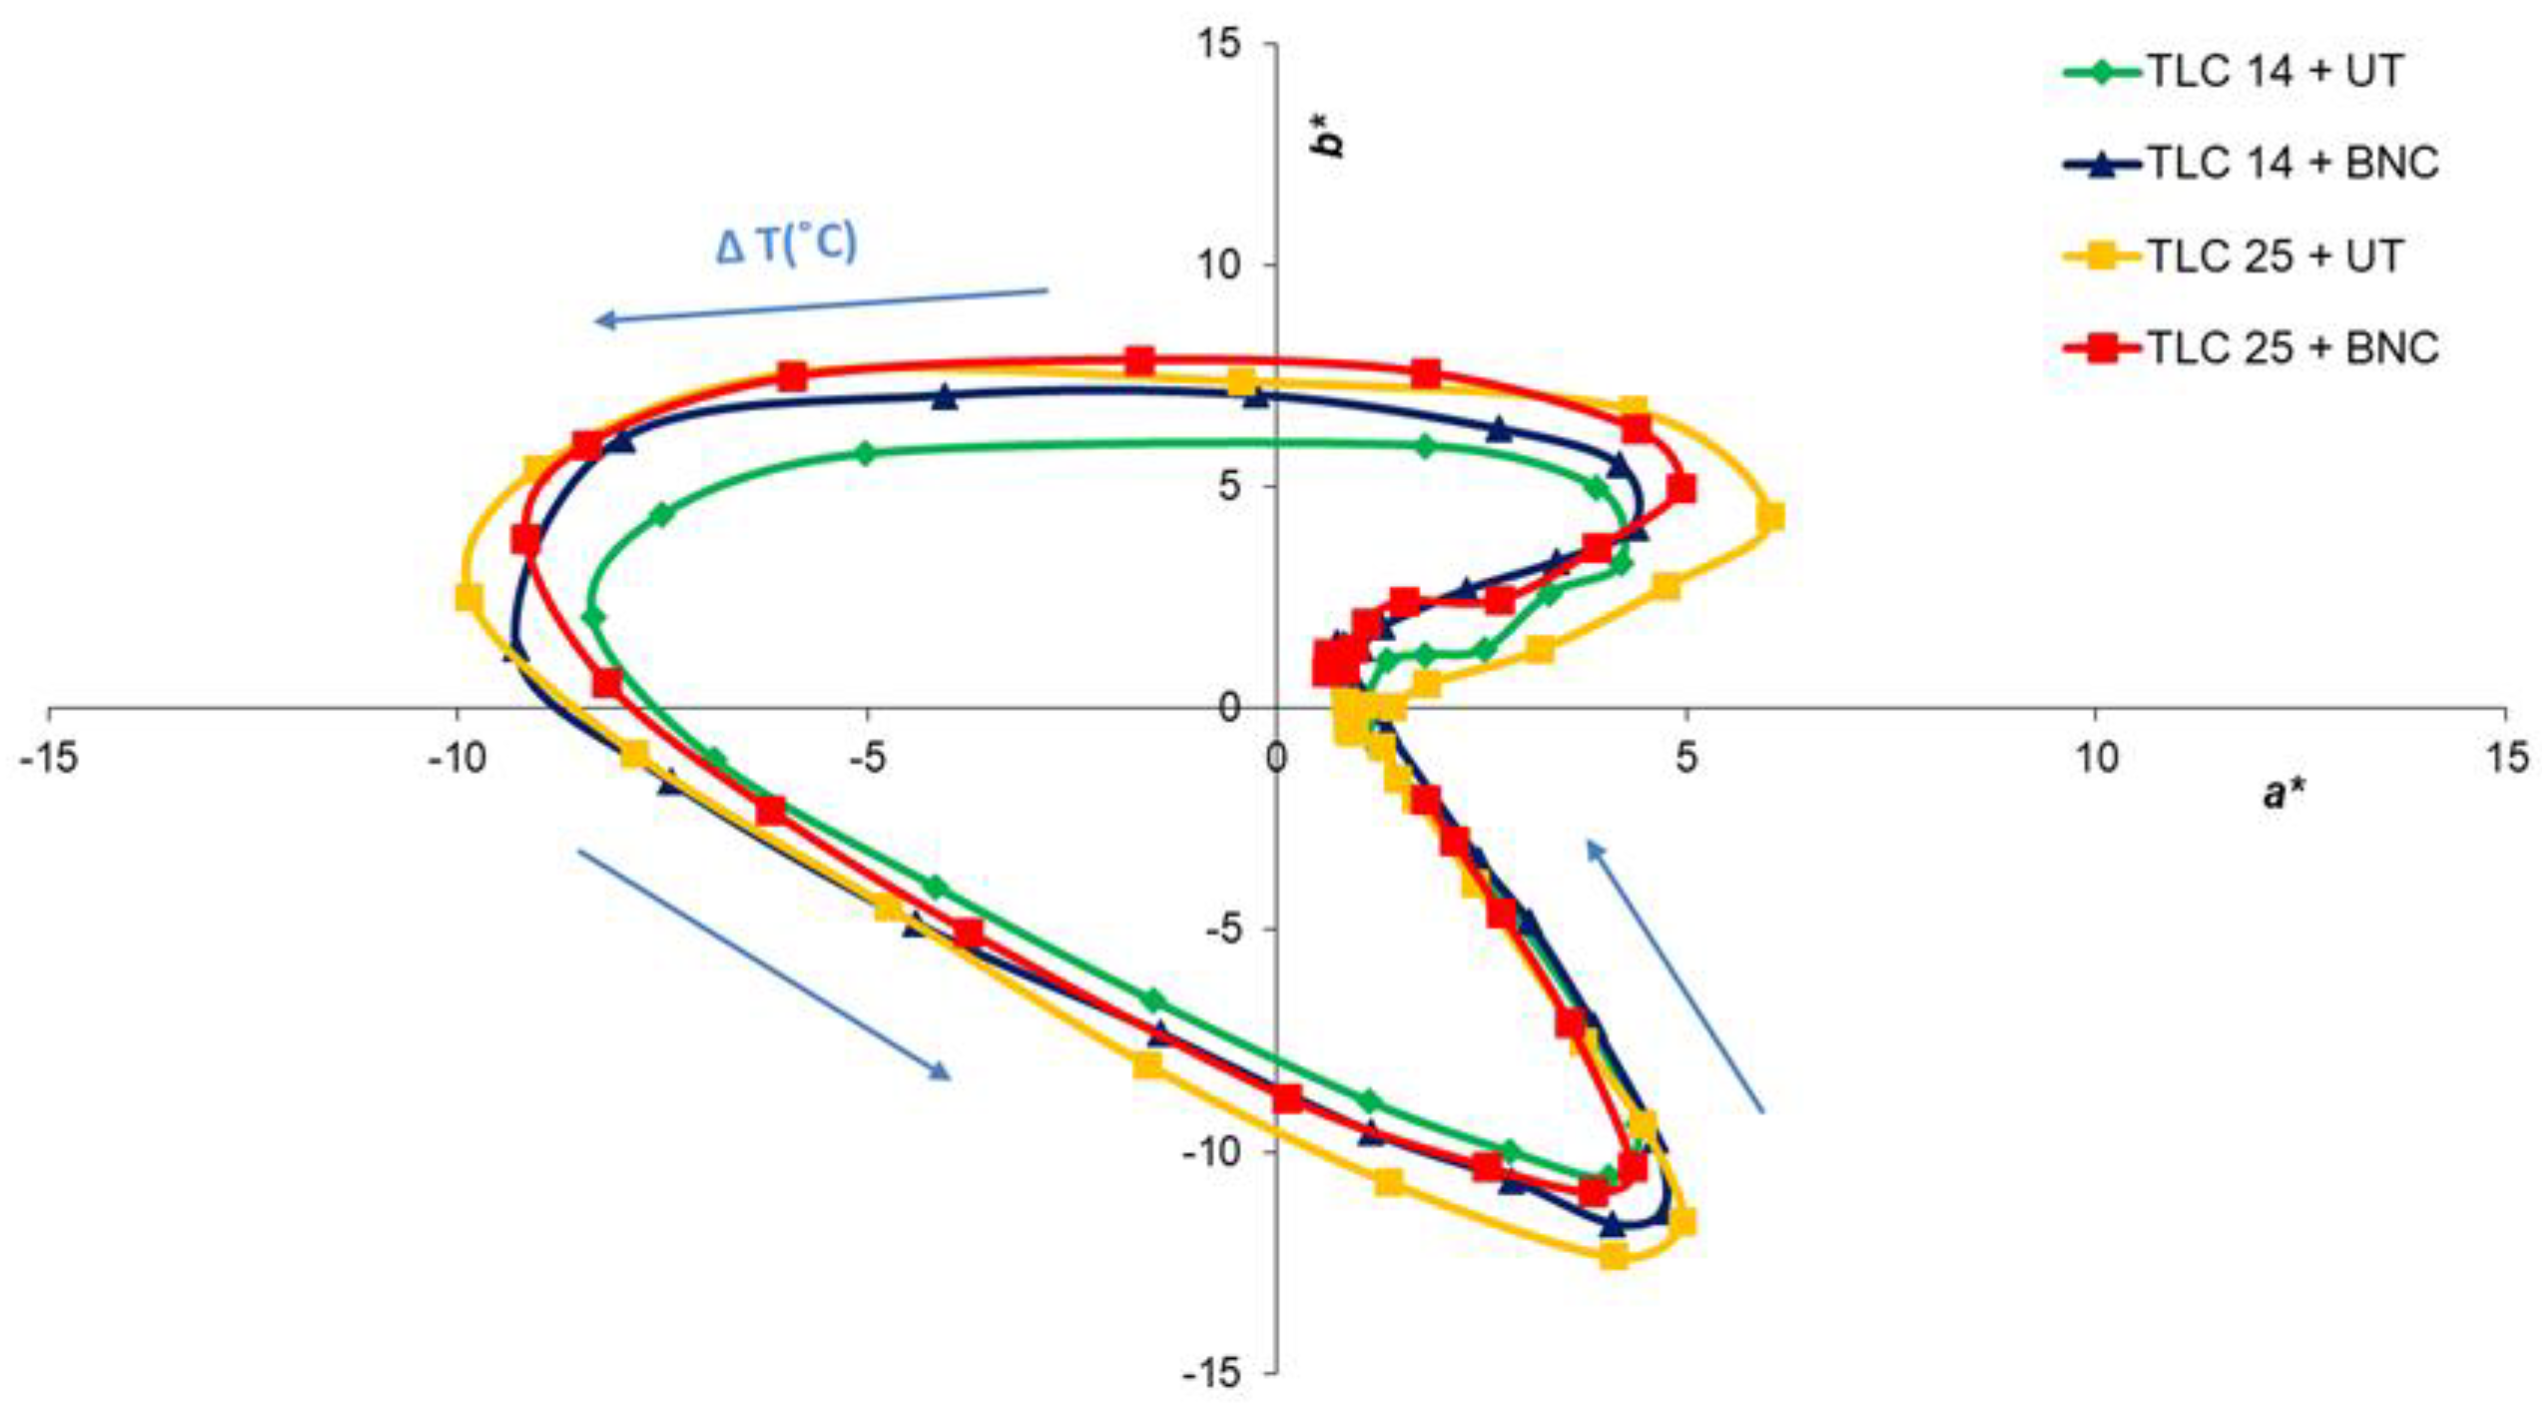
Figure 13.
Temperature dependence of CIELAB lightness values L*, measured for TLC 14 and TLC 25 printed on UT and BNC substrates.
Figure 13.
Temperature dependence of CIELAB lightness values L*, measured for TLC 14 and TLC 25 printed on UT and BNC substrates.
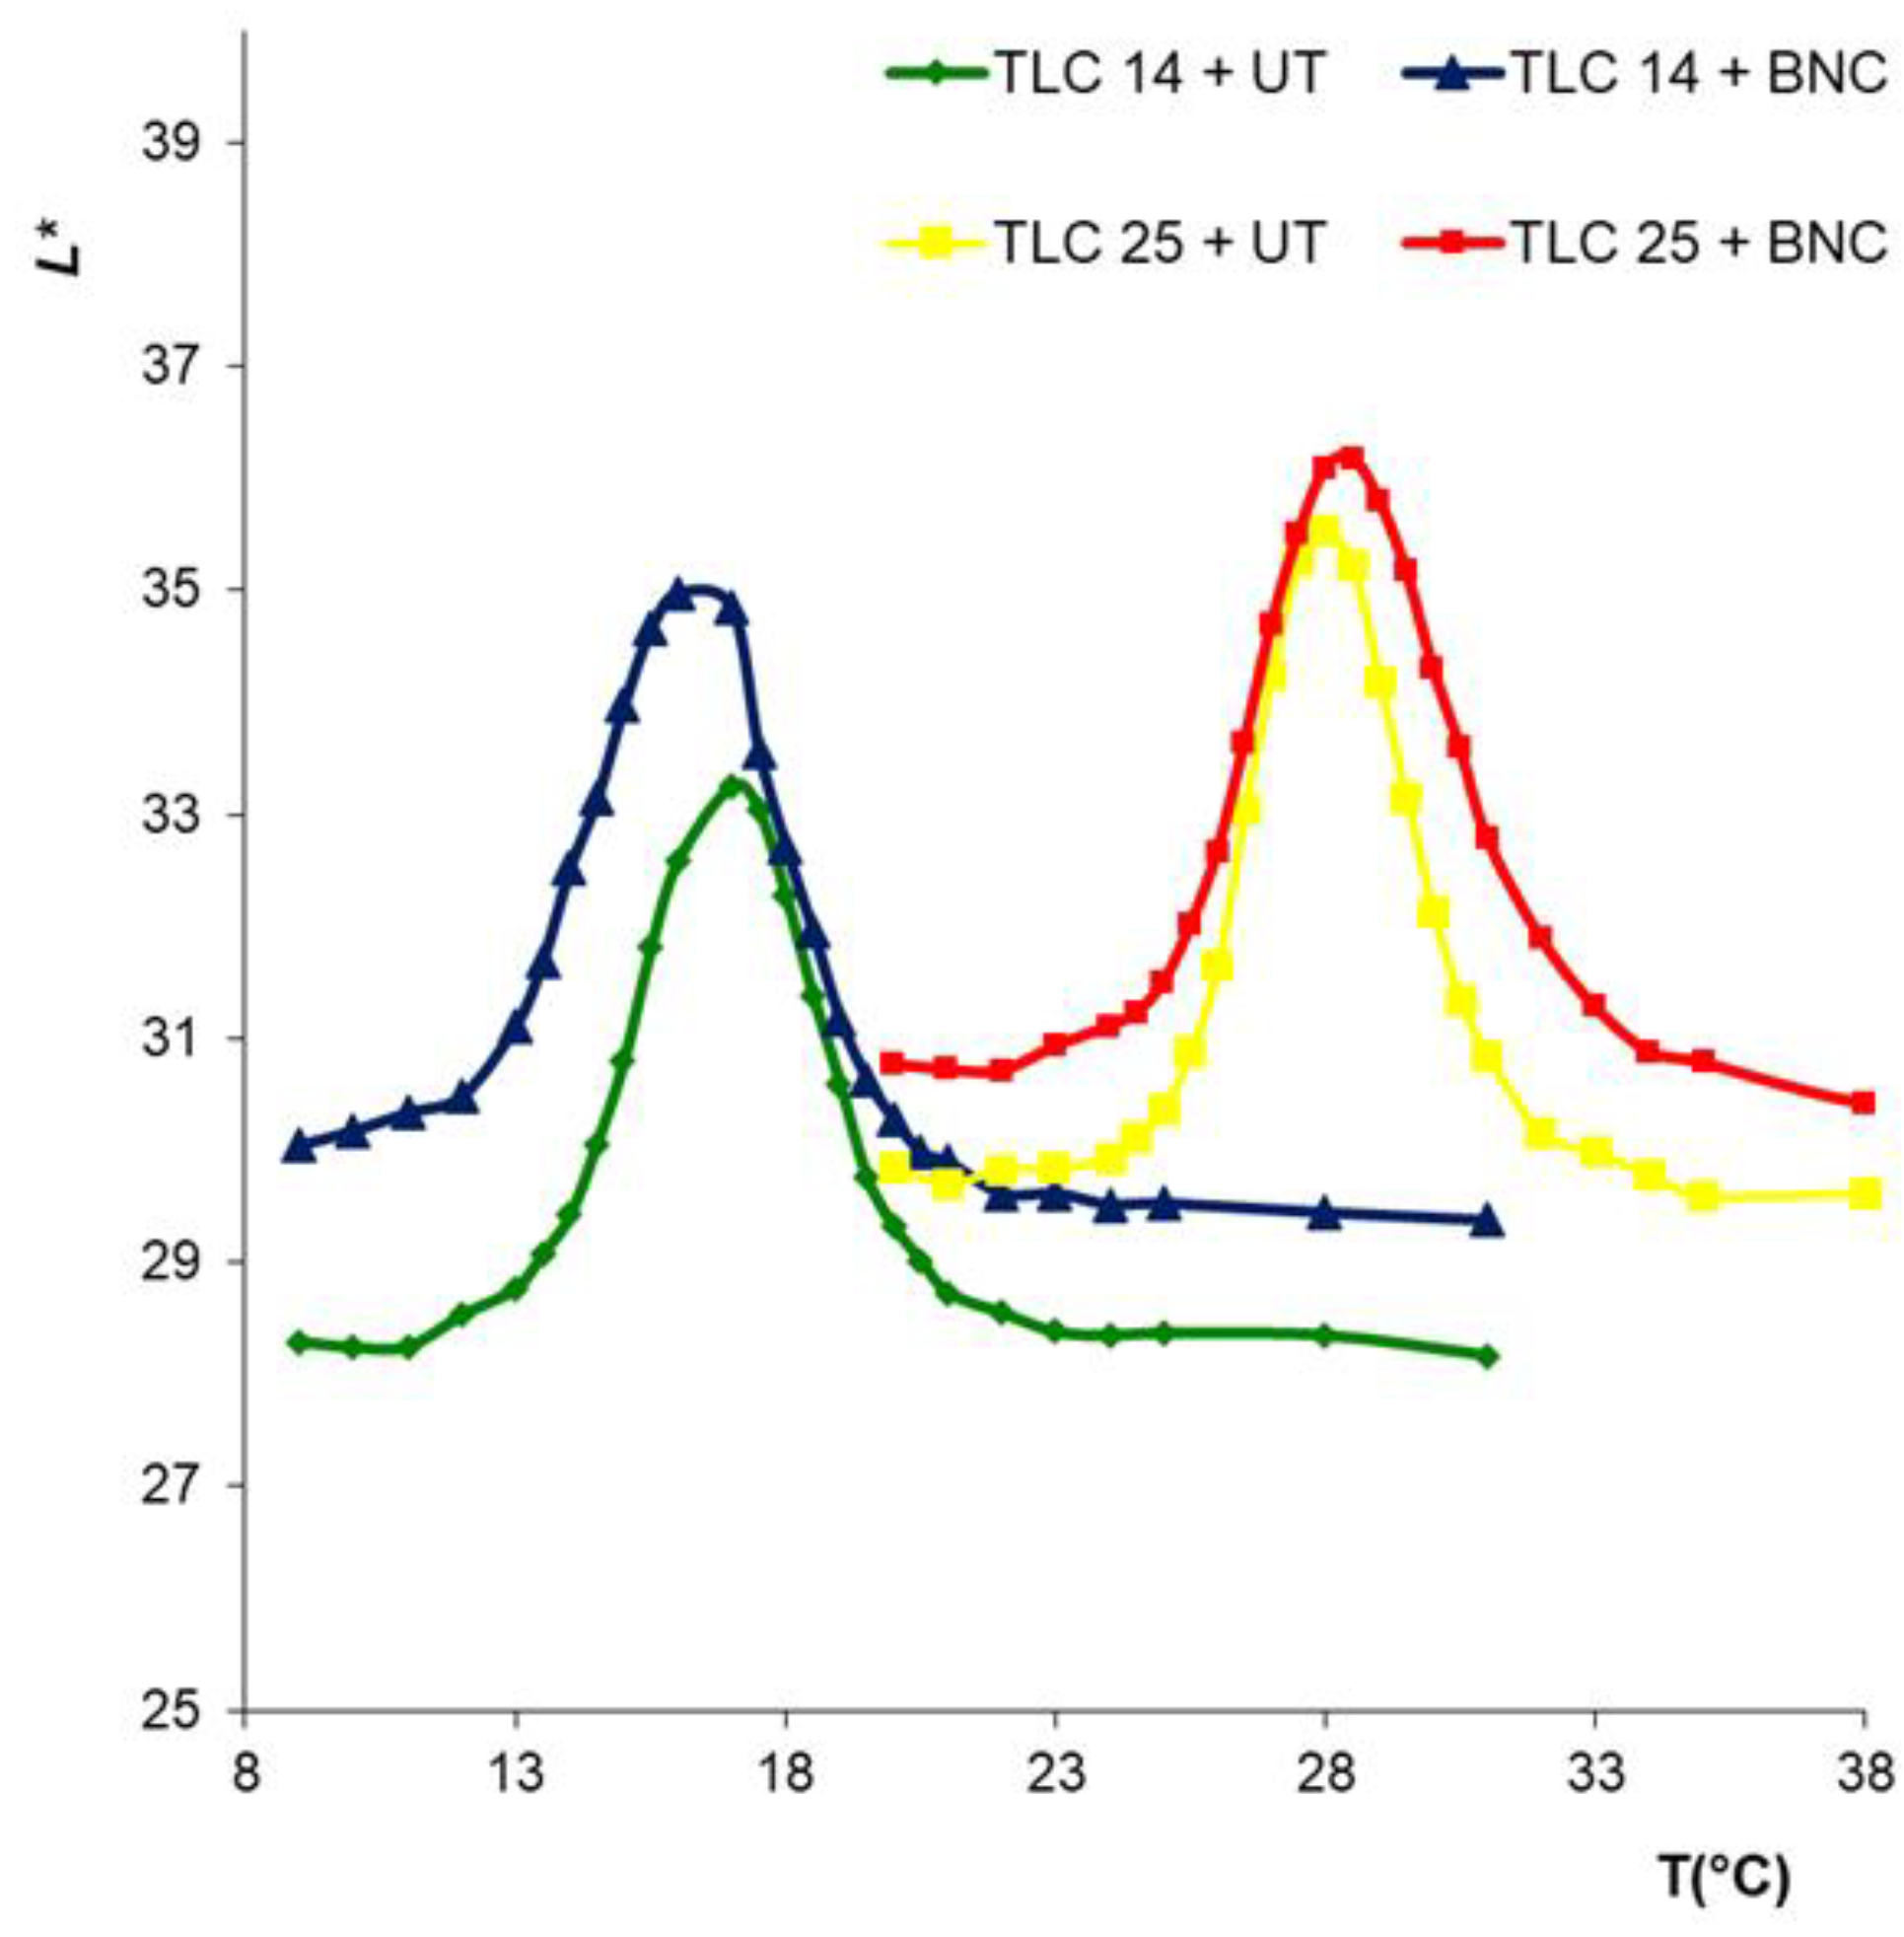
Figure 14.
Position of the reflectance peak dependent on temperature for TLC 14 (a), and TLC 25 ink (b), printed on UT and BNC substrates (referring to Figure 8, Figure 9, Figure 10 and Figure 11).
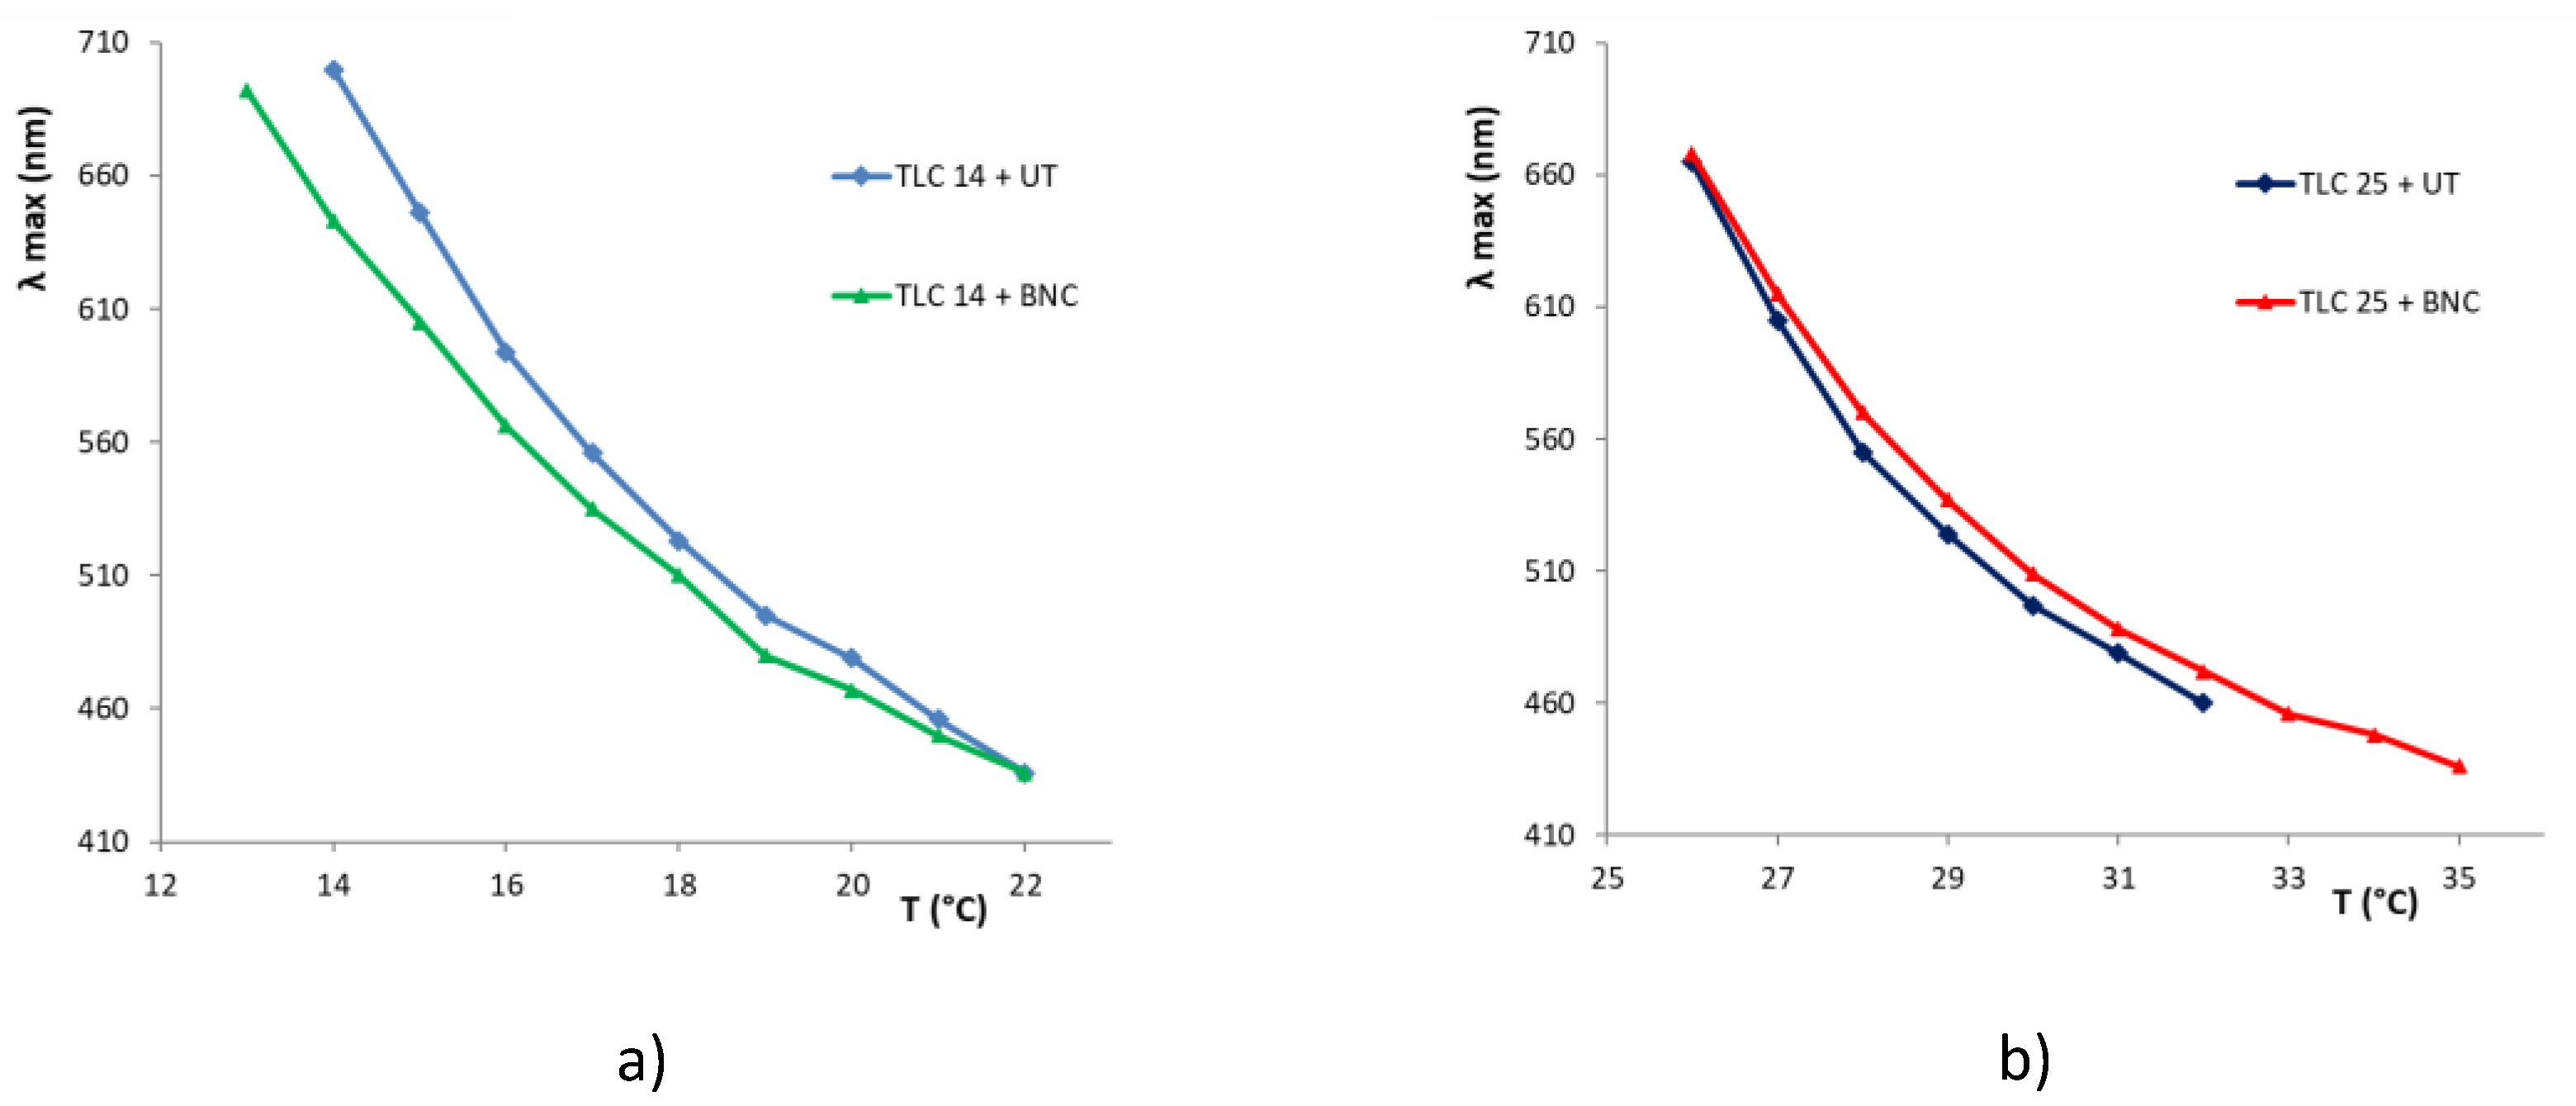

Table 1.
Temperature dependent specifications of used TLC inks.
| TLC ink | TA (°C) | Temperature activation region (°C) |
|---|---|---|
| TLC 14 | 14 | 14 - 19 |
| TLC 25 | 25 | 15 - 30 |
Table 2.
Roughness parameters for substrates UT and BNC – unprinted and printed with TLC 14 and TLC 25 inks.
Table 2.
Roughness parameters for substrates UT and BNC – unprinted and printed with TLC 14 and TLC 25 inks.
| Sample | Sa (µm) | Sz (µm) | Sp (µm) | Sv (µm) |
|---|---|---|---|---|
| UT, unprinted | 2 | 47 | 32 | 15 |
| BNC, unprinted | 20 | 112 | 47 | 65 |
| TLC 14 + UT | 5 | 31 | 15 | 16 |
| TLC 14 + BNC | 18 | 119 | 62 | 57 |
| TLC 25 + UT | 3 | 36 | 25 | 11 |
| TLC 25 + BNC | 13 | 97 | 47 | 50 |
Table 3.
The results of moisture and ash content for samples UT and BNC.
| Sample | Absolute moisture (%) | Ash content/525 °C (%) | Ash content/900 °C (%) |
|---|---|---|---|
| UT | 3.93 | 5 | 4.57 |
| BNC | 3.93 | 6.22 | 3.74 |
Table 4.
Properties of TLC inks printed on UT and BNC substrate: temperature at which the L*(T) curve has its maximum is denoted by T(L*max), and its intensity by ∆L*max. See also Figure 13.
Table 4.
Properties of TLC inks printed on UT and BNC substrate: temperature at which the L*(T) curve has its maximum is denoted by T(L*max), and its intensity by ∆L*max. See also Figure 13.
| TLC prints | T(L*max) (˚C) | λ (nm) | ∆L*max |
|---|---|---|---|
| TLC 14 + UT | 17 | 556 | 5.09 |
| TLC 14 + BNC | 16 | 566 | 5.6 |
| TLC 25 + UT | 28 | 555 | 5.94 |
| TLC 25 + BNC | 28.5 | 554 | 5.76 |
Disclaimer/Publisher’s Note: The statements, opinions and data contained in all publications are solely those of the individual author(s) and contributor(s) and not of MDPI and/or the editor(s). MDPI and/or the editor(s) disclaim responsibility for any injury to people or property resulting from any ideas, methods, instructions or products referred to in the content. |
© 2025 by the authors. Licensee MDPI, Basel, Switzerland. This article is an open access article distributed under the terms and conditions of the Creative Commons Attribution (CC BY) license (http://creativecommons.org/licenses/by/4.0/).
Copyright: This open access article is published under a Creative Commons CC BY 4.0 license, which permit the free download, distribution, and reuse, provided that the author and preprint are cited in any reuse.


