
Submitted:
06 March 2025
Posted:
07 March 2025
You are already at the latest version
Abstract
Phosphorus (P) is an essential macronutrient for plant growth, and its deficiency in soils poses a significant global challenge to agricultural productivity, particularly in cereal-based cropping systems. A substantial proportion of global croplands and grasslands are classified as P-deficient, necessitating phosphorus inputs to sustain soil fertility and food production. Moreover, optimizing phosphorus use efficiency (PUE) is critical to reducing environmental impacts while maintaining agricultural sustainability. This review explores the best management practices (BMPs) for enhancing phosphorus use, emphasizing sustainable strategies that mitigate ecological consequences. It highlights the need for integrated approaches that account for local agricultural conditions, economic feasibility, and environmental sustainability. By advancing knowledge of P cycling, soil health, and innovative fertilizer application techniques, this study aims to promote sustainable phosphorus management. Implementing these BMPs can help stakeholders balance crop productivity with environmental stewardship, ensuring the long-term viability and resilience of cereal-based cropping systems globally.
Keywords:
Phosphorus
; sustainable agriculture
; best management practices
; phosphorus use efficiency
; cereal cropping systems
; soil fertility
; fertilizer management
; 4R nutrient stewardship
1. Introduction
Nutrients are essential for life, for plants, animals, and humans. Seventeen nutrients are essential for plants to grow and reproduce (White and Brown, 2010). Nutrient supply, through the application of nitrogen and phosphorus (P) fertilizers, has been an essential resource in sustaining the increase in food production since the 1960s (Stewart et al., 2005a; McArthur and McCord, 2017; Dobermann et al., 2022). Yield gap studies have shown that in several cereal cropping systems, nutrients are responsible of a large portion of the gap (Stewart et al., 2005a; Krasilnikov et al., 2022; McDowell et al, 2024; Scholz et al., 2025). However, the sharp increase on the use of N and P fertilizers has also been responsible of several environmental issues: GHG emissions, surface-water eutrophication, and heavy-metal contamination, among others (Dobermann et al., 2022). Rockstrom et al. (2020) indicated that N and P fluxes have largely exceeded the safe-operating planetary boundaries.
Phosphorus is characterized as a macronutrient because of the amount required by plants and its frequency of deficiency in cropping systems along with nitrogen and potassium (Ziadi et al., 2013). Phosphorus is the 11th most abundant element in the earth’s crust, and its concentration in soils generally fluctuates between 100 and 3,000 mg P kg-1 soil, or 200–6,000 kg P ha-1 (Mengel, 1997). Despite of its abundancy in the earth´s crust, P deficiency has been identified in many areas of the world (McDowell et al., 2023). McDowell et al. (2024) estimated that 45-74% of the global cropland and 51-80% of grasslands are grown in P-deficient soils.
P fertilizers are produced from phosphate rock that is a finite non-renewable resource, and they provide for the maintenance and improvement of soil P status and agricultural production, but their incorrect use might result in negative environmental impacts because of P surpluses/deficits (Johnston et al., 2014). Future supply of P would be limited by scarcity or exhaustion of rock phosphate reserves although the longevity of P resources is ample discussed by several authors (Cordell and White, 2013; Mardamootoo et al., 2021; McDowell et al, 2024; Scholz et al., 2025). Most of them would agree with projections of at least +300-1000 years of rock P availability (Argus-IFA, 2023; Scholz et al., 2025).
Approximately 85% of the annual phosphate production is used as P fertilizers, which represent approximately 90% of the annual P inputs to agricultural land (Cordell et al., 2009; Lun et al., 2018). The recent study of Scholz et al. (2025), estimates that about 93% of the total annual mined P flows are used for food production. If weathered P is added to this mined P, the total use efficiency would be with a low total use efficiency of 5-10% (mine to fork). This total P use efficiency would be potentially improved by improving the P use efficiency of fertilizers and agricultural-by-products, recycling P from industry and household wastes, and optimizing animal and human diets (Brownlie et al., 2022).
Modern terrestrial P cycle is dominated by agriculture and human activity, but with a wide variation among regions (Demay et al., 2023). According to FAOSTAT, (https://www.fao.org/faostat/en/#data/), P fertilizer use has increased globally from 4.8 to 18.3 Tg of P·y−1 from 1961 to 2022, a 284% increase in a period of 62 years (Figure 1). MacDonald et al. (2011) estimated global agronomic inputs of P fertilizer at 14.2 Tg of P·y−1, and manure at 9.6 Tg of P·y−1 by 2000. These inputs exceeded P removal by crops (12.3 Tg of P·y−1), but the authors indicated that P deficits covered almost 30% of the cropland, given the unbalanced regional distribution of P application.
Zou et al. (2022) estimated that the total application of P fertilizers in croplands was of 18 Tg P yr-1 in 2013 and projected it to increase to 22-27 Tg P yr-1 by 2050. These authors estimated a global surplus (P inputs-P removal) of 6 kg P ha−1 yr−1 in 2019, and that the mean global P residual in soil in 2019 has accumulated to 212 kg P ha−1 since 1961.
Phosphorus inputs and surpluses widely differ across regions and countries (Lott et al., 2009; Mogollon et al., 2018; Demay et al., 2023), and in fact, across cropping systems as withdrawals and fertilizer additions depend on crop choice (Jobbagy and Sala, 2014; Łukowiak et al., 2016). Countries such as Argentina, Russia, US, most African nations and some European nations show P balances close to neutral or negative, while China, India, Brazil and others show positive balances (Lott et al., 2009; Zou et al., 2022). According to FAO data (https://www.fao.org/faostat/en/#data/ESB), global P balance for the main 15 field crops producing countries, in 2019-2021, averages +13.9 kg P ha-1, but with variations between -6.2 kg P ha-1 for Argentina to +25.9 kg P ha-1 for Bangladesh (Table 1).
Phosphorus fertilizer use in agriculture has contributed to three-fold increases in cereal grain production (Figure 2). According to IFA (2022), cereals received about 49% of world P fertilizer application in 2018: 18% for maize, 15% for wheat, and 13% for rice. Soybean share was of 11% of global P consumption. The same IFA report indicates a high variation in P rates among crops and countries, but averages were of 22-23 kg/ha for maize, 19-20 kg/ha for rice and soybean, and 16-17 kg/ha for wheat.
Phosphorus imbalances, either deficits or excesses, would affect cropping systems productivity and crop nutritional value (MacDonald et al., 2011; Wall and McDonald, 2015; Dobermann et al., 2022; Peñuelas and Sardans, 2022). Phosphorus deficiencies have reduced attainable cereal production in many areas of the world such as sub-Saharan Africa (SSA) (Dobermann et al., 2022). Adequate P supply has shown to increase crop yields and quality (Aulakh et a., 2003; Valkama et al., 2009; McLaughlin et al., 2011; Schlindwein et al., 2013; Johnston et al., 2014: Vieira et al., 2015; Aune et al., 2017; Saito et al., 2019; Vanlauwe et al., 2023).
Excess P can lead to environmental issues, such as eutrophication of surface waters, including streams, rivers, lakes, and coastal seas (Carpenter et al., 1998; Schoumans et al., 2015; Withers et al., 2019). Such P excesses are frequently associated with agricultural practices involving overuse of fertilizers and improper manure disposal, as well as contributions from urban areas (Sharpley et al., 2015).
Increasing the efficiency of use and cycling of P arise as an essential need at the planetary scale (Cordell and White, 2013; Withers et al., 2014; Brownlie et al., 2022; Peñuelas and Sardans, 2022). Management of P for enhancement of P use efficiency (PUE) should be based on the knowledge of its dynamics in the soil-crop system and varies depending on the soil, environment and cropping system conditions and management.
Four main issues are generally considered when discussing past, current and future P demand, use, and management (Schroder et al., 2011; Suh and Yee, 2011; Johnston et al., 2014; Sharpley et al., 2015; Peñuelas and Sardans, 2022; Grieger et al., 2024):
- Concern on P scarcity: Rock P reserves and resources are of non-renewable nature.
- Need for P application in P-deficient soils of many world regions: Under-application has been largely reported for cropping systems of Africa and South America as well as in many regions of other countries.
- Mitigation and reduction of environmental impacts of excessive P applications: Over- application of P has impacted water quality in many areas of the world. Work done in recent years has emphasized the need for suitable P management under these conditions.
- Improve P use efficiency, recovery and recycling, as it relates to the previous three points.
The objective of this review is to present and discuss 4R nutrient stewardship as applied to P focused on cereal-based cropping systems. As background for the discussion of BMPs for P in cereal-based cropping systems, we would briefly review P cycling in field crop agroecosystems, and P use efficiency across world cereal-based cropping systems. Based on the 4R nutrient management framework, we address concepts of nutrient management such as integrated plant nutrient management (IPNM), site-specific nutrient management (SSNM), new fertilizer technologies, and others. Similarities and differences in sustainable P management among different regions and cropping systems are discussed, as well as specific situations of low-input systems, organic farming and others.
2. P in the Soil-Crop Ecosystem
Soil is the basic source of P for crops. The primary P minerals are fluorapatite in igneous rocks and authigenic carbonate-fluorapatite (Filippelli, 2002, 2008). All these minerals contain phosphate linked to calcium, and weathering proceeds as result of the reaction with carbon dioxide (CO2). Several processes are involved in weathering: biochemical respiration releasing CO2, organic acid exudates from plant roots, release of phosphatase enzymes by plants, and mycorrhizae symbiosis.
2.1. P Cycle in Field Crop Systems
Phosphorus is typically regarded as a nutrient with low mobility within the soil system, and understanding this characteristic is crucial for effective agronomic management. Figure 3 shows a general diagram of the P soil-plant dynamics for cereal crop-based agroecosystems. Crop roots uptake P from the soil solution which typically exists at low concentration (0.1-0.3 mg kg-1). Soluble P is replenished from organic and inorganic fractions which vary in availability. Chemical, biological and physical reactions, such as sorption/desorption, precipitation/dissolution, and mineralization/immobilization, govern the equilibrium of the P soil fractions (Pierzynski et al., 2005).
From a more practical approach, Johnston et al. (2014) refer to the behavior of soil P as an equilibrium of four pools of decreasing accessibility: immediately available, readily available, less readily available, and very low availability.
Solution P concentration is very low, in the range of 10-5-10-4M, and it is replenished several times a day to maintain the uptake demand of growing crops (Mengel and Kirby, 2001). Inorganic P pools are associated to Fe-or Al-phosphates under neutral to low soil pH conditions and to Ca-phosphates under neutral to high pH conditions (Penn and Camberato, 2019). Prevalence of sorption/desorption or precipitation/dissolution reactions depend on pH and on minerology (clay content) (Pierzynski et al., 2005).
Organic P represents 30% to 65% of total P in the surface soil layers and most of this organic P is incorporated within chemically and physically protected forms which slowly degraded (Condron et al., 2005). Organic forms of soil P have been mainly identified as inositol phosphates, phospholipids and nucleic acids, other forms include sugar phosphates, phosphoproteins and phosphorylated carboxylic acids. However, much organic P remains unidentified.
When P is added, either as a mineral or organic source, the released phosphate anions are adsorbed in the surface of organo-clay colloids and/or precipitate in different forms (McLaughlin et al., 2011; Syers et al., 2008), depending on the soil properties and on the fertilizer. Degryse and McLaughlin (2014) found that the extent of P diffusion was limited in soils rich on amorphous Al and Fe oxides and in calcareous soils. The initially adsorbed P slowly penetrates the reacting surfaces (Barrow et al., 2018).
Only 15-25% of the applied P is usually recovered by the first crop (Chien et al., 2012; Johnston et al., 2014). However, the remaining added P would be recovered along the successive cropping seasons, and, depending on soil texture, mineralogy and available P, recovery may be as large as 90% (Johnston et al., 2014; Johnston and Poulton, 2019). This is considered the residual P (Barrow et al., 2018; Johnston and Poulton, 2019).
Years of successive P applications, especially with P rates larger than crop P removal (positive balances) would build soil P (Johnston and Poulton, 2019). This situation has happened in many cereal producing regions of the world (MacDonald et al., 2012). This buildup of P has been called “legacy P” (Gatiboni et al., 2021). Legacy P is involved in undesired externalities which affect surface and ground water quality. Use of legacy P by reducing or stopping P application is an alternative to take advantage of this P buildup, reduce these undesired impacts, and improve PUE. Xu et al. (2024) evaluated the effects of long-term P fertilization (117 years) at the Morrow plots (Illinois, USA), and found that fertilization impacts on total soil P and soil P fractions were mostly limited to surface depths (0-30 cm); positive P balances enriched labile inorganic and organic pools and depleted non-labile organic fractions.
Continuous P fertilizers/organic sources application usually results in P stratification as P accumulates in the surface soil. Under conservation tillage systems, stratification and surface P accumulation (0-5 cm, 0-2.5 cm) would be more intense as soil is not mixed (Nunes et al., 2020). Stratification is a concern because plant roots tend to develop in the high-phosphorus surface layer of the soil, potentially impacting crop growth. However, the main concern with P stratification is the increased risk of P runoff and erosion. Under soil P stratification, Baker et al. (2017) propose periodic soil inversion and mixing as a viable practice to reduce dissolved reactive P input to Lake Erie.
2.2. P Functions in Plants
Phosphorus plays an essential role in several physiological processes in plants as component of genetic, metabolic, structural and regulatory molecules (White and Hammond, 2008). Plant tissue P concentrations vary between 0.3% and 0.5% of the dry matter as component of phospholipids, nucleic acids, nucleotides, coenzymes, and phosphoproteins (Marschner, 1995).
As P concentration in the soil solution is low, P is supplied to the roots mostly by diffusion. Phosphorus is absorbed by plants as orthophosphate ions, H2PO4- and HPO42-, and uptake is controlled by plant demand. It is an active uptake as concentration in plant cells is 100-1000-fold higher than in the soil solution. Once absorbed, P is rapidly involved in metabolic processes (Mengel and Kirby, 2001).
Phosphorus deficiencies in plants are generally related to their role in energy transfer and storage. Crops with P deficiency show reduced and slow initial growth. In general, P deficiencies affect growth more than photosynthesis per unit of leaf area (Marschner 1995; Mengel and Kirkby 2001; White and Hammond, 2008). Plants with P deficiencies mainly show less leaf expansion and fewer leaves or tillers (e.g. wheat, Rodriguez et al., 1999) or branches (e.g. soybean), depending on the crop. In contrast, protein and chlorophyll contents per unit of leaf area are not greatly affected by P deficiencies. Therefore, the greater effect on leaf growth than on chlorophyll content explains why the concentration of chlorophyll becomes comparatively high and the color of the leaves, especially of the youngest ones, turns dark green. Since P is a mobile nutrient in the plant, deficiency symptoms appear first on older leaves (purple or reddish color). Also, P-deficient plants prolong dormancy, mature early, and decrease size and number of flowers and buds.
Under low concentrations of P in the soil solution, plant root architecture, mycorrhizal association, and chemical and biological processes in the rhizosphere play a main role in P availability to plants (White and Hammond, 2008; Richardson et al., 2011; Shen et al., 2011). Lambers (2022) states that when the availability of soil P is low, soil characteristics and root morphology govern plant P acquisition, whereas kinetic properties of the P-uptake system are of lower importance. Shen et al. (2011) noted that plant P nutrition dynamics are controlled by P dynamics in the soil/rhizosphere-plant continuum, involving root architecture and exudation adaptations to balance heterogenous soil P supply. These authors suggested that a better understanding of P dynamics in the soil/rhizosphere-plant continuum is required to establish integrated P-management strategies.
P improves water use efficiency in crops by improving root growth and maintaining a high leaf water potential which result in improved water uptake and maintain cell turgidity increasing photosynthetic rate (Waraich et al., 2011; Kang et al., 2014; Savala et al., 2021).
2.3. P Requirements of Field Crops
Field crops of cereal-based agroecosystems vary in their P requirements as well as in the grain nutrient concentration. Ludemann et al. (2023) compile data of grain P concentration of several crops in building the global cropland nutrient database of FAO (Table 2). These authors emphasize that nutrient concentrations of the main crops would widely fluctuate, a coefficient of variation of 34% was reported, and recommend using country or region average values, if available, for the estimation of nutrient balances at different scales until better data become available (Ludemann et al., 2024a and 2024b).
Crop P requirements, defined as P uptake per t of grain, also vary across crop species, and environmental and management conditions. Table 3 compiles literature data on P uptake, P grain concentration, and P harvest index for field crops at different cropping systems across the world.
The dynamics of crop P uptake in field crops usually follows an “S” shape along the growing season with low P rate uptake at initial stages, then an increase in the uptake rate and a decrease after initiation of reproductive periods. Figure 4 shows the dynamics of P uptake for maize under two nitrogen fertilization rates (Ciampitti et al.; 2013). Although P requirements are key in the early stages of the crop to achieve high yields, it begins to accumulate at a maximum rate after V5-V6 in maize. At flowering, the crop has accumulated between 45% and 55% (Bender et al., 2013) of the total P uptake. The harvest P index ranges between 69% and 85% (Table 3).
Under high-yielding environments of southern Chile, Sandaña and Pinochet (2011) reported that P deficiency in wheat mainly affected aboveground biomass accumulation because of a reduction on cumulative solar radiation intercepted and has minor effects on radiation use efficiency and P harvest index. Figure 5 shows the temporal dynamics of P uptake in wheat at three different soil P test conditions at southern Buenos Aires province (Argentina).
3. P Use Efficiency in Cereal-Based Cropping Systems Around the World
Improving P use efficiency (PUE) is key in achieving the goals established for P security and simultaneously addressing P deficits and environmental concerns across different world cereal-based cropping systems (Cordell and White, 2013; Sharpley et al, 2015; Blackwell et al., 2019). Enhancement of PUE along the whole food systems requires proper management in process and transformations from the mine to the consumer (Suh and Yee, 2011; Stamm et al., 2022). Along the P use chain, agricultural P use is key in achieving P security, “The agricultural sector is at the heart of phosphorus use” as stated by Cordell and White (2013).
Johnston et al. (2014) discuss three methods (direct, difference, and balance) to estimate PUE. The “direct method” involves the determination of crop recovery of added P by labeling the P fertilizer with the radioisotope 32P; the “difference method” estimates crop recovery of added P by difference in crop P uptake between a fertilized and an unfertilized crop; and the “balance method” involves the ratio of P removed in harvested part of the crop to total P applied (P removal/P input). They suggested the “balance method” for evaluating cropping systems (Syers et al., 2008; Chien et al., 2012). The “balance method” considers that the replacement of P removed by crops from the soil is an efficient approach of using applied P (Johnston et al., 2014). Generally, estimates of PUE for the first crop are low, however, because of the residual effect of P, recovery and PUE improve if considering succeeding crops in the rotation (Syers et al., 2008).
Fertilizer P use efficiency estimated by “difference method” (% of P uptake from applied fertilizer P), has been reported at only 10-15% for agriculture (Johnston et al., 2014) or 16% for cereal crops (Dhillon et al., 2017). Zou et al. (2022) evaluated the historical trend in PUE (balance method) indicating that it was 55% in 1961, 44% by 1980 and 66% in 2019. Lun et al. (2018) estimated an average world cropland PUE of 46% for cropland, but with high variations among regions because of P input differences, i.e. extremes of PUE of 151% and 27% at Western/Central Africa and Eastern Asia, respectively.
Zou et al. (2022) indicated that PUE relates to P surplus and varies across countries according to income level (Figure 8). The evolution of PUE according to income level, from mining soil P to early development and sustainable intensification, is exemplified by the analysis of Guejjoud et al. (2024) for France for the periods 1920-1959, 1960-1991, and 1992-2020, respectively. The evolution of PUE for seven main grain producing countries in 1961-2022 is shown in Figure 9: Three high/upper middle-income countries, the US, France and Russia (1991-2022), transitioned to a sustainable intensification; and three low/upper middle-income countries, China, India and Pakistan, transitioned from a from mining to early development stage.
Main drivers of PUE at the country scale, other than economic growth, are N use efficiency, fertilizer-to-crop price ratio, farm size, crop mix, and agricultural machinery (Zou et al., 2022). At the field level, PUE depend on soil conditions, plant/crop and crop/soil management, and mostly of fertilization management practices (Figure 10) (Johnston et al., 2014). PUE is higher under low P rates and low P availability (García, 2004; Barbieri et al., 2014; Lun et al., 2018; Ros et al., 2020; Balboa et al., 2024) (Figure 11).
Soil factors affecting PUE are soil P status, texture, pH, organic matter, mineralogy, availability of other nutrients, water availability, and physical conditions (compaction, dense layers) (Syers et al., 2008; Valkama et al., 2009; Johnston et al., 2014; Blackwell et al., 2019; Qaswar et al., 2020).
Crops and genotypes differ in yield responses to P fertilization (Hammond et al., 2004), mainly due to P acquisition efficiency (PUpE) rather than P utilization efficiency (PUtE) within the plant (Vance et al., 2003; Fernández et al., 2009; White and Brown, 2010; Veneklaas et al., 2012; van de Wiel et al., 2016). Plants and microorganisms may improve PUE through: (i) root-foraging strategies which improve P acquisition by lowering the critical plant P requirement; (ii) P-mining strategies for enhancing desorption, solubilization and/or mineralization of soil P using root exudates, and (iii) breeding for improving internal P-utilization efficiency (Fernández et al., 2011; Richardson et al., 2011; van de Wiel et al., 2016).
Management factors affecting PUE are rotation, cover crops, crop variety, fertilizer placement, fertilizer product, application time, and fertilizer modifiers/conditioners (Syers et al., 2008; Hallama et al., 2019; Hopkins and Hansen, 2019; Lizcano Toledo et al., 2022; Crespo et al., 2024).
Blackwell et al. (2019) stated three overall key actions for managing PUE: i) Improving the efficiency of fertilizer applications, ii) a better understanding of P cycling in cropping systems, and iii) a better understanding of the interactions between soil physics, chemistry and biology, coupled with plant traits. Research and experimentation (Blackwell et al., 2019; Chowdhury and Zhang, 2021; Zou et al., 2022; Peñuelas and Sardans, 2022) have developed and evaluated several approaches to improve PUE, specifically in cereal-based cropping systems:
- Improving P fertilizer recommendations
- Managing soil pH to optimize soil P availability
- Utilizing legacy P
- Developing plant traits for PUE
- Increasing plant accessibility to P sources
- Developing innovative P sources, management techniques and biotechnologies
- Minimizing soil P losses by erosion and runoff
- Developing P-efficient cropping systems through novel crop combinations
- improving management of low PUE crops
- Optimizing farm size and mechanization
- Promoting precision ag and P budgeting
- Increasing recycling from manure and waste
Partial productivity factor (PPF, ratio of grain yield to nutrient application rate) and partial nutrient balance (PNB, nutrient removal to nutrient application ratio) have been proposed among the nutrient efficiency indicators (Dobermann, 2007; Fixen et al., 2015). Figure 12 depicts the relationships between grain yield and P rate (PPF-P) for maize, rice, soybean and wheat for the main world grain producing countries. Also, the continuous orange lines indicate the P rates needed to maintain neutral P balances; this is PNB-P of 1 (removal equal to application). Values of P rate were drafted from IFA (2022) and correspond to the year 2018, while grain yields were obtained from FAOSTAT considering averages of 2017, 2018, and 2019.
As expected, at the world level, P rates exceed P removal resulting in P buildup, which would add to legacy P. These surpluses depend on the crop but are more generalized at Asia (China, India, Pakistan, Vietnam, Bangladesh) and Brazil. In the other hand, PNB-P are negative for Europe (France, Germany, and Ukraine) and Argentina. These differences among countries reveal differences in soil fertility status and previous P fertilizer use, as well as P fertilizer use efficiencies for the different cropping systems because of soil type and/or management.
For Africa, data is available for seven countries, and it shows PNB-P generally greater than 1 indicating removal > application for the four crops, with extremes of 5.2 and 8.2 for maize and rice at Nigeria (Table 4). Morocco and Burkina Faso show low PNB-P between 0.1 and 0.5 for maize, with P application largely exceeding P removal
Some special considerations at different world regions from previous studies and reviews are:
- North America
Estimates the life-cycle PUE of the US food production and consumption system show that only 15% of the P extracted for the provision of food is eventually ingested by humans, with the rest being lost to the environment along the supply-chain (Suh and Yee, 2011). Most losses occur at livestock production and crop cultivation (66% of total P), followed by mining and fertilizer manufacturing (13% of total P losses) and finally household and food processing Improving (6% of total P losses). Yields of livestock and crop cultivation processes are key to improve life-cycle P use-efficiency. However, these results highlight the need of an integrated effort along the life cycle for improving PUE.
- South America
Brazil is a top world agricultural producer which largely depends on P fertilizer imports. High P-fixing soils limit PUE to low values (30%) and resulted in high application P rates which, along the years, build considerable amount of “Legacy P” (Roy et al., 2016; Raniro et al., 2023). Thus, the improvement of fertilizer P efficiency and the exploration of legacy P are keys in developing and expanding the agricultural potential of the country (Pavinato et al., 2020).
On the other hand, Argentina has historically used low rates of P in field crops with negative partial P balances which resulted in high PUE but at the expense of soil P degradation in many of the main producing areas of the Pampas (Lun et al., 2018; Sainz Rozas et al., 2019; García et al., 2024).
- Africa
Fertilizer use efficiency is generally low at SSA resulting in low yields and poor economic returns (Vanlauwe et al., 2023). Low nutrient use efficiency is related to many soil factors such as pH, organic matter, texture, and water availability; but management factors seem to be the most significant ones: variety, weed management, crop rotation, and organic inputs, among others.
- Europe
For Europe, Schroder et al. (2011) have estimated P surpluses of 0 to 20 kg P/ha, depending on the country. These authors proposed to reduce the amounts of P applied in agriculture through the improvement of fertilization management, and modifying livestock densities and diets. They proposed compensating P extraction from agricultural land using P recovered from waste.
- Asia
Ma et al. (2011) reported that by 2004, 80% of the total P inputs to wheat, maize and rice at China came from fertilizers. Harvests accounted for approximately 42%, 69% and 52% of total P inputs, resulting in fertilizer P losses of 29.4, 13.6, and 21.3 kg P/ha. The low fertilizer PUE resulted in high P accumulation in soil and losses to the environment.
- Oceania
Cordell et al. (2013) indicated that despite being a net food exporter, Australia is a net P importer as soils are naturally P deficient. These authors also pointed to substantial losses and inefficiencies at all process in the P chain.
Weaver and Wong (2011) analyzed the P balance of farming systems across southern Australia. The median output/input ratio was of 0.48, with positive P balance of 6.1 kg P ha−1 yr−1 (P application>P removal). Half of the samples evaluated showed more important constraints such as soil acidity, and potassium and sulfur deficiency, which might be attended to improve PUE.
A GRDC-IPNI project (Norton, 2016), estimated nutrient performance indicators for 514 fields of farms at southeastern Australia. The output/input ratio (or partial nutrient balance) for P averaged 0.69 with 80% of fields under positive P balance (P application>P removal) and varying from 0.70 to 0.97 in four different agroecological zones.
4. Fertilizer Best Management Practices for P
4.1. What Are BMPs?
There are many definitions for best management practices (BMPs):
- “The goal of fertilizer best management practices is to match nutrient supply with crop requirements to optimize yield while minimizing nutrient losses to the environment” (IFA)
- “BMPs can be described as research proven and farm-tested practices that optimize production potential, input efficiency, and environmental protection” (Roberts and Johnston, 2015).
- “Practices that will ensure the production of safe and high-quality products, animals and plants, while preserving the environment and contributing to the social well-being of society” (Science Direct)
- “Site-specific, economically feasible practices that farmers use to maintain agricultural production while considering environmental and public health impacts. BMPs are industry-driven and are intended to provide guidance for farmers, not to be regulatory” ( Google AI)
- “An industry driven effort to maintain agricultural production in a profitable, environmentally sensitive and sustainable manner. BMPs are not meant to be regulatory as every farm operation and site is different and may require special practices. But BMPs are meant to provide guidance as to practices that farmers can strive towards implementing on their farms” (University of Massachussets)
- “Methods and practices designed to reduce or prevent soil and water pollution without affecting farm productivity” (Drizo et al., 2022).
- “Farming methods that are designed to minimize adverse environmental effects while maintaining agricultural production. Nutrient BMPs, referred to as the 4Rs—Right rate, Right timing, Right source, and Right placement—should be used on all cropping systems and is the first line of defense. Additional BMPs should be used to control nutrients as they move from application area to the water resource. Put together, these BMPs form a system to avoid, control, and trap nutrients” (North Carolina State University)
For this paper, P BMPs are defined as scientifically evidence-based practices and/or combination of practices which optimize P use efficiency and effectiveness in a profitable, environmentally sound and sustainable way in any given cereal-based cropping system.
4.2. Approaches for BMPs in Field Crop Systems
BMPs have been approached by different agendas like the 4R (four Rights), Integrated Plant Nutrient Management (IPNM), Site-Specific Nutrient Management (SSNM), and, in general terms, innovative fertilization/fertilizer technologies.
The 4R framework describes proper nutrient management as the optimum combination of the right source at the right rate, right time, and right placement for each field (IPNI, 2012). The 4Rs are based on scientific principles: nutrient management driven by scientific evidence. Source involves the identification of the specific deficient nutrient, and it is the initial step. Rate would depend on the soil supply capacity and crop requirement according to yield goal. Time and placement are quite dependent on nutrient dynamics in the soil-plant system and the nutrient source characteristics. 4R for P stewardship will be further discussed in the following sections.
IPNM has been defined as “an approach through which the management of plant nutrition and soil fertility in cropping and farming systems is adapted to site characteristic and to locally available resources” (Dudal and Roy, 1995). This approach promotes the combination of mineral fertilizers with locally available organic sources. IPNM offers alternative sources to supply plants with enough nutrients, providing for improved soil and environmental health under appropriate soil nutrient balance, through mineral, organic, and biofertilizers (Selim, 2020; Amanullah et al., 2024).
IPNM under different cropping systems have been thoroughly discussed in the literature. Paramesh et al. (2023) reviewed global data comparing conventional management and IPNM reporting a 1.3% reduction in methane emission and increases in crop yields of 1.3% to 66.5% across major cropping systems. Overall, IPNM improved soil health and crop productivity by increasing soil aggregation, water-holding capacity, porosity and microbiota.
In Pakistan, Jamal et al. (2023) found that the combination of manure at a rate of 10 t ha-1 plus 26 kg P ha-1 of fertilizer P was the optimum combination to increase wheat yield, and improve soil organic matter and residual soil P. In Egypt, Abdo AI et al. (2022) evaluate the use of growth stimulants in combination with mineral fertilizers and found that the mineral NPK rate can be reduced by 25% with biofertilizers achieving similar yields than with the recommended NPK rate under arid and semi-arid conditions.
In SSA, integrated soil fertility management (ISFM), an alternative name for IPNM, seems to be the way forward to a sustainable agriculture by combining mineral and organic nutrient sources (Vanlauwe et al., 2023). Fertilizer use increases yields, but its agronomic efficiency is frequently low. Organic sources increase soil organic carbon and agronomic efficiency but not yield as it happens with mineral fertilization. Fertilizer use would constitute the entry point for a change and intensification of smallholder agriculture in SSA. An ISFM approach, including fertilizer and other locally adapted soil and fertility management practices, would reverse soil health decline as knowledge is currently available to develop site-specific recommendations in the region. Njoroge et al. (2019) showed a strong effect of past animal manure application on maize yield response to fertilizer application at 23 farms over seven consecutive cropping seasons in the Sidindi area of Western Kenya.
SSNM was originally developed for generating field-specific fertilizer recommendations for rice in Asia in the early 90s (Dobermann et al., 1998; Dobermann and Fairhurst, 2000) and successfully expanded into other regions such as SSA (Chivenge et al., 2022) and India (Khurana et al., 2008).
It is based on the estimation of fertilizer requirements for a specific field and crop from the omission plot technique (http://www.knowledgebank.irri.org/training/fact-sheets/nutrient-management/nutrient-omission-plots). Briefly, the process involves 1) estimation of demand according to attainable yield, 2) estimation of indigenous nutrient supply (INS, soil availability plus nutrients in crops residues plus biological N fixation), 3) estimation of fertilizer recovery, 4) calculate nutrient rates from the difference between the amount of nutrients required by the crop and the INS, and 5) decide number and timing of applications (Dobermann and Fairhurst, 2000; Dobermann and Witt, 2004; Buresh and Witt, 2007).
Chivenge et al. (2022) indicated that the SSNM approach increases yield, profitability, and nutrient use efficiency in SSA. Yield gains of rice and maize with SSNM averaged 24% and 69% when compared to the farmer practice, respectively, or 11% and 4% when compared to local general fertilizer recommendations. These authors foresee the need for more extensive field evaluation to quantify the broader benefits of the SSNM approach in diverse farming systems and environments, especially for rice.
Nutrient Expert® (NE) is a nutrient decision support software that was developed from the success of SSNM in field crops of southeastern Asia (Pampolino et al., 2012) and rapidly expanded in China, India, and SSA (Dutta et al, 2014; Xu et al., 2015; Zhang et al., 2018; Chivenge et al., 2022). NE provides crop advisers with a simpler and faster way to develop fertilizer recommendations. It considers main factors affecting nutrient management recommendations and uses a systematic method of compiling information for developing a local recommendation. The parameters needed in SSNM can be estimated through proxy information when using NE, allowing crop advisors to develop local fertilizer guidelines without data from field trials. Evaluation of NE have shown success in optimizing nutrient rates and management as well as reducing greenhouse gas emissions in studies at the Indo-Gangetic Plains of India (Sapkota et al., 2021) and Nigeria (Maertens et al, 2023).
4.3. BMPs for Fertilizer P
Many authors have presented and discussed BMPs for P in agricultural production, either looking at productivity and/or environmental impacts. According to Roberts and Johnston (2015), “Improvement of fertilizer P use efficiency and effectiveness is best achieved through the implementation of best management practices (BMPs) within the context of 4R Nutrient Stewardship”.
Sustainable P management in agriculture include several practices related to fertilizer management (fertilizer type, placement, time, and rate), to soil management (soil testing, erosion reduction, improved soil characteristics); to crop management (crop and variety/hybrid selection, use of microbial inoculants), and many others (IPNI, 2012; Cordell and White, 2013; Grant and Flaten, 2019; Singh et al., 2020; Drizo et al., 2022).
Schoumans et al. (2015) proposed a framework of 5R stewardship to help improve P use efficiency in Europe: Re-align P inputs, Reduce P losses, Recycle P in bioresources, Recover P in wastes, and Redefine P in food systems. All 5Rs relate to BMPs at the field level for cereal-based cropping systems.
Bruulsema (2017) reported a science-based compilation of 4Rs practices for P management in North America. A series of practices for each R (source, rate, time, placement), classified as basic, intermediate and advanced, were proposed for five regions/cropping systems across US and Canada.
The EU Commission (2018) emphasizes Best Environmental Management Practices regarding nutrient management:
- o
- Field nutrient budgeting.
- o
- Crop rotation for efficient nutrient cycling (legumes).
- o
- Synchronize nutrient supply with plant demand.
- o
- Precise application of nutrients.
- o
- Select lower impact fertilizers.
Stamm et al. (2022) highlight the importance of BMP to undertake “the P issue” at Europe. These authors presented the outcomes of the 2019 P International Workshop which included the efficient use of P in agroecosystems with other critical issues related to sustainable P management. Important advances on the awareness of P as finite mineable resource, technologies to recycle P, and legislation towards a circular P economy were recognized. However, critical deficits were identified: handling of legacy P, climate change effects on ecosystem P cycling, or up-scaling recycling models to working business models. There is a need for more transdisciplinary networks, involving all stakeholders, to reduce the science-practice/policy gap.
Fertilizer P BMPs are not restricted to the fertilizer management itself but also included aspects of crop management, crop rotation and intensity of production, soil acidity management, interactions between P and other nutrients, soil conservation tillage system, risk of off-site P loss, and economic and logistical constraints (farm size and tenure) (Djodjic et al., 2005; Sharpley et al., 2006; Bruulsema et al., 2019; Grant and Flaten, 2019; Tiecher et al., 2023). The 4Rs of P management should be framed at policy, regional, and farm levels including all stakeholders involved in the full agricultural value process.
Bruulsema et al. (2019) highlight the significance of 4R nutrient management addressing three examples of how 4R P management might apply globally by 1) improving multiple ecosystem services, 2) evaluating and managing legacy P, and 3) the engagement of a wide number of scientists and practitioners as well as multiple disciplines. Main conclusions focused on linking 4Rs of P management to indicators and metrics, sharing open and transparent data on soil tests as a central practice for P management in reusing P surpluses (legacy P at US, Europe, Brazil), and considering not just the farm level but the whole agricultural food chain.
Singh et al. (2020) recently reviewed fertilizer P BMPs looking at P losses in agroecosystems in the midwestern US. Cover crops, reduced tillage, saturated buffers, and constructed wetlands have been the most evaluated practices areas. Additional research is necessary on developing/updating of P fertilizer recommendations, long-term impacts of P stratification, models to identify critical areas for site-specific recommendations, soil pH modifiers and enhanced-efficiency fertilizers effectiveness, and watershed-scale studies to monitor long-term P fluxes.
Drizo et al. (2022) listed BMPs Nutrient Reduction, Recycling and Recovery from Agricultural Runoff for in the northern EU. While they listed 24 BMPs, they found inconsistency of data and a knowledge gap on the effectiveness of BMPs in nutrient reduction, their potential for recycling and recovery, and their operation and maintenance requirements and costs.
Work by Tiecher et al. (2023) in a subtropical oxisol at southern Brazil, showed that correcting soil acidity is a crucial step to ensure optimum P use. The effect was further enhanced by combining liming with no-tillage.
4.4. Four Rs for Phosphorus: Right Source, Right Rate, Right Place, Right Time
BMPs for P fertilization would be addressed following the 4R framework, applying the right source at the right rate, at the right place and at the right time (IPNI, 2012). Table 5 compiles scientific principles that support each one of the 4R.
4.4.1. Right Source
Rock phosphate (RP) is the primary raw material used in the manufacturing of P fertilizers such as triple superphosphate (TSP), single superphosphate (SSP), diammonium phosphate (DAP), and monoammonium phosphate (MAP) (Argus-IFA, 2023). RP is mined at sedimentary deposits which represent approximately 80% of P world production (Morocco, China, United States, and Russia). Igneous P rocks are also used in P fertilizer production at Russia, South Africa, Brazil, Finland, and Zimbawe (Stewart et al., 2005b; Whiters et al., 2018).
Rock Phosphates
Rock phosphates might be used directly, especially in soils of pH lower than 6, and there is a large set of data showing its efficiency in different cropping systems across the world (Chien et al, 2009). It is usually of low effectiveness in alkaline or near-neutral soils.
The agronomic effectiveness of rock phosphates depends on the reactivity of the rock, which varies according to their origin; soil properties; crop and management practices; and climate (Zapata and Roy, 2004; Chien et al., 2009). Vilela de Resende et al. (2006) found similar performances comparing two soluble P sources and two reactive rock phosphates under different application methods in an oxisol at the Cerrado region of Brazil. The two rock phosphates presented the most favorable economic return. In the other hand, for oxisols of southern Brazil, Amorim et al. (2024) reported that rock phosphate would not be recommended for P-deficient soils, as its gradual dissolution would not be sufficient to meet crop requirements. However, rock phosphate could be an alternative source to use in high-P conditions for replacement of P exported by crops. These authors state the opportunity to maintain high crop yields through residual P accumulation in these soils under no-tillage. Residual effects of rock phosphates would be significant and would result in efficiencies similar to water-soluble P fertilizers (Prochnow et al., 2002; Chien et al., 2009).
Mixes of rock phosphate with water-soluble P fertilizers or acidulation of rock phosphate with water-soluble P is an option for rocks of low solubility. Non-conventional acidulated phosphate fertilizers from P impurity compounds of acidulated fertilizers have been successful under low pH conditions (Prochnow et al., 2008).
Conventional Commercial P Fertilizers
There is ample availability of conventional commercial P fertilizers, which allows to select according to the price per unit of P, the efficiency of each source according to the environmental condition of application, the local supply, and the logistics of storage and application (Table 6). Most commercial phosphate fertilizers are manufactured from the reaction of phosphate rock with acids such as sulfuric acid that solubilize the P in the rock. These processes allow the production of phosphoric acid and soluble fertilizers such as TSP, SSP, DAP and MAP. The solubility in water of STP, SSP, DAP and MAP fertilizers is 85-95%, 100% for APP and 0-10% for phosphate rock (Leikam et al., 1991), although they might present small differences in the timing of soluble P release (Nash et al., 2003). Recent studies have demonstrated that fertilizers with a minimum of 60% water-soluble P might be effective in achieving 90% of the maximum crop yield (Prochnow et al., 2008; IPNI, 2012).
The production of ammonium polyphosphates (APP) requires the dehydration and polymerization of phosphoric acid prior to ammonification. The term polyphosphate refers to two or more combined orthophosphate ions. This polymerization, or chain, is complexed by the dehydration of phosphoric acid. Liquid APPs present 70-75% of their P material as polyphosphates, and the remainder as orthophosphate. Before plants can utilize polyphosphate, it must be converted to orthophosphate via a hydrolysis reaction; this transformation occurs rapidly in soils, therefore poly- and orthophosphates are sources of equivalent agronomic value (Leikam et al., 1991). The advantage of APP is the ability to chelate, whereby high concentrations of micronutrients can be maintained in solution. Polyphosphates are also available in solid form.
Generally, water soluble phosphate sources (MAP, DAP, TSP, SSP and APP) show minor differences in PUE when applied at equivalent P rates and comparable application methods; the best source is determined by factors such as soil type and pH, product availability, preference, sales service, and of course, price per unit of P (Fixen, 1989; Hedley and Mclaughlin, 2005; Gomez de Souza et al., 2010; Grant and Flaten, 2019; Zhou et al., 2022; Nakayama et al., 2024). In several situations, differences among these P sources would be attributed to other accompanying nutrients such as N, S or Ca (Meyer et al., 2023).
Under adequate to high soil P tests, Nakayama et al. (2024) did not find differences in grain P removal and soybean yields irrespectively of source, either MAP, DAP or TSP in Illinois (USA). They indicate that substituting commonly applied MAP and DAP with TSP would contribute to reducing off-farm nitrate-N losses by eliminating the co-application of N.
Some differences may occur between DAP and MAP due to the potential for damage due to the NH3 released when fertilizers are placed very close to the seed at the time of sowing (See application method). DAP may present a greater potential for damage than MAP in calcareous or alkaline soils (Leikam et al., 1991). Another difference between these sources is the initial pH in the reaction with the soil, with DAP pH is close to 8, while with MAP it is 3.5 (Lindsay et al., 1962), but this situation would vary upon soil type (Meyer et al., 2023).
Fluid P fertilizers allow for more diffusion from the application band than granular P fertilizers. This would be an advantage in calcareous soils by keeping P concentrations low and thus reducing Ca-P precipitation (Holloway et al., 2001; Lombi et al., 2004, 2005), but a disadvantage in acidic soils as soluble P would be largely adsorbed and precipitate as Al-P and Fe-P (Montalvo et al., 2014).
Pierzynski and Hettiarachchi (2018) evaluated the mobility of granular and fluid P fertilizers for three acid soils (Oxisol, Ultisol, and Andisol) and found that mobility was restricted to 13.75 mm in all three soils for granular fertilizers but expanded towards 25 mm for fluid fertilizers. Lability depended on soil type, there were no differences among granular and fluid fertilizers for the Oxisol, while the fluid fertilizer increase lability in the Andisol but decreased in the Ultisol. Thus, the effects of fertilizer types and formulations were highly variable in these acid soils.
Dry Bulk Blends
Compatibility of physical mixtures, or dry bulk blends, is limited between urea and superphosphates or between DAP and superphosphates (incompatible with high free moisture content). When the moisture content of urea and superphosphates is low and/or the mixture is bagged, the reaction occurs more slowly and does not represent a serious problem. A practical recommendation is to ensure that the mixtures are applied as soon as possible after receiving them in the field, avoiding the product becoming wet, altering its properties and agronomic performance.
Organic Wastes
Organic wastes, products of recycling of ag operations, industry or even urban waste processing, are alternative sources of P for soils and crops. Advanced P recovery might support P circularity and reduce depletion of rock phosphate by supplying P fertilizers in areas of high P dissipation such as Europe (Tonini et al., 2019).
Manure could be a significant source of P. P concentration vary across manure types according to animal type, diet, and water consumption; and manure storage, management, and formulation (Withers et al., 2015; Rayne and Aula, 2020). For different animal types and formulations, Rayne and Aula (2020) indicate a range of total P concentration of 0.035% to 1.5%. Manure application impact on soil P availability varies with soil conditions (pH, organic matter, and texture), animal type and manure management. In several cases, long-term manure application results in build-up of soil P (Sharpley et al., 2004), and concomitant environmental problems, as application is recommended on an N-need basis considering that manure N:P ratios are narrow. Chowdhury and Zhang (2021) observed a high potential for improving PUE in the agricultural production system of China, Bangladesh and India, by reducing the use of mineral P fertilizers and enhancing the use of livestock manure through systematic recovery and recycling. However, to prevent the accumulation of harmful substances in soils and crops, organic waste should be analyzed for potential contaminants before application.
Biosolids from wastewater treatment are a valuable alternative source for P in agriculture (Torri et al., 2017). Many technologies have been identified to remove and recover P from wastewater: chemical precipitation, biological P removal, crystallization, advanced chemical precipitation and nutrient removal, ion exchange, and other wastewater and sludge-based methods (Morse et al., 1998). Products of these treatments are P-metal salts, sludge with biologically bound P, Ca phosphates, chemical sludges, phosphate slurry, struvite, and others.
Struvite (MgNH4PO4 • 6H2O) is a recycled P fertilizer of low water solubility which can be formed from manure and wastewater precipitates. Research has shown its potential use as P source for crops (Achat et al., 2014; Talboys et al., 2016; Hertzberger et al.; 2020). Wang et al. (2023) reported that substituting conventional P fertilizer with struvite in rice–wheat rotation system in the lower region of Yangtze River in China could increase the rice and wheat yield and N and P use efficiency and thus reduce the overall impact of conventional nutrient management. Chatterjee et al. (2024) also found that struvite would be an efficient P source for adequate to high P soils at the Corn Belt of US. Hertzberger et al. (2020) indicate that struvite efficacy increases at pH lower than 6 and that its solubility depends on particle size. They recommend using struvite in blends with conventional fertilizers which would reduce P losses and improve the synchronization of P supply and plant demand. Kokulan et al. (2024) reported the potential of struvite and struvite/MAP blends for maize crops at Ontario (Canada), reaching similar yields that the conventional MAP fertilization and reducing environmental P losses.
Annual P excreted through human waste is estimated at 3.4 Mt of P with about 50% in urine and 50% in feces (Mihelcic et al., 2011). P present in urine represents approximately 11% of the global P demand (Martin et al., 2020). Bonvin et al. (2015) and Martin et al. (2020) showed high P recoveries, like mineral fertilizers, for nitrified urine fertilizer and struvite derived from urine. However, further research should be done under different treatments and conditions.
Stutter (2015) evaluated seven alternative P sources: sewage sludge, anaerobic digestate, chicken manure, food waste compost, seaweed, green compost and biochar. The variations in nutrient contents, forms, and C:N and C:P stoichiometry among the seven materials have consequences for their efficiency. His conclusion is that alternative ‘waste’ materials with different compositions as replacement of P fertilizers need to be characterized not only for agronomic productivity but also for control environmental P losses to waters.
Mineral Wastes
Phosphogypsum (PG) is a by-product of the phosphate fertilizer industry which results from the production of phosphoric acid from rock phosphate. It is constituted of calcium sulfate and presents P, magnesium, manganese, fluor, and several other elements in minor concentrations, including heavy metals and radioactive elements (Korcak, 1998). It is produced in large quantities (300 Mt/year, Outbakat et al., 2023). Only 15% of PG is recycled for use in road construction, building materials and agriculture, its use in agriculture has been limited because of the presence of radioactive elements. It might be used as an amendment to treat saline or sodic soils, as well as neutralize acidic subsoils and as a fertilizer (Argus-IFA, 2023). Use of PG to improve subsurface soil acidity has been documented in Brazil where PG shows low radioactive elements concentrations (Prochnow et al., 2016). Also in Russia, technologies have allowed the application of PG to improve crop productivity in cropping systems with sodium-affected or compacted soils; plus, its value as multi-nutrient fertilizer, component of organo-mineral fertilizers, and for remediation of oil-contaminated soils (Kalinitchenko and Nosov, 2019).
Biofertilizers
Microorganisms in the rhizosphere, including bacteria and fungi, contribute to plant growth promotion through enhanced availability of nutrients and phytohormone production (direct mechanisms) and/or suppression of diseases by biocontrol agents, amelioration of abiotic stresses and bioremediation of pollutants and contaminants (indirect mechanisms) (Miransari, 2011; Kumar et al., 2022). Beneficial microorganisms associated with plant roots would supply P through solubilization and/or mobilization of soil P. Shah et al. (2021) cited research that indicate reductions of 25% to 50% of P fertilizer use when using P solubilizing bacteria (PSB) alone or combined with other plant growth promoting rhizobacteria (PGPR) or arbuscular mycorrhizal fungi (AMF). The authors indicate PGPR solubilize insoluble soil P by producing organic acids (gluconic and keto gluconic acids) which chelate cations bound to phosphate.
The capacity of solubilizing P has been identified at several bacteria and fungi genera: Pseudomonas, Bacillus, Agrobacterium, Rhizobium, Enterobacter, Penicillum, and Aspergillus, among others (Macik et al., 2020; Mardamootoo et al., 2021; Vera-Morales et al., 2023). Solubilization mechanisms involve the secretion of low molecular weight organic acids and mineral dissolving compounds, and the release of extracellular enzymes and phosphate during mineralization. These mechanisms allow for lower rhizosphere pH, the chelation of cations such as Al, Fe, and Ca, the formation of soluble complexes with these cations, the solubilization of organic P compounds, and the synthesis of phosphatase enzymes (Macik et al., 2020). Phosphorus mobilizing biofertilizers includes mycorrhizal fungi which increase P uptake by a symbiotic association with plants (Miransari, 2011). Covacevich et al. (2007) found that indigenous arbuscular mycorrhizal colonization of wheat roots was modulated by soil available P but not by plant P status. They found that the intensity of arbuscular mycorrhizal colonization reduced as soil Bray-P increased from 6 to 27 mg P kg-1 and that 15.5 mg P kg-1 level was the highest soil P value that ensures high wheat yield with an indigenous mycorrhizal formation that efficiently improves wheat growth and soil stability.
Biofertilizers might be applied through seed inoculation, soil application, and foliar treatment, either as solid or liquid formulations. Limitations on the use of biofertilizers include restraints at the manufacturing step (contamination, effective strain, carrier material, storage), the success of the inoculation (soil condition, competition to inoculated strain, plant and inoculant abiotic stress), and even the lack of regulations and safety standards (Kumar et al., 2022).
Innovative Fertilizer P Technologies
Guelfi et al. (2022) provides a detailed discussion on innovative fertilizer P technologies that would improve PUE. These innovative P sources should be thoroughly tested under laboratory, greenhouse, and field conditions for a scientifically based recommendation looking for increased profitability and reduced environmental impact. Alternative P fertilizer sources include:
- Fixation-inhibitor fertilizers: fertilizers with additives to reduce reactions of precipitation and adsorption of P. They could be classified as pH-modifiers, cation-sequestering agents or blockers
- Synergistic phosphate fertilizers: conventional P fertilizers with the addition of other nutrients, microorganisms, nanoparticles, or biostimulants.
- Chemically modified fertilizers: conventional P sources with changed solubility and/or chemical form at the production process by physical, chemical, or physical–chemical reactions that modify the interaction of P with other chemical compounds
- Controlled-release fertilizers: conventional fertilizers with coating which serve as a physical barrier and control the flow by diffusion
- Blends and multifunctional fertilizers: physical blend of conventional phosphate fertilizer granules and those that have some type of technology, as the indicated above.
Chien et al. (2009) discussed alternative coatings, additives and forms that might improve PUE for the conventional water-soluble sources: 1) coatings with polymers to slow down the release pf P from the fertilizer granule, 2) additives to chelate Ca, Al, and Fe to reduce formation of insoluble phosphates, and 3) use of liquid MAP and DAP in calcareous soils.
Chien et al. (2014) reviewed the research and information on the use of maleic-itaconic acid as additive by coating water-soluble P fertilizers which would reduce the conversion of soluble P forms to insoluble ones. Their review indicates that “the amount of the copolymer applied with DAP based on the commercial-use recommendation is small to have any significant effect on reducing the level of soil P-retention capacity even in a soil with low P-retention capacity treated with high P rate, either in soils dominated by Al/Fe oxides or by Ca under alkaline conditions”. Similar conclusions were obtained by Degryse et al. (2013). However, Hopkins et al. (2018) reviewed a set of 503 field experiments finding an overall response of 2.1% yield-increase, and of 5.8% in responsive sites (n=116), stressing the importance to test enhanced-efficiency fertilizers under responsive environments. Also, Dunn and Stevens (2008) noted a 5% increase in rice yield by polymer coating TSP in responsive P sites at Mississippi (USA). Pierzynski and Hettiarachchi (2018) found that the addition of an additive, such as the maleic-itaconic acid copolymer, did not influenced mobility in three acid soils (Oxisol, Ultisol, and Andisol). The additive did not affected lability in the Oxisol or Andisol but increased in the Ultisol.
Weeks and Hettiarachchi (2019) discussed research related to innovative commercial P fertilizers. These authors proposed a classification of P sources according to the mechanism of action (Figure 13). Alternative sources are those P species different from orthophosphate. The slow releasers limit the association of P with soil components by reducing the physical contact with soil colloids and/or delaying the release of P into the soil solution. Blockers are sources that disrupt P precipitation or form inner-sphere complexes. Inducers include compounds that do not contain P but stimulate plant-microbe P acquisition.
Among the alternative P sources, phosphite might be absorbed by plants but it does not replace orthophosphate in metabolic functions and failed to meet P needs under P deficient conditions. It has been reported as an effective fungicide. Opportunities for phosphite use as P source arise from biotechnology, by introducing genes that allow plants to oxidize phosphite into phosphate. Benefits of phosphite use would extend from recycling of waste of the chemical and automotive industry to its use as fungicide and weed suppressor (López-Arredondo and Herrera-Estrella, 2012).
Coating of granular P fertilizers is a traditional method which seek to slow the dissolution of the granule in its first stages and extend the release of P along the crop growing season. Coatings include polymers, special modifications and pH modifiers such as elemental sulfur, ammonium slats, or silicate compounds (Mc Laughlin et al., 2011).
Among the scaffolds, nanofertilizers have been cited as efficient P sources (Seleiman et al., 2021; Avsar, 2022). Nanofertilizers present a large surface area and slow nutrient release which might reduce P losses and improve grain yields and PUE (Liu and Lal, 2014; Seleiman et al., 2021).
Blockers would impair fixation by polyvalent
cations such as Ca, Fe or Al, and then improve P lability. However, current evidence of their effectiveness is mixed with both positive and negative results (Mc Laughlin et al., 2011; Chien et al., 2014; Hopkins et al., 2018).
Among possible inducers, zeolites are natural crystalline aluminosilicates which might improve use efficiency of P and other nutrients. Zeolites might improve soil chemical and physical properties, such as saturated hydraulic conductivity, infiltration rate, cation exchange capacity, and water-holding capacity (Cataldo et al., 2021).
4.4.2. Right Rate
Applying the right P rate is crucial not only for the current crop but also for subsequent crops, due to P residuality, and for environmental protection, as excessive P application can lead to soil P buildup and losses to surface waters (Djodjic et al., 2005).
The focus of P rate recommendations varied across regions, countries, and local cropping systems. In many cropping systems the priority is to secure optimal P levels for crop yields, while in other cases the attention is centered on mitigating P losses to surface waters. These situations are related to soil P levels, countries in developing economies with low soil P status (Africa, Asia, Latin America) would follow the first option, while developed economies under high soil P status (Europe, North America), would focus on the second option (Drohan et a., 2019).
Approaches for deciding P rates are multiple, but they are typically based on soil testing, plant analysis, and specific methodologies such as QUEFTS (Quantitative Evaluation of the Native Fertility of Tropical Soils) model and others.
Soil Testing
Commonly, soil P tests are used to determine plant P availability (Beegle, 2005; Moody et al., 2013). The development of soil analysis for fertility diagnosis purposes includes the following phases: soil sampling, selection of extractant and analysis methodology, correlation, calibration, interpretation, and recommendation (Brown et al., 1987; Fixen and Grove, 1990; Havlin et al., 2005). Once developed, the implementation of fertility diagnosis programs based on soil analysis involves three steps, associated with the six phases indicated for their development:
- Soil sampling,
- Analysis,
- Interpretation and recommendation.
These three steps must strictly follow the protocols defined during the development of the program since there are numerous sources of variability and potential errors in each one of them.
Soil sampling is frequently the most critical step in the program because of high soil P variability (Kitchen et al., 1990; Beegle, 2005). Several recommendations and sampling schemes have been proposed to obtain a representative soil sample of a field (Mallarino and Wittry, 2004; Beegle, 2005), but the main points are:
- identify heterogenous areas within the field (cropping history, topography, others),
- collect an adequate number of sub-samples per sample (at least 10-20 cores),
- collect all sub-samples at the sampling depth recommended in the program,
- avoid sampling near fences or forests,
- homogenize the sample,
- properly preserve the samples until they reach the laboratory.
Soil analysis usually involves a rapid chemical and/or biochemical extraction (Sims, 2000; Havlin et al., 2005). The amount of P extracted is only a proportion of the total amount of P in the soil, not equal to the amount of nutrient absorbed by the crop but closely related to it (Moody et al., 2013). Therefore, the soil analysis is only an “index of P availability” for the crop. The term “available” is often used, but the fraction determined usually represents only a P fraction that is in rapid equilibrium with the soil solution and can be absorbed by plants. The objectives of soil analysis for diagnostic purposes are: 1) to provide an index of P availability in the soil, 2) to predict the probability of response to fertilization, and 3) to provide the basis for the development of fertilization recommendations (Beegle, 2005; Havlin et al., 2005). These tests use different extractants adapted to regional/local soil conditions (soil pH, texture, mineralogy) (Table 7).
Research, through field experimentation at the regional/local level, calibrates crop yield vs. soil P test to provide critical thresholds/ranges below which there is a high probability of profitable response and above which the probability of profitable response is unlikely (Table 8). The relationship of soil P tests and grain yield is affected by several environmental and crop and soil management conditions (soil type, organic matter, texture, pH, minerology, water availability, crop variety/hybrid, planting date), thus it has been suggested to use a critical range rather than a critical value (Conyers et al., 2013; Johnston and Poulton, 2019). Also, critical values and ranges would vary even for a same P extractant depending on soil sampling depth, sample management, laboratory processing, soil properties).
It should be noted that these critical thresholds are independent of the expected crop yield (Bell et al., 2013). For example, a wheat crop has the same threshold with an expected yield of 3 or of 5 t/ha. This is because of the dynamics of soil P (a nutrient of low mobility) and because higher-yielding plants have a greater capacity to explore the soil profile. Because of the low mobility of P in the soil, the roots might absorb soil P at 3 – 5 mm from the root surface. Thus, only a small proportion of soil P can be absorbed, since the limiting factor is the mobility of the element and the rate of root elongation. A larger plant has a greater root system which explores a larger volume of soil; therefore, its P needs might be fulfilled with the same level of soil “available” P as a smaller plant. This constitutes a fundamental difference with the philosophy of nitrogen fertilization (N is a mobile nutrient), which depends on the expected yield.
Values of P extracted through the different methods are related under specific situations. As an example, Mallarino (2003) found that the critical concentration ranges for Mehlich-3 and Bray soil P tests were similar for acid to neutral soils at Iowa in the US Corn Belt. However, determinations of P extracted by Mehlich-3 either by colorimetric method or inductive coupled plasma (ICP) differ in interpretation.
Research has amply discussed the fit and bias of models that describe the grain yield-soil P test relationship, and especially in estimating the critical values and ranges (Conyers et al., 2013; Pearce et al., 2022). Models included linear- and quadratic-plateau, Mitscherlich exponential, the Cate-Nelson approach, and the arcsine-log calibration curve (ALCC) (Dahnke and Olson, 1990; Mallarino and Blackmer, 1992; Dyson and Conyers, 2013; Correndo et al., 2017; Bolster et al., 2023; Correndo et al., 2023).
Culman et al. (2023) evaluated 457 maize, wheat and soybean trials at Ohio (US) and could not identified robust critical soil test values because of lack of model fit and model bias. Thus, they suggested to arbitrary classified soil test according to probabilities of crop response indicating a critical soil test value of 20 mg kg-1 below which there is a high probability of response. This is an interesting alternative for the users, farmers or consultants, as probabilities explain the variability observed at the field, there are always responses at high soil P tests and lack of response at low soil P tests.
For China, Bai et al. (2013) reported critical Olsen-P values for crop yields from 11 mg kg−1 to 21 mg kg−1, depending on crops and soil types. The authors also estimated a critical Olsen-P value of 40 mg kg−1 to 90 mg kg−1, at which CaCl2-P strongly increased, a critical value above which there is a major risk of P leaching.
Speirs et al. (2013) evaluated the correlation of several soil P tests with fertilizer P response in wheat in 164 soils of southeastern Australia. None of the alternative P tests proved statistically superior prediction than the Colwell-P test, which is the benchmark soil P test used in Australia, just the DGT-P test was superior to Colwell P in calcareous soils. Previous work by Mason et al. (2010) showed that the Diffusive Gradients in Thin Films (DGT) test performed better than Colwell P and Resin P test for 35 field trials in southeastern Australia. Analyzing a large number of wheat sites (1777 sites), Bell et al. (2013) concluded that critical Colwell P concentrations should be obtained for wheat yields > 1 t/ha according to soil class of the Australian Classification System, soil pH, and region using the Better Fertiliser Decisions for Crops (BFDC) National Database (Conyers et al., 2013; https://www.dpi.nsw.gov.au/agriculture/soils/guides/soil-nutrients-and-fertilisers/bfdc)
The Fertilizer Recommendation Support Tool (FRST) project is a collaborative project, which includes over 30 land-grant universities in the US, the USDA-ARS, the USDA-NRCS, and several not-for-profit organizations (Lyons et al., 2020). The project develops a database of P correlation–calibration results for use in research and fertilizer recommendation development which might be accessed online (https://frst.scinet.usda.gov). The website contains a national survey describing the status of soil testing, minimum requirements for correlation–calibration data inclusion, and database population and looks for FRST to be a user-friendly online decision support tool. Within the project, Lyons et al. (2023) reported a survey which indicates that i) most of the states recommend sampling at 0-15 cm; ii) sampling frequency recommendations are variable, and iii) some states differentiate sampling according to tillage system, precision technologies, and crop. P extractants also vary across states: Olsen or a combination of Olsen and other methods at 91% of the western states, Mehlich-3 at 50% of both southern and northeastern states, and Bray-1 or a combination of Bray-1 and other methods in 75% of the North Central states. Recommendation philosophies were Sufficiency (37%), Build and Maintenance (19%), hybrid (20%), or others (20%).
Jordan-Meille et al. (2012) reviewed fertilizer P recommendations in 18 countries of Europe finding divergences in soil test selection, contradictions in the interpretation and large differences in recommendations. However, all countries used soil P tests and based recommendations in field trial experimentation. Six countries/regions used ammonium lactate extractant, five used Olsen P test, three Mehlich-3 test, and there were another seven other soils tests extractants. On recommendations, the major difference among countries were attributed to the estimation of P removed by crops. Higgins et al. (2022) conducted a study across 23 European countries to harmonize methodologies for delivering fertilization guidelines. The study found substantial differences in the content, format and delivery of current fertilization guidelines, in soil test methods and how crop nutrient requirements are calculated, even in similar cropping systems and in the same environmental zone. Although full harmonization would not be possible, the authors emphasized that harmonization of fertilization guidelines should be increased by sharing principles of soil testing, analytical methods and technological advances such as those associated with precision agriculture.
Soil tests might be complemented with other determinations under some conditions according to local/regional research. The evaluation of soil P buffering capacity, the capacity of release of P from adsorption sites, has been proposed by several authors (Burkitt et al., 2002: Quintero et al., 2003; Sadzawka and Molina, 2005; Moody et al., 2013; Johnston et al., 2014; Shuai et al., 2018). Another option has been the evaluation of extractable P in the subsurface soil layer (Pothuluri et al., 1986). There have also been developments such as simultaneous determination by weak and strong extractants (Shuai et al., 2018). The contribution of labile organic P fractions to P supply has also been revealed (Thien and Myers, 1992; Dodd and Sahrpley, 2015; Appelhans et al., 2016, 2021a).
P rate recommendations are frequently done considering soil P test categories. These categories are defined from the crop yield vs. soil P test calibration. The values for these categories vary depending not only upon the soil extractant but also according to crops, soil type, and local/regional criteria (Zhang et al., 2021). Table 9 shows the common ranges for categories of different soil extractants and regions.
Fertilizer P rates might be defined according to two general criteria: sufficiency and build-up and maintenance. The sufficiency criterion results in fertilization recommendations only below the critical level of extractable P seeking to maximize the return on investment of fertilizer in the year of application minimizing nutrient applications and fertilizer costs (Table 10). On the other hand, the buildup and maintenance criterion recommend applications of phosphate fertilizers with the objective of raising the soil P level above the critical level and maintaining it, to avoid yield losses due to limitations in P supply, maximizing the effectiveness of the system and the efficiency of P use in the medium and long term. The decision for one or another criterion, based on agronomic knowledge, is a business decision and depends on factors such as land tenure (owner, tenant), availability of capital, etc. (Leikam et al., 2003). Probably, in many situations, the most appropriate criterion involves an intermediate situation between both philosophies (Olson et al., 2015). Finally, it should be noted that the use of these criteria is site-specific, because they vary with the level of extractable P in the soil and the capital investment to be made.
Recommendations based on the buildup and maintenance have been proposed in many world regions, buildup for deficient P soils and maintenance for medium to high P soils (Cubilla et al., 2012; Wall and McDonald, 2015; Vieira et al., 2015; AHDB, 2023; Mallarino et al., 2023). As example, Table 11 shows fertilizer P rates recommended for soil P test categories for field crops at the Corn Belt of US, Brazil, and Paraguay.

Table 11.
Recommendations of P rates for different sol test P categories in Iowa (US), Brazil and Paraguay.
Table 11.
Recommendations of P rates for different sol test P categories in Iowa (US), Brazil and Paraguay.
| Phosphorus recommendations for corn and soybean grain production (two-year rotation) with application before corn or soybean - PM 1688 Rev. February 2023 (Mallarino et al., 2023) | |||||
| Soil Test Category | Very Low | Low | Optimum* | High | Very High |
| Bray P1 and Mehlich-3 P | <9 | 10-17 | 18-25 | 26-34 | >351 |
| Olsen P | <6 | 7-10 | 11-15 | 16-20 | >21 |
| Mehlich-3 ICP | <16 | 17-27 | 28-40 | 41-51 | >52 |
| P to apply (kg/ha) | 93 | 66 | 57 | (0)** | 0 |
*Amounts of P for the optimum category will maximize yield for most conditions. To maintain soil tests in the optimum category, application rates should be based on nutrient removal with harvested grain using the prevailing yield for the field or subfield areas. **In the high soil test category, consider applying one half or lower partial removal rate to the first crop if planning to skip application for the second crop.
| Phosphorus recommendations for corn according to resin P analysis and expected yield (Raij et al., 1996) - Brazil | |||||||||
| Soil Test Category | Very Low | Low | Medium | High | |||||
| Resin P | < 6 | 7-15 | 16-40 | >41 | |||||
| Expected grain yield (t/ha) | P to apply (kg/ha) | ||||||||
| 2-4 | 60 | 40 | 30 | 20 | |||||
| 4-6 | 80 | 60 | 40 | 30 | |||||
| 6-8 | 90 | 70 | 50 | 30 | |||||
| 8-10 | - | 90 | 60 | 40 | |||||
| 10-12 | - | 100 | 70 | 50 | |||||
| Phosphorus recommendations for crops successive crops according to Mehlich-1 P analysis (Cubilla et al., 2012) - Paraguay | |||||||||
| Soil Test Category | Very Low | Low | Medium | High | Very high | ||||
| Grain yield (t/ha) | P to apply (kg/ha) | ||||||||
| 1st crop | 35 + M | 15 + M | 11 + M | M* | R** | ||||
| 2nd crop | 30 + M | 15 + M | M | M | R | ||||
| 3rd crop | 22 + M | 13 + M | M | M | R | ||||
| Total | 87 + 3M | 43 + 3M | 11 + 3M | 3M | 3R | ||||
* Maintenance rate, crop P removal + P losses (25%); **Replenishment rate, crop P removal.
Leikam et al. (2003) proposed flexible fertilizer P recommendations, based on the sufficiency approach or the build-maintenance approach to nutrient management, giving the customer (farmer/consultant) the option of which of these approaches best fits their operation. At low soil test values, recommendations are intended to apply enough P to i) meet the nutrient needs of the immediate crop, or ii) to build soil test levels to a non-limiting value, above the critical level. Two risks are confronted: the risk of input limiting crop yield and the risk of last increment of input being non-profitable (Figure 14). Build-maintenance programs might be designed for variable periods facilitating the decision of investment in P fertilizer.
On deciding the recommended P rate under the sufficiency approach, it was proposed to increase soil P test just to the critical value/range. The rate of P needed to increase each unit of extractable P depends on soil type, texture, minerology, original Bray P level, evaluation time of the fertilization strategy, phosphate fertilizer source, and P extraction method (Rubio et al., 2008; Schlindwein et al., 2013; Cabello et al., 2016). In tropical soils of Brazil, Schlindwein et al. (2013) determined that the amount of P fertilization needed to increase P levels by 1 mg kg−1 was higher for the 0-20 cm layer (15.5-17.4 kg P ha-1) than the 0-10 cm layer (12.6-16.6 kg P ha-1), and that the increases depended on the fertilizer P source and on the P extraction method. In Mollisolls of the Argentinean Pampas, Cabello et al. (2016) indicated averages of 4.2-5.4 kg fertilizer P per hectare to raise soil Bray-P by 1 mg kg-1 (bulk density of 1.2 Mg m-3, 0-20 cm).
A different approach on recommendation of P rates to increase soil P levels would be used if the criterion is buildup and maintenance. In these cases, the amount of P removed in grain should be added to the amount of P needed to increase the level of extractable P in the soil to the desired value. Also, the amount of P needed to increase soil P to the desired level would be different as the increase should be sustained in the long-term (Ciampitti et al., 2011; Sucunza et al., 2018; Appelhans et al., 2021b, 2024; Steinfurth et al., 2024). In the central region of Argentina, field experiments of around 10 years showed increases of 1 mg kg-1 with 3-4 kg of positive P balance (applied P minus P removal in grain) (Ciampitti et al., 2011; Sucunza et al., 2018; Appelhans et al., 2024), but long-term experiments might indicate higher values of positive/negative balance to increase/decrease soil P tests (Dodd and Mallarino, 2005; Johnston et al., 2016). In a slightly alkaline but non-calcareous soil at France, under long-term continuous maize, Messiga et al. (2010) estimated a positive/negative P balance of 7.1 kg P for an increase/decrease of 1 mg kg-1 as determined by Mehlich-3 soil P test. For Iowa and other states of the US Corn Belt, Mallarino et al. (2023) indicated a variable need of 2 to 7 kg P to increase 1 mg kg-1 Bray P or Mehlich-3 P. Alvarez and Steinbach (2017) stated that summarizing the soil test P change–P balance relationship into a single slope would be possible only for soils of similar P fixation, runoff, lixiviation, and absorption from deep soil layers; and with similar initial soil test P values.
As indicated above, recommended rates, as well as critical thresholds, vary across regions even for similar soil test P values and are continuously revised. Hopkins and Hansen (2019) stated that P rates should be increased for high-yielding field crop systems in the US. Zhang et al. (2021) reviewed P recommendations across 13 states at the southern US and found differences of up to 150% in the recommended P rate for maize at the same soil Mehlich-3 level. For Nebraska (USA), Wortmann et al. (2018) found that P rates should be higher than recommended ones, basically covering grain P removal if STP is lower than 20 ppm. Also at Nebraska, for irrigated continuous corn cropping systems, Balboa et al. (2023) reported a need of 39 kg P ha−1 to maintain soil P and a positive P balance with corn crops yielding above 14 Mg ha−1. For soybeans in Illinois (USA), Nakayama et al. (2024) proposed long-term maintenance applications as an effective and efficient practice for P management because of the high variability of grain yield and P concentrations, and thus P removal. At the UK, AHDB (2023) recently updated P recommendations indicating the need to keep soil P levels estimated for maximum yield or arable crops at 16-25 mg·kg−1 Olsen P.
Approaches from the reduction of environmental impacts of P also look to soil test P as an indicator of potential losses. Withers et al. (2019) indicated that upholding soil test P at levels below the critical values would reduce eutrophication risk. Sharpley et al. (2003) sketched the relationship of soil P test and risk of P loss with crop yield and P loss in surface runoff (Figure 15). However, characterizing current and potential soil P losses, especially through runoff and sedimentation, requires more parameters than soil P test values (Kleinman et al., 2011). Wall and McDonald (2015) indicate that despite that there is not specific regulation for the EU, several states address agricultural P losses through national directives. Ireland has implemented measures to limit P entering water bodies: ban of P fertilization in high soil P test fields, limits of stocking rates, and other management measures of P fertilizers and manure. Morgan soil P test is the standard test in Ireland, and fertilization is managed by improving or maintaining the soil P levels to a Soil Index 3 (“unlikely/tenuous” response to fertilizer) which would be of 6-10 mg L-1 for arable crops.
Other Methodologies
Soil testing is not widely available in many cropping systems, i.e. smallholders at SSA. It has also been questioned because of limitations in assessing the actual nutrient supplying capacity (Schut and Giller, 2020). The QUEFTS model was developed in the late 80´s as an alternative for tropical systems in which soil testing was not available and/or difficult to obtain (Janssen et al., 1990). The SSNM approach adapted QUEFTS to generate nutrient fertilization recommendations, including P.
QUEFTS consists of four steps that estimate the indigenous nutrient supply (INS), calculate the actual nutrient uptake, establish yield ranges, and combine them to estimate a final yield (Figure 16). The recommended rate is estimated from the expected response (difference between final yield and yield without P) and an estimated recovery for P fertilizer. In SSNM, the Omission Plot Technique (OPT) is used to estimate INS and the potential yield response to a determined nutrient. INS is estimated from plant nutrient uptake or grain yield of a crop with ample supply of nutrients except the one for which INS is being determined. OPT also includes a full treatment, i.e., NPK, which is compared to a treatment that omitted one nutrient, i.e. NK. Differences in grain yield/uptake between the full treatment and the omitted nutrient treatment estimate the response. As example of use of OPT, Gangaiah (2019) developed a study for rice at India that revealed a significant response to P (+ 23%) and estimated an INS of 10 kg P/ha.
Sattari et al. (2014) evaluated QUEFTS for maize, rice, and wheat at contrasting cropping systems and proposed a recalibration for several model parameters. They state that the main problems in using QUEFTS relate to data availability on soils and fertilizer field trials, irrigation, and extreme soil pH values. A specific issue for P is that the model does not account for residual P effects, thus it is useful just for first season after soil analysis. Results from this study confirm the validity of the QUEFTS structure but highlight the needs for recalibration of coefficients and equations for different scenarios, as well as the limitations of soil heterogeneity and weather variability, as it is also indicated by Chivenge et al. (2022). These limitations reduce the potential for QUEFTS as a generic global model, able to capture all combinations of soil, climate and management conditions.
Plant Analysis
Plant analysis is an alternative tool to monitor the current P status of the crop, complementing growth observations and early soil analysis, and/or to adjust P fertilization in the subsequent crops of the rotation. Table 12 compiles data from literature on the critical ranges/vales of P concentration in plants or plant parts which indicate possible P deficiencies in field crops. In all cases, it is important that the plant, or the part of the plant, be collected under the conditions indicate in the protocol, basically the right plant part at the right phenological stage.
Ranges of 0.21-0.50% P in the flag leaf at heading for wheat crops, 0.26-0.50% in the ear leaf for maize at silking and in the top fully developed leaf prior pod set for soybean, and 0.09-0.18% for the most recent leaf at panicle initiation in rice, are considered adequate concentrations for the correct P nutrition of the plant (Jones, 1998).
Rashid et al. (2005) estimated critical P concentration ranges for spring wheat in Pakistan: young whole shoots, 0.13–0.28%; recently matured leaves, 0.27–0.36%; and mature grain, 0.13–0.27%. Singh et al. (2018) reported a critical leaf P concentration of 2.74 mg g−1 in the uppermost fully expanded leaves between 25 and 37 days after planting for optimum soybean yield.
The determination of critical P concentrations (CPC) has been proposed for different crops to generate a P nutrition index (PNI) which would relate to crop yield (Ziadi et al., 2007, 2008; Bélanger et al., 2015; Gagnon et al., 2020). Strong relationships between shoot biomass and CPC have been found but with variations on the parameters of the models according to locations. However, relationships between shoot P and N concentrations were independent of locations, allowing for measurements of shoot N to properly estimate CPC. The PNI can be calculated as the ratio of actual P concentration to CPC under any field situation.
Use of Remote Sensors
It is anticipated that in the upcoming years there will be a rapid development of sensor technologies, a main chapter of the Internet of Plants (IoP) (Steeneken et al., 2023). Currently, the use of remote sensors for crop P status has not been studied as much as for the case of N, there is currently very little information available on P sensors. In some works, relationships were found between measurements at early stages and the detection of deficiencies, Osborne et al. (2004) found that spectral radiation measurements in the near-red and blue regions predicted early P stress in corn (V6-V8).
Most approaches for rapid in-field soil analysis evaluated for P are based on technologies like near infrared (NIR) and mid-infrared (MIR) spectroscopy), X-ray fluorescence spectroscopy (XRF), ion-spectroscopy (ISE) or ion-selective field effect transistors (ISFET) (Najdenko et al., 2024). In most cases, their successful application under field conditions has yet to be demonstrated. There are proximal and remote alternatives. Among proximal sensors, machine-based and hand-held or static invasive sensors and machine-based, hand-held (in-situ) and in-situ (Y ray) non-invasive sensors might determine phosphate. Among spectral sensors, visible NIR might detect plant available P. Ion-selective electrodes, as electrochemical sensors, has also been developed to determine plant-available P with success. Alternative non-invasive in-situ devices through spectral sensors can estimate plant-available P. Many of these in-field analysis combine different sensor technologies to be able to simultaneously determine soil nutrients and soil pH.
Further research is needed to advance this branch of technological and scientific knowledge for P management. Once developed, these technologies would be more accessible and affordable than soil testing for smallholder farmers, for example at Africa (Vanlauwe et al., 2023).
4.4.3. Right Placement
There are several options for fertilizer P placement in field crops: banding with the seed, banding to the side, deep banding, broadcasting (Figure 17). Generally, crop responses to P placement for field crops depend on soil P test status. Banding near the seed at planting is the best placement option for field crops under P deficient soils (McLaughlin et al., 2011; Noonari et al., 2016; Grant and Flaten, 2019; Freiling et al., 2022; Sharifi et al., 2024). However, Mallarino et al. (1999) did not find response to P placement in maize when comparing P banded with the planter 5 cm beside and below the seeds and broadcast or deep-banded at a 13- to 18-cm depth before planting. Barbieri et al. (2014) found that broadcasting 3 months before seeding and banding resulted in similar P recovery efficiencies and wheat grain yields at high organic matter Argiudolls of the Pampas of Argentina under no-tillage.
When soil P tests are at optimum levels, yield responses are low or null thus P fertilizer placement is not an issue (Bordoli and Mallarino, 1998; Nakayama et al., 2024). Starter fertilization, a low P rate with or near the seed, has shown yield responses in complementing a main application either broadcast or deep banding (Preston et al., 2019). Deep fertilizer P placement has increased P use efficiency under several cropping systems (McLaughlin et al., 2011; Nkebiwe et al., 2016; Hansel et al., 2017; Freiling et al., 2022).
Foliar P fertilization would be an alternative for rescue situations, soil with high P-fixing capacity or complementary for rapid P supply (Ling and Silberbush, 2002; Mosali et al., 2006; Girma et al., 2007; Noack et al., 2010; Bindraban et al., 2015; Grant and Flaten, 2019; Hopkins and Hansen, 2019).
Girma et al. (2007) reported that foliar P applied at a rate of 8 kg ha−1 at the VT growth stage in maize increased grain yield in some experiments. These authors suggested that foliar P, at the correct growth stage and rate, could be used as an efficient P-management tool in maize.
Field experiments in maize and soybean with multi-nutrient foliar fertilizers, including P, showed erratic responses in the US (Boote et al., 1978; Haq and Mallarino, 2000; Mallarino et al., 2001). Responses were low and did not follow a special management, soil or climate condition.
Noack et al. (2010) pointed out that the success of foliar P applications depends on the soil P level, water status, crop type, fertilizer formulation, and climatic conditions. Foliar P might reduce P inputs for the crop and improve PUE, combinations of soil and foliar applications would be a suitable alternative for specific soil, crop and management situations under field crop production.
Deraoui et al. (2021) found a significant effect of soil P fertilizer on wheat grain yield components, grain P use efficiency and available P in soil in calcareous-alkaline soils of Algeria, but no differences were observed for these parameters among foliar P fertilizer sources. Similarly, Al-Harbi et al. (2013) reported wheat responses to foliar P applications under calcareous soils of Saudi Arabia, the best P management strategy being application of foliar P along with medium rates of soil P fertilizer. Also, Talboys et al. (2020) using a combination of controlled-environment experiments and radio-isotopic labeling, indicated that the combination of seed dressing and foliar P applications showed greater PUE, P uptake and wheat grain yield than the conventional soil-based application.
Site-specific management (SSM) and associated precision agriculture techniques would improve P management and contribute to the efficient use of P fertilizers (Mallarino and Schepers, 2005). The high spatial variability of soil P test and fertilizer P recovery leads to site-specific P management (Nishigaki et al., 2019). Moreover, the availability of variable rate technology either with solid or liquid P fertilizers has supported the acceptance of SSM for P fertilization.
Soil sampling for SSM includes grid sampling of cells of different size or sampling of homogeneous zones (Schepers et al., 2000; Mallarino and Wittry, 2004; Hornung et al, 2006). Identification of soil P test variability allows for application through variable rate technologies (VRT). Recommendations for different cells or management zones would follow the concepts already described for right rate. Comparisons of PUE and/or economic return of VRT vs. uniform applications have been variable and highly dependent on the extent of soil P variability in a specific field and the consideration of P residual effects (Lambert et al., 2007). On-the-go sensors would greatly help in characterizing soil P variability across fields.
4.4.4. Right Time
Time of P application depends on soil P dynamics, crop requirements, and P source/placement (Figure 18). Applications of P in cereal-based systems might be in advance of crop planting because of the low P mobility in soils (Bundy et al., 2005).
Early P availability is critical for high yields and high PUE (Mollier and Pellerin, 1999; Pellerin et al., 2000; Smit et al., 2013; Bindraban et al., 2015). Fertilizer P application for field crops has shown better PUE in early applications for rice (Slaton et al., 2002; Sanusan et al., 2009), before or at planting for maize (Amanullah et al., 2010), pre-plant or at seeding for wheat and other winter cereals (Grant and Flaten, 2019).
Pre-plant surface broadcast P applications should consider the risk of P transport to surface waters, especially for water soluble P sources. Field topography, distance to water ponds and streams, and precipitation intensity would be key factors to consider.
Research is not conclusive regarding differences in PUE when comparing rotation vs annual applications. Some authors consider that a single P application for several crops in the rotation would not show differences with single crop applications (Randall et al., 1997), while in other cases single applications for each crop outyielded a one-time application for the whole rotation (Appelhans et al., 2024).
4.5. Advances and Potential Developments on BMPs for P
4.5.1. Small Holders Cropping Systems
Aune et al. (2017) indicates that precision agriculture provides low-cost methods to increase yields for small holders in West Africa. These methods include seed treatment and priming, micro-dosing fertilization, manure application, and water management. Fertilizer micro-dosing plus seed priming has resulted in yield increases of 50 to 100% (Rakotoson et al., 2020). Micro-dosing with rates as low as 0.3 g fertilizer per pocket (plant) seems to be the recommended rate for sorghum and pearl millet.
Further information of P management in small holder cropping systems is presented at Chivenge et al. (2022) and Vanlauwe et al. (2023) and was discussed in previous sections.
4.5.2. Organic Farming
P sources approved for organic cropping systems include rock phosphate, manure, compost, and biofertilizers (Nelson and Janke, 2007; Hue, 2024). Rock phosphate has shown more effectiveness in soils of pH 5.5 or lower. Manure and compost sources provide available P, but its management should evaluate possible P losses to the environment from P buildup, especially when these sources are managed as primary N source. Thus, BMPs should address the control of P buildup through the incorporation and proper timing (avoiding high and intense precipitation periods) to reduce particulate and dissolved P losses to surface waters. Other materials such as bone meal and meat from cattle or fish may be used as P sources in organic farming, they consist mainly of apatite-like calcium phosphate like rock P (Hue, 2024).
Organic systems would benefit crop P nutrition through increased organic matter, P cycling with cover crops, and mycorrhizae colonization (Hallama et al., 2019; Hue, 2024). P cycling through organic sources would benefit from P solubilizing bacteria.
4.5.3. Environmental Issues Related to P
The environmental impacts of P have been extensively discussed in recent years (Sharpley et al., 2003, 2006, 2015; Smith et al., 2015; Wall and McDonald, 2015; Withers et al., 2019). These impacts are related to surface water contamination and, to a lesser extent, to water-table pollution. Agriculture has been identified as the main source of these effects. The application of fertilizer P BMPs discussed in the previous paragraphs, would reduce and even avoid these impacts.
The following are among the main BMPs for P and the environment (Withers et al., 2019; Walker, 2023):
- Reduce soil erosion and runoff.
- Avoid surface-broadcast applications in the hilly landscape and in the rainy season.
- Know soil and manure P levels.
- Match fertilizer and manure P to crop needs.
- Do not over-apply fertilizer or manure P on sites contiguous to rivers, streams, reservoirs or lakes.
- Establish buffer strips along river and stream banks, reservoirs and lakes.
Source and transport practices should be combined to reduce P transfers from field to water (Sharpley et al., 2004; Singh et al., 2020). Kleinman et al. (2011) indicate that water quality protection in different situations always requires on-farm actions, but agro-ecosystems with long term challenges such as severe P surpluses require efforts beyond the local farm gate.
Alewell et al. (2020) indicate average soil P losses by water erosion of 5.9 kg P /ha/year with variations among continents and countries but averaging over 50% of total P losses. There is a need to reduce soil erosion, considering differential impacts in components of P balances across cropping systems.
Research on the effects on no-tillage on P losses shows contrasting results (Osmond et al., 2019). Smith et al. (2015) compared no-tillage and rotational tillage (e.g., tilled only before planting corn) and reported that no-tillage doubled soluble P loading but decreased total P loading by 69% compared to rotational tillage. Similarly, grassed waterways and rotation with wheat and oat reduced total P loads compared to the standard corn–soybean rotation in the region. Similar results under no-tillage have been reported by Lamba et al. (2016). However, Duncan et al. (2019) indicated that the widespread adoption of conservation tillage and cover crops might increase P loading to surface water bodies in the absence of other P management practices.
In the US, regulatory agencies requested to establish agronomic soil test P recommendations, environmental soil test P thresholds, and a P index to identify fields according to their vulnerability to potential environmental P losses (Sharpley et al. 2003). The P indices rank site vulnerability to P loss by accounting for P source and management and transport factors, plus factors like flooding frequency, conservation practices, and others. States built their own P indices which widely vary among them and in their effectiveness as risk assessment tools (Osmond et al., 2017).
4.5.4. P Fertilization and Soil Health
Dinca et al. (2022) indicated that mineral and organic fertilization increases the abundance and growth of microbial populations through nutrient supply, and that negative effects have been observed on decreases of enzymatic activity mainly in soils that lost organic matter and receive considerable amounts of fertilizer.
Vanlauwe et al. (2023), for SSA conditions, stated that fertilizer use might be a starting action to improve soil health, but investments for rehabilitation should anticipate it on degraded soils where fertilizer responses are limited.
4.5.5. Modeling P Dynamics in Soil-Crop Systems
Simulation models of P dynamics in agroecosystems have been developed since the 1970’s (Allan Jones et al., 1991). Several of these models addressed single P transformations, while others look at the whole complex transformations of the P cycle involving P chemistry, soil supply and removal by plants, and hydrological processes (Ziadi et al., 2013).
Das et al. (2019) indicate that agricultural P modeling would support and integrate scientific advances and identify strategies to increase PUE. However, they found a shortage of field data, a limited ability to predict P cycling and availability and a limitation in matching conceptual and modellable pools with measured P fractions. Interdisciplinary collaboration and complementary efforts would be key factors in developing
Drohan et al. (2019) reviewed decision support systems (DSS) with different scales of application and resolution at several countries. They pointed out that those recent developments have targeted integrated digital mapping advancing runoff modeling and education. Technologies such as monitoring, imaging, sensors, remote sensing, and analytical instrumentation would assist the development and adoption of DSSs. The incorporation of “big data”, in a format acceptable to users, remains as a challenge for DSSs.
Wang et al. (2020) indicated that modeling of agricultural P losses has increased significantly, specifically analyzing hypothetical reduction of P losses through adoption of BMPs (Gitau et al., 2008; Lamba et al., 2016; Osmond et al., 2017). The authors foresee improvements in the accuracy of P loss modeling by incorporating processes and subroutines for direct P loss; integrating field and watershed models for BMP calibration; and building holistic interactions among the several stakeholders.
5. Looking for Sustainable P Use and Management in Cereal-Based Cropping Systems
There is a strong need for sustainable P use and management in cereal-based cropping systems from the concerns on P scarcity, P deficient soils of many world regions, environmental negative impacts of excessive P applications, and improved PUE, recovery and recycling.
The main issues addressing these needs and discussed in this review are:
- Large variability in soil P availability and PUE in cereal-based cropping systems across world regions and cereal-based cropping systems
- Knowledge of P cycling is key for successful P management
- BMPs are the foundation for improving PUE and decoupling production from externalities in P management
- Emphasis on Right source, Right rate, Right time, and Right placement
-
Essential BMPs:
- o
- Diagnosis of soil P status
- o
- Evaluation of P balance in the rotation: Budget P removal and application
- o
- Precise P fertilizer recommendations
- o
- Attend cropping system condition (rotation, crop, climate, farmer) and economics on deciding P source and placement/time
References
- Abdo, A.I.; El-Sobky, E.-S.E.A.; Zhang, J. Optimizing maize yields using growth stimulants under the strategy of replacing chemicals with biological fertilizers. Front. Plant Sci. 2022, 13, 1069624. [Google Scholar] [CrossRef]
- Achat, D.L.; Sperandio, M.; Daumer, M.-L.; Santellani, A.-C.; Prud’Homme, L.; Akhtar, M.; Morel, C. Plant-Availability of Phosphorus Recycled from Pig Manures and Dairy Effluents as Assessed by Isotopic Labeling Techniques. Geoderma 2014, 232–234, 24–33.
- AHDB (2023). Nutrient Management Guide (RB209). Section 4 Arable Crops. Available online: https://ahdb.org.uk/knowledge-library/rb209-section-4-arable-crops.
- Alewell, C.; Ringeval, B.; Ballabio, C.; Robinson, D.A.; Panagos, P.; Borrelli, P. Global phosphorus shortage will be aggravated by soil erosion. Nature communications 2020, 11, 4546. [Google Scholar] [CrossRef] [PubMed]
- Al-Harbi, S.F.; Ghoneim, A.M.; Modaihsh, A.S.; Mahjoub, M.O. . Effect of foliar and soil application of phosphorus on phosphorus uptake, use efficiency and wheat grain yield in calcareous soil. Journal of Applied Sciences 2013, 13, 188–192. [Google Scholar] [CrossRef]
- Allan Jones, C.; Sharpley, A.N.; Williams, J.R. Modeling Phosphorus Dynamics in the Soil-Plant System. In Modeling Plant and Soil Systems; Hanks, J., Ritchie, J.T., Eds.; 1991. [CrossRef]
- Alvar-Beltrán, J.; Napoli, M.; Dao, A.; Ouattara, A.; Verdi, L.; Orlandini, S.; Dalla Marta, A. Nitrogen, phosphorus and potassium mass balances in an irrigated quinoa field. Italian Journal of Agronomy 2021, 16. [Google Scholar] [CrossRef]
- Alvarez, R.; Steinbach, H.S. Modeling Soil Test Phosphorus Changes under Fertilized and Unfertilized Managements Using Artificial Neural Networks. Agron. J. 2017, 109, 2278–2290. [Google Scholar] [CrossRef]
- Amanullah., Ondrasek, G., Al –Tawaha, A. R. M. S., eds. Integrated nutrients management: An approach for sustainable crop production and food security in changing climates, 2nd ed.; Lausanne: Frontiers Media SA. 2024. [CrossRef]
- Amanullah, A.; Zakirullah, M.; Tariq, M.; Nawab, K.; Khan, A.Z.; Farhatullah, F.; Sha, Z.; Khalil, S.K.; Jan, M.T.; M.Sajid; Hussain, Z. Levels and time of phosphorus application influence growth, dry matter partitioning and harvest index in maize. Pakistan Journal of Botany 2010, 42, 4051-4061.
- Amorim, M.B.; Fontoura, S.M.V.; Tiecher, T.; Moraes, R.P.; Bayer, C. Use and recovery of P reserves in Southern Brazil Oxisols under no-till with low and high P availability. Rev Bras Cienc Solo. 2024, 48, e0230127. [Google Scholar] [CrossRef]
- Appelhans, S.C.; Barbagelata, P.A.; Melchiori, R.J.M. Is the Lack of Response of Maize to Fertilization in Soils with Low Bray1-P Related to Labile Organic Phosphorus? J Soil Sci Plant Nutr 2021, 21, 612–621. [Google Scholar] [CrossRef]
- Appelhans, S.C.; Carciochi, W.D.; Correndo, A.; Gutiérrez Boem, F.H.; Salvagiotti, F.; García, F.O.; Melchiori, R.J.M.; Barbagelata, P.A.; Ventimiglia, L.A.; Ferraris, G.N.; et al. Predicting soil test phosphorus decrease in non-P-fertilized conditions. Eur. J. Soil Sci. 2021, 72, 254–264. [Google Scholar] [CrossRef]
- Appelhans, S.C.; Melchiori, R.J.; Barbagelata, P.A.; Novelli, L.E. Assessing organic phosphorus contributions for predicting soybean response to fertilization. Soil Sci Soc Am J 2016, 80, 1688–1697. [Google Scholar] [CrossRef]
- Appelhans, S.C.; Novelli, L.E.; Melchiori, R.J.; Barbagelata, P.A. Does the fertilisation strategy affect the long-term legacy phosphorus dynamic? Eur. J. Agron. 2024, 153, 127035. [Google Scholar] [CrossRef]
- Argus-IFA. Phosphate Rock Resources & Reserves. 2023. Available online: https://www.fertilizer.org/wp-content/uploads/2023/04/2023_Argus_IFA_Phosphate_Rock_Resources_and_Reserves_Final.pdf.
- Aulakh, M.S.; Pasricha, N.S.; Bahl, G.S. Phosphorus fertilizer response in an irrigated soybean–wheat production system on a subtropical, semiarid soil. Field Crops Research 2003, 80, 99–109. [Google Scholar] [CrossRef]
- Aune, J.B.; Coulibaly, A.; Giller, K.E. Precision farming for increased land and labour productivity in semi-arid West Africa. A review. Agronomy for sustainable development 2017, 37, 1–10. [Google Scholar]
- Avsar, C. Novel Assessment Strategy for Nanotechnology in Agriculture: Evaluation of Nanohydroxyapatite as an Alternative Phosphorus Fertiliser. Kem. Ind. 2022, 71, 327–3. [Google Scholar] [CrossRef]
- Bai, Z.; Li, H.; Yang, X. The critical soil P levels for crop yield, soil fertility and environmental safety in different soil types. Plant Soil 2013, 372, 27–37. [Google Scholar] [CrossRef]
- Baker, D.B.; Johnson, L.T.; Confesor, R.B.; Crumrine, J.P. Vertical Stratification of Soil Phosphorus as a Concern for Dissolved Phosphorus Runoff in the Lake Erie Basin. Journal of Environmental Quality 2017, 46, 1287–1295. [Google Scholar] [CrossRef]
- Balboa, G.R.; Ferguson, R.; Puntel, L. Irrigated corn yield and soil phosphorus response to long-term phosphorus fertilization. Agronomy Journal 2024, 116, 2588–2598. [Google Scholar] [CrossRef]
- Barbieri, P., Sainz Rozas, H., Covacevich, F., Echeverría, H. E. Phosphorus Placement Effects on Phosphorous Recovery Efficiency and Grain Yield of Wheat under No-Tillage in the Humid Pampas of Argentina, International Journal of Agronomy 2014, 2014, 1–12. [CrossRef]
- Barth, G.; Francisco, E.; Suyama, J.T.; García, F.O. Nutrient Uptake Illustrated for Modern, High-Yielding Soybean. Better Crops 2018, 102, 11-14. [CrossRef]
- Barrow, N.J.; Barman, P.; Debnath, A. Three Residual Benefits of Applying Phosphate Fertilizer. Soil Science Society of America Journal 2018, 82, 1168–1176. [Google Scholar] [CrossRef]
- Beegle, D. Assessing Soil Phosphorus for Crop Production by Soil Testing. In Phosphorus: Agriculture and the Environment; Sims, J.T., Sharpley, A.N., Westermann, D.T., Eds.; Wiley: Hoboken, NJ, USA, 2005. [Google Scholar] [CrossRef]
- Bélanger, G.; Ziadi, N.; Pageau, D.; Grant, C.; Högnäsbacka, M.; Virkajärvi, P.; Hu, Z.; Lu, J.; Lafond, J.; Nyiraneza, J. A Model of Critical Phosphorus Concentration in the Shoot Biomass of Wheat. Agronomy Journal 2015, 107, 963–970. [Google Scholar] [CrossRef]
- Bell, R.; Reuter, D.; Scott, B.; Sparrow, L.; Strong, W. Soil phosphorus–crop response calibration relationships and criteria for winter cereal crops grown in Australia. Crop and Pasture Science 2013, 64, 480–498. [Google Scholar]
- Bender, R.R.; Haegele, J.W.; Below, F.E. Nutrient Uptake, Partitioning, and Remobilization in Modern Soybean Varieties. Agronomy Journal 2015, 107, 563–573. [Google Scholar] [CrossRef]
- Bender, R.; Haegele, J.W.; Ruffo, M.L.; Below, F.E. Nutrient Uptake, Partitioning, and Remobilization in Modern, Transgenic Insect-Protected Maize Hybrids. Agronomy Journal 2013, 105, 161–170. [Google Scholar] [CrossRef]
- Bindraban, P.S.; Dimkpa, C.; Nagarajan, L.; Roy, A.; Rabbinge, R. Revisiting fertilisers and fertilisation strategies for improved nutrient uptake by plants. Biology and Fertility of Soils 2015, 51, 897–911. [Google Scholar]
- Bindraban, P.S.; Dimkpa, C.O.; Pandey, R. Exploring phosphorus fertilizers and fertilization strategies for improved human and environmental health. Biology and Fertility of Soils 2020, 56, 299–317. [Google Scholar]
- Martin, B.; Darch, T.; Haslam, R. Phosphorus use efficiency and fertilizers: future opportunities for improvements. Front. Agr. Sci. Eng. 2019, 6, 332–340. [Google Scholar] [CrossRef]
- Bonvin, C.; Etter, B.; Udert, K.M. Plant uptake of phosphorus and nitrogen recycled from synthetic source-separated urine. AMBIO 2015, 44 (Suppl. S2), 217–227. [Google Scholar] [CrossRef]
- Bolster, C.H.; Correndo, A.A.; Pearce, A.W.; Spargo, J.T.; Slaton, N.A.; Osmond, D.L. A spreadsheet for determining critical soil test values using the modified arcsine-log calibration curve. Soil Science Society of America Journal 2023, 87, 182–189. [Google Scholar] [CrossRef]
- Boote, K.J.; Gallaher, R.N.; Robertson, W.K.; Hinson, K.; Hammond, L.C. Effect of Foliar Fertilization on Photosynthesis, Leaf Nutrition, and Yield of Soybeans1. Agronomy Journal 1978, 70, 787–791. [Google Scholar] [CrossRef]
- Bray, R.H.; Kurtz, L.T. Determination of total, organic, and available forms of phosphorus in soil. Soil Sci. 1945, 59, 39–45. [Google Scholar]
- Brown, J. Soil Testing: Sampling, correlation, calibration and interpretation. SSSA Spec. Pub. 21. SSSA. Madison, Wisconsin, EE.UU. 1987; 144 pag.
- Brownlie, W.J.; Sutton, M.A.; Heal, K.V.; Reay, D.S.; Spears, B.M. (Eds.) Our Phosphorus Future; UK Centre for Ecology & Hydrology: Edinburgh, UK, 2022. [Google Scholar] [CrossRef]
- Bruulsema, T.W. 4R Phosphorus Management Practices for Major Commodity Crops of North America. IPNI. Issue Review Ref #17023. 2017. Available online: http://phosphorus.ipni.net/article/PPP-3169.
- Bruulsema, T.W.; Peterson, H.M.; Prochnow, L.I. The Science of 4R Nutrient Stewardship for Phosphorus Management across Latitudes. J Environ Qual. 2019, 48, 1295–1299. [Google Scholar] [CrossRef] [PubMed]
- Bundy, L.G.; Tunney, H.; Halvorson, A.D. Agronomic Aspects of Phosphorus Management. In Phosphorus: Agriculture and the Environment; Sims, J.T., Sharpley, A.N., Daniel, T.C., Eds.; Wiley: Hoboken, NJ, USA, 2005. [Google Scholar] [CrossRef]
- Buresh, R.J.; Witt, C. Site-specific nutrient management. In Fertilizer Best Management Practices: Gneral principles, strategy for their adoption and voluntary initiatives vs regulations. In Proceedings of the IFA International Workshop on Fertilizer Best Management Practices, Brussels, Belgium, 7–9 March 2007; International Fertilizer Industry Association (IFIA): Paris, France, 2007. [Google Scholar]
- Burkitt, L.L.; Moody, P.W.; Gourley, C.J.P.; Hannah, M.C. A simple phosphorus buffering index for Australian soils. Aust. J. Soil Res. 2002, 40, 497–513. [Google Scholar]
- Carpenter, S.R.; Caraco, N.F.; Correll, D.L.; Howarth, R.W.; Sharpley, A.N.; Smith, V.H. Nonpoint pollution of surface waters with phosphorus and nitrogen. Ecological Applications 1998, 8, 559–568. [Google Scholar]
- Cataldo, E.; Salvi, L.; Paoli, F.; Fucile, M.; Masciandaro, G.; Manzi, D.; Masini, C.M.; Mattii, G.B. Application of Zeolites in Agriculture and Other Potential Uses: A Review. Agronomy 2021, 11, 1547. [Google Scholar] [CrossRef]
- Chatterjee, N.; Li, C.; Margenot, A.J. 33P-isotope labelling ammonium phosphate fertilizers reveals majority of early growth maize phosphorus is soil-derived. European Journal of Soil Science 2024, 75, e13578. [Google Scholar] [CrossRef]
- Chien, S.H.; Edmeades, D.; McBride, R.; Sahrawat, K.L. Review of maleic–itaconic acid copolymer purported as urease inhibitor and phosphorus enhancer in soils. Agronomy Journal 2014, 106, 423–430. [Google Scholar] [CrossRef]
- Chien, S.H.; Prochnow, L.I.; Cantarella, H. Recent developments of fertilizer production and use to improve nutrient efficiency and minimize environmental impacts. Adv. Agron. 2009, 102, 267–322. [Google Scholar] [CrossRef]
- Chien, S.H.; Sikora, F.J.; Gilkes, R.; McLaughlin, M.J. Comparing of the difference and balance methods to calculate percent recovery of fertilizer phosphorus applied to soils: A critical discussion. Nutrient Cycling in Agroecosystems 2012, 92, 1–8. [Google Scholar] [CrossRef]
- Chivenge, P.; Zingore, S.; Ezui, K.S.; Njoroge, S.; Bunquin, M.A.; Dobermann, A.; Saito, K. Progress in research on site-specific nutrient management for smallholder farmers in sub-Saharan Africa. Field Crops Res. 2022, 281, 108503. [Google Scholar] [CrossRef]
- Chowdhury, R.B.; Zhang, X. Phosphorus use efficiency in agricultural systems: a comprehensive assessment through the review of national scale substance flow analyses, Ecol. Indicators, 2021, 121, 107172. [Google Scholar] [CrossRef]
- Chuan, L.; He, P.; Jin, J.; Li, S.; Grant, C.; Xu, X.; Zhou, W. Estimating nutrient uptake requirements for wheat in China. Field Crops Research 2013, 146, 96–104. [Google Scholar]
- Ciampitti, I.; García, F.O. Requerimientos nutricionales. Absorción y extracción de macronutrientes y nutrientes secundarios: Cereales, Oleaginosos e Industriales. Informaciones Agronómicas No. 33. Archivo Agronómico No. 11. pp. 1-4. IPNI Cono Sur. Acassuso, Buenos Aires. 2007.
- Ciampitti, I.A.; García, F.O.; Picone, L.I.; Rubio, G. Phosphorus budget and soil extractable dynamics in field crop rotations in Mollisols. Soil Science Society of America Journal 2011, 75, 131–142. [Google Scholar] [CrossRef]
- Ciampitti, I.A.; Murrell, S.T.; Camberato, J.J.; Vyn, T.J. Maize nutrient accumulations and partitioning in response to plant density and nitrogen rate: I. Macronutrients. Agronomy Journal 2013, 105, 783–795. [Google Scholar] [CrossRef]
- Clark, R.B. Sorghum. In Nutrient Deficiencies & Toxicities in Crop Plants, 1st ed.; Bennett, W.F., Ed.; APS Press: Minnesota, USA, 1993; pp. 21–26. [Google Scholar]
- Cabello, M. J., Gutiérrez Boem, F. H., Quintero, C. E., & Rubio, G. (2016). Soil characteristics involved in phosphorus sorption in Mollisols. Soil Science Society of America Journal, 80, 1585-1590.
- Cox, F.R., & L. Unruh. (2000). Reference sufficiency ranges, field crops: Grain Sorghum. N.C. Department of Agriculture and Consumer Services. Available at http://www.ncagr.gov/agronomi. /: of Agriculture and Consumer Services. Available at http.
- Colwell JD (1963). The estimation of the phosphorus fertilizer requirements of wheat in southern New South Wales by soil analysis. Australian Journal of Experimental Agriculture and Animal Husbandry 3, 190–198. [CrossRef]
- Condron, L.M. , Turner, B.L. & Cade-Menun, B.J. (2005). Chemistry and Dynamics of Soil Organic Phosphorus. In Phosphorus: Agriculture and the Environment (eds J. Thomas Sims, A.N. Sharpley & D.T. Westermann). [CrossRef]
- Conyers M. K., Bell M. J., Wilhelm N. S., Bell R., Norton R. M., Walker C. (2013). Making Better Fertiliser Decisions for Cropping Systems in Australia (BFDC): knowledge gaps and lessons learnt. Crop and Pasture Science 64, 539-547.
- Cordell, D., Drangert, J. O. & White, S. (2009). The story of phosphorus: global food security and food for thought. Glob. Environ. Change 19, 292–305.
- Cordell, D.; Jackson, M.; White, S. (2013). Phosphorus flows through the Australian food system: Identifying intervention points as a roadmap to phosphorus security. Environ. Sci. Policy, 29, 87–102. [CrossRef]
- Cordell, D.; White, S. (2013). Sustainable Phosphorus Measures: Strategies and Technologies for Achieving Phosphorus Security. Agronomy, 3, 86-116. [CrossRef]
- Correndo, A. A., A. Pearce, C. Bolster, J. T. Spargo, D. Osmond, & I. A. Ciampitti. (2023). The soiltestcorr R package: An accessible framework for reproducible correlation analysis of crop yield and soil test data. SoftwareX, Volume 21, 101275. [CrossRef]
- Correndo A. A., Salvagiotti, F., García, F. O., & Gutiérrez-Boem, F. H. (2017). A modification of the arcsine-log calibration curve for analysing soil test value-relative yield relationships. Crop & Pasture Science, 68, 297–304. [CrossRef]
- Covacevich F, Echeverría HE, Aguirrezabal LA (2007). Soil available phosphorus status determines indigenous mycorrhizal colonization of field and glasshouse-grown spring wheat from Argentina. Appl Soil Ecol 35:1–9.
- Crespo C., N. Wyngaard, H. R. Sainz Rozas, A. Pizzuto, P. Barbagelata, M. Barraco, V. Gudelj, & P. A. Barbieri. (2024). Cover crops affect phosphorus fractions in soybean-based sequences with different phosphorus availability in Mollisols. Soil Till. Res. 240, 106096. [CrossRef]
- Cubilla, M; Ademir, A; Wendling, F; Eltz, L; Amado, T & Mielniczuk, J. (2012). Recomendaciones de fertilización para soja, trigo, maíz y girasol bajo sistema de siembra directa en el Paraguay. Asunción, Paraguay, CAPECO. 88 p.
- Culman, S., Fulford, A., Camberato, J., & Steinke, K. (2020). Tri-State Fertilizer Recommendations. Bulletin 974. College of Food, Agricultural, and Environmental Sciences. Columbus, OH: The Ohio State University. extensionpubs.osu.edu.
- Culman, S., Fulford, A., LaBarge, G., Watters, H., Lindsey, L. E., Dorrance, A., & Deiss, L. (2023). Probability of crop response to phosphorus and potassium fertilizer: Lessons from 45 years of Ohio trials. Soil Science Society of America Journal, 87, 1207–1220. [CrossRef]
- Dahnke, W. C. , & Olson, R. A. (1990). Soil test correlation, calibration, and recommendation. In R. L.Westerman (Ed.), Soil testing and plant analysis (pp. 45–71). SSSA. [CrossRef]
- Das, B., Huth, N., Probert, M., Condron, L., & Schmidt, S. (2019). Soil phosphorus modeling for modern agriculture requires balance of science and practicality: A perspective. Journal of Environmental Quality, 48, 1281-1294.
- Degryse, F., B. Ajiboye, R.D. Armstrong, & M.K. McLaughlin. (2013). Sequestration of phosphorus-binding cations by complexing compounds is not a viable mechanism to increase P efficiency. Soil Science Society of America Journal 77:2050–2059. [CrossRef]
- Degryse, F. & McLaughlin, M.J. (2014). Phosphorus Diffusion from Fertilizer: Visualization, Chemical Measurements, and Modeling. Soil Science Society of America Journal, 78: 832-842. [CrossRef]
- Demay, J., Ringeval, B., Pellerin, S. et al. (2023). Half of global agricultural soil phosphorus fertility derived from anthropogenic sources. Nat. Geosci. 16, 69–74. [CrossRef]
- Deraoui, N.B., Mekliche, L.H. & Mekliche, A. (2021). Response of Wheat to Foliar and Soil P Fertilization on Grain Yield and Phosphorus use Efficiency in Southeastern Algeria. Indian Journal of Agricultural Research. 55, 99-104. [CrossRef]
- Dhillon, J. , Torres, G., Driver, E., Figueiredo, B. & Raun, W.R. (2017). World Phosphorus Use Efficiency in Cereal Crops. Agronomy Journal, 109: 1670-1677. [CrossRef]
- Dinca, L.C.; Grenni, P.; Onet, C.; Onet, A. (2022). Fertilization and Soil Microbial Community: A Review. Appl. Sci. 12, 1198.
- Divito G. A., A. A. Correndo & F. O. García. (2017). La nutrición del cultivo de trigo. In Manual del cultivo de trigo. G. A. Divito & F. O. García. International Plant Nutrition Institute, Acassuso, Buenos Aires, Argentina. 224 p. ISBN 978-987-46277-3-5.
- Djodjic, F., Bergström, L. & Grant, C. (2005). Phosphorus management in balanced agricultural systems. Soil Use and Management, 21: 94-101. [CrossRef]
- Dobermann, A. (2007). Nutrient use efficiency – measurement and management. In: IFA International Workshop on Fertilizer Best Management Practices. Belgium, Brussels, pp. 1–28.
- Dobermann A, Bruulsema T, Cakmak I, Gerard B, Majumdar K, McLaughlin M, Reidsma P (2022). Responsible plant nutrition: a new paradigm to support food system transformation. Glob Food Sec 33:100636. [CrossRef]
- Dobermann, K.G. Cassman, C.P. Mamaril, J.E. Sheehy. (1998). Management of phosphorus, potassium, and sulfur in intensive, irrigated lowland rice, Field Crops Research, Volume 56, Issues 1–2, Pages 113-138. [CrossRef]
- Dobermann, A. & Fairhurst, T. (2000). Rice: Nutrient disorders and nutrient management. Handbook Series, Potash and Phosphate Institute (PPI), Potash and Phosphate Institute of Canada (PPIC) and International Rice Research Institute, Philippine.
- Dobermann, A. & Witt, C. (2004). The evolution of site-specific nutrient management in irrigated rice systems of Asia. In Increasing productivity of intensive rice systems through site-specific nutrient management (eds. Dobermann, A., Witt, C. & Dawe, D.) 410 (Science Publisher Inc., and International Rice Research Institute (IRRI).
- Dodd, J.R. & Mallarino, A.P. (2005). Soil-Test Phosphorus and Crop Grain Yield Responses to Long-Term Phosphorus Fertilization for Corn-Soybean Rotations. Soil Science Society of America Journal, 69: 1118-1128. [CrossRef]
- Dodd R.J., Sharpley A.N. (2015). Recognizing the role of soil organic phosphorus in soil fertility and water quality. Res Conserv Recycl 105, Part B: 282-293. [CrossRef]
- Drizo, A.; Johnston, C.; Guðmundsson, J. (2022). An Inventory of Good Management Practices for Nutrient Reduction, Recycling and Recovery from Agricultural Runoff in Europe’s Northern Periphery and Arctic Region. Water, 14, 2132. [CrossRef]
- Drohan, P.J., Bechmann, M., Buda, A., Djodjic, F., Doody, D., Duncan, J.M., Iho, A., Jordan, P., Kleinman, P.J., McDowell, R., Mellander, P.-E., Thomas, I.A. & Withers, P.J.A. (2019). A Global Perspective on Phosphorus Management Decision Support in Agriculture: Lessons Learned and Future Directions. Journal of Environmental Quality, 48: 1218-1233. [CrossRef]
- Dudal, R. & R.N. Roy (eds.) (1995). Integrated Plant Production Systems. FAO Fertilizer and Plant Nutrition Bulletin. 12. Rome, Italy.: 139-154.
- Duncan, E.W., Osmond, D.L., Shober, A.L., Starr, L., Tomlinson, P., Kovar, J.L., Moorman, T.B., Peterson, H.M., Fiorellino, N.M. & Reid, K. (2019). Phosphorus and Soil Health Management Practices. Agricultural & Environmental Letters, 4: 190014. [CrossRef]
- Dunn, D. J., & Stevens, G. (2008). Response of rice yields to phosphorus fertilizer Rates and polymer coating. Crop Management. [CrossRef]
- Dutta, S.K., Majumdar, K. & Satyanarayana, T. (2014). India: Nutrient Expert: A precision nutrient management tool for smallholder production systems of India. Crops & Soils, 47: 23-25. [CrossRef]
- Dyson, C. B., & Conyers, M. K. (2013). Methodology for online biometric analysis of soil test-crop response datasets. Crop & Pasture Science, 64, 435–441. [CrossRef]
- Egner H, H. Riehm & W. R. Domingo. (1960). Untersuchungen uber die chemishe bodenanalyse als grundlage fur die beurteilung des nahrstoffzustandes.der boden. II. Chemische extraktions-methoden zur phosphor-und kalimbestimmung kungl. Lantbrukshoegsk. Ann. 26:204-209.
- European Commission (2018). Best Environmental Management Practice for the Agriculture Sector-Crop and Animal Production; Antonopoulos, I.S., Canfora, P., Dri, M., Gaudillat, P., Styles, D., Julie Williamson, J., Jewer, A., Haddaway, N., Price, M. (Eds.); Final Draft; European Commission: Brussels, Belgium. Available online: http://susproc.jrc.ec.europa.eu/activities/emas/documents/AgricultureBEMP.pdf.
- Fernández, M. C., Belinque, H., Gutierrez Boem, F. H. & Rubio, G. (2009). Compared Phosphorus Efficiency in Soybean, Sunflower and Maize. Journal of Plant Nutrition,32:12,2027- 2043. [CrossRef]
- Fernández, M. C., Gutiérrez Boem, F. H. & Rubio, G. (2011). Effect of indigenous mycorrhizal colonization on phosphorus-acquisition efficiency in soybean and sunflower J. Plant Nutr. Soil Sci. 2011, 174, 673–677. [CrossRef]
- Filippelli GM (2002). The global phosphorus cycle. In: Kohn M, Rakovan J, Hughes J (eds) Phosphates: Geochemical, Geobiological, and Materials Importance. Reviews in Mineralogy & Geochemistry 48, pp 391-425.
- Filippelli G. (2008). The Global Phosphorus Cycle: Past, Present, and Future. Elements, V O L . 4, PP. 89–95. [CrossRef]
- Fixen, P.E. (1989). Agronomic Evaluations of MAP and DAP. Proc. (1989) North Central Extension-Industry Soil Fertility Conference, St. Louis, MO, US.
- Fixen, P.E., F. Brentrup, T. Bruulsema, F. Garcia, R. Norton, & S. Zingore. (2015). Nutrient/Fertilizer Use Efficiency: Measurement, Current Situation and Trends. In P. Drechsel, P. Heffer, H. Magen, R. Mikkelsen, D. Wichelns. (eds.). Managing Water and Fertilizer for Sustainable Agricultural Intensification. International Fertilizer Industry Association (IFA), International, Water Management Institute (IWMI), International Plant Nutrition Institute (IPNI), and International Potash Institute (IPI). Paris, France. p 8-37.
- Fixen, P.E., & J. Grove. (1990). Testing soils for phosphorus. Pp. 141- 180. In: R.L. Westerman (ed.) Soil testing and plant analysis. 3a. edicion. SSSA Book Number 3. Madison, Wisconsin, EE.UU.
- Freiling M, von Tucher S, Schmidhalter U (2022). Factors influencing phosphorus placement and effects on yield and yield parameters: A meta-analysis. Soil Till Res 216:105257. [CrossRef]
- Fryer, M.S., Slaton, N.A., Roberts, T.L., Hardke, J.T. & Norman, R.J. (2019). Validation of Soil-Test-Based Phosphorus and Potassium Fertilizer Recommendations for Flood-Irrigated Rice. Agronomy Journal, 111: 2523-2535. [CrossRef]
- Gagnon, B., Ziadi, N., Bélanger, G., & Parent, G. (2020). Validation and use of critical phosphorus concentration in maize. European Journal of Agronomy, 120, 126147.
- Gangaiah B. (2019). Nutrient omission plot technique for yield response, indigenous nutrient supply and nutrient use efficiency estimation of rice (Oryza sativa L.) crop in Andaman & Nicobar Islands. Oryza Vol. 56 No. 4, 2019 (388-395). [CrossRef]
- García F. O. (2004). Avances en el manejo nutricional de los cultivos de trigo. Actas Congreso “A Todo Trigo”. FCEGAC. Mar del Plata, 13-14 Mayo. Pp. 55-62.
- García F. O., M. F. González Sanjuan, E. Ciarlo, & N. Reussi Calvo. (2024). Phosphorus use and balance in field crops of Argentina. 2024 Centennial Congress of IUSS. Florence, Italy, 19-21 May 2024.
- García F. O., L. Picone, & I. A. Ciampitti. (2014). Phosphorus. In Echeverría H. E. & F.O. García (ed.). Soil fertility and crop fertilization. Ed. INTA. 2a. Ed. Buenos Aires, Argentina. ISBN 9-789875-215658. p. 229-264. (In Spanish).
- Gatiboni, L., Brunetto, G., Pavinato, P. S., George, T., eds. (2021). Legacy Phosphorus in Agriculture: Role of Past Management and Perspectives for the Future. Lausanne: Frontiers Media SA. [CrossRef]
- George, T., Magbanua, R., Roder, W., Van Keer, K., Trébuil, G. & Reoma, V. (2001). Upland Rice Response to Phosphorus Fertilization in Asia. Agronomy Journal, 93: 1362-1370. [CrossRef]
- Girma, K., M., K. L., Freeman, K. W., Mosali, J., Teal, R. K., Raun, William. R., … Arnall, D. B. (2007). Determination of Optimum Rate and Growth Stage for Foliar-Applied Phosphorus in Corn. Communications in Soil Science and Plant Analysis, 38(9–10), 1137–1154. [CrossRef]
- Gitau, M., Gburek, W., & Bishop, P. (2008). Use of the SWAT model to quantify water quality effects of agricultural BMPs at the farm-scale level. Transactions of the ASAE, 51, 1925-1936.
- Gomez de Sousa D., T. Rein, W. Goedert, E. Lobato, & R. de Souza Nunes. (2010). Fósforo. In L. I. Prochnow, V. Casarin, & S. R. Stipp (ed.). Proc. Symposium “Boas practicas para uso eficiente de efrtilizantes”. Piracicaba, SP, Brazil. Pag. Vol. 2. 67-132.
- Grant, C. & D. Flaten. (2019). 4R Management of Phosphorus Fertilizer in the Northern Great Plains. Journal of Environmental Quality 48:1356–1369. [CrossRef]
- Grieger, K., Merck, A., Deviney, A. et al. (2024). What are stakeholder views and needs for achieving phosphorus sustainability? Environ Syst Decis 44, 114–125. [CrossRef]
- Guejjoud, H., Curie, F., & Grosbois, C. (2024). Analyzing a century of agricultural phosphorus surplus and its long-term key drivers in France. Nutrient Cycling in Agroecosystems, 1-19.
- Guelfi, D.; Nunes, A.P.P.; Sarkis, L.F.; Oliveira, D.P. (2022). Innovative Phosphate Fertilizer Technologies to Improve Phosphorus Use Efficiency in Agriculture. Sustainability, 14, 14266. [CrossRef]
- Hallama, M., Pekrun, C., Lambers, H. et al. (2019). Hidden miners – the roles of cover crops and soil microorganisms in phosphorus cycling through agroecosystems. Plant Soil 434, 7–45. [CrossRef]
- Hammond John P., Martin R. Broadley, Philip J. White. (2004). Genetic Responses to Phosphorus Deficiency, Annals of Botany, Volume 94, Issue 3, Pages 323–332. [CrossRef]
- Hansel, F. D., Ruiz Diaz, D. A., Amado, T. J., & Rosso, L. H. (2017). Deep banding increases phosphorus removal by soybean grown under no-tillage production systems. Agronomy Journal, 109, 1091-1098.
- Haq, M.U. & Mallarino, A.P. (2000). Soybean Yield and Nutrient Composition as Affected by Early Season Foliar Fertilization. Agronomy Journal, 92: 1624. [CrossRef]
- Havlin J., J. Beaton, S. Tisdale & W. Nelson. 2005. Soil Fertility and Fertilizers. Pearson Education Inc. Upper Saddle River, New Jersey, EE.UU. 7th. ed. 515 pag.
- Hedley, M. Mclaughlin, M. (2005). Reactions of phosphate fertilizers and by-products in soils. In: Sims, T. & Sharpley, A. N. (eds.) Phosphorus: Agriculture and the Environment. Madison, WI: American Society of Agronomy, Crop Science Society of America, Soil Science Society of America.
- Hertzberger AJ, Cusick RD, Margenot AJ. (2020). A review and meta-analysis of the agricultural potential of struvite as a phosphorus fertilizer. Soil Science Society of America Journal ; 84: 653–671. [CrossRef]
- Higgins, S., Keesstra, S. D., Kadziuliene, Z., Jordan-Meille, L., Wall, D., Trinchera, A., Spiegel, H., Sandén, T., Baumgarten, A., Jensen, J. L., Hirte, J., Liebisch, F., Klages, S., Löw, P., Kuka, K., De Boever, M., D'Haene, K., Madenoglu, S., Ozcan, H., ... Vervuurt, W. (2022). Fertilisation Strategies across Europe: Current Situation, Potential and Limits for a Harmonised Approach. In Fertilisation Strategies across Europe: Current Situation, Potential and Limits for a Harmonised Approach (Vol. 875). International Fertiliser Society Proceedings. Available at https://papers.ssrn.com/sol3/papers.cfm?abstract_id=4258569.
- Hirzel, J. (2004). Fertilización del Cultivo. (in Spanish) In: Mellado, M. (Ed.), Boletín deTrigo 2004. Manejo Tecnológico. Instituto de Investigaciones Agropecuarias, Chillán, Chile, pp. 49–75.
- Holloway, R E, Bertrand I, Frischke A J, Brace D M, McLaughlin M J & Shepperd W (2001). Improving fertilizer efficiency on calcareous and alkaline soils with fluid sources of P,N and Zn. Plant Soil. 236, 209–219.
- Hopkins, B.G. & Hansen, N.C. (2019). Phosphorus Management in High-Yield Systems. Journal of Environmental Quality, 48: 1265-1280. [CrossRef]
- Hopkins, B.G., Fernelius, K.J., Hansen, N.C. & Eggett, D.L. (2018). AVAIL Phosphorus Fertilizer Enhancer: Meta-Analysis of 503 Field Evaluations. Agronomy Journal, 110: 389-398. [CrossRef]
- Hornung, A., Khosla, R., Reich, R., Inman, D. & Westfall, D.G. (2006). Comparison of Site-Specific Management Zones: Soil-Color-Based and Yield-Based. Agronomy Journal, 98: 407-415. [CrossRef]
- Hue N. (2024). Phosphorus Nutrient in Organic Farming - A Review. Mod Concep Dev Agrono. 13. MCDA. 000820. [CrossRef]
- IFA (2022). Fertilizer use by crop and country for the 2017-2018 period. International Fertilizer Association (IFA), Paris, France; Available at https://www.ifastat.org/consumption/fertilizer-use-by-crop.
- IPNI (2012). 4R Plant Nutrition Manual: A Manual for Improving the Management of Plant Nutrition, (T.W. Bruulsema, P.E. Fixen, G.D. Sulewski eds.), International Plant Nutrition Institute, Norcross, GA, USA. 126 p.
- Jamal A, Saeed MF, Mihoub A, Hopkins BG, Ahmad I & Naeem A (2023). Integrated use of phosphorus fertilizer and farmyard manure improves wheat productivity by improving soil quality and P availability in calcareous soil under subhumid conditions. Front. Plant Sci. 14:1034421. [CrossRef]
- Janssen, B.H., Guiking, F.C.T., van der Eijk, D., Smaling, E.M.A., Wolf, J. & van Reuler, H. (1990). A system for quantitative evaluation of the fertility of tropical soils (QUEFTS). Geoderma, 46:299-318.
- Jobbágy E. G. & O. E. Sala. (2014). The imprint of crop choice on global nutrient needs. Environ. Res. Lett. 9 084014. [CrossRef]
- Johnston, A.E. & Poulton, P.R. (2019). Phosphorus in Agriculture: A Review of Results from 175 Years of Research at Rothamsted, UK. Journal of Environmental Quality, 48: 1133-1144. [CrossRef]
- Johnston A. E., P. R. Poulton, P. E. Fixen, D. Curtin. (2014). Chapter Five - Phosphorus: Its Efficient Use in Agriculture, Editor(s): Donald L. Sparks, Advances in Agronomy, Academic Press, Volume 123, Pages 177-228. [CrossRef]
- Johnston, A.E., Poulton, P.R., White, R.P., MacDonald, A.J., (2016). Determining the longer term decline in plant-available soil phosphorus from short-term measured values. Soil Use Manage. 32, 151–161. [CrossRef]
- Jones, Jr. J.B. (1998). Plant Nutrition Manual. CRC Press. Boca Raton. Florida. USA. 149 pp.
- Jordan-Meille, L., Rubæk, G.H., Ehlert, P.A.I., Genot, V., Hofman, G., Goulding, K., Recknagel, J., Provolo, G. & Barraclough, P. (2012). An overview of fertilizer-P recommendations in Europe: soil testing, calibration and fertilizer recommendations. Soil Use Manage, 28: 419-435. [CrossRef]
- Kalinitchenko V. & V. Nosov. (2019). Phosphogypsum: P Fertilizer By-Product and Soil Amendment. Better Crops Vol. 103 (2019, No. 1) p.50-53.
- Kang, L.Y., Yue, S.C., Li, S.Q., (2014). Effects of phosphorus application in different soil layers on root growth, yield, and water-use efficiency of winter wheat grown under semi-arid conditions. J. Integr. Agr. 13, 2028–2039.
- Karbo, A., Woodard, H. J., & Bly, A. (2017). Crop production impacts on soil phosphorus removal and soil test levels. Journal of Plant Nutrition, 40, 1172–1179. [CrossRef]
- Khurana, H. S., Bijay-Singh, A. D., Phillips, S. B., & Sidhu, A. S. (2008). Site-specific nutrient management performance in a rice-wheat cropping system. Better Crops, 92, 26-28.
- Kitchen, N.R., D.G. Westfall, J.L. Havlin. (1990). Soil sampling under no-till banded phosphorus. Soil Science Society of America Journal 54:1661-1665. [CrossRef]
- Kleinman, P.J.A., Sharpley, A.N., McDowell, R.W. et al. (2011). Managing agricultural phosphorus for water quality protection: principles for progress. Plant Soil 349, 169–182. [CrossRef]
- Kokulan V., K. Schneider, M. L. Macrae, & H. Wilson. (2024). Struvite application to field corn decreases the risk of environmental phosphorus loss while maintaining crop yield. Ag. Eco. Env. 366. [CrossRef]
- Korcak R. (1998). Agricultural uses of phosphogypsum, gypsum, and other industrial byproducts. In: Wright RJ, Robert J, Kemper WD, Millner PD, Power JF, Korcak RF, editors. Agriculture uses of municipal animal, and industrial byproduct. Beltsville (MD): U.S. Department of Agriculture, Agricultural Research Service, Conservation Research Report 44, p. 120–126.
- Krasilnikov, P.; Taboada, M.A.; Amanullah. (2022). Fertilizer Use, Soil Health and Agricultural Sustainability. Agriculture 12, 462. [CrossRef]
- Kumar, S., Sindhu, S. S., & Kumar, R. (2022). Biofertilizers: an ecofriendly technology for nutrient recycling and environmental sustainability. Cur. Res. Microbial. Sci. 3, 100094. [CrossRef]
- Lamba J., A. M. Thompson, K.G. Karthikeyan, J. C. Panuska, L. W. Good. (2016). Effect of best management practice implementation on sediment and phosphorus load reductions at subwatershed and watershed scale using SWAT model. International Journal of Sediment Research 31 (4): 386-394. [CrossRef]
- Lambers H. (2022). Phosphorus Acquisition and Utilization in Plants. Annual Review of Plant Biology Vol. 73:17-42. [CrossRef]
- Lambert, D.M., Lowenberg-DeBoer, J. & Malzer, G. (2007). Managing phosphorous soil dynamics over space and time. Agricultural Economics, 37: 43-53. [CrossRef]
- Lindsay, W.L., Frazier, A.W., Stephenson, H.F. (1962). Identification of reaction products from phosphate fertilizers in soils. Soil Science Society of America Journal 26, 446–452. [CrossRef]
- Lombi, E., M.J. McLaughlin, C. Johnston, R.D. Armstrong, & R.E. Holloway. (2004). Mobility and Lability of Phosphorus from Granular and Fluid Monoammonium Phosphate Differs in a Calcareous Soil. Soil Science Society of America Journal 68:682–689.
- Lombi, E., M.J. McLaughlin, C. Johnston, R.D. Armstrong, & R.E. Holloway. (2005). Mobility, solubility and lability of fluid and granular forms of P fertiliser in calcareous and noncalcareous soils under laboratory conditions. Plant Soil 269:25–34. [CrossRef]
- Lázaro, L.; P.E. Abbate & V.T. Manfreda, (2012). Incidence of the differences in the amount of P exported between wheat cultivars. Agriscientia XXIX: 1-13.
- Leikam D. F., Lamond R, Mengel D. (2003). Providing Flexibility in Phosphorus and Potassium Fertilizer Recommendations. Better Crops with Plant Food, 87, 6–10.
- Leikam D. F., W. N. Sutherland, & E.J. Penas. (1991). Phosphorus Sources for Corn Fertilization. National Corn Handbook NCH-13. Iowa State University Extension. https://store.extension.iastate.edu/product/2883.
- Ling, F., Silberbush, M. (2002). Response of maize to foliar vs. soil application of nitrogen-phosphorus- potassium fertilizers. Journal of Plant Nutrition. 25, 2333-2342.
- Liu, R., Lal, R. (2014) Synthetic apatite nanoparticles as a phosphorus fertilizer for soybean (Glycine max). Sci Rep 4, 5686. [CrossRef]
- Lizcano Toledo, R.; Lerda, C.; Moretti, B.; Miniotti, E.; Santoro, V.; Fernandez-Ondoño, E.; Martin, M.; Said-Pullicino, D.; Romani, M.; Celi, L. (2022). Cover Crops Increase N and P Cycling and Rice Productivity in Temperate Cropping Systems. Agronomy, 12, 2193. [CrossRef]
- López-Arredondo, D.L., & L. Herrera-Estrella. (2012). Engineering phosphorus me tabolism in plants to produce a dual fertilization and weed control system. Nat. Biotechnol. 30:889–893. [CrossRef]
- Lott, J.N.A., Bojarski, M., Kolasa, J., Batten, G.D. & Campbell, L.C. (2009). A review of the phosphorus content of dry cereal and legume crops of the world, Int. J. Agricultural Resources, Governance and Ecology, Vol. 8, Nos. 5/6, pp.351–370.
- Lu, Y., Gao, Y., Nie, J. et al. (2021). Substituting chemical P fertilizer with organic manure: effects on double-rice yield, phosphorus use efficiency and balance in subtropical China. Sci Rep 11, 8629. [CrossRef]
- Ludemann, Cameron I.; Hijbeek, Renske; van Loon, Marloes et al. (2023). Global data on crop nutrient concentration and harvest indices [Dataset]. Dryad. [CrossRef]
- Ludemann, C.I., Hijbeek, R., van Loon, M.P. T. S. Murrell, A. Dobermann, & M. K. van Ittersum. Tiered maize and wheat nutrient removal coefficients estimated from available data. Nutr Cycl Agroecosyst (2024a). [CrossRef]
- Ludemann CI, Wanner N, Chivenge P, Dobermann A, Einarsson R, Grassini P, Gruere A, Jackson K, Lassaletta L, Maggi F, Obli-Laryea G, van Ittersum MK, Vishwakarma S, Zhang X, Tubiello FN (2024b). A global FAOSTAT reference database of cropland nutrient budgets and nutrient use efficiency (1961–2020): nitrogen, phosphorus and potassium. Earth Syst Sci Data 16:525–541.
- Łukowiak R., W. Grzebisz, & G. F. Sassenrath. (2016). New insights into phosphorus management in agriculture — A crop rotation approach. Science of The Total Environment, 542, Part B, 1062-1077. [CrossRef]
- Lun, F. , Liu, J., Ciais, P., Nesme, T., Chang, J., Wang, R., Goll, D., Sardans, J., Peñuelas, J., & Obersteiner, M. (2018). Global and regional phosphorus budgets in agricultural systems and their implications for phosphorus-use efficiency, Earth Syst. Sci. Data, 10, 1–18. [CrossRef]
- Lyons, S. E., Clark, J. D., Osmond, D. L., Parvej, M. R, Pearce, A. W., Slaton, N. A., & Spargo, J. T. (2023). Current status of US soil test phosphorus and potassium recommendations and analytical methods. Soil Science Society of America Journal, 87, 985–998. [CrossRef]
- Lyons SE, Osmond DL, Slaton NA, et al. (2020). FRST: A national soil testing database to improve fertility recommendations. Agric Environ Lett. 5:e20008. [CrossRef]
- Ma, W., L. Ma, J. Li, F. Wang, I. Sisák, F. Zhang. (2011). Phosphorus flows and use efficiencies in production and consumption of wheat, rice, and maize in China. Chemosphere 84: 814–821. [CrossRef]
- MacDonald, G. K., Bennett, E. M., Potter, P. A., & Ramankutty, N. (2011). Agronomic phosphorus imbalances across the world's croplands. Proceedings of the National Academy of Sciences, 108, 3086-3091.
- MacDonald, G.K., Bennett, E.M. & Taranu, Z.E. (2012). The influence of time, soil characteristics, and land-use history on soil phosphorus legacies: a global meta-analysis. Glob Change Biol, 18: 1904-1917. [CrossRef]
- Macik, M., Gryta, A., Frac, M. (2020). Biofertilizers in agriculture: An overview on concepts, strategies, and effects on soil microorganisms. Adv. Agron. 160, 31.
- Maertens, M., Oyinbo, O., Abdoulaye, T., & Chamberlin, J. (2023). Sustainable maize intensification through site-specific nutrient management advice: Experimental evidence from Nigeria. Food Policy, 121, 102546. [CrossRef]
- Malavolta, E., G.C. Vitti, & S.A. de Oliveira. (1997). Avaliação do estado nutricional das plantas: principios e aplicações. 2da Ed. rev e atual. POTAFOS. Piracicaba-SP. 319 pp.
- Malhi, S. S., Johnston, A. M., Schoenau, J. J., Wang, Z. H. & Vera, C. L. (2006). Seasonal biomass accumulation and nutrient uptake of wheat, barley and oat on a Black Chernozem soil in Saskatchewan. Can. J. Plant Sci. 86: 1005–1014.
- Mallarino A. (2003). Field Calibration for Corn of the Mehlich-3 Soil Phosphorus Test with Colorimetric and Inductively Coupled Plasma Emission Spectroscopy Determination Methods. Soil Science Society of America Journal 68:1928-1934.
- Mallarino, A. P., & Blackmer, A. M. (1992). Comparison of methods for determining critical concentrations of soil test phosphorus for corn. Agronomy Journal, 84, 850–856. [CrossRef]
- Mallarino, A.P., Bordoli, J.M. & Borges, R. (1999). Phosphorus and Potassium Placement Effects on Early Growth and Nutrient Uptake of No-Till Corn and Relationships with Grain Yield. Agronomy Journal, 91: 37-45. [CrossRef]
- Mallarino, A.P. , Haq, M.U., Wittry, D. & Bermudez, M. (2001). Variation in Soybean Response to Early Season Foliar Fertilization among and within Fields. Agronomy Journal, 93: 1220-1226. [CrossRef]
- Mallarino A. & J. Sawyer. (2018). Phosphorus and Potassium Tissue Testing in Corn and Soybean. Iowa State University Crop 3153. Ames, Iowa, US. Available at https://store.extension.iastate.edu/product/Phosphorus-and-Potassium-Tissue-Testing-in-Corn-and-Soybean.
- Mallarino A. P., J. E. Sawyer, S. K. Barnhart, & M. A. Licht. (2023). A General Guide for Crop Nutrient and Limestone Recommendations in Iowa. PM 1688 Revised February 2023. Iowa State University. Ames, Iowa, US.
- Mallarino, A.P. & Schepers, J.S. (2005). Role of Precision Agriculture in Phosphorus Management Practices. In Phosphorus: Agriculture and the Environment (eds J. Thomas Sims, A.N. Sharpley & T.C. Daniel). [CrossRef]
- Mallarino, A.P., & D.J. Wittry. (2004). Efficacy of grid and zone soil sampling approaches for site-specific assessment of phosphorus, potassium, pH, and organic matter. Precision Agriculture 5:131-144. [CrossRef]
- Mardamootoo T., C. C. du Preez, & J. H. Barnard. (2021). Phosphorus management issues for crop production: A review. African Journal of Agricultural Research Vol. 17, 939-952. [CrossRef]
- Marschner H (1995). Mineral Nutrition of Higher Plants (2nd edition). Academic, London.
- Martin T. M. P., F. Esculier, F. Levavasseur & S. Houot (2020): Human urine-based fertilizers: A review, Critical Reviews in Environmental Science and Technology. [CrossRef]
- Martinengo, S., Schiavon, M., Santoro, V. et al. (2023). Assessing phosphorus availability in paddy soils: the importance of integrating soil tests and plant responses. Biol Fertil Soils 59, 391–405. [CrossRef]
- Mason, S., McNeill, A., McLaughlin, M.J. et al. (2010). Prediction of wheat response to an application of phosphorus under field conditions using diffusive gradients in thin-films (DGT) and extraction methods. Plant Soil 337, 243–258. [CrossRef]
- McArthur J. W. & G. C. McCord. (2017). Fertilizing growth: Agricultural inputs and their effects in economic development. Journal of Development Economics 127 133–152. [CrossRef]
- McDowell, R.W., Noble, A., Pletnyakov, P. et al. (2023). A Global Database of Soil Plant Available Phosphorus. Sci Data 10, 125. [CrossRef]
- McDowell, R.W., Pletnyakov, P. & Haygarth, P.M. (2024). Phosphorus applications adjusted to optimal crop yields can help sustain global phosphorus reserves. Nat Food 5, 332–339. [CrossRef]
- McLaughlin, M.J., T.M. McBeath, R. Smernik, S.P. Stacey, B. Ajiboye, & C. Guppy. (2011). The chemical nature of P accumulation in agricultural soils: Implications for fertiliser management and design: An Australian perspective. Plant Soil 349:69–87. [CrossRef]
- Mehlich A. (1953). Determination of P, Ca, Mg, K, Na and NH4. North Carolina Soil Test Division. Mimeo 1958. North Carolina, EE.UU.
- Mehlich, A. (1984). Mehlich-3 soil test extractant: A modification of Mehlich 2 extractant. Commun. Soil Sci. Plant Anal. 15:1409–1416.
- Mengel, K. (1997). Agronomic measures for better utilization of soil and fertilizer phosphates. European Journal of Agronomy, 7(1-3), 221-233.
- Mengel K, Kirkby EA (2001). Principles of Plant Nutrition (5th edition). Kluwer, Dordrecht, The Netherlands.
- Merrien, A., G. Arjaure, & C. Maisonneuve. (1986). Besoins en elements minéraux (majeurs, mineurs et oligo-éléments) chez le tornesol dans les conditions francaises. Informations Techniques CETIOM 95:8-19.
- Messiga, A.J., N. Ziadi, D. Plenet, L.-E. Parent, & C. Morel. (2010). Long-term changes in soil phosphorus status related to P budgets under maize monoculture and mineral fertilization. Soil Use and Manage 26: 354–364.
- Meus, L. D., Silva, M. R. Da Ribas, G. G. , Zanon, A. J. , Rossato, I. G. , Pereira, V. F. , Pilecco, I. B. , Ribeiro, B. San Martin Rolim , Souza, P. M. De, Nascimento, M. De F. Do., Poersch, A. H. , Duarte Junior, A. J. , Quintero, C. E. , Carracelas, G. , Carmona, L. De C., Streck, N. A. (2020). Ecofisiología del Arroz Buscando Altos Rendimientos. Santa Maria, RS (Brasil):FieldCrops, 312 p. ISBN 978-65-992356-4-1.
- Meyer, G., Bell, M. J., Kopittke, P. M., Lombi, E., Doolette, C. L., Brunetti, G., Klysubun, W., & Janke, C. K. (2023). Mobility and lability of phosphorus from highly concentrated fertiliser bands. Geoderma, 429, 116248. [CrossRef]
- Mihelcic, J.R., L.M. Fry, & R. Shaw. (2011). Global potential of phosphorus recovery from human urine and feces. Chemosphere 84: 832–839.
- Miransari M. (2011). Soil microbes and plant fertilization. Appl Microbiol Biotechnol 92:875–885. [CrossRef]
- Mogollón J.M., A.H.W. Beusen, H.J.M van Grinsven, H. Westhoek, A.F. Bouwman. (2018). Future agricultural phosphorus demand according to the shared socioeconomic pathways. Global Environmental Change, Volume 50, Pages 149-163, ISSN 0959-3780. [CrossRef]
- Mollier A., S. Pellerin. (1999). Maize root system growth and development as influenced by phosphorus deficiency, Journal of Experimental Botany, Volume 50, Issue 333, Pages 487–497. [CrossRef]
- Montalvo, D., F. Degryse, & M.J. McLaughlin. (2014). Fluid fertilizers improve phosphorus diffusion but not lability in Andisols and Oxisols. Soil Science Society of America Journal 78:214–224. [CrossRef]
- Moody PW, Speirs SD, Scott BJ, Mason SD (2013). Soil phosphorus tests I: What soil phosphorus pools and processes do they measure? Crop & Pasture Science 64, 461–468.
- Morgan M.F. (1941). Chemical soil diagnosis by the Universal Soil Testing System. CT Agric. Exp. Sta. Bull. 450. Connecticut, EE.UU.
- Morse, G. K., Brett, S. W., Guy, J. A., & Lester, J. N. (1998). Review: phosphorus removal and recovery technologies. Science of the Total Environment, 212, 69–81. [CrossRef]
- Mosali, J., Desta, K., Teal, R. K., Freeman, K. W., Martin, K. L., Lawles, J. W., & Raun, W. R. (2006). Effect of Foliar Application of Phosphorus on Winter Wheat Grain Yield, Phosphorus Uptake, and Use Efficiency. Journal of Plant Nutrition, 29, 2147–2163. [CrossRef]
- Mubeena, P., A.S. Halepyati, & Chittapur, B.M. (2019). Effect of Date of Sowing and Nutrient Management on Nutrient Uptake and Yield of Foxtail Millet (Setaria italica L.). International Journal of Bio-resource and Stress Management, 10, 092-095. [CrossRef]
- Murrell, T.S. (2008). Measuring Nutrient Removal, Calculating Nutrient Budgets. In Soil Science Step-by-Step Field Analysis (eds S. Logsdon, D. Clay, D. Moore & T. Tsegaye). [CrossRef]
- Najdenko, E., Lorenz, F., Dittert, K., & Olfs, H. W. (2024). Rapid in-field soil analysis of plant-available nutrients and pH for precision agriculture—A review. Precision Agriculture, 25, 3189-3218.
- Nakayama, Y., Leon, P., Douglass, M., Becker, T., & Margenot, A. (2024). Optimum source, rate, timing, and placement of phosphorus fertilizer for Illinois soybean. Agronomy Journal, 116, 3300–3314. [CrossRef]
- Nash D., Hannah M., Clemow L., Halliwell D. , Webb B. Chapman D. (2003). A laboratory study of phosphorus mobilisation from commercial fertilisers. Soil Research 41, 1201-1212. [CrossRef]
- Nelson, N. O., & Janke, R. R. (2007). Phosphorus Sources and Management in Organic Production Systems. HortTechnology 17, 442-454. Retrieved Oct 9, 2024. [CrossRef]
- Nguyen, D. N., Nguyen, T. T., Tran, Q. N., Macdonald, B., To, T. P., Tran, D. V., & Nguyen, Q. V. (2017). Soil and Rice Responses to Phosphate Fertilizer in Two Contrasting Seasons on Acid Sulfate Soil. Communications in Soil Science and Plant Analysis, 48, 615–623. [CrossRef]
- Nishigaki, T., Tsujimoto, Y., Rinasoa, S. et al. (2019). Phosphorus uptake of rice plants is affected by phosphorus forms and physicochemical properties of tropical weathered soils. Plant Soil 435, 27–38. [CrossRef]
- Njoroge, S., Schut, A. G. T., Giller, K. E., & Zingore, S. (2019). Learning from the soil's memory: Tailoring of fertilizer application based on past manure applications increases fertilizer use efficiency and crop productivity on Kenyan smallholder farms. European Journal of Agronomy, 105, 52-61. [CrossRef]
- Nkebiwe, P.M., M. Weinmann, A. Bar-Tal, & T. Müller. (2016). Fertilizer placement to improve crop nutrient acquisition and yield: A review and meta-analysis. Field Crops Res. 196:389–401. [CrossRef]
- Noack S. R., McBeath T. M., McLaughlin M. J. (2010). Potential for foliar phosphorus fertilisation of dryland cereal crops: a review. Crop and Pasture Science 61, 659-669.
- Noonari, S., Kalhoro, S. , Ali, A. , Mahar, A. , Raza, S. , Ahmed, M. , Shah, S. & Baloch, S. (2016). Effect of Different Levels of Phosphorus and Method of Application on the Growth and Yield of Wheat. Natural Science, 8, 305-314. [CrossRef]
- Norton, R.M. (2016). Nutrient Performance Indicators IPN00003 – A Scoping Study to Investigate the Development of Grains Industry Benchmarks Partial Factor Productivity, Partial Nutrient Balance, and Agronomic Efficiency of Nitrogen, Phosphorus, Potassium, and Sulfur. International Plant Nutrition Institute (IPNI), Horsham, Victoria. 95pp.
- Nunes RS, de Sousa DMG, Goedert WJ, de Oliveira LEZ, Pavinato PS & Pinheiro TD (2020). Distribution of Soil Phosphorus Fractions as a Function of Long-Term Soil Tillage and Phosphate Fertilization Management. Front. Earth Sci. 8:350. [CrossRef]
- Olsen S.R., C.V. Cole, F.S. Watanabe & L.A. Dean (1954). Estimation of available P in soils by extraction with sodium bicarbonate. USDA Circ. 939.
- Olson, R. A. , Anderson, F. N., Frank, K. D., Grabouski, P. H., Rehm, G. W., & Shapiro, C. A. (2015). Soil testing interpretations: Sufficiency vs. build-up and maintenance. In J. R. Brown (Ed.), Soil testing: Sampling, correlation, calibration, and interpretation (Vol. 21, pp. 41–52). SSSA. [CrossRef]
- Osborne, S. L., Schepers, J. S., & Schlemmer, M. R. (2004). Detecting nitrogen and phosphorus stress in corn using multi-spectral imagery. Communications in Soil Science and Plant Analysis, 35(3-4), 505-516.
- Osmond, D., Bolster, C., Sharpley, A., Cabrera, M., Feagley, S., Forsberg, A., Mitchell, C., Mylavarapu, R., Oldham, J.L., Radcliffe, D.E., Ramirez-Avila, J.J., Storm, D.E., Walker, F. & Zhang, H. (2017). Southern Phosphorus Indices, Water Quality Data, and Modeling (APEX, APLE, and TBET) Results: A Comparison. Journal of Environmental Quality, 46: 1296-1305. [CrossRef]
- Osmond, D.L., Shober, A.L., Sharpley, A.N., Duncan, E.W. & Hoag, D.L.K. (2019). Increasing the Effectiveness and Adoption of Agricultural Phosphorus Management Strategies to Minimize Water Quality Impairment. Journal of Environmental Quality, 48: 1204-1217. [CrossRef]
- Outbakat, M. , Choukr-Allah, R., Bouray, M., EL Gharous, M., EL Mejahed, K. (2023). Phosphogypsum: Properties and Potential Use in Agriculture. In: Choukr-Allah, R., Ragab, R. (eds) Biosaline Agriculture as a Climate Change Adaptation for Food Security. Springer, Cham. [CrossRef]
- Pampolino, M., Witt, C., Pasuquin, J.M., Johnston, A., Fisher, M.J. (2012). Development approach and evaluation of the Nutrient Expert software for nutrient management in cereal crops. Comput. Electron. Agric. 88, 103–110.
- Paramesh V, Mohan Kumar R, Rajanna GA, Gowda S, Nath AJ, Madival Y, Jinger D, Bhat S & Toraskar S (2023). Integrated nutrient management for improving crop yields, soil properties, and reducing greenhouse gas emissions. Front. Sustain. Food Syst. 7:1173258. [CrossRef]
- Pavinato, P.S., Cherubin, M.R., Soltangheisi, A. et al. (2020). Revealing soil legacy phosphorus to promote sustainable agriculture in Brazil. Sci Rep 10, 15615. [CrossRef]
- Payne, W.A., Hossner, L.R., Onken, A.B. & Wendt, C.W. (1995). Nitrogen and Phosphorus Uptake in Pearl Millet and Its Relation to Nutrient and Transpiration Efficiency. Agronomy Journal, 87: 425-431. [CrossRef]
- Pearce, A. W., Slaton, N. A., Lyons, S. E., Bolster, C. H., Bruulsema, T. W., Grove, J. H., Jones, J. D., McGrath, J. M., Miguez, F. E., Nelson, N. O., Osmond, D. L., Parvej, M. R., Pena-Yewtukhiw, E. M., & Spargo, J. T. (2022). Defining relative yield for soil test correlation and calibration trials in the Fertilizer Recommendation Support Tool. Soil Science Society of America Journal, 86, 1338–1353. [CrossRef]
- Pellerin, S., Mollier, A. & Plénet, D. (2000). Phosphorus Deficiency Affects the Rate of Emergence and Number of Maize Adventitious Nodal Roots. Agronomy Journal, 92: 690-697. [CrossRef]
- Penn, C. J., & Camberato, J. J. (2019). A Critical Review on Soil Chemical Processes that Control How Soil pH Affects Phosphorus Availability to Plants. Agriculture, 9, 120. [CrossRef]
- Peñuelas J. & J. Sardans. (2022). The global nitrogen-phosphorus imbalance. Science, 375 (6578). [CrossRef]
- Pierzynski, J. & Hettiarachchi, G.M. (2018). Reactions of Phosphorus Fertilizers with and without a Fertilizer Enhancer in Three Acidic Soils with High Phosphorus-Fixing Capacity. Soil Science Society of America Journal, 82: 1124-1139. [CrossRef]
- Pierzynski, G.M. , McDowell, R.W. & Thomas Sims, J. (2005). Chemistry, Cycling, and Potential Movement of Inorganic Phosphorus in Soils. In Phosphorus: Agriculture and the Environment (eds J. Thomas Sims, A.N. Sharpley & D.T. Westermann). [CrossRef]
- Plank, C.O., & S.J. Donohue. (2000). Reference sufficiency ranges, field crops: Small Grains. N.C. Department of Agriculture and Consumer Services. https://www.ncagr.gov/Divisions/Agronomic-Services.
- Pothuluri, J. V., Kissel, D. E., Whitney, D. A., & Thien, S. J. (1986). Phosphorus uptake from soil layers having different soil test phosphorus levels 1. Agronomy Journal, 78, 991-994.
- Prashanth D V, R Krishnamurthy & D V Naveen. (2019). Long-term Effect of Integrated Nutrient Management on Soil Nutrient Status, Content and Uptake by Finger Millet Crop in a TypicKandiustalf of Eastern Dry Zone of Karnataka, Communications in Soil Science and Plant Analysis. [CrossRef]
- Preston, C.L., Ruiz Diaz, D.A. & Mengel, D.B. (2019). Corn Response to Long-Term Phosphorus Fertilizer Application Rate and Placement with Strip-Tillage. Agronomy Journal, 111: 841-850. [CrossRef]
- Prochnow L. I., L. E. Caires, & C. Rodriguez. (2016). Phosphogypsum Use to Reduce Subsoil Acidity: The Brazilian Experience. Better Crops 100 (2): 13-15.
- Prochnow, L. I., Chien, S. H., Carmona, G., Dillard, E. F., Henao, J., & Austin, E. R. (2008). Plant availability of phosphorus in four superphosphate fertilizers varying in water-insoluble phosphate compounds. Soil Science Society of America Journal 72, 462–470.
- Prochnow, L. I.; Van Raij, B.; Kiehl, J. C. (2002). Effect of Water and Citrate Solubility on Agronomic Effectiveness of Acidulated Phosphates in Three Consecutive Corn Crops. Revista Brasileira de Ciência do Solo, vol. 26, núm. 3, pp. 729-736 Sociedade Brasileira de Ciência do Solo Viçosa, Brasil.
- Qaswar, M. Qaswar, M., Dongchu, L., Jing, H. et al. (2020). Interaction of liming and long-term fertilization increased crop yield and phosphorus use efficiency (PUE) through mediating exchangeable cations in acidic soil under wheat–maize cropping system. Sci Rep 10, 19828. [CrossRef]
- Quintero, C. E., Boschetti, N. G., & Benavidez, R. A. (2003). Effect of Soil Buffer Capacity on Soil Test Phosphorus Interpretation and Fertilizer Requirement. Communications in Soil Science and Plant Analysis, 34(9–10), 1435–1450. [CrossRef]
- Quintero, C.E., Gutiérrez-Boem, F., Befani Romina, M. & Boschetti, N.G. (2007). Effects of soil flooding on P transformations in soils of the Mesopotamia region, Argentina. Z. Pflanzenernähr. Bodenk., 170: 500-505. [CrossRef]
- Rabuffetti, A. (2017). La fertilidad del suelo y su manejo. Montevideo: Hemisferio Sur. Vo. 2 Cap. 9 pp. 397-513.
- Raij van, B., Cantarella H., Quaggio, J. A., & Furlani, A. M. (ed.) (1996). Recomendações de adubação e calagem para o Estado de Sao Paulo. Bol. Tec. 100. 2 ed. Campinas, SP, Brazil. Instituto Agronômica e Fundação IAC. 285p.
- Raij van, B., Quaggio, J. A., & da Silva, N. M. (1986). Extraction of phosphorus, potassium, calcium, and magnesium from soils by an ion-exchange resin procedure. Communications in Soil Science and Plant Analysis, 17, 547–566. [CrossRef]
- Rakotoson, T., Tsujimoto, Y., & Nishigaki, T. (2022). Phosphorus management strategies to increase lowland rice yields in sub-Saharan Africa: A review. Field Crops Research, 275, 108370.
- Randall, G.W., Evans, S.D. & Iragavarapu, T.K. (1997). Long-Term P and K Applications: II. Effect on Corn and Soybean Yields and Plant P and K Concentrations. Journal of Production Agriculture, 10: 572-580. [CrossRef]
- Raniro, H.R., Papera, J., José, L.U. et al. (2023). New investments in phosphorus research and training are paramount for Brazilian long-term environmental and food security. Environ Syst Decis 43, 504–508. [CrossRef]
- Rashid, A., Z.I. Awan, & J. Ryan. (2005). Diagnosing phosphorus deficiency in spring wheat by plant analysis: Proposed critical concentration ranges. Communications in Soil Science and Plant Analysis 36:609–622.
- Rayne, N.; Aula, L. (2020). Livestock Manure and the Impacts on Soil Health: A Review. Soil Syst. , 4, 64. [CrossRef]
- Reussi Calvo, N. I., Cortez, D., Crespo, C., Wyngaard, N., Terrazas, J., Paz, C., Trujillo, R., Correndo, A., & Garcia, F. O. (2025). Soil test correlation of Olsen-P for corn and soybean in a subtropical humid region. Agronomy Journal, 117, e70009. [CrossRef]
- Richardson, A.E., Lynch, J.P., Ryan, P.R. et al. (2011). Plant and microbial strategies to improve the phosphorus efficiency of agriculture. Plant Soil 349, 121–156. [CrossRef]
- Roberts Terry L., A. Edward Johnston. (2015). Phosphorus use efficiency and management in agriculture. Resources, Conservation and Recycling, Volume 105, Part B, Pages 275-281, ISSN 0921-3449. [CrossRef]
- Rockström, J., Edenhofer, O., Gaertner, J. et al. (2020). Planet-proofing the global food system. Nat Food 1, 3–5. [CrossRef]
- Rodríguez D, Andrade FH, Goudriaan J (1999). Effects of phosphorus nutrition on tiller emergence in wheat. Plant Soil 209, 283–295. [CrossRef]
- Ros, M.B.H., Koopmans, G.F., van Groenigen, K.J. et al. (2020). Towards optimal use of phosphorus fertiliser. Sci Rep 10, 17804. [CrossRef]
- Roy, E., Richards, P., Martinelli, L. et al. The phosphorus cost of agricultural intensification in the tropics. Nature Plants 2, 16043 (2016). [CrossRef]
- Rubio, G., Cabello, M. J., Gutiérrez Boem, F. H., & Munaro, E. (2008). Estimating available soil phosphorus increases after phosphorus additions in Mollisols. Soil Science Society of America Journal, 72, 1721-1727.
- Sadzawka, A., Molina, R. (2005). Capacidad Tampón de Fósforo. Método de Determinación en el Laboratorio. (in Spanish) Informaciones Agronómicas 25,12–13. IPNI. Available at https://fertilizar.org.ar/wp-content/uploads/2005/03/Sadzawka-Pdeterminacio%CC%81n.pdf.
- Sainz Rozas H.R., Eyherabide M., Larrea G., Martínez Cuesta N., Angelini H., Reussi-Calvo N., Wyngaard N. (2019). Relevamiento y determinación de propiedades químicas en suelos de aptitud agrícola de la regi´on pampeana. Actas Simposio Fertilidad. Rosario, Argentina, 8-9 mayo 2019, pp141-158.
- Saito, K.; Vandamme, E.; Tanaka, A.; Senthilkumar, K.; Dieng, I.; Gbaguidi, F.; Segda, Z.; Bassoro, I.; Lamare, D.; Gbakatchetche, H.; Abera, B.B.; Jaiteh, F.; Bam, R.K.; Johnson, J.M.; Dogbe, W.; Sekou, K.; Rabeson, R.; Kamissoko, N.; Mossi, I.M.; Tarfa, B.D.; Bakare, S.O.; Kalisa, A.; Baggie, I.; Kajiru, G.J.; Ablede, K.; Ayeva, T.; Nanfumba, D.; Wopereis, M.C.S. (2019). Yield-limiting macronutrients for rice in sub-Saharan Africa. Geoderma. ISSN 0016-7061. 338. pp 546-554.
- Sandaña P. & D. Pinochet. (2011). Ecophysiological determinants of biomass and grain yield of wheat under P deficiency. Field Crops Research 120 (2011) 311–319.
- Sanusan, S., Polthanee, A., Seripong, S., Audebert, A., & Mouret, J. C. (2009). Rates and timing of phosphorus fertilizer on growth and yield of direct-seeded rice in rain-fed conditions. Acta Agriculturae Scandinavica, Section B — Soil & Plant Science, 59, 491–499. [CrossRef]
- Salvagiotti F., L. Magnano, O. Ortez, J. Enrico, M. Barraco, P. Barbagelata, A. Condori, G. Di Mauro, A. Manlla, J. Rotundo, F. O. García, M. Ferrari, V. Gudelj, e I. Ciampitti (2021). Estimating nitrogen, phosphorus, potassium, and sulfur uptake and requirement in soybean. European Journal of Agronomy, Volume 127, 126289. [CrossRef]
- Sapkota, T.B., Jat, M.L., Rana, D.S. et al. (2021). Crop nutrient management using Nutrient Expert improves yield, increases farmers’ income and reduces greenhouse gas emissions. Sci Rep 11, 1564. [CrossRef]
- Sattari, S.Z., van Ittersum, M.K., Bouwman, A.F., Smit, A.L., Janssen, B.H. (2014). Crop yield response to soil fertility and N, P, K inputs in different environments: testing and improving the QUEFTS model. Field Crops Res. 157, 35–46.
- Savala C. E. N., Wiredu A. N., Okoth J. O., Kyei-Boahen S. (2021). Inoculant, nitrogen and phosphorus improves photosynthesis and water-use efficiency in soybean production. The Journal of Agricultural Science 159, 349–362. [CrossRef]
- Schepers, J.S., Schlemmer, M.R. & Ferguson, R.B. (2000). Site-Specific Considerations for Managing Phosphorus. Journal of Environmental Quality, 29: 125-130. [CrossRef]
- Schlindwein, J. , Bortolon, L. , Fioreli-Pereira, E. , Oliveira Bortolon, E. & Gianello, C. (2013). Phosphorus and potassium fertilization in no till southern Brazilian soils. Agricultural Sciences, 4, 39-49. [CrossRef]
- Scholz, R. W., Wellmer, F. W., Mew, M., & Steiner, G. (2025). The dynamics of increasing mineral resources and improving resource efficiency: Prospects for mid-and long-term security of phosphorus supply. Resources, Conservation and Recycling, 213, 107993.
- Schoumans, O.F., Bouraoui, F., Kabbe, C., Oenema, O., van Dijk, K.C. (2015). Phosphorus management in Europe in a changing world. Ambio 44 (Suppl. 2), S180–S192. [CrossRef]
- Schröder, J.J.; Smit, A.L.; Cordell, D.; Rosemarin, A. (2011). Improved phosphorus use efficiency in agriculture: A key requirement for its sustainable use. Chemosphere , 84, 822–831.
- Schut, A. G. T., & Giller, K. E. (2020). Soil-based, field-specific fertilizer recommendations are a pipe-dream. Geoderma, 380, Article 114680. [CrossRef]
- Seleiman, M.F.; Almutairi, K.F.; Alotaibi, M.; Shami, A.; Alhammad, B.A.; Battaglia, M.L. (2021). Nano- Fertilization as an Emerging Fertilization Technique: Why Can Modern Agriculture Benefit from Its Use? Plants, 10, 2. [CrossRef]
- Selim, M. M. (2020). Introduction to the integrated nutrient management strategies and their contribution to yield and soil properties. International Journal of Agronomy, (1), 2821678.
- Selles, F., Campbell, C. A., Zentner, R. P., Curtin, D., James, D. C. & Basnyat, P. (2011). Phosphorus use efficiency and long-term trends in soil available phosphorus in wheat production systems with and without nitrogen fertilizer. Can. J. Soil Sci. 91:39-52.
- Setiyono, T. D., Walters, D. T., Cassman, K. G., Witt, C., & Dobermann, A. (2010). Estimating maize nutrient uptake requirements. Field Crops Research, 118, 158-168.
- Shah A, Nazari M, Antar M, Msimbira LA, Naamala J, Lyu D, Rabileh M, Zajonc J & Smith DL. (2021). PGPR in Agriculture: A Sustainable Approach to Increasing Climate Change Resilience. Front. Sustain. Food Syst. 5:667546. [CrossRef]
- Sharifi, S.; Shi, S.; Obaid, H.; Dong, X.; He, X. (2024). Differential Effects of Nitrogen and Phosphorus Fertilization Rates and Fertilizer Placement Methods on P Accumulations in Maize. Plants, 13, 1778. [CrossRef]
- Sharpley, A.N., Bergström, L., Aronsson, H. et al. (2015). Future agriculture with minimized phosphorus losses to waters: Research needs and direction. AMBIO 44 (Suppl 2), 163–179. [CrossRef]
- Sharpley, A.N., Daniel, T., Gibson, G., Bundy, L., Cabrera, M., Sims, T., Stevens, R., Lemunyon, J., Kleinman, P.J., Parry, R. (2006). Best management practices to minimize agricultural phosphorus impacts on water quality. Agricultural Research Service Publication. 52 p.
- Sharpley A., P. Kleinman & J. Weld. (2004). Assessment of best management practices to minimise the runoff of manure-borne phosphorus in the United States, New Zealand Journal of Agricultural Research, 47:4, 461-477. [CrossRef]
- Sharpley, A.N., J. L. Weld, D.B. Beegle, P.J.A. Kleinman, W.J. Gburek, P.A. Moore, Jr., & G. Mullins. (2003). Development of Phosphorus Indices for nutrient management planning strategies in the United States. J. Soil Water Conserv, 58:137–151.
- Shen J., L. Yuan, J. Zhang, H. Li, Z. Bai, X. Chen, W. Zhang, F. Zhang. (2011). Phosphorus Dynamics: From Soil to Plant, Plant Physiology, Volume 156, Issue 3, Pages 997–1005. [CrossRef]
- Shuai, X., Ma, L. & Wendroth, O. (2018). Unified Weak and Strong Soil Tests to Estimate Intrinsic Plant Available Phosphorus Pools. Agronomy Journal, 110: 859 -867. [CrossRef]
- Sims J.T. (2000). Soil fertility evaluation. En M.E. Sumner (ed.). Handbook of Soil Science. CRC Press. Boca Raton, FL. pp. D113-D153.
- Singh, G.; Kaur, G.; Williard, K.; Schoonover, J.; Nelson, K.A. (2020). Managing Phosphorus Loss from Agroecosystems of the Midwestern United States: A Review. Agronomy, 10, 561. [CrossRef]
- Singh, S.K., Reddy, V.R. & Sicher, R.C. (2018). Seasonal critical concentration and relationships of leaf phosphorus and potassium status with biomass and yield traits of soybean. J. Plant Nutr. Soil Sci., 181: 575-585. [CrossRef]
- Slaton, N.A., Wilson, C.E., Norman, R.J., Ntamatungiro, S. & Frizzell, D.L. (2002), Rice Response to Phosphorus Fertilizer Application Rate and Timing on Alkaline Soils in Arkansas. Agronomy Journal, 94: 1393-1399. [CrossRef]
- Smit, A.L. M. Blom-Zandstra, A. van der Werf, & Bindraban, P.S. (2013). Plant strategies and cultural practices to improve the uptake of indigenous soil P and the efficiency of fertilization. VFRC Report 2013/14. Washington DC, USA. 34 p. https://hub.ifdc.org/items/28097750-567a-4035-9ae9-5f073eed9cd5.
- Smith, Douglas R., et al. (2015). Phosphorus Losses from Monitored Fields with Conservation Practices in the Lake Erie Basin, USA.” Ambio, vol. 44, pp. S319–31. JSTOR, http://www.jstor.org/stable/24670883. Accessed 5 Nov. 2024.
- Soltanpour P.W.& A.P. Schwab. (1977). A new soil test for simultaneous extraction of macro-micronutrients in alkaline soils. Communications in Soil Science and Plant Analysis 8:195-207.
- Sousa, D.M.G.; Lobato, E. & Rein, T.A. (2002). Adubação com fósforo. In: Sousa, D.M.G. & Lobato, E., eds. Cerrado: correção do solo e adubação. Planaltina, Embrapa Cerrados,. p.147-168.
- Speirs, S. D., Scott, B. J., Moody, P. W., & Mason, S. D. (2013). Soil phosphorus tests II: A comparison of soil test–crop response relationships for different soil tests and wheat. Crop and Pasture Science, 64, 469-479.
- Stamm, C., Binder, C.R., Frossard, E. et al. (2022). Towards circular phosphorus: The need of inter- and transdisciplinary research to close the broken cycle. Ambio 51, 611–622. [CrossRef]
- Stammer, A.J. & Mallarino, A.P. (2018). Plant Tissue Analysis to Assess Phosphorus and Potassium Nutritional Status of Corn and Soybean. Soil Science Society of America Journal, 82: 260-270. [CrossRef]
- Steeneken, P.G., Kaiser, E., Verbiest, G.J. et al. (2023). Sensors in agriculture: towards an Internet of Plants. Nat Rev Methods Primers 3, 60. [CrossRef]
- Stewart W., D. Dibb, A. Johnston & T. Smyth. (2005a). The contribution of commercial fertilizer nutrients to food production. Agronomy Journal 97:1-6.
- Stewart, W.M., Hammond, L.L. & Van Kauwenbergh, S.J. (2005b). Phosphorus as a Natural Resource. In Phosphorus: Agriculture and the Environment (eds J. Thomas Sims, A.N. Sharpley & G.M. Pierzynski). [CrossRef]
- Steinfurth, K., Börjesson, G., Denoroy, P., Eichler-Löbermann, B., Gans, W., Heyn, J., Hirte, J., Jansen, F., Koch, D., Merbach, I., Mollier, A., Morel, C., Panten, K., Peiter, E., Poulton, P. R., Reitz, T., Rubæk, G. H., Spiegel, H., van Laak, M., … Buczko, U. (2024). Decrease in soil test phosphorus levels under omitted phosphorus fertilizer application. Soil Use and Management, 40, e13088. [CrossRef]
- Stutter, M.I. (2015). The composition, leaching, and sorption behavior of some alternative sources of phosphorus for soils. AMBIO 44 (Suppl 2), 207–216. [CrossRef]
- Sucunza, F.A., Gutiérrez Boem, F.H., García, F.O., Boxler, M. & Rubio, G. (2018). Long-term phosphorus fertilization of wheat, soybean and maize on Mollisols: Soil test trends, critical levels and balances. European Journal of Agronomy, 96, 87-95.
- Suh, S., Yee, S. (2011). Phosphorus use-efficiency of agriculture and food system in the US. Chemosphere 84, 806e813. [CrossRef]
- Syers, J.K., Johnston, A.E., Curtin, D. (2008). Efficiency of Soil and Fertilizer Phosphorus. Food and Agriculture Organization of the United Nations, FAO Fertilizer and Plant Nutrition Bulletin 18, 107 pp.
- Talboys PJ, Healey JR, Withers PJA, Roose T, Edwards AC, Pavinato PS & Jones DL. (2020). Combining Seed Dressing and Foliar Applications of Phosphorus Fertilizer Can Give Similar Crop Growth and Yield Benefits to Soil Applications Together With Greater Recovery Rates. Front. Agron. 2:605655. [CrossRef]
- Talboys, P.J.; Heppell, J.; Roose, T.; Healey, J.R.; Jones, D.L.; Withers, P.J.A. (2016). Struvite: A Slow-Release Fertiliser for Sustainable Phosphorus Management? Plant Soil, 401, 109–123.
- Tang, X., Ma, Y., Hao, X. et al. (2009). Determining critical values of soil Olsen-P for maize and winter wheat from long-term experiments in China. Plant Soil 323, 143–151. [CrossRef]
- Thien, S.J. & Myers, R. (1992). Determination of Bioavailable Phosphorus in Soil. Soil Science Society of America Journal, 56: 814-818. [CrossRef]
- Tiecher, T., Fontoura, S. M., Ambrosini, V. G., Araújo, E. A., Alves, L. A., Bayer, C., & Gatiboni, L. C. (2023). Soil phosphorus forms and fertilizer use efficiency are affected by tillage and soil acidity management. Geoderma, 435, 116495.
- Tonini, D., Saveyn, H.G.M. & Huygens, D. (2019). Environmental and health co-benefits for advanced phosphorus recovery. Nat Sustain 2, 1051–1061. [CrossRef]
- Torri SI, Correa RS, Renella G. (2017). Biosolid application to agricultural land—a contribution to global phosphorus recycle: a review. Pedosphere;27,1–16.
- Valkama, E., Uusitalo, R., Ylivainio, K., Virkajärvi, P., & Turtola, E. (2009). Phosphorus fertilization: A meta-analysis of 80 years of research in Finland. Agriculture, Ecosystems & Environment, 130(3-4), 75-85.
- Vance, C.P., C. Uhde-Stone, & D.L. Allan. (2003). Phosphorus acquisition and use: Critical adaptations by plants for securing a nonrenewable resource. New Phytol. 157:423–448.
- Vanlauwe, B. , Amede, T., Bationo, A., Bindraban, P., Breman, H., Cardinae, R., Couede, A., Chivenge, P., Corbeels, M., Dobermann, A., Falconnier, G., Fatunbi, W., Giller, K., Harawa, R., Kamau, M., Merckx, R., Palm, C., Powlson, D. S., Rusinamhodzi, L., Six, J., Singh, U., Stewart, Z., Ittersum, M. V., Witt, C., Zingore, S. & Groot, R. (2023). Fertilizer and Soil Health in Africa The Role of Fertilizer in Building Soil Health to Sustain Farming and Address Climate Change. in: Fertilizer and Soil Health in Africa: The role of fertilizer in building soil health to sustain farming and address climate change International Fertilizer Development Center - IFDC.
- van de Wiel, C.C.M., van der Linden, C.G. & Scholten, O.E. (2016). Improving phosphorus use efficiency in agriculture: opportunities for breeding. Euphytica 207, 1–22. [CrossRef]
- Veneklaas, E.J., Lambers, H., Bragg, J., Finnegan, P.M., Lovelock, C.E., Plaxton, W.C., Price, C.A., Scheible, W.-R., Shane, M.W., White, P.J. & Raven, J.A. (2012). Opportunities for improving phosphorus-use efficiency in crop plants. New Phytologist, 195: 306-320. [CrossRef]
- Vera-Morales, M.; López Medina, S.E.; Naranjo-Morán, J.; Quevedo, A.; Ratti, M.F. (2023). Nematophagous Fungi: A Review of Their Phosphorus Solubilization Potential. Microorganisms, 11, 137. [CrossRef]
- Vieira, R. C. B., Fontoura, S. M. V., Bayer, C., Moraes, R. P. de, & Carniel, E. (2015). Adubação Fosfatada para Alta Produtividade de Soja, Milho e Cereais de Inverno Cultivados em Rotação em Latossolos em Plantio Direto no Centro-Sul do Paraná. Revista Brasileira De Ciência Do Solo, 39, 794–808. [CrossRef]
- Vilela de Resende, A., Furtini Neto, A. E., Carvalho Alves, V. M., Muniz, J. A., Curi, N., Faquin, V., Ioshiteru Kimpara, D., Lopes Santos, J. Z. & Carneiro L. F. (2006). Fontes e modos de aplicação de fósforo para o milho em solo cultivado da região do Cerrado. Revista Brasileira de Ciência do Solo.; 30,453-466. [CrossRef]
- Walker F. (2023). Best management practices for phosphorus in the environment. Agricultural Extension Service. University of Tennesse PB1645. https://utia.tennessee.edu/publications/wp-ontent/uploads/sites/269/2023/10/PB1645.pdf.
- Wall D. P. & N. T. McDonald. (2015). Phosphorus fertilisation: Achieving agronomic and environmental goals. Proceedings 779, International Fertiliser Society.
- Wang, J.; Xue, L.; Hou, P.; Hao, T.; Xue, L.; Zhang, X.; Sun, T.; Lobanov, S.; Yang, L. (2023). Struvite as P Fertilizer on Yield, Nutrient Uptake and Soil Nutrient Status in the Rice–Wheat Rotation System: A Two-Year Field Observation. Agronomy, 13, 2948. [CrossRef]
- Wang Z.Z., Zhang T.Q., Tan C.S., Qi Z.M. (2020). Modeling of phosphorus loss from field to watershed: A review. Journal of Environmental Quality; 49: 1203–1224. [CrossRef]
- Waraich, E. A., Ahmad, R., Ashraf, M. Y., Saifullah, & Ahmad, M. (2011). Improving agricultural water use efficiency by nutrient management in crop plants. Acta Agriculturae Scandinavica, Section B — Soil & Plant Science, 61, 291–304. [CrossRef]
- Weaver, D.M., Wong, M.T.F. (2011). Scope to improve phosphorus (P) management and balance efficiency of crop and pasture soils with contrasting P status and buffering indices. Plant Soil 349, 37–54. [CrossRef]
- Weeks Jr, J. J., & Hettiarachchi, G. M. (2019). A review of the latest in phosphorus fertilizer technology: possibilities and pragmatism. Journal of Environmental Quality, 48, 1300-1313.
- White P. J. & P. H. Brown. (2010). Plant nutrition for sustainable development and global health. Annals of Botany 105: 1073–1080. available online at www.aob.oxfordjournals.org. [CrossRef]
- White P. J. & J. P. Hammond. (2008). Phosphorus nutrition of terrestrial plants. In P.J. White, J.P. Hammond (eds.) The Ecophysiology of Plant-Phosphorus Interactions, 51, Springer Science + Business Media B.V. pp. 51-81.
- Withers, P.J.A., Rodrigues, M., Soltangheisi, A. et al. (2018). Transitions to sustainable management of phosphorus in Brazilian agriculture. Sci Rep 8, 2537. [CrossRef]
- Withers P. J. A., R. Sylvester-Bradley, D. L. Jones, J. R. Healey, & P. J. Talboys. (2014). Feed the Crop Not the Soil: Rethinking Phosphorus Management in the Food Chain. Environmental Science & Technology 48 (12), 6523-6530. [CrossRef]
- Withers, P.J.A., Vadas, P.A., Uusitalo, R., Forber, K.J., Hart, M., Foy, R.H., Delgado, A., Dougherty, W., Lilja, H., Burkitt, L.L., Rubæk, G.H., Pote, D., Barlow, K., Rothwell, S. & Owens, P.R. (2019). A Global Perspective on Integrated Strategies to Manage Soil Phosphorus Status for Eutrophication Control without Limiting Land Productivity. Journal of Environmental Quality, 48: 1234-1246. [CrossRef]
- Withers, P.J.A., van Dijk, K.C., Neset, TS.S. et al. (2015). Stewardship to tackle global phosphorus inefficiency: The case of Europe. AMBIO 44 (Suppl 2), 193–206. [CrossRef]
- Wortmann, C., Shapiro, C., Shaver, T. & Mainz, M. (2018). High Soil Test Phosphorus Effect on Corn Yield. Soil Science Society of America Journal, 82: 1160-1167. [CrossRef]
- Xu, S., Nakayama, Y., Rothman, M. G., & Margenot, A. J. (2024). Depth-dependent soil phosphorus alteration is independent of 145-year phosphorus balances. European Journal of Soil Science, 75, e70006. [CrossRef]
- Xu, X.P., He, P., Pampolino, M.F., Chuan, L.M., Johnston, A.M., Qiu, S.J., Zhao, S.C.,Zhou, W. (2013). Nutrient requirements for maize in China based on QUEFTS analysis. Field Crops Res. 150, 115–125.
- Xu, X., Xie, J., Hou, Y., He, P., Pampolino, M. F., Zhao, S., ... & Zhou, W. (2015). Estimating nutrient uptake requirements for rice in China. Field Crops Research, 180, 37-45.
- Zapata F. & R.N. Roy (ed.). (2004). Use of Phosphate Rocks for Sustainable Agriculture. Joint FAO/IAEA Division of Nuclear Techniques in Food and Agriculture, Vienna, Austria. Land and Water Development Division, FAO, Rome, Italy.
- Zhang H, Antonangelo J, Grove J, Osmond D, Slaton N A, Alford S, Florence R, Huluka G, Hardy D H, Lessl J, Maguire R, Mylavarapu R, Oldham J L, Pena-Yewtukhiw E M, Provin T, Sonon L, Sotomayor D, Wang J. (2021). Variation in soil-test-based phosphorus and potassium rate recommendations across the southern USA. Soil Science Society of America Journal.;85:975–988. [CrossRef]
- Zhang, J.J., He, P., Xu, X.P., Ding, W.C., Ullah, S., Wang, Y.L., Jia, L.L., Cui, R.Z., Wang, H.T. & Zhou, W. (2018). Nutrient Expert Improves Nitrogen Efficiency and Environmental Benefits for Winter Wheat in China. Agronomy Journal, 110: 696-706. [CrossRef]
- Zhou, L.; Su, L.; Zhang, L.; Zhang, L.; Zheng, Y.; Tang, L. (2022). Effect of Different Types of Phosphate Fertilizer on Phosphorus Absorption and Desorption in Acidic Red Soil of Southwest China. Sustainability, 14, 9973. [CrossRef]
- Ziadi, N., Bélanger, G., Cambouris, A.N., Tremblay, N., Nolin, M.C. & Claessens, A. (2007). Relationship between P and N Concentrations in Corn. Agronomy Journal, 99: 833-841. [CrossRef]
- Ziadi, N., Bélanger, G., Cambouris, A.N., Tremblay, N., Nolin, M.C. & Claessens, A. (2008). Relationship between Phosphorus and Nitrogen Concentrations in Spring Wheat. Agronomy Journal, 100: 80-86. [CrossRef]
- Ziadi N., J. K. Whalen, A. J. Messiga, C. Morel. (2013). Assessment and Modeling of Soil Available Phosphorus in Sustainable Cropping Systems. In Donald L. Sparks (ed.), Advances in Agronomy, Academic Press, Volume 122, 2013, Pages 85-126, ISSN 0065-2113, ISBN 9780124171879. [CrossRef]
- Zou, T. Zou, T., Zhang, X. & Davidson, E.A. (2022). Global trends of cropland phosphorus use and sustainability challenges. Nature 611, 81–87. [CrossRef]
Figure 1.
Agricultural P fertilizer use at different regions of the world, 1961-2022. Data from FAOSTAT (https://www.fao.org/faostat/en/#data/RFN, verified 3 December 2024).
Figure 1.
Agricultural P fertilizer use at different regions of the world, 1961-2022. Data from FAOSTAT (https://www.fao.org/faostat/en/#data/RFN, verified 3 December 2024).
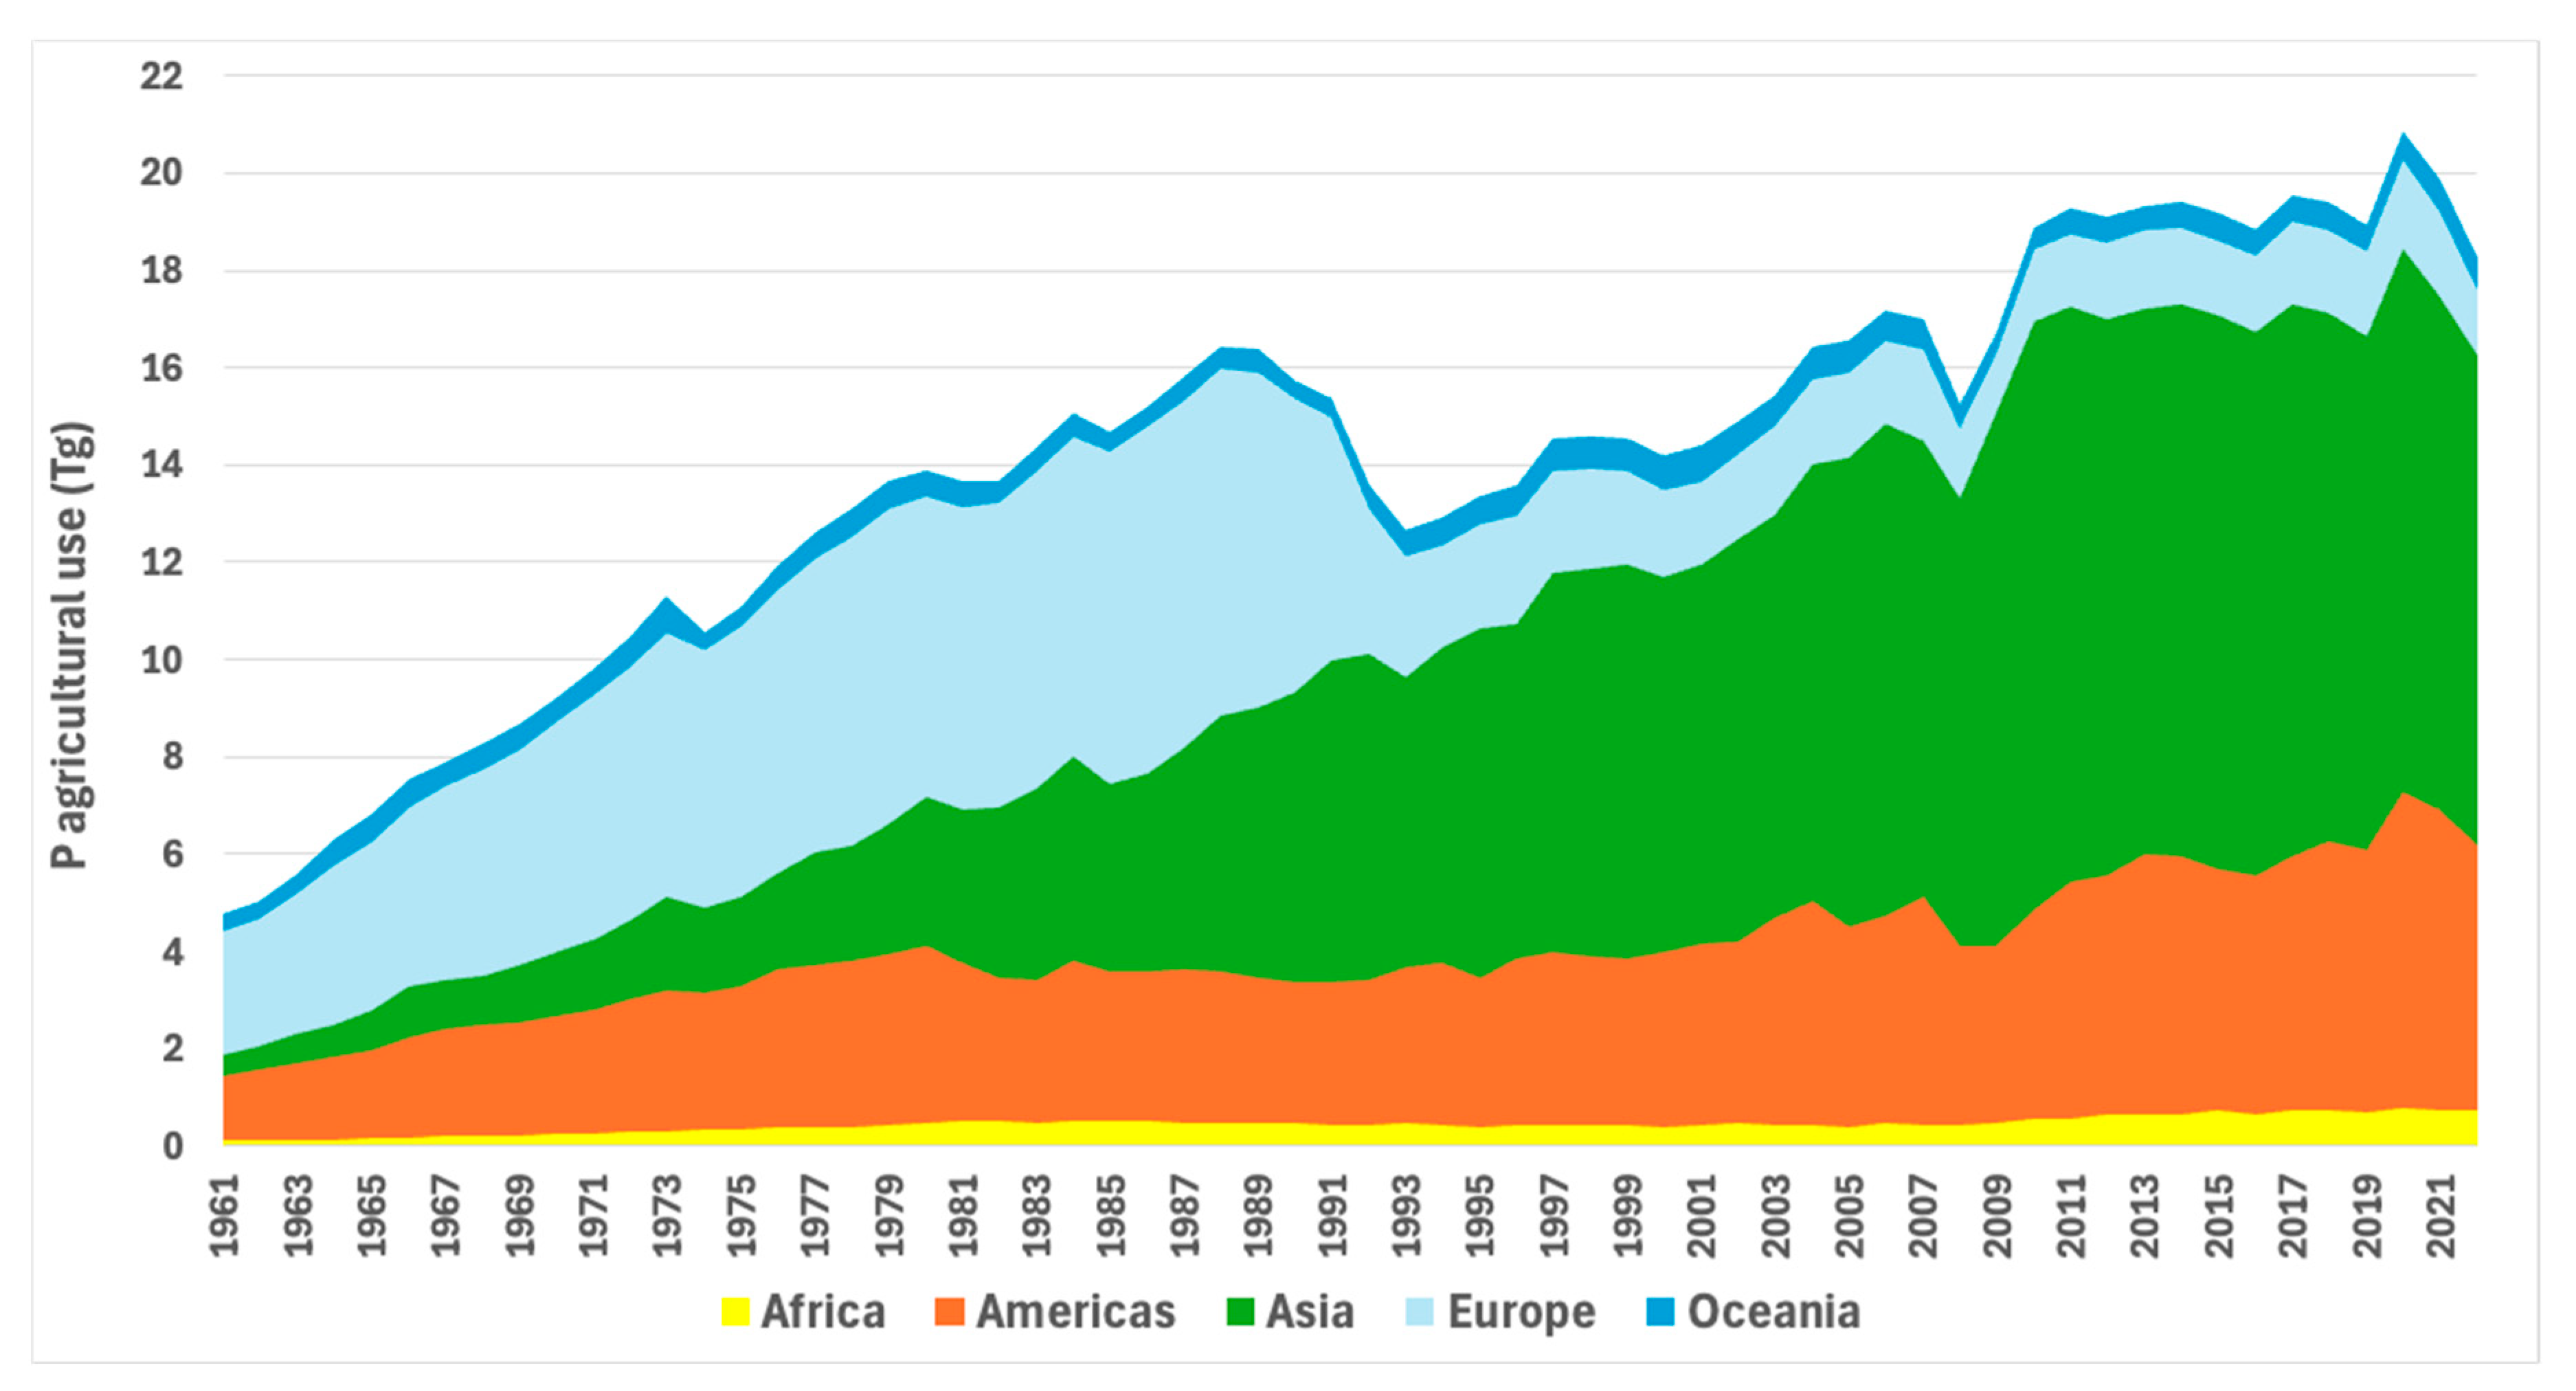
Figure 2.
Field crop production at different regions of the world, 1961-2022. Data from FAOSTAT (https://www.fao.org/faostat/en/#data/QCL, verified 3 December 2024).
Figure 2.
Field crop production at different regions of the world, 1961-2022. Data from FAOSTAT (https://www.fao.org/faostat/en/#data/QCL, verified 3 December 2024).
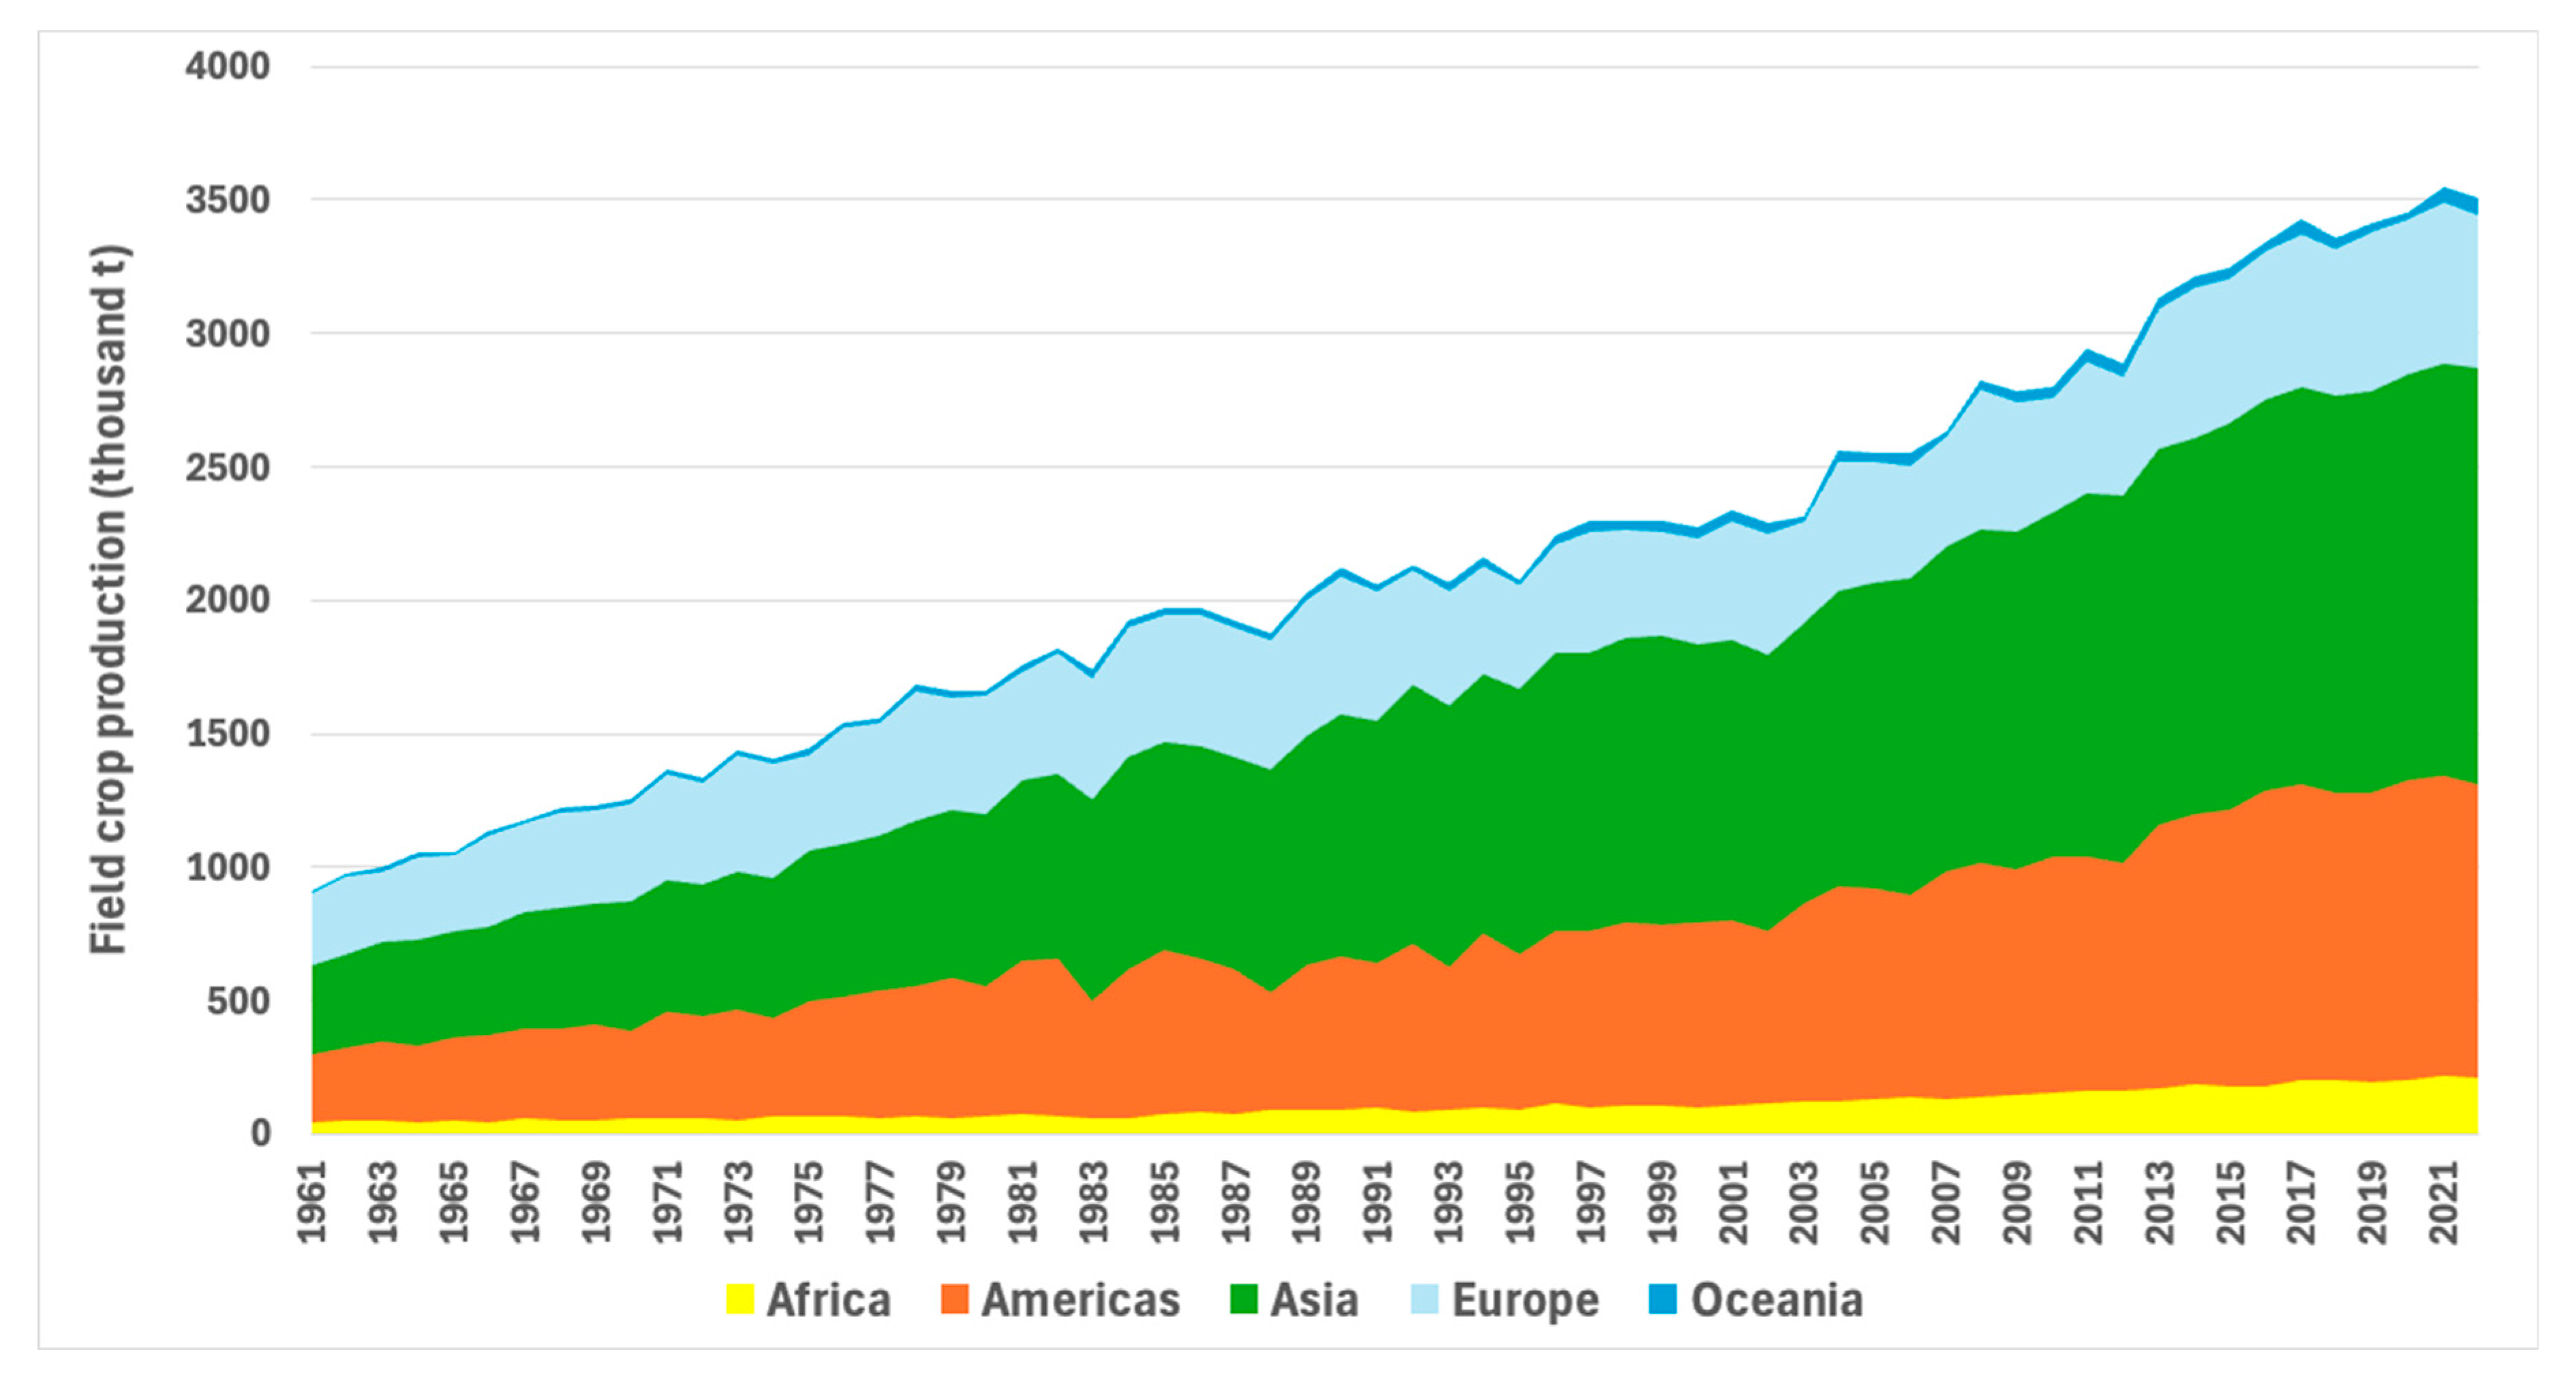
Figure 3.
Diagram of the P cycle in agricultural land. Black lines show transformations, green lines inputs, and red lines outputs/losses.
Figure 3.
Diagram of the P cycle in agricultural land. Black lines show transformations, green lines inputs, and red lines outputs/losses.
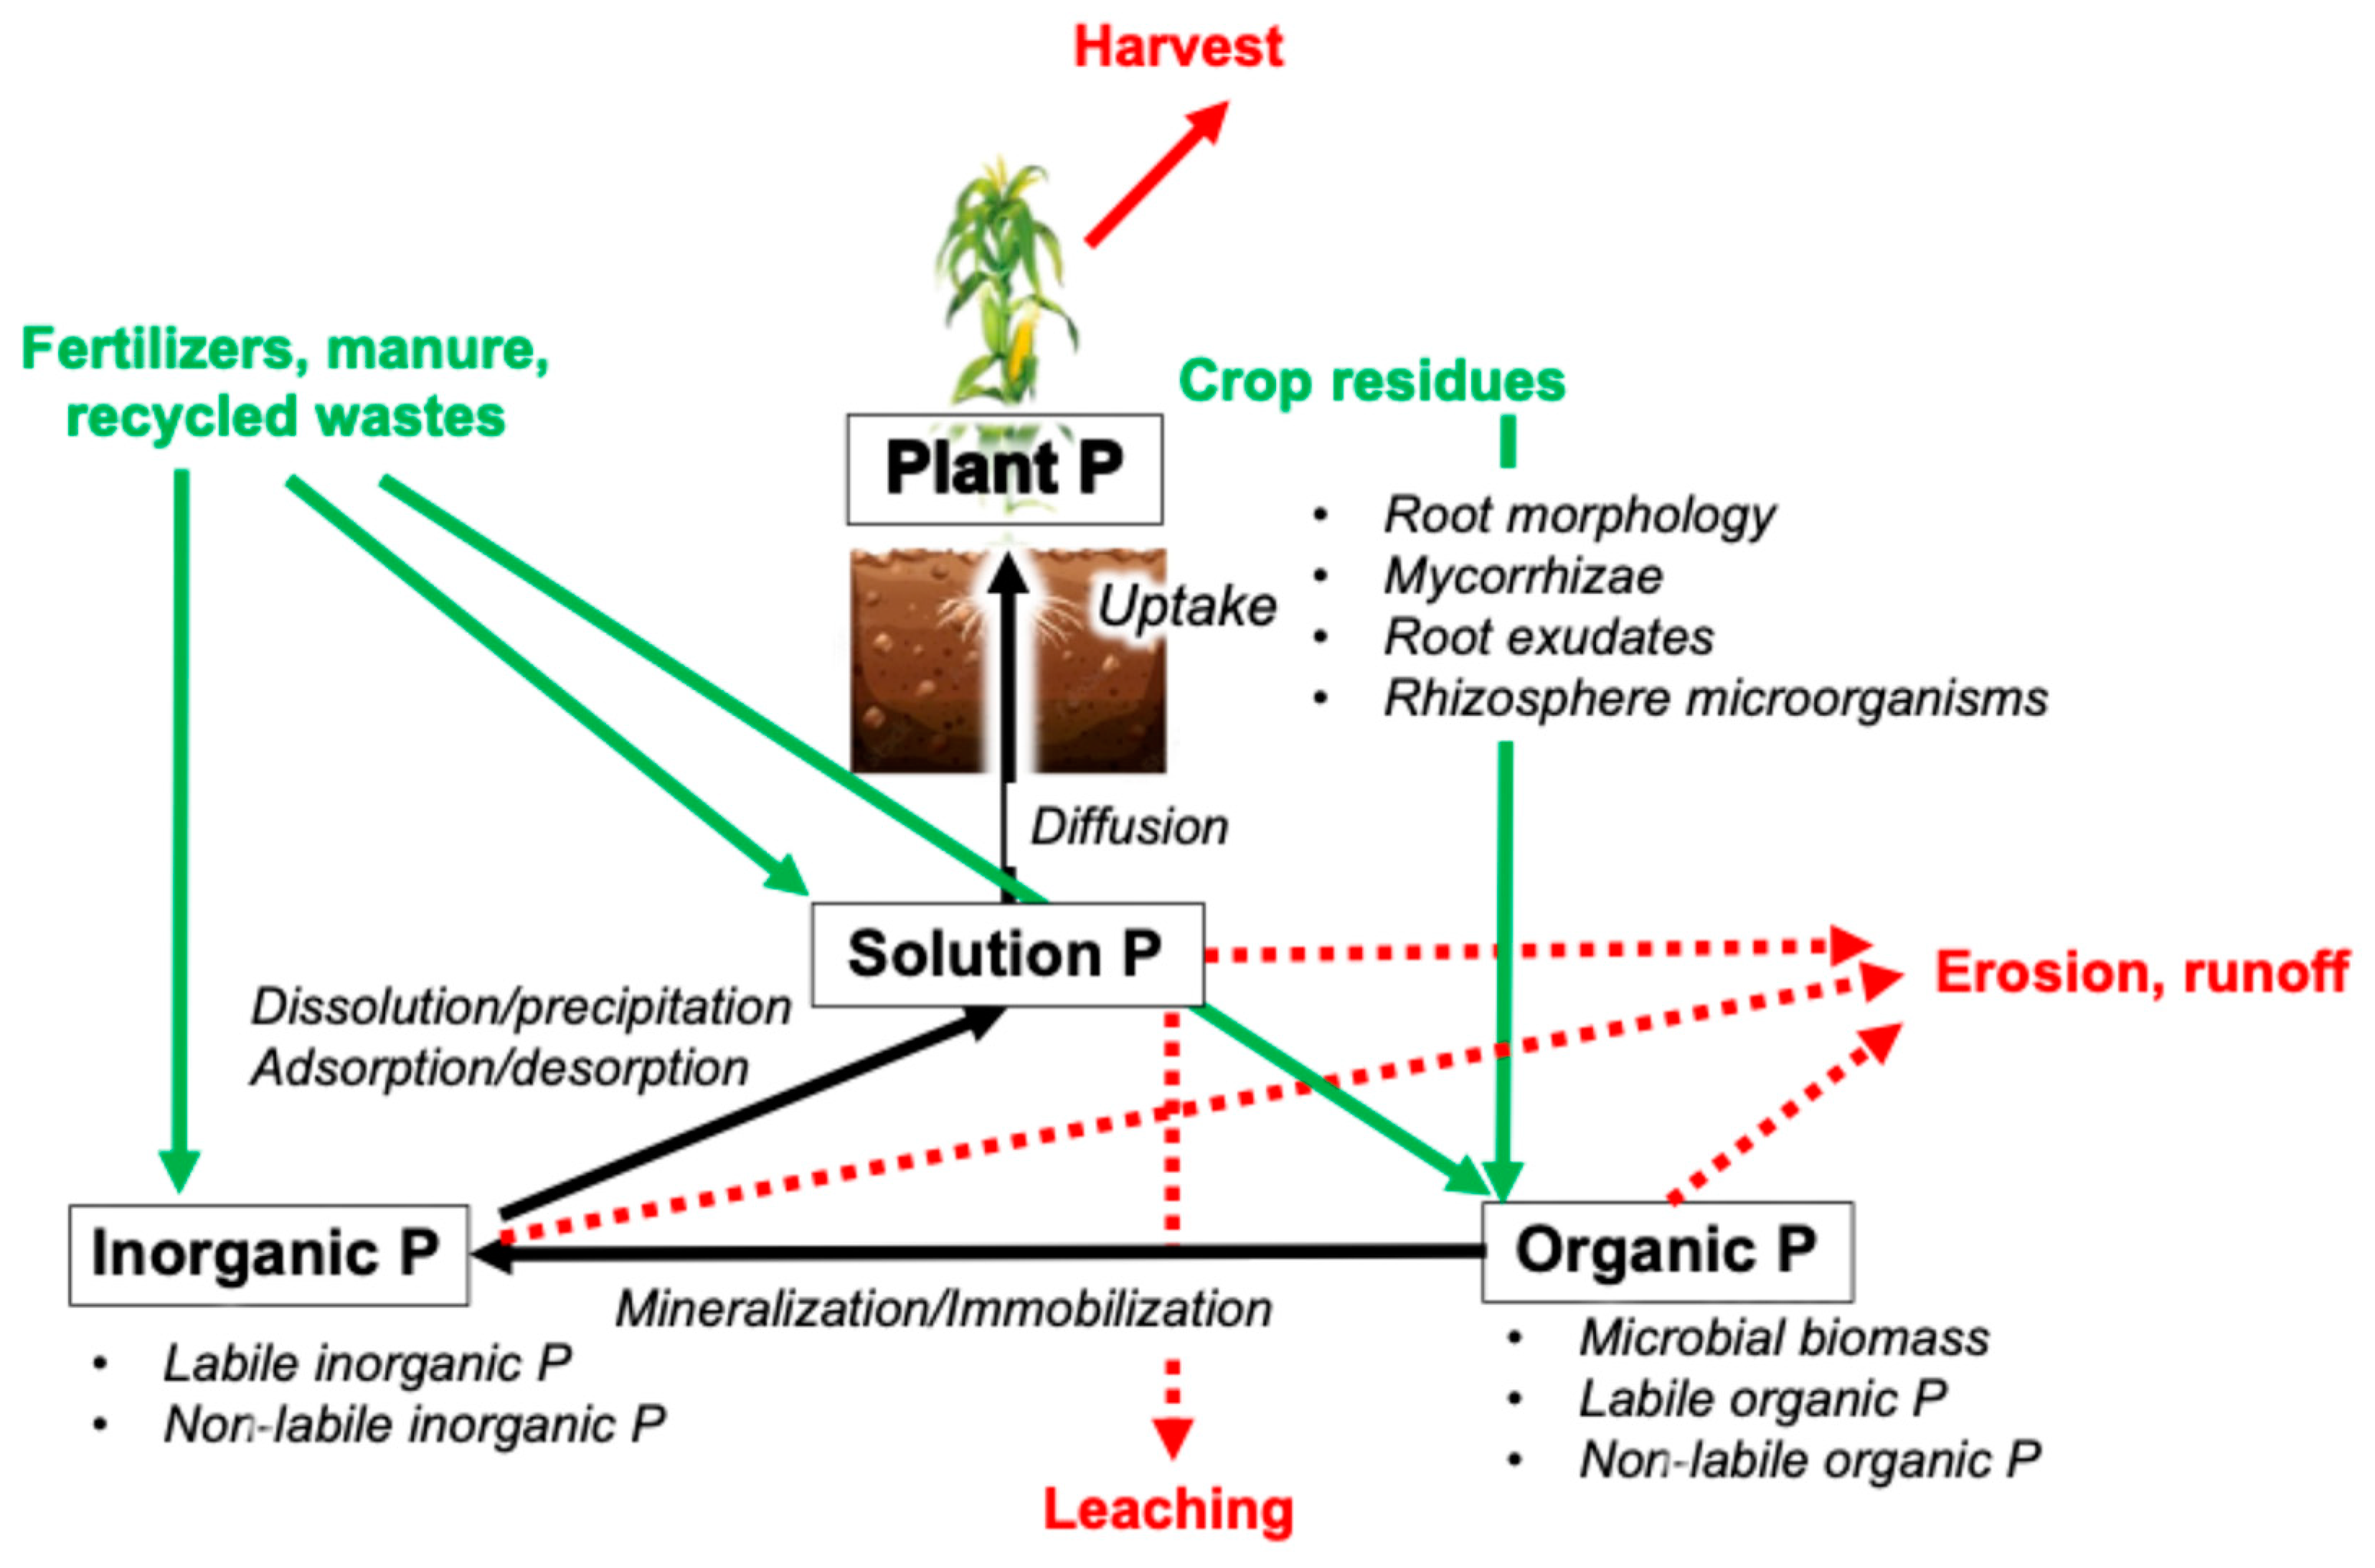
Figure 4.
P uptake of maize from emergence until physiological maturity without and with N fertilization. The arrow indicates the date of anthesis. Adapted from Ciampitti et al. (2013).
Figure 4.
P uptake of maize from emergence until physiological maturity without and with N fertilization. The arrow indicates the date of anthesis. Adapted from Ciampitti et al. (2013).
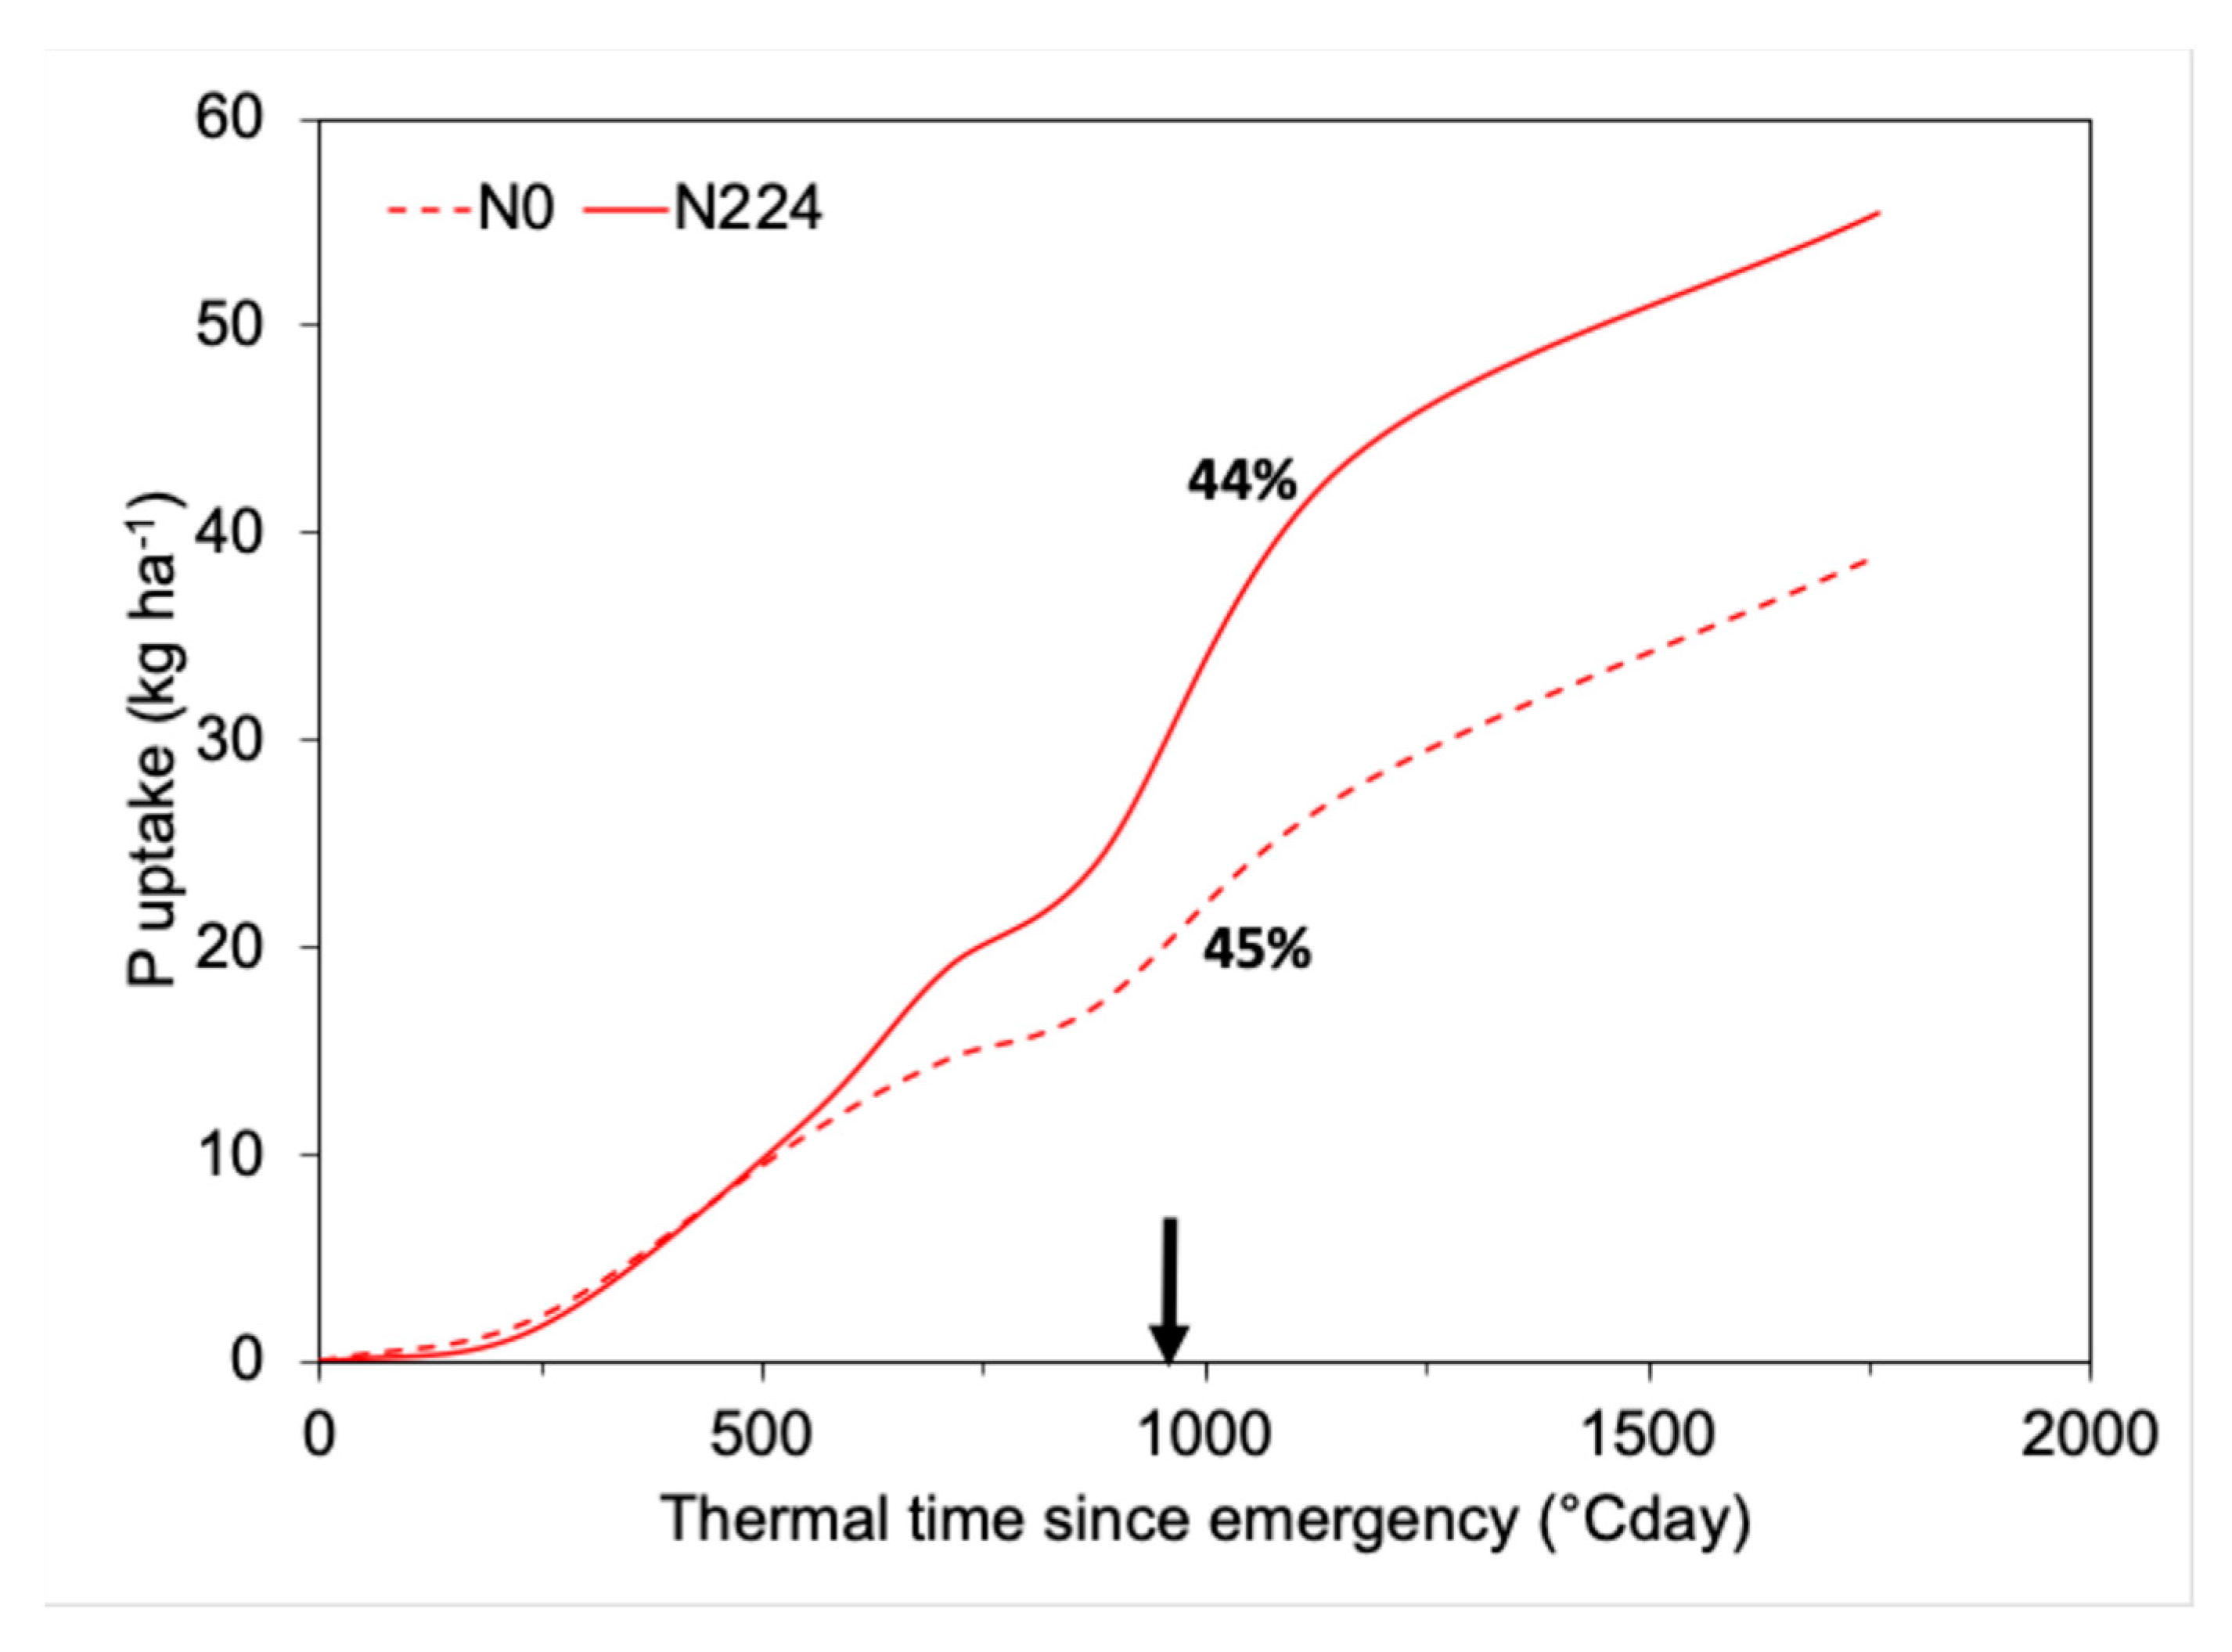
Figure 5.
P uptake of wheat from seeding until physiological maturity at three levels of soil Bray P test at southern Buenos Aires (Argentina). A. Berardo, INTA-FCA Balcarce (pers. comm.).
Figure 5.
P uptake of wheat from seeding until physiological maturity at three levels of soil Bray P test at southern Buenos Aires (Argentina). A. Berardo, INTA-FCA Balcarce (pers. comm.).
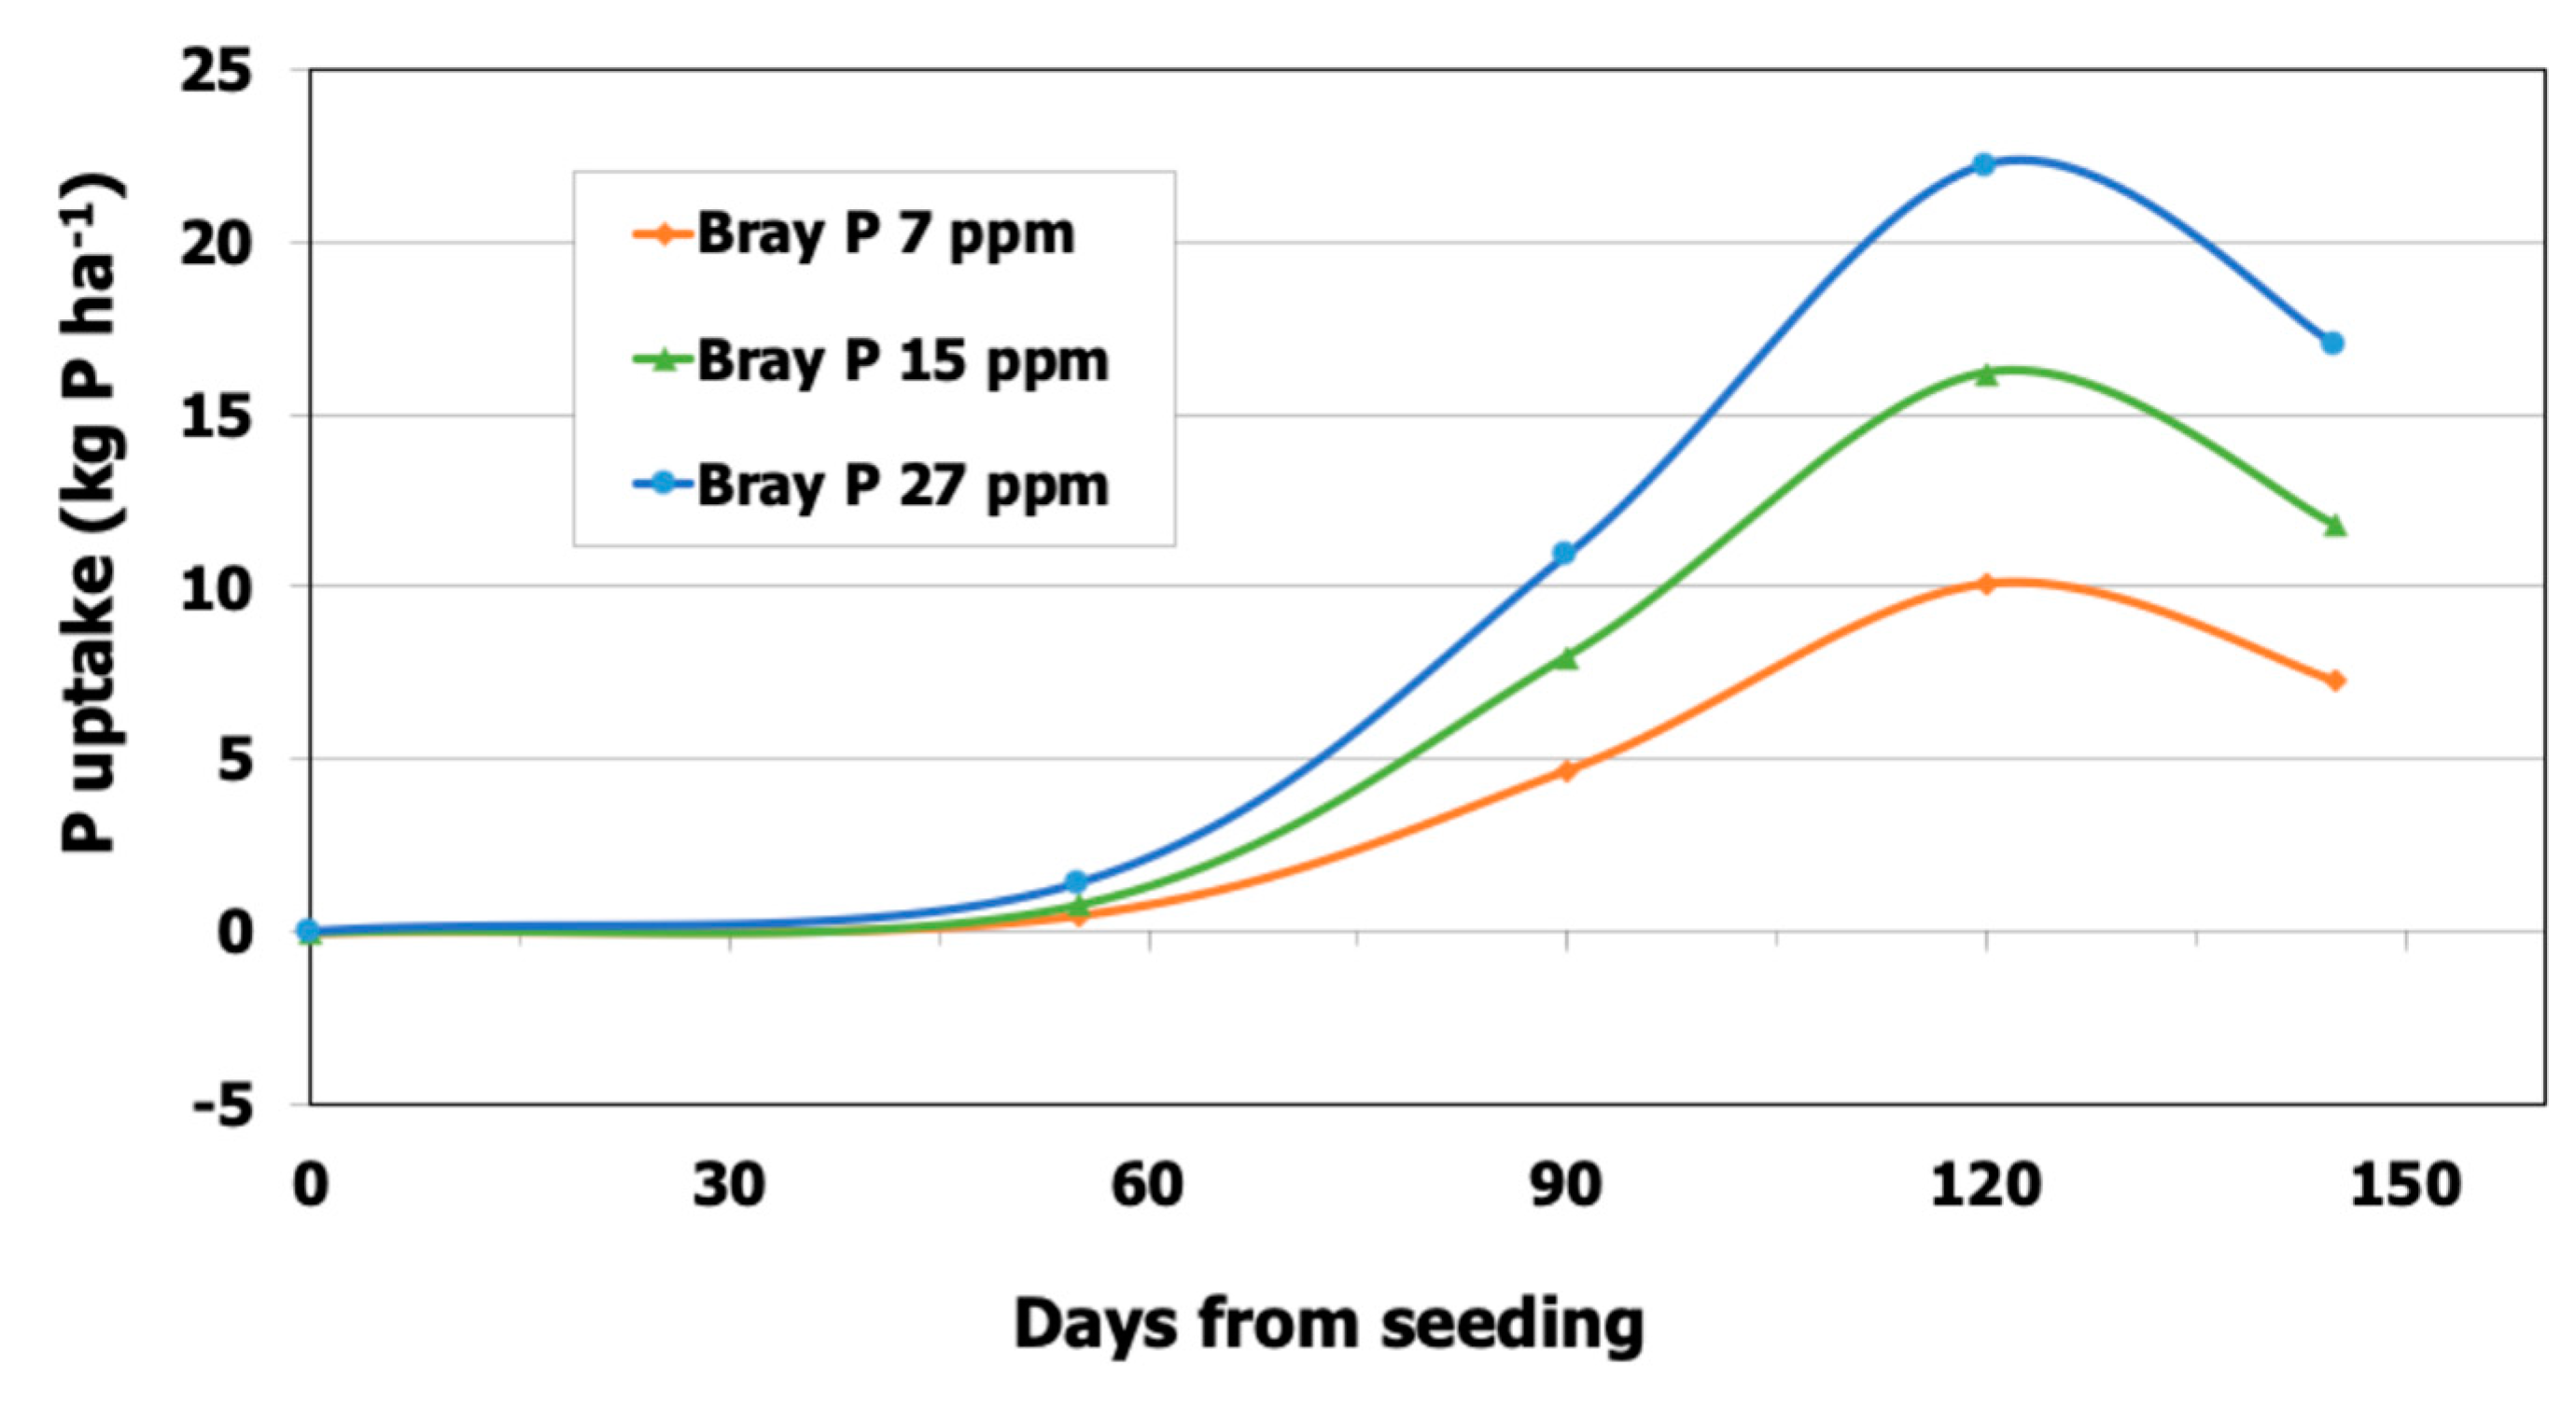
Figure 6.
Seasonal accumulation and partitioning of P for soybean (average yield of 6.6 t grain/ha) at Ponta Grossa, Paraná, Brazil (Barth et al., 2018).
Figure 6.
Seasonal accumulation and partitioning of P for soybean (average yield of 6.6 t grain/ha) at Ponta Grossa, Paraná, Brazil (Barth et al., 2018).
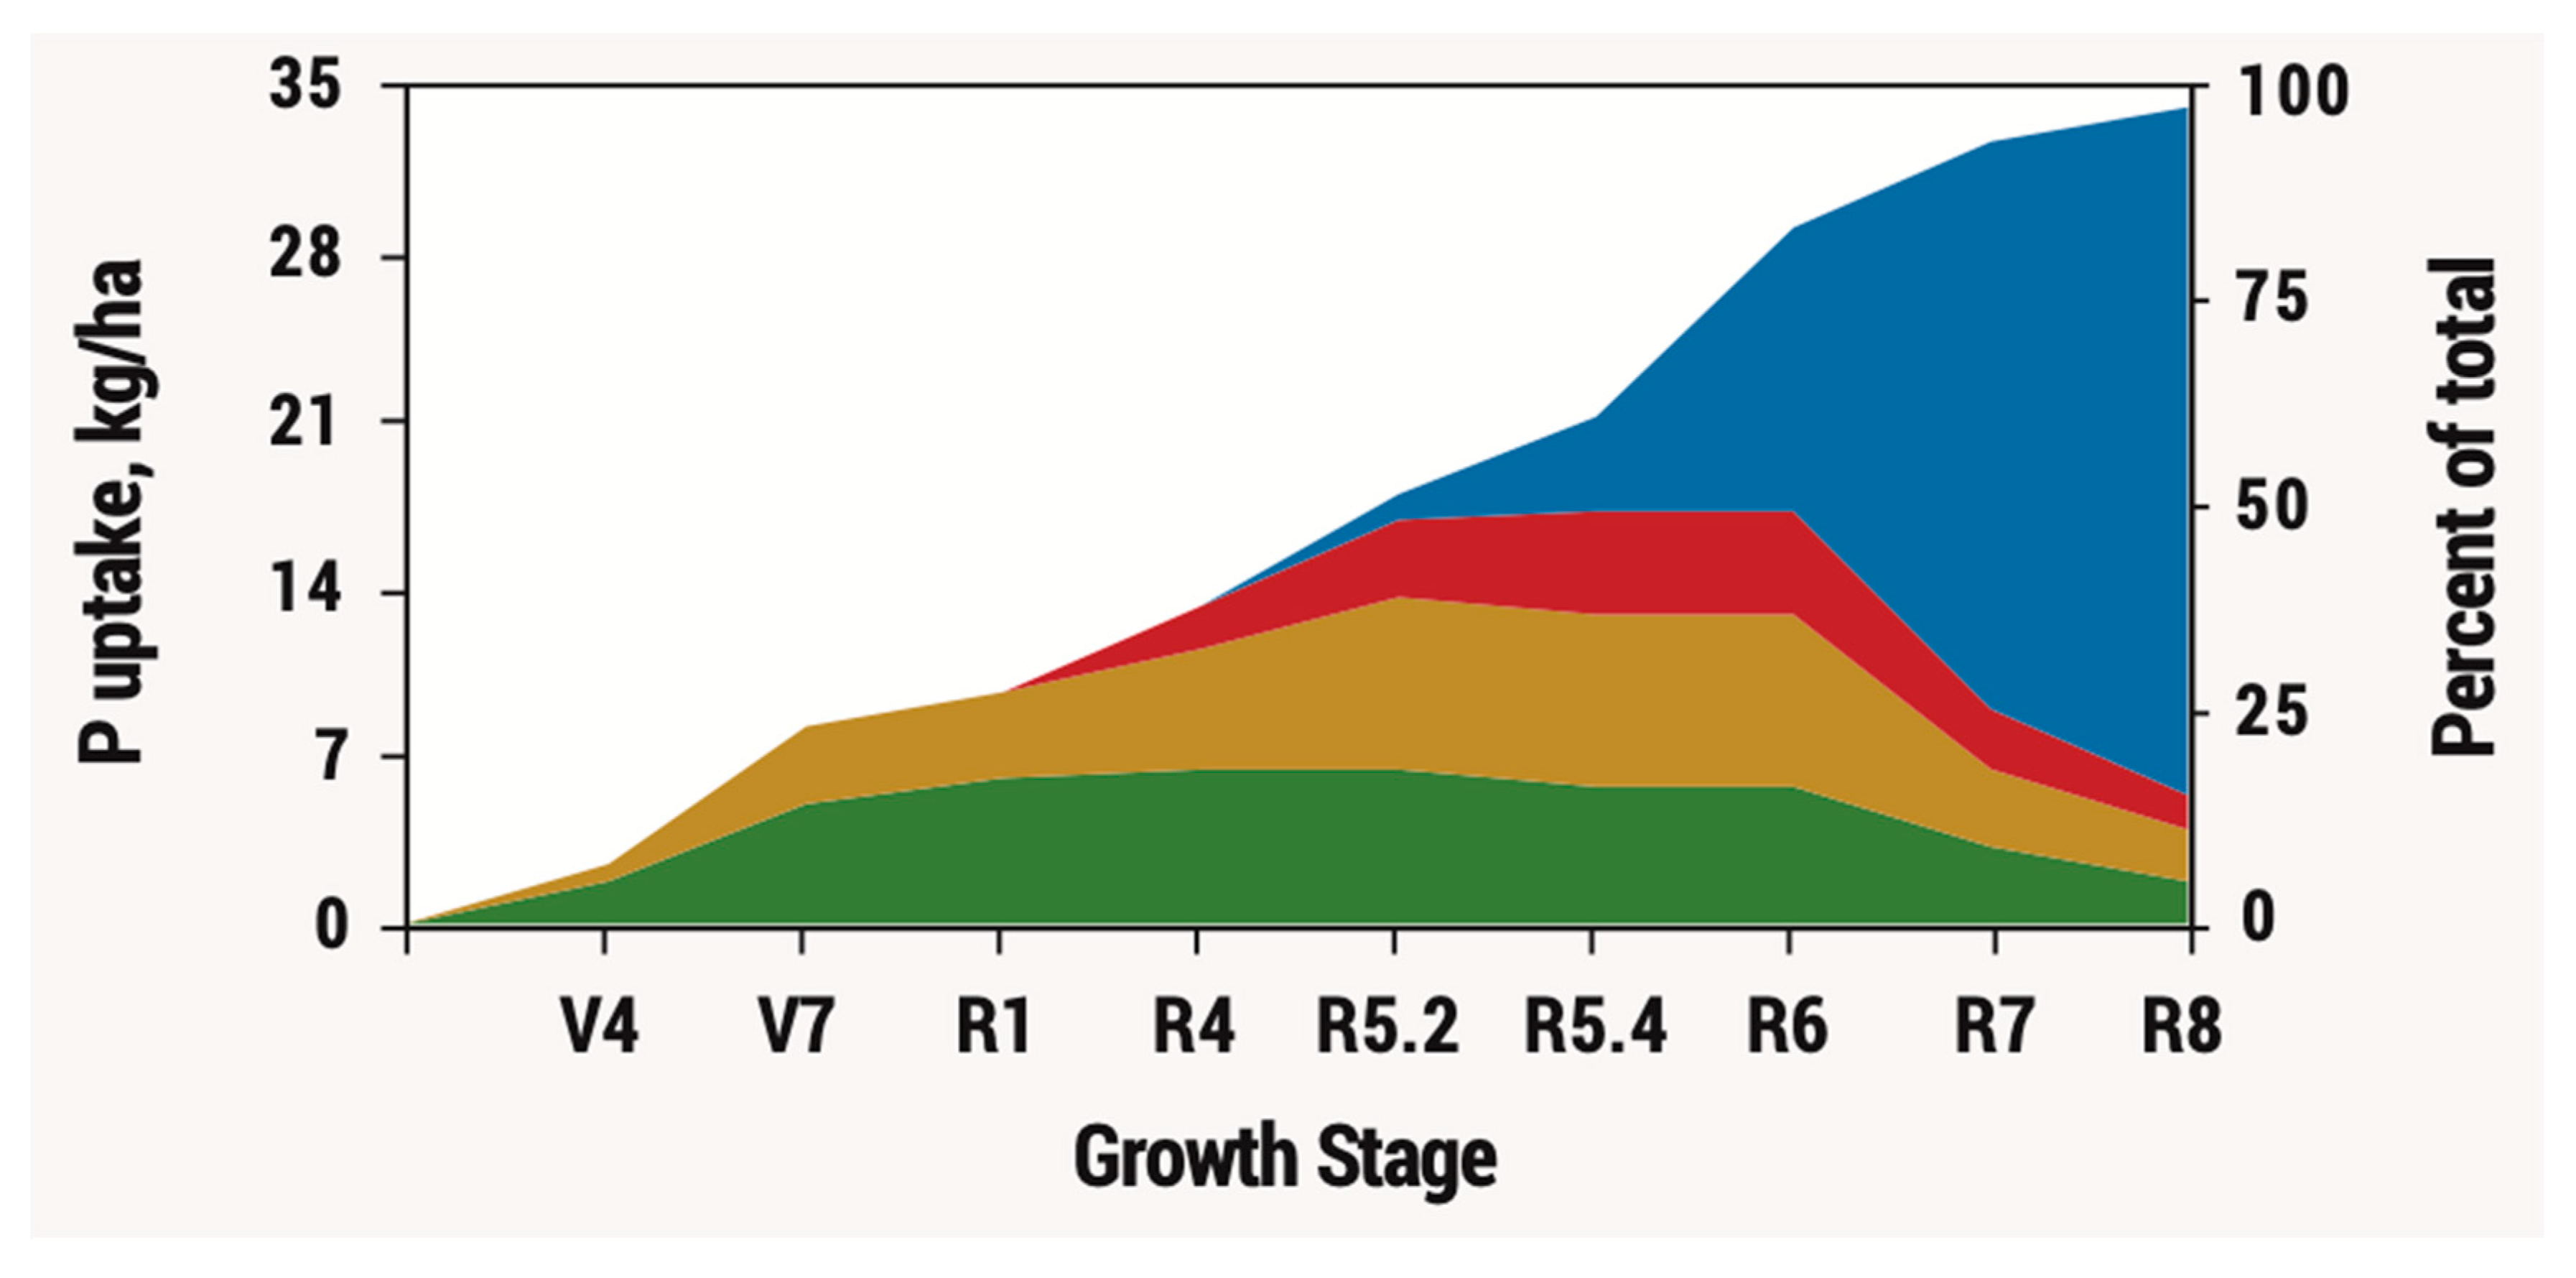
Figure 7.
Seasonal accumulation and partitioning of P for rice (Redrawn from Meus et al., 2020).
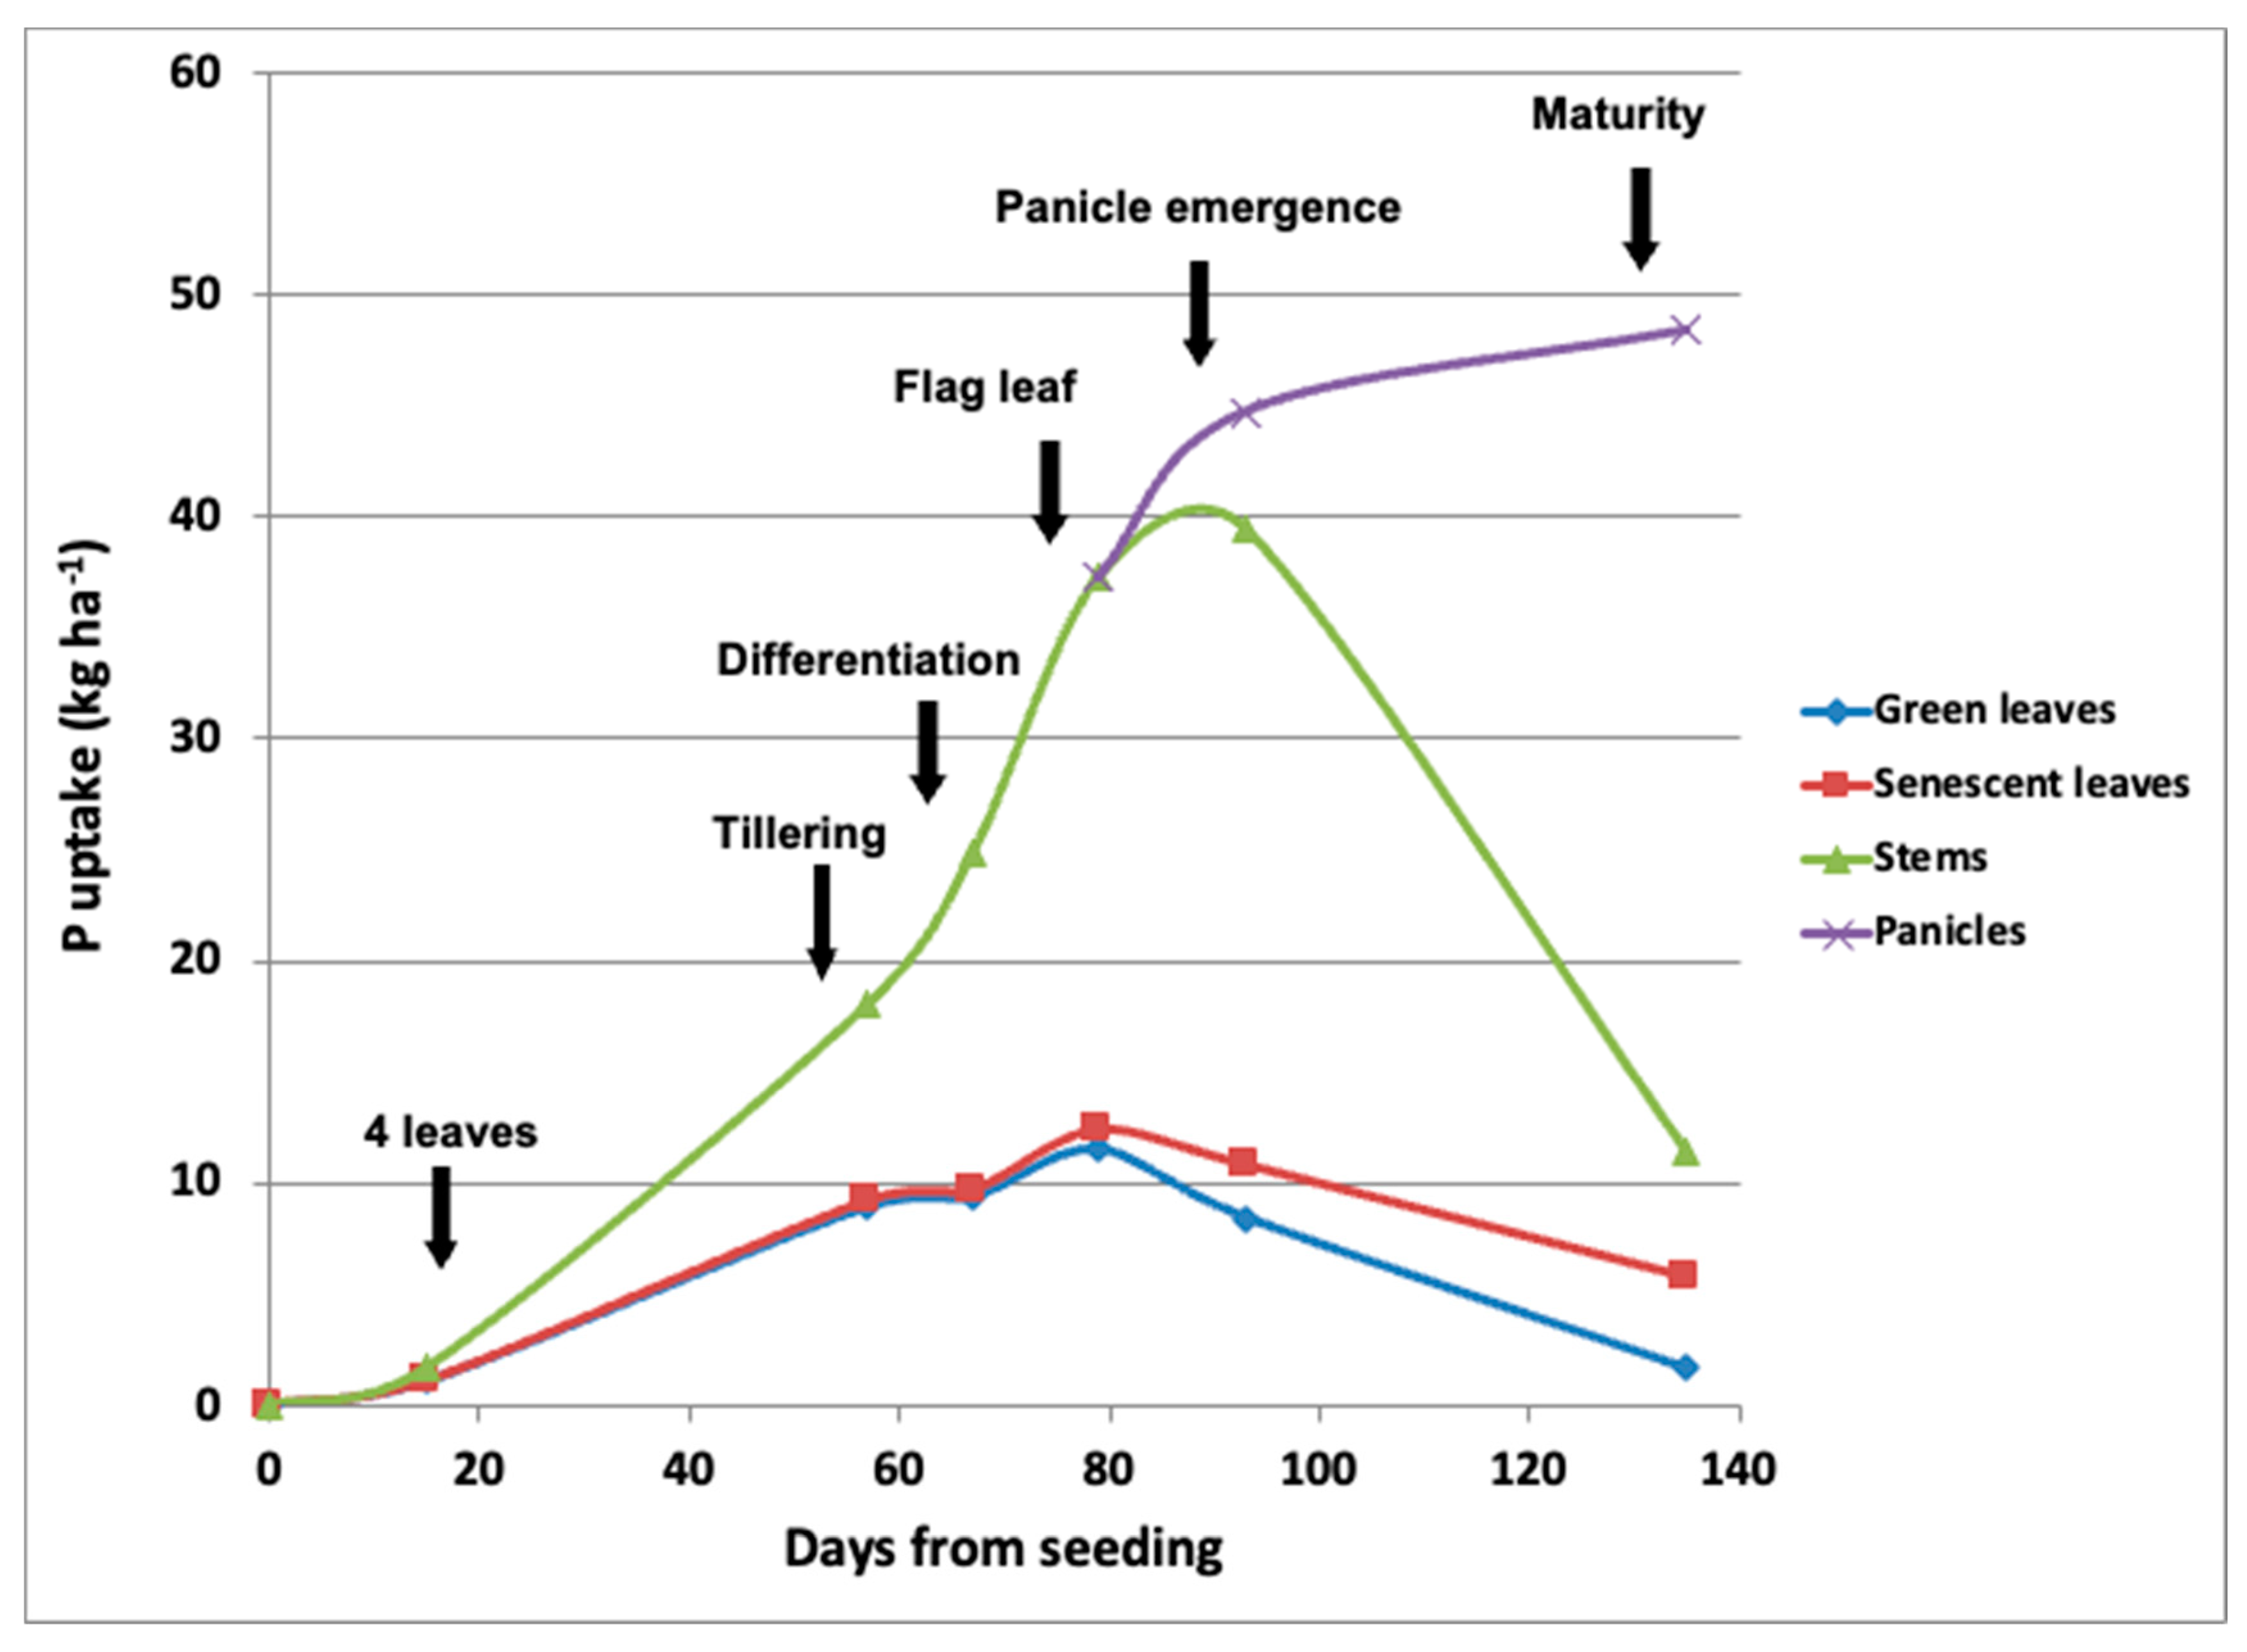
Figure 8.
Hypothesized relationship between income level and PUE, redrawn from Zou et al. (2022).
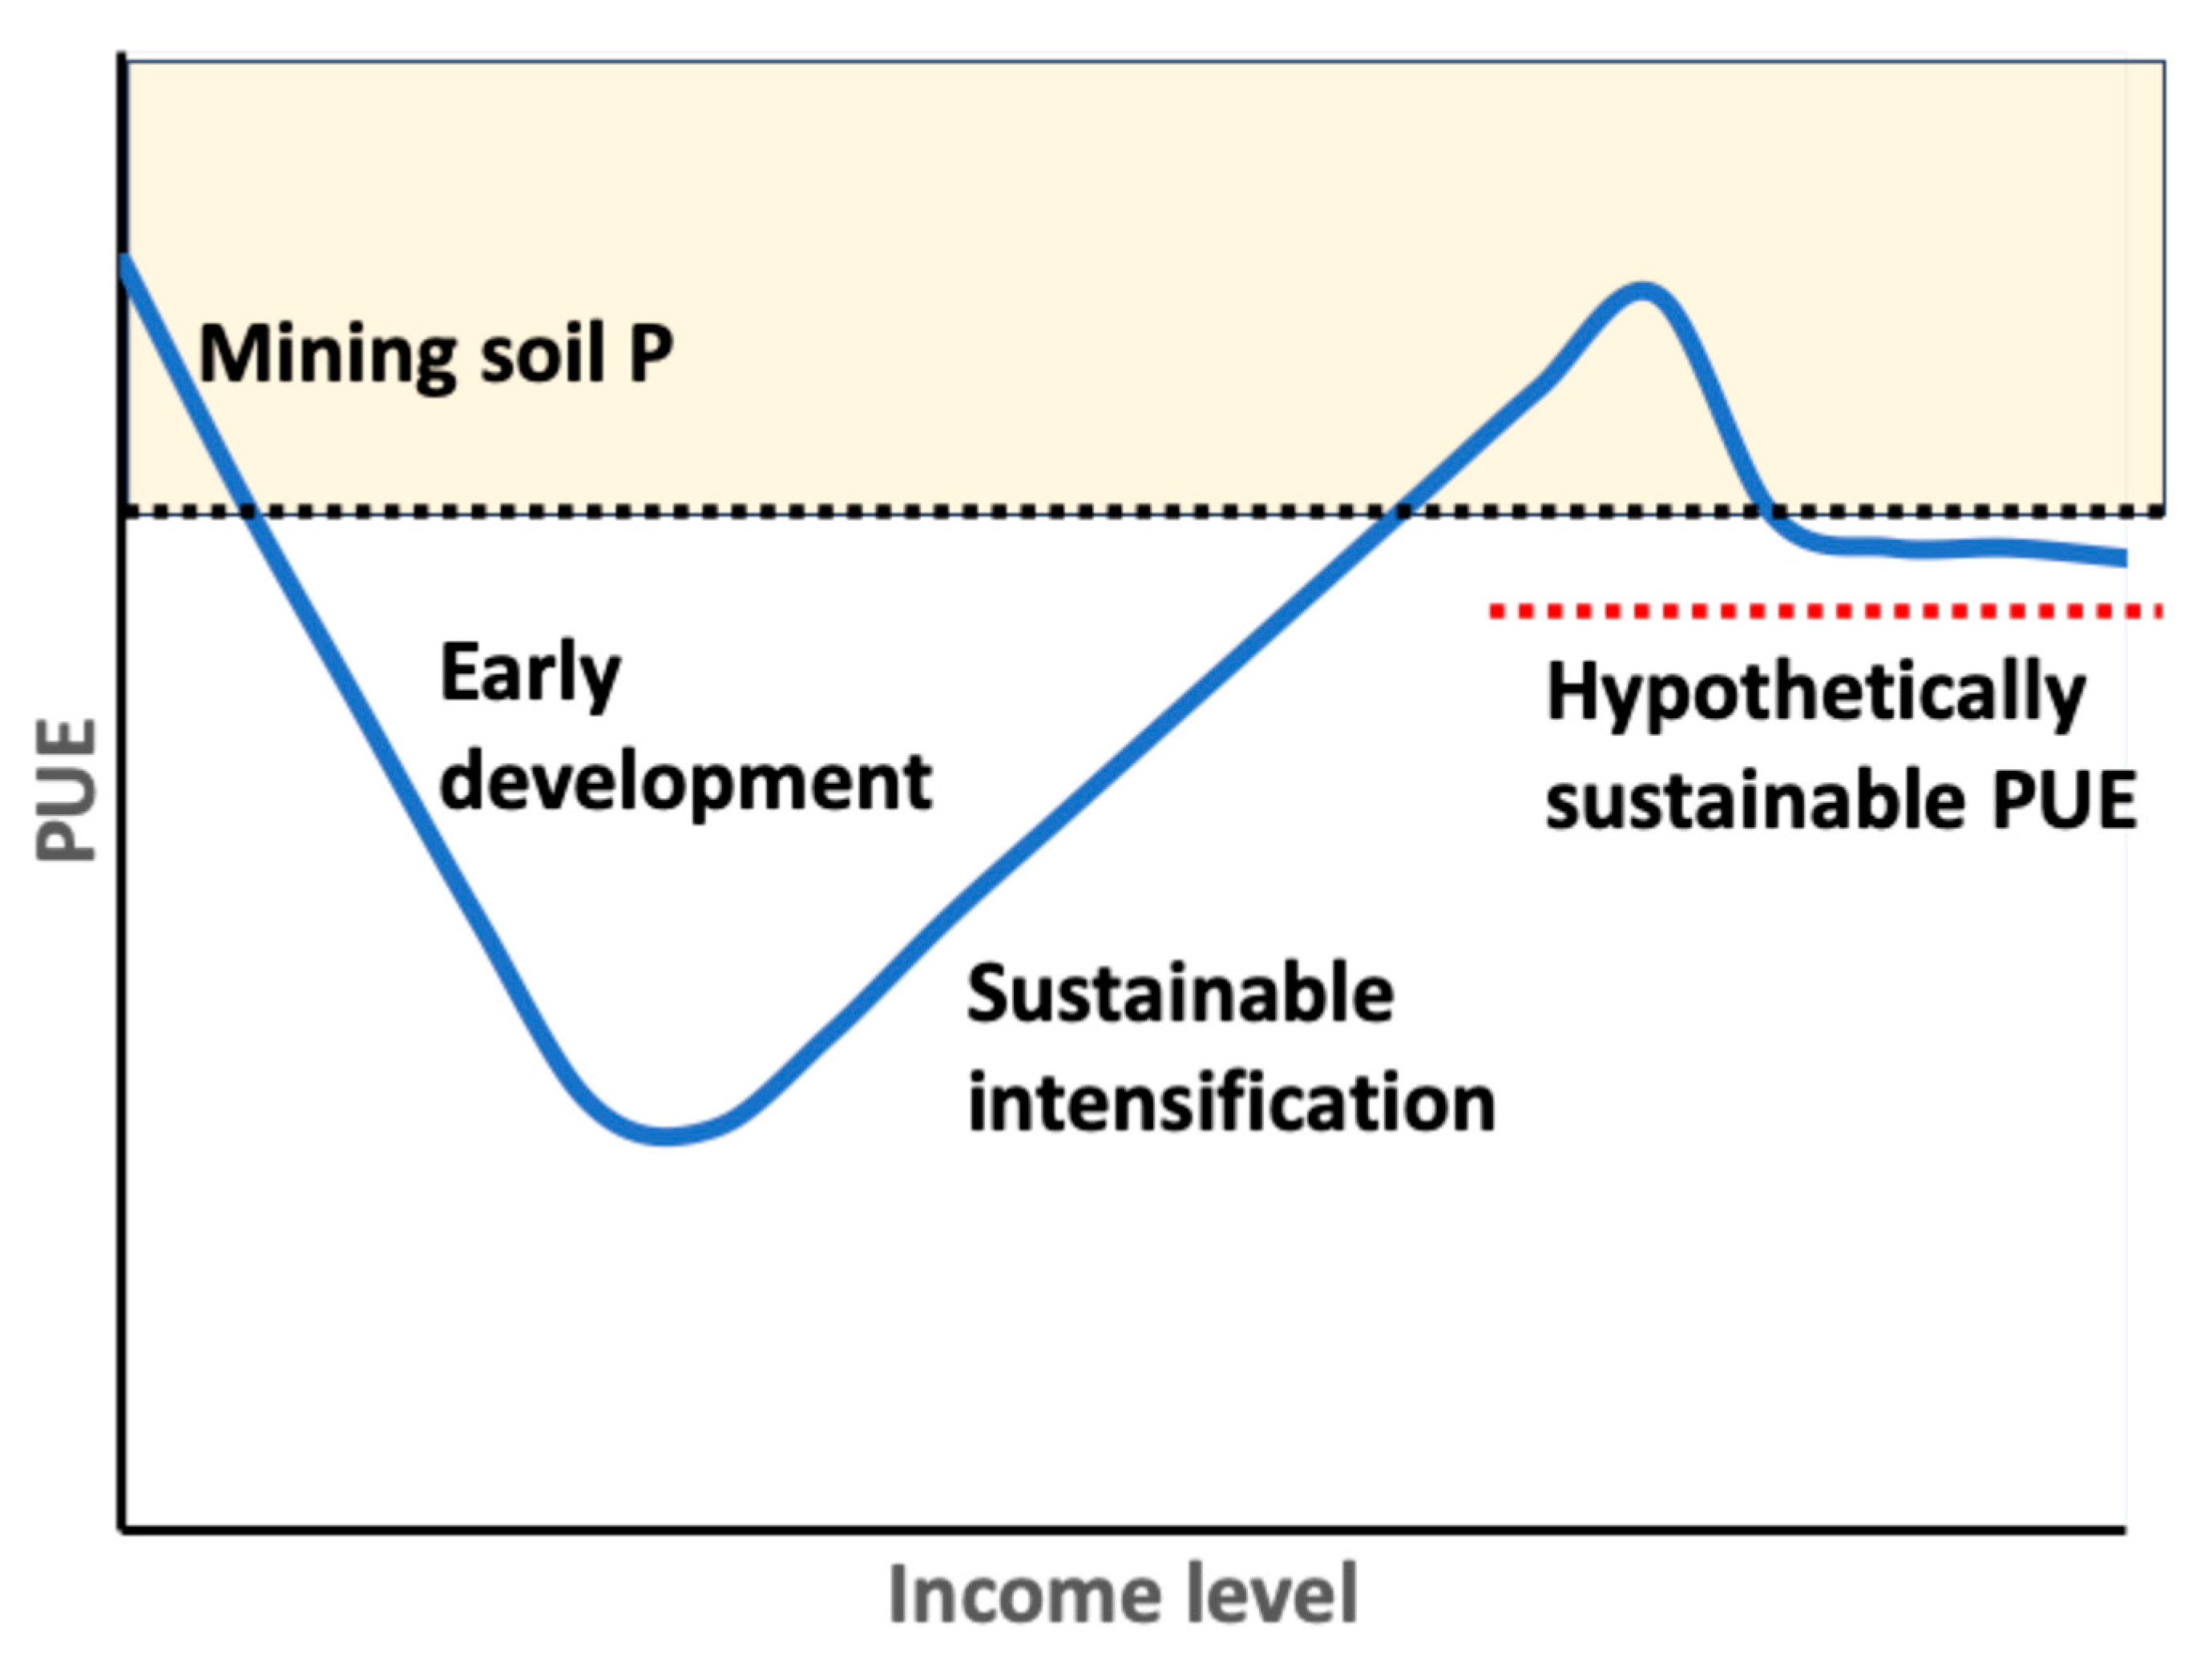
Figure 9.
Evolution of PUE for seven main grain producing countries PUE was estimated from FAOSTAT data on Cropland Nutrient Balance as P out/P input.
Figure 9.
Evolution of PUE for seven main grain producing countries PUE was estimated from FAOSTAT data on Cropland Nutrient Balance as P out/P input.
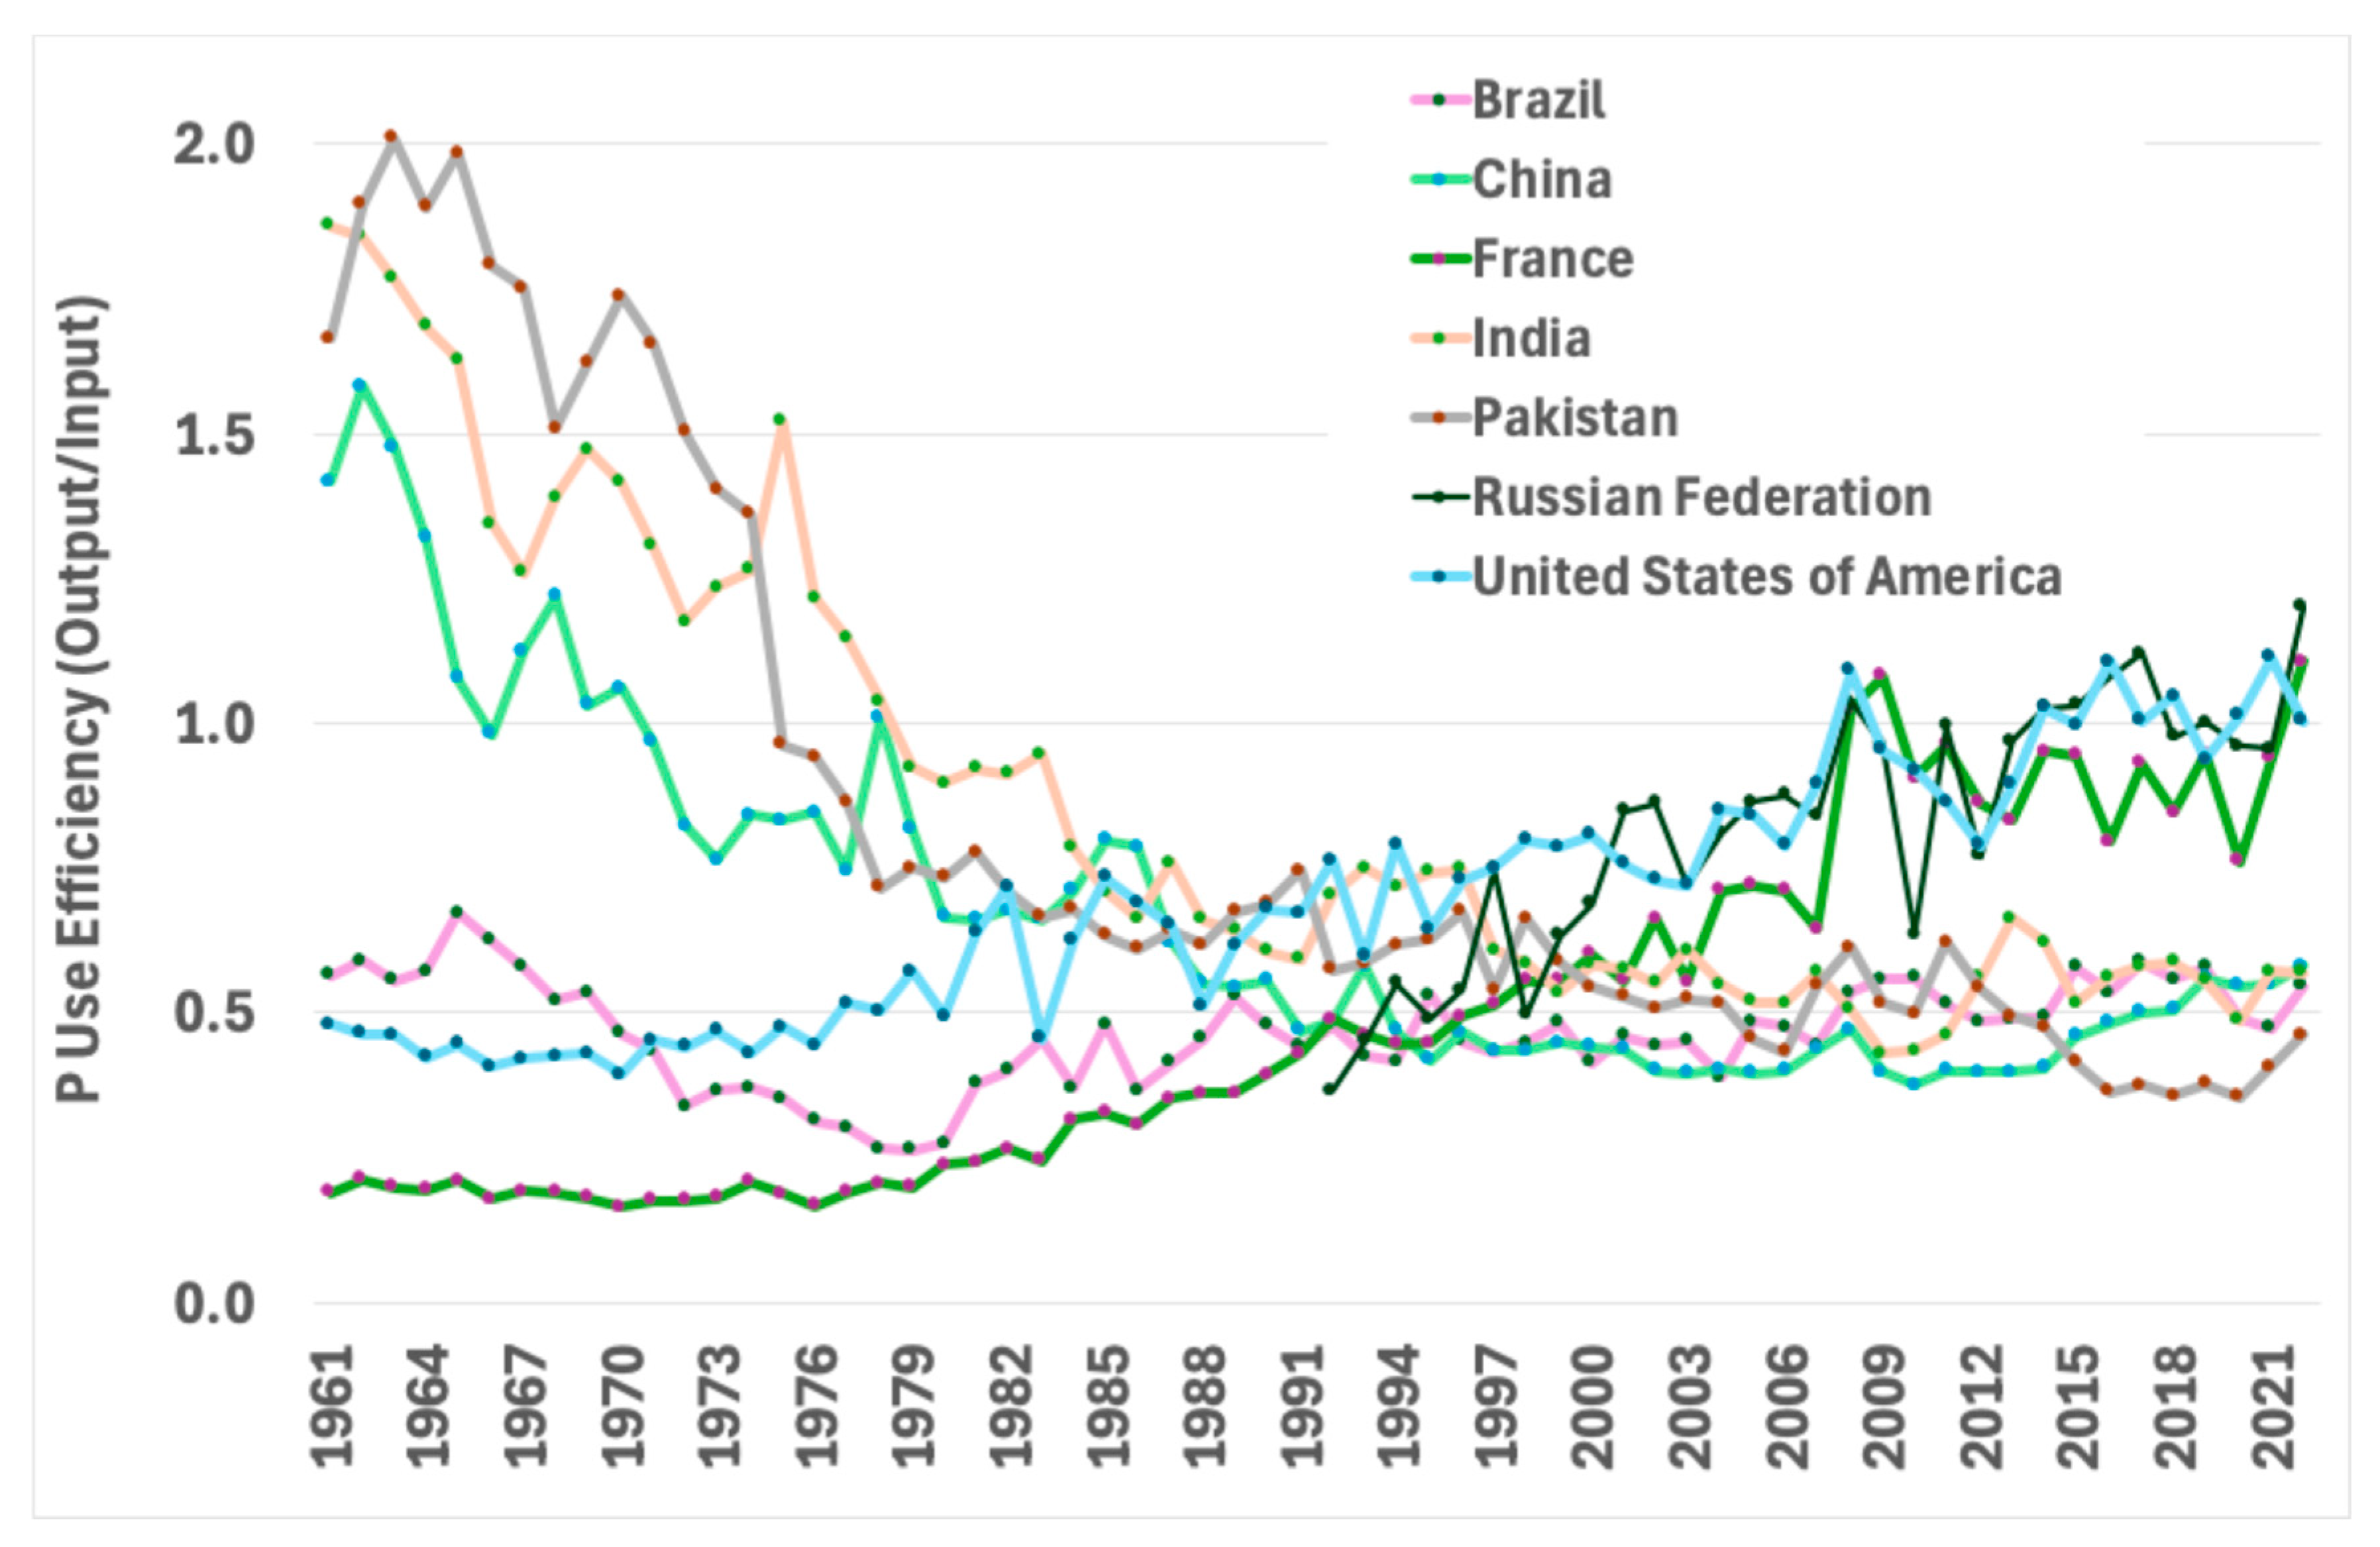
Figure 10.
Soil, plant/rhizosphere and management factors affecting PUE.
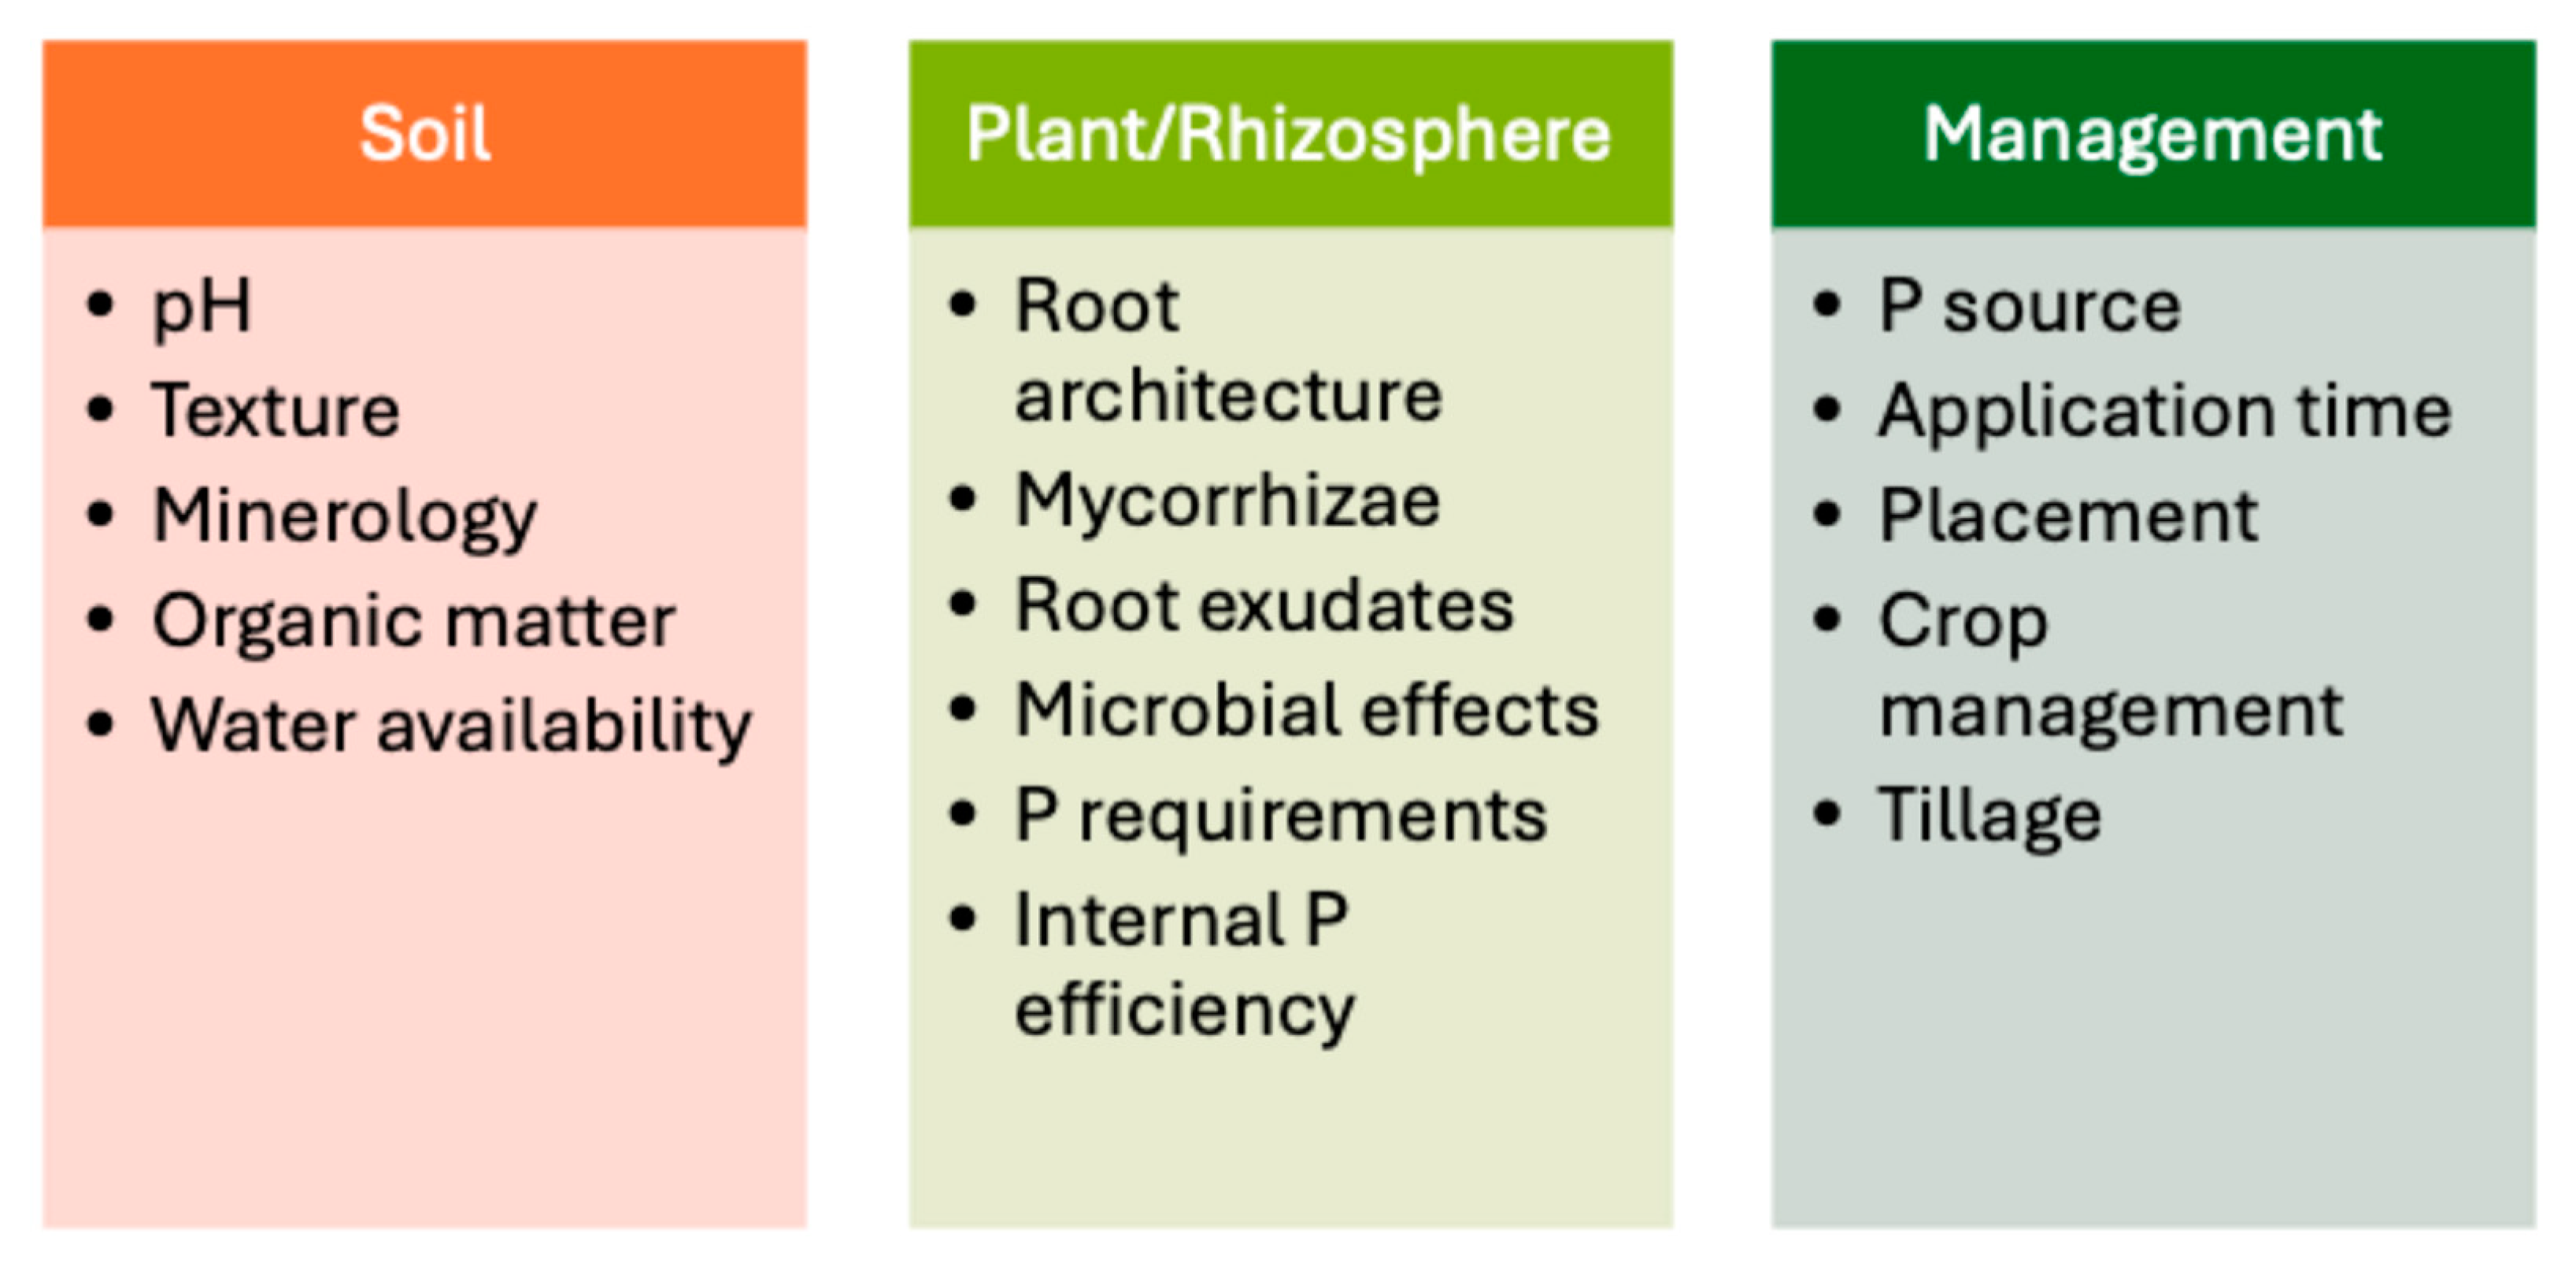
Figure 11.
PUE as a function of P input per area at the country level from FAOSTAT data (left); and agronomic P use efficiency as function of soil P test at wheat experiments at Argentina (García et al., 2004) (right).
Figure 11.
PUE as a function of P input per area at the country level from FAOSTAT data (left); and agronomic P use efficiency as function of soil P test at wheat experiments at Argentina (García et al., 2004) (right).
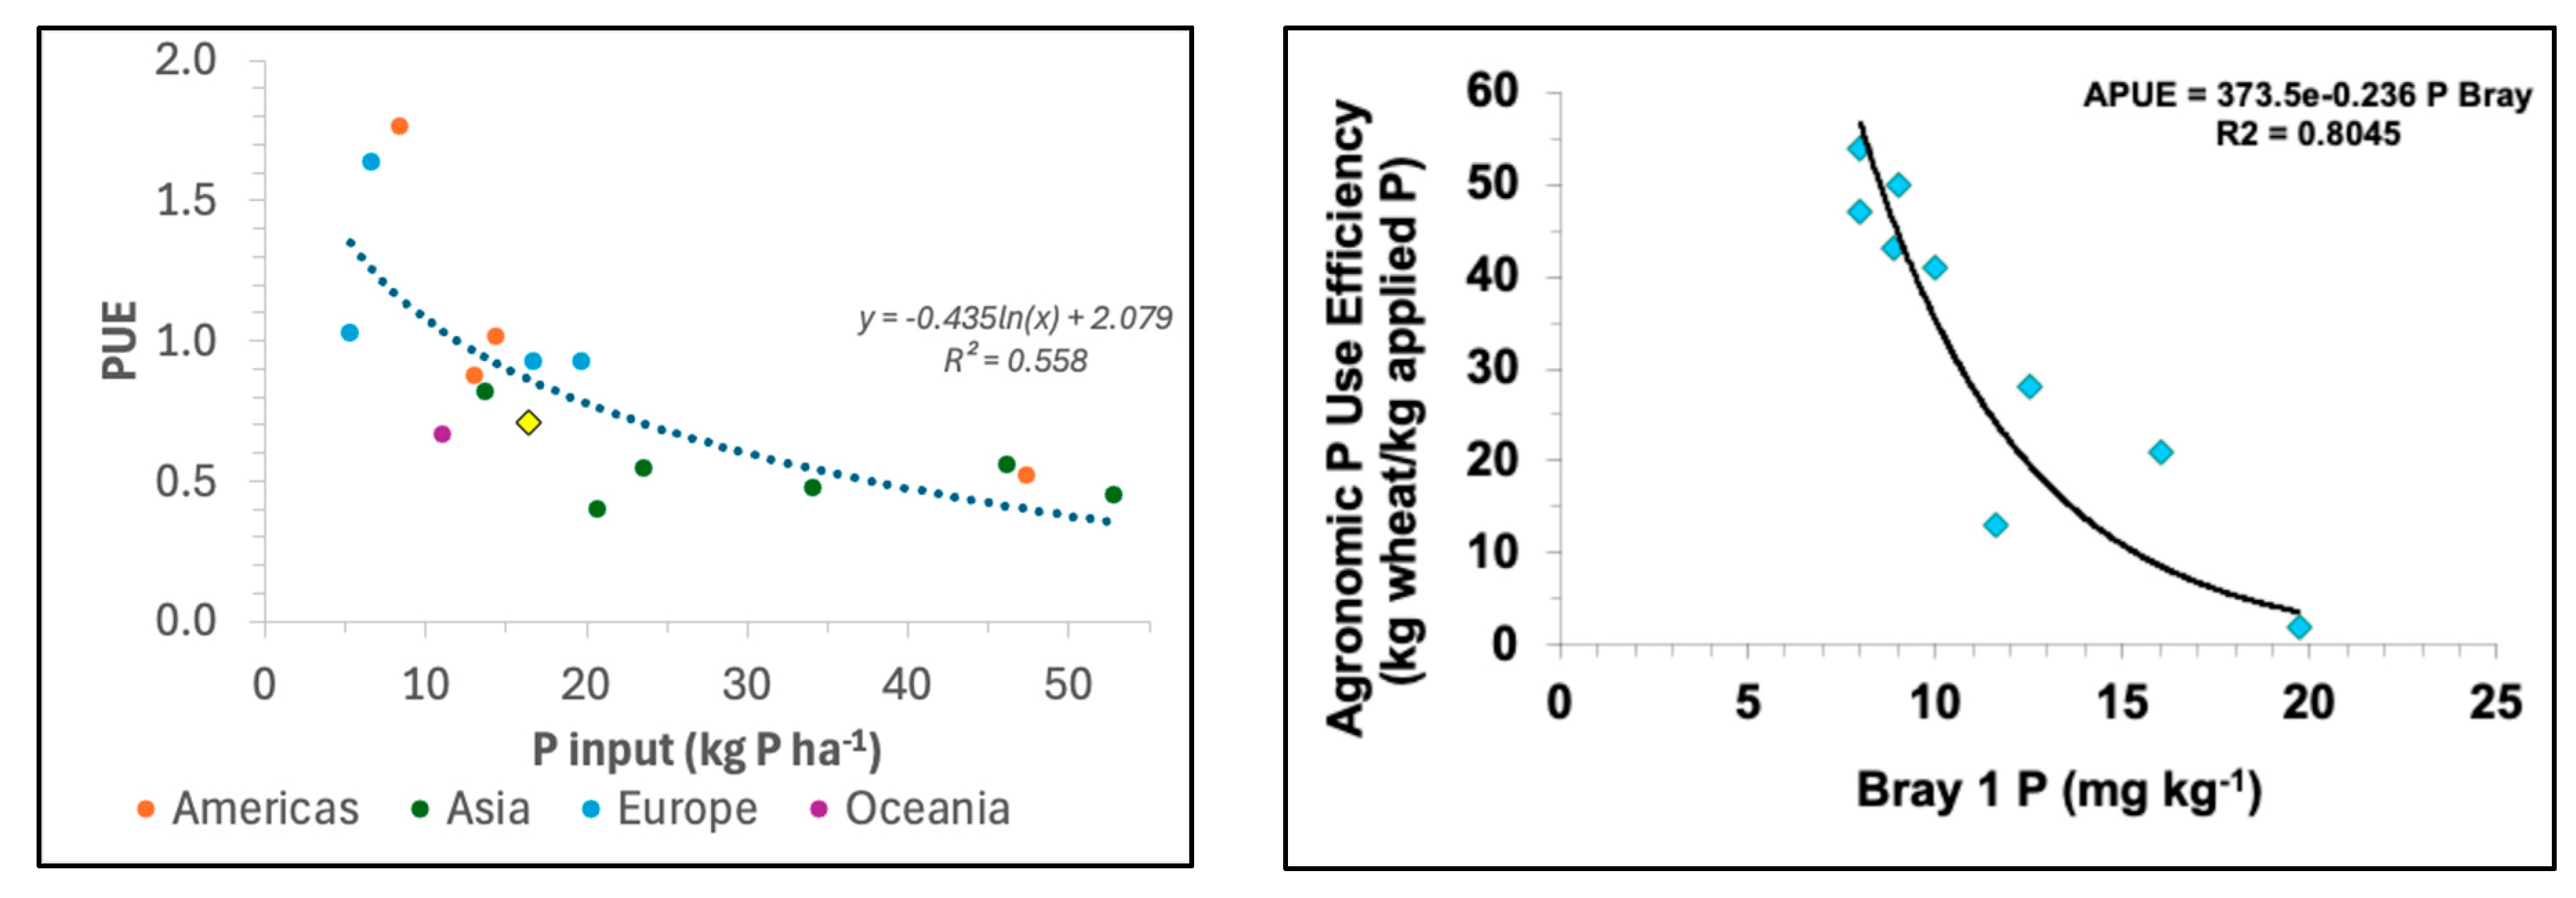
Figure 12.
Relationships between grain yield and P rate (PPF-P) for maize, rice, soybean and wheat for the main world grain producing countries. The continuous orange lines indicate the P rates needed to maintain neutral P balances (PNB-P of 1, removal equal to application). Values of P rate were drafted from IFA (2022) and correspond to the year 2018, while grain yields were drafted from FAOSTAT conserving averages of 2027, 2018, and 2019.
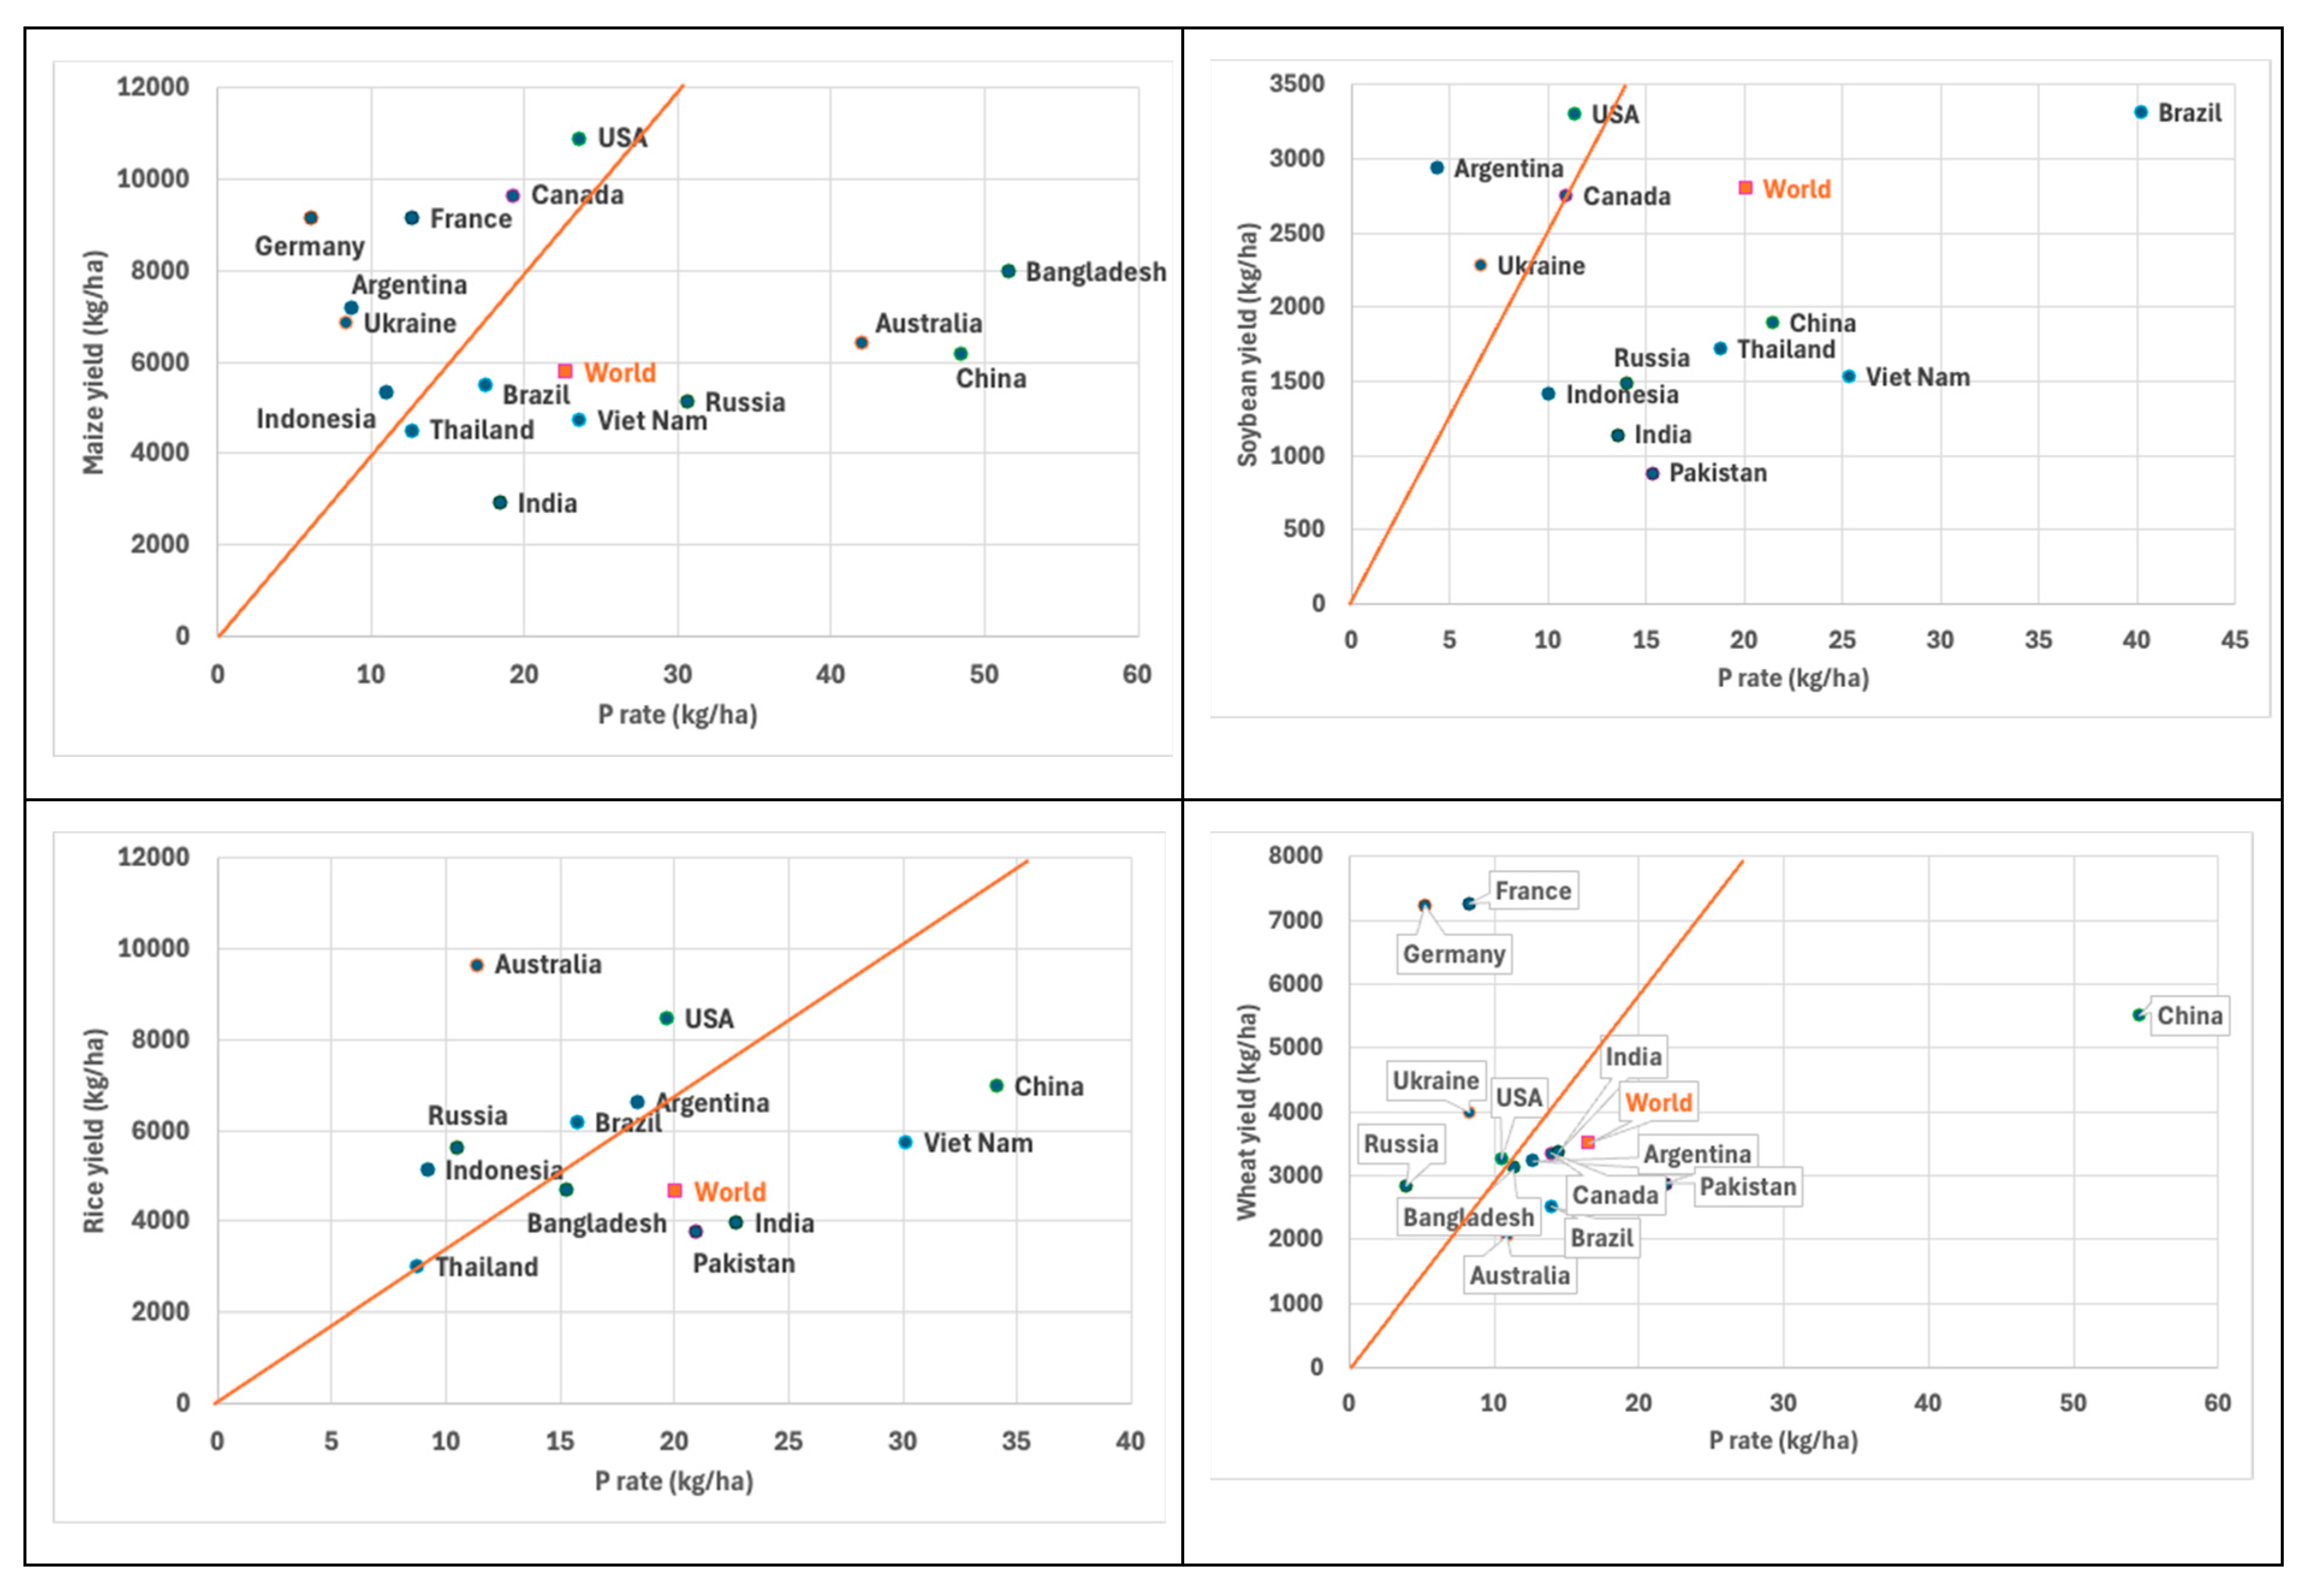
Figure 13.
Mechanisms of action of enhanced P fertilizer acquisition efficiency according to Weeks and Hettiarachchi (2019).
Figure 13.
Mechanisms of action of enhanced P fertilizer acquisition efficiency according to Weeks and Hettiarachchi (2019).
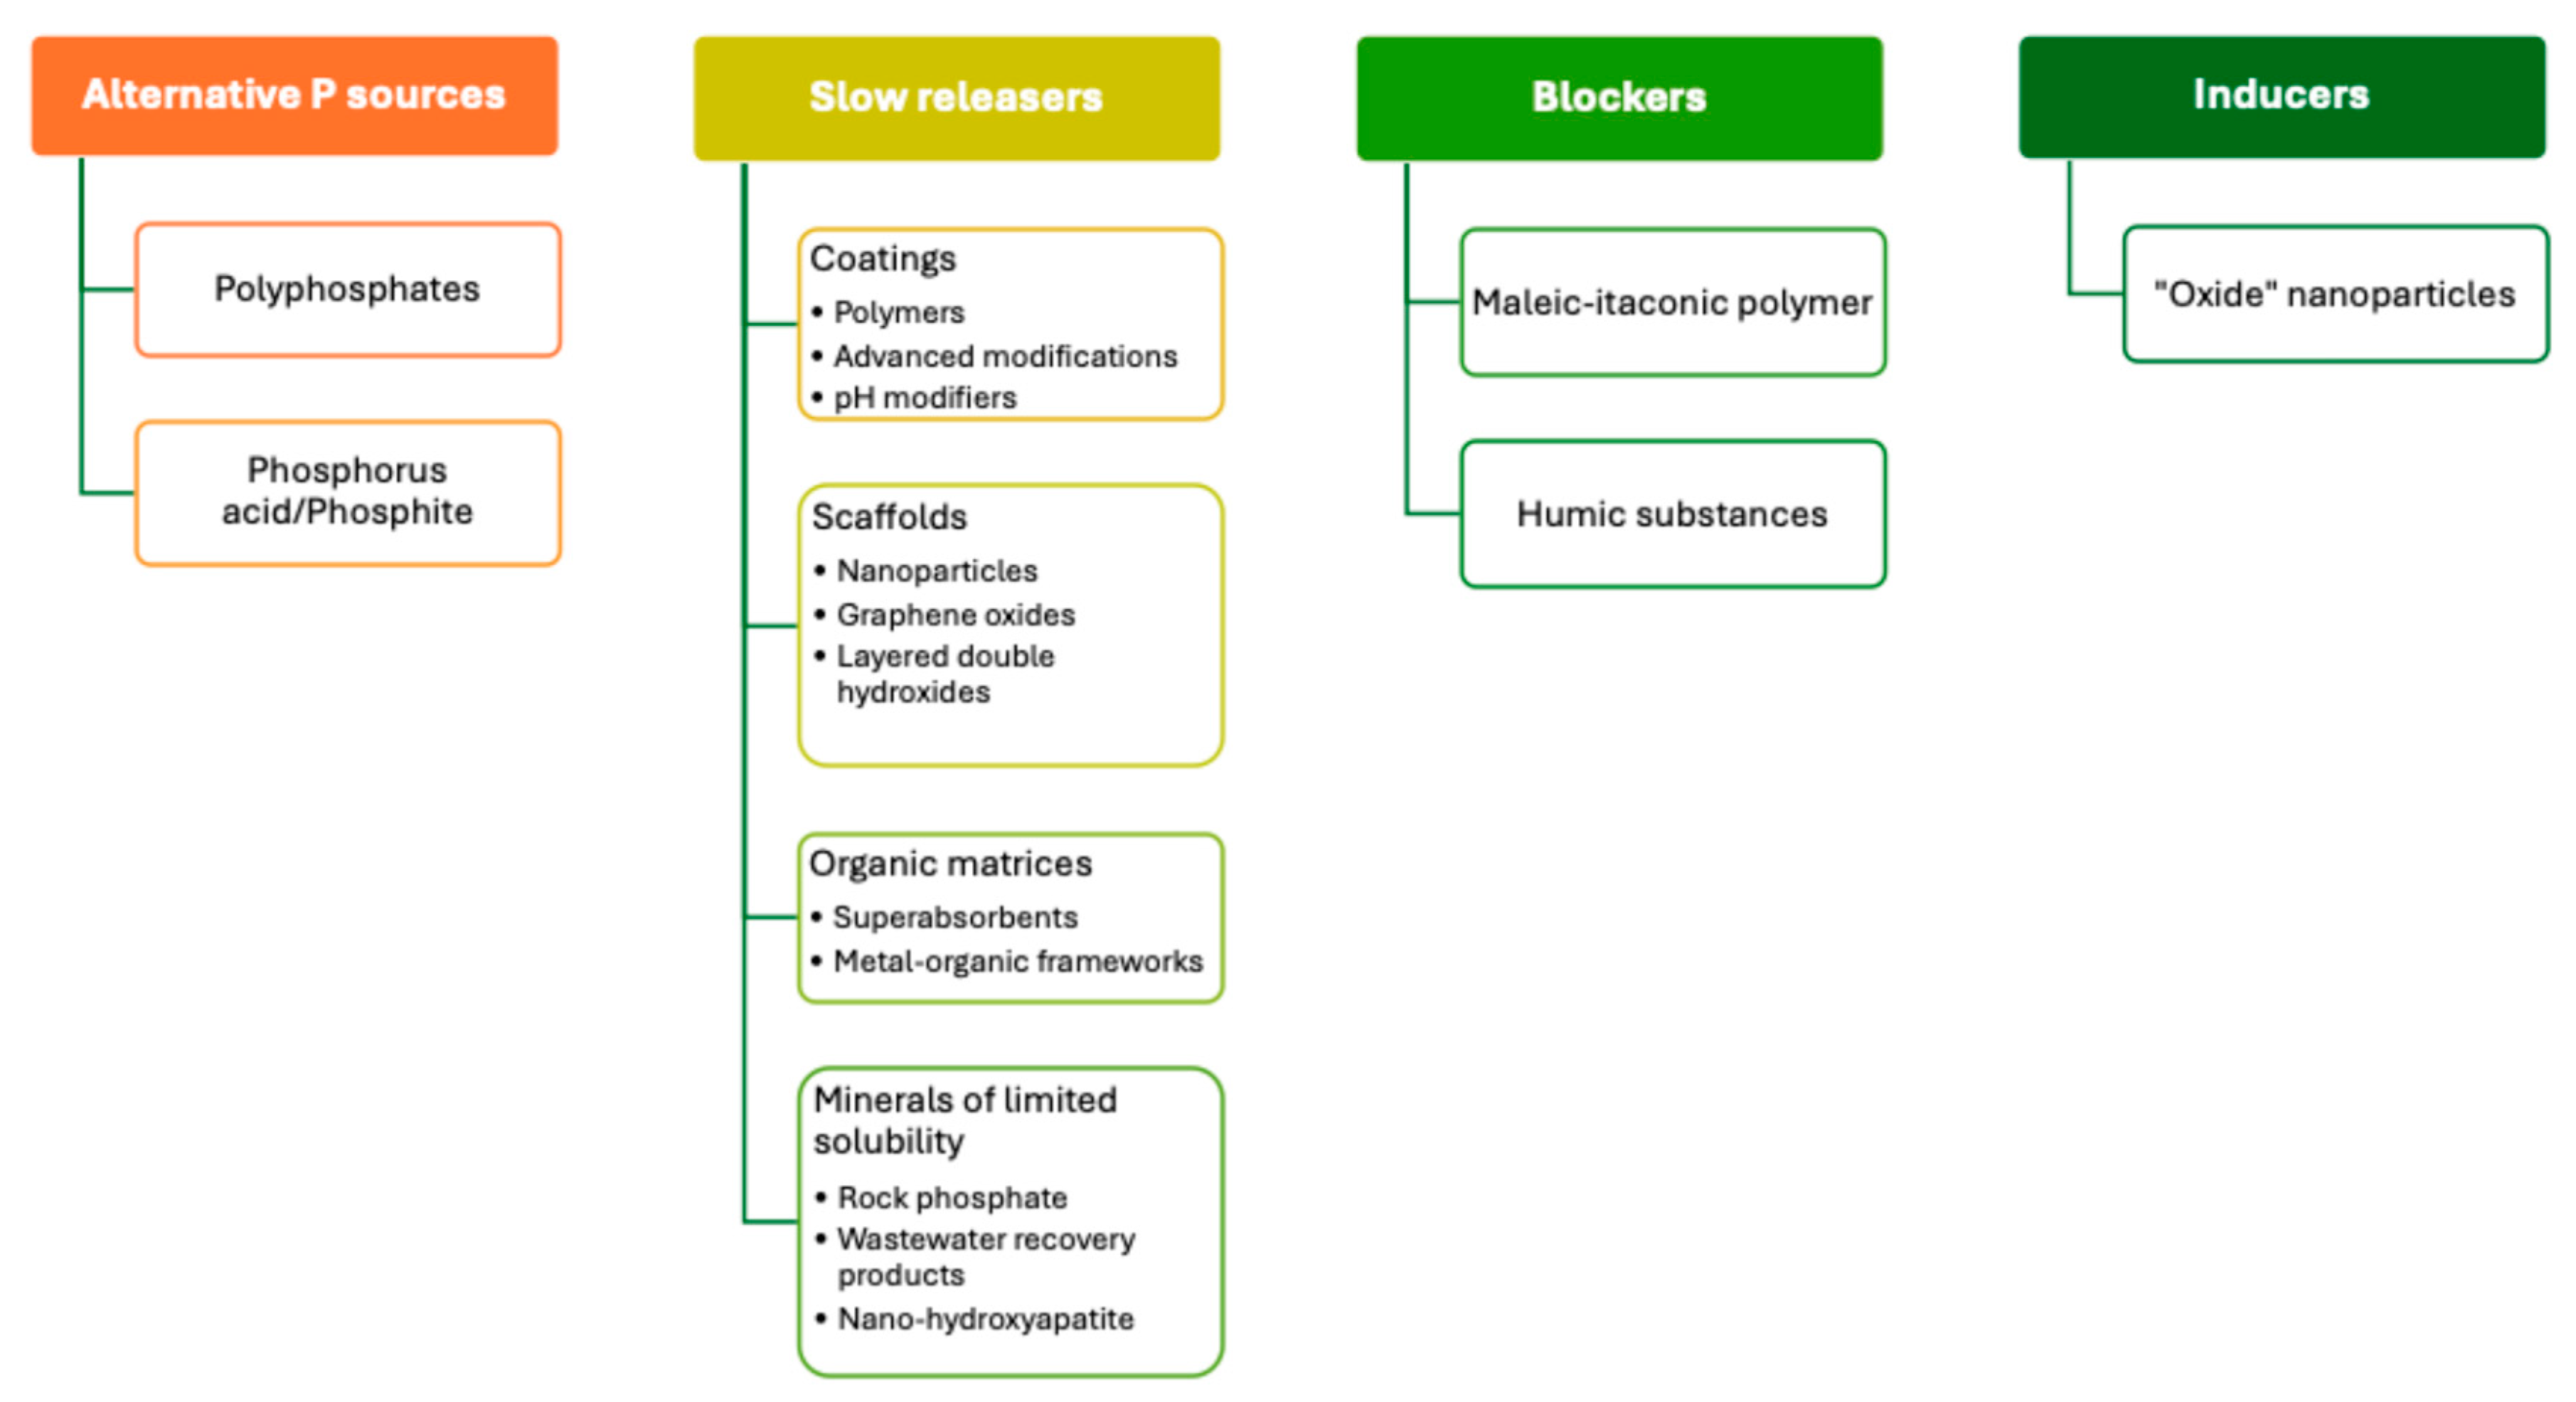
Figure 14.
Level of risks associated with soil test level and level of input for crop sufficiency and build-up maintenance fertility programs. From Leikam et al. (2003).
Figure 14.
Level of risks associated with soil test level and level of input for crop sufficiency and build-up maintenance fertility programs. From Leikam et al. (2003).
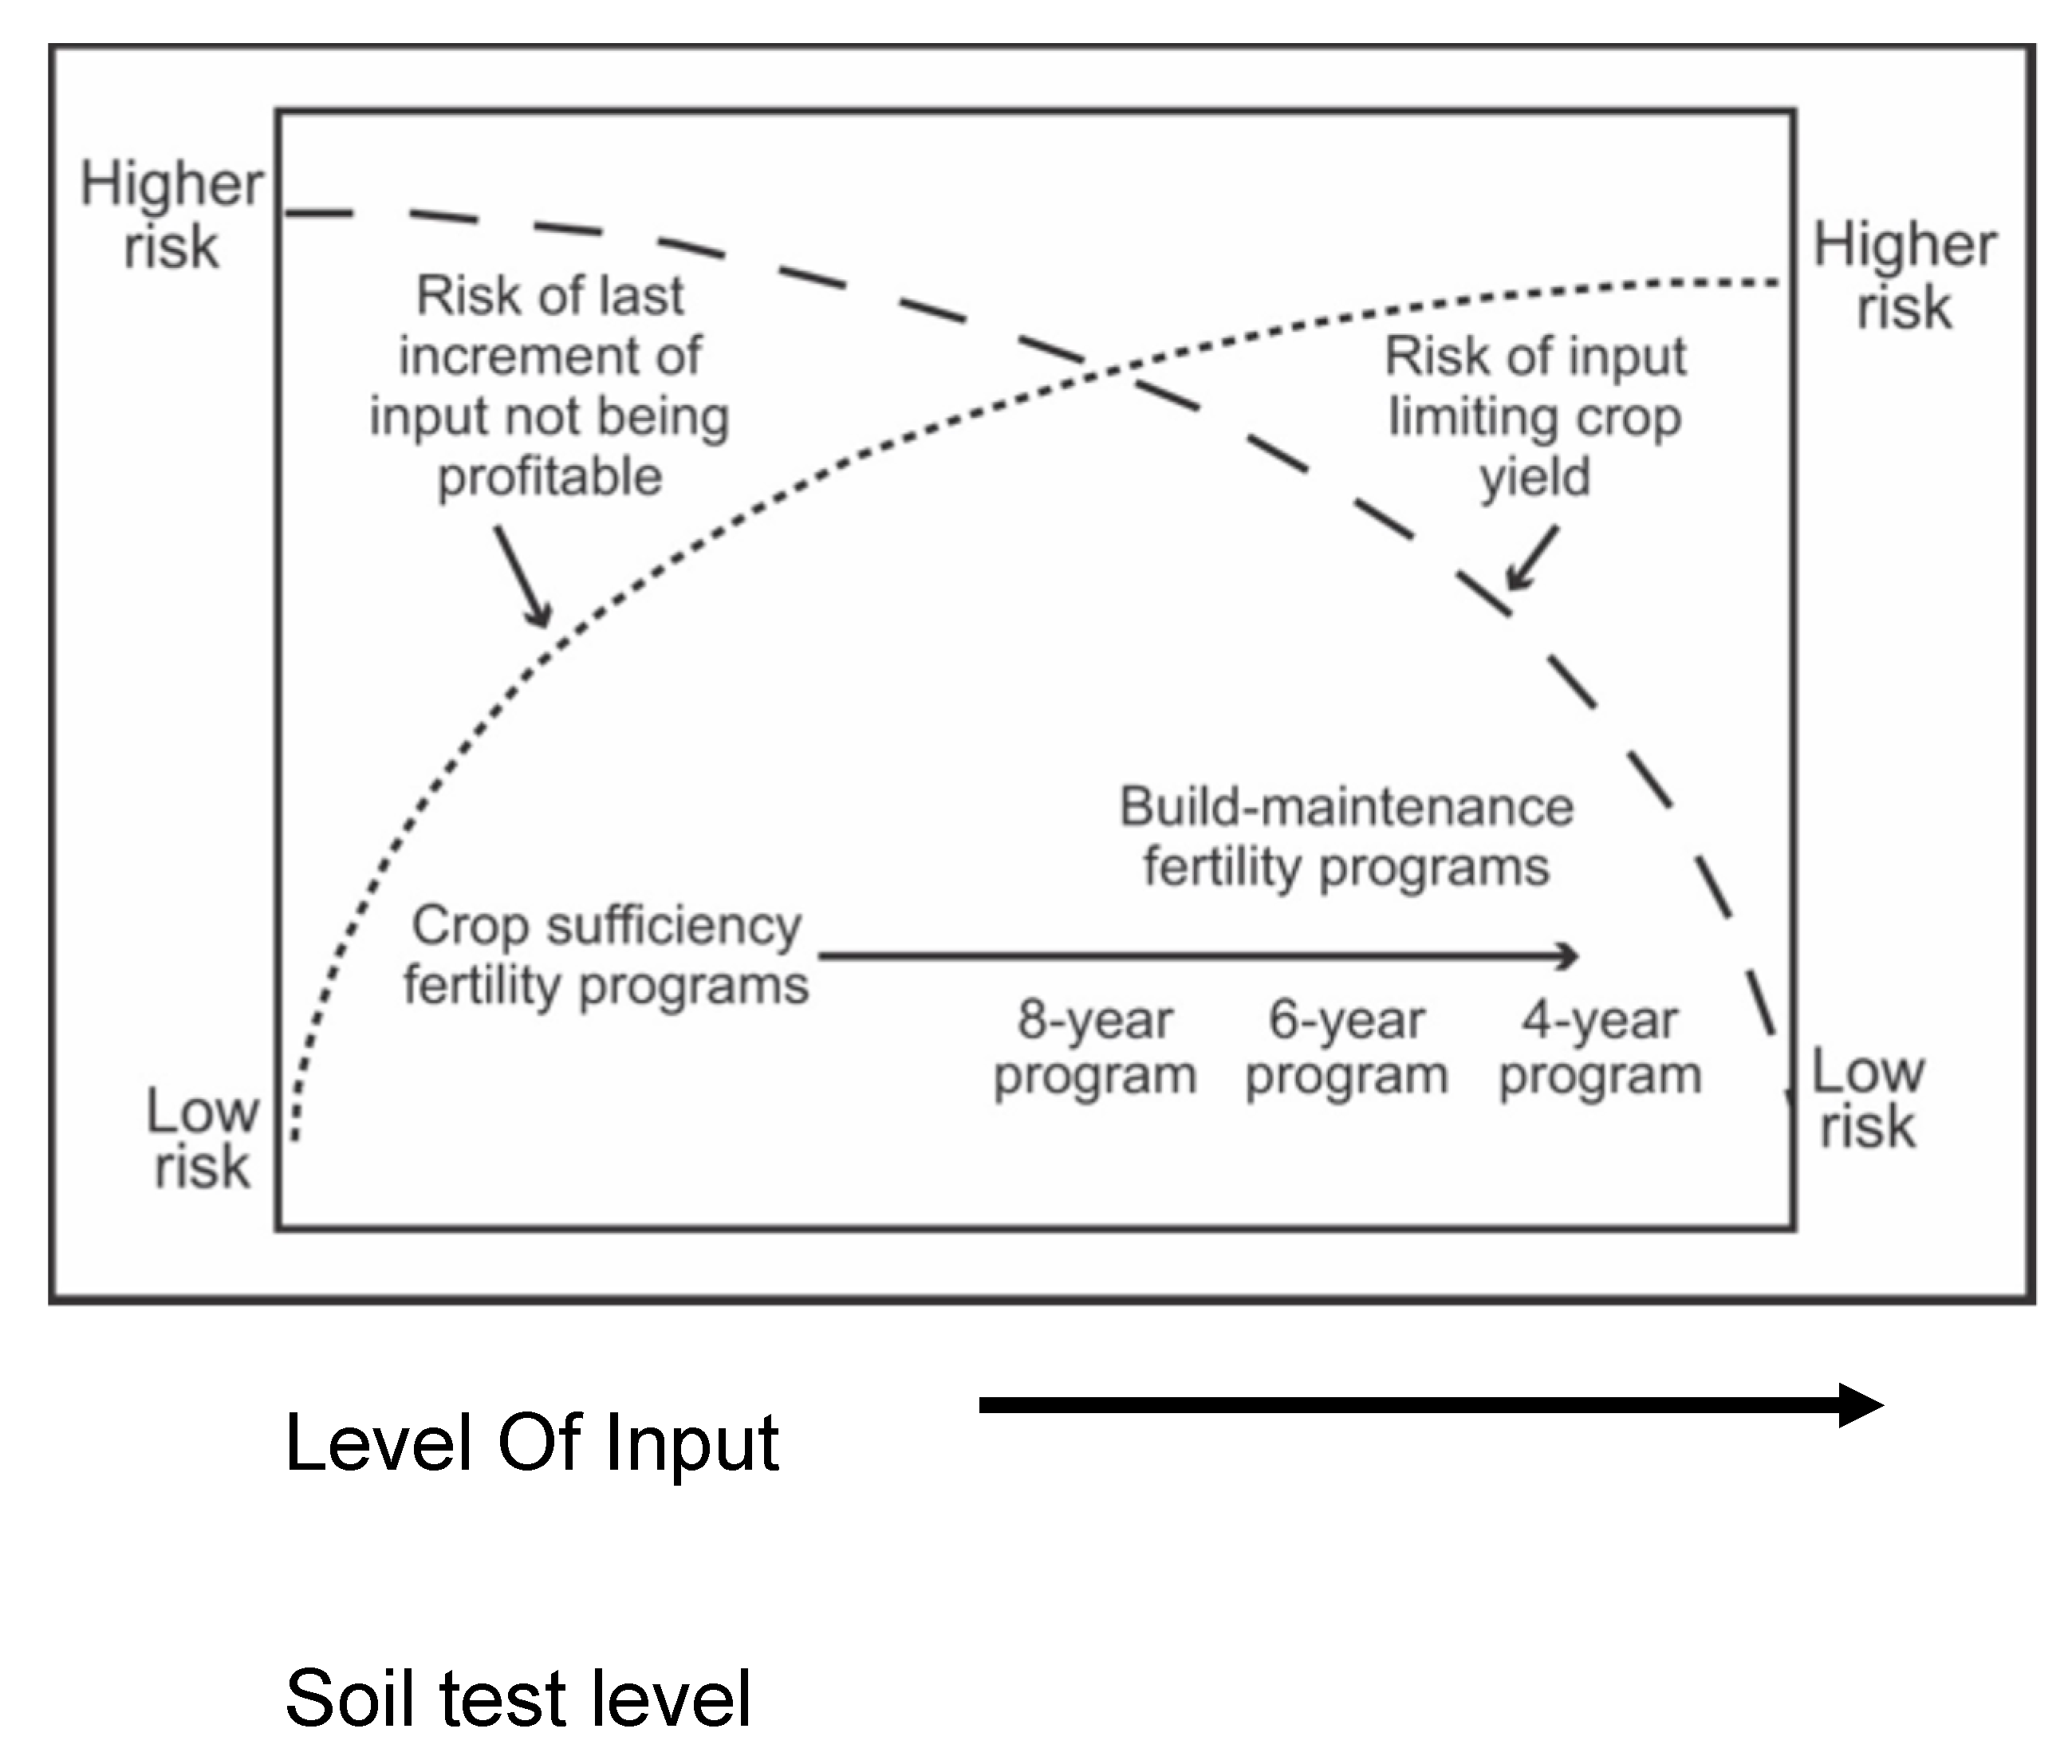
Figure 15.
Conceptual relationship of crop yield and P loss in surface runoff with soil P test and risk of P loss (Sharpley et al., 2003).
Figure 15.
Conceptual relationship of crop yield and P loss in surface runoff with soil P test and risk of P loss (Sharpley et al., 2003).
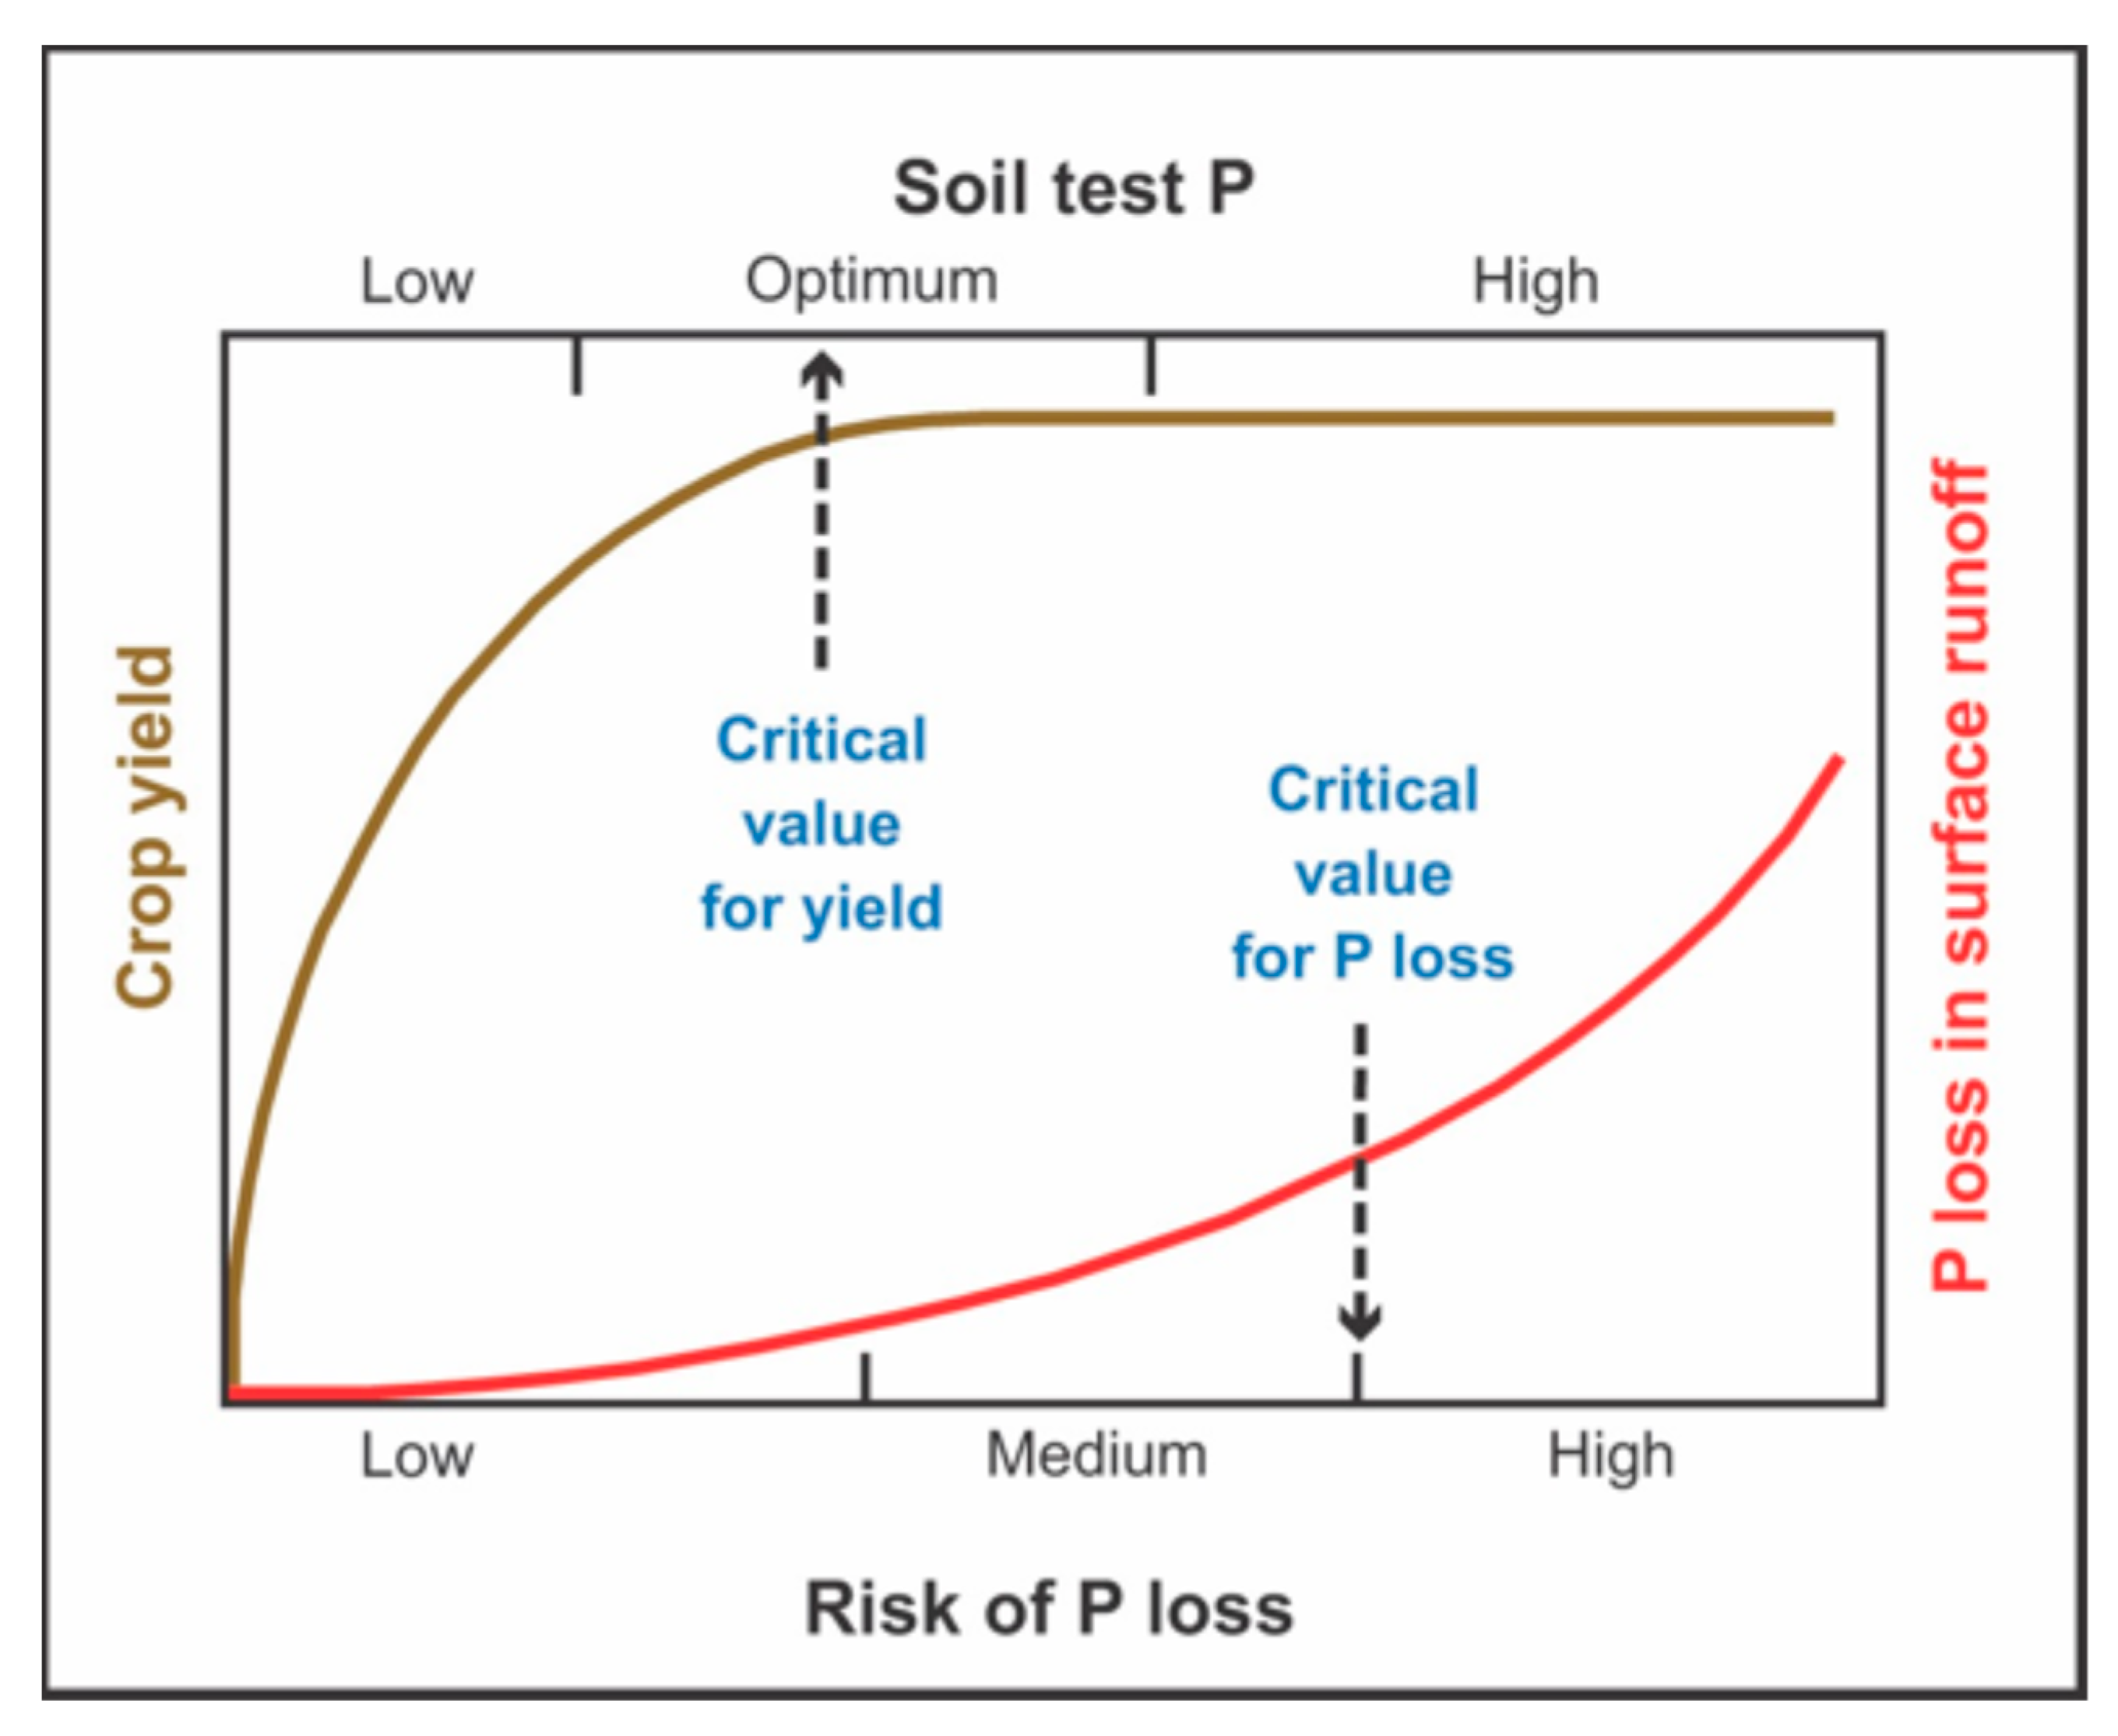
Figure 16.
The QUEFTS model consists of four steps. Adapted from Janssen et al. (1990) and Sattari et al. (2014).
Figure 16.
The QUEFTS model consists of four steps. Adapted from Janssen et al. (1990) and Sattari et al. (2014).
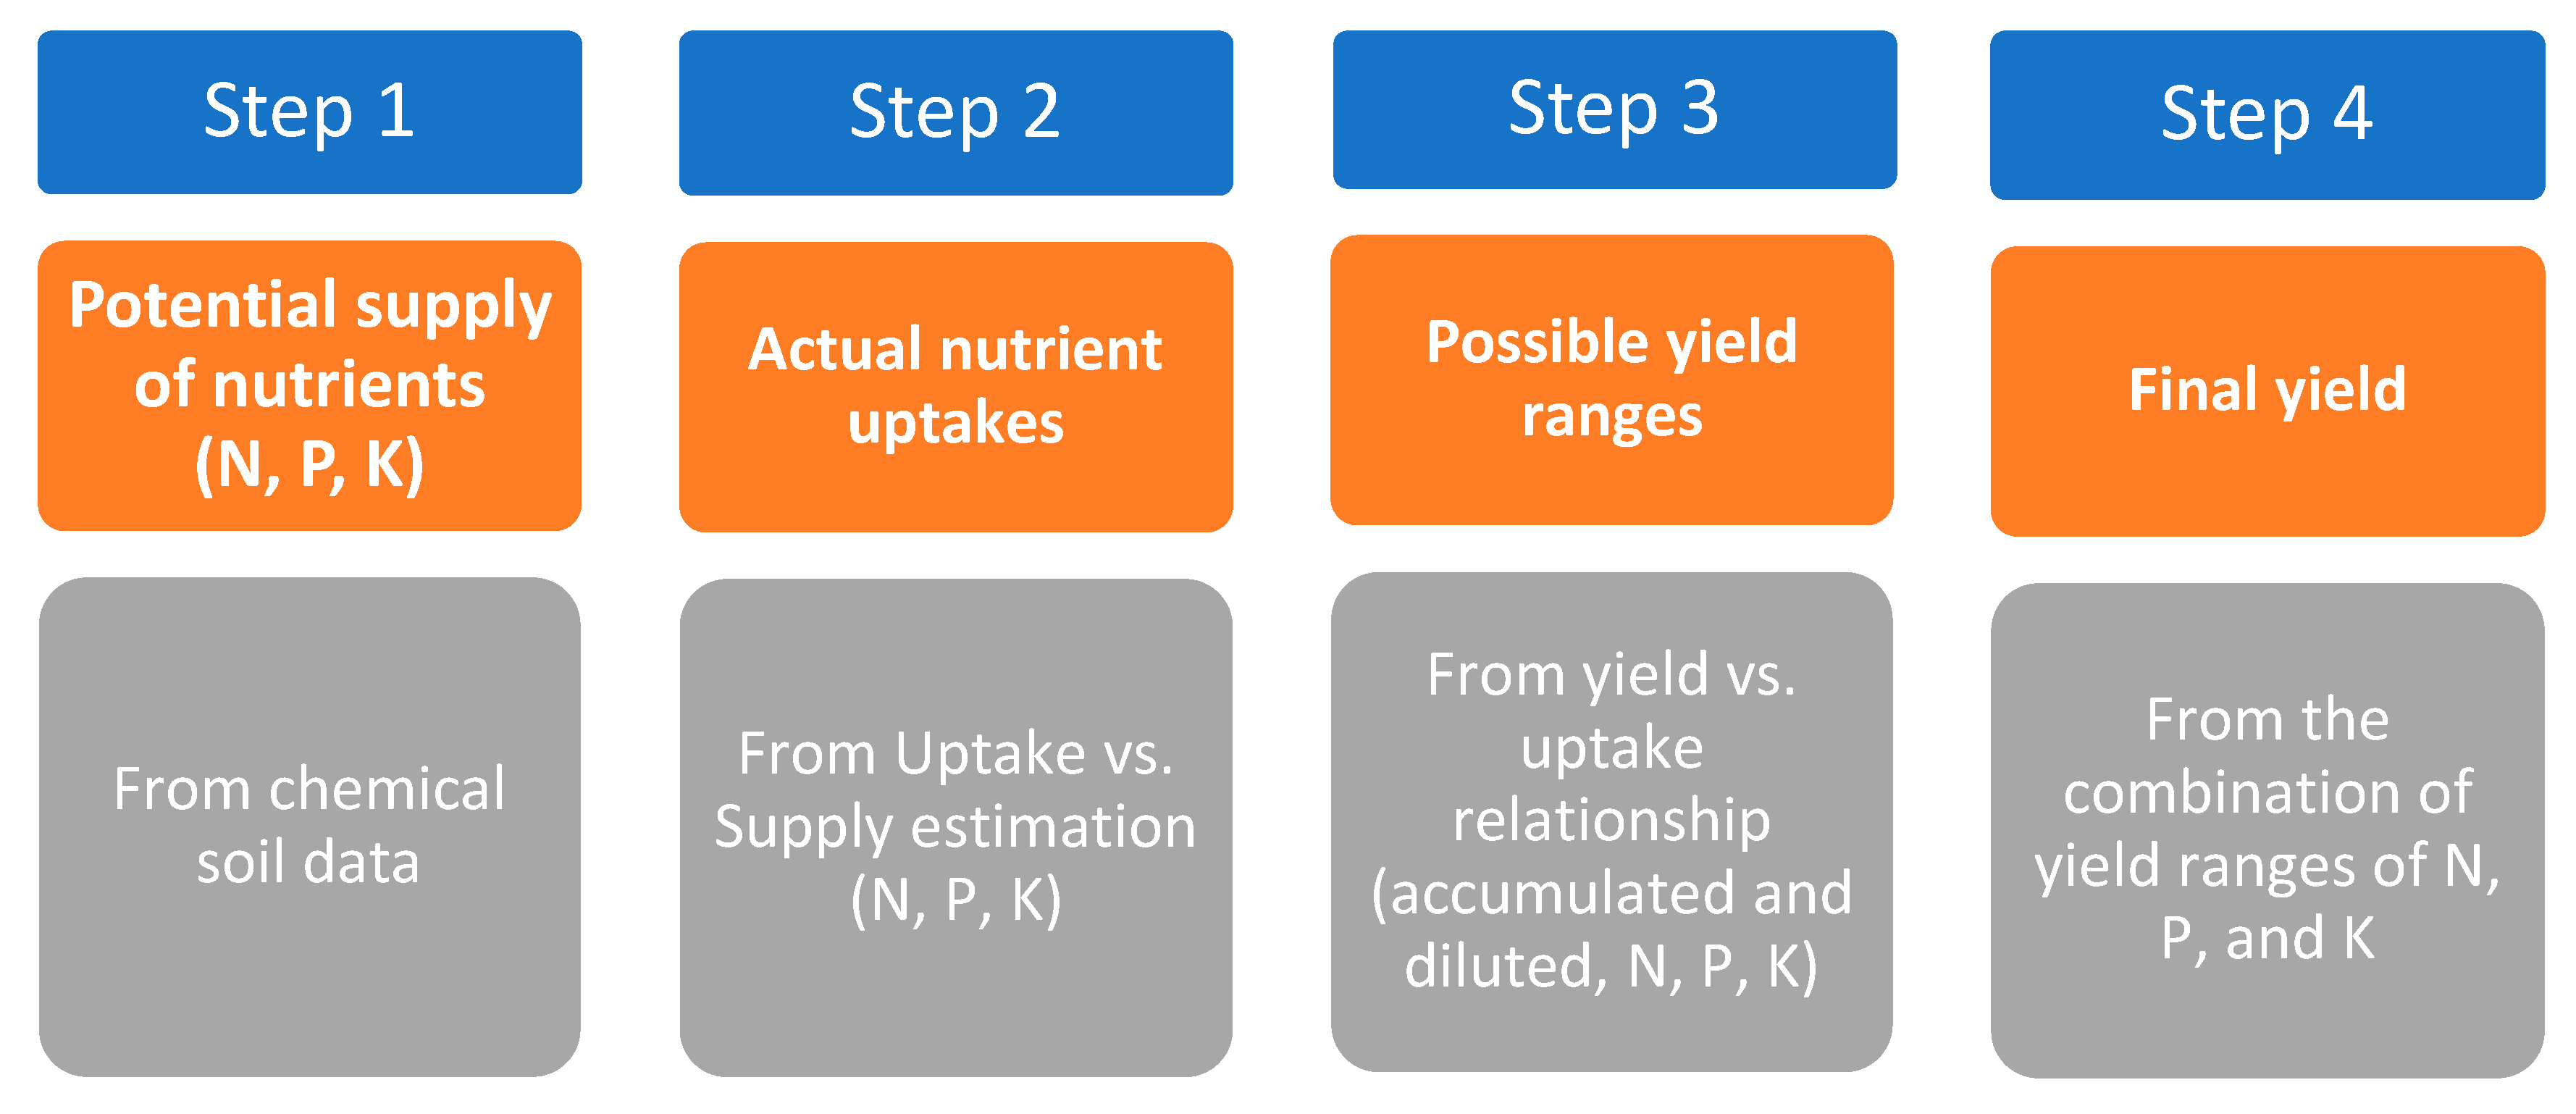
Figure 17.
Options for fertilizer P placement in field crops. From IPNI (2012).
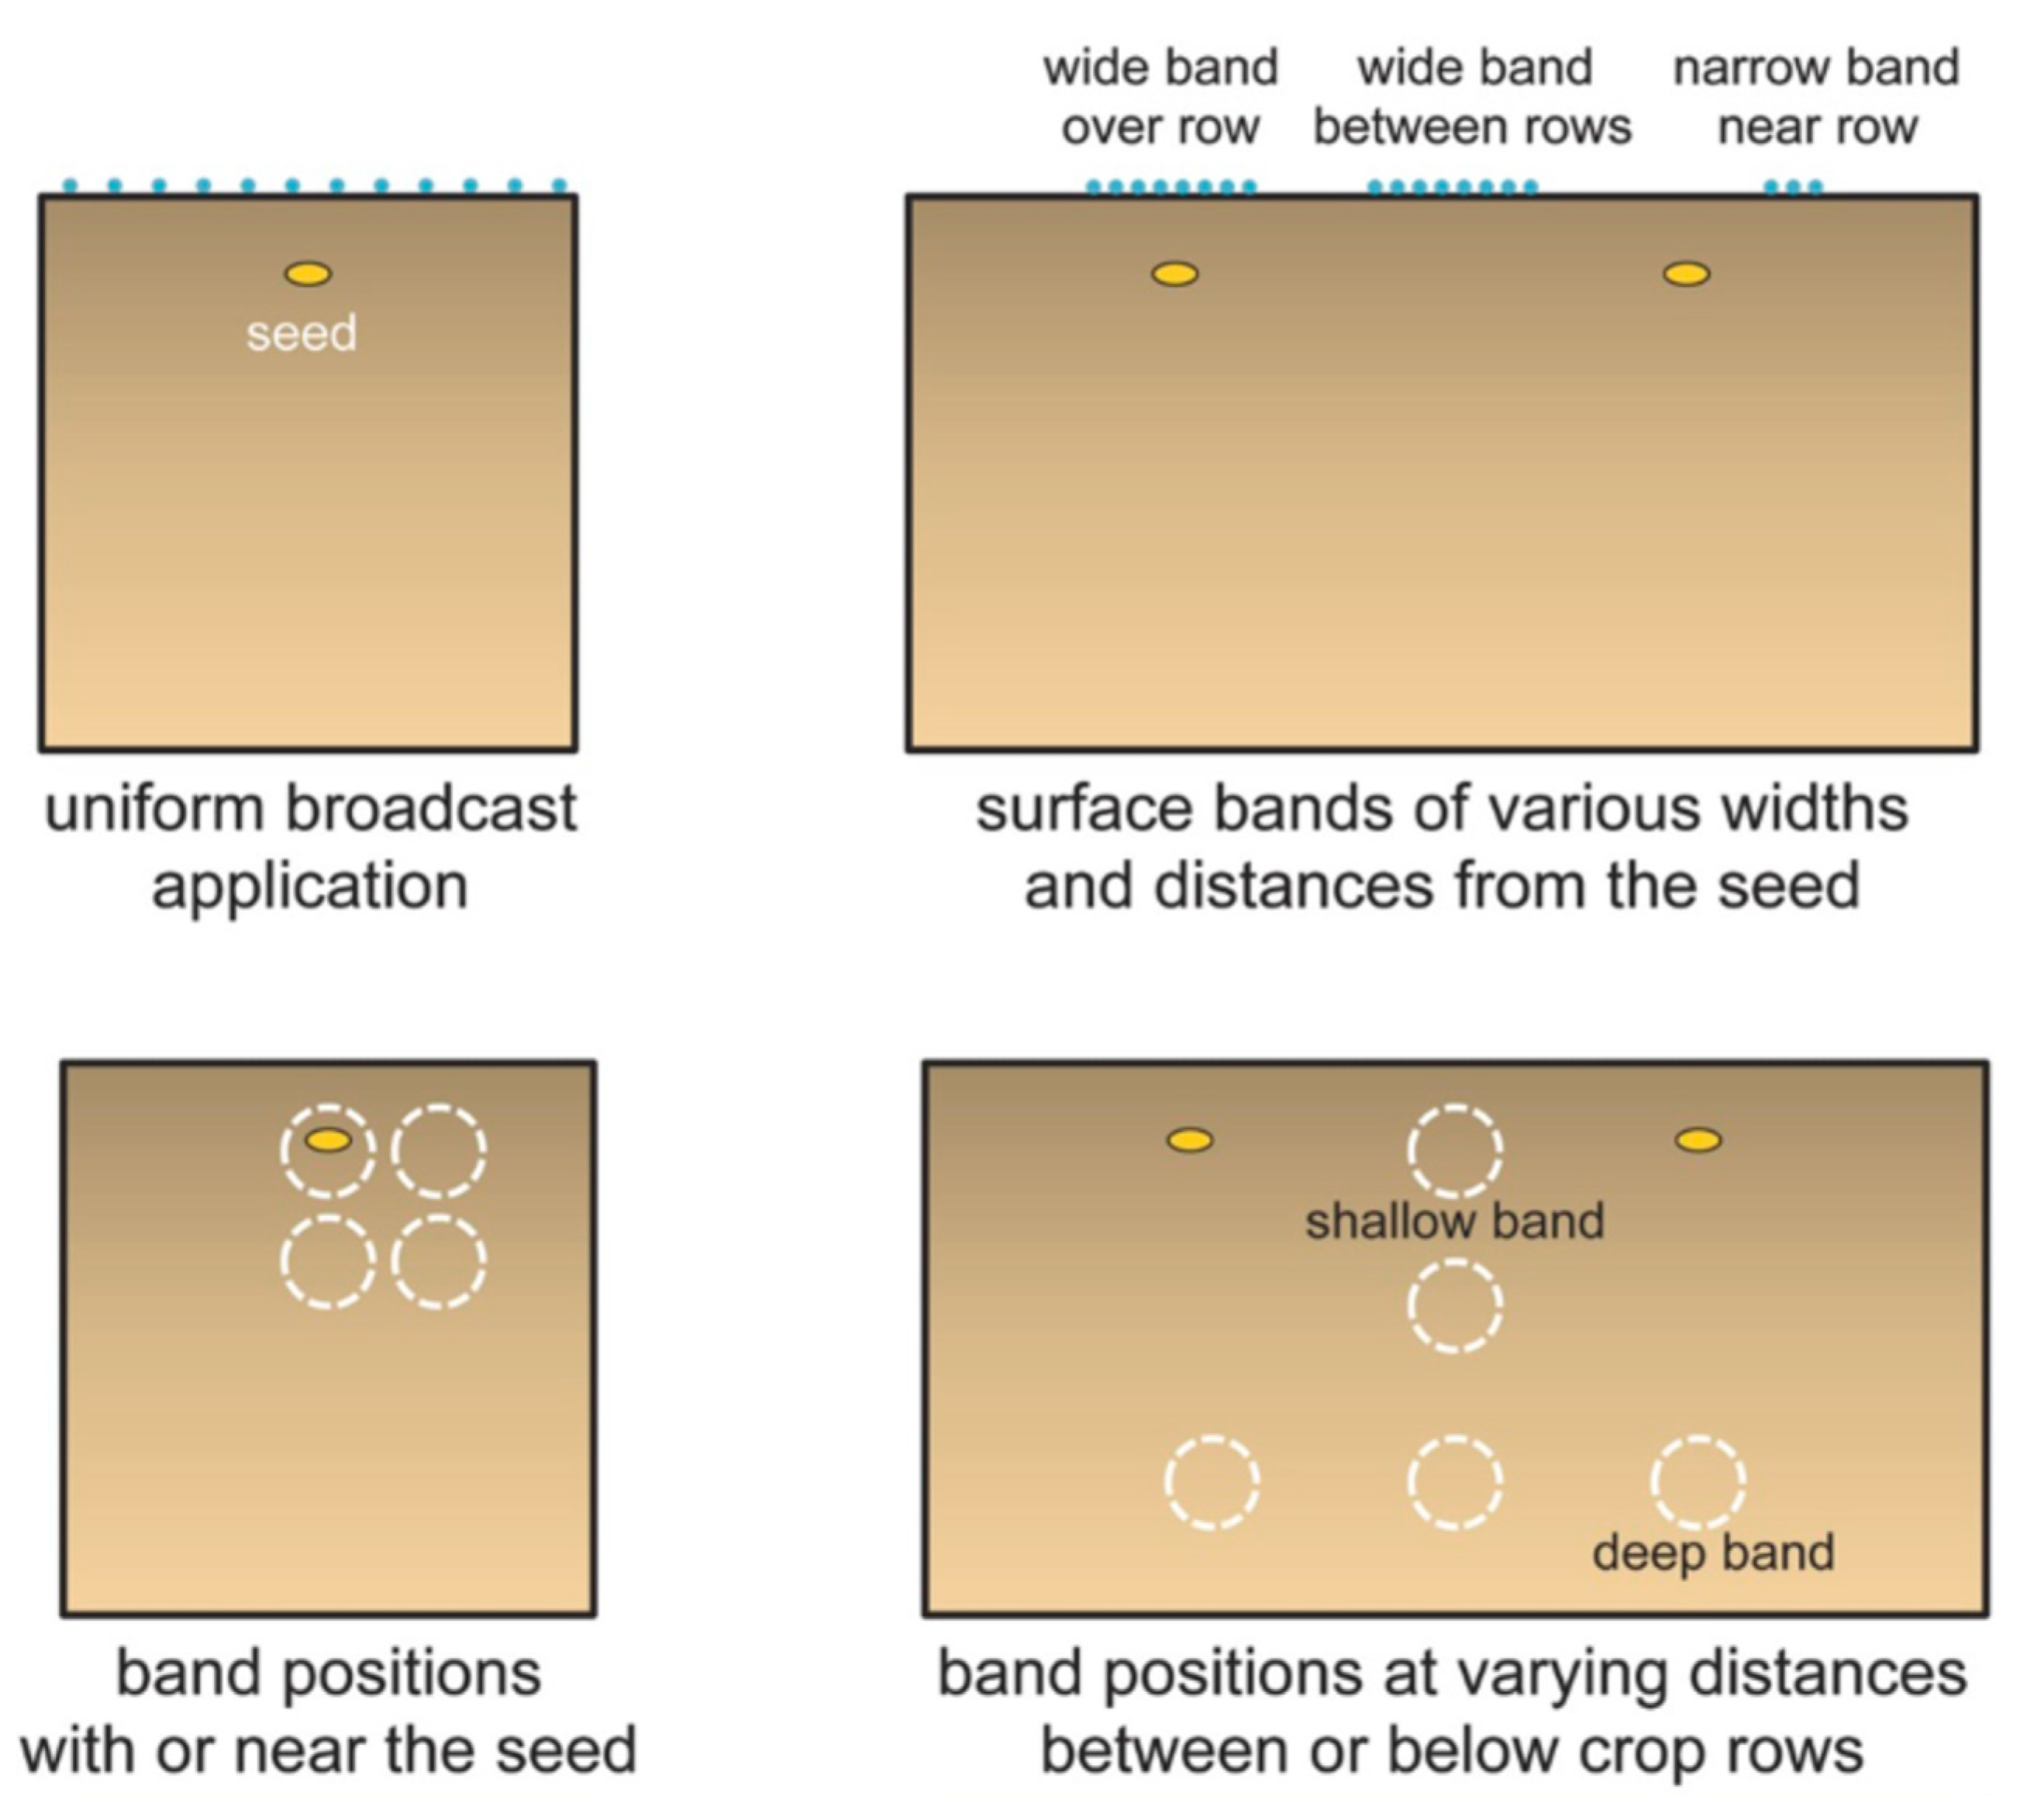
Figure 18.
Time and method of P application in cereal crops (i.e., maize).
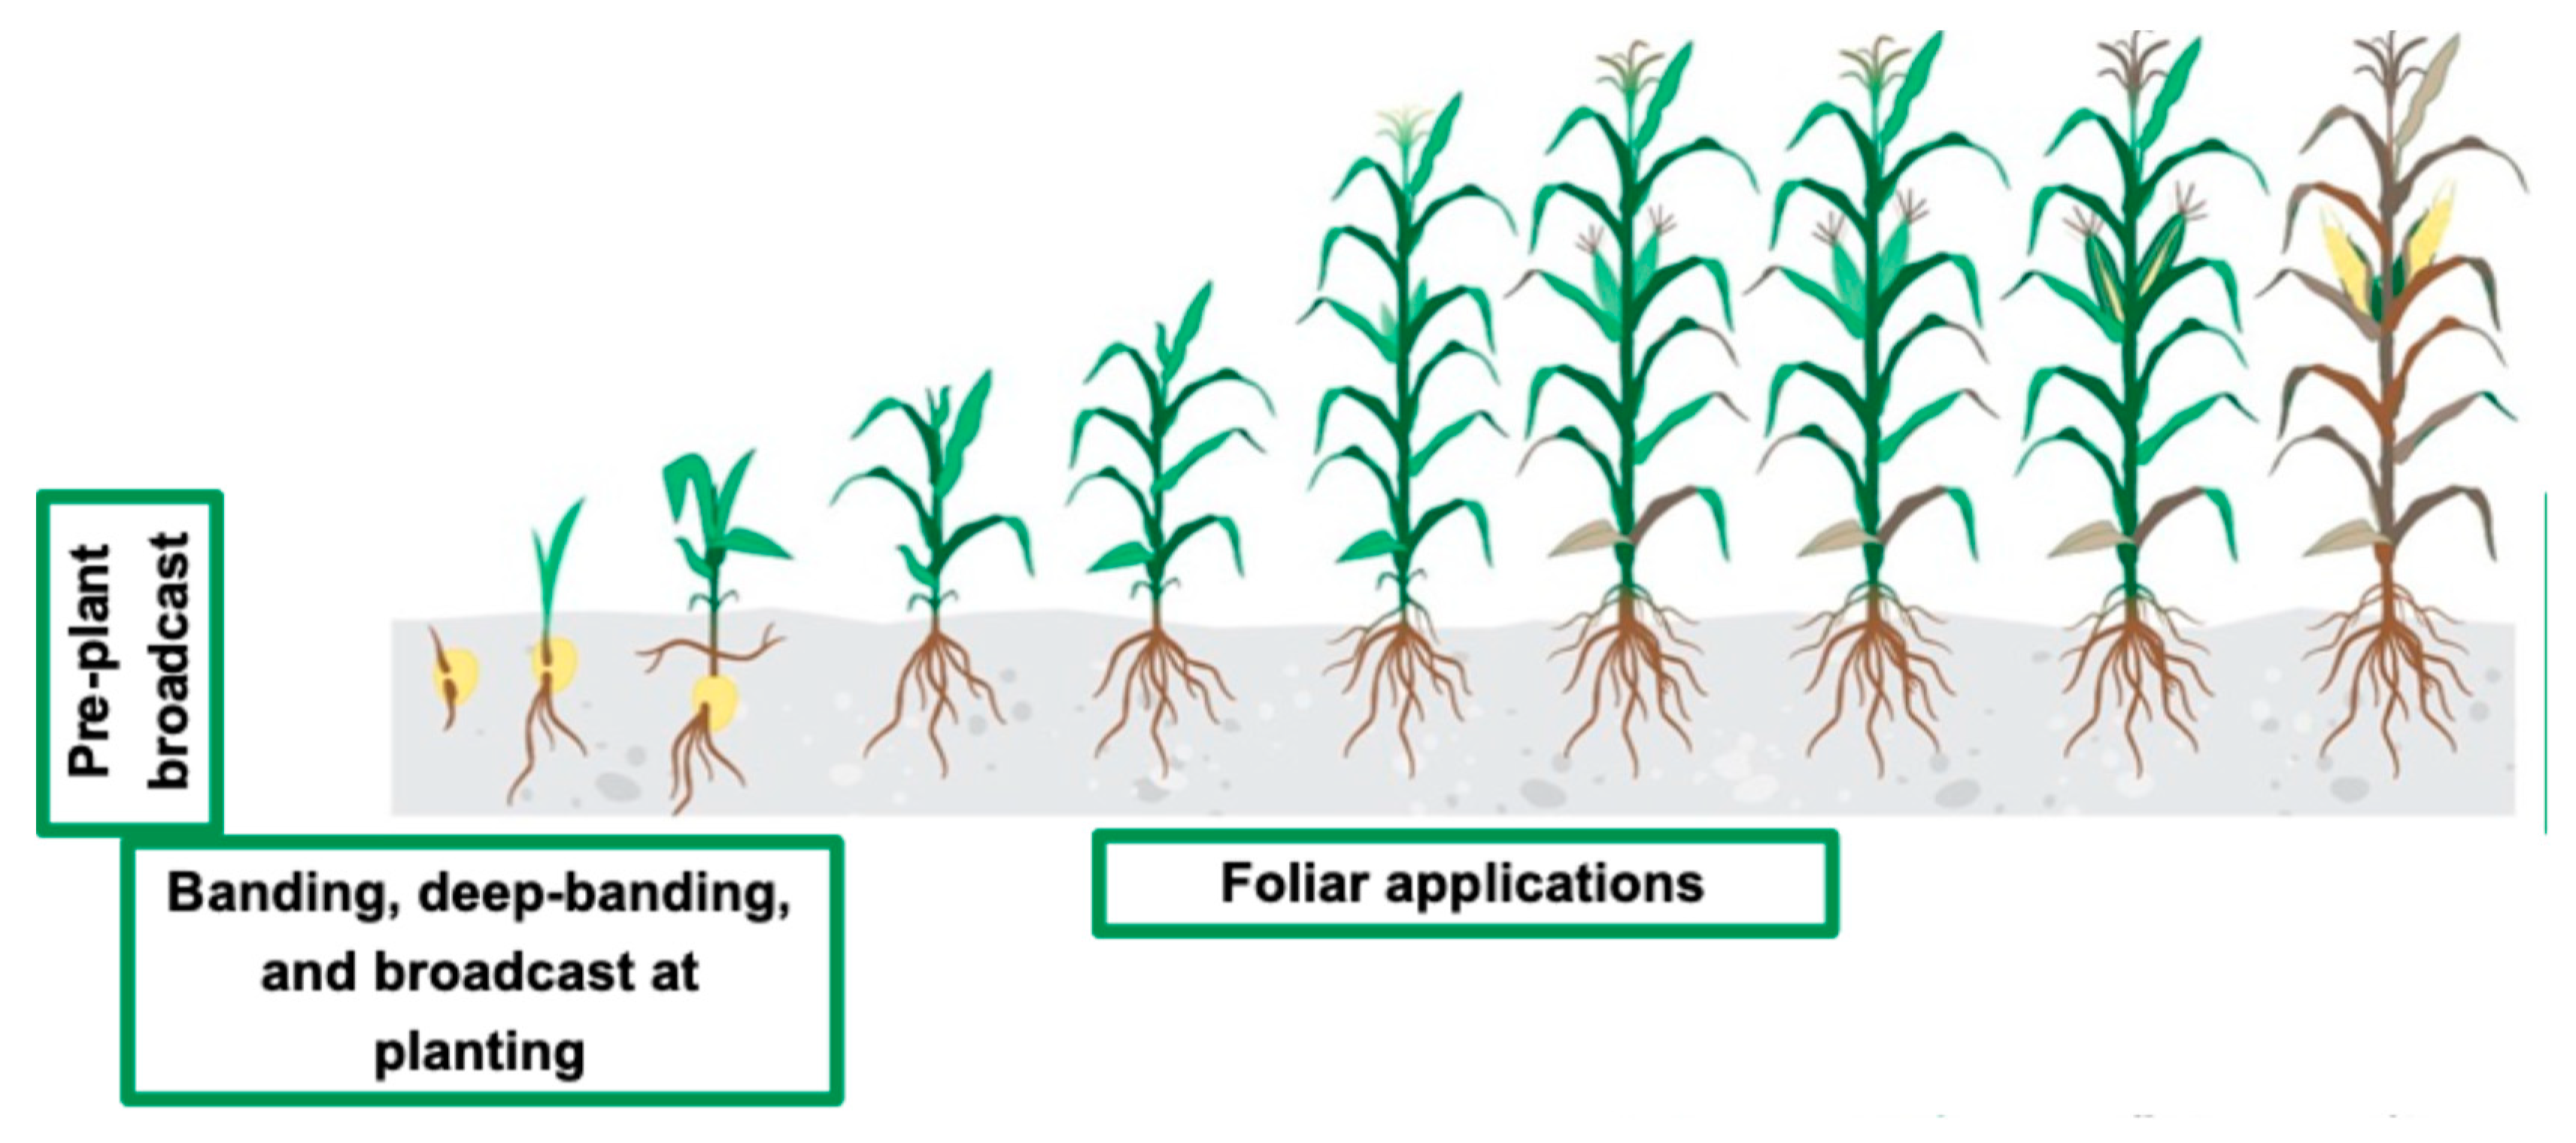
Table 1.
Phosphorus balance (P input – P removal, kg P/ha) for the 15 top producing countries and for the world. Source: FAOSTAT, averages 2019-22.
Table 1.
Phosphorus balance (P input – P removal, kg P/ha) for the 15 top producing countries and for the world. Source: FAOSTAT, averages 2019-22.
| Country | P balance |
| China | 21.2 |
| United States of America | 4.3 |
| India | 11.2 |
| Brazil | 23.3 |
| Russian Federation | 0.3 |
| Argentina | -6.2 |
| Canada | 2.5 |
| Ukraine | 4.1 |
| Indonesia | 4.1 |
| France | 2.4 |
| Bangladesh | 25.9 |
| Pakistan | 13.8 |
| Australia | 4.6 |
| Viet Nam | -0.5 |
| Germany | 3.4 |
| World | 13.9 |
Table 2.
Removal of P by field crops (Ludemann et al., 2023). Data available at https://datadryad.org/stash/dataset/doi:10.5061/dryad.n2z34tn0x.
Table 2.
Removal of P by field crops (Ludemann et al., 2023). Data available at https://datadryad.org/stash/dataset/doi:10.5061/dryad.n2z34tn0x.
| Crop (FAO nomenclature) |
P removal (kg P t-1 grain) |
| Barley | 3.46 |
| Beans, dry | 5.71 |
| Buckwheat | 2.20 |
| Canary seed | 2.90 |
| Chickpeas | 5.06 |
| Groundnuts, with shell | 3.61 |
| Lentils | 5.88 |
| Linseed | 7.04 |
| Lupins | 5.06 |
| Maize | 2.94 |
| Millet | 3.91 |
| Mustard seed | 9.24 |
| Oats | 3.73 |
| Peas, dry | 8.73 |
| Quinoa | 2.20 |
| Rapeseed | 7.04 |
| Rice, paddy | 2.87 |
| Rye | 3.42 |
| Safflower seed | 5.33 |
| Seed cotton | 11.62 |
| Sesame seed | 5.12 |
| Sorghum | 3.83 |
| Soybeans | 6.33 |
| Sunflower seed | 4.09 |
| Triticale | 2.86 |
| Wheat | 3.84 |
Table 3.
Ranges of P requirements for field crops.
| Crop | Uptake | P harvest index | Removal in grain | References |
| kg t-1 | % | kg P t-1 grain | ||
| Maize | 2.7-4.5 | 69-85 | 2.3-3.7 | Bender et al., 2013 Setiyono et al., 2010 Ciampitti et al., 2013 Xu et al., 2013 Karbo et al., 2017 |
| Wheat | 2.7-5.2 | 68-90 | 2.2-4.5 | Malhi et al., 2006 Selles et al., 2011 Lazaro et al., 2012 Chuan et al., 2013 Wall and McDonald, 2015 Divito et al., 2017 Karbo et al., 2017 |
| 2.0-4.5 | 60-70 | 1.7-2.6 | Dobermann et al., 1998 Dobermann and Fairhurst, 2000 Xu et al., 2015 |
|
| Soybean | 8.23 6.54 |
83 67 |
6.83 4.36 3.8-6.2 |
Karbo et al., 2017 Salvagiotti et al., 2021 Nakayama et al., 2024 |
| Barley | 2.6-4.0 | 75-87 | 2.2-3.7 | Murrell, 2008 Malhi et al., 2006 |
| Sorghum | 4.4 | 82 | 3.6 | Ciampitti and García, 2007 Murrell, 2008 |
| Sunflower | 11.0 | 62 | 4.3-6.8 | Ciampitti and García, 2007 Murrell, 2008 |
| Canola | 15.0 | 73 | 11.0 | Ciampitti and García, 2007 |
| Oats | 3.3 | 87 | 2.6-3.9 | Murrell, 2008 Malhi et al., 2006 |
| Rye | 4.3 | 60 | 2.6-3.6 | Ciampitti and García, 2007 Murrell, 2008 |
| Foxtail Millet Setaria italica |
4.1-4.6 | - | - | Mubeena et al.2019 |
| Pearl millet Pennisetum glaucum |
- | - | 1.8-3.1 | Payne et al., 1995 |
| Finger millet Eleusine coracana |
2.9-5.0 | 48-56 | 1.2-2.8 | Prashanth et al. 2019 |
| Quinoa | 4.2-4.7 | 62-67 | 2.8 | Alvar-Beltran et al., 2021 |
Table 4.
P rates, grain yields, and PNB-P for maize, rice, soybean, and wheat at selected countries of Africa. Values of P rate were drafted from IFA (2022) and correspond to the year 2018, while grain yields were drafted from FAOSTAT conserving averages of 2027, 2018, and 2019.
Table 4.
P rates, grain yields, and PNB-P for maize, rice, soybean, and wheat at selected countries of Africa. Values of P rate were drafted from IFA (2022) and correspond to the year 2018, while grain yields were drafted from FAOSTAT conserving averages of 2027, 2018, and 2019.
| Country | P rate (kg P/ha) |
Grain yield (kg grain/ha) |
PNB-P |
| Maize | |||
| Burkina Faso | 8 | 1652 | 0.5 |
| Egypt | 12 | 6752 | 1.4 |
| Mali | 5 | 2821 | 1.4 |
| Morocco | 17 | 792 | 0.1 |
| Nigeria | 1 | 1729 | 5.2 |
| South Africa | 20 | 5130 | 0.7 |
| Tanzania | 1 | 1722 | 3.4 |
| Rice | |||
| Burkina Faso | 3 | 2091 | 1.8 |
| Egypt | 7 | 8811 | 3.6 |
| Mali | 9 | 3417 | 1.1 |
| Morocco | 17 | 7698 | 1.4 |
| Nigeria | 1 | 2388 | 8.2 |
| Soybeans | |||
| Egypt | 16 | 2890 | 0.7 |
| Nigeria | 1 | 935 | 2.7 |
| South Africa | 7 | 1950 | 1.0 |
| Wheat | |||
| Egypt | 10 | 6551 | 2.3 |
| Mali | 8 | 3901 | 1.6 |
| Morocco | 8 | 2092 | 0.9 |
| South Africa | 17 | 3225 | 0.7 |
Table 5.
Scientific principles that sustain the 4Rs and some examples of BMPs associated with them (adapted from IPNI, 2012).
Table 5.
Scientific principles that sustain the 4Rs and some examples of BMPs associated with them (adapted from IPNI, 2012).
| Scientific principles | BMPs | |
|---|---|---|
| Right source | Consider rate, time, and place of application Ensure balanced supply of nutrients Supply nutrients in plant-available form Suit soil physical and chemical properties Recognize synergisms among nutrient elements and sources Recognize blend compatibility Recognize benefits and sensitivities to associated elements |
Election of commercial fertilizer Use of enhance-efficient fertilizers Use of livestock manure Use of compost Use of wastes |
| Right rate | Consider source, time, and place of application Assess nutrient supply from all sources Assess plant nutrient demand Assess soil nutrient supply Assess all available nutrient sources Predict fertilizer use efficiency Consider soil resource impacts Consider economics |
Soil testing Estimate target yield Evaluate economics Balance crop removal |
| Right time | Consider source, rate, and place of application Assess the dynamics of crop uptake and soil supply Recognize dynamics of soil nutrient loss Evaluate logistics of field operations Determine timing of loss risk |
Select pre-plant, planting, in-season |
| Right place | Consider source, rate, and time of application Recognize crop rooting patterns Consider soil chemical reactions Suit the goals of the tillage system Manage spatial variability |
Select broadcast, banded/drilled/injected Variable-rate application Use conservation tillage practices to reduce erosion and runoff |
Table 6.
Concentration of P of commercial fertilizers and alternative P sources.
| Source | P concentration (%) | Water P solubility | Concentration of other nutrients (%) | Form |
|---|---|---|---|---|
| Rock phosphate | 10-18 Highly variable depending upon origin |
0-10% | Variable | Solid |
| Triple superphosphate (TSP) | 20-21 | 85-95% | 13-15 Ca | Solid |
| Single superphosphate (SSP) | 8-9 | 85-95% | 11-12 S 18-21 Ca |
Solid |
| Monoammonium phosphate (MAP) | 20-23 | 90-95% | 10-12 | Solid |
| Diammonium phosphate (DAP) | 20 | 90-95% | 18 | Solid |
| Ammonium polyphosphate (APP) | 15-16 | 100% | 10-11 N | Solution |
| Nitrophosphate | 6-8 | Up to 95% | 10-28 N 0-14 K |
Solid |
| Manure | 1-5 | Variable | Many, variable concentrations | Solid |
| Pig slurry | 0.1 | Variable | Many, variable concentrations | Slurry |
| Broiler litter | 0.8-2 | Variable | Many, variable concentrations | Solid |
| Dairy effluents | 0.8 | Variable | Many, variable concentrations | Liquid |
| Struvite | 8-12 | Low, variable | 10 Mg, 6 N | Solid |
Table 7.
Analysis methods used to determine extractable phosphorus (P) in soils.
| Extractant | Composition | Comments | Source |
|---|---|---|---|
| Bray 1 | 0,03 M NH4F + 0,025 M HCl | For P in acidic and neutral soils | Bray and Kurtz, 1945 |
| Olsen | 0,5 M NaHCO3 - pH 8,5 0.5 h extraction in 1:20 soil:solution | For alkaline soils, also in neutral to acidic soils | Olsen et al., 1954 |
| Mehlich-1 | 0,05 M HCl + 0,0125 M H2SO4 | Multinutrient for acidic soils | Mehlich, 1953 |
| Mehlich-3 | 0,2 M CH3COOH + 0,25 M NH4NO3 + 0,015 N H4F + 0,013 M HNO3 + 0,001 M EDTA - pH 2,5 | Multinutrient for a wide range of soils. Correlates with Bray 1, Mehlich-1 and Olsen | Mehlich, 1984 |
| AB-DTPA | 1 M NH4HCO3 + 0,005 M DTPA - pH 7,5 | Multinutrient for alkaline soils |
Soltanpour and Schwab, 1977 |
| Colwell P | 0,5 M NaHCO3 - pH 8,5 16 h extraction in 1:100 soil:solution | Developed at Australia | Colwell, 1963 |
| Morgan and Morgan | Morgan: 0,7 M NaC2H3O2 + 0,54 M CH3COOH - pH 4,8 | Multinutrient used in the northeastern US for acidic soils. Not adapted to calcareous soils. | Morgan, 1941 |
| Ion Exchange resin | Adsorption of P by anion-exchange resin placed in a soil-water suspension | Useful for acid and alkaline soils, and soils treated with lime and rock phosphate | Raij et al., 1986 |
| Egner | 0,01 M lactato de Ca + 0,02 M HCl 0,10 M NH4 lactate+ HOAc –pH 3,75 |
Multinutrient used in Europe | Egner et al., 1960 |
Table 8.
Soil test P critical thresholds/ranges for different extractants calibrated for field crop cropping systems in different regions of the world.
Table 8.
Soil test P critical thresholds/ranges for different extractants calibrated for field crop cropping systems in different regions of the world.
| Method | Region | Critical threshold/range (mg kg-1) |
Reference | Comments |
|---|---|---|---|---|
| Bray-1 | Iowa (US) | 18-25 Other crops 24-30 Alfalfa and wheat |
Mallarino et al., 2023 | 0-15 cm |
| Nebraska (US) | 22.2 | Balboa et al., 2024 | 0-20 cm, continuous irrigated corn | |
| Pampas (Argentina) | 12-19 | Sucunza et al., 2018 | Wheat, maize, and soybean 0-20 cm |
|
| Uruguay | 16-18 | Rabuffetti, 2017 | Wheat | |
| SE Asia | 7-20 | Dobermann and Fairhurst, 2000 | Rice | |
| Olsen | Australia | 9.8-14 | Speirs et al., 2013 | Wheat, 0-10 cm |
| Eastern plains of Bolivia | 6-14 | Reussi Calvo et al., 2025 | Miaze and soybean, 0-20 cm | |
| Southern Chile | 15-25 | Hirzel, 2004 | 0-20 cm | |
| China | 10-28 | Bai et al.., 2013 | Four LTE, maize, wheat and rice, 0-20 cm | |
| China | 12.1-17.3 (Maize) 12.5-19.0 (wheat) |
Tang et al., 2009 | Multisite LTE, 15 years, 0-20 cm | |
| SE Asia | 5 (non-calcareous soils) 25 (calcareous soils) |
Dobermann and Fairhurst (2000) | Rice | |
| UK | 16 | Johnston and Poulton, 2019 | ||
| Mehlich-1 | Paraguay | 12 15 |
Cubilla et al., 2012 | 0-10 cm 41-60% clay 21-40% clay |
| Paraná (Brazil) | 11.2 (wheat, barley, oats) 8.2 (maize, soybean) |
Vieira et al., 2015 | 0-20 cm | |
| Mehlich-3 | Iowa (US) | 18-25 (Other crops) 24-30 (Alfalfa and wheat) |
Mallarino et al., 2023 | 0-15 cm, Colorimetric method |
| Iowa (US) | 28-40 (Other crops) 33-44 (Alfalfa and wheat) |
Mallarino et al., 2023 | 0-15 cm, ICP method | |
| Australia | 23-35 | Speirs et al., 2013 | Wheat, 0-10 cm | |
| Ohio (US) | 20-40 (Maize and soybean) 30-50 (wheat and alfalfa) |
Culman et al., 2020 | 0-20 cm | |
| Resin | Cerrados Region (Brazil) | 15 | Sousa et al., 2002 | |
| Colwell | Australia | 22-30 | Speirs et al., 2013 | Wheat, 0-10 cm |
| Australia | 15-47 | Bell et al., 2013 | Wheat, 0-10 cm, analysis of 1777 experiments, variation according soil classification and pH | |
| DGT-P | Australia | 30-49 | Speirs et al., 2013 | Wheat, 0-10 cm |
| Australia | 66 | Mason et al., 2010 | Wheat, 0-10 cm | |
| Morgan | Ireland | 6.1-10 | Wall and McDonald, 2015 | Arable crops |
Table 9.
Categories of soil P test according to extractant.
| Method | Categories | ||||
| Very low | Low | Medium | High | Very high | |
| -------------------- mg/kg -------------------- | |||||
| Bray-1 1 | <6 | 6-14 | 14-20 | 20-30 | >30 |
| Olsen 2 | <6 | 7-10 | 11-15 | 16-20 | >21 |
| Mehlich-1 3 | <5 | 4-8 | 8-12 | 12-24 | >24 |
| Mehlich-3 2 | <8 | 9-15 | 16-20 | 21-30 | >31 |
| Mehlich-34 | <11 | 11-27 | 28-54 | 54-107 | >107 |
| Resin5 | <6 | 7-15 | 16-40 | 41-80 | >80 |
1 García et al., 2014; 2 Mallarino et al., 2023; 3 Cubilla et al., 2012, 41-60% clay; 4 Zhang et al., 2021; 5 Raij et al., 1996.
Table 10.
Comparing the sufficiency and buildup criteria for P fertilization.
| Sufficiency | Buildup and maintenance |
|---|---|
| Based on “crop response” to P | Based on “soil response” to P |
| For each value below the critical level, different rates determine the optimum economic yield. | Soil P test should be above the critical level/range |
| The effects of fertilization on nutrient levels in the soil are not considered. | If the P level is low, fertilization is not only used to achieve maximum yield, but also to ensure that the initial level is raised. |
| Requires good knowledge of the initial level and precision in the soil analysis, and of the optimal rates for each crop | The optimum P level would be reached in 4 to 6 years, and it should be maintained, generally based on the removal of nutrients by crops. |
| Great impact of calibration errors in soil analysis, recommendations and sampling | Less impact of calibration errors in soil analysis, recommendations and sampling |
| Requires frequent sampling and localized applications in many cases | Does not require frequent sampling, can be done every 2 to 4 years |
| Good option for “fixing” soils, and in fields under short-term lease | Reasonable in soils with little or no P fixation, and in own fields |
| It does not require high initial capital availability | It requires high initial capital availability |
Table 12.
Critical plant P concentration ranges for field crops.
| Crop | Sampling | Critical P concentration |
References |
|---|---|---|---|
| Wheat | Plant at tillering stage | 0.2-0.5 | Jones, 1998; Malavolta et al., 1997; Plank and Donahue, 2000 |
| Top 4 leaves at heading-anthesis | 0.2-0.5 | ||
| Barley | Plant at heading | 0.2-0.5 | Jones, 1998; Malavolta et al., 1997 |
| Rice | Last full developed leaf at tillering-heading | 0.1-0.4 | Jones, 1998; Malavolta et al., 1997; Dobermann and Fairhurst, 2000 |
| Maize | Plant at 5-6 leaves stage | 0.48-0.58 | Stammer and Mallarino, 2018; Mallarino and Sawyer, 2018 |
| Ear leaves at R1 | 0.25-0.32 | ||
| Sorghum | Top third leaves at tillering | 0.4-0.8 | Jones, 1998; Malavolta et al., 1997; Clark, 1993; Cox and Unruh, 2000 |
| Last fully developed leaf at vegetative stages | 0.2-0.4 | ||
| Top second leaf at flowering | 0.2-0.35 | ||
| Soybean | Plant at 5-6 leaves stage | 0.33-0.41 | Stammer and Mallarino, 2018; Mallarino and Sawyer, 2018 |
| Trifoliate leaves at R2-3 | 0.35-0.42 | ||
| Sunflower | Top third leaves at flowering | 0.3-0.7 | Jones, 1998; Malavolta et al., 1997; Merrien et al., 1986 |
Disclaimer/Publisher’s Note: The statements, opinions and data contained in all publications are solely those of the individual author(s) and contributor(s) and not of MDPI and/or the editor(s). MDPI and/or the editor(s) disclaim responsibility for any injury to people or property resulting from any ideas, methods, instructions or products referred to in the content. |
© 2025 by the authors. Licensee MDPI, Basel, Switzerland. This article is an open access article distributed under the terms and conditions of the Creative Commons Attribution (CC BY) license (http://creativecommons.org/licenses/by/4.0/).
Copyright: This open access article is published under a Creative Commons CC BY 4.0 license, which permit the free download, distribution, and reuse, provided that the author and preprint are cited in any reuse.


