
Submitted:
06 March 2025
Posted:
07 March 2025
You are already at the latest version
Abstract
Tillage in agricultural production is one of the most demanding in terms of the tractor's energy requirements, consuming a large amount of fuel and therefore releasing the harmful products of fuel combustion into the atmosphere, where carbon dioxide and nitrogen oxides are released. The experimental test was carried out under real operating conditions on the property, where an analysis was made of all the important parameters that can be correlated with ground resistance and thus the changes in the observed parameters, i.e. the changes in specific fuel consumption and the changes in exhaust emissions. Machine learning techniques were used as highly effective modelling techniques to predict the appropriate tractor operating conditions and soil condition. XGBoost model was selected due to its flexibility and high level of learning. The models were built to predict the CO2 content in the exhaust gases and the specific fuel consumption. Although the statistical parameters were not the highest, the prediction of CO2 content based on the data analysis has an accuracy of over 80%, and the prediction of specific fuel consumption is over 65%, which can be used for a quick or initial analysis, but also represents a challenge for further research on this topic.
Keywords:
tractor exhausts emission
; predictive soil tillage
; VRA soil tillage
; precise agriculture
; machine learning
; XGBoost model
1. Introduction
Global energy consumption, according to the International Energy Agency, is expected to double by 2050 [1]. Unfortunately, fossil fuels still account for about 80% of total energy consumption, not only in certain countries but also in specific economic sectors [2]. Diesel fuel predominates in agricultural production due to its economic efficiency, durability, and lower emissions of unburned hydrocarbons and carbon dioxide compared to some alternatives [3,4,5]. Although biodiesel is increasingly replacing diesel in many countries [6], in the Republic of Serbia the production of biodiesel is not yet competitive [7]. Therefore, analyzing energy inputs—namely fuel consumption, as well as monitoring gas emissions in different tractor operating modes—is extremely important.
Due to diverse operational requirements, tractors must be structurally, energetically, ergonomically, and ecologically adapted to current conditions. As a multifunctional working machine, a tractor’s ability to adapt to operational requirements greatly influences exhaust gas emissions and overall environmental impact [8,9,10,11]. Many studies have examined the adverse effects of exhaust gases on the environment, including contributions to global warming, acid rain, and changes in air composition [12], as well as their potential threats to human health and other living organisms [13,14]. In [15], the authors developed a simplified approach to evaluating the key factors of tractor fuel consumption. These factors are often classified into three groups [16]: (1) the tractor’s technological equipment for exhaust gas after-treatment, (2) operational factors, and (3) the type and composition of the fuel and lubricants. The first group involves the tractor’s technical and technological solutions for emission control, the second encompasses operational setups (e.g., tractor–implement matching, speed, load), and the third includes characteristics of the fuel itself (type, chemical composition, etc.).
This paper focuses on the second group—operational factors—affecting exhaust gas composition during primary soil tillage with a plow. Because the tractor operates under variable load conditions during plowing, exhaust emissions can fluctuate accordingly. An inadequately tuned working mode of the tractor for given field conditions can significantly increase emissions [17,18]. Optimizing the tractor’s operating mode is thus highly relevant from an economic standpoint, as it can reduce exhaust gas emissions without large financial investments—often requiring only minor adjustments or software solutions.
Various authors have analyzed tractor fuel consumption and the environmental impact of exhaust gases under different operating regimes [19]. According to [20], the differences in observed parameters can range from just a few percent to several times more, depending on the conditions. Setting the engine load is crucial in determining exhaust emission levels. For instance, operating the engine at around 1000 rpm and low torque (~30% Mmax) is neither economically nor ecologically favorable. At higher torque (>50% Mmax) and medium (1000–2000 rpm) to high (>2000 rpm) engine speeds, the tractor tends to be more efficient and more acceptable environmentally [21,22].
In [23], it was found that the tractor’s draught force during tillage varies with clay content, soil bulk density, organic matter, and cohesive forces between soil aggregates. Repeated application of increased organic fertilizer rates reduced diesel consumption by 25%, whereas standard fertilization saved 14% of diesel compared to unfertilized plots. Soil moisture is another key factor influencing specific draught and thus fuel consumption [24].
In addition to standard numerical methods for modeling exhaust emissions, artificial intelligence (AI) is increasingly being used. Neural networks (ANN) often provide exceptionally accurate predictions [25,26,27,28,29]. While common models include ANN, Decision Trees (DT), Random Forest (RF), Support Vector Machines (SVM), and others [30,31], this research employs the XGBoost model to predict specific fuel consumption and CO₂ emissions, leveraging its flexibility for handling experimental data.
Hence, the main objective of this study is to analyze how different operational (working) modes of the tractor during primary tillage affect exhaust gas composition and fuel consumption. By investigating these operational factors, we aim to propose adjustments that could reduce exhaust emissions and optimize fuel efficiency in a cost-effective manner.
2. Materials and Methods
Experimental tests were carried out in December 2019 and November 2020 on a 243 ha sample area in Vojvodina, in the municipality of Stara Pazova, at the coordinates 44°59’38.0” N, 20°06’10.3” E. The area lies at an altitude of 81–86 m above sea level, which is relevant because terrain height minimally influences the plow’s traction resistance. The tractor’s movement path on the plot is shown in Figure 1, extending approximately 2,000 m in the direction E 75°–W 256°. The plot is divided into 80 cultivation zones, of which 33 were effectively used during the 2019 and 2020 trials. The soil type is carbonate chernozem.
Soil compaction was measured with a penetrometer at 50 points. In 2019, the measured resistance ranged from 100 to 200 N/cm², and in 2020 from 90 to 220 N/cm². In each production year, soil moisture was monitored in specific cultivation zones along the tractor’s path, to exclude moisture-driven changes in tillage resistance. Sampling was carried out at three points during a tractor pass. Soil moisture in 2019 ranged between 24.10% and 27.63%, while in 2020 it was between 24.20% and 27.20%.
The average volumetric mass of the sampled soil in 2019 was 1.42 g/cm³, and 1.40 g/cm³ in 2020. During tillage, the tractor moved along the direction E 75°–W 256°, maintaining one operating mode per pass end-to-end, then switching to one of six different working modes at each subsequent pass (with a 2.4 m plow working width). The movement was confined to similar soil zones to neutralize the influence of secondary factors such as soil moisture and compaction. Thus, soil characteristics could exert their effect on the variation of observed parameters.
Wheel slippage in 2019 ranged from 9–16%, while in 2020 it was 8–14%. The test tractor was a 2017 Fendt 936 (AGCO, Marktoberdorf, Germany) equipped with a Deutz Fahr TTCD 6-cylinder diesel engine (7,750 cm³), rated at 263 kW (358 hp) at 2,200 rpm (ECE R24). The tractor used diesel fuel specified by DIN EN 590. The engine compression ratio is 1:18 ± 0.3, and fuel injection is via a Deutz common rail system with a Bosch EDC 17 hardware control unit. The engine meets the Tier IV standard with a 2-stage turbocharger, cooled air intercooler, EGR valve with cooled exhaust gases, a DPF filter, and SCR technology with AdBlue (DIN 77070). The DPF filter was regenerated after 80 working hours in 2019, and after 130 working hours in 2020. Table 1 summarizes the key experimental setup data.
During operation, the Tractor Management System (TMS) set the transmission ratio with load limit control in combination with Vario technology, enabling direct engine–transmission communication. The TMS processor optimizes each operating mode for efficiency.
Besides the factory tractor mass of 10,830 kg, additional ballast of 3,000 kg was installed (1,800 kg front ballast and 1,200 kg rear wheel ballast). The soil was tilled with a 6-furrow reversible Kuhn Multi-Master 183 plow (mounted, 240 cm working width, support wheel limiting depth to 25 cm). The tractor moved on unplowed ground (“on land”), using high-precision navigation (±2.5 cm), ensuring a consistent 2.4 m working width.
2.1. Remote Method for Determining Management Zones Based on NDVI
Remote sensing (NDVI) was used as a starting point to create management zones with varying conditions across the 243 ha plot. Remote sampling offers a relatively simple way to gather large amounts of multidimensional data [32,33,34]. Factors affecting the NDVI index include drought, plant health, insects, soil compaction, nutrient availability, the quality of performed operations, soil texture variations, and other issues.
To minimize one-year-only variability (e.g., weather anomalies) and capture long-term factors such as soil composition, a multi-year (seven-year) Landsat image analysis was performed. This resulted in 80 management zones of irregular shape, ranging from 0.92–5.9 ha [35].
2.2. Soil Sampling with an Automatic Soil Sampler
After determining the management zones, soil sampling was performed within each of the 80 zones. From each management zone, using an automatic soil sampler mounted on a car and with the aid of GPS navigation, sampling was performed from 5 samples for a management zone of 0.92 ha, up to 30 samples for a management zone of 5.9 ha. Then, all the samples from one management zone are combined to form one representative sample, which is then analyzed in the laboratory. A total of about 1,200 samples were taken. The sampling depth is the depth at which the plowing operation is performed, i.e., a depth of 25 cm.
2.3. Soil Testing Methods in the Laboratory
The textural class of the soil was determined by the Arany method [36], which is based on determining the amount of water (in cm3) that needs to be added with continuous mixing to air-dried soil to reach the upper limit of plasticity. To differentiate the results according to different soil compositions, the classification of the clay content in the soil was carried out as follows: 42-48 Arany number values indicate a low clay level, 49-51 Arany number values indicate a medium clay level, and 52-60 Arany number values indicate a high clay level.
The content of organic carbon, i.e., humus, in the soil was determined by the dichromate method. For the classification of soil according to humus content, as in the case of clay, a division was made into low clay level 2-3.06%, medium clay level 3.07-3.2%, and high clay level 3.21-4.00%.
The instantaneous soil moisture content was determined by the gravimetric method, drying soil samples in an oven at 105°C to a constant mass.
2.4. Method for Collecting Data from Tractors in Real-Time
For collecting data in real-time from the Fendt 936 tractor, a compatible data logger "FMB 120" manufactured by Teltonika (Teltonika, Vilnius, Lithuania) was used. The device used GNSS connection in communication with the operations centre: GPS, GLONASS, GALILEO, BEIDOU, SBAS, QZSS, DGPS, AGPS and GSM mobile technology.
The working parameters of the tractor obtained via the FMB 120 data logger were: current location of the tractor on the experimental plot with an accuracy of < 3 m, passed distance (m), fuel consumption (L-1), engine load (%), and engine temperature (° C). Signals arrived at the operations canter every 60 s. By placing POI polygons with management zones in the operations canter, the exact position of the tractor within each zone was determined. Several authors have addressed the topic of real-time data collection from tractors via the CAN bus. For example, in work [37], a specific data logger is used to collect data for the analysis of fuel consumption, engine load, engine speed, tractor performance, etc.
2.5. Method for Measuring Exhaust Gases
The composition of exhaust gases was measured with a portable gas analyser Testo 350 (TestoGMBH, Lenzkirch, Germany), which meets the requirements of EN50270:2000-01 and the ISO 9001 standard. The analyser was configured to monitor the concentration of molecular oxygen O2, nitric oxide NO, nitrogen oxides NOx, nitrogen dioxide NO2, sulphur dioxide SO2, carbon dioxide CO2, carbon monoxide CO. The time on the gas analyser was synchronized with the time on the data logger installed in the tractor. This synchronization enabled mutual correlation of real-time data from the mentioned devices and allowed for comparison of different operating conditions, performance indicators, and exhaust gases.
2.6. Machine Learning Model
The application of Machine Learning (ML) models has proven to be an extremely effective statistical tool in regression and classification problems. ML models are based on connecting input data, which may not have a clear correlation in advance, which in the ML model, through learning and training methods, provide output data. Extreme Gradient Boosting (XGBoost) belongs to ensemble learning techniques, iterating through an ensemble of weak learners, mainly with decision trees, to ultimately generate a strong prediction model. The advantages of the XGBoost model are high flexibility, strong predictability, high scalability, and high efficiency in model learning. These models have proven extremely successful in processing various types of data, in both their models - regression and classification, because they use regularization to minimize the loss function. XGBoost models successively correct prediction errors, with approximation through decision trees. Also, the advantage of the XGBoost model compared to others is the generation of high model accuracy for less model training time compared to other methods. The success of these networks lies in the fact that they can be adapted to a wide range of applications. The current application of these models can be direct, integrated with other algorithms, and optimized for parameters [38,39,40,41,42,43,44,45]. Figure 2 shows the proposed XGBoost model for the analysis of experimentally collected data [46].
The model selection and the final comparison of model efficiency based on standard statistical variables, the coefficient of determination, the mean absolute error and the mean square error [47]:
3. Results and Discussion
The aim of this study was to determine the dependence between the tractor working regime, soil type (clay and humus content), specific fuel consumption, and the CO2 content in exhaust gases. As the input data were categorical, each model required transformation of these categories into numeric values. Based on all input data, farm types were arranged into six categories, while soil composition (humus and clay content) was grouped into three. Table 3 shows the input data converted into numerical values.
The correlation matrix (Figure 3) was created to determine the dependencies between various input and output parameters. Positive values of the correlation coefficient indicate a positive correlation, negative values indicate a negative correlation. The strength of the correlation is indicated by the absolute value of the correlation coefficient. From the data shown, it can be seen that none of the input data has a strong correlation with the output data, and this is the reason for choosing the XGBoost regression model. The percentage composition of CO2 in the exhaust gases shows a negative correlation with all input parameters, and it is interesting to note that the percentage of humus shows a negative correlation in relation to the specific fuel consumption and the amount of CO2.
In order to optimise the XGBoost model for different output data for which the model needs to be trained, the hyperparameters of the model, booster and learning rate, were varied to avoid overfitting the model. The training score, i.e. the quality of the corresponding model, is determined according to the standard statistical equations from (1) to (3). and the modelling results for the case of determining the percentage CO2 content in the combustion products are shown in Table 4.
Table 4. clearly shows that the last model has the best values of the statistical coefficients, R2 has the highest value and MSE and RMSE have the lowest value. For the selected values, the distribution diagram of the measured and calculated values is shown in Figure 4. Although the model with the selected gbtree booster and a learning rate of 0.02 shows a 22% lower R2 value, an 11% higher MSE value and a 0.05% higher RMSE value, it can be seen in Figure 5, which shows the distribution of the measured and calculated values, that this model is also acceptable.
If you compare the calculated and measured values for Mode 1 and Mode 2, for example, with the variation of other parameters in Figure 6, you can see that there are certain differences between the predicted and measured values. The values obtained by the prediction, so that the difference with the measured values is greater than 30%, have less than 15%. From this it can be concluded that the model can be applied for the prediction of CO2 emissions depending on the input parameters.
The modelling values for the optimisation of specific fuel consumption are listed in Table 5. In contrast to the previous set of data, the statistical data show much lower values when predicting the specific fuel consumption per hectare travelled. The best model was obtained with the selection booster "dart" and learning rate = 0.05. The distribution of the measured and predicted values is shown in Figure 7, where the deviations between the data can be clearly seen.
Although such data would be rejected due to the value of the statistical parameters, the confusion matrix can be used to show that this model is not bad either and can be taken as a predictive fit. 65% of those affected are correct, regardless of whether they are positive or negative. Based on this value, it can be concluded that the model for predicting specific fuel consumption is not precise and absolutely reliable, but that it can be used as a model for preliminary analyses and rough predictions of specific consumption.
4. Conclusions
This study investigated the viability of the ML model in predicting specific fuel consumption during tractor operation and the CO2 content of combustion gasses. As such, all ML techniques have proven to be highly effective and have been applied in almost all fields of science and technology over the last decades. Agriculture is an exceptional field thanks to the application of various ML models in all areas of production.
The choice of the appropriate model depends on the type of data available. The problem that arises in this paper is the avoidance of clustering methods, which would be very easily applicable to experimental data, but such a method would not provide an answer to the question posed, how to establish a mathematical dependency between different tractor operating modes, soil quality and fuel consumption and exhaust gas emissions. Such dependencies are of great importance when it comes to assessing the environmental impact of certain processes in agricultural production. Most of these problems are solved either by multivariable linear regressions or by some of the standard artificial neural network models, which have excellent predictive accuracy. Based on the initial analyses, which are not presented here to avoid overload, it has been shown that the previously mentioned models do not provide good accuracy, moreover, the prediction accuracy of the model is extremely low. For this reason, the RGBoost network with exceptional precision was chosen, which can process data with the profile described in this article.
The simulation results show that the prediction of the CO2 content is very good. There are slight differences depending on the choice of booster in the network, but the prediction accuracy is over 80%.
Such models are of particular interest in Republic of Serbia and countries that do not yet use biodiesel, not only for agricultural purposes but in general. These models can be used to estimate air pollution during tractor operation, which is not insignificant and could be completely avoided by switching to biodiesel or some other more environmentally friendly one’s energy such as electricity
The model created to predict specific fuel consumption, on the other hand, was much less accurate, as can be seen from the statistical parameters. The confusion matrix analysis suggests that the prediction accuracy is around 65%, which can be used for quick and preliminary analyses.
Although the results of the analysis are promising, they clearly indicate that there is potential for further consideration and modelling of ML models in this area, which would be developed from and improve the models interrupted in the thesis, but perhaps also the development of other models or the improvement of certain segments of the ML model to raise the prediction to a higher level. All problems that directly or indirectly affect environmental protection are of great importance, especially in agricultural production, so it can be concluded that these models will be increasingly used in precision agriculture.
Author Contributions
N.B. – experiment setup, data collection, and data processing., O.E.-Đ.: methodology, software, validation, formal analysis, visualization,investigation, data curation, resources, writing—original draft, and writing—review and editing.M.M.: software, formal analysis, validation, data curation, investigation, and writing—review andediting. A.R.: data curation and writing—original draft. Z.M.: formal analysis and writing—review and editing. A.D.: formal analysis and writing—review and editing. R.M.: data curation,formal analysis, and writing—review and editing. All authors have read and agreed to thepublished version of the manuscript.
Funding
This research was funded by “Contract for the Transfer of Funds for the Financing of Scientific Research Work of Teaching Staff at Accredited Higher Education Institutions in 2025, contract registration number: 451-03-65/2024-03/200116”.
Data Availability Statement
Dataset available on request from the authors.
Conflicts of Interest
The authors declare that the research was conducted in the absence of any commercial or financial relationships that could be construed as a potential conflict of interest.
References
- Conti J, Holtberg P, Diefenderfer J, LaRose A, Turnure JT, Westfall L. International energy outlook 2016 with projections to 2040. Washington, DC (United States …:USDOE Energy Information Administration (EIA); 2016.
- Song, S.; Li, T.; Liu, P.; Li, Z. The transition pathway of energy supply systems towards carbon neutrality based on a multi-regional energy infrastructure planning approach: A case study of China. Energy 2022, 238. [Google Scholar] [CrossRef]
- Bezergianni, S.; Dimitriadis, A. Comparison between different types of renewable diesel. Renew. Sustain. Energy Rev. 2013, 21, 110–116. [Google Scholar] [CrossRef]
- Alagumalai, A. Internal combustion engines: Progress and prospects. Renew. Sustain. Energy Rev. 2014, 38, 561–571. [Google Scholar] [CrossRef]
- Naik, S.N.N.; Goud, V.V.; Rout, P.K.; Dalai, A.K. Production of first and second generation biofuels: A comprehensive review. Renew. Sustain. Energy Rev. 2010, 14, 578–597. [Google Scholar] [CrossRef]
- Rokicki, T.; Perkowska, A.; Klepacki, B.; Bórawski, P.; Bełdycka-Bórawska, A.; Michalski, K. Changes in Energy Consumption in Agriculture in the EU Countries. Energies 2021, 14, 1570. [Google Scholar] [CrossRef]
- Latinović, L. Production and mandatory use of biodiesel in Serbia from the aspect of economic impact on the population. Serbian J. Eng. Manag. 2019, 4, 29–38. [Google Scholar] [CrossRef]
- Felten, D.; Fröba, N.; Fries, J.; Emmerling, C. Energy balances and greenhouse gas-mitigation potentials of bioenergy cropping systems (Miscanthus, rapeseed, and maize) based on farming conditions in Western Germany. Renew. Energy 2013, 55, 160–174. [Google Scholar] [CrossRef]
- Shamshirband, S.; Khoshnevisan, B.; Yousefi, M.; Bolandnazar, E.; Anuar, N.B.; Wahab, A.W.A.; Khan, S.U.R. A multi-objective evolutionary algorithm for energy management of agricultural systems—A case study in Iran. Renew. Sustain. Energy Rev. 2015, 44, 457–465. [Google Scholar] [CrossRef]
- Paciolla, F.; Łyp-Wrońska, K.; Quartarella, T.; Pascuzzi, S. Simulation Analysis of Energy Inputs Required by Agricultural Machines to Perform Field Operations. Agriengineering 2024, 7, 7. [Google Scholar] [CrossRef]
- Dettù, F.; Formentin, S.; Savaresi, S.M. Driving Style Assessment System for Agricultural Tractors: Design and Experimental Validation. Agronomy 2022, 12, 590. [Google Scholar] [CrossRef]
- Milosavljevic, M.; Marinkovic, A.; Petrovic, S.; Sovrlic, M. A new ecologically friendly process for the synthesis of selective flotation reagents. Chem. Ind. Chem. Eng. Q. 2009, 15, 257–262. [Google Scholar] [CrossRef]
- Sedyaaw, P.; Kawade, S.; Bhaladhare, D.R.; Pranali, K.; Pandey, A. Causes, Effects and Management Measures of Acid Rain: A Review. Bhartiya Krishi Anusandhan Patrika 2024, 39, 215–222. [Google Scholar] [CrossRef]
- Mamta, B. Acid Rain-A Specific type of Pollution: Its concept, causes, effects and tentative solutions. Chemical Science Review and Letters 2016, 5, 21–26. [Google Scholar]
- Cutini, M.; Brambilla, M.; Pochi, D.; Fanigliulo, R.; Bisaglia, C. A Simplified Approach to the Evaluation of the Influences of Key Factors on Agricultural Tractor Fuel Consumption during Heavy Drawbar Tasks under Field Conditions. Agronomy 2022, 12, 1017. [Google Scholar] [CrossRef]
- Renius, K.T. Fundamentals of Tractor Design; Springer Nature: Dordrecht, GX, Netherlands, 2020. [Google Scholar]
- Bortolheiro, F.P.d.A.P.; Blanco Bertolo, D.M.; Lopes, A.G.C.; Santana, L.S. Controlled Traffic Farm: Fuel Demand and Carbon Emissions in Soybean Sowing. AgriEngineering 2024, 6, 1794–1806. [Google Scholar] [CrossRef]
- Damanauskas, V.; Janulevicius, A. Validation of Criteria for Predicting Tractor Fuel Consumption and CO2 Emissions When Ploughing Fields of Different Shapes and Dimensions. AgriEngineering 2023, 5, 2408–2422. [Google Scholar] [CrossRef]
- Al-Sager, S.M.; Almady, S.S.; Marey, S.A.; Al-Hamed, S.A.; Aboukarima, A.M. Prediction of Specific Fuel Consumption of a Tractor during the Tillage Process Using an Artificial Neural Network Method. Agronomy 2024, 14, 492. [Google Scholar] [CrossRef]
- Janulevièius, A., Juostas A., Pupinis G..Estimation of tractor wheel slippage with different tire pressures for 4wd and 2wd driving systems, 2019, 18th International Scientific Conference Engineering for Rural Development, 88-93, 10.22616/ERDev2019.18.
- Juostas, A.; Janulevičius, A. TRACTOR’S ENGINE EFFICIENCY AND EXHAUST EMISSIONS’ RESEARCH IN DRILLING WORK. J. Environ. Eng. Landsc. Manag. 2014, 22, 141–150. [Google Scholar] [CrossRef]
- Juostas, A.; Janulevičius, A. TRACTOR’S ENGINE EFFICIENCY AND EXHAUST EMISSIONS’ RESEARCH IN DRILLING WORK. J. Environ. Eng. Landsc. Manag. 2014, 22, 141–150. [Google Scholar] [CrossRef]
- Peltre, C.; Nyord, T.; Bruun, S.; Jensen, L.S.; Magid, J. Repeated soil application of organic waste amendments reduces draught force and fuel consumption for soil tillage. Agric. Ecosyst. Environ. 2015, 211, 94–101. [Google Scholar] [CrossRef]
- Arvidsson, J.; Hillerström, O. Specific draught, soil fragmentation and straw incorporation for different tine and share types. Soil Tillage Res. 2010, 110, 154–160. [Google Scholar] [CrossRef]
- Manimaran, R.; Mohanraj, T.; Venkatesan, M.; Ganesan, R.; Balasubramanian, D. A computational technique for prediction and optimization of VCR engine performance and emission parameters fuelled with Trichosanthes cucumerina biodiesel using RSM with desirability function approach. Energy 2022, 254, 124293. [Google Scholar] [CrossRef]
- El-Shafay, A.; Gad, M.; Ağbulut, Ü.; Attia, E.-A. Optimization of performance and emission outputs of a CI engine powered with waste fat biodiesel: A detailed RSM, fuzzy multi-objective and MCDM application. Energy 2023, 275, 127356. [Google Scholar] [CrossRef]
- Wang, H.; Ji, C.; Shi, C.; Ge, Y.; Meng, H.; Yang, J.; Chang, K.; Wang, S. Comparison and evaluation of advanced machine learning methods for performance and emissions prediction of a gasoline Wankel rotary engine. Energy 2022, 248, 123611. [Google Scholar] [CrossRef]
- Krzywanski, J.; Skrobek, D.; Sosnowski, M.; Ashraf, W.M.; Grabowska, K.; Zylka, A.; Kulakowska, A.; Nowak, W.; Sztekler, K.; Shahzad, M.W. Towards enhanced heat and mass exchange in adsorption systems: The role of AutoML and fluidized bed innovations. Int. Commun. Heat Mass Transf. 2024, 152, 107262. [Google Scholar] [CrossRef]
- Li, Y.; Jia, M.; Han, X.; Bai, X.-S. Towards a comprehensive optimization of engine efficiency and emissions by coupling artificial neural network (ANN) with genetic algorithm (GA). Energy 2021, 225, 120331. [Google Scholar] [CrossRef]
- S, N.V.; V, S.; Thangavel, V.; P, A.B.; Vijayaragavan, M.; Subramanian, B.; Js, F.J.; Varuvel, E.G. Efficacy of machine learning algorithms in estimating emissions in a dual fuel compression ignition engine operating on hydrogen and diesel. Int. J. Hydrogen Energy 2023, 48, 39599–39611. [Google Scholar] [CrossRef]
- Yıldırım, S.; Tosun, E.; Çalık, A.; Uluocak, İ.; Avşar, E. Artificial intelligence techniques for the vibration, noise, and emission characteristics of a hydrogen-enriched diesel engine. Energy Sources, Part A: Recovery Util. Environ. Eff. 2018, 41, 2194–2206. [Google Scholar] [CrossRef]
- Ali, A.; Rondelli, V.; Martelli, R.; Falsone, G.; Lupia, F.; Barbanti, L. Management Zones Delineation through Clustering Techniques Based on Soils Traits, NDVI Data, and Multiple Year Crop Yields. Agriculture 2022, 12, 231. [Google Scholar] [CrossRef]
- Cammarano, D.; Zha, H.; Wilson, L.; Li, Y.; Batchelor, W.D.; Miao, Y. A Remote Sensing-Based Approach to Management Zone Delineation in Small Scale Farming Systems. Agronomy 2020, 10, 1767. [Google Scholar] [CrossRef]
- Serrano, J.; Shahidian, S.; Paixão, L.; da Silva, J.M.; Moral, F. Management Zones in Pastures Based on Soil Apparent Electrical Conductivity and Altitude: NDVI, Soil and Biomass Sampling Validation. Agronomy 2022, 12, 778. [Google Scholar] [CrossRef]
- Rokhafrouz, M.; Latifi, H.; Abkar, A.A.; Wojciechowski, T.; Czechlowski, M.; Naieni, A.S.; Maghsoudi, Y.; Niedbała, G. Simplified and Hybrid Remote Sensing-Based Delineation of Management Zones for Nitrogen Variable Rate Application in Wheat. Agriculture 2021, 11, 1104. [Google Scholar] [CrossRef]
- Szolnoki, Z.; Farsang, A. Evaluation of Metal Mobility and Bioaccessibility in Soils of Urban Vegetable Gardens Using Sequential Extraction. Water, Air, Soil Pollut. 2013, 224, 1–16. [Google Scholar] [CrossRef]
- Pitla, S.K.; Lin, N.; Shearer, S.A.; Luck, J.D. Use of Controller Area Network (CAN) Data To Determine Field Efficiencies of Agricultural Machinery. Appl. Eng. Agric. 2014, 30, 829–838. [Google Scholar] [CrossRef]
- Li, X.; Ma, L.; Chen, P.; Xu, H.; Xing, Q.; Yan, J.; Lu, S.; Fan, H.; Yang, L.; Cheng, Y. Probabilistic solar irradiance forecasting based on XGBoost. Energy Rep. 2022, 8, 1087–1095. [Google Scholar] [CrossRef]
- Sagi, O.; Rokach, L. Approximating XGBoost with an interpretable decision tree. Inf. Sci. 2021, 572, 522–542. [Google Scholar] [CrossRef]
- T. Chen, C. Guestrin, XGBoost, in: Proc. 22nd ACM SIGKDD Int. Conf. Knowl. Discov. Data Min., ACM, New York, NY, USA, 2016, pp. [CrossRef]
- Dong, J.; Chen, Y.; Yao, B.; Zhang, X.; Zeng, N. A neural network boosting regression model based on XGBoost. Appl. Soft Comput. 2022, 125. [Google Scholar] [CrossRef]
- Batunacun; Wieland, R.; Lakes, T.; Nendel, C. Using Shapley additive explanations to interpret extreme gradient boosting predictions of grassland degradation in Xilingol, China. Geosci. Model Dev. 2021, 14, 1493–1510. [Google Scholar] [CrossRef]
- Romeo, L.; Frontoni, E. A Unified Hierarchical XGBoost model for classifying priorities for COVID-19 vaccination campaign. Pattern Recognit. 2022, 121, 108197. [Google Scholar] [CrossRef]
- Zhang XL, Xiu CD, Wang YZ, et al. High-precision WiFi indoor localization algorithm based on CSI-XGBoost. J Beijing Univ Aeronaut Astronaut 2018; 44(12): 2536–2544.
- Li YZ, Wang ZY, Zhou YL, et al. The improvement and application of XGBoost method based on the Bayesian optimization. J Guangdong Univ Technol 2018; 35(1): 23–28.
- Liu, P.; Fan, W. EXTREME GRADIENT BOOSTING (XGBOOST) MODEL FOR VEHICLE TRAJECTORY PREDICTION IN CONNECTED AND AUTONOMOUS VEHICLE ENVIRONMENT. Promet - Traffic&Transportation 2021, 33, 767–774. [Google Scholar] [CrossRef]
- Wang, H.-C.; Wang, Y.-Q.; Wang, X.; Yin, W.-X.; Yu, T.-C.; Xue, C.-H.; Wang, A.-J. Multimodal Machine Learning Guides Low Carbon Aeration Strategies in Urban Wastewater Treatment. Engineering 2024, 36, 51–62. [Google Scholar] [CrossRef]
Figure 1.
The direction of movement of the tractor on the sample plot in 2019 and 2020 under different working regimes depending on the previously determined soil properties, the clay content indicated in the Arany yarn number and the humus content.
Figure 1.
The direction of movement of the tractor on the sample plot in 2019 and 2020 under different working regimes depending on the previously determined soil properties, the clay content indicated in the Arany yarn number and the humus content.
Figure 2.
Flowchart of XGBoost model.
Figure 3.
Correlation matrix for the machine learning (ML) model.
Figure 4.
Distribution of measured and predicted values for best model with dart booster and learning rate = 0.11.
Figure 4.
Distribution of measured and predicted values for best model with dart booster and learning rate = 0.11.
Figure 5.
Distribution of measured and predicted values for best model with gbtree booster and learning rate = 0.02.
Figure 5.
Distribution of measured and predicted values for best model with gbtree booster and learning rate = 0.02.
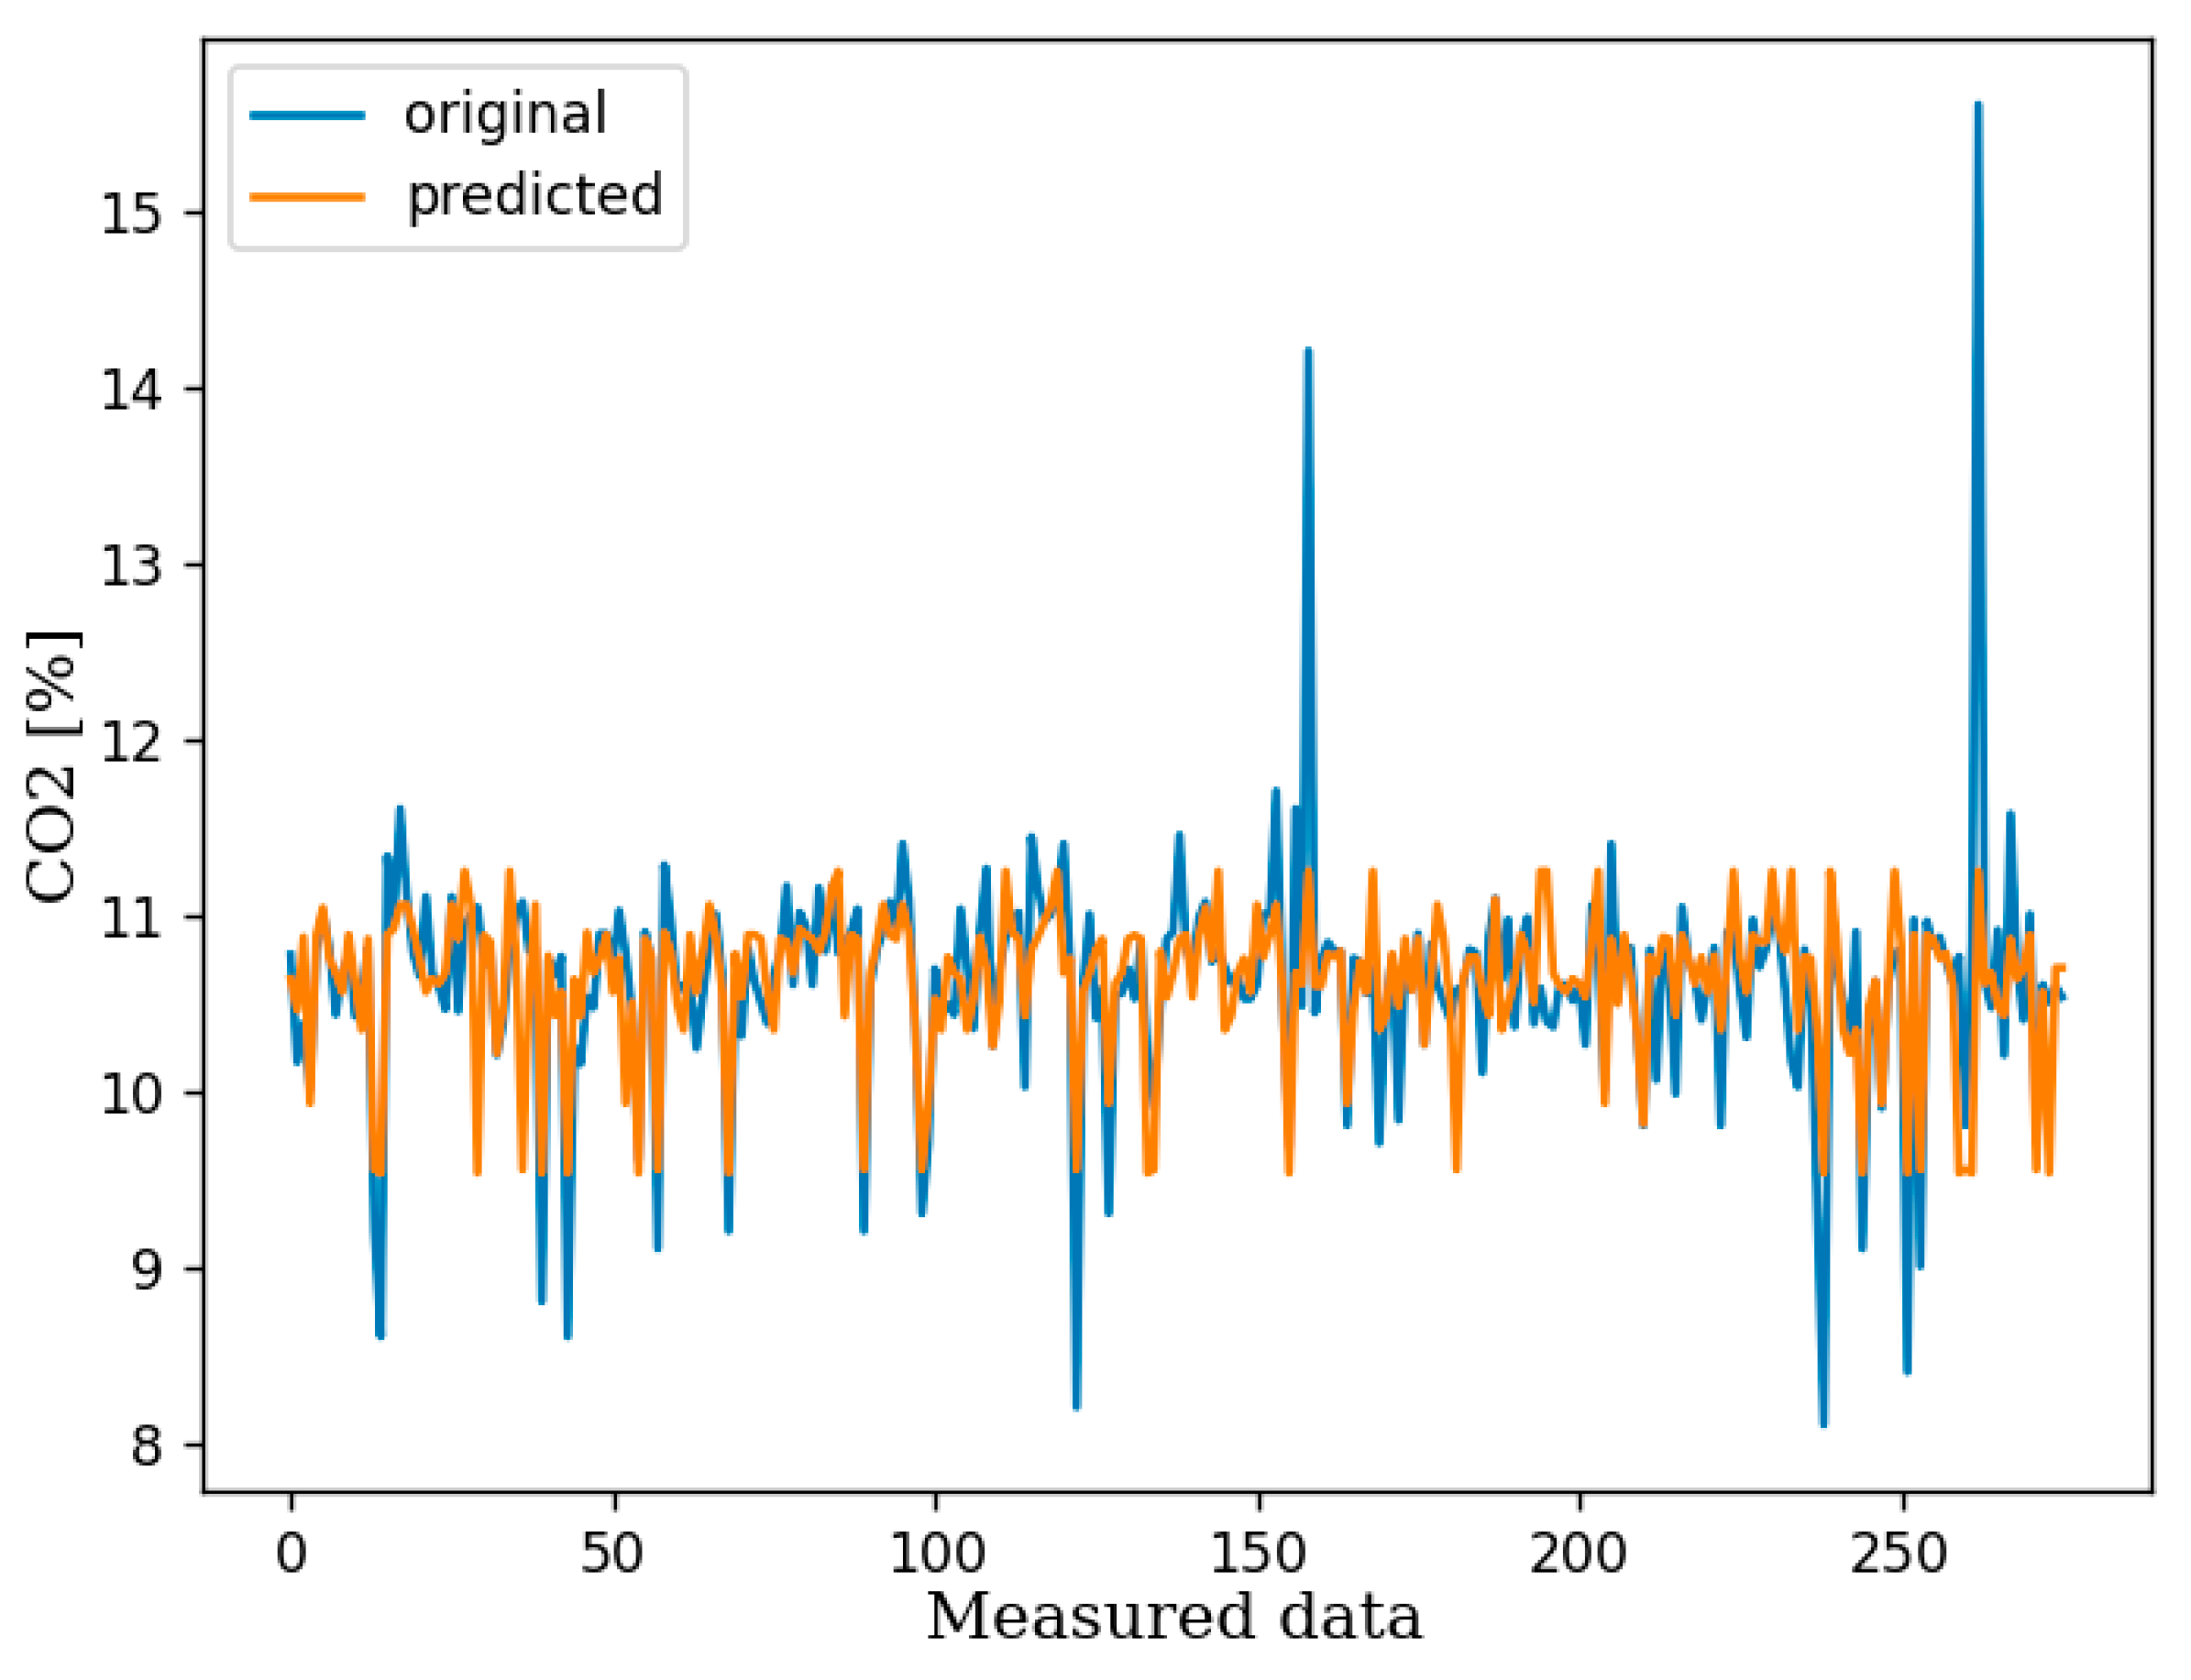
Figure 6.
Differences between the predicted and measured values. (a) Working regime 1, (b) Working regime 2.
Figure 6.
Differences between the predicted and measured values. (a) Working regime 1, (b) Working regime 2.
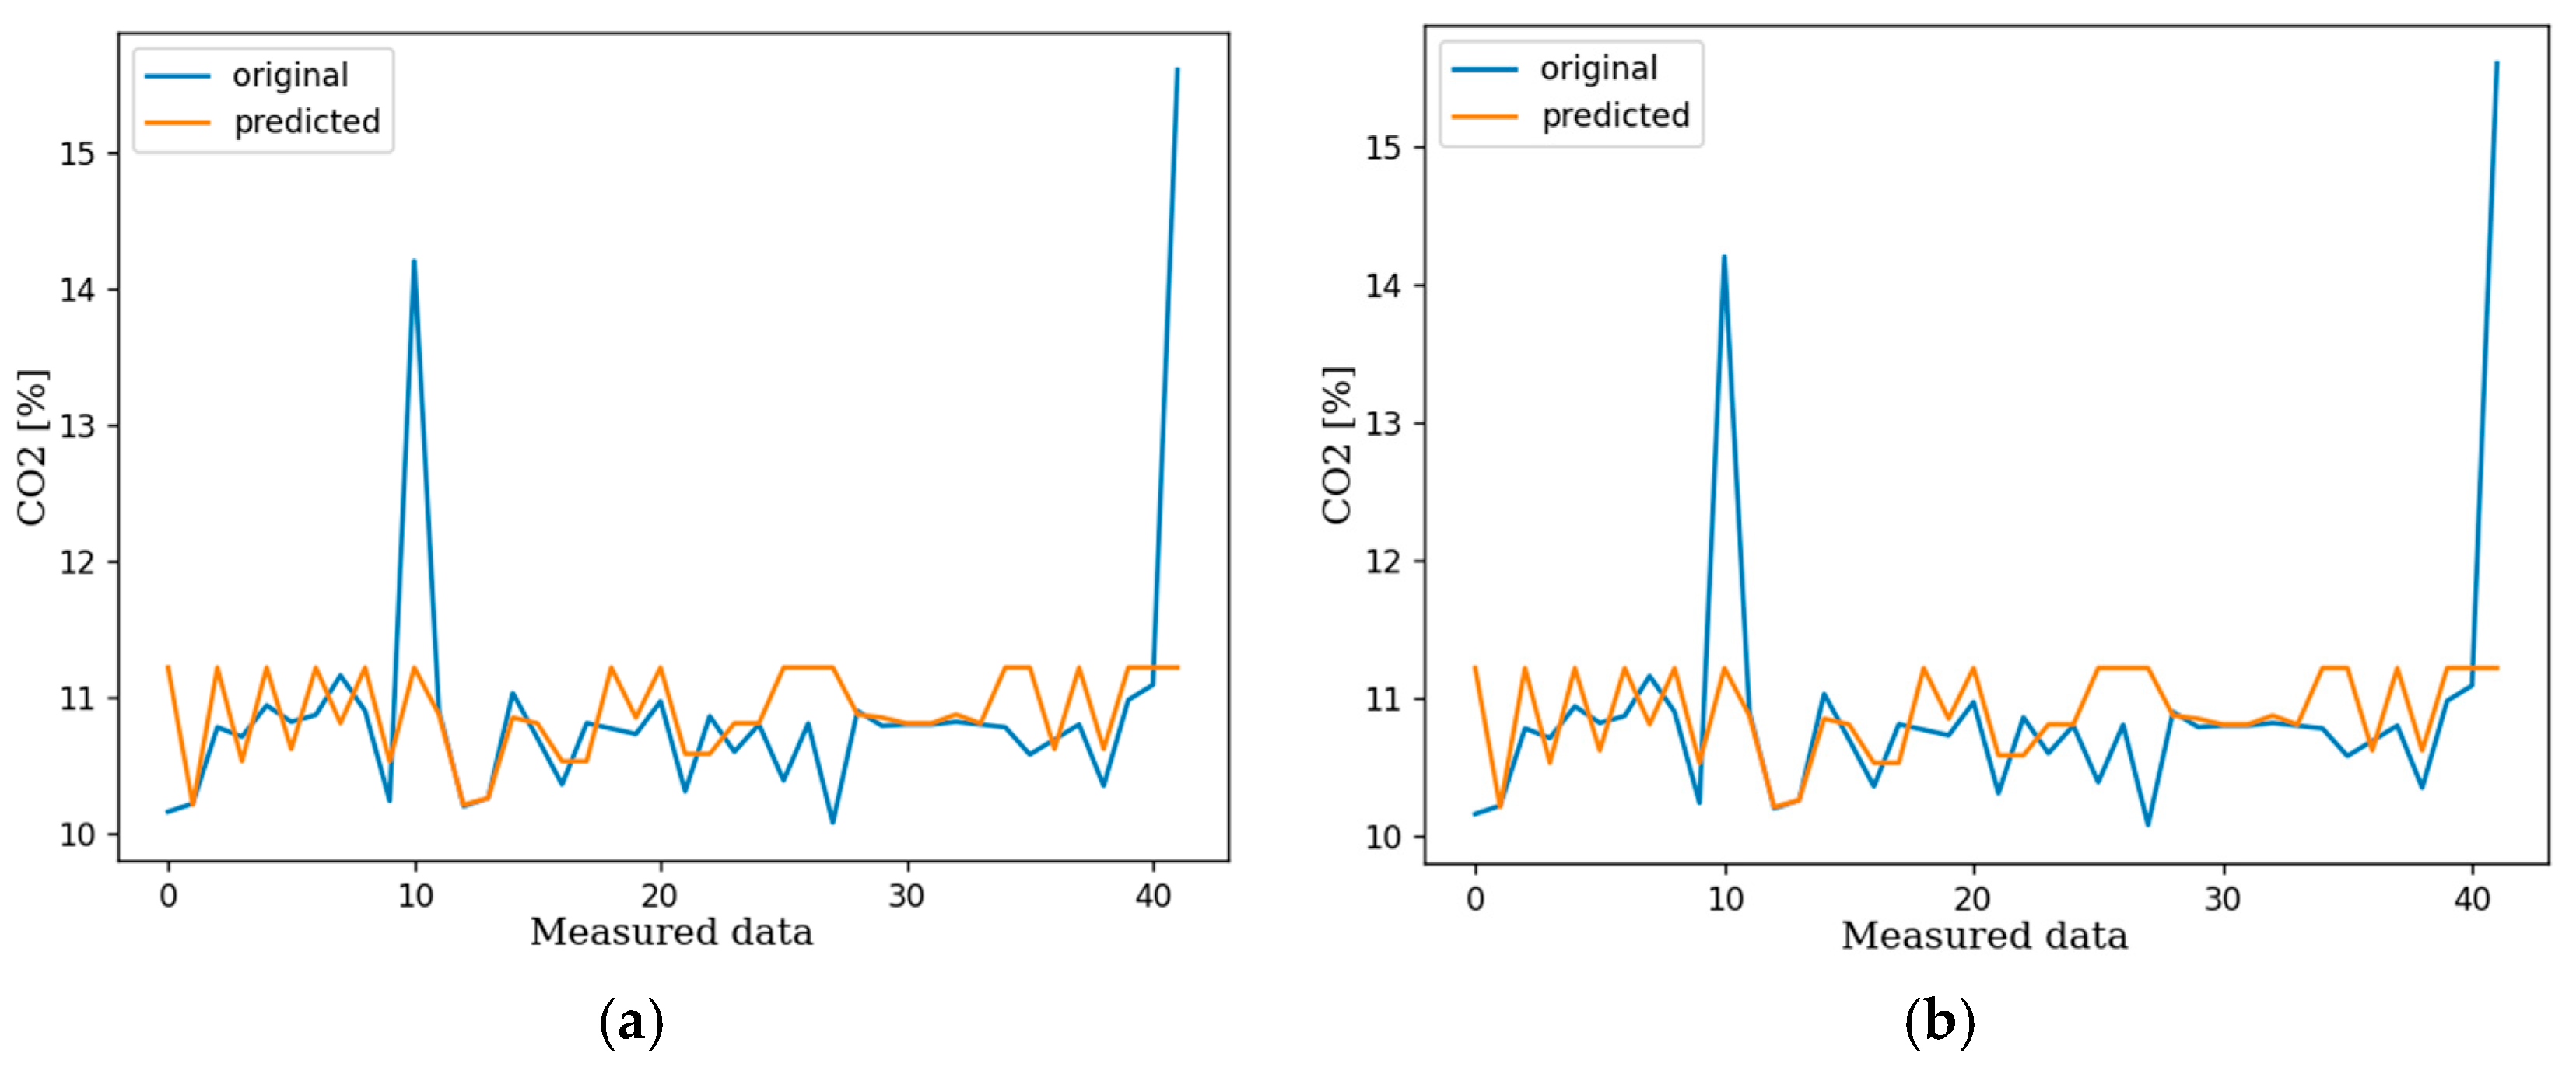
Figure 6.
Distribution of measured and predicted values for best model with dart booster and learning rate = 0.05.
Figure 6.
Distribution of measured and predicted values for best model with dart booster and learning rate = 0.05.
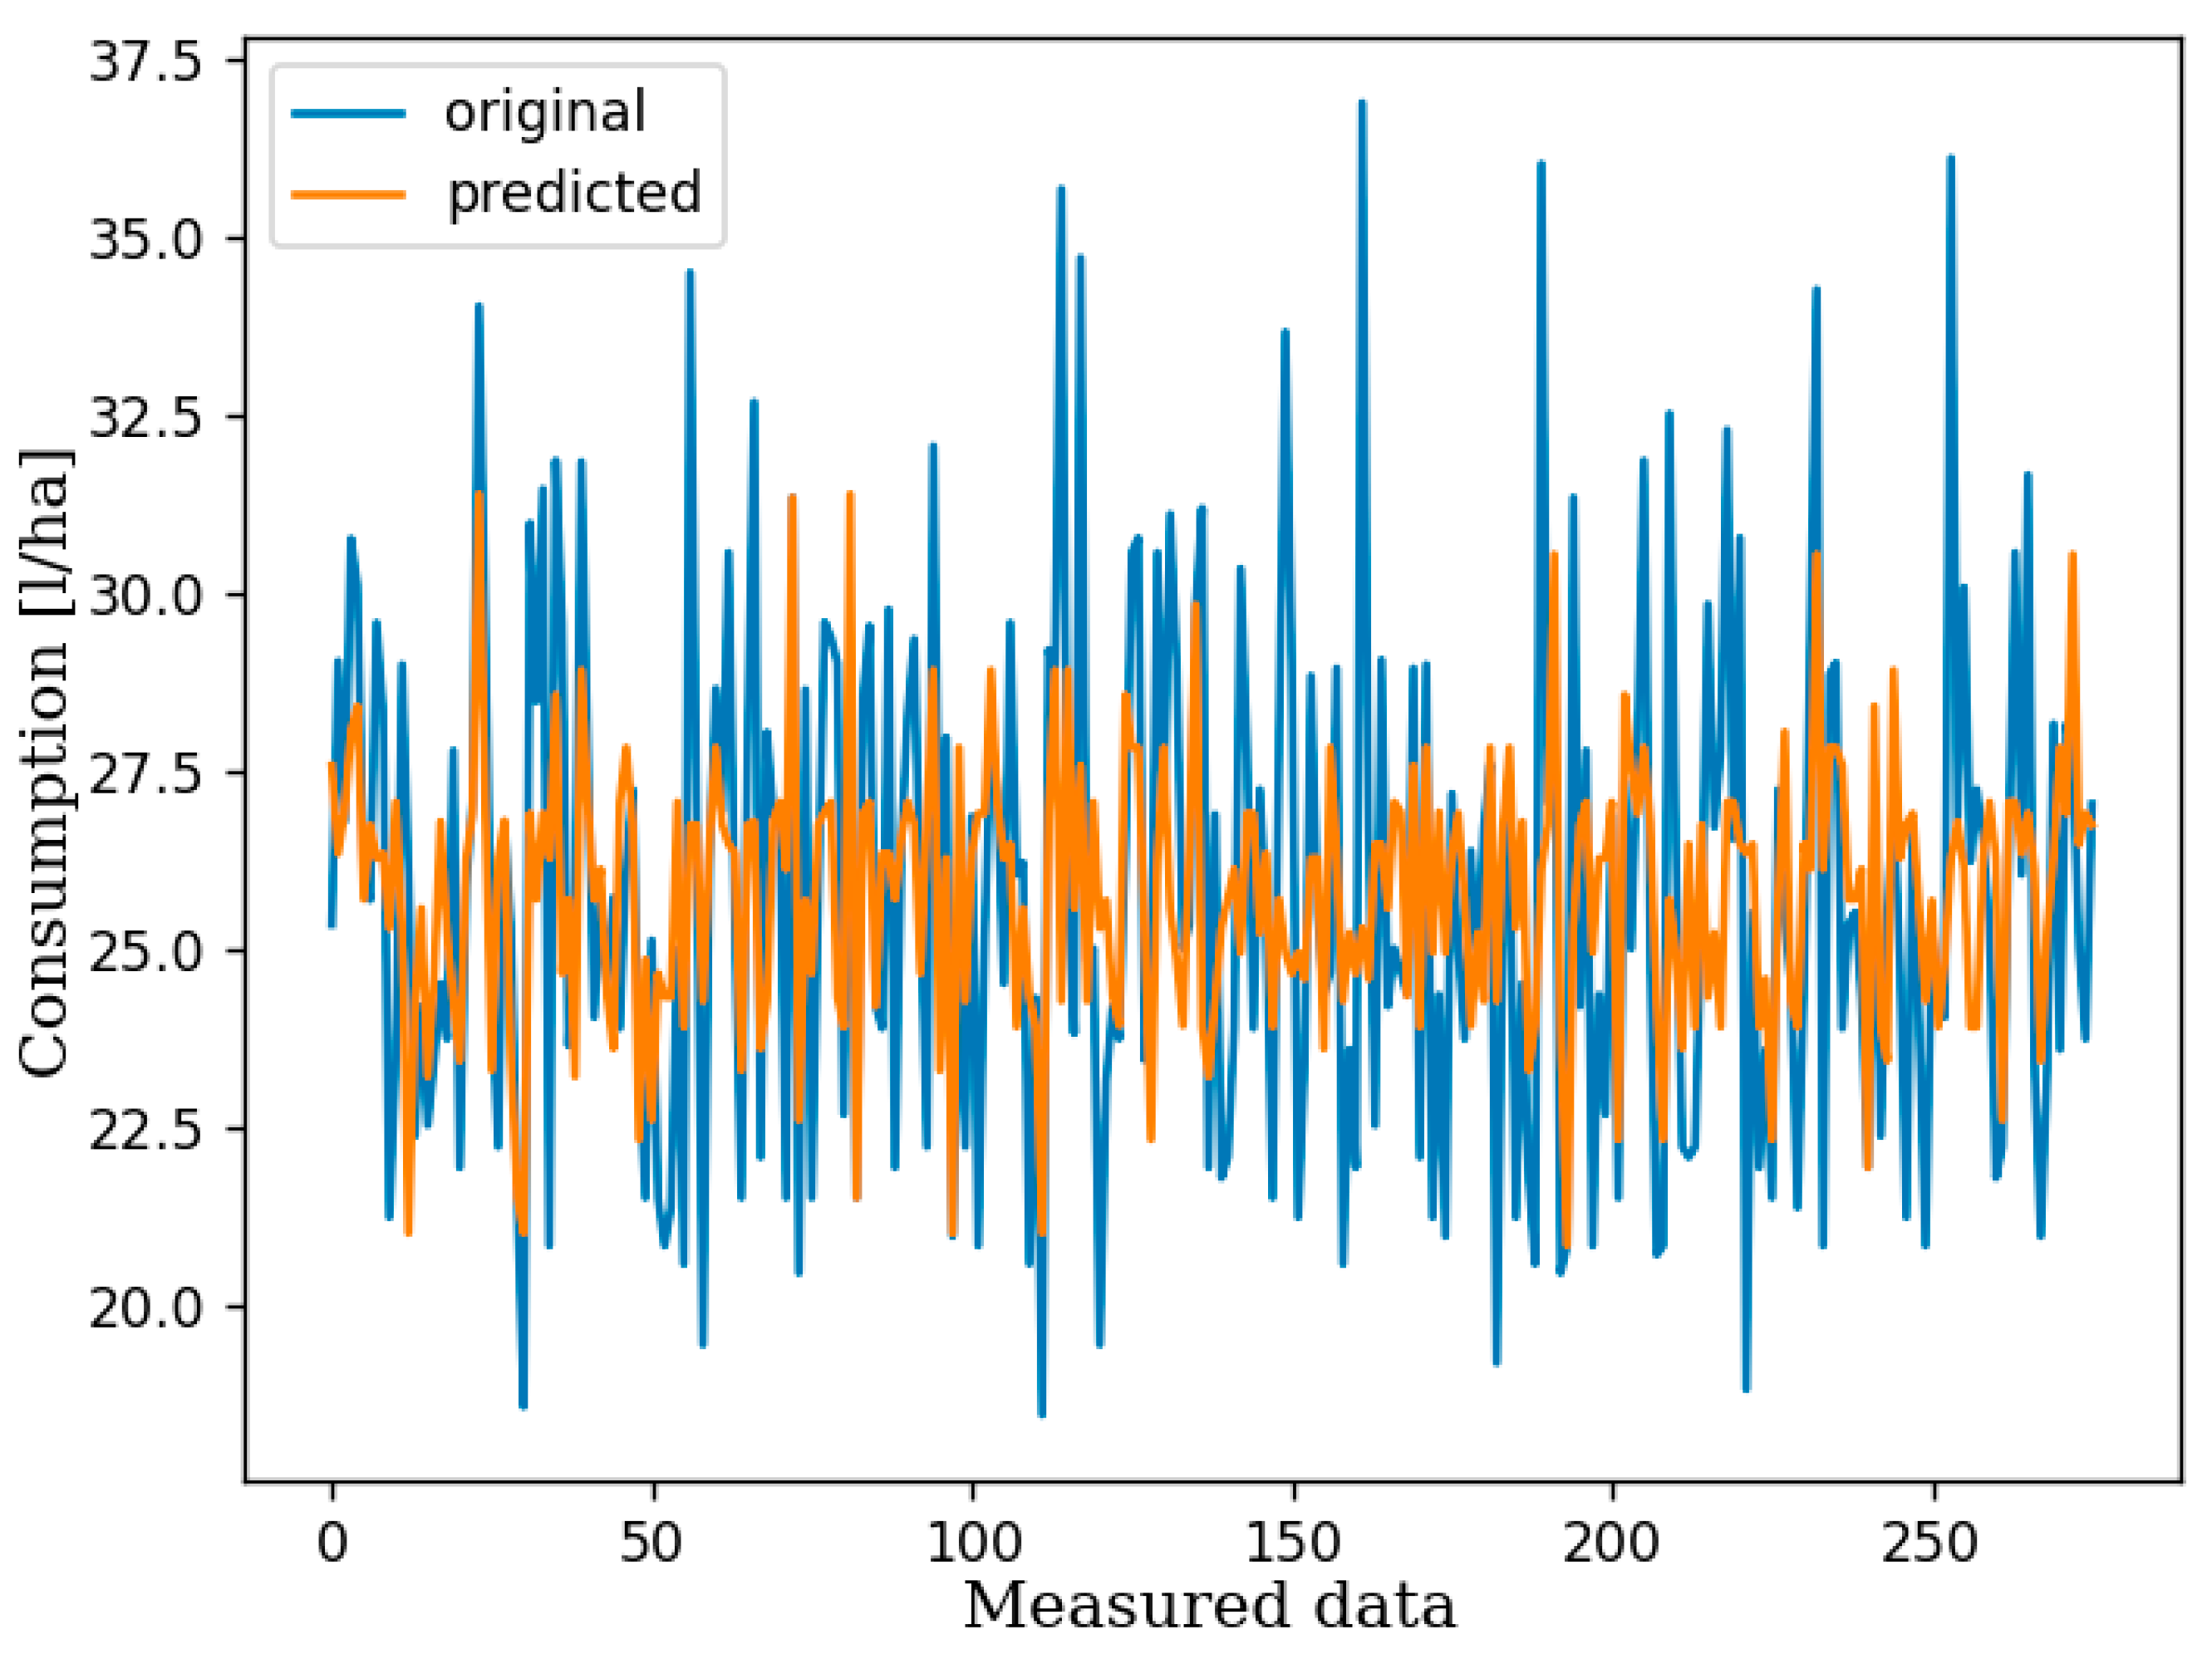
Figure 7.
XGBoost model confusion matrix for specific fuel consumption.
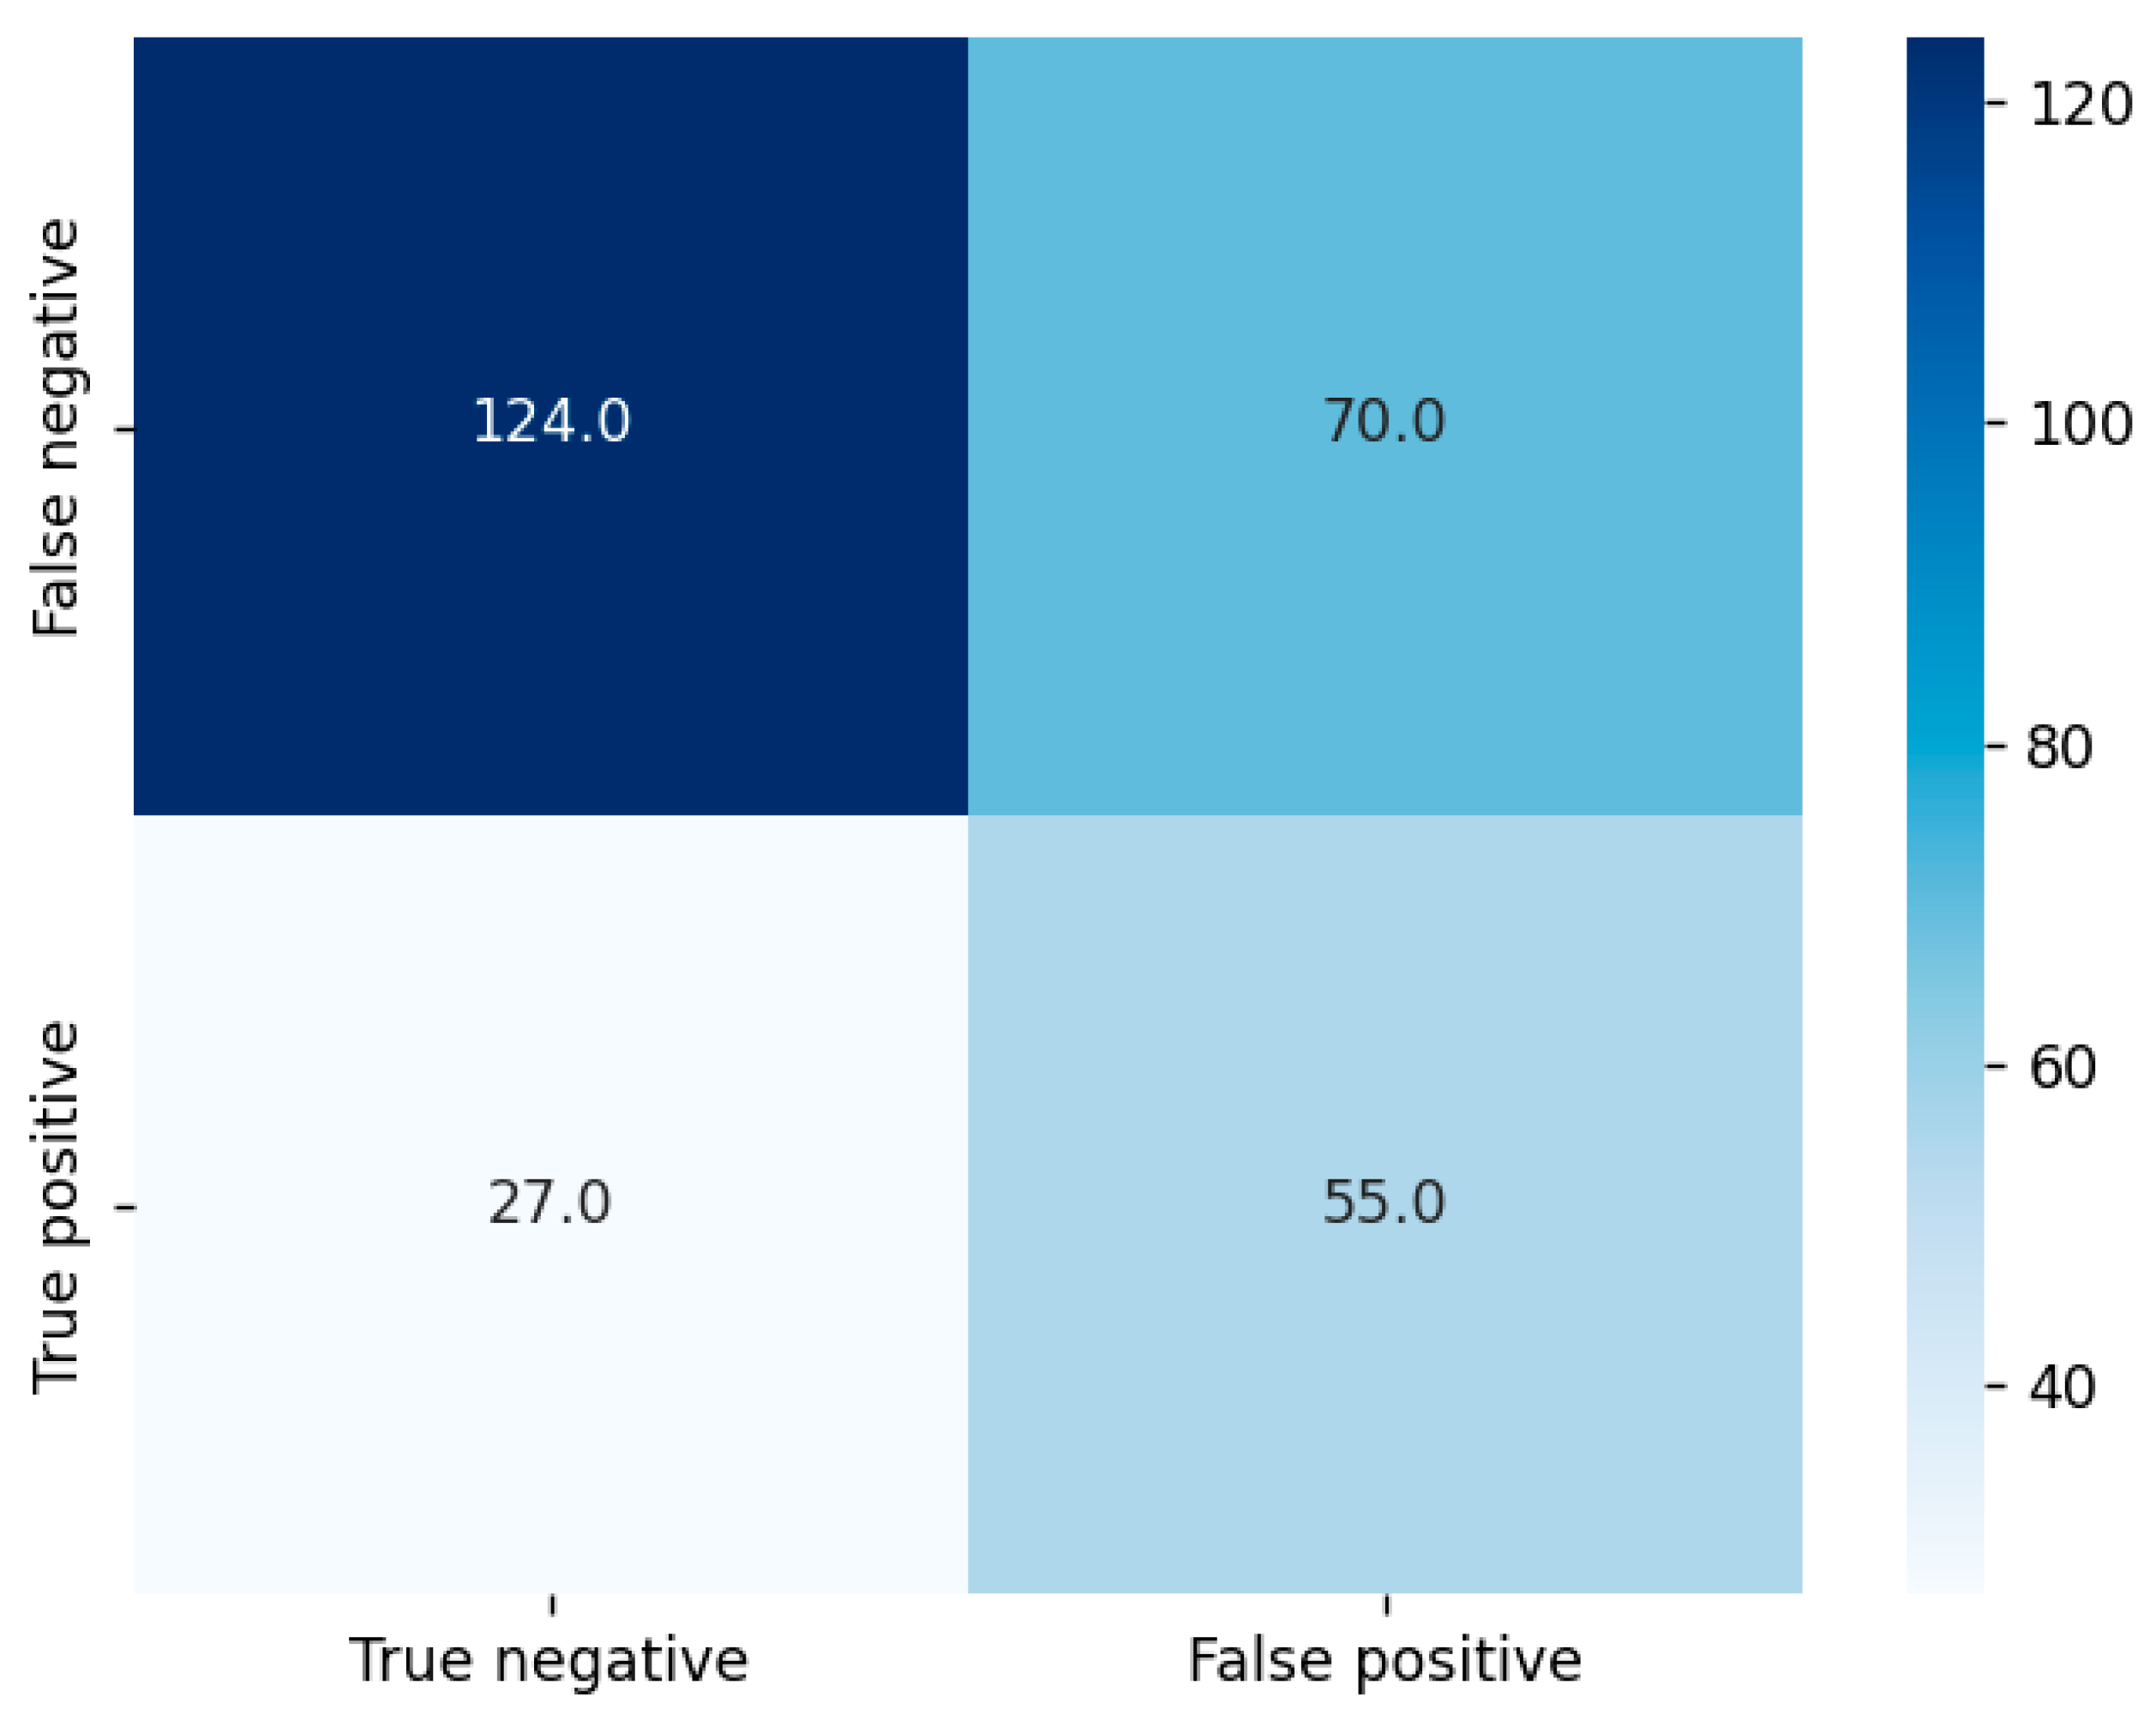

Table 1.
Experimental setup data.
| Technical characteristics tractor | Technical characteristics plough | ||
|---|---|---|---|
| Engine power (kW) ECE R24 |
263 | Number of working body | 6 |
| No. of revolution at max. power (min-1) | 1.900 | Working width per working body (cm) | 40 |
| Mmax/nmax (Nm/min-1) | 1.498/1.450 | Plough working width (cm) | 240 |
| q [g/kWh] | 195 | Tillage depth (cm) | 25 |
| Energy supply in reference to const. mass [kW/t] |
2,4 |
Clearance (cm) |
80 |
| Specific mass without ballast [kg/kW] |
41,5 | Hitching type | Mounted |
| Specific mass with ballast [kg/kW] |
52,99 | Mass (kg) | 2.341 |
| Mass without ballast | 10.830 | Required power (kW) | 243 |
Table 2.
Frequency range of the Teltonika FMB 120 device.
| Channels | Tx | Rx |
| GSM 900 | 880 – 915 MHz | 925 – 960 MHz |
| GSM 1800 | 1.710 – 1.785 MHz | 1.805 – 1.880 MHz |
| BT/BLE | 2.400 – 2.483,5 MHz | 2.400 – 2.483,5 MHz |
| GPS L1 | 1.575,42 MHz | |
| GLONASS | 1.602,56 – 1.615,50 MHz |
Table 3.
Input data.
| Tractor working regime | Clay[%] | Humus[%] | |||
|---|---|---|---|---|---|
| 1 | 42-50 | 1 | 2-3,06 | 1 | |
| 1300 - 1700 TMS | |||||
| 25 cm 2,4 m | |||||
| 2 | 50-60 | 2 | 3,07-3,2 | 2 | |
| 1400 - 1500 TMS | |||||
| 25 cm 2,4 m | |||||
| 3 | 42-58 | 3 | 3,2-4 | 3 | |
| 1400 - 1600 TMS | |||||
| 25 cm 2,4 m | |||||
| 4 | 49-51 | 4 | |||
| 1500 - 1600 TMS | |||||
| 25 cm 2,4 m | |||||
| 5 | 52-60 | 5 | |||
| 1600 - 1700 TMS | |||||
| 25 cm 2,14 m | |||||
| 6 | |||||
| without TMS | |||||
| 25 cm 2,4 m | |||||
(TMS = Tractor Management System; 25 cm = depth; 2.4 m / 2.14 m = plow working width.).
Table 4.
Variation of RMSE, MAE, and R2 values for different XGBoost models for CO2% prediction.
| Booster | Learning rate | R2 | MSE | RMSE |
|---|---|---|---|---|
| gbtree | 0,1 | 0,337811 | 0,256934 | 0,506889 |
| gbtree | 0,05 | 0,334865 | 0,243014 | 0,492964 |
| gbtree | 0,01 | 0,330987 | 0,254212 | 0,504195 |
| gbtree | 0,02 | 0,427529 | 0,147581 | 0,384163 |
| gbtree | 0,021 | 0,315038 | 0,266614 | 0,515885 |
| dart | 0,02 | 0,312012 | 0,253482 | 0,503470 |
| dart | 0,01 | 0,365701 | 0,256175 | 0,506137 |
| dart | 0,1 | 0,423450 | 0,217854 | 0,466748 |
| dart | 0,11 | 0,549201 | 0,132960 | 0,364636 |
Table 5.
Variation of RMSE, MAE, and R2 values for different XGBoost models for fuel specific consumption.
Table 5.
Variation of RMSE, MAE, and R2 values for different XGBoost models for fuel specific consumption.
| Booster | Learning rate | R2 | MSE | RMSE |
|---|---|---|---|---|
| gbtree | 0.3 | 0.278144 | 8.712392 | 2.951676 |
| gbtree | 0.1 | 0.235264 | 10.042184 | 3.168940 |
| dart | 0.05 | 0.289586 | 9.048537 | 3.008078 |
| dart | 0.04 | 0.274618 | 9.580924 | 3.095306 |
| dart | 0.3 | 0.286009 | 8.822204 | 2.970193 |
Disclaimer/Publisher’s Note: The statements, opinions and data contained in all publications are solely those of the individual author(s) and contributor(s) and not of MDPI and/or the editor(s). MDPI and/or the editor(s) disclaim responsibility for any injury to people or property resulting from any ideas, methods, instructions or products referred to in the content. |
© 2025 by the authors. Licensee MDPI, Basel, Switzerland. This article is an open access article distributed under the terms and conditions of the Creative Commons Attribution (CC BY) license (http://creativecommons.org/licenses/by/4.0/).
Copyright: This open access article is published under a Creative Commons CC BY 4.0 license, which permit the free download, distribution, and reuse, provided that the author and preprint are cited in any reuse.


