
Submitted:
05 March 2025
Posted:
10 March 2025
You are already at the latest version
Abstract
Soybean is an important source of protein and is gaining popularity in Ghana due to a rising demand for its use in the poultry industry. However, the grain yield of soybean is relatively low in the Upper West Region due to infertile soil and climate change. This study assessed the symbiotic efficiency of rhizobia isolated from root nodules of soybean via evaluating their effect on photosynthetic functioning in the homologous host. The study also assessed the tolerance of the rhizobial isolates to temperature, drought, salinity and varying pH levels in the laboratory. The infra-red gas analyser, 15N and 13C natural abundance were used to assess photosynthetic activity, N2 fixation, and water-use efficiency, respectively. The test isolates that induced greater photosynthetic rates from higher stomatal conductance, also led to increased water loss via leaf transpiration in soybean plants. Isolates TUTGMGH9 and TUTGMGH19 elicited greater shoot δ13C in the host soybean and also promoted high shoot biomass, C accumulation, relative symbiotic effectiveness, and symbiotic N2 fixation relative to Bradyrhizobium strain WB74 and 5 mM nitrate which were used as positive controls. Although isolate TUTGMGH9, did not grow at 40℃, it showed a growth at 5% of PEG-6000, NaCl, and low pH, while also producing moderate IAA. However, for a better utilization of these rhizobial isolates as bioinoculants, their growth performance needs to be assessed under field conditions to ascertain their competitiveness and symbiotic efficacy.
Keywords:
root nodulation
; rhizobia
; photosynthesis
; 15N/14N isotopes
; 13C/12C
; symbiotic effectiveness
1. Introduction
Soybean (Glycine max L. Merr.) is a nutritionally important grain legume in the world, because of its high protein (40%), oil content (20%), and low cholesterol, as well as its high dietary fibre [1]. In Ghana, soybean has gained popularity partly due to the increase in its demand for the poultry and oil industries [2,3]. Although soybean production in Ghana is relatively low [4], the Northern parts of the country account for about 96% of the crop’s output, making its cultivation a major source of livelihood in the region [2].
Over the past decade, the soybean-rhizobia symbiosis has become important due to the role of symbiotic N2 fixation as a component of sustainable and environmentally-friendly green agriculture [5]. However, the optimization of N2 fixation in legumes such as soybean requires the use of effective microsymbionts that are adapted to prevailing edapho-climatic conditions [6,7]. Because ineffective indigenous soil rhizobia often outcompete introduced strains for nodule occupancy in field-grown legumes, several attempts to use rhizobial inoculants as biofertilizers have often failed [8,9]. Indigenous rhizobia are generally better adapted to local edaphoclimatic conditions than exotic commercial inoculants that often exhibit low effectiveness when transferred from the laboratory to the field due to competition with native rhizobia for the establishment of symbiosis [10,11]. Thus, the competitive ability of introduced rhizobial strains against indigenous soil microbes for nodule occupancy is critical for determining inoculation success in the field [12]. Unfortunately, abiotic stresses have detrimental constraints on symbiotic N2 fixation and yield of soybean, among other crops. Ghana is in the tropical region with erratic rainfall and high temperatures, both of which contribute to the occurrence of drought and soil acidity [13]. The optimum temperature for rhizobial growth is 28℃, and an increase in soil temperature above this value can increase evapo-transpiration rates and consequently cause a reduction in rhizobial growth, rate of root colonization, and nodule biomass [11,14]. Salinity is prevalent in most arid and semiarid regions and can limit the transport of salts from the root zone to shoots due to insufficient soil moisture. Soil salinity can also affect the legume/rhizobia symbiotic interaction by interfering with the infection process and rhizobial survival as a result of toxicity and osmotic stress [15,16].
With the changing climate that has characterized most parts of the world, the inoculation of legumes with efficient and stress-tolerant rhizobia is a promising strategy for sustainable production of grain legumes. For example, the inoculation of legumes with salt-tolerant [17,18], heat-resistant [19], cold-tolerant [20], drought-tolerant [21], and acid (low pH) tolerant rhizobia [22] have been shown to increase yield in legumes. Thus, there are rhizobial strains that possess intrinsic mechanisms for plant growth promotion and abiotic stress tolerance; these include the synthesis of indole acetic acid (IAA) and exopolysaccharides [11]. The search for effective and naturally-adapted rhizobial strains for inoculant production often entails the characterization of native rhizobial isolates for their symbiotic effectiveness, and adaptability to changing environmental conditions. The aim of this study was to assess the symbiotic efficiency of rhizobial isolates of soybean from Da, in the Upper West region of Ghana, by measuring the photosynthetic rates of the homologous host. Additionally, the isolates were screened for their ability to produce indole-3-acetic acid (IAA), as well as for their tolerance to temperature, drought, salinity and to varying pH levels in the laboratory.
2. Materials and Methods
2.1. Study Sites and Nodule Sample Collection
The bacterial isolates used in this study were obtained from the root nodules of soybean harvested from Da in Nadowli District of Upper West Region, Ghana. The Upper West Region lies within the Guinea savanna agroecological zone, and is characterized by grassland and savanna vegetation. It is a warm, semi-arid environment with unimodal rainfall of 800 to 1100 mm, which commences in May and ends in October each year. The experimental field had no history of rhizobia inoculation. The plants were sampled at the flowering stage and the nodules were detached from the roots, washed with running water, placed in vials, dried on silica gel covered with cotton wool [23].
2.2. Rhizobial Isolation
For bacterial isolation and purification, the nodules were rehydrated by immersing in distilled water for 2 h. The nodules were then surface-sterilized by exposing them to ethanol (75%) for 10 s, followed by washing in sodium hypochlorite (3%) for 2 minutes, and rinsed five times with sterilized distilled water. The nodules were then crushed in sterile petri dishes with a drop of autoclave water using a glass rod [23,24], and the nodule suspension streaked onto sterile yeast mannitol-agar (YMA) plates, and incubated at 28 ± 2°C for 5 to 12 days. Daily observations were made for the appearance of single rhizobial colonies. Bacterial colonies were purified by re-streaking on YMA plates until pure single colonies were obtained. Stock cultures of the single colonies were maintained in 50% glycerol-YMB at -80°C for long-term use [24].
2.3. Authentication of Rhizobial Isolates
The single colonies were tested for their ability to induce nodule formation in the homologous host (soybean cv. Favour). Prior to planting, river sand was autoclaved in clean, washed pots, and seeds surface-sterilized by soaking in 95% ethanol for 10 s, and then in sodium hypochlorite (3%) for 3 minutes, followed by rinsing six times in sterile distilled water [24]. Two seeds were sown per pot, and three replicated pots used for each isolate. The pots were arranged in a randomized complete block design in the glasshouse at the Tshwane University of Technology. The glasshouse was naturally lit, with an uncontrolled temperature. The mean daily temperature during the experiment was 28℃. After germination, the seedlings were thinned out to one plant per pot and then inoculated with bacterial cultures at seven days after germination, using 1 mL per plant of rhizobial culture grown in yeast mannitol broth (YMB) to exponential phase (1x 10⁹ cells mL). The commercial Bradyrhizobium strain WB74 obtained from Soygro, Potchefstroom, South Africa, was used as a positive control. Plants receiving 5 mM potassium nitrate (KNO3) every week, and uninoculated plants were included as additional controls. The soybean seedlings were irrigated with sterile N-free nutrient solution [23,24] and deionized water, when necessary. The soybean plants were harvested at eight weeks after planting, and root nodulation assessed. Dark leaf colour and pink nodule internal colouration indicated effectiven nodulation.
2.4. Characterization of Rhizobial Isolates
For isolate characterization, colony morphology and appearance were assessed. Authenticated rhizobial isolates were restreaked on YMA media and incubated at 28 °C for 5 - 12 days to assess colony morphology, characteristics, and appearance. The number of days taken for colonies to appear was used to classify the bacteria into three groups: fast-growers (< 3 days), intermediate-growers (3 – 5 days), and slow-growers (≥ 6 days). The colony colour was recorded as milkish or white, and the texture was described as watery, gummy, or dry. Colony shape was characterized as circular or irregular, and elevation was recorded as convex or flat. Colony size was measured as the colony diameter using graph paper to the nearest millimetre [23,25].
2.5. Leaf Gas-Exchange Studies
Photosynthetic measurements were made on three fully expanded young trifoliate leaves per plant for three replicate plots, between 08:00 to 11:00 at 60 days after planting (DAP) using a portable infrared gas analyzer, version 6.2 (Li-6400XT, Li-COR, Nebraska, USA). Leaves were allowed to acclimatize to the light environment in the chamber for 4 to 5 min before each measurement was taken. The instrument was calibrated to maintain the following conditions in the leaf chamber before use: light intensity 1200 μmol photons m-2 s-1, reference CO2 concentration of 400 ppm, flow rate of 400 μmol s-1, leaf temperature of 25°C, and relative humidity of 44%. Gas-exchange parameters measured included net photosynthesis (A), transpiration (E), stomatal conductance (gs), intercellular CO2 concentration (Ci), and the ratio of intercellular CO2 to ambient CO2 concentration (Ci/Ca). The intrinsic water-use efficiency (WUEi) was calculated as the ratio of A to gs [26,27].
2.6. Relative Symbiotic Effectiveness of Rhizobial Isolates
The effectiveness of the rhizobial isolates was assessed at 60 days after planting. The harvested plants were separated into shoots, roots, and nodules. Strain symbiotic efficacy isolates was measured as nodule number per plant, and nodule fresh weight per plant. Plant shoots and roots were separated, oven-dried separately at 60°C for 48 h, and weighed. The percent relative symbiotic effectiveness (%RSE) of and rhizobial isolate was calculated by expressing shoot dry matter of soybean plants inoculated with the test isolates as a percentage of the shoot dry matter of plants inoculated with the commercial Bradyrhizobium inoculant strain WB74 as described in earlier studies [28,29,30]:
%RSE = x 100 (1)
The isolates were considered as ineffective at < 50% RSE, moderately effective at 50 to 80% RSE, and highly effective at > 80% RSE.
2.7. Shoot 15N/14N and 13C/12C Isotopic Analysis
To assess N2 fixation and C assimilation in the test soybean plants, oven-dried shoot samples were analyzed for their 15N/14N and 13C/12C isotopic composition using a mass spectrometer at the Stable Light Isotope Laboratory, University of Cape Town, South Africa. Briefly, about 2 to 3 mg of ground plant samples were weighed into aluminium capsules and fed into a Carlo Erba NA1500 elemental analyzer (Fisons Instruments SpA, Strada, Rivoltana, Italy) coupled to a Finnigan MAT252 mass spectrometer (Fisons Instrument SpA, Strada, Rivoltana, Italy) via conflo II open-split device to measure 15N/14N isotopic composition. A standard (Merck Gel: δ15N = 6.8‰, N% = 14.64) was included together with a blank sample and run after every 12 samples to calibrate the machine and avoid errors during the isotopic fractionation. All the results were referenced to air for the N isotope values. The isotopic composition (δ15N) was calculated as [31]:
(2)
The 13C natural abundance or δ13C (‰), was also calculated as [32]:
(3)
The C and N content of the soybean shoots were calculated as the product of shoot biomass and percent C concentration (%C) or pecent N concentration (%N) [33]. The %C and %N were obtained directly from the mass spectrometer. Shoot N-fixed was calculated as:
N-fixed = shoot N content (nodulated plants) – shoot N content (uninoculated plants) (4)
2.8. Physiological Characterization of Isolates
2.8.1. Temperature Tolerance
To assess the temperature tolerance of the rhizobial isolates, 10 μL of single-colony culture was pipetted onto YMA plates and incubated at 25, 28, 30, 37, 40, and 45℃. The tolerance of each isolate was evaluated by observing the growth of colonies on the plates up to seven days, as described by Mohammed, et al. [34].
2.8.2. Drought Tolerance
The tolerance of isolates to drought was determined using yeast mannitol broth containing polyethylene glycol (PEG-6000) at 5, 15, and 30% concentration (w/v). For this, 10 μL volume of the test rhizobial culture was pipetted onto YMA plates that were supplemented with the different levels of PEG-6000, and incubated at 28°C for 72 h. The isolates were shaken on daily basis and the growth was measured at a wavelength of 600 nm using a spectrophotometer. The optical density (OD) values of test isolates were used as measure of their tolerance to drought. Thus, OD < 0.30 was considered to be highly sensitive to drought; OD = 0.30 – 0.39 as sensitive drought; OD = 0.40 – 0.50 as tolerant; and OD > 0.5 as highly tolerant to drought [35].
2.8.3. Salinity Tolerance
The ability of rhizobial isolates to form colonies in the presence of different salt concentrations was assessed. Yeast mannitol agar was supplemented with different levels of NaCl 0.05, 2.5, 5.0, 10.0, 15.0, 20.0, and 25.0 g per 500 mL YMA equivalent to 0.01, 0.5, 1, 2, 3, 4, and 5%. This was followed by pipetting 10 μL volume of the test rhizobial culture onto each plate and incubating at 28°C for seven days. Bacterial growth rates were scored as +++ indicating full growth, ++ moderate growth, and + weak growth, and – no growth [34].
2.8.4. pH Tolerance
To assess the ability of test isolates to tolerate different pH levels (pH 4.5, 5, 6, 7, and 8.5), five yeast mannitol broth cultures were prepared with different pH levels in 200 ml Erlenmeyer flasks [36]. For pH values less than 7, MES buffer was added to the flask, and for pH 7 and 8.5, HEPES was added to the flask containing broth culture. A 10 µl volume of test isolate was added into the media adjusted to each pH level and incubated for seven days at 28℃. Rhizobial growth was measured at 660 nm using a spectrophotometer.
2.8.5. Acid-Alkali Production
Isolates were cultured on YMA plates containing 0.025 g per liter of Bromothymol blue (BTB), which was used as the acid and base indicator, and incubated at 28°C for seven days [23]. Colony formation and colour change of the medium were observed for 2 – 7 days. Fast-growing isolates usually change the medium to yellow due to acid production, and slow-growers to blue.
2.9. Statistical Analysis
All data were tested for normality and then subjected to a one-way analysis of variance using Statistica software (version 10.1). Where treatments showed significant differences, the means were separated using Duncan’s multiple range test at p≤0.05. Correlation and regression analyses were performed to assess the existence of any relationships between the measured parameters.
3. Results
3.1. Gas-Exchange Parameters
At 60 days after planting, gas-exchange measurements were taken on the leaves of soybean seedlings to assess differences in photosynthesis, which reflects the symbiotic functioning of the isolates used to inoculate the plants (Table 1). The rate of photosynthesis was highest in soybean plants inoculated with isolates TUTGMGH11 (16.18 µmol CO2 m-2s-1) and TUTGMGH8 (16.16 µmol CO2 m-2s-1) (Table 1). The uninoculated control plants induced the lowest photosynthetic rates (2.64 µmol CO2 m-2s-1). Of the 31 test isolates, 16% elicited higher photosynthetic rates (14.71 – 16.18 µmol CO2 m-2s-1) than the NO3-fed plants (14.47 µmol CO2 m-2s-1). Generally, the isolates that showed greater stomatal conductance also elicited greater CO2 uptake via photosynthesis. For example, the plants inoculated with isolates TUTGMGH8, TUTGMGH11, TUTGMGH22, TUTGMGH4, and the commercial Bradyrhizobium strain WB74, all showed an increase in stomatal conductance and hence greater photosynthetic rates (Table 1).
More than 40% of isolates induced higher intercellular CO2 concentration than the commercial strain Bradyrhizobium strain WB74. Isolates TUTGMGH19 and TUTGMGH20 elicited the highest intercellular CO2 concentration in the host soybean when compared to the other test isolates. In contrast, isolates TUTGMGH21 and TUTGMGH26 caused lower levels of intercellular CO2 (230.75 and 209.91 µmol CO2 molair-1, respectively). About 28 isolates also elicited higher intercellular CO2 concentration in soybean than the NO3-fed plants (Table 1).
Greater leaf transpiration rates were generally associated with increased photosynthetic rates and higher stomatal conductance. For example, isolate TUTGMGH8 and the commercial Bradyrhizobium strain. WB74, as well as TUTGMGH4 induced the highest leaf transpiration (12.62, 12.12, 10.11 and 9.09 mol H2O m-2s-1, respectively), much higher photosynthetic rates, and greater stomatal conductance (Table 1). Including the commercial Bradyrhizobium strain WB74, 16% of the isolates induced greater leaf transpiration than the NO3-fed plants. As to be expected, the uninoculated control plants showed the lowest leaf transpiration rates, stomatal conductance, and photosynthetic rates (Table 1).
The ratio of the intercellular to ambient CO2 concentrations also differed significantly, with values ranging from 0.53 in plants inoculated with isolate TUTGMGH26 to 12.10 in soybean plants inoculated with the commercial Bradyrhizobium strain WB74 (Table 1). Isolates TUTGMGH6, TUTGMGH8, TUTGMGH11, TUTGMGH17, TUTGMGH20, and TUTGMGH23 elicited significantly higher intercellular to ambient CO2 concentrations than commercial strain Bradyrhizobium strain WB74 (0.75). However, 21 isolates induced greater leaf intercellular to ambient CO2 concentrations than the commercial Bradyrhizobium strain WB74.
Soybean plants inoculated with isolate TUTGMGH26 recorded the highest intrinsic water-use efficiency (97.09 µmol CO2 mol-1 H2O), followed by the plants inoculated with isolates TUTGMG7H30, TUTGMGH25 and TUTGMGH15 (71.43 – 72.20 µmol CO2 mol-1 H2O) (Table 1). About 81% of the isolates induced higher intrinsic water-use efficiency than the commercial Bradyrhizobium strain WB74, while 19% induced greater intrinsic water-use efficiency than plants receiving 5 mM KNO3. As to be expected, plants that showed lower photosynthetic rates, stomatal conductance, leaf transpiration, and intercellular CO2 concentration induced much higher intrinsic water-use efficiency, except for the uninoculated control plants (Table 1).
3.2. Plant Growth
The shoot biomass of inoculated soybean plants ranged from 0.45 to 1.99 g plant-1 (Table 2). The highest shoot biomass was induced by isolate TUTGMGH21 (1.99 g plant-1), followed by the 5 mM NO3-fed plants (1.85 g plant-1), and isolate TUTGMGH3 (1.74 g plant-1). High leaf photosynthesis was generally associated with increased shoot biomass and vice versa. For example, isolates TUTGMGH14, TUTGMGH18, and TUTGMGH26, which induced lower photosynthetic rates, resulted in the lowest shoot biomass (0.45 – 0.72 g plant-1), followed by the uninoculated control plants (0.33 g plant-1) (Table 2).
The root biomass varied significantly among the plants inoculated the test isolates, with TUTGMGH6, TUTGMGH21, and TUTGMGH30 inducing the highest root dry matter accumulation (0.72 – 0.85 g plant-1). However, the highest root dry matter was recorded by the 5 mM NO3-fed plants (1.13 g plant-1), and the lowest by the uninoculated control (0.22 g plant-1 (Table 2).
Whole-plant biomass (shoot+root) differed significantly (p ≤ 0.001), with 5 mM NO3-fed plants producing the highest total plant biomass (2.97 g plant-1), followed by plants inoculated with isolates TUTGMGH1, TUTGMGH3, TUTGMGH6, TUTGMGH9, TUTGMGH20, TUTGMGH21, and TUTGMGH30 (2.23 – 2.70 g plant-1). About 77% of the rhizobial isolates induced greater accumulation of whole plant biomass (1.69 – 2.70 g plant-1) than the commercial Bradyrhizobium strain WB74 (Table 2).
3.3. Shoot C Concentration
The C concentration (%C) of soybean shoots varied significantly (p ≤ 0.01) with inoculation, and ranged from 40.15% to 44.42% (Table 2). Isolates TUTGMGH24 and TUTGMGH29 elicited the highest shoot C concentration (44.42 and 44.30%, respectively), followed by the commercial Bradyrhizobium strain WB74, TUTGMGH28, TUTGMGH30, and TUTGMGH20. The least shoot C concentration (40.15%) was recorded in the uninoculated control plants.
In general, higher shoot biomass was associated with increased shoot C content and accumulation. As a result, the 5 mM NO3-fed plants and the plants inoculated with isolates TUTGMGH1, TUTGMGH3, TUTGMGH20, TUTGMGH23, TUTGMGH25, TUTGMGH21, and TUTGMGH24 recorded greater shoot biomass, and hence higher shoot C content. In contrast, the plants inoculated with isolates TUTGMGH10, TUTGMGH14, TUTGMGH18, TUTGMGH22, TUTGMGH26 and the uninoculated control recorded the least shoot biomass and hence the lowest shoot C content. About 81% of the isolates induced greater shoot C content (51.86 – 84.98 g plant-1) than the commercial Bradyrhizobium strain WB74 (42%) (Table 2).
3.4. Shoot δ13C and C:N Ratio
The shoot δ13C values of soybean plants differed significantly (p ≤ 0.01) with test isolates, and ranged from -29.55‰ to -27.19‰. Inoculating soybean plants with isolate TUTGMGH9 resulted in greater shoot δ13C (-27.19‰), followed by isolates TUTGMGH11, TUTGMGH24, TUTGMGH26, and TUTGMGH27 (-27.34‰ to -27.23‰). In contrast, lower δ13C values were recorded in the plants inoculated with the commercial Bradyrhizobium strain WB74 (-29.55‰), and those inoculated with isolates TUTGMGH23 (-28.44‰) and TUTGMGH25 (-28.29‰).
The soybean plants treated with 5 mM KNO3 recorded the highest C:N ratio (23.59 g g-1), followed by the plants inoculated with the commercial Bradyrhizobium strain WB74 (21.59 g g-1) and isolate TUTGMGH13 (21.54 g g-1). In contrast, the plants inoculated with isolates TUTGMGH7 and TUTGMGH25 recorded the lowest C:N ratios (15.57 and 15.91 g g-1, respectively) (Table 2).
3.5. Nodulation Induced by Rhizobial Isolates
Nodule number of soybean plants inoculated with the different rhizobial isolates varied from 10 to 43 per plant, while nodule fresh mass ranged from 0.18 to 0.64 g plant-1 (Table 3). The plants inoculated with isolate TUTGMGH20 produced the most root nodules (43 nodules per plant), followed by isolates TUTGMGH3 and TUTGMGH25, which produced similarly high nodule numbers (37 and 35 nodules per plant, respectively). Of the 31 isolates tested, 16% induced significantly greater nodule number on soybean than the commercial Bradyrhizobium strain WB74 (which formed 24 nodules per plant), while about 71% of them induced fewer nodules in the test soybeans than the commercial Bradyrhizobium strain WB74. Higher nodule numbers generally correlated with greater nodule fresh weight, though there were a few exceptions due to differences in nodule size. For example, isolates TUTGMGH4, TUTGMGH9, TUTGMGH12 and TUTGMGH25 induced more nodules in the soybean, resulting in the highest nodule fresh weight (0.51 – 0.6 g plant-1). However, despite inducing fewer nodule numbers per plant, isolates TUTGMGH1, TUTGMGH2, and TUTGMGH6 elicited relatively high nodule fresh mass in soybean due to bigger nodule sizes. About 90% of the isolates produced greater nodule biomass (0.31– 0.64 g plant-1) than the commercial Bradyrhizobium strain WB74. In contrast, isolates TUTGMGH26 and TUTGMGH27 induced much lower nodule numbers (16 nodules per plant), and hence small nodule fresh weights (0.18 and 0.24 g plant-1) (Table 3).
3.6. Relative Symbiotic Effectiveness of Rhizobial Isolates
The percent relative symbiotic effectiveness varied significantly (p ≤0.05) among the test isolates, with a range of 42% to 186% (Table 3). According to Rejili, et al. [37] isolates with less than 50% RSE are considered as ineffective, 50 – 80% as moderately effective, and greater than 80% as highly effective. In this study, the isolates were effective, except isolate TUTGMGH14, which scored 42% relative symbiotic effectiveness. Isolates TUTGMGH18 and TUTGMGH26 were moderately effective with 67% and 56% RSE, while the rest of the isolates (90%) were highly effective (%RSE ≥ 80%) (Figure 1). Furthermore, 75% of the isolates were more effective than the commercial Bradyrhizobium strain WB74. Isolate TUTGMGH21 was the most effective, with 186% RSE (Table 3).
3.7 Shoot N Concentration
Inoculating soybean with rhizobial isolate TUTGMGH23 resulted in significantly greater shoot N concentration (2.92%), followed by with isolates TUTGMGH19, TUTGMG7, and TUTGMGH16 (Table 3). Quite expectedly, the lowest shoot N concentration (1.13%) was recorded in the uninoculated control plants. However, the plants inoculated with isolates TUTGMGH23 and TUTGMGH21 produced the highest shoot N content, with the uninoculated control (0.37 g plant-1) and the plants inoculated with isolates TUTGMGH18 and TUTGMGH26 recording the lowest shoot N content (1.64 and 1.57 g plant-1) (Table 3).
3.8. Shoot δ15N and N-fixed
The highest shoot δ15N values were recorded in the uninoculated control plants (+2.16‰), followed by the 5 mM KNO3-fed plants (+1.55‰) (Table 3). Isolates TUTGMGH24 (-1.26‰) and TUTGMGH14 (-1.26‰) recorded the highest δ15N values. The remaining isolates recorded much lower shoot δ15N values, which ranged from -2.64‰ to -1.76‰ (Table 3). The amount of N-fixed by isolates in soybean differed significantly, with values ranging from 0.75 g plant-1 for isolates TUTGMGH14 to 4.77 g plant-1 by isolate TUTGMGH21 (Table 3).
3.9. Phenotypic Characterisation of the Rhizobial Isolates
A total of 31 authenticated soybean rhizobial isolates were evaluated for phenotypic characteristics such as colony colour, size, texture, elevation, opacity, shape, and the number of days to colony appearance on YMA plates (Figure 2 and Table S1). Of the 31 isolates, 42% were classified as intermediate growers (3 – 5 days to appear on YMA plates), and 58% slow growers (6 – 8 days). In terms of colony colour, 22 isolates (71%) were milkish, while the remaining 9 isolates (29%) were white. With colony elevation, 19 isolates (61%) were convex, and 12 isolates (39%) flat. A number of isolates were gummy (48%), or watery (32%), and 6 isolates (20%) showed a dry texture. About 94% of the isolates had a circular shape, with only two isolates being irregular. Two isolates (TUTGMGH15 and TUTGMGH23) were transparent, 16 isolates translucent, and the remaining 13 isolates opaque. Most isolates had small colonies with diameter less than 2.5 mm (68%), while the remainder had diameters between 2.5 and 4 mm (Figure 2). The isolates were also cultured in YMA medium containing Bromothymol Blue (BTB) as the acid/base indicator, and 45% of the isolates turned the medium into yellow within 5 days of incubation, while the remaining isolates turned into blue (Table 3).
3.10. Biochemical Characterisation of Rhizobial Isolates
3.10.1. Temperature Tolerance
Most of the test isolates showed growth at all tested temperatures, except TUTGMGH5, TUTGMGH9, and TUTGMGH28, which failed to grow at 40 and 45℃ (Table 4). Isolates TUTGMGH3 and TUTGMGH4 showed weak growth at all the temperature levels. The test isolates generally exhibited maximum growth at temperatures ranging from 28 to 30 ℃. At 25 ℃, 14 isolates (45%) showed weak growth, but six isolates showed full growth. Only isolate TUTGMGH17 showed a good growth at all the temperature levels tested (Table 4).
3.10.2. Salinity Tolerance
All the isolates showed growth in media supplemented with 0.01% (control) and 0.5% NaCl (Table 4). However, isolates TUTGMGH5, TUTGMGH11, and TUTGMGH16 grew in only the 0.01% control, but were susceptible to 0.5 up to 5% NaCl (Table 4). In contrast, isolates TUTGMGH8, TUTGMGH22, and TUTGMGH27 (in that order), showed moderate to full cell growth at all the salinity levels tested (Figure S3.1). However, it was only isolate TUTGMGH8 that showed full growth at all the salinity levels (0.01 – 5% NaCl), followed by TUTGMGH3, TUTGMGH7, TUTGMGH9, TUTGMGH22, TUTGMGH27, and TUTGMGH31, which showed moderate growth at 5% NaCl (Table 4).
3.10.2. Drought Tolerance
Drought tolerance was evaluated in soybean isolates using polyethylene glycol (PEG) 6000 at different levels ranging from 5, 15, to 30% (Table 5). There was a significant suppression of rhizobial cell growth at 15 and 30% PEG. Although isolates TUTGMGH12 (0.424) and TUTGMGH19 (0.461) could tolerate 5% PEG 6000, TUTGMGH9 (0.523) was highly tolerant of PEG 6000, with the rest showing significant cell growth inhibition at 5% PEG 6000. Of all the 31 isolates tested, TUTGMGH12 showed better cell growth at 5, 15 and 30% PEG than the other isolates, followed by TUTGMGH10, TUTGMGH16, and TUTGMGH15 (Table 5). The isolates that were intolerant of 30% PEG included TUTGMGH17 and TUTGMGH29.
3.10.2. IAA Production
The rhizobial isolates differed significantly (p ≤0.05) in their ability to produce IAA using Salkowski’s reagent. The maximum IAA production was by isolate TUTGMGH15 (11.37 µg mL-1), followed by TUTGMGH3, TUTGMGH8 and TUTGMGH5 (9.92, 9.85, and 9.59 µg mL-1). Isolates TUTGMGH26 (0.98 µg mL-1) and TUTGMGH24 (1.21 µg mL-1) produced the lowest IAA (Table 5)
3.10.5. pH Tolerance
The 31 rhizobial isolates exhibited varied responses to different pH levels. The maximum growth of most of the isolates was recorded at pH 8.5, and lowest at pH 4.5 and 5 (Figure 3). In this study, 21 out of the 31 isolates recorded maximum growth at pH 8.5, and these included TUTGMGH2, TUTGMGH4, TUTGMGH5, TUTGMGH6, TUTGMGH7, TUTGMGH8, TUTGMGH10, TUTGMGH12, TUTGMGH17, TUTGMGH18, and TUTGMGH30. However, some isolates tolerated a wider range of pH conditions, ranging from acidic to alkaline.
4. Discussion
4.1. Diversity of Soybean Rhizobial Isolates and Their Photosynthetic Performance
The presence of diverse rhizobial populations in soils represents an opportunity to identity effective strains for inoculant formulation [38]. With a changing climate however, the identified rhizobia should have multiple traits for survival in a changing environment that is characterized by high temperature extremes, drought, salinity and low pH, low soil nutrient concentrations. The soybean rhizobia obtained from Da in the Upper West Region of Ghana exhibited diverse characteristics. Single colonies isolated from soybean root nodules displayed a circular shape (>94%), milkish colour (>71%), as well as a gummy or watery texture (>48 and 32% respectively), and were small in size with diameters of less than 2.5 mm (>68%) and consisted of slow growers (58%) and intermediate growers (42%). These colony characteristics suggest that the soybean rhizobia from Da belong to the genus Bradyrhizobium, as described by Somasegaran and Hoben [23],Pongslip [25]. Bradyrhizobium is the most dominant rhizobial microsymbiont in Africa [39,40,41,42] nodulating soybean in Ghana [6].
Because bacteroids in legume root nodules require de novo photosynthate to reduce N2 to NH3, photosynthetic rates during legume plant growth generally correlate the symbiotic efficacy of the nodule occupants [43]. In this study, gas-exchange measurements revealed marked differences in photosynthetic functioning, stomatal conductance, leaf transpiration, and water-use efficiency of soybean plants nodulated by 31 rhizobial isolates from Da, Ghana. In fact, isolates TUTGMGH4, TUTGMGH8, TUTGMGH11, and TUTGMGH22, as well as the commercial Bradyrhizobium strain WB74 generally induced greater photosynthetic rates powered by higher stomatal conductance, which permitted greater CO2 influx into photosynthetic cells. In contrast, soybean plants nodulated by isolates TUTGMGH14, TUTGMGH18, and TUTGMGH26 revealed low photosynthesis due to reduced stomatal conductance that led to reduced CO2 influx and hence limited accumulation of shoot and whole-plant biomass.
In this study, there was no link between an increase in nodulation and plant biomass accumulation as reported by previous studies [44]. For example, although isolates TUTGMGH8, TUTGMGH11, TUTGMGH22, TUTGMGH30, and the commercial Bradyrhizobium strain WB74 elicited higher photosynthetic rates, they showed lower nodule dry matter. In contrast, the lower photosynthetic rates, stomatal conductance, and leaf transpiration induced by isolates TUTGMGH1, TUTGMGH3, and TUTGMGH21 were associated with higher nodulation, shoot dry matter and C concentration in shoots (Table 1,2 and 3). This discrepancy could be attributed to the instantaneous nature of gas-exchange measurements which are influenced by many environmental factors [26].
C accumulation in legumes is a function of photosynthesis and is dependent on symbiotic N2 fixation for the biosynthesis of chlorophyll and the CO2-reducing Rubisco enzyme. Inoculating soybean with rhizobial isolates in this study, improved C accumulation compared to 5 mM NO3 feeding with values ranging from 40.15 to 44.30 g plant-1. It was also interesting to note that rhizobial isolates that induced high shoot C concentration were associated with more negative shoot δ13C values and vice versa, except for isolate TUTGMGH24. As a result, shoot C concentration was positively correlated with shoot δ13C (r = 0.52**) (Table S2).
4.2. Plant Water-Use Efficiency and Strain Symbiotic Effectiveness
Shoot δ13C is a known measure of water-use efficiency in C3 plants [32]. In this study, isolates TUTGMGH9, TUTGMGH11, TUTGMGH19, TUTGMGH24, TUTGMGH26, TUTGMGH27, and TUTGMGH30 induced greater shoot δ13C values (Table 6), and hence greater water-use efficiency. However, isolates TUTGMGH26, TUTGMGH15, TUTGMGH21, TUTGMGH24, TUTGMGH31 and TUTGMGH9 also showed higher photosynthetic water-use efficiency, in addition to greater shoot δ13C values (Table 1 and 2). These results suggest that, as tools the shoots 13C and photosynthetic water-use efficiency were robust enough in identifying water-use efficiency in soybean nodulated by different rhizobial strains. Furthermore, isolates TUTGMGH9, TUTGMGH19 and TUTGMGH21 did not only exhibit greater shoot δ13C, they also showed high shoot N content or N-fixed, as well as increased relative symbiotic effectiveness (Table 3). These results suggest that water-use efficiency was strongly enhanced by potent symbiotic signals that served as environmental cues, in addition to increasing N2 fixation and N nutrition of the legume.
However, the fact that isolates TUTGMGH7, TUTGMGH9, TUTGMGH23, and TUTGMGH25 which obtained a high proportion of their N nutrition from symbiosis and yet exhibited low water-use efficiency could suggest that partial closure of stomata during soil water deficit affected photosynthesis leading to reduced water-use efficiency. This was supported by the negative correlation found between shoot δ13C and stomatal conductance (r = -0.28**), as well as between shoot δ13C and leaf transpiration rates (r = -0.40***) (Table S2).
The symbiotic functioning of the 31 soybean isolates from Da varied significantly, as evidenced by the observed differences in nodule number, nodule biomass, shoot N concentration, shoot δ15N, amount of N-fixed and shoot N content. The marked differences in soybean biomass were generally linked to isolate symbiotic efficacy. For example, isolates TUTGMGH16, TUTGMGH21, TUTGMGH23, and TUTGMGH25, which were among the isolates that induced the highest nodulation (nodule number and weight), showed the lowest δ15N values, exhibited greater shoot N concentration and content, as well as the highest amount of N-fixed, produced the largest soybean biomass (Table 2 and 3). Metabolites such as lumichrome and riboflavin produced by rhizobia during nodule formation serve as environmental cues for sensing soil moisture deficit [45,46,47]). High N2-fixing rhizobia apparently release more lumichrome that low fixing microbes [48], suggesting a link between rhizobial strain effectiveness, symbiotic N nutrition and legume water-use efficiency. It is not surprising that high effective isolates such as TUTGMGH9, TUTGMGH19 and TUTGGMGH21 showed high amounts of N-fixed and greater shoot δ13C or water-use efficiency in this study. The results of this study suggest that an increase in nodule functioning induced by test isolates increased C and N assimilation through photosynthesis and N2 fixation, leading to greater biomass accumulation. In contrast, isolates TUTGMGH14, TUTGMGH18, and TUTGMGH26, which produced the lowest nodule mass and N concentration, high shoot δ15N, and low amount of N-fixed induced least shoot biomass. These results were supported by the significant correlations between shoot dry matter and nodule biomass (r = 0.43***), shoot N concentration (r = 0.31***) (Table S2). These findings clearly indicate that soybean dry matter accumulation is directly linked to N2 fixation [43]. An argument that is consistent with the observed relationship between root nodulation and shoot biomass in Jack bean [30] and cowpea [49]. Furthermore, the isolates that produced greater symbiotic N also recorded much higher relative symbiotic effectiveness produce greater symbiotic N.
The data for percent relative symbiotic effectiveness of isolates in this study differed significantly (p ≤ 0.01), with a range of 42% for isolate TUTGMGH14 to 186% for isolate TUTGMGH21. Of the 31 isolates evaluated, 28 were more effective than the commercial Bradyrhizobium strain WB74, suggesting the presence of highly effective rhizobial populations in Ghanaian soils with potential for use as inoculants. These isolates should however be further assessed for their ability to increase soybean plant growth and yield under field conditions.
4.3. Plant Growth-Promoting Traits of the Rhizobial Isolates from Da
Many abiotic factors can affect rhizobial growth and survival in soils. Temperature stress can alter the permeability of bacterial membrane and cause denaturation of enzymes, leading to cell death and low rhizobial populations [50]. Under laboratory conditions, the growth of the test isolates was not markedly affected by temperature except for TUTGMGH5, TUTGMGH9 and TUTGMGH28, which failed to grow at temperatures above 40℃. The ability of these isolates to grow in a wide range of temperatures gives them a competitive edge in the rhizosphere to survive and nodulate their host plants. However, isolates are generally origin-related, and therefore rhizobia from hot climates may generally tolerate high temperatures and vice versa. Yuan, et al. [20] for example, found greater shoot biomass and N2 fixation under cooler conditions following inoculation with a cold-tolerant strain (4 ℃) than the control commercial inoculant. However, Yuan, et al. [20] also showed that rhizobia isolated from soybean in hot environments could tolerate temperatures up to 44 ℃, suggesting the development of heat tolerance mechanisms such as the production of heat-shock proteins by the rhizobia for cellular protection against high temperatures [19].
The rhizobial isolates from this study were also found to be sensitive to drought with only few showing positive growth at 5% PEG-6000. Although isolates TUTGMGH9, TUTGMGH12, TUTGMGH19, TUTGMGH3, TUTGMGH10 and TUTGMGH30 grew well at 5% PEG-6000 concentration, only TUTGMGH12 showed all growth at 5, 15 and 30% PEG-6000, followed by TUTGMGH10, TUTGMGH16 and TUTGMGH15. Many of these isolates could however also induce high water-use efficiency and N2 fixation in soybean plants (Table 3.1 and 3.3), thus making them ideal for use in a changing climate, where drought is frequent. The reported high nodulation of Phaseolus vulgaris inoculated with drought-tolerant rhizobia under conditions of soil moisture deficit [51], implies that the soybean isolates with drought tolerance can be recommended to farmers. These drought-tolerant rhizobia can apparently adjust their cell wall elasticity to prevent mechanical damage to the plasma membrane, thus improving water-use efficiency [21].
With climate change, irrigated agriculture and hence soil salinity are likely to increase. This would require identifying salt-tolerate crops and rhizobia for achieving food security. The 31 soybean isolates tested in this study, showed markedly different growth rates to various concentrations of salinity (Table 4), 16 isolates showing an ability to grow at 5% NaCl, a finding better than the report by Khaitov, et al. [18] who identified rhizobial strains from chickpea that had good growth at 3% NaCl. In fact, in this study, isolate TUTGMGH8 exhibited maximum growth from 0.01% up to 5% NaCl, and is therefore ideal candidate for inoculant formation as biofertilizer for soybean production under saline conditions. We also found that in this study, the slow-growing rhizobial isolates were sensitive to salinity, whereas the acid-producers could tolerate up to 5% NaCl. While 17 isolates showed low tolerance to increasing NaCl concentration, 16 isolates were able to grow at all levels of salinity and temperature, though they differed in their growth rates (Table S1).
This study also revealed differences in isolate growth rate at various pH levels. Although these rhizobia were isolated from an acidic soil, only isolates TUTGMGH1, TUTGMGH3, TUTGMGH9, and TUTGMGH28 showed positive growth in an acidic medium with their absorbances ranging from 0.5 to 0.75. This could be because the activity of H+ ions in culture medium is different from that in the soil, where the charges of the colloids can partially neutralize the activity of the ions [52]. However, isolates TUTGMGH6, TUTGMGH8, TUTGMGH10, TUTGMGH12, TUTGMGH17, TUTGMGH18, TUTGMGH21, TUTGMGH27, and TUTGMGH30 performed better under alkaline conditions. Acid-tolerant isolates were intermediate and slow-growing, and changed the YMA medium supplemented with BTB into a blue colour, indicating alkaline production. Slow-growing rhizobia isolates are generally considered highly tolerant of low pH, suggesting that alkaline producers are dominant in tropical soils. In fact, Oliveira, et al. [53] have suggested that alkaline-producing rhizobia are dominant in acidic soils, while acid producers are dominant in alkaline soils [54,55].
Taken together, isolates TUTGMGH9 and TUTGMGH19 induced the highest shoot biomass, C accumulation via photosynthesis, relative symbiotic effectiveness, symbiotic N2 fixation, and tolerance to abiotic stresses. However, for better application of these rhizobial isolates as bioinoculants, their growth performance should be assessed under field conditions to ascertain their symbiotic efficacy.
Supplementary Materials
The following supporting information can be downloaded at the website of this paper posted on Preprints.org, Table S1: Morphological characteristics of 31 soybean nodulating rhizobial isolates; Table S2: Correlation analysis between shoot biomass of soybean and symbiotic N as well as gas-exchange parameters; Figure S1: Picture showing NaCl tolerance at different concentrations (A, 0.1 to 3% and B, 4 and 5%) exhibited by the test rhizobial isolates from Da. The numbers in each segment correspond to the number of the test rhizobial isolates as preceded by the prefix TUTGMGH in Table 4.
| MDPI | Multidisciplinary Digital Publishing Institute |
| DOAJ | Directory of open access journals |
Author Contributions
M.T.M. carried out bacterial isolation and characterization, and drafted the manuscript. M.M. is a PhD Co-supervisor of M.T.M., collected root nodules and reviewed the manuscript. F.D.D. is PhD supervisor of M.T.M., secured funding for the research and approved the final manuscript. All authors have read and agreed to the published version of the manuscript.
Funding
This research was funded by the National Research Foundation, grant number MND20052552476, Tshwane University of Technology, and the South African Research Chair in Agrochemurgy and Plant Symbioses.
Data Availability Statement
Data are contained within the article.
Acknowledgments
We are grateful to Titus Ngmenzuma and Lebogang Msiza for assisting in taking gas-exchange measurements and Tshwane University of Technology, Department of Crop Sciences for technical and infrastructural assistance
Conflicts of Interest
The authors declare no conflicts of interest
The following abbreviations are used in this manuscript:
References
- Meena, I.; Meena, R.; Sharma, S.; Singh, D. Yield and Nutrient Uptake by Soybean as Influenced by Phosphorus and Sulphur Nutrition in Typic Haplustept. Madras Agricultural Journal 2015, 102, 1. [Google Scholar]
- MacCarthy, D.S.; Traore, P.S.; Freduah, B.S.; Adiku, S.G.K.; Dodor, D.E.; Kumahor, S.K. Productivity of Soybean under Projected Climate Change in a Semi-Arid Region of West Africa: Sensitivity of Current Production System. Agronomy 2022, 12, 2614. [Google Scholar] [CrossRef]
- MoFA-SRID. Facts & figures: Agriculture in Ghana, 2021. Statistics Research, and InformationDirectorate of Minister of Food and Agriculture.
- FAOSTAT. Food and Agriculture organization of the United Nations. Available online: https://www.fao.org/faostat/en/#data/QCL/visualize (accessed on 21 March 2024).
- Mitran, T.; Meena, R.S.; Lal, R.; Layek, J.; Kumar, S.; Datta, R. Role of soil phosphorus on legume production. Legumes for soil health and sustainable management 2018, 487–510. [Google Scholar]
- Ayuba, J.; Jaiswal, S.K.; Mohammed, M.; Denwar, N.N.; Dakora, F.D. Adaptability to local conditions and phylogenetic differentiation of microsymbionts of TGx soybean genotypes in the semi-arid environments of Ghana and South Africa. Systematic and Applied Microbiology 2021, 44, 126264. [Google Scholar] [CrossRef]
- Dlamini, S.T.; Jaiswal, S.K.; Mohammed, M.; Dakora, F.D. Studies of Phylogeny, Symbiotic Functioning and Ecological Traits of Indigenous Microsymbionts Nodulating Bambara Groundnut (Vigna subterranea L. Verdc) in Eswatini Microb. Ecol. 2021, 82, 688–703. [Google Scholar] [CrossRef]
- Mwenda, G.M.; Hill, Y.J.; O’Hara, G.W.; Reeve, W.G.; Howieson, J.G.; Terpolilli, J.J. Competition in the Phaseolus vulgaris-Rhizobium symbiosis and the role of resident soil rhizobia in determining the outcomes of inoculation. Plant and Soil 2023, 487, 61–77. [Google Scholar] [CrossRef] [PubMed]
- Kawaka, F.; Dida, M.M.; Opala, P.A.; Ombori, O.; Maingi, J.; Osoro, N.; Muthini, M.; Amoding, A.; Mukaminega, D.; Muoma, J. Symbiotic Efficiency of Native Rhizobia Nodulating Common Bean (Phaseolus vulgaris L.) in Soils of Western Kenya. International Scholarly Research Notices. [CrossRef]
- Kumar, A.; Verma, J.P. Does plant—microbe interaction confer stress tolerance in plants: a review? Microbiol. Res. 2018, 207, 41–52. [Google Scholar] [CrossRef]
- Sindhu, S.; Dahiya, A.; Gera, R.; Sindhu, S.S. Mitigation of abiotic stress in legume-nodulating rhizobia for sustainable crop production. Agricultural Research 2020, 9, 444–459. [Google Scholar]
- Mendoza-Suárez, M.; Andersen, S.U.; Poole, P.S.; Sánchez-Cañizares, C. Competition, Nodule Occupancy, and Persistence of Inoculant Strains: Key Factors in the Rhizobium-Legume Symbioses. Front Plant Sci 2021, 12, 690567. [Google Scholar] [CrossRef]
- Bationo, A.; Fening, J.O.; Kwaw, A. Assessment of soil fertility status and integrated soil fertility management in Ghana. Improving the Profitability, Sustainability and Efficiency of Nutrients Through Site Specific Fertilizer Recommendations in West Africa Agro-Ecosystems: Volume 1.
- Gopalakrishnan, S.; Sathya, A.; Vijayabharathi, R.; Varshney, R.K.; Gowda, C.L.; Krishnamurthy, L. Plant growth promoting rhizobia: challenges and opportunities. 3 Biotech 2015, 5, 355–377. [Google Scholar]
- Bouizgarne, B.; Oufdou, K.; Ouhdouch, Y. Actinorhizal and Rhizobial-Legume symbioses for alleviation. In Plant Microbes Symbiosis: Applied Facets; Springer New Delhi, India: 2014.
- Rasanen, L.A.; Lindstrom, K. Effects of biotic and abiotic constraints on the symbiosis between rhizobia and the tropical leguminous trees Acacia and Prosopis. Indian J. Exp. Biol. 2003, 41, 1142–1159. [Google Scholar]
- Ali, Q.; Shabaan, M.; Ashraf, S.; Kamran, M.; Zulfiqar, U.; Ahmad, M.; Zahir, Z.A.; Sarwar, M.J.; Iqbal, R.; Ali, B.; et al. Comparative efficacy of different salt tolerant rhizobial inoculants in improving growth and productivity of Vigna radiata L. under salt stress. Sci. Rep. 2023, 13, 17442. [Google Scholar] [CrossRef]
- Khaitov, B.; Kurbonov, A.; Abdiev, A.; Adilov, M. Effect of chickpea in association with Rhizobium to crop productivity and soil fertility. Eurasian Journal of Soil Science 2016, 5, 105–112. [Google Scholar]
- Bansal, M.; Kukreja, K.; Sunita, S.; Dudeja, S. Symbiotic effectivity of high temperature tolerant mungbean (Vigna radiata) rhizobia under different temperature conditions. Int. J. Curr. Microbiol. Appl. Sci 2014, 3, 807–821. [Google Scholar]
- Yuan, K.; Reckling, M.; Ramirez, M.D.A.; Djedidi, S.; Fukuhara, I.; Ohyama, T.; Yokoyama, T.; Bellingrath-Kimura, S.D.; Halwani, M.; Egamberdieva, D. Characterization of rhizobia for the improvement of soybean cultivation at cold conditions in central Europe. Microbes and environments 2020, 35, ME19124. [Google Scholar] [PubMed]
- del-Canto, A.; Sanz-Saez, Á.; Sillero-Martínez, A.; Mintegi, E.; Lacuesta, M. Selected indigenous drought tolerant rhizobium strains as promising biostimulants for common bean in Northern Spain. Frontiers in Plant Science 2023, 14. [Google Scholar] [CrossRef]
- Avelar Ferreira, P.A.; Bomfeti, C.A.; Lima Soares, B.; de Souza Moreira, F.M. Efficient nitrogen-fixing Rhizobium strains isolated from amazonian soils are highly tolerant to acidity and aluminium. World Journal of Microbiology and Biotechnology 2012, 28, 1947–1959. [Google Scholar] [CrossRef]
- Somasegaran, P.; Hoben, H.J. Handbook for rhizobia: methods in legume-Rhizobium technology; Springer Science & Business Media: 2012.
- Vincent, J.M. A manual for the practical study of the root-nodule bacteria. 1970.
- Pongslip, N. Phenotypic and genotypic diversity of rhizobia; Bentham Science Publishers: 2012.
- Makoi, J.H.J.R.; Chimphango, S.B.M.; Dakora, F.D. Photosynthesis, water-use efficiency and δ13C of five cowpea genotypes grown in mixed culture and at different densities with sorghum. Photosynthetica 2010, 48, 143–155. [Google Scholar] [CrossRef]
- Rai, V.; Sanagala, R.; Sinilal, B.; Yadav, S.; Sarkar, A.K.; Dantu, P.K.; Jain, A. Iron availability affects phosphate deficiency-mediated responses, and evidence of cross-talk with auxin and zinc in Arabidopsis. Plant Cell Physiol. 2015, 56, 1107–1123. [Google Scholar]
- Kebede, E.; Amsalu, B.; Argaw, A.; Tamiru, S. Symbiotic effectiveness of cowpea (Vigna unguiculata (L.) Walp.) nodulating rhizobia isolated from soils of major cowpea producing areas in Ethiopia. Cogent Food & Agriculture 2020, 6, 1763648. [Google Scholar]
- Purcino, H.; Festin, P.; Elkan, G. Identification of effective strains of Bradyrhizobium for Arachis pintoi. 2000.
- Ngwenya, Z.D.; Dakora, F.D. Symbiotic Functioning and Photosynthetic Rates Induced by Rhizobia Associated with Jack Bean (Canavalia ensiformis L.) Nodulation in Eswatini. Microorganisms 2023, 11, 2786. [Google Scholar] [CrossRef]
- Mariotti, A.; Germon, J.; Hubert, P.; Kaiser, P.; Letolle, R.; Tardieux, A.; Tardieux, P. Experimental determination of nitrogen kinetic isotope fractionation: some principles; illustration for the denitrification and nitrification processes. Plant and soil 1981, 62, 413–430. [Google Scholar]
- Farquhar, G.D.; Ehleringer, J.R.; Hubick, K.T. Carbon isotope discrimination and photosynthesis. Annu. Rev. Plant Biol. 1989, 40, 503–537. [Google Scholar]
- Pausch, R.C.; Mulchi, C.L.; Lee, E.H.; Forseth, I.N.; Slaughter, L.H. Use of 13C and 15N isotopes to investigate O3 effects on C and N metabolism in soybeans. Part I. C fixation and translocation. Agriculture, Ecosystems & Environment 1996, 59, 69–80. [Google Scholar] [CrossRef]
- Mohammed, M.A.; Chernet, M.T.; Tuji, F.A. Phenotypic, stress tolerance, and plant growth promoting characteristics of rhizobial isolates of grass pea. Int. Microbiol. 2020, 23, 607–618. [Google Scholar] [CrossRef]
- Susilowati, A.; Puspita, A.; Yunus, A. Drought resistant of bacteria producing exopolysaccharide and IAA in rhizosphere of soybean plant (Glycine max) in Wonogiri Regency Central Java Indonesia. In Proceedings of the IOP conference series: earth and environmental science; 2018; p. 012058. [Google Scholar]
- Guerrero-Castro, J.; Lozano, L.; Sohlenkamp, C. Dissecting the acid stress response of Rhizobium tropici CIAT 899. Front. Microbiol. 2018, 9, 846. [Google Scholar]
- Rejili, M.; Mahdhi, M.; Fterich, A.; Dhaoui, S.; Guefrachi, I.; Abdeddayem, R.; Mars, M. Symbiotic nitrogen fixation of wild legumes in Tunisia: Soil fertility dynamics, field nodulation and nodules effectiveness. Agriculture, ecosystems & environment 2012, 157, 60–69. [Google Scholar]
- Grönemeyer, J.L.; Kulkarni, A.; Berkelmann, D.; Hurek, T.; Reinhold-Hurek, B. Rhizobia indigenous to the Okavango region in Sub-Saharan Africa: diversity, adaptations, and host specificity. Applied and environmental microbiology 2014, 80, 7244–7257. [Google Scholar] [CrossRef]
- Ngwenya, Z.D.; Mohammed, M.; Jaiswal, S.K.; Dakora, F.D. Phylogenetic relationships among Bradyrhizobium species nodulating groundnut (Arachis hypogea L.), jack bean (Canavalia ensiformis L.) and soybean (Glycine max Merr.) in Eswatini. Sci. Rep. 2022, 12, 10629. [Google Scholar]
- Gyogluu, C.; Mohammed, M.; Jaiswal, S.K.; Kyei-Boahen, S.; Dakora, F.D. Assessing host range, symbiotic effectiveness, and photosynthetic rates induced by native soybean rhizobia isolated from Mozambican and South African soils. Symbiosis 2018, 75, 257–266. [Google Scholar] [CrossRef]
- Mohammed, M.; Jaiswal, S.K.; Dakora, F.D. Distribution and correlation between phylogeny and functional traits of cowpea (Vigna unguiculata L. Walp.)-nodulating microsymbionts from Ghana and South Africa. Sci. Rep. 2018, 8, 18006. [Google Scholar]
- Osei, O.; Abaidoo, R.C.; Ahiabor, B.D.K.; Boddey, R.M.; Rouws, L.F.M. Bacteria related to Bradyrhizobium yuanmingense from Ghana are effective groundnut micro-symbionts. Appl Soil Ecol 2018, 127, 41–50. [Google Scholar] [CrossRef] [PubMed]
- Belane, A.K.; Dakora, F.D. Assessing the relationship between photosynthetic C accumulation and symbiotic N nutrition in leaves of field-grown nodulated cowpea (Vigna unguiculata L. Walp.) genotypes. Photosynthetica 2015, 53, 562–571. [Google Scholar]
- Parvin, S.; Uddin, S.; Tausz-Posch, S.; Armstrong, R.; Tausz, M. Carbon sink strength of nodules but not other organs modulates photosynthesis of faba bean (Vicia faba) grown under elevated [CO2] and different water supply. New Phytol. 2020, 227, 132–145. [Google Scholar]
- Phillips, D.A.; Joseph, C.M.; Yang, G.-P.; Martínez-Romero, E.; Sanborn, J.R.; Volpin, H. Identification of lumichrome as a Sinorhizobium enhancer of alfalfa root respiration and shoot growth. Proceedings of the national academy of sciences 1999, 96, 12275–12280. [Google Scholar]
- Matiru, V.; Dakora, F. Xylem transport and shoot accumulation of lumichrome, a newly recognized rhizobial signal, alters root respiration, stomatal conductance, leaf transpiration and photosynthetic rates in legumes and cereals. New Phytol. 2005, 165, 847–855. [Google Scholar]
- Matiru, V.N.; Dakora, F.D. The rhizosphere signal molecule lumichrome alters seedling development in both legumes and cereals. New Phytol. 2005, 166, 439–444. [Google Scholar]
- Dakora, F.D.; Matiru, V.; Kanu, A.S. Rhizosphere ecology of lumichrome and riboflavin, two bacterial signal molecules eliciting developmental changes in plants. Frontiers in plant science 2015, 6, 146621. [Google Scholar]
- Mohammed, M.; Mbah, G.C.; Sowley, E.N.; Dakora, F.D. Cowpea Genotypic Variations in N2 Fixation, Water Use Efficiency (δ13C), and Grain Yield in Response to Bradyrhizobium Inoculation in the Field, Measured Using Xylem N Solutes, 15N, and 13C Natural Abundance. Frontiers in Agronomy 2022, 4, 1. [Google Scholar]
- Bhargava, Y.; Murthy, J.; Kumar, T.R.; Rao, M.N. Phenotypic, stress tolerance and plant growth promoting characteristics of rhizobial isolates from selected wild legumes of semiarid region, Tirupati, India. Advances in Microbiology 2016, 6, 1–12. [Google Scholar]
- Mhadhbi, H.; Chihaoui, S.; Mhamdi, R.; Mnasri, B.; Jebara, M. A highly osmotolerant rhizobial strain confers a better tolerance of nitrogen fixation and enhances protective activities to nodules of Phaseolus vulgaris under drought stress. African Journal of Biotechnology 2011, 10, 4555–4563. [Google Scholar]
- Li, D.; Gao, Y. Hydrogen Ion Concentration Index of Culture Media. In Quality Management in the Assisted Reproduction Laboratory; Springer Nature Singapore: Singapore, 2024; pp. 37–47. [Google Scholar]
- Oliveira, A.N.d.; Oliveira, L.A.d.; Andrade, J.S. Production and some properties of crude alkaline proteases of indigenous Central Amazonian rhizobia strains. Brazilian Archives of Biology and Technology 2010, 53, 1185–1195. [Google Scholar] [CrossRef]
- Adhikari, D.; Kaneto, M.; Itoh, K.; Suyama, K.; Pokharel, B.B.; Gaihre, Y.K. Genetic diversity of soybean-nodulating rhizobia in Nepal in relation to climate and soil properties. Plant and Soil 2012, 357, 131–145. [Google Scholar] [CrossRef]
- Yan, J.; Han, X.Z.; Ji, Z.J.; Li, Y.; Wang, E.T.; Xie, Z.H.; Chen, W.F. Abundance and diversity of soybean-nodulating rhizobia in black soil are impacted by land use and crop management. Applied and Environmental Microbiology 2014, 80, 5394–5402. [Google Scholar] [CrossRef]
Figure 1.
Classification of 31 native rhizobial isolates based on percent relative symbiotic effectiveness.
Figure 1.
Classification of 31 native rhizobial isolates based on percent relative symbiotic effectiveness.
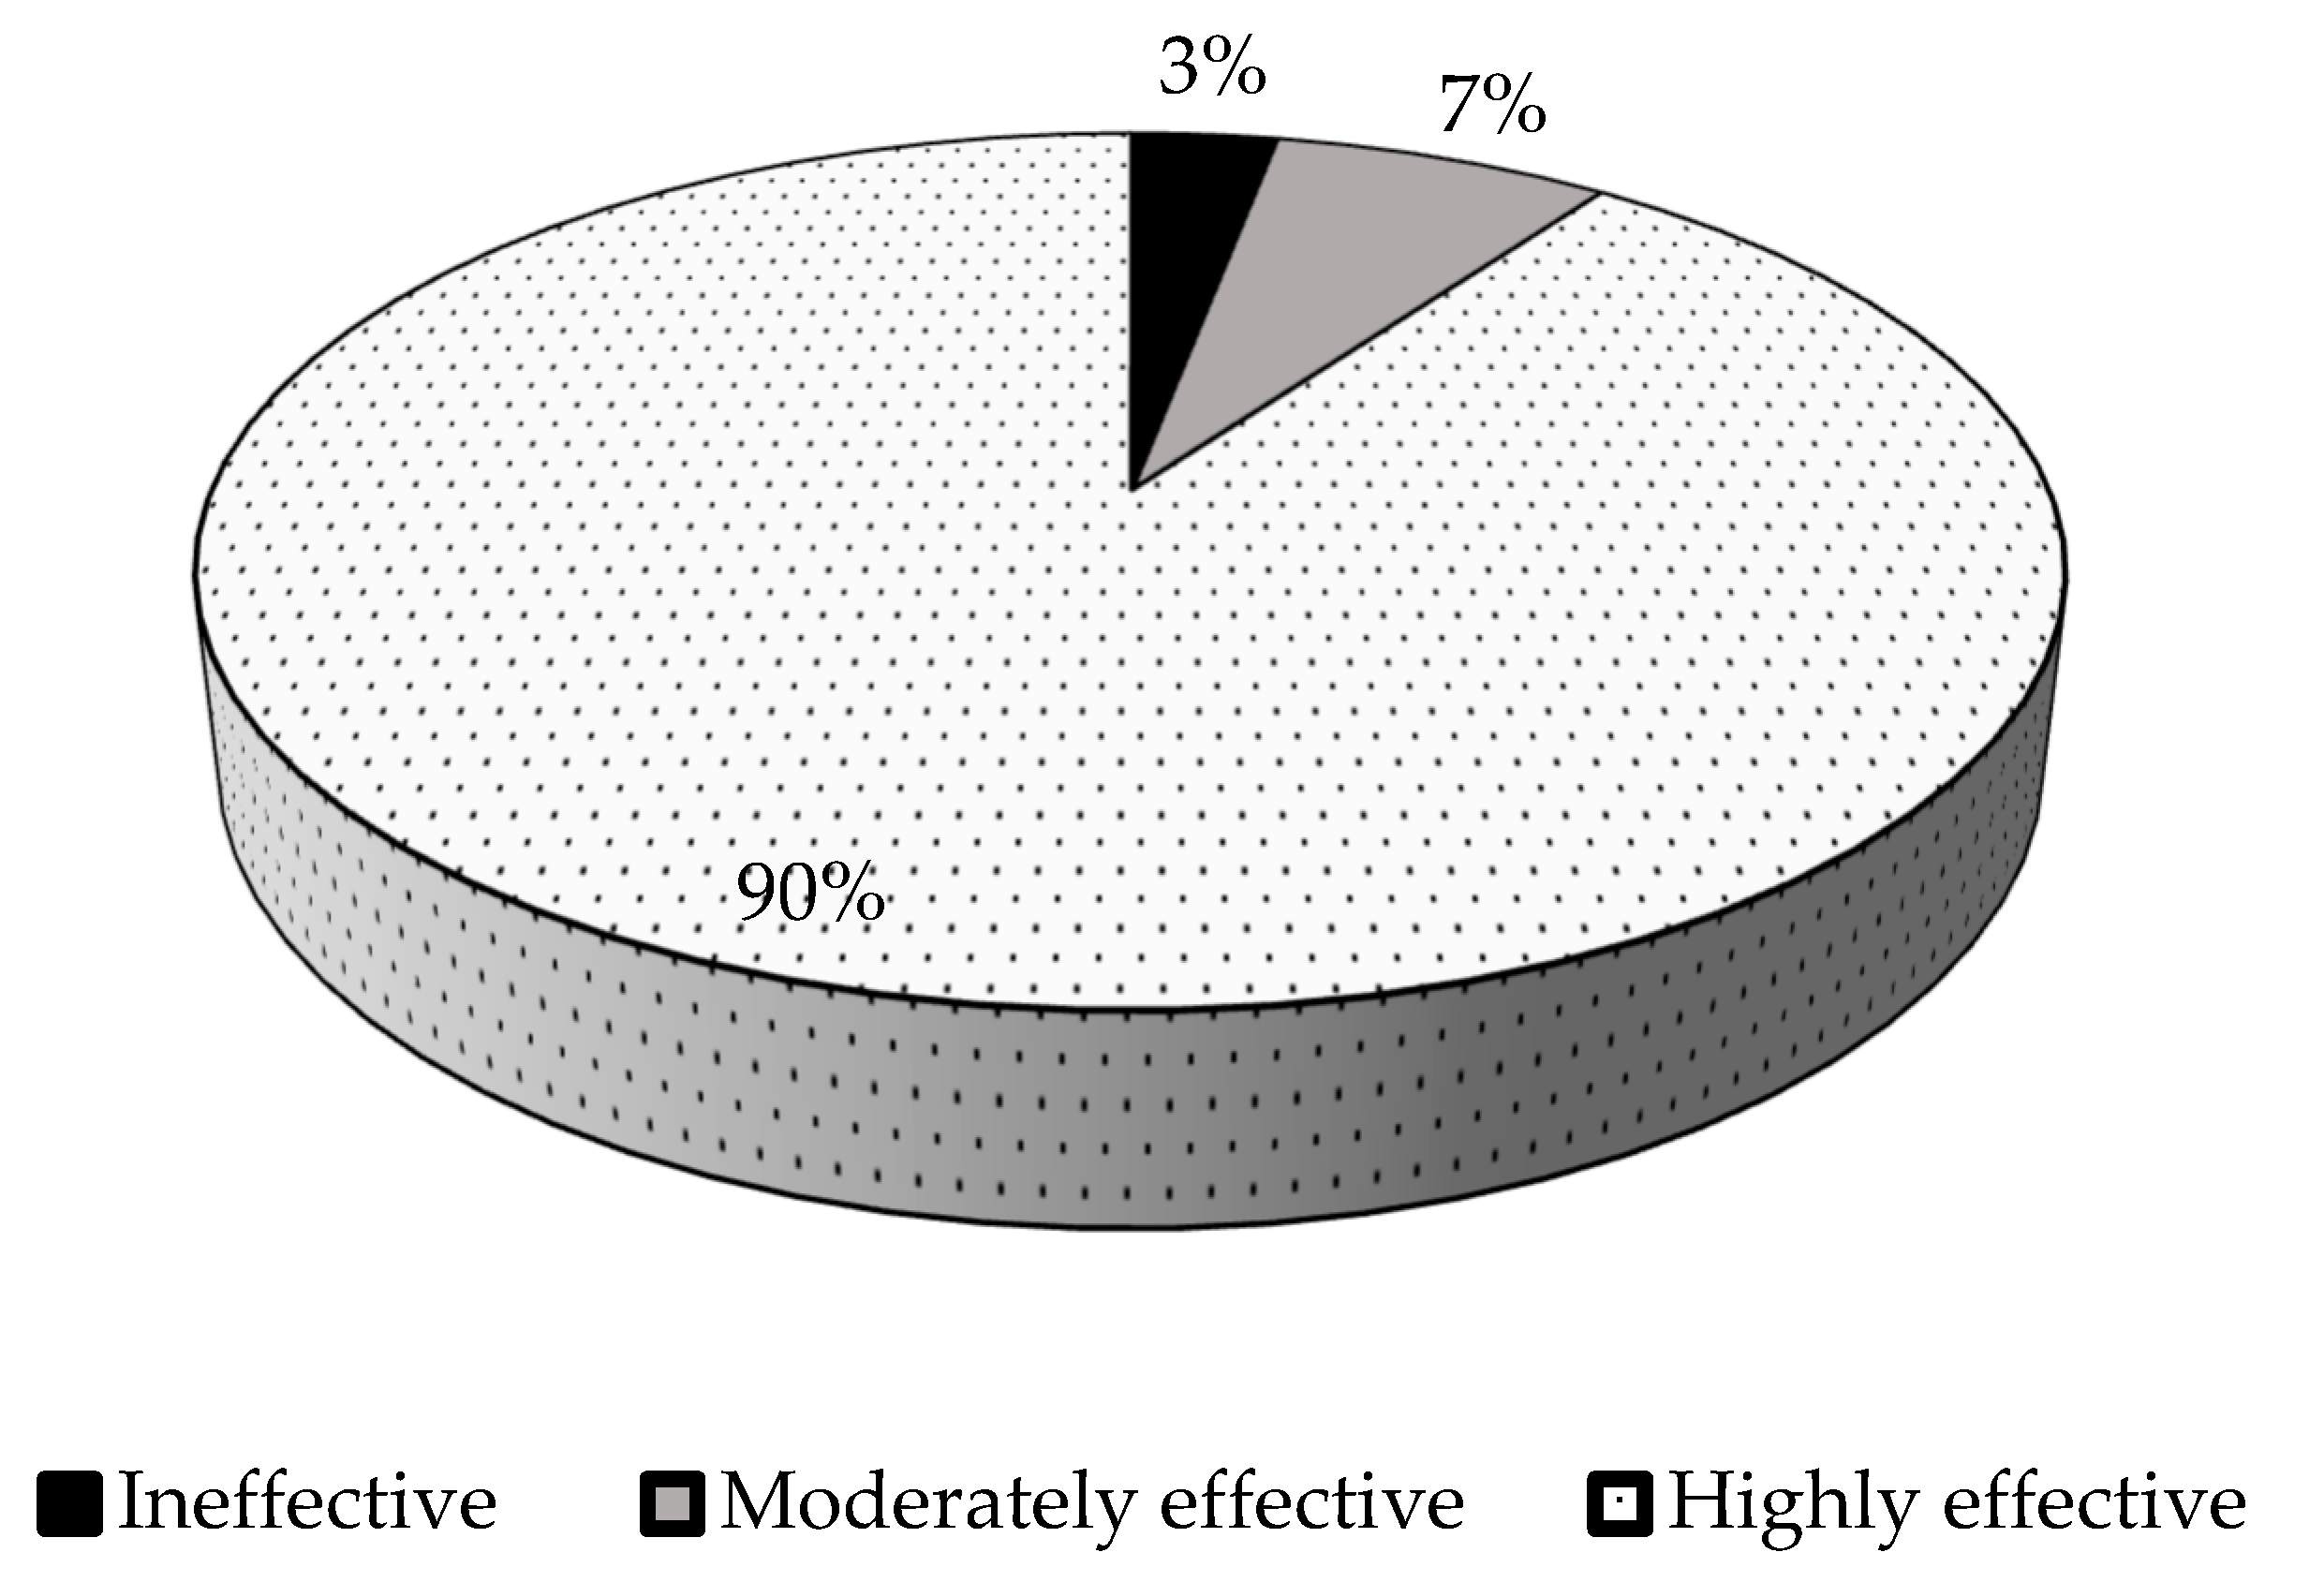
Figure 2.
Phenotypic characterisation of 31 soybean rhizobial isolates.
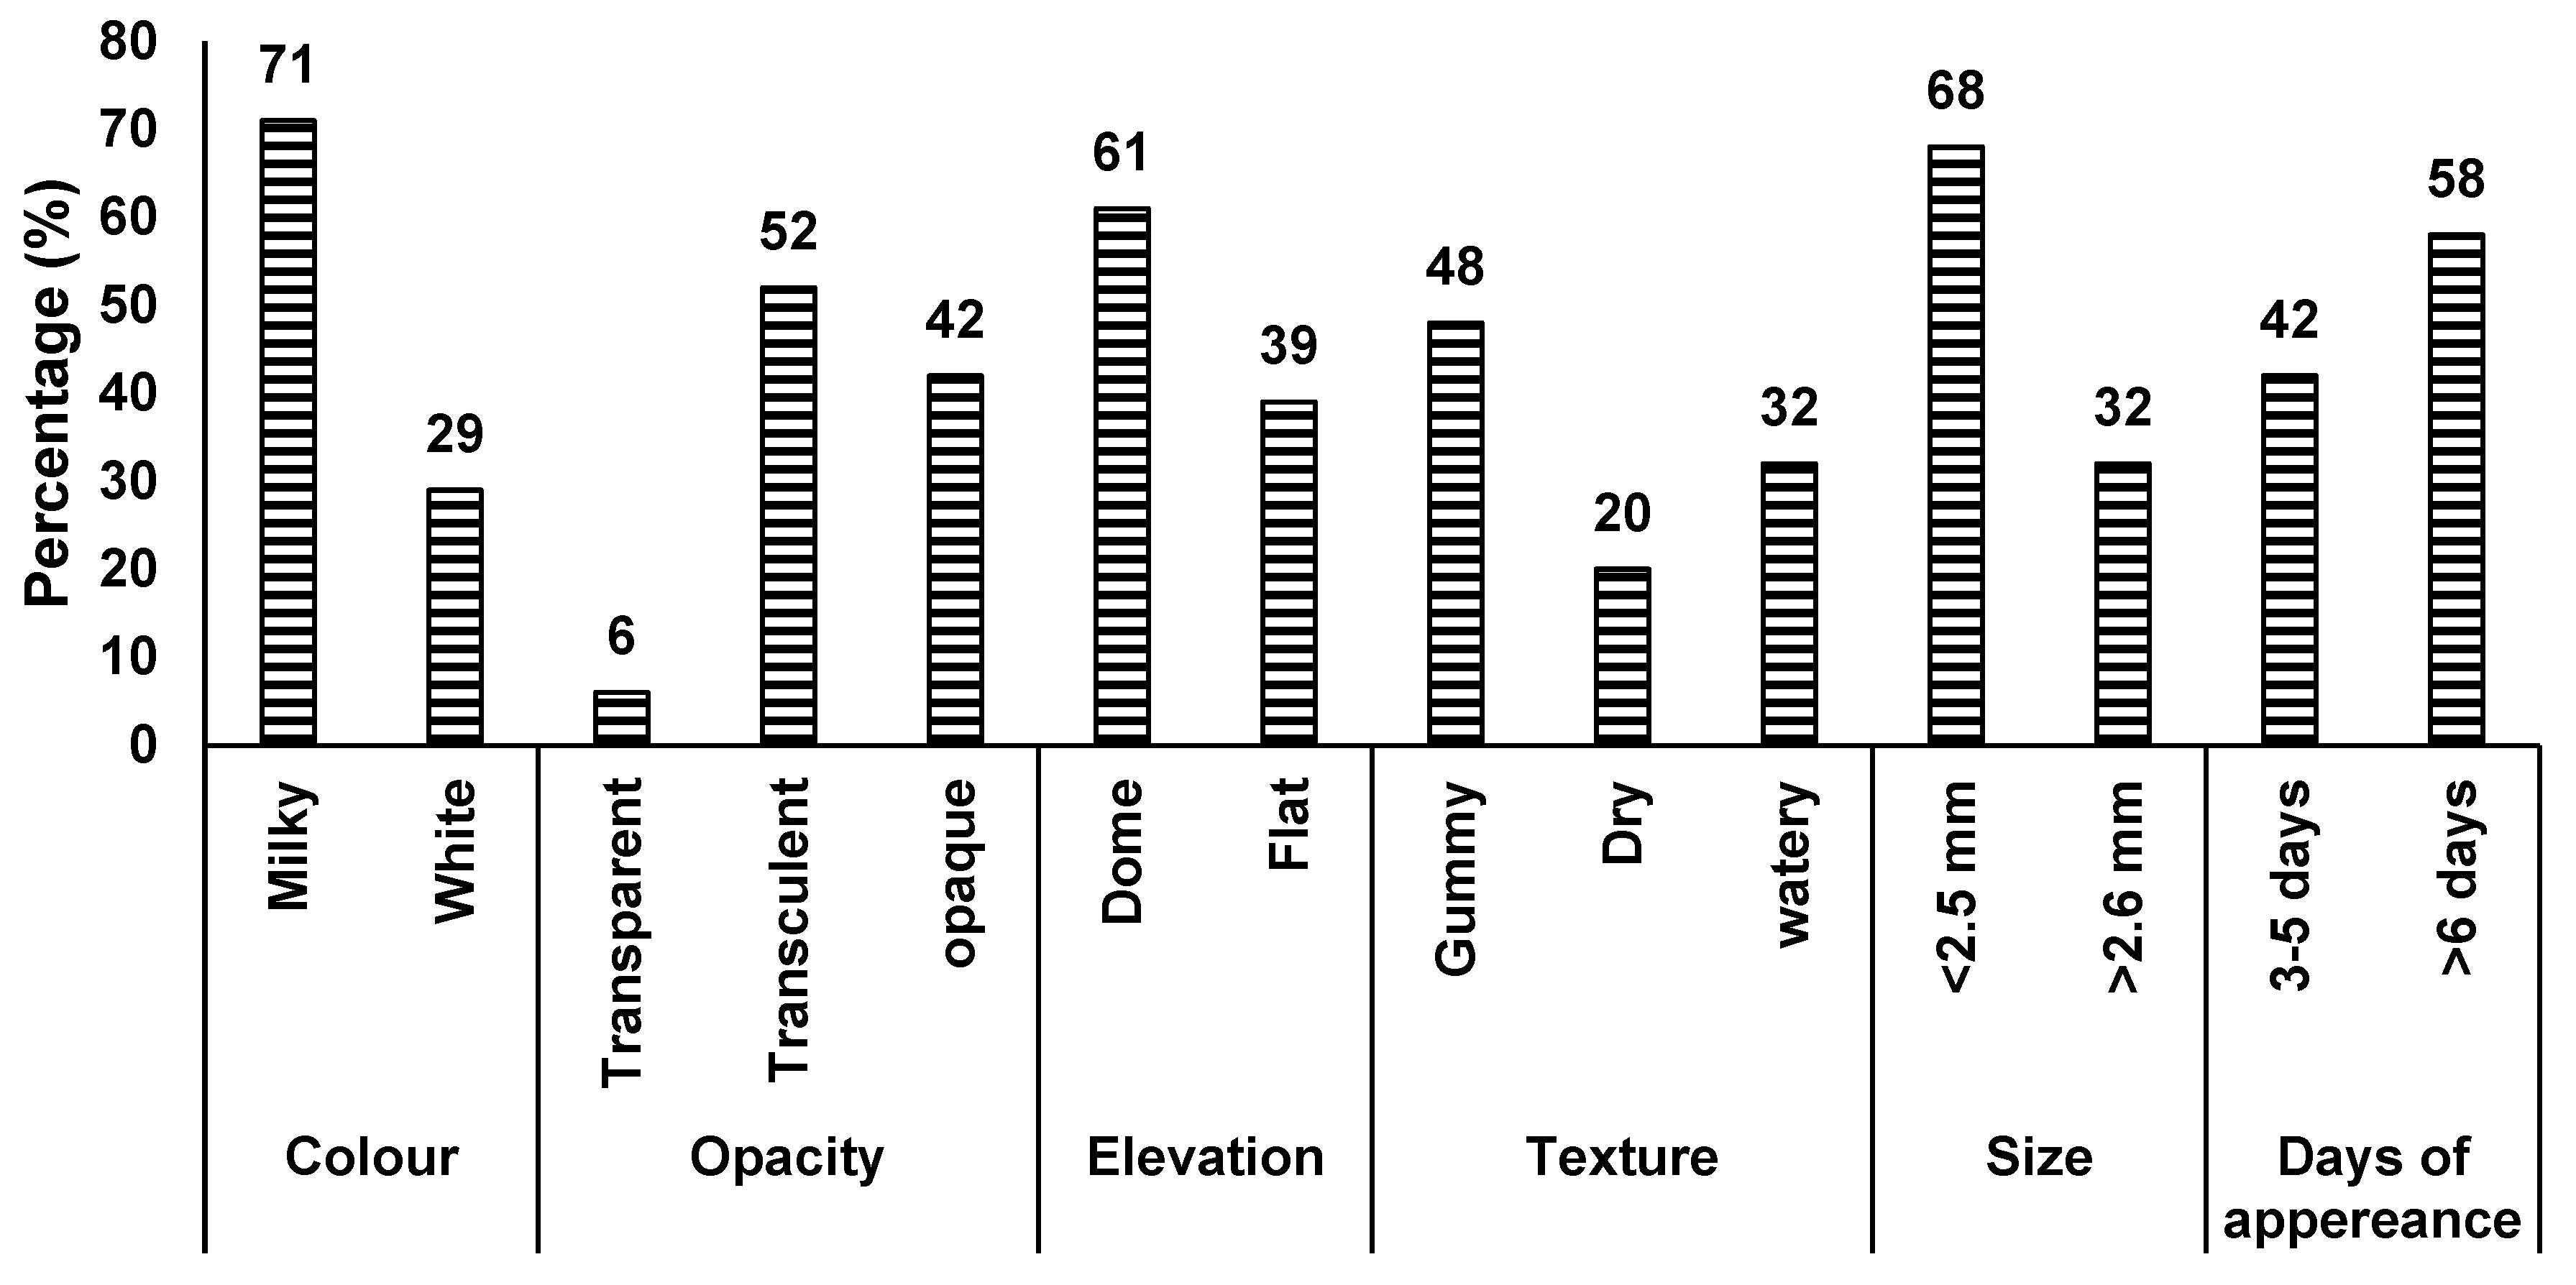
Figure 3.
Growth response of soybean isolates to pH levels.
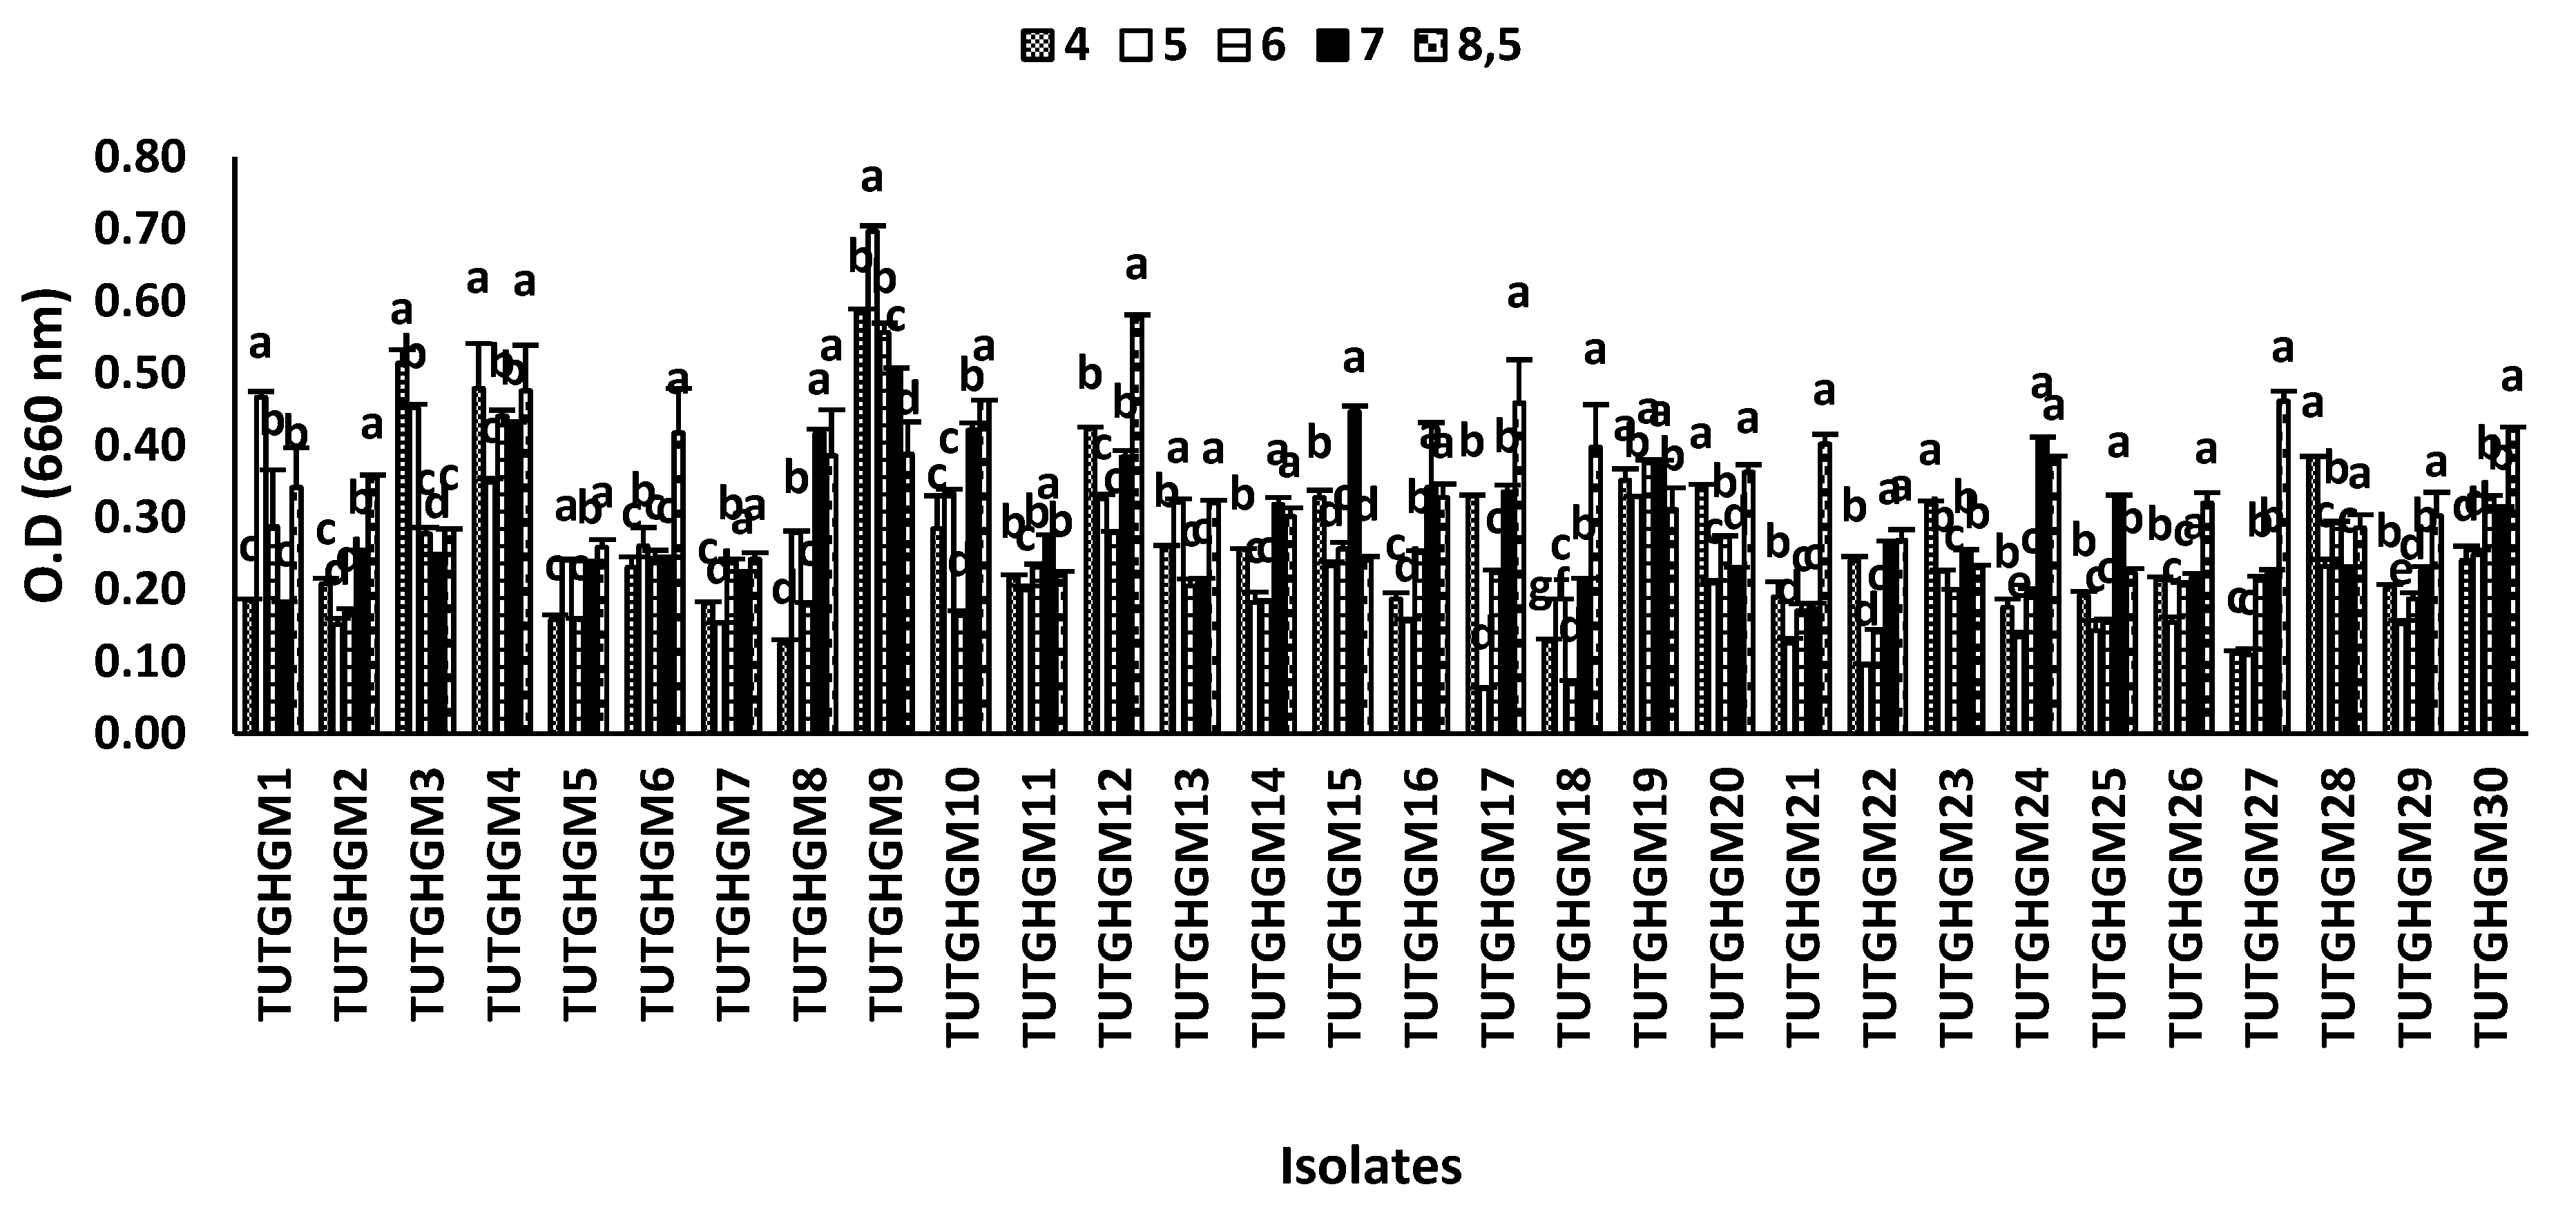

Table 1.
Effect of 31 rhizobial inoculation and nitrate-feeding on leaf gas-exchange of soybean plants. Values (mean± S.E.) followed by dissimilar letters are significant at **p ≤ 0.01 or ***p ≤ 0.001.
Table 1.
Effect of 31 rhizobial inoculation and nitrate-feeding on leaf gas-exchange of soybean plants. Values (mean± S.E.) followed by dissimilar letters are significant at **p ≤ 0.01 or ***p ≤ 0.001.
| Isolates | A | Gs | Ci | E | Ci/Ca | WUEi |
| µmol (CO2) m-2s-1 |
mol(H2O) m-2s-1 |
µmol(CO2) molair-1 |
mol(H2O) m-2s-1 |
µmol(CO2) mol-1(H2O) |
||
| TUTGMGH1 | 11.34±0.76d-l | 0.16±0.01j-m | 257.38±1.38fg | 5.41±0.07ij | 0.65±0.01i-j | 70.36±2.43bc |
| TUTGMGH2 | 12.48±0.40fg | 0.26±0.01edf | 285.89±3.89a-d | 7.81±0.21d-h | 0.74±0.01a-e | 48.30±2.11d-g |
| TUTGMGH3 | 11.59±0.01g-k | 0.19±0.02hij | 277.25±5.98a-f | 6.12±0.44g-j | 0.72±0.01a-i | 63.80±7.59b-e |
| TUTGMGH4 | 14.81±0.07bc | 0.33±0.0001b | 285.99±0.27a-d | 9.09±0.01bcd | 0.75±0.001abc | 44.54±0.13hij |
| TUTGMGH5 | 10.62±0.12j-m | 0.18±0.03h-l | 261.91±21.91d-g | 9.84±2.46cd | 0.67±0.06g-j | 65.69±16.51bcd |
| TUTGMGH6 | 11.81±0.01ghi | 0.30±0.03c | 290.18±0.66ab | 7.97±0.001c-g | 0.76±0.003ab | 40.49±3.49ij |
| TUTGMGH7 | 11.26±0.02h-m | 0.27±0.003cd | 290.69±3.60ab | 8.29±0.004b-f | 0.75±0.01abc | 41.29±0.54ij |
| TUTGMGH8 | 16.16±0.63a | 0.39±0.03a | 285.08±0.25a-e | 12.62±0.01a | 0.76±0.003ab | 41.06±1.20ij |
| TUTGMGH9 | 13.05±0.10ef | 0.21±0.01ghi | 266.68±5.76b-h | 7.40±0.04c-h | 0.70±0.01b-j | 62.08±2.23b-f |
| TUTGMGH10 | 12.44±0.31fg | 0.24±0.01efg | 271.05±1.85a-f | 8.12±0.35c-f | 0.71±0.01a-i | 53.08±1.38b-i |
| TUTGMGH11 | 16.18±0.01a | 0.39±0.001a | 286.22±0.18a-d | 10.11±0.01b | 0.76±0.001ab | 41.57±0.11ij |
| TUTGMGH12 | 9.03±0.73o | 0.14±0.002lm | 260.12±9.90efg | 6.01±0.06hij | 0.67±0.02f-j | 62.60±5.87b-f |
| TUTGMGH13 | 11.78±0.74g-j | 0.23±0.01efg | 274.35±1.67a-g | 8.74±0.10b-e | 0.70±0.001a-i | 50.58±0.47e-j |
| TUTGMGH14 | 10.94±0.00h-m | 0.27±0.001cde | 283.46±7.89a-e | 8.38±1.22b-f | 0.74±0.02a-d | 40.83±0.16ij |
| TUTGMGH15 | 9.25±0.04no | 0.13±0.01mn | 243.343±10.34gh | 7.19±1.25d-i | 0.63±0.02j | 71.59±6.07b |
| TUTGMGH16 | 10.15±0.08mn | 0.17±0.003i-l | 263.78±3.02c-g | 7.09±0.13e-i | 0.69±0.01c-j | 58.43±1.51c-g |
| TUTGMGH17 | 10.96±0.38h-m | 0.25±0004def | 288.84±3.23abc | 8.41±0.03b-f | 0.76±0.01ab | 43.13±1.53ij |
| TUTGMGH18 | 7.76±0.08p | 0.15±0.0001klm | 281.28±0.91a-f | 7.24±0.002c-i | 0.71±0.002a-i | 51.77±0.57-i |
| TUTGMGH19 | 11.44±0.36g-l | 0.28±0.003cd | 293.69±2.53a | 8.67±0.32b-e | 0.77±0.02a | 41.01±0.85ij |
| TUTGMGH20 | 7.86±0.02p | 0.21±0.01kmn | 294.82±3.90a | 7.84±0.06d-h | 0.76±0.01ab | 37.63±1.68j |
| TUTGMGH21 | 10.40±0.29lm | 0.15±0.002klm | 230.75±16.97h | 6.12±0.002g-j | 0.61±0.04e-j | 70.88±2.75bc |
| TUTGMGH22 | 15.71±0.35ab | 0.30±0.0014c | 272.51±2.23a-g | 7.79±0.11d-h | 0.71±0.07a-i | 52.62±0.54e-i |
| TUTGMGH23 | 12.04±0.29fgh | 0.25±0.02def | 276.83±6.81a-f | 8.34±0.02b-f | 0.76±0.004ab | 47.90±2.15g-j |
| TUTGMGH24 | 13.57±0.42de | 0.21±0.002gh | 262.06±4.01b-g | 7.91±0.16-h | 0.67±0.01f-j | 63.60±1.42b-e |
| TUTGMGH25 | 13.07±0.19ef | 0.18±0.002h-k | 265.45±1.68b-g | 6.49±0.04f-j | 0.66±0.01hij | 71.43±1.26b |
| TUTGMGH26 | 10.58±0.19jkl | 0.11±0.001n | 209.91±3.81i | 4.80±0.03jk | 0.53±0.010j | 97.09±2.40a |
| TUTGMGH27 | 11.46±0.01g-l | 0.20±0.001ghi | 245.10±20.48gh | 7.40±0.54d-h | 0.64±0.06j | 56.32±0.23d-h |
| TUTGMGH28 | 11.403±0.08g-l | 0.22±0.002fg | 279.53±0.97a-f | 7.18±0.05d-i | 0.73±0.002a-h | 50.81±0.70f-i |
| TUTGMGH29 | 10.67±0.17i-m | 0.23±0.001fg | 279.44±0.07a-f | 8.24±0.50b-f | 0.74±0.02a-f | 46.63±0.63d-j |
| TUTGMGH30 | 14.74±0.71bc | 0.20±0.002ghi | 259.90±6.45efg | 7.79±0.47d-h | 0.64±0.02j | 72.20±3.08b |
| TUTGMGH31 | 11.49±0.28g-l | 0.18±0.001h-l | 265.91±8.97b-g | 7.68±0.57d-h | 0.68±0.02d-j | 64.15±0.68b-e |
|
Bradyrhizobium strain WB74 |
15.59±0.03bc | 0.37±0.001a | 279.293±0.24a-f | 12.10±0.01a | 0.75±0.001a-d | 42.39±0.18ij |
| Uninoculated | 2.64±0.26q | 0.07±0.0002o | 293.67±0.69a | 3.58±0.01i | 0.76±0.019ab | 40.43±4.08ij |
| 5 mM KNO3 | 14.47±0.53cd | 0.21±0.001ghi | 256.56±4.31fg | 8.81±0.29b-e | 0.72±0.002a-i | 70.34±2.60bc |
| F- statistics | 59.32** | 46.96** | 6.66*** | 9.72*** | 6.99*** | 12.68** |
Table 2.
Plant growth, shoot C accumulation and δ13C of soybean inoculated with different rhizobial isolates. Values (mean± S.E.) followed by dissimilar letters are significant at **p ≤ 0.01 or ***p ≤ 0.001.
Table 2.
Plant growth, shoot C accumulation and δ13C of soybean inoculated with different rhizobial isolates. Values (mean± S.E.) followed by dissimilar letters are significant at **p ≤ 0.01 or ***p ≤ 0.001.
| Isolates | Shoot dry matter | Root dry matter | Total biomass | C concentration | C content | δ13C | C:N ratio |
| g plant-1 | g plant-1 | g plant-1 | % | g plant-1 | ‰ | g.g-1 | |
| TUTGMGH1 | 1.72±0.09a-d | 0.64±0.03b-e | 2.36±0.13bc | 43.30±0.05fgh | 74.48±4.05ab | -27.52±0.01e-i | 18.31±0.04c-g |
| TUTGMGH2 | 1.44±0.03c-h | 0.50±0.05c-g | 1.94±0.07c-k | 43.27±0.03f-i | 62.16±1.22b-k | -27.95±0.02mn | 17.99±0.03c-i |
| TUTGMGH3 | 1.74±0.09abc | 0.51±0.01c-g | 2.25±0.11c-f | 43.42±0.28d-g | 75.58±4.29bc | -27.51±0.01d-h | 18.59±0.18c-g |
| TUTGMGH4 | 1.32±0.23e-l | 0.37±0.01fgh | 1.69±0.26h-l | 42.99±0.13ij | 56.83±10.89d-m | -27.65±0.06h-k | 17.40±0.02e-l |
| TUTGMGH5 | 1.22±0.05h-l | 0.35±0.01gh | 1.57±0.05g-k | 43.37±0.06efg | 52.92±2.07h-m | -28.11±0.03no | 17.33±0.11e-l |
| TUTGMGH6 | 1.49±0.07c-j | 0.85±0.18b | 2.33±0.19bcd | 43.81±0.09bc | 65.14±3.01b-j | -27.74±0.03jkl | 17.55±0.27d-l |
| TUTGMGH7 | 1.54±0.01b-i | 0.50±0.04-g | 2.03±0.03c-h | 43.72±0.03bcd | 67.19±0.35c-g | -28.07±0.01no | 15.57±0.10l |
| TUTGMGH8 | 1.27±0.14f-l | 0.45±0.02d-h | 1.59±0.05d-j | 42.82±0.10jk | 54.37±6.13g-m | -28.13±0.06o | 16.54±0.45g-l |
| TUTGMGH9 | 1.61±0.19b-f | 0.62±0.01b-e | 2.23±0.19b-e | 43.27±0.09f-i | 69.64±8.01b-e | -27.19±0.04a | 16.69±0.10f-l |
| TUTGMGH10 | 1.08±0.02l | 0.39±0.01e-h | 1.47±0.01lmn | 42.76±0.016jk | 46.04±0.86lm | -27.67±0.03h-l | 16.17±0.10h-m |
| TUTGMGH11 | 1.53±0.05b-i | 0.37±0.02fgh | 1.90±0.04d-k | 43.69±0.11bcd | 66.85±2.11c-g | -27.25±0.02ab | 17.07±0.28e-l |
| TUTGMGH12 | 1.38±0.03d-k | 0.57±0.02c-g | 1.95±0.05c-k | 43.44±0.02d-g | 59.81±1.40i-m | -27.76±0.07jkl | 19.54±0.24cd |
| TUTGMGH13 | 1.21±0.08i-l | 0.52±0.002c-g | 1.73±0.08g-l | 42.86±0.011j | 51.86±3.23g-k | -27.69±0.01i-l | 21.54±0.07b |
| TUTGMGH14 | 0.45±0.05mn | 0.23±0.01h | 0.68±0.05n | 43.66±0.11b-e | 19.44±2.42mn | -27.60±0.05g-j | 19.86±1.04bc |
| TUTGMGH15 | 1.23±0.09g-l | 0.61±0.003c-f | 1.84±0.09e-l | 43.45±0.09d-g | 53.43±3.96h-l | -27.38±0.09b-f | 19.87±0.17bc |
| TUTGMGH16 | 1.54±0.03b-i | 0.61±0.01c-f | 2.15±0.04c-g | 43.01±0.13hij | 66.24±1.60b-i | -27.85±0.01lm | 16.04±0.09i-l |
| TUTGMGH17 | 1.57±0.01b-h | 0.67±0.08bcd | 1.90±0.40c-f | 43.56±0.01c-f | 68.25±0.28b-g | -27.40±0.02b-f | 18.78±0.36bcd |
| TUTGMGH18 | 0.72±0.01m | 0.42±0.05d-h | 1.14±0.04n | 42.53±0.35kl | 30.48±0.38no | -27.97±0.05mno | 18.67±0.37c-f |
| TUTGMGH19 | 1.56±0.07b-i | 0.60±0.01c-f | 2.16±0.06c-h | 43.32±0.07fg | 67.43±2.83b-h | -27.35±0.02a-e | 17.68±2.09d-k |
| TUTGMGH20 | 1.62±0.04b-f | 0.61±0.03c-f | 2.23±0.07c-f | 43.81±0.03bc | 70.97±1.74a-d | -27.82±0.03klm | 15.68±0.68kl |
| TUTGMGH21 | 1.99±0.10a | 0.72±0.02bc | 2.70±0.12ab | 42.77±0.03jk | 84.98±4.38a | -27.37±0.03b-f | 17.05±0.10e-l |
| TUTGMGH22 | 1.17±0.09jkl | 0.64±0.09b-e | 1.80±0.15f-l | 41.88±0.06m | 48.87±3.73jkl | -27.45±0.05c-g | 17.18±0.04e-l |
| TUTGMGH23 | 1.55±0.10c-g | 0.52±0.07c-g | 2.07±0.15c-h | 43.35±0.15efg | 70.75±2.02a-d | -28.44±0.04q | 16.03±1.29i-l |
| TUTGMGH24 | 1.61±0.02b-f | 0.51±0.12c-g | 2.11±0.11c-i | 44.42±0.09a | 71.36±0.84a-d | -27.24±0.01ab | 18.61±0.36e-g |
| TUTGMGH25 | 1.30±0.03e-k | 0.61±0.05c-f | 1.91±0.02d-k | 42.43±0.05l | 55.02±1.38e-l | -28.29±0.04p | 15.91±0.50jkl |
| TUTGMGH26 | 0.60±0.32mn | 0.60±0.23c-f | 1.20±0.44mn | 43.21±0.12ghi | 26.00±13.95mn | -27.33±0.02abc | 16.87±0.58e-l |
| TUTGMGH27 | 1.48±0.15c-j | 0.53±0.02c-g | 2.00±0.14c-j | 42.84±0.04j | 63.25±6.52b-j | -27.34±0.01a-d | 16.86±0.58e-l |
| TUTGMGH28 | 1.54±0.15b-i | 0.58±0.09c-g | 2.12±0.20c-h | 43.90±0.03b | 67.76±6.50b-h | -27.54±0.01f-i | 17.55±0.29d-l |
| TUTGMGH29 | 1.48±0.02c-k | 0.45±0.01d-h | 1.93±0.01c-k | 44.30±0.02a | 65.56±0.74b-h | -27.74±0.01jkl | 17.54±0.67d-l |
| TUTGMGH30 | 1.58±0.09b-f | 0.72±0.05bc | 2.30±0.04bcd | 43.83±0.01bc | 69.23±3.79b-f | -27.66±0.10h-k | 17.84±0.13d-j |
| TUTGMGH31 | 1.13±0.04kl | 0.41±0.12-h | 1.54±0.07klm | 42.84±0.04j | 48.26±1.83klm | -27.34±0.11a-d | 16.86±0.58e-l |
|
Bradyrhizobium strain WB74 |
1.07±0.001l | 0.57±0.04c-g | 1.64±0004i-m | 43.88±0.01b | 46.95±0.02l | -29.55±0.06r | 21.59±0.08b |
| Uninoculated | 0.33±0.01n | 0.22±0.07h | 0.54±0.07o | 40.15±0.02n | 13.12±0.30n | -27.77±0.09jkl | 18.15±0.98c-i |
| 5 mM KNO3 | 1.85±0.07ab | 1.13±0.08a | 2.97±0.07a | 41.77±0.01m | 77.14±2.78ab | -27.75±0.01jkl | 23.59±0.1.71a |
| F-statistics | 13.50** | 5.74*** | 15.74** | 68.00** | 13.18** | 70.00** | 8.90*** |
Table 3.
Nodulation, relative symbiotic effectiveness and N fixation of soybean inoculated with different rhizobial isolates. Values (mean± S.E.) followed by dissimilar letters are significant at **p ≤ 0.01 or ***p ≤ 0.001, NA = not applicable.
Table 3.
Nodulation, relative symbiotic effectiveness and N fixation of soybean inoculated with different rhizobial isolates. Values (mean± S.E.) followed by dissimilar letters are significant at **p ≤ 0.01 or ***p ≤ 0.001, NA = not applicable.
| Isolates | Nodule number | Nodule fresh weight | Relative symbiotic effectiveness | N concentration | N content | δ15N | N-fixed |
| per plant | g plant-1 | % | % | g plant-1 | ‰ | g plant-1 | |
| TUTGMGH1 | 19±0.88hij | 0.64±0.01a | 161±8.63ab | 2.36±0.01f-i | 4.07±0.23b-e | -2.02±0.02f-i | 3.82±0.23b-e |
| TUTGMGH2 | 10±0.58k | 0.52±0.003abc | 134±2.55b-i | 2.41±0.02d-i | 3.46±0.06c-h | -2.08±0.05f-k | 3.21±0.06c-h |
| TUTGMGH3 | 37±1.15ab | 0.44±0.02c-f | 163±8.63ab | 2.25±0.02ghi | 3.91±0.19b-f | -1.76±0.05d | 3.66±0.19b-f |
| TUTGMGH4 | 30±1.15b-e | 0.61±0.01ab | 124±24.07d-j | 2.53±0.03b-h | 3.36±0.70c-h | -2.15±0.05g-l | 3.11±0.70c-h |
| TUTGMGH5 | 25±6.35e-i | 0.34±0.002f-i | 114±4.32f-j | 2.52±0.03b-h | 3.07±0.14fgh | -1.94±0.02d-g | 2.82±0.14fgh |
| TUTGMGH6 | 18±0.58h-j | 0.52±0.001bc | 139±6.14b-h | 2.60±0.01b-f | 3.87±0.18b-f | -1.95±0.02d-g | 3.62±0.18b-f |
| TUTGMGH7 | 20±6.69g-j | 0.42±0.02c-g | 144±0.82b-g | 2.72±0.03abc | 4.18±0.03a-d | -2.28±0.01jkl | 3.93±0.03a-d |
| TUTGMGH8 | 24±1.73-j | 0.44±0.01c-f | 119±1.49e-j | 2.61±0.07b-f | 3.31±0.40d-h | -2.35±0.01l | 3.06±0.40d-h |
| TUTGMGH9 | 35±5.77abc | 0.51±0.10bcd | 150±17.59b-e | 2.59±0.02b-f | 4.16±0.45a-d | -2.17±0.02g-l | 3.91±0.45a-d |
| TUTGMGH10 | 16±0.58jk | 0.43±0.01c-f | 101±1.89j | 2.61±0.04b-f | 2.81±0.05gh | -1.76±0.02d | 2.56±0.05gh |
| TUTGMGH11 | 28±0.88c-g | 0.43±0.003c-f | 143±4.32b-g | 2.59±0.06b-f | 3.96±0.15b-f | -2.31±0.03kl | 3.71±0.15b-f |
| TUTGMGH12 | 34±0.33bd | 0.56±0.01ab | 129±2.97c-j | 2.27±0.05ghi | 3.13±0.11e-h | -2.18±0.01g-l | 2.88±0.11e-h |
| TUTGMGH13 | 30±1.15b-e | 0.40±0.03d-h | 133±7.01g-j | 2.33±0.08f-i | 2.79±0.07gh | -2.13±0.05g-l | 2.54±0.07gh |
| TUTGMGH14 | 24±2.03e-j | 0.36±0.04fgh | 42±5.13k | 2.23±0.21hi | 0.99±0.16ij | -1.26±0.03c | 0.75±0.16j |
| TUTGMGH15 | 26±6.43d-h | 0.40±0.03d-h | 115±8.63f-j | 2.28±0.03ghi | 2.81±0.25gh | -2.16±0.02g-l | 2.56±0.25gh |
| TUTGMGH16 | 20±0.58g-j | 0.43±0.10c-f | 144±3.24b-g | 2.70±0.01a-d | 4.16±0.10a-d | -2.64±0.28m | 3.91±0.10a-d |
| TUTGMGH17 | 25±3.06e-g | 0.43±0.01c-f | 146±0.627b-g | 2.23±0.02ghi | 3.50±0.02c-h | -2.11±0.05g-l | 3.25±0.02c-h |
| TUTGMGH18 | 20±3.76g-j | 0.19±0.01jk | 67±0.82j | 2.17±0.11i | 1.56±0.01i | -2.14±0.01g-l | 1.31±0.10i |
| TUTGMGH19 | 22±0.58e-j | 0.55±0.03ab | 145±6.21b-g | 2.78±0.06ab | 4.33±0.24abc | -2.01±0.03e-h | 4.08±0.24abc |
| TUTGMGH20 | 43±1.45a | 0.38±0.01e-h | 151±3.77b-e | 2.41±0.11d-i | 3.90±0.15b-f | -2.29±0.04jkl | 3.65±0.15b-f |
| TUTGMGH21 | 27±0.33c-h | 0.50±0.01b-e | 186±9.51a | 2.53±0.03b-g | 5.02±0.23a | -2.23±0.03h-l | 4.77±0.23a |
| TUTGGH22 | 20±0.88g-j | 0.39±0.04e-i | 109±8.24hij | 2.34±0.10f-i | 2.71±0.14gh | -2.23±0.01h-l | 2.46±0.14gh |
| TUTGMGH23 | 23±0.33e-j | 0.51±0.01b-e | 153±4.59bcd | 2.92±0.04a | 4.77±0.12ab | -2.65±0.24m | 4.53±0.12ab |
| TUTGMGH24 | 21±0.33f-j | 0.38±0.03d-h | 150±1.89b-e | 2.39±0.04f-i | 3.84±0.10b-f | -1.26±0.03c | 3.59±0.10b-f |
| TUTGMGH25 | 35±1.53ab | 0.58±0.01ab | 121±2.97b-j | 2.69±0.07a-e | 3.49±0.01c-h | -2.79±0.04m | 3.24±0.01c-h |
| TUTGMGH26 | 16±0.88ijk | 0.18±0.05k | 56±29.93k | 2.46±0.16c-i | 1.57±0.92i | -2.05±0.001f-j | 1.32±0.92i |
| TUTGMGH27 | 16±1.73jk | 0.24±0.03ijk | 138±14.30b-i | 2.37±0.16f-i | 3.47±0.35c-h | -2.08±0.03f-k | 3.22±0.35c-h |
| TUTGMGH28 | 29±1.15b-f | 0.31±0.01ghi | 144±13.75b-g | 2.36±0.15f-i | 3.64±0.41c-g | -1.86±0.05def | 3.39±0.41c-g |
| TUTGMGH29 | 20±0.33g-j | 0.43±0.002c-f | 138±1.62b-i | 2.43±0.20c-i | 3.60±0.29c-g | -2.10±0.05f-k | 3.35±0.29c-g |
| TUTGMGH30 | 21±1.45f-g | 0.40±0.08d-h | 147±8.09b-f | 2.46±0.02c-i | 3.88±0.20b-f | -1.79±0.02de | 3.63±0.20b-f |
| TUTGMGH31 | 16±0.58jk | 0.31±0.01ghi | 105±4.05ij | 2.37±0.16f-i | 2.68±0.29gh | -2.08±0.04f-k | 2.43±0.29gh |
| Bradyrhizobium strain WB74 | 30±0.33b-e | 0.29±0.01hij | 100±0.00j | 2.40±0.16e-i | 2.57±0.17h | -2.26±0.04i-l | 2.32±0.17h |
| Uninoculated | NA | NA | NA | 1.13±0.05k | 0.37±0.02j | +1.55±0.01b | NA |
| 5 mM KNO3 | NA | NA | NA | 1.39±0.02j | 2.57±0.12g | +2.16±0.06a | NA |
| F-statistics | 8.05*** | 9.95*** | 9.90*** | 14.97** | 12.96** | 194.76** | 12.96** |
Table 4.
Tolerance of introduced soybean rhizobial isolates to different levels of temperature and NaCl, and pH indicators. Scoring was done as +++ = full growth, ++ = moderate growth, + = weak growth, and – no growth, as illustrated in .
Table 4.
Tolerance of introduced soybean rhizobial isolates to different levels of temperature and NaCl, and pH indicators. Scoring was done as +++ = full growth, ++ = moderate growth, + = weak growth, and – no growth, as illustrated in .
| Isolates |
Temperature ℃ |
Salinity (NaCl) % |
pH indicator | ||||||||||||
| 25 | 28 | 30 | 37 | 40 | 45 | 0.01 | 0.50 | 1 | 2 | 3 | 4 | 5 | BTB | ||
| TUTGMGH1 | ++ | +++ | +++ | ++ | ++ | ++ | +++ | ++ | - | - | - | - | - | Blue | |
| TUTGMGH2 | ++ | +++ | ++ | ++ | ++++ | ++ | +++ | + | + | + | + | + | - | Yellow | |
| TUTGMGH3 | + | + | + | + | + | + | +++ | +++ | +++ | ++ | ++ | ++ | ++ | Yellow | |
| TUTGMGH4 | + | + | ++ | + | + | + | +++ | +++ | ++ | +++ | +++ | - | - | Blue | |
| TUTGMGH5 | +++ | +++ | +++ | ++ | - | - | +++ | - | - | - | - | - | - | Blue | |
| TUTGMGH6 | +++ | ++ | +++ | +++ | ++ | ++ | +++ | + | + | + | + | + | + | Yellow | |
| TUTGMGH7 | ++ | ++ | +++ | +++ | ++ | ++ | +++ | +++ | ++ | ++ | ++ | ++ | ++ | Blue | |
| TUTGMGH8 | + | ++ | ++ | + | + | + | +++ | +++ | +++ | +++ | +++ | +++ | +++ | Yellow | |
| TUTGMGH9 | ++ | +++ | +++ | ++ | - | - | +++ | +++ | +++ | ++ | ++ | ++ | ++ | Yellow | |
| TUTGMGH10 | ++ | +++ | +++ | + | +++ | ++ | +++ | +++ | +++ | +++ | +++ | - | - | Blue | |
| TUTGMGH11 | ++ | +++ | ++ | +++ | ++ | ++ | +++ | - | - | - | - | - | - | Blue | |
| TUTGMGH12 | +++ | ++ | ++ | + | + | + | +++ | +++ | +++ | ++ | + | + | - | Blue | |
| TUTGMGH13 | + | ++ | ++ | + | + | ++ | +++ | +++ | +++ | +++ | +++ | ++ | + | Yellow | |
| TUTGMGH14 | ++ | ++ | +++ | ++ | ++ | ++ | +++ | ++ | + | + | + | + | - | Blue | |
| TUTGMGH15 | ++ | +++ | + | + | + | ++ | +++ | +++ | ++ | ++ | ++ | ++ | + | Yellow | |
| TUTGMGH16 | +++ | +++ | +++ | +++ | +++ | + | +++ | - | - | - | - | - | - | Yellow | |
| TUTGMGH17 | +++ | +++ | +++ | +++ | +++ | +++ | +++ | + | - | - | - | - | - | Blue | |
| TUTGMGH18 | + | ++ | +++ | +++ | + | + | +++ | ++ | ++ | ++ | ++ | + | + | Yellow | |
| TUTGMGH19 | ++ | +++ | +++ | ++ | ++ | ++ | +++ | ++ | ++ | ++ | ++ | + | + | Blue | |
| TUTGMGH20 | + | ++ | +++ | +++ | ++ | + | +++ | +++ | ++ | ++ | ++ | + | + | Blue | |
| TUTGMGH21 | ++ | ++ | +++ | +++ | +++ | ++ | +++ | +++ | ++ | ++ | ++ | + | + | Blue | |
| TUTGMGH22 | +++ | +++ | +++ | ++ | +++ | ++ | +++ | +++ | +++ | +++ | +++ | ++ | ++ | Blue | |
| TUTGMGH23 | ++ | ++ | ++ | + | + | + | +++ | +++ | ++ | ++ | ++ | + | + | Yellow | |
| TUTGMGH24 | + | ++ | ++ | + | ++ | ++ | +++ | ++ | - | - | - | - | - | Blue | |
| TUTGMGH25 | + | +++ | +++ | +++ | ++ | ++ | +++ | + | - | - | - | - | - | Blue | |
| TUTGMGH26 | + | ++ | +++ | +++ | +++ | ++ | +++ | +++ | ++ | ++ | ++ | ++ | - | Yellow | |
| TUTGMGH27 | + | ++ | +++ | +++ | +++ | ++ | +++ | +++ | +++ | +++ | ++ | ++ | ++ | Blue | |
| TUTGMGH28 | + | +++ | +++ | ++ | - | - | +++ | +++ | +++ | +++ | ++ | ++ | - | blue | |
| TUTGMGH29 | + | +++ | + | + | ++ | + | +++ | ++ | ++ | + | + | + | + | Yellow | |
| TUTGMGH30 | + | +++ | ++ | + | + | + | +++ | +++ | ++ | ++ | + | + | + | Yellow | |
| TUTGMGH31 | + | ++ | +++ | ++ | +++ | ++ | +++ | +++ | +++ | +++ | ++ | ++ | ++ | Yellow | |
Table 5.
Tolerance of isolates to drought and IAA-producing properties of rhizobial isolates nodulating soybean. Values followed by dissimilar letters are significant at **p ≤ 0.01. OD< 0.30 is highly sensitive to drought; OD= 0.30 – 0.39 is sensitive; OD= 0.40 – 0.50 is tolerant; OD>0.5 is highly tolerant.
| Isolates | Drought | IAA | |||
| Control | 5% | 15% | 30% | (µg mL-1) | |
| TUTGMGH1 | 0.170±0.012ijk | 0.204±0.003fgh | 0.084±0.001lm | 0.078±0.0003e-h | 8.59±0.03d |
| TUTGMGH2 | 0.333±0.006klm | 0.142±0.001 | 0.088±0.005jkl | 0.065±0.006gh | 6.52±0.15f |
| TUTGMGH3 | 0.262±0.001hij | 0.258±0.002de | 0.176±0.004b | 0.069±0.002fgh | 9.92±0.10b |
| TUTGMGH4 | 0.330±0.036d-g | 0.210±0.001fg | 0.077±0.001mn | 0.075±0.0003e-h | 8.59±0.47d |
| TUTGMGH5 | 0.238±0.023ij | 0.103±0.001k-n | 0.144±0.003e | 0.083±0.002d-h | 9.39±0.16bc |
| TUTGMGH6 | 0.634±0.048b | 0.256±0.005de | 0.114±0.001h | 0.083±0.002d-h | 8.74±0.054cd |
| TUTGMGH7 | 0.225±0.003ijk | 0.131±0.001i-m | 0.110±0.002h | 0.084±0.001d-h | 8.49±0.15de |
| TUTGMGH8 | 0.282±0.0196f-i | 0.145±0.005 | 0.135±0.006ef | 0.086±0.002def | 9.85±0.01b |
| TUTGMGH9 | 0.526±0.015c | 0.523±0.003a | 0.157±0.009d | 0.067±0.0003fgh | 8.30±0.13de |
| TUTGMGH10 | 0.277±0.003f-i | 0.377±0.067c | 0.171±0.003bc | 0.154±0.026b | 4.52±0.03g |
| TUTGMGH11 | 0.137±0.002mn | 0.099±0.001lmn | 0.085±0.002klm | 0.106±00.004c | 8.65±0.11d |
| TUTGMGH12 | 0.639±0.019a | 0.424±0.002b | 0.243±0.001a | 0.164±0.001a | 8.11±0.64de |
| TUTGMGH13 | 0.338±0.007 | 0.175±0.0003f-k | 0.165±0.002cd | 0.065±0.002h | 7.75±0.10e |
| TUTGMGH14 | 0.105±0.002n | 0.093±0.0003mn | 0.057±0.0003p | 0.089±0.0003cde | 4.01±.07gh |
| TUTGMGH15 | 0.307±0.003e-h | 0.082±0.001n | 0.072±0.001no | 0.085±0.0003d-g | 7.75±0.05e |
| TUTGMGH16 | 0.447±0.003d | 0.218±0.0003ef | 0.164±0.001cd | 0.098±0.0003cd | 11.37±0.23a |
| TUTGMGH17 | 0.350±0.002def | 0.172±0.010f-k | 0.106±0.0003hi | 0.041±0.001 | 8.49±0.04de |
| TUTGMGH18 | 0.203±0.042jkl | 0.096±0.002lmn | 0.127±0.001fg | 0.069±0.001fgh | 4.16±0.37gh |
| TUTGMGH19 | 0.223±0.007ijk | 0.461±0.038b | 0.124±0.003g | 0.142±0.001b | 4.69±0.35g |
| TUTGMGH20 | 0.314±0.005e-h | 0.128±0.0003i-n | 0.097±0.001ij | 0.075±0.001e-h | 3.00±0.14ij |
| TUTGMGH21 | 0.270±0.061g-j | 0.167±0.006g-j | 0.166±0.005dd | 0.101±0.0123cd | 6.35±0.03f |
| TUTGMGH22 | 0.266±0.002g-j | 0.086±0.003mn | 0.05±0.001q | 0.067±0.0003fgh | 8.06±0.69de |
| TUTGMGH23 | 0.265±0.013hij | 0.176±0.004f-j | 0.081±0.001lm | 0.085±0.00d-g1 | 4.48±0.29g |
| TUTGMGH24 | 0.156±0.011lmn | 0.127±0.006j-n | 0.090±0.0003jkl | 0.091±0.003cde | 1.21±0.14k |
| TUTGMGH25 | 0.228±0.012ijk | 0.128±0.001i-n | 0.139±0.003e | 0.078±0.001e-h | 2.76±0.04jk |
| TUTGMGH26 | 0.258±0.009hij | 0.161±0.005hij | 0.096±0.001j | 0.090±0.001cde | 0.98±0.11l |
| TUTGMGH27 | 0.235±0.008ij | 0.159±0.003hij | 0.162±0.001cd | 0.074±0.002e-h | 3.02±0.22ij |
| TUTGMGH28 | 0.388±0.002de | 0.159±0.003hij | 0.162±0.001cd | 0.074±0.002e-h | 2.14±0.02k |
| TUTGMGH29 | 0.269±0.001g-j | 0.105±0.0003k-n | 0.067±0.001o | 0.044±0.004i | 4.12±0.07gh |
| TUTGMGH30 | 0.227±0.003ijk | 0.282±0.003d | 0.094±0.001jk | 0.089±0.001cde | 3.59±0.26hi |
| TUTGMGH31 | 0.257±0.009hij | 0.160±0.004hij | 0.096±0.001j | 0.091±0.001cde | 0.98±0.11l |
| F-statistics | 41.294** | 62.881** | 207.34** | 22.857** | 135.02** |
Disclaimer/Publisher’s Note: The statements, opinions and data contained in all publications are solely those of the individual author(s) and contributor(s) and not of MDPI and/or the editor(s). MDPI and/or the editor(s) disclaim responsibility for any injury to people or property resulting from any ideas, methods, instructions or products referred to in the content. |
© 2025 by the authors. Licensee MDPI, Basel, Switzerland. This article is an open access article distributed under the terms and conditions of the Creative Commons Attribution (CC BY) license (http://creativecommons.org/licenses/by/4.0/).
Copyright: This open access article is published under a Creative Commons CC BY 4.0 license, which permit the free download, distribution, and reuse, provided that the author and preprint are cited in any reuse.


