Submitted:
11 February 2025
Posted:
06 March 2025
You are already at the latest version
Abstract
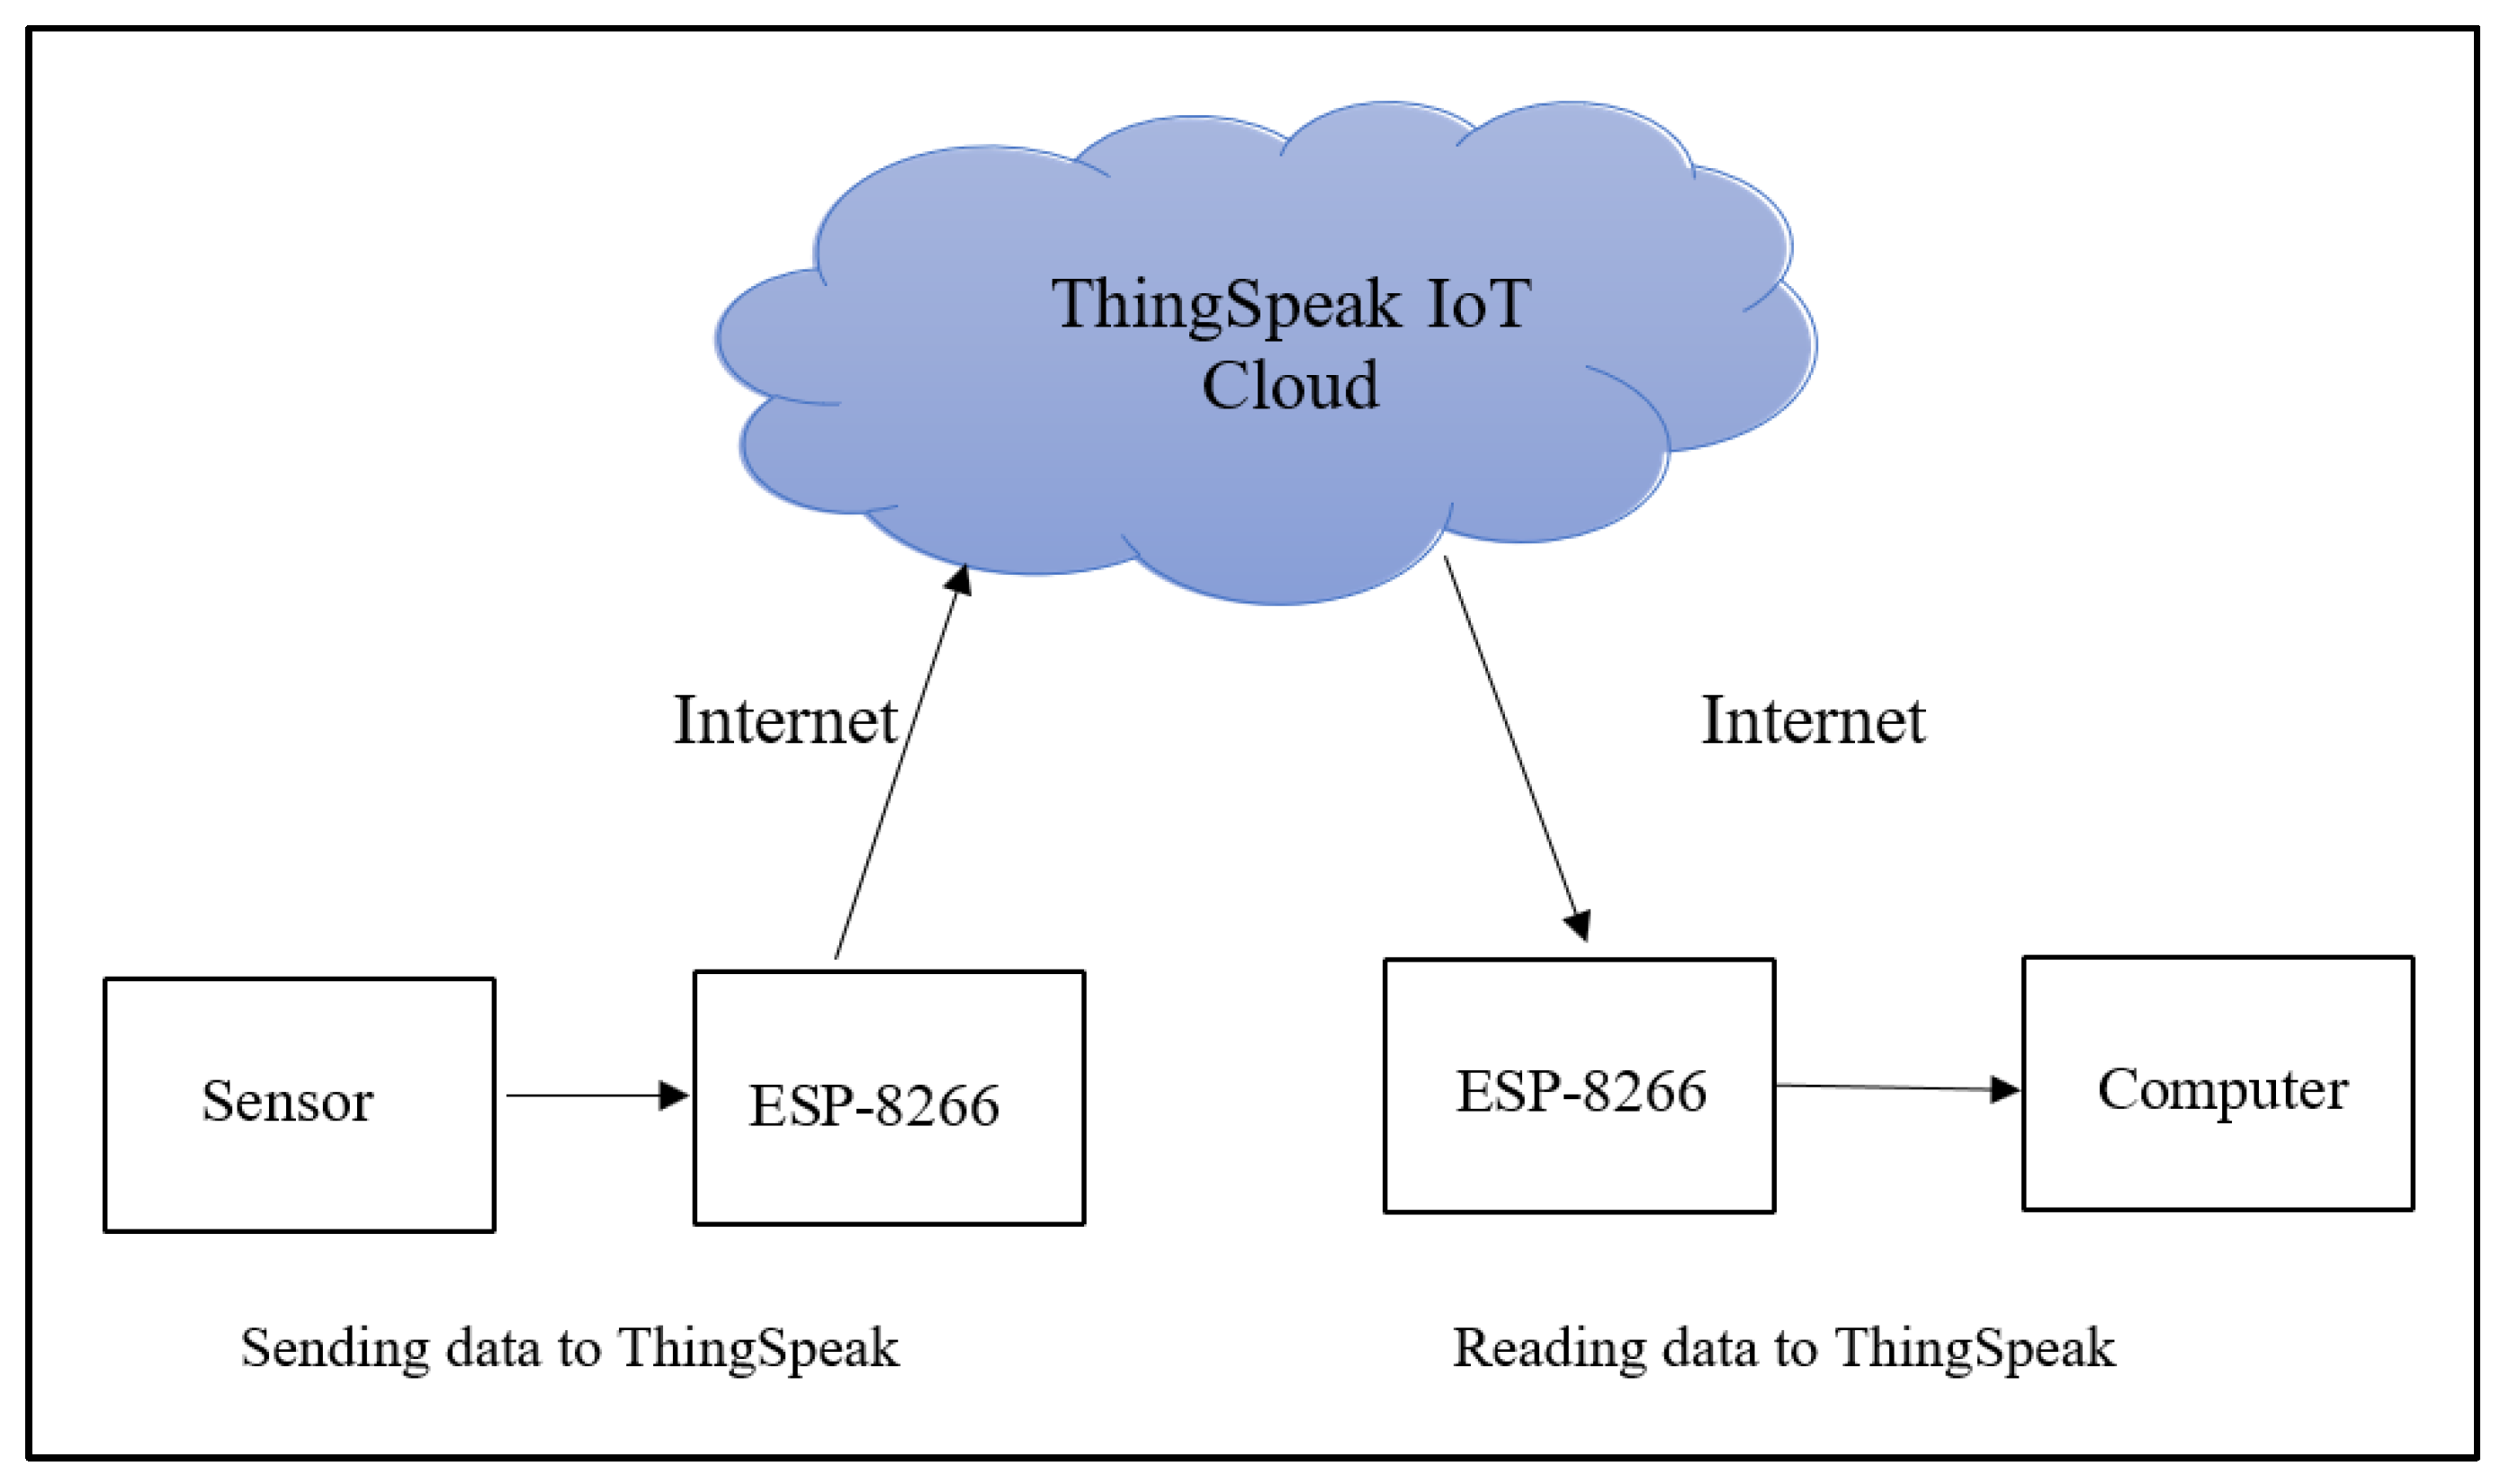
Environmental monitoring refers to the tools and techniques designed to observe an environment, characterize its quality, and establish environmental parameters, to accurately quantify the impact an activity has on an environment. A warmer climate may result in lower thermal efficiency and reduced load-including shutdowns in thermal power plants. It is found in research that a rise in temperature of 1°C reduces the supply of nuclear power by about 0.5% through its effect on thermal efficiency. A drastic change in air pressure also indicates there could be a significant climate change. In the event of a radiological release accident, environmental data is required to reduce radiation exposure to humans. That’s why environmental monitoring is very important for a nuclear power plant. It can be a crucial matter for the industries also because environmental monitoring helps industries operate responsibly, minimize negative impacts on the planet, and contribute to a more sustainable future. An IoT-based system can do environmental monitoring. Anyone using an IoT-based system can get environmental data like temperature, pressure, humidity, etc. Here the projected system delivers sensor data which are got from the environment to an API called ThingSpeak over an HTTP protocol and allows storing of data. The proposed system works well and it shows reliability. The prototype has been used to monitor and analyse real-time data using graphical information of the environment.
Keywords:
1. Introduction
2. Literature Review
3. Project Elements
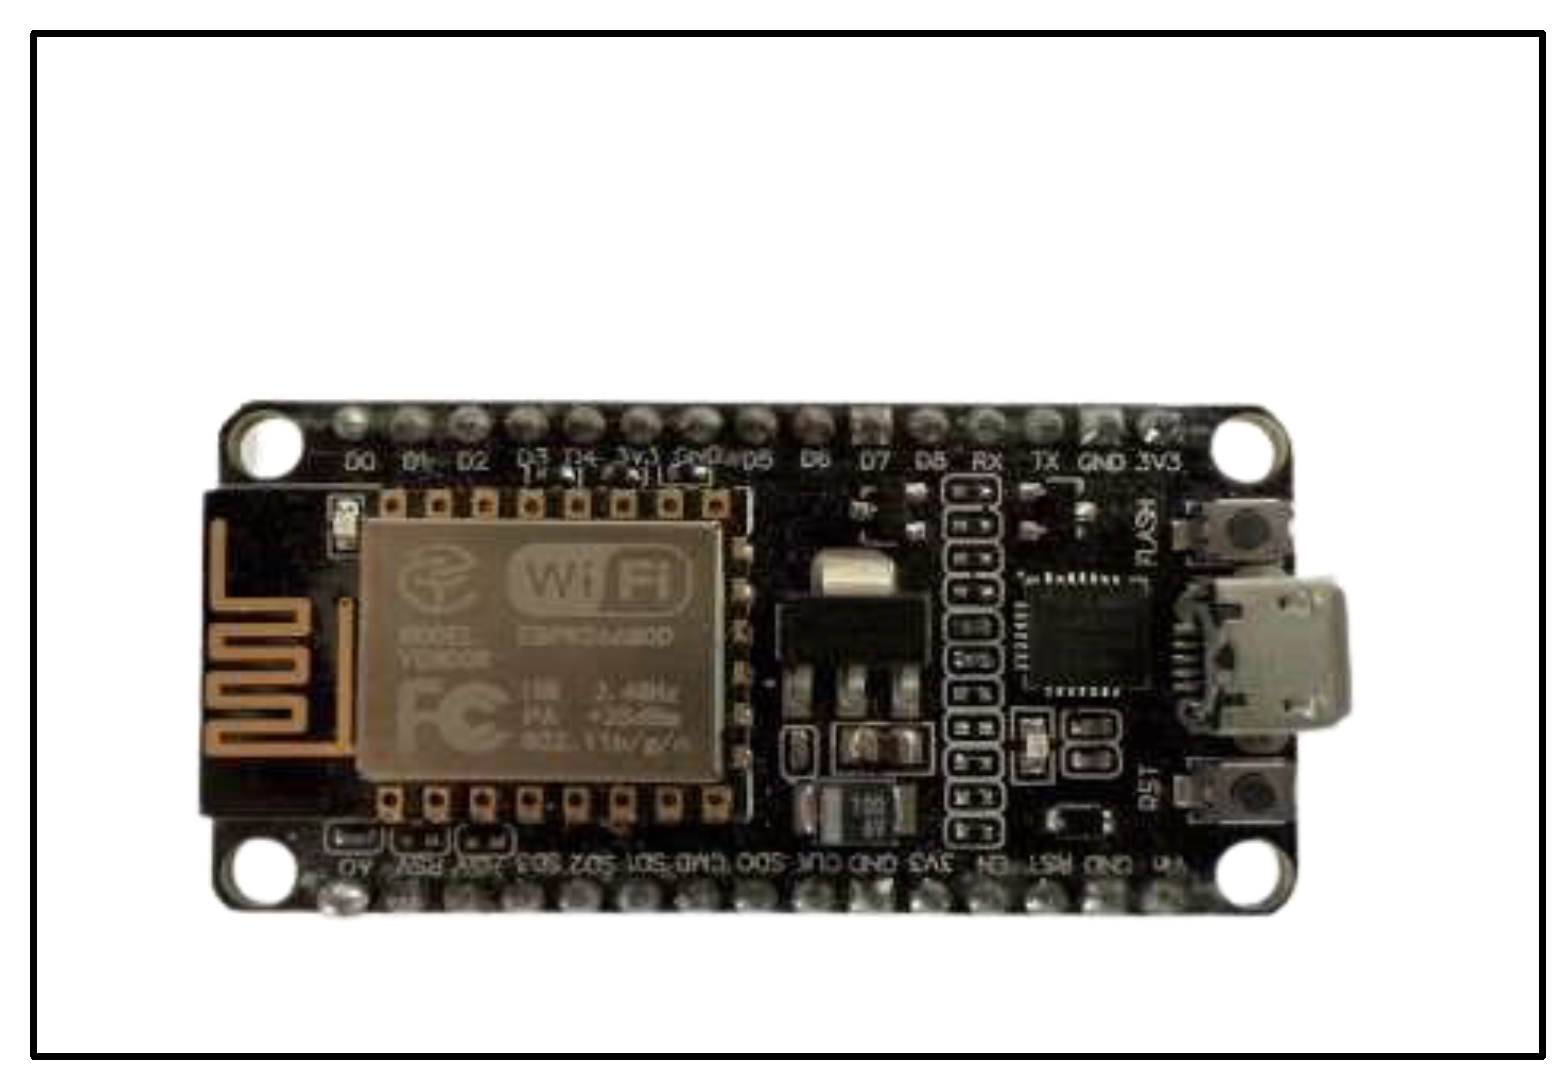
3.1. NodeMCU
- Power input: 4.5V ~ 9V (10VMAX), USB-powered
- Transfer rate: 110-460800bps
- Support Smart Link Smart Networking
- Working temperature: -40°C to 125°C
- Connected to 2.4 GHz Wi-Fi
- Wireless 802.11 b/g/n standard
- Open-source, Interactive, Programmable, Low-cost, Simple, Smart, WI-FI enabled.
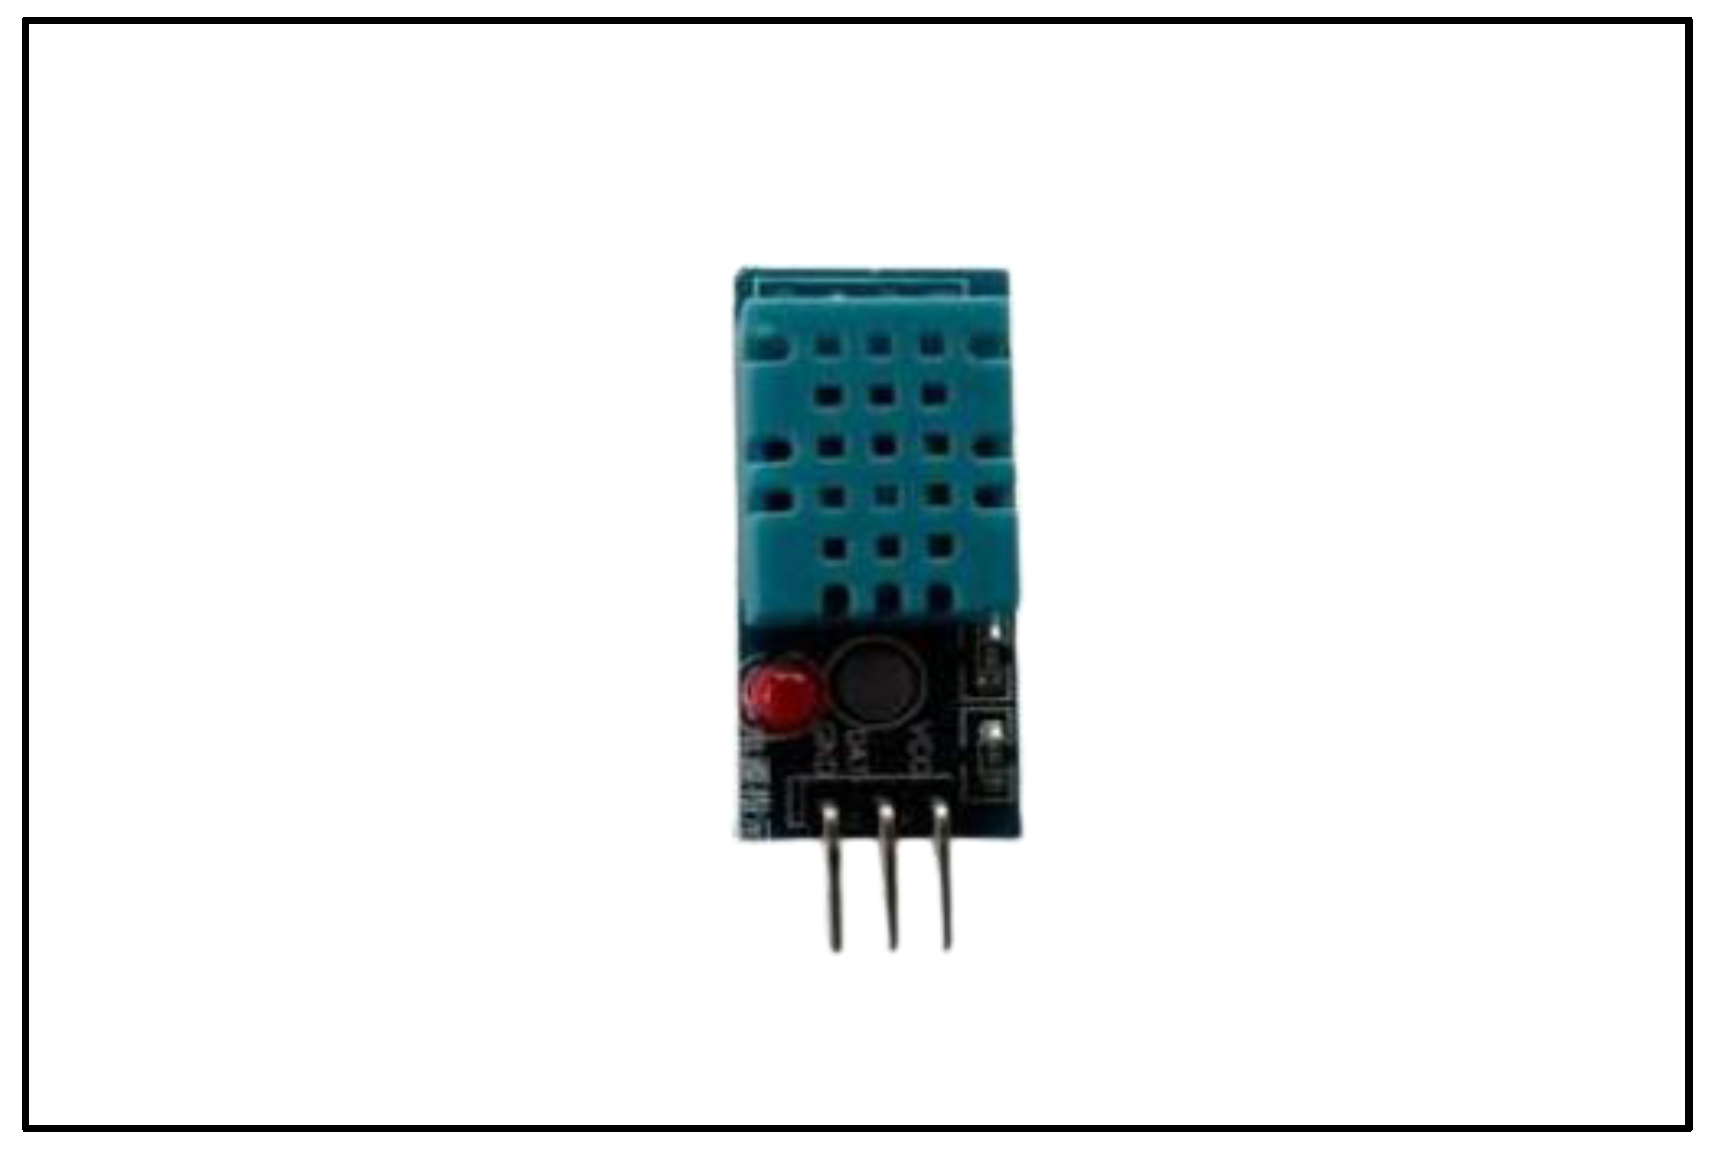
3.2. Temperature and Humidity Sensor (DHT 11)
- Low-cost Module.
- I/O power is 5V.
- Good for 20-80% humidity readings with 5% accuracy.
- Good for 0-50°C temperature readings ±2°C accuracy.
- No more than 1 Hz sampling rate (once every second).
- Resolution: 16 bit
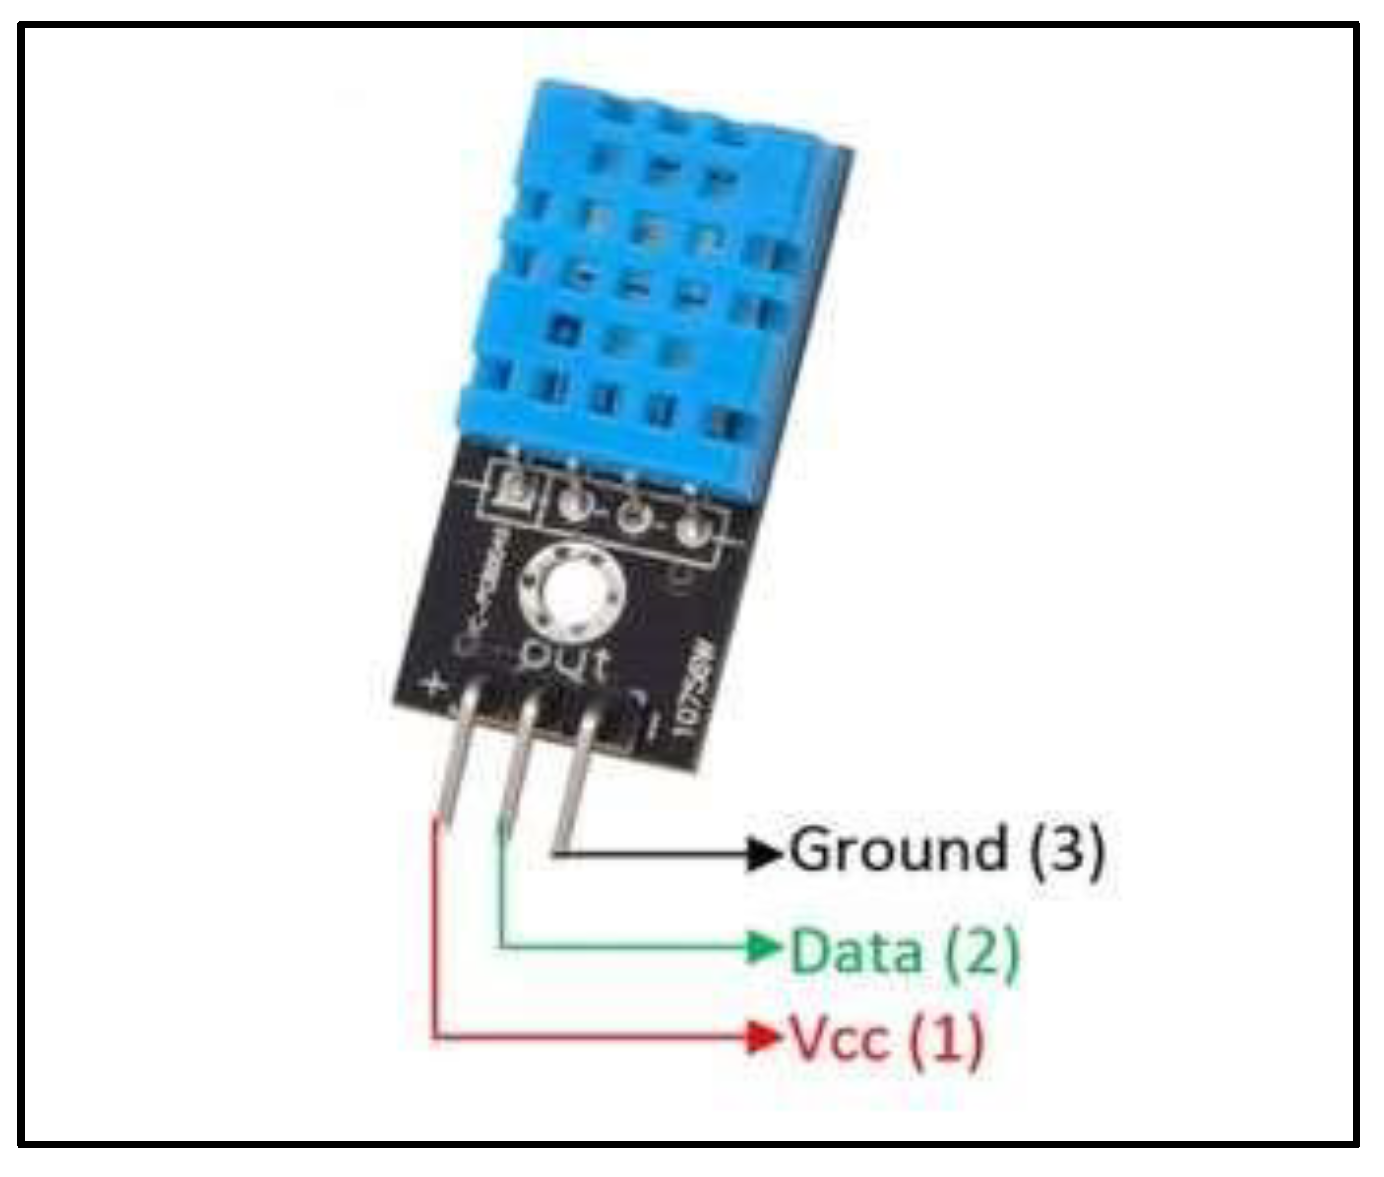

| Pin Name | Description |
|---|---|
| VCC | Power supply |
| Data | Outputs of Temperature and Humidity data |
| Ground | Connected to the ground of the circuit |
- Measure temperature and humidity
- Local Weather station
- Automatic climate control [12]
3.3. Pressure Sensor (BMP 180)
- Operating temperature: -40ºC to +80ºC
- Potable size
- Low power consumption (3uA)
- Operating voltage of BMP180: 1.3V – 3.6V
- Input voltage of BMP180 MODULE: 3.3V to 5.5V
- Maximum voltage at SDA, SCL: VCC + 0.3V
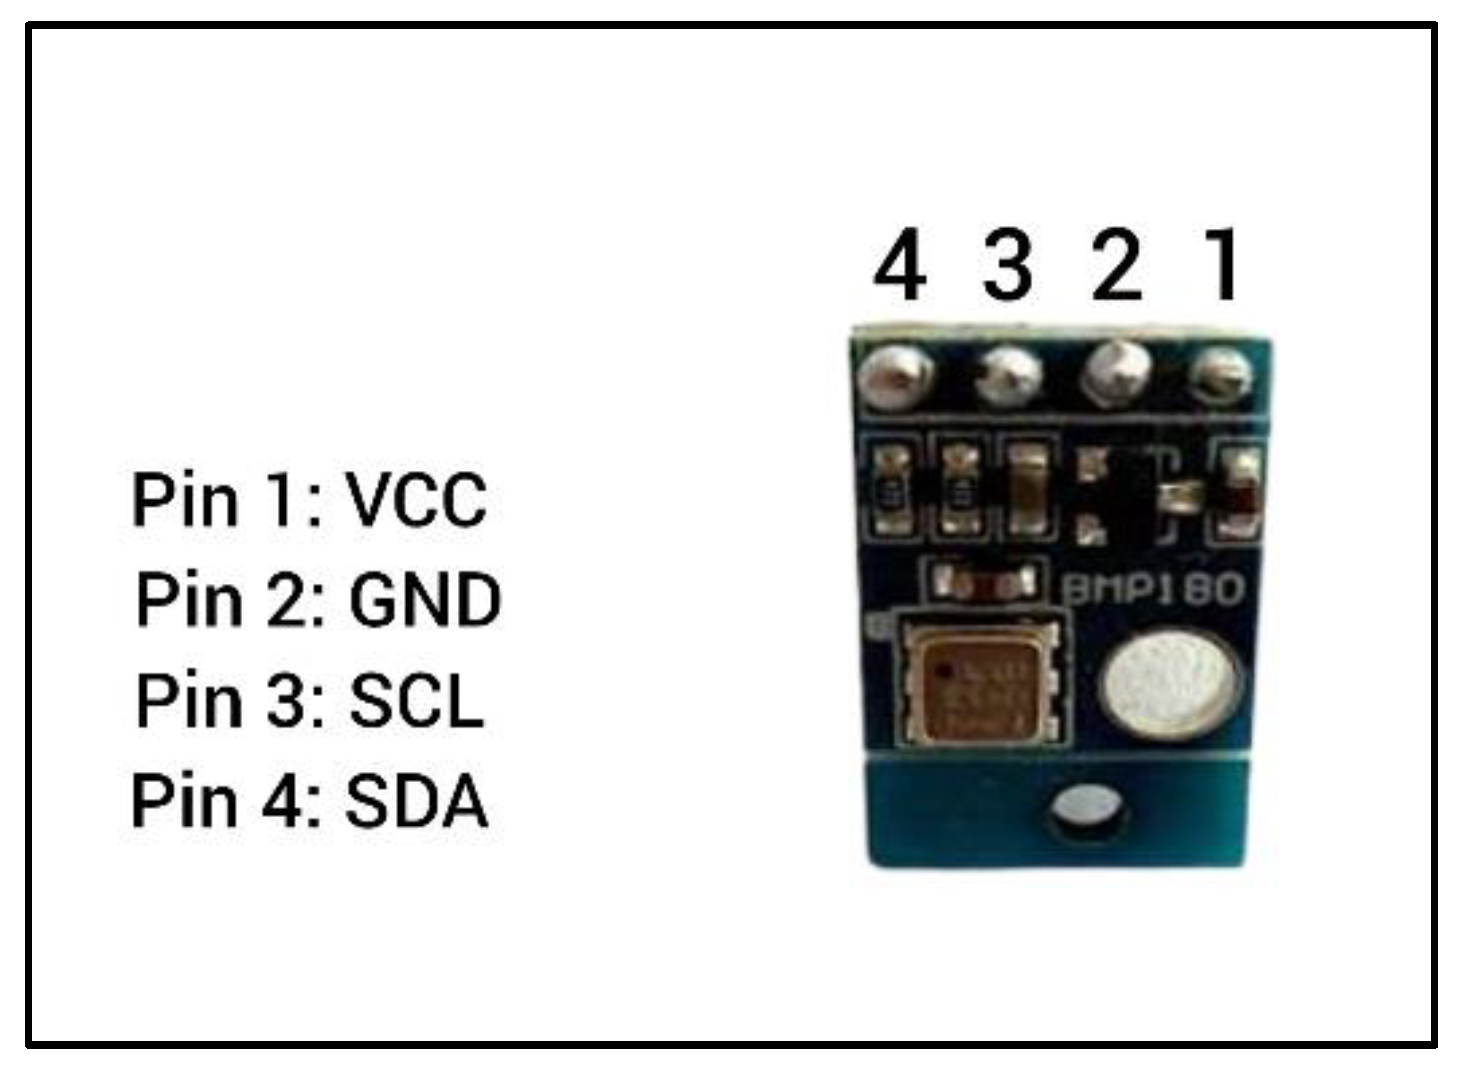
| Pin Name | Description |
|---|---|
| VCC | Power supply |
| Ground | Connected to the ground of the circuit |
| SCL | Serial Clock Pin |
| SDA | Serial Data Pin |
- i.
- Indoor navigation
- i.
- Vertical velocity indication
- i.
- Weather forecast [14]
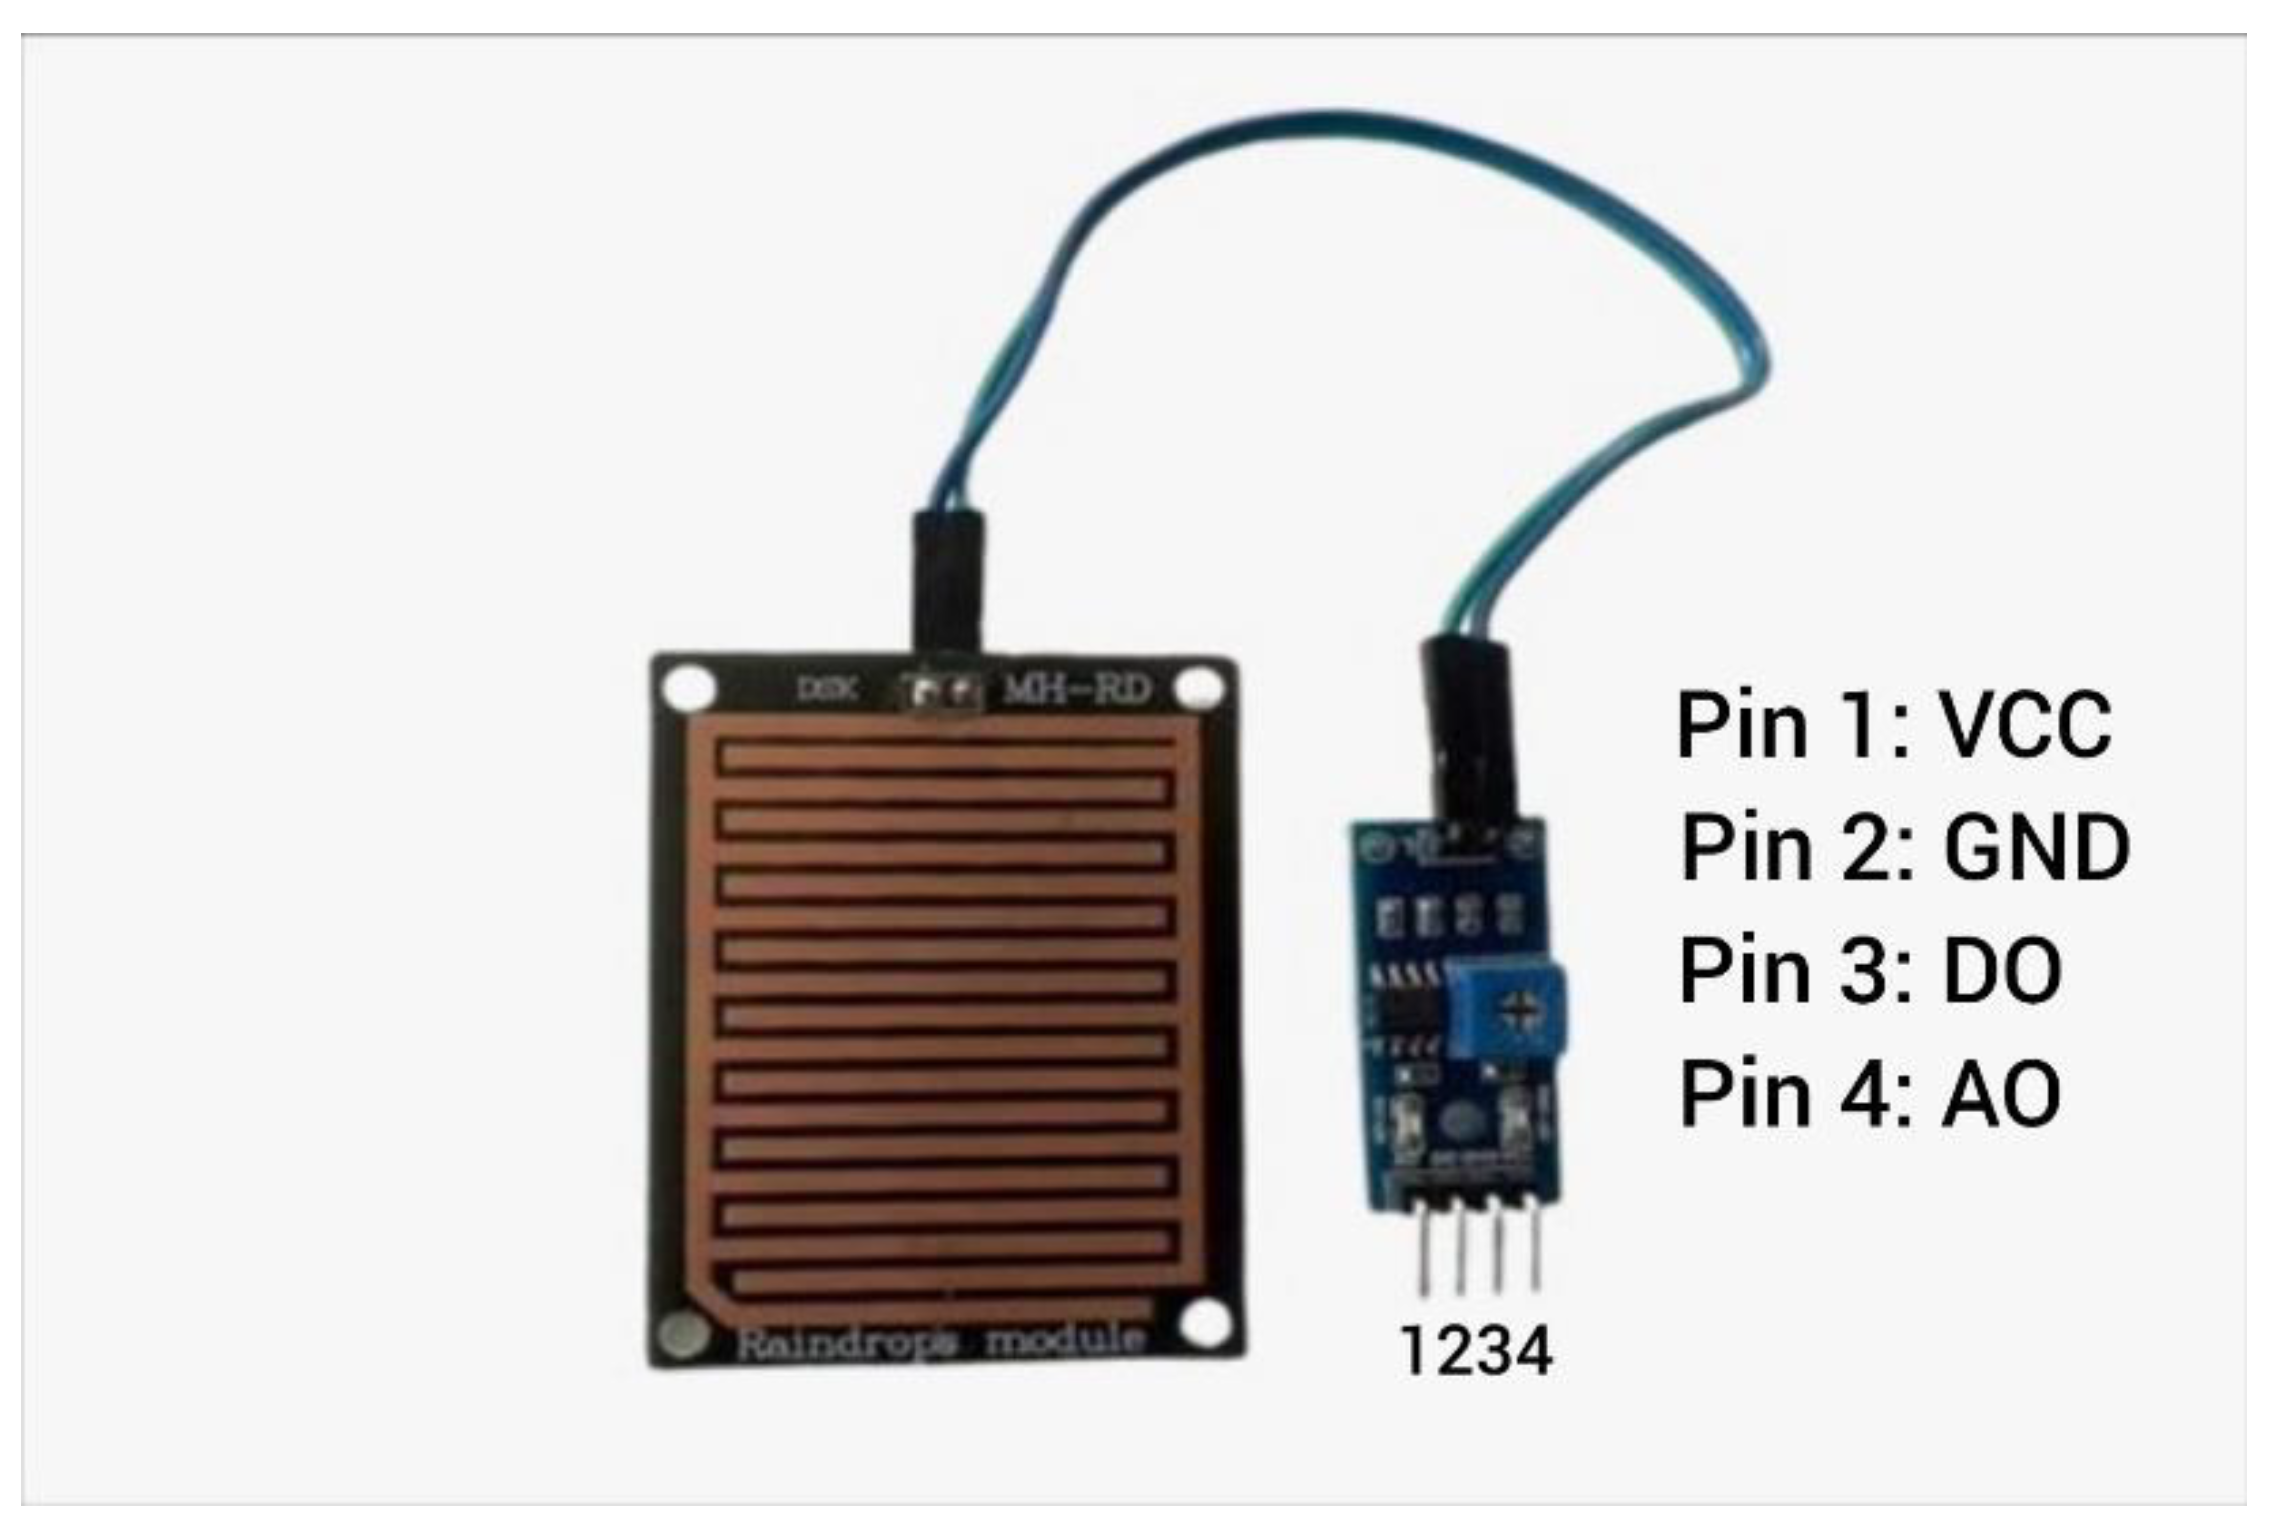
3.4. Raindrops Detection Sensor
- The LM393 uses the wide voltage comparator
- Provide both digital and analog output
- The output format: digital switch output (0 and 1) and analog AO voltage output
- The sensor uses the high-quality FR – 04 double material, a large area of 5.5 * 4.0 CM
| Pin Name | Description |
|---|---|
| VCC | Power supply |
| Ground | Connected to the ground of the circuit |
| DO | Low/High output pin |
| AO | Analog output pin |
- This sensor is used as a water preservation device and this is connected to the irrigation system to shut down the system in the event of rainfall.
- This sensor is used in specialized satellite communications aerials for activating a rain blower over the opening of the aerial feed, to get rid of water droplets from the mylar wrap to keep pressurized as well as dry air within the waveguides [16].
3.5. ThingSpeak
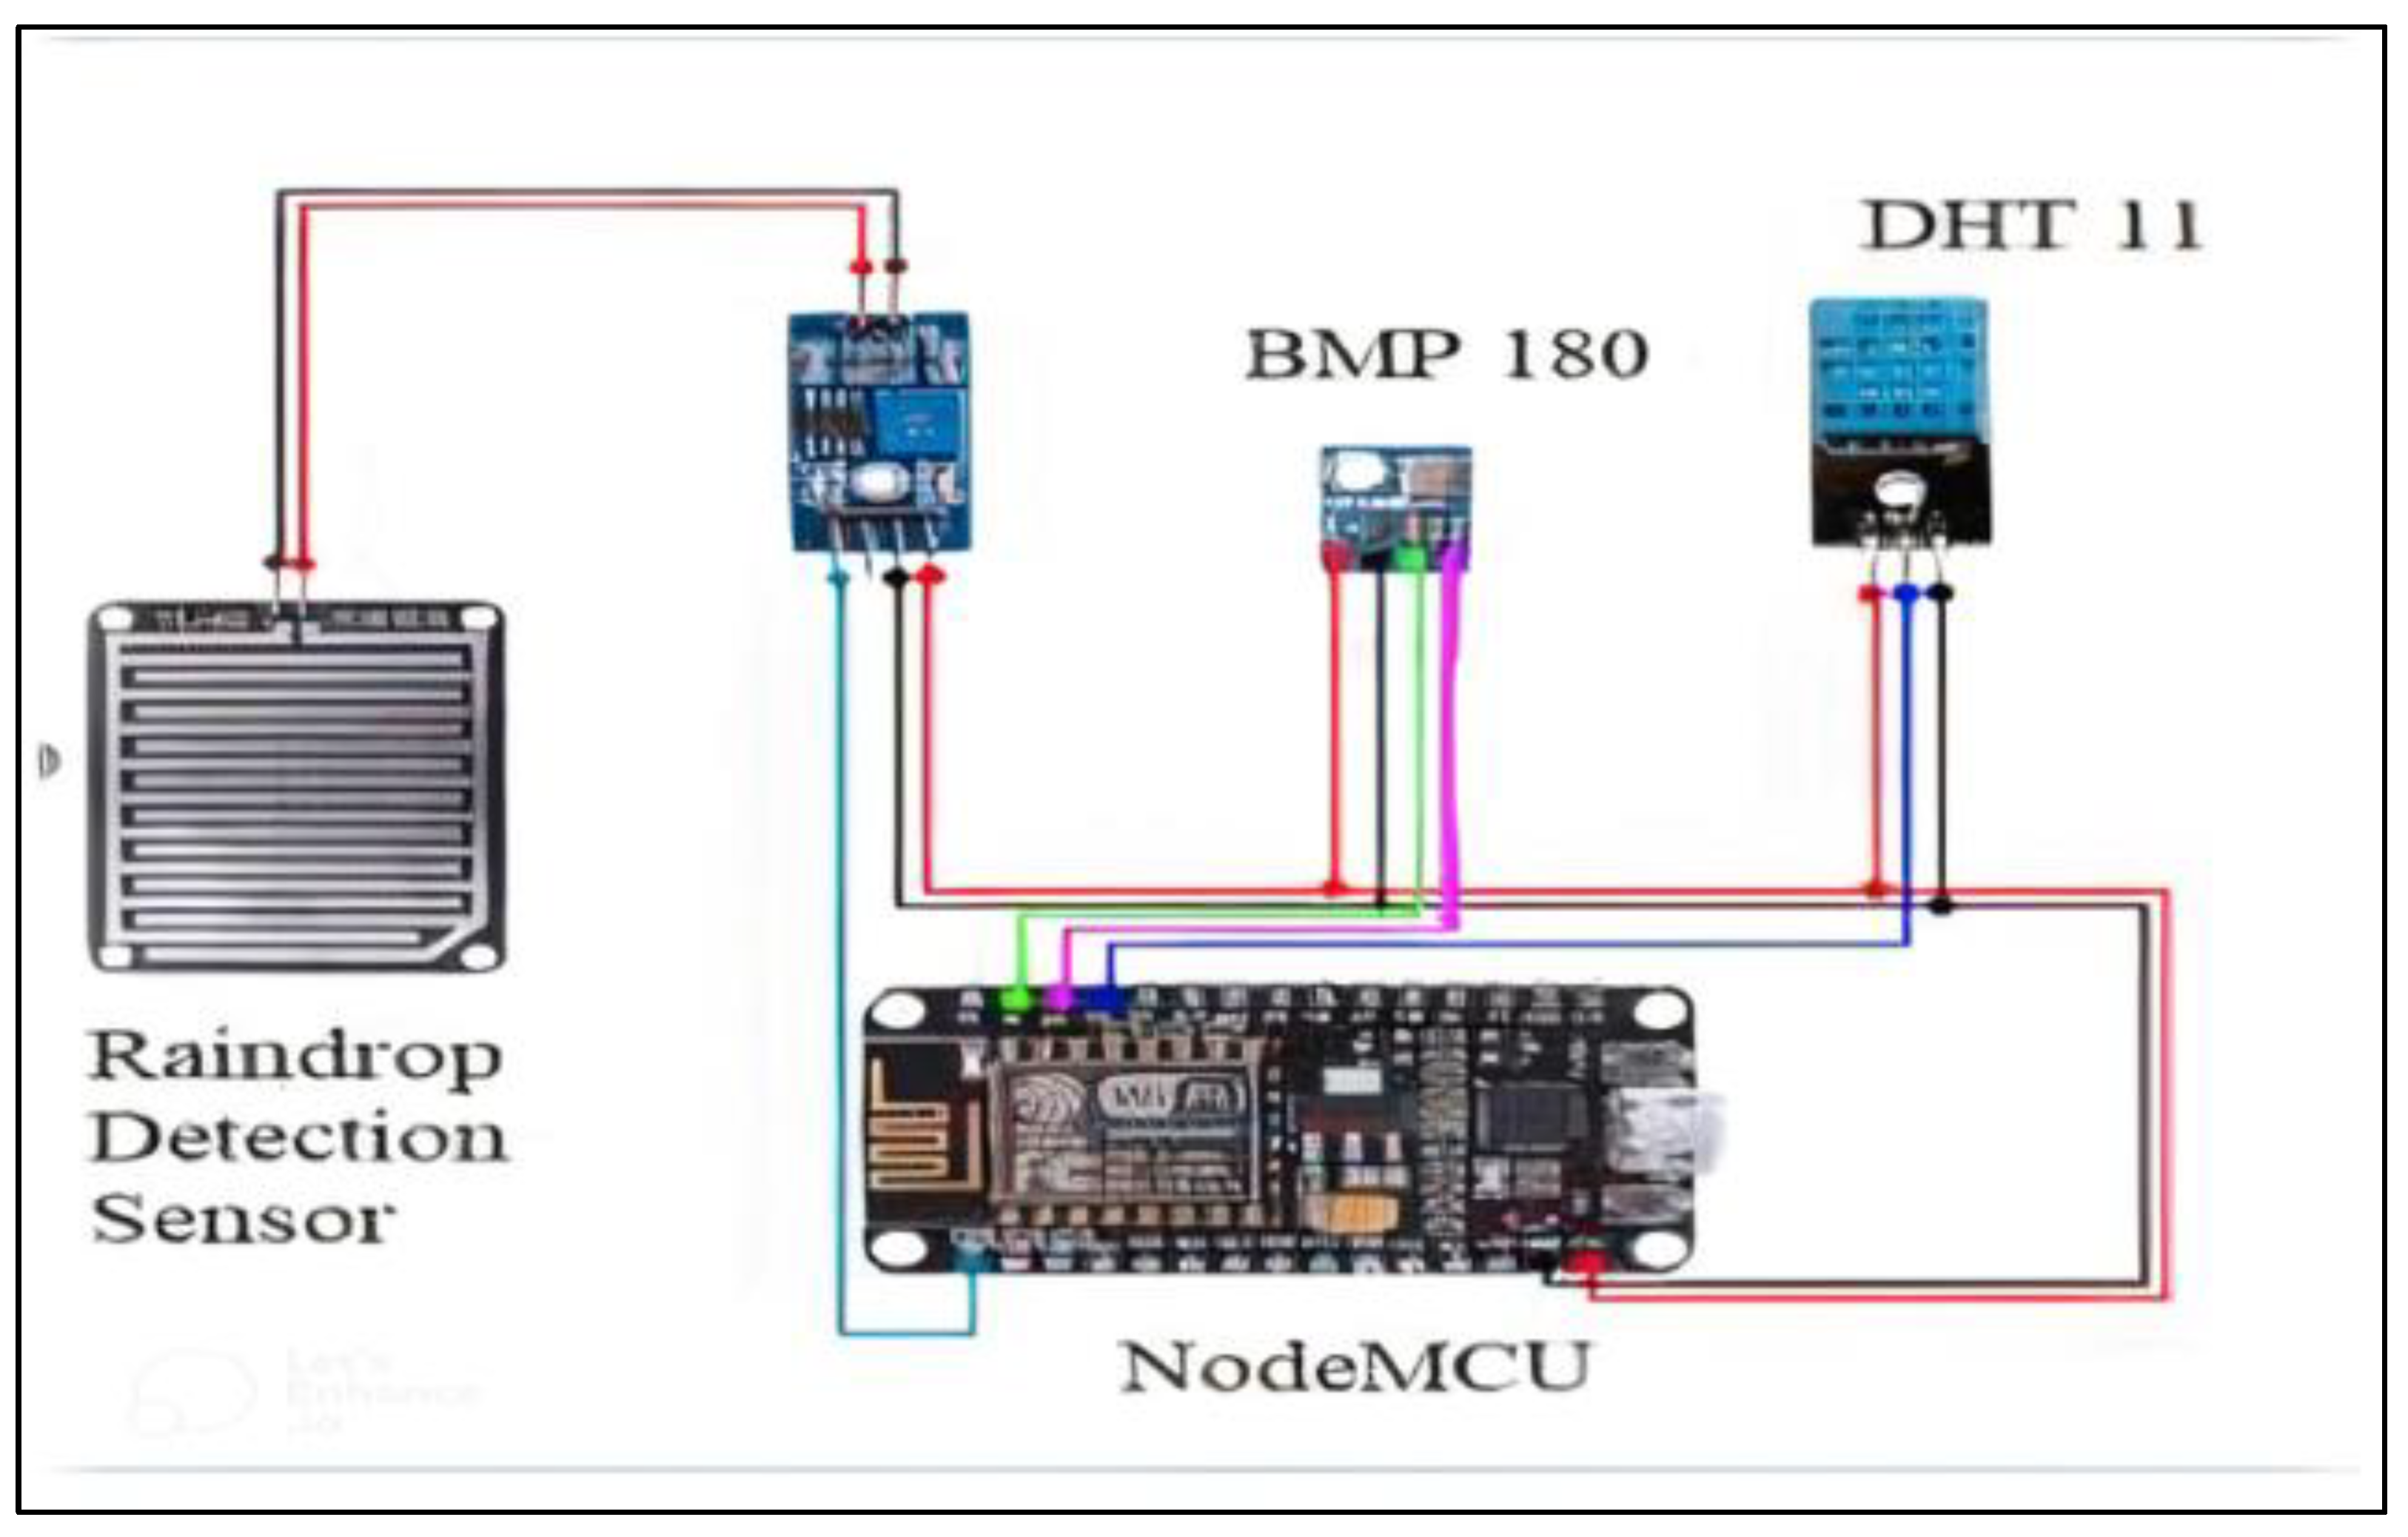
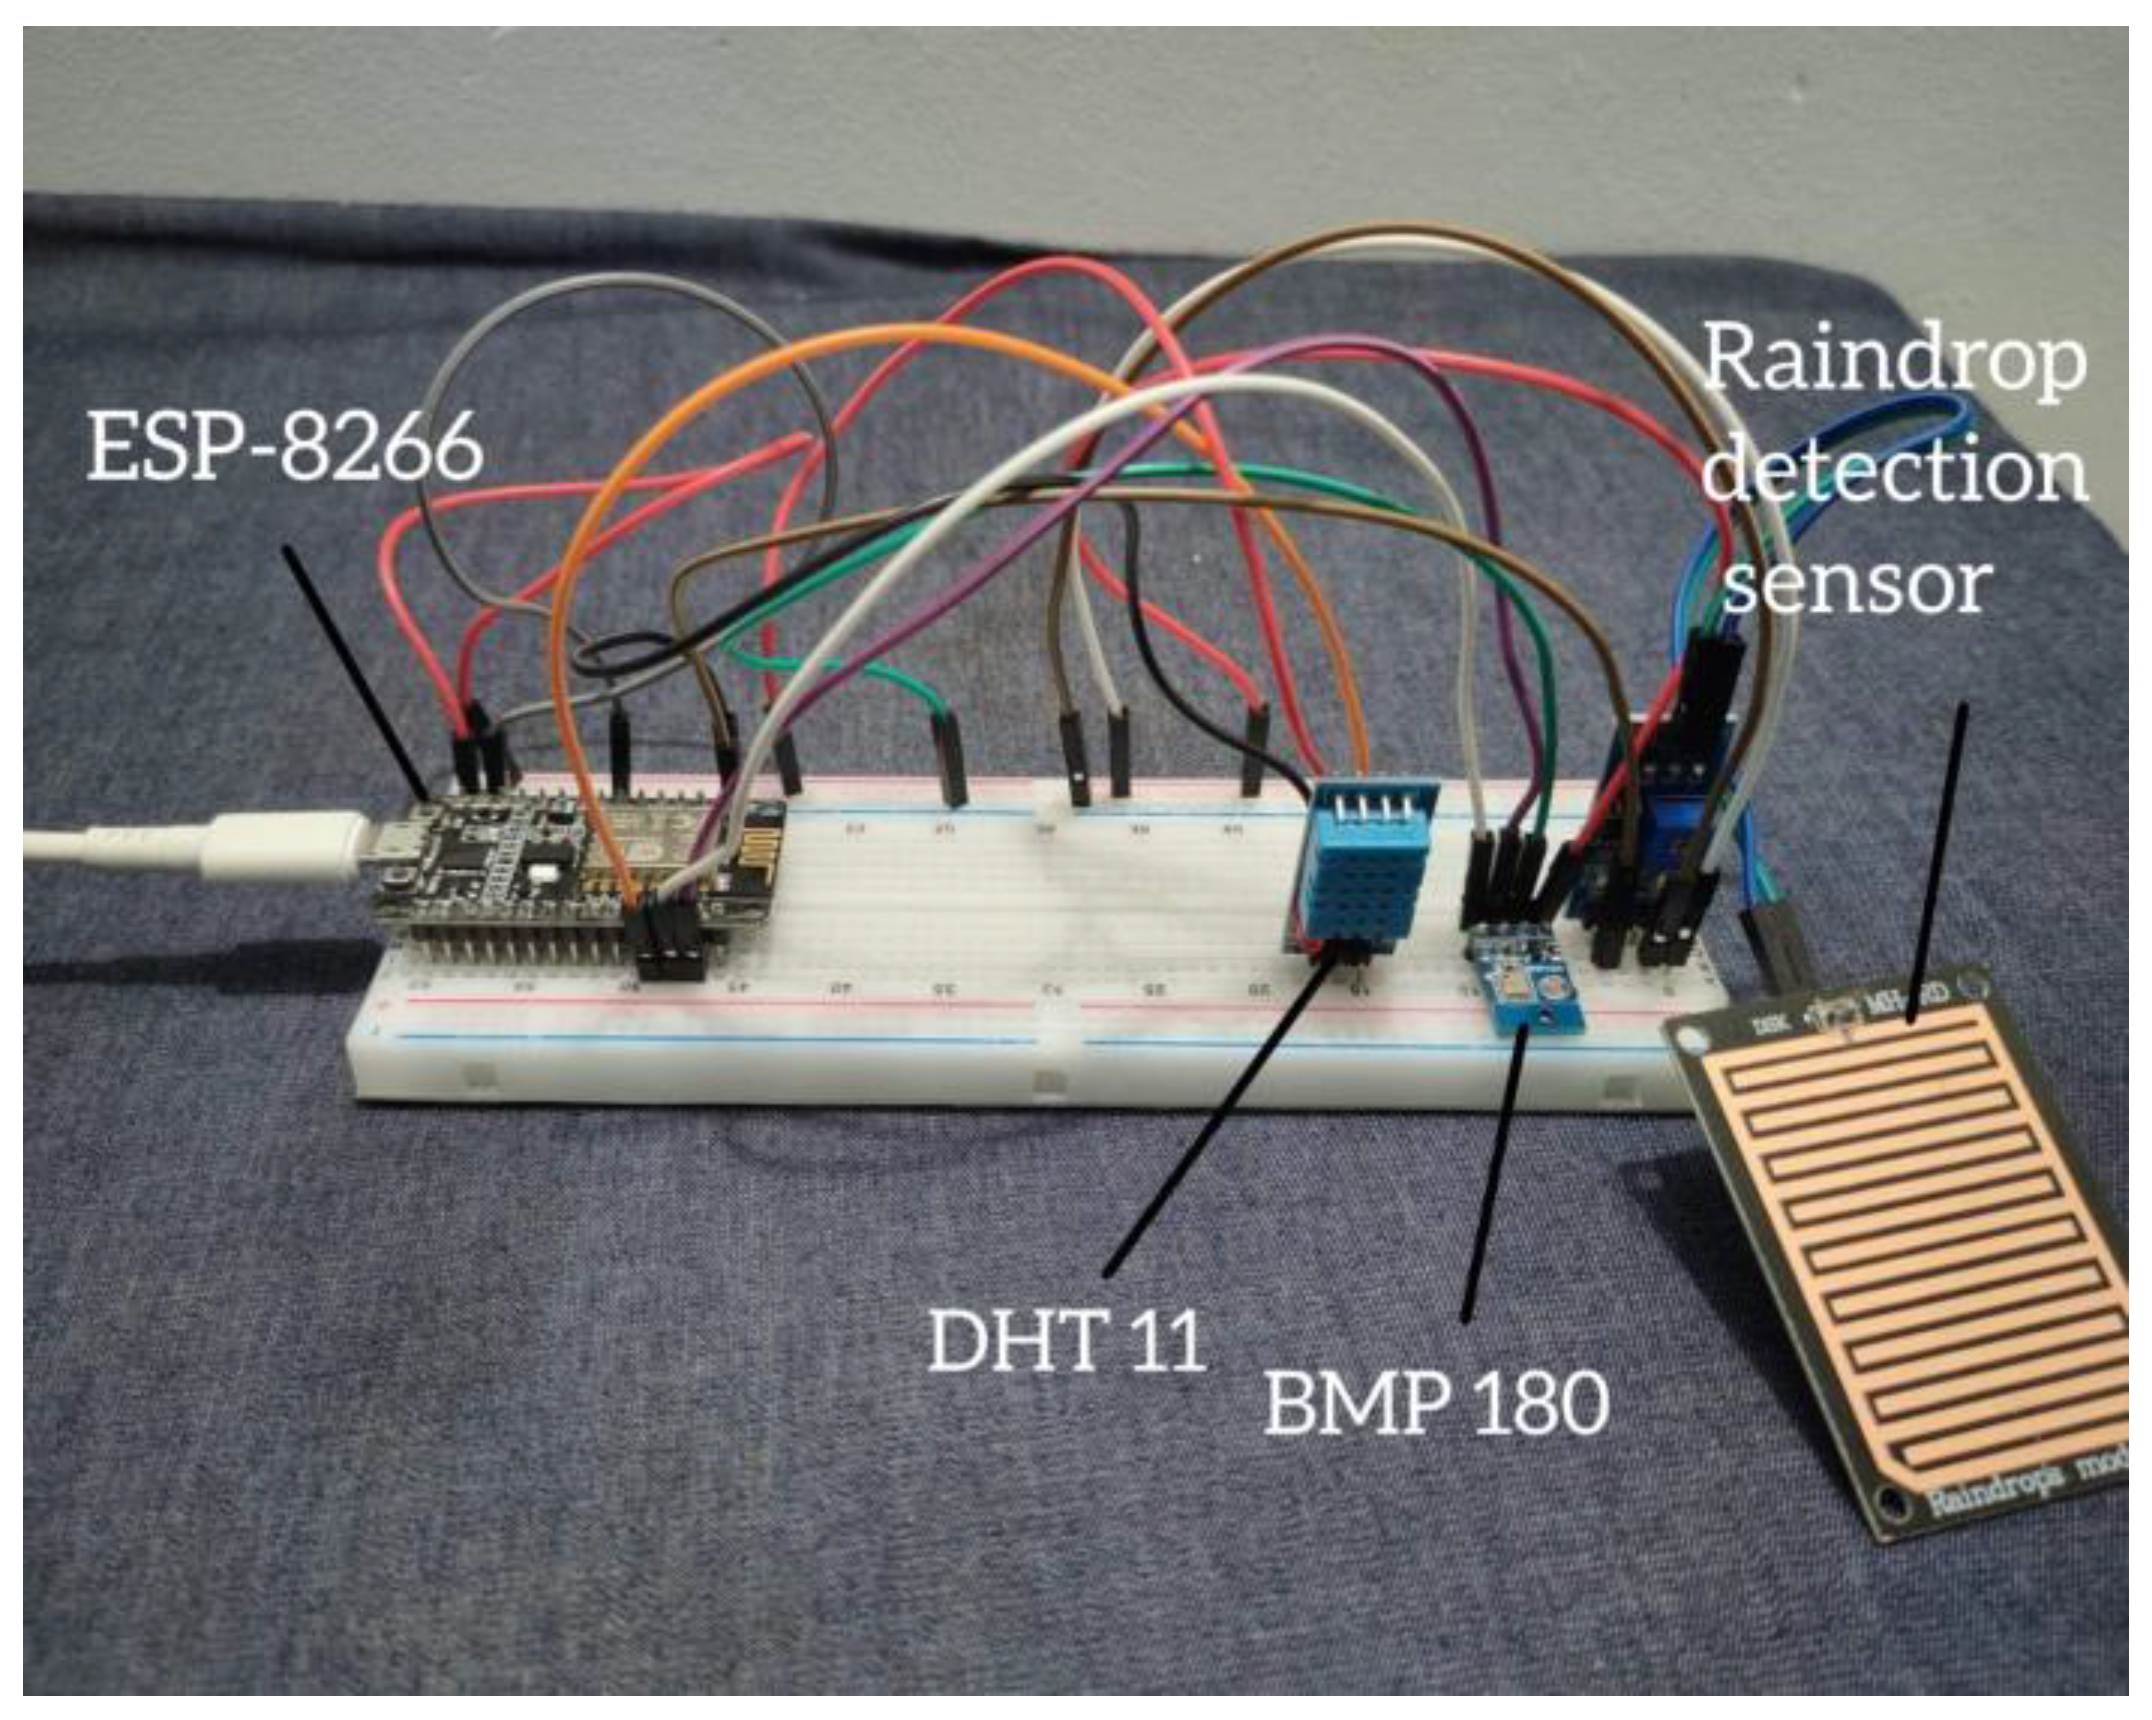
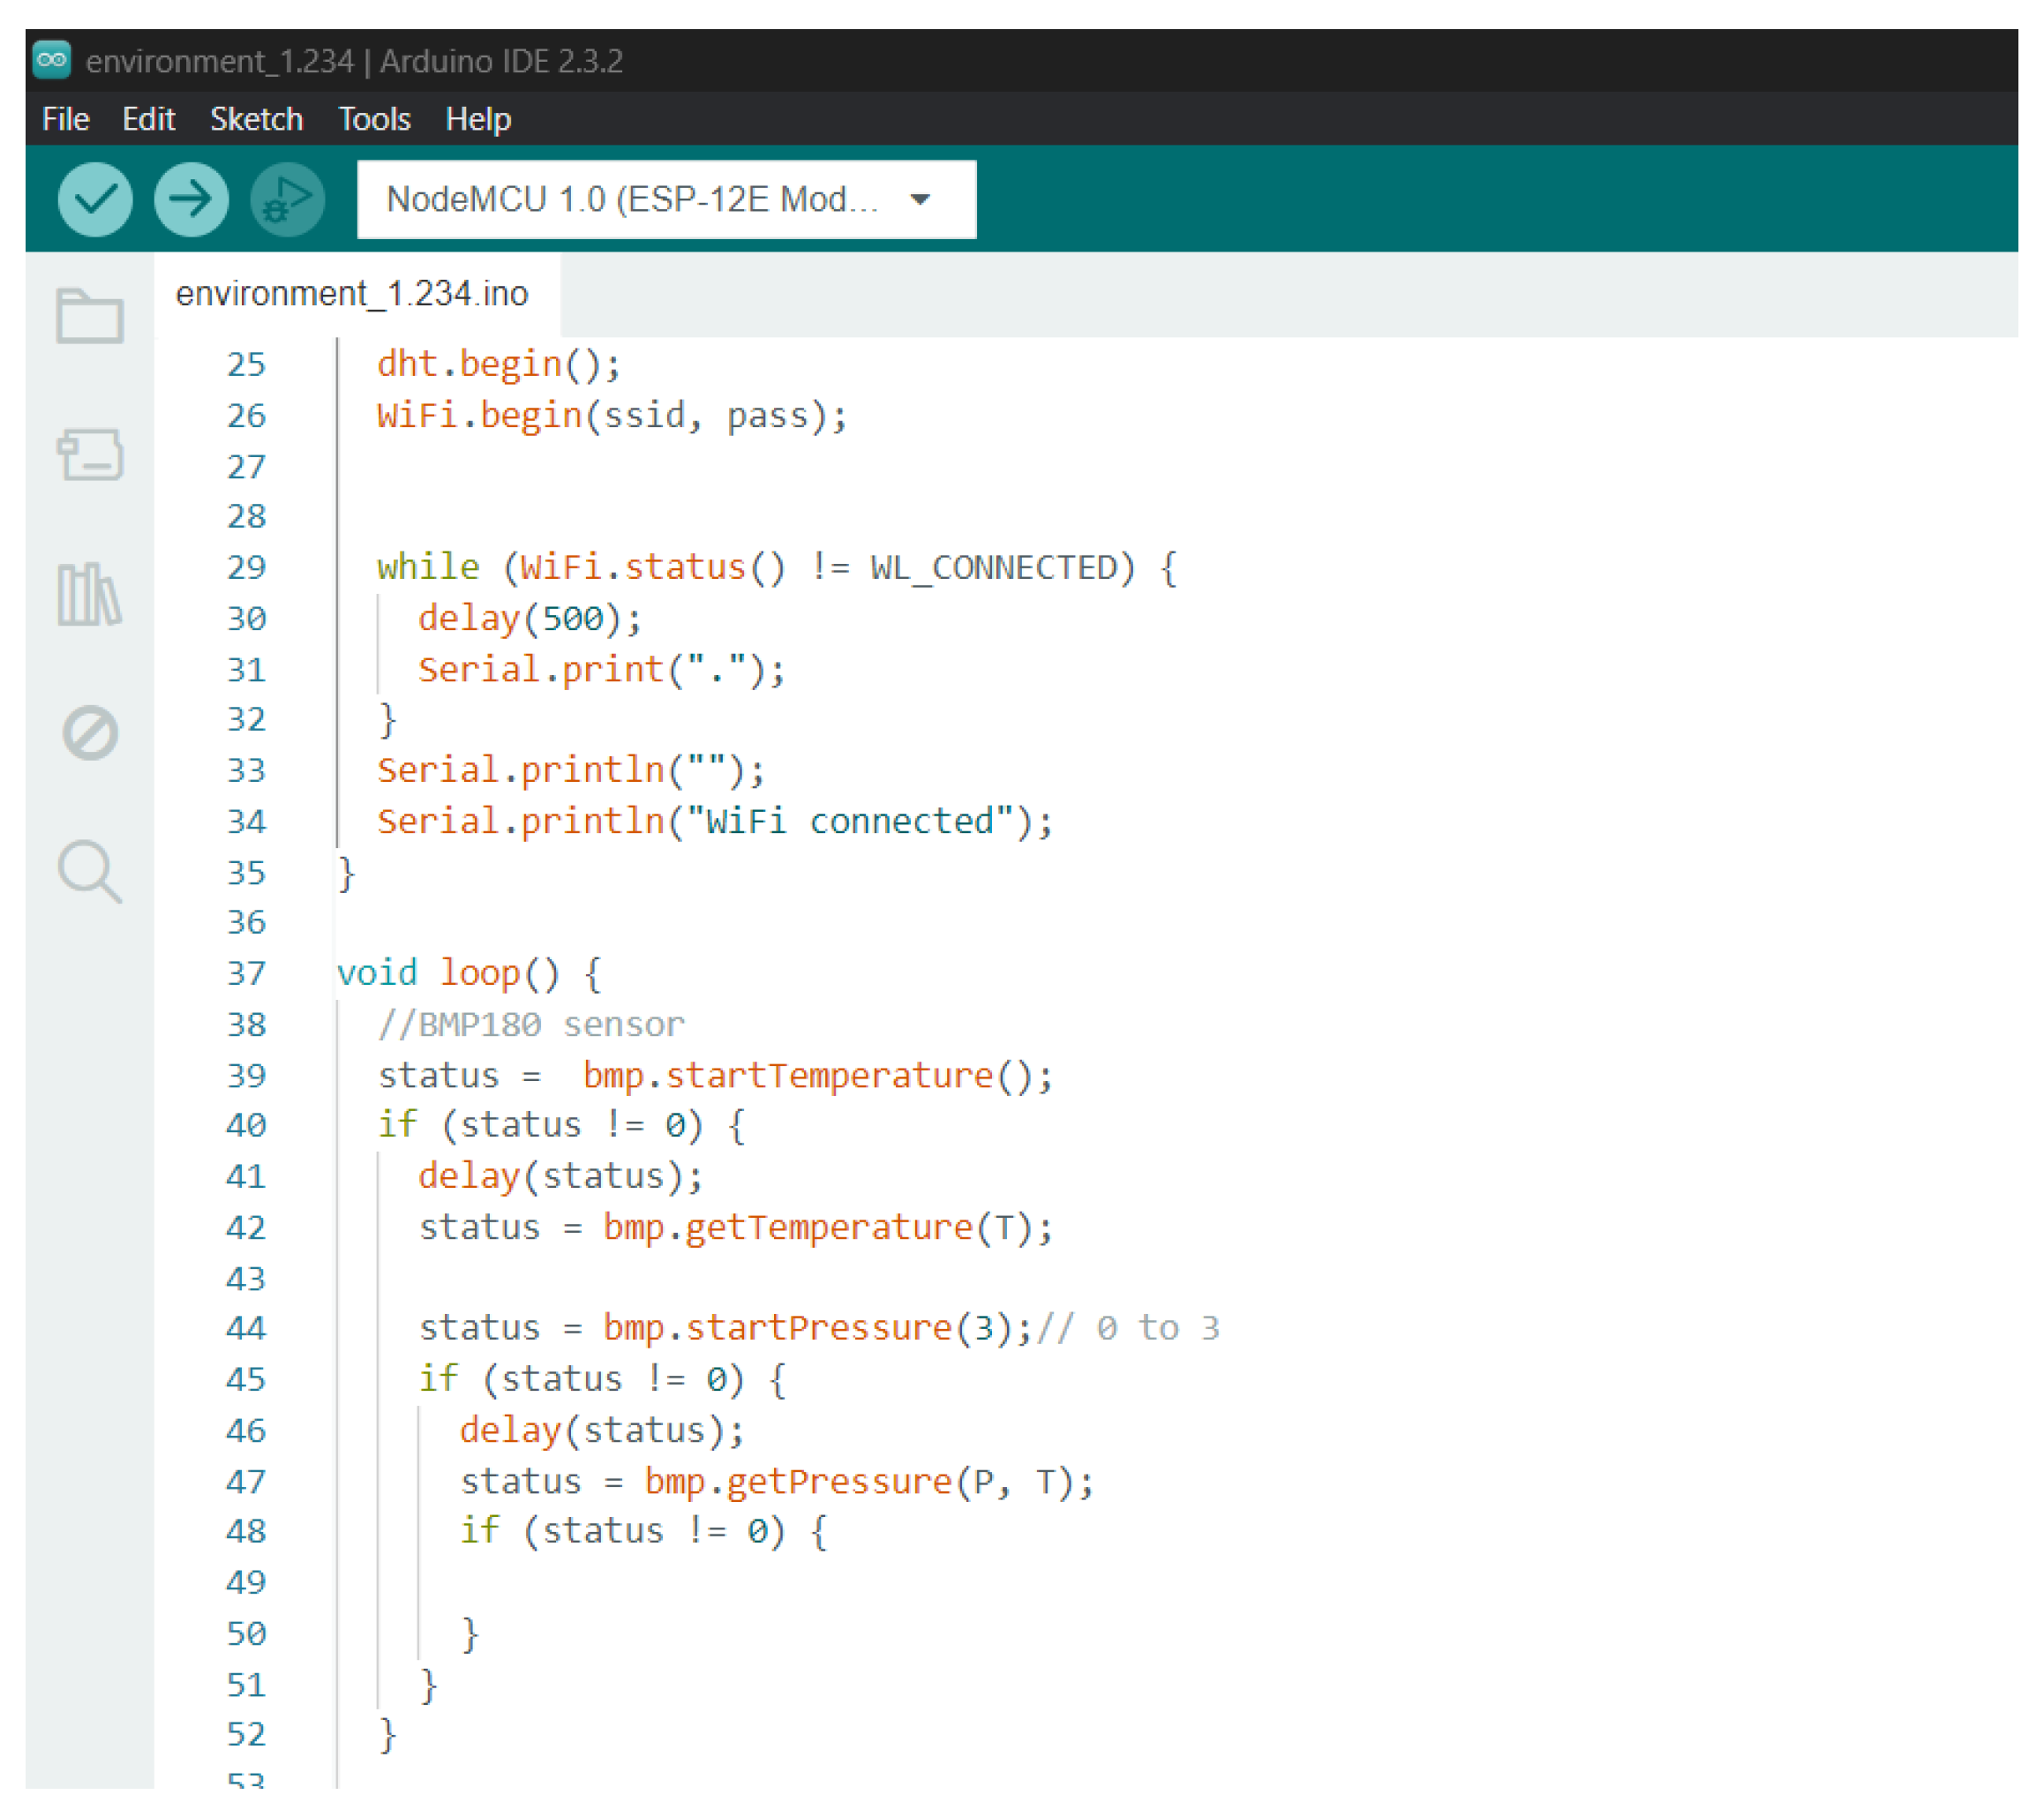
4. Methodology
5. Result and Discussion
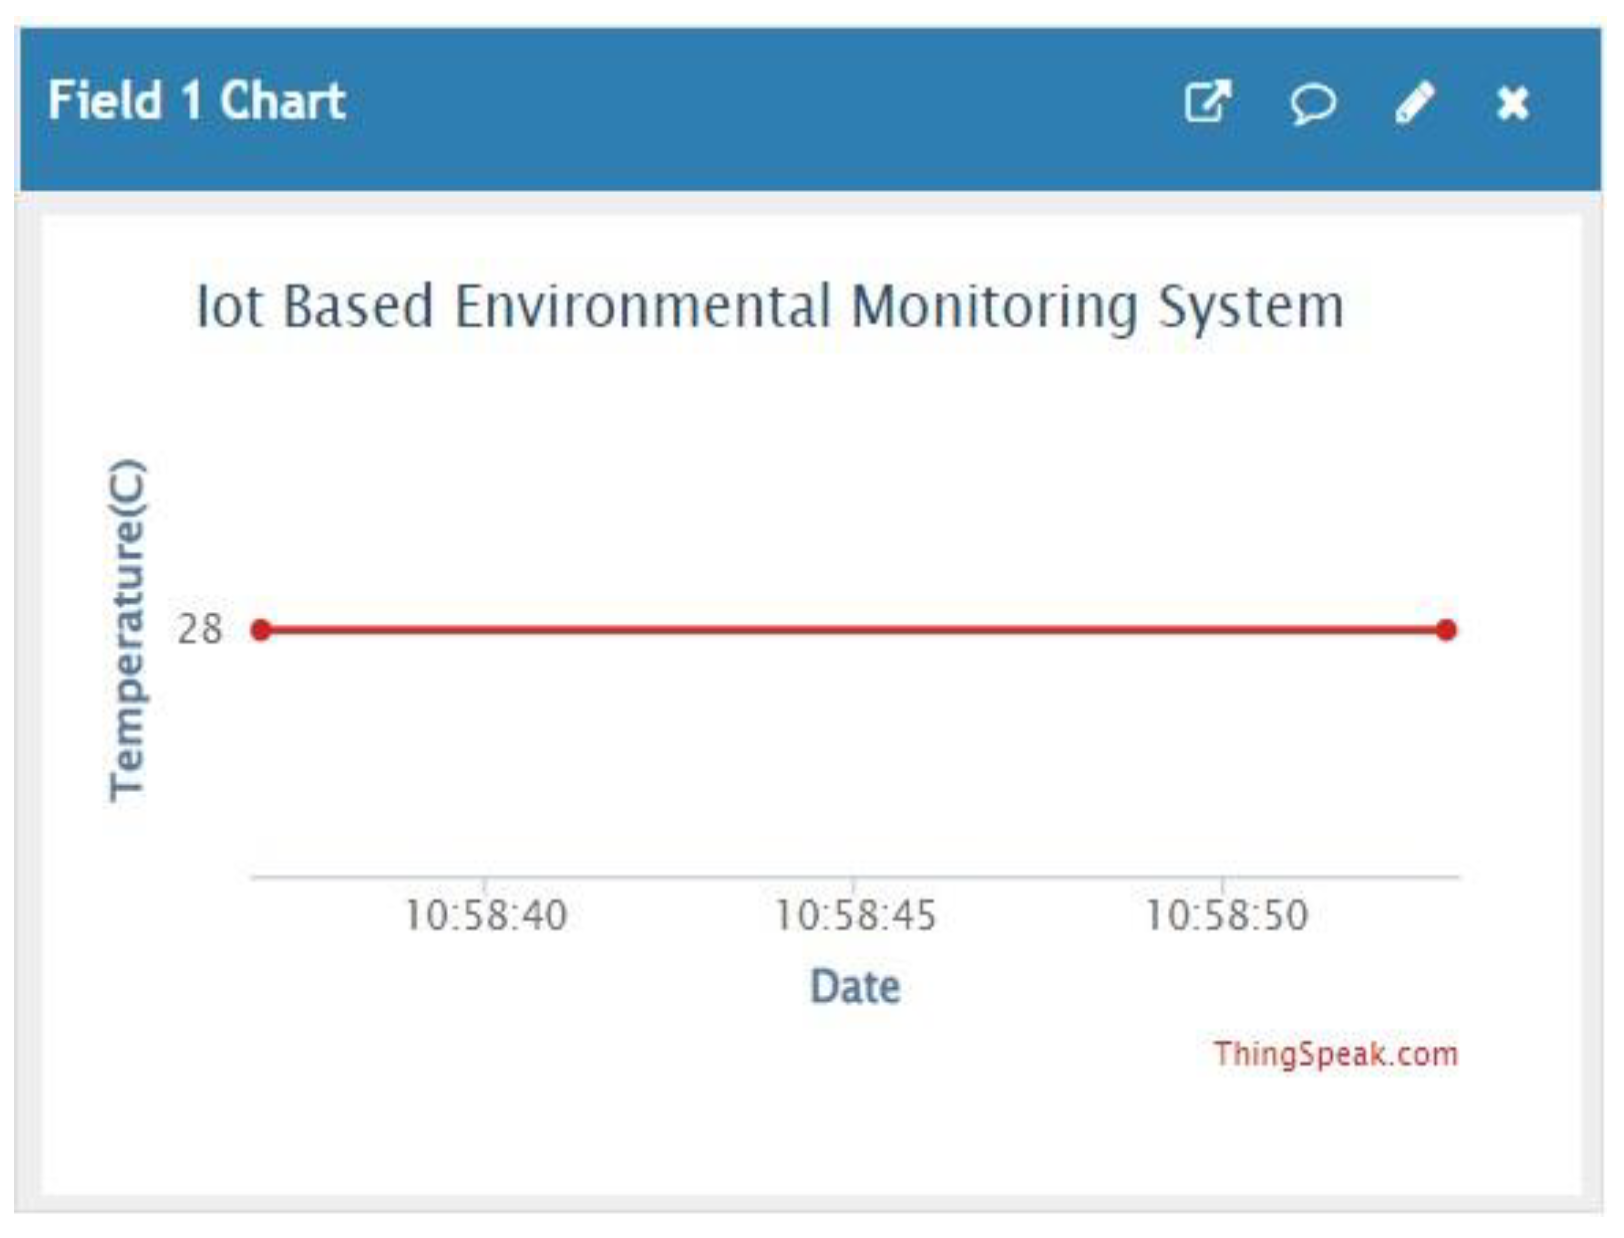
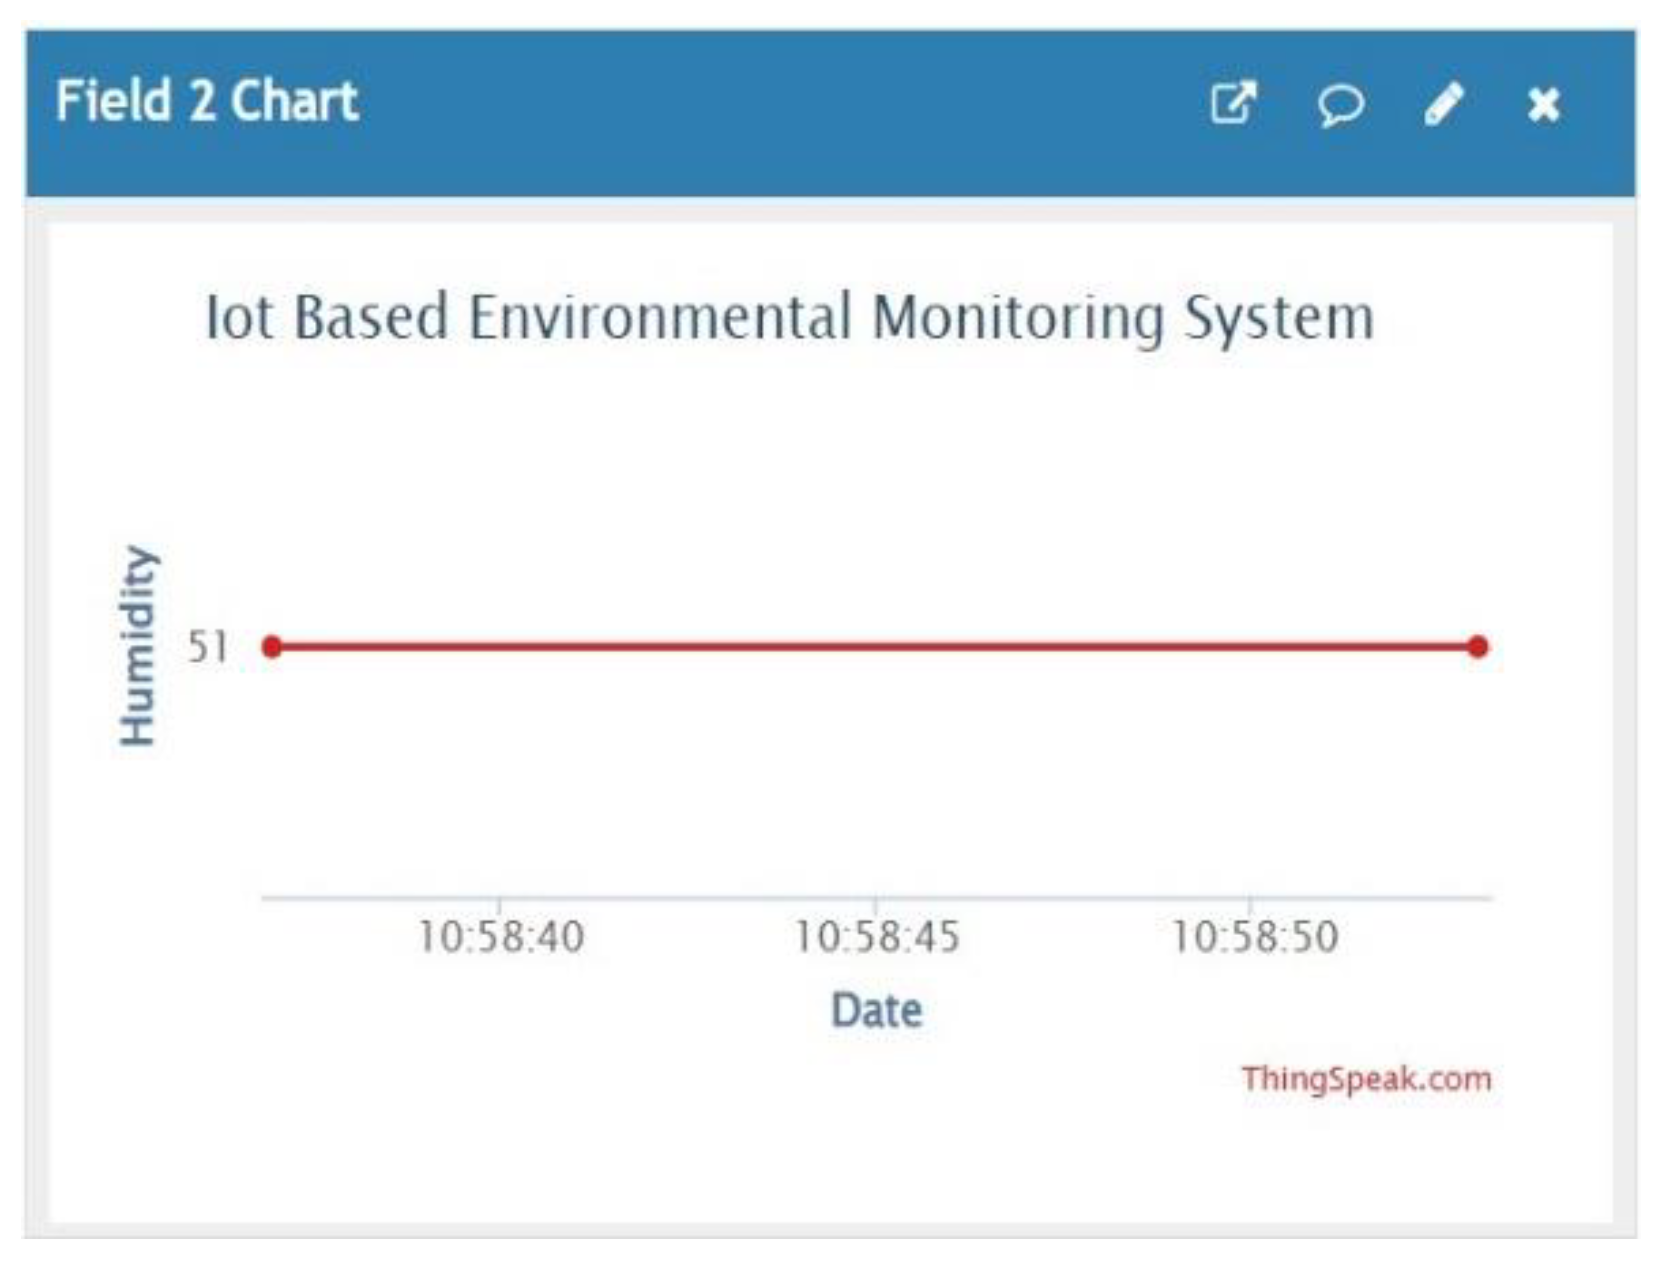
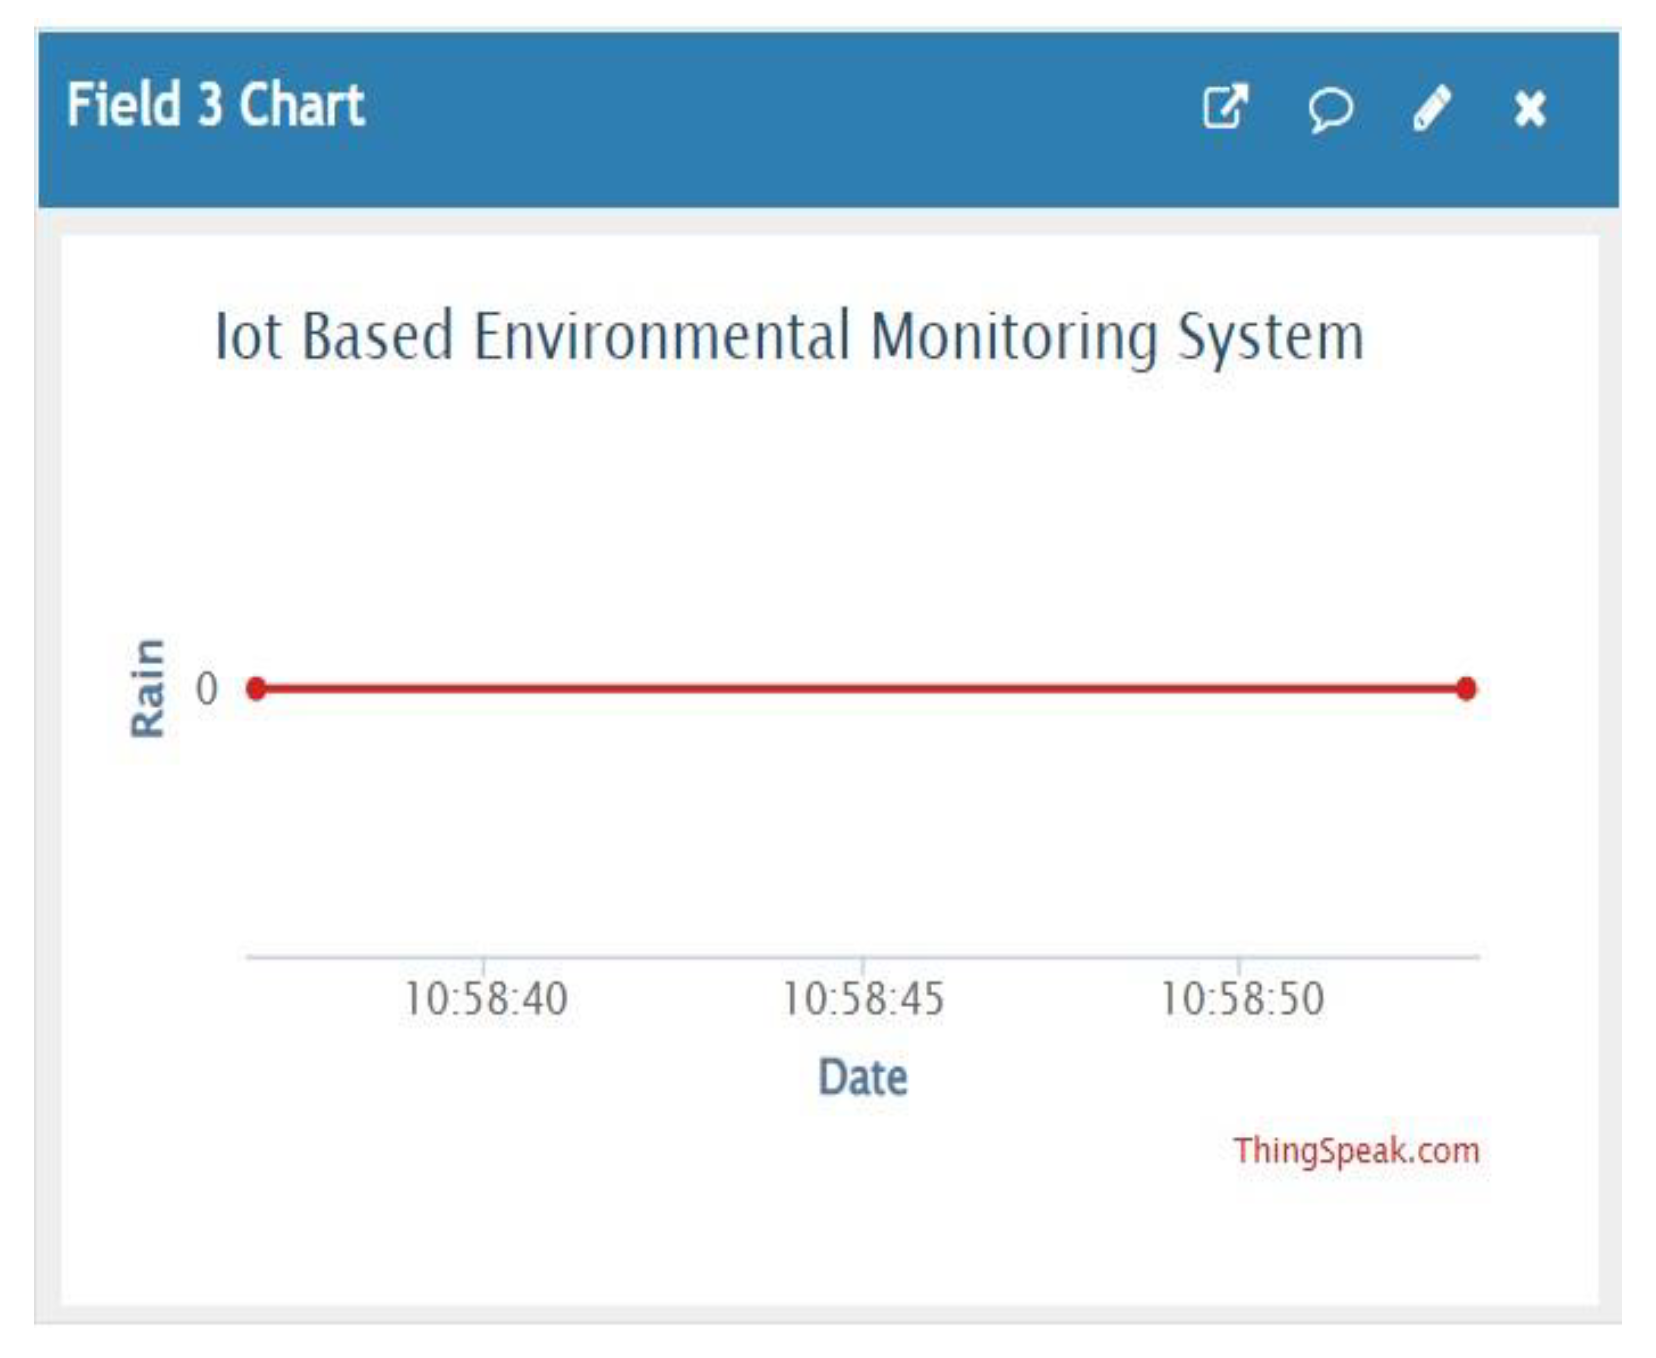
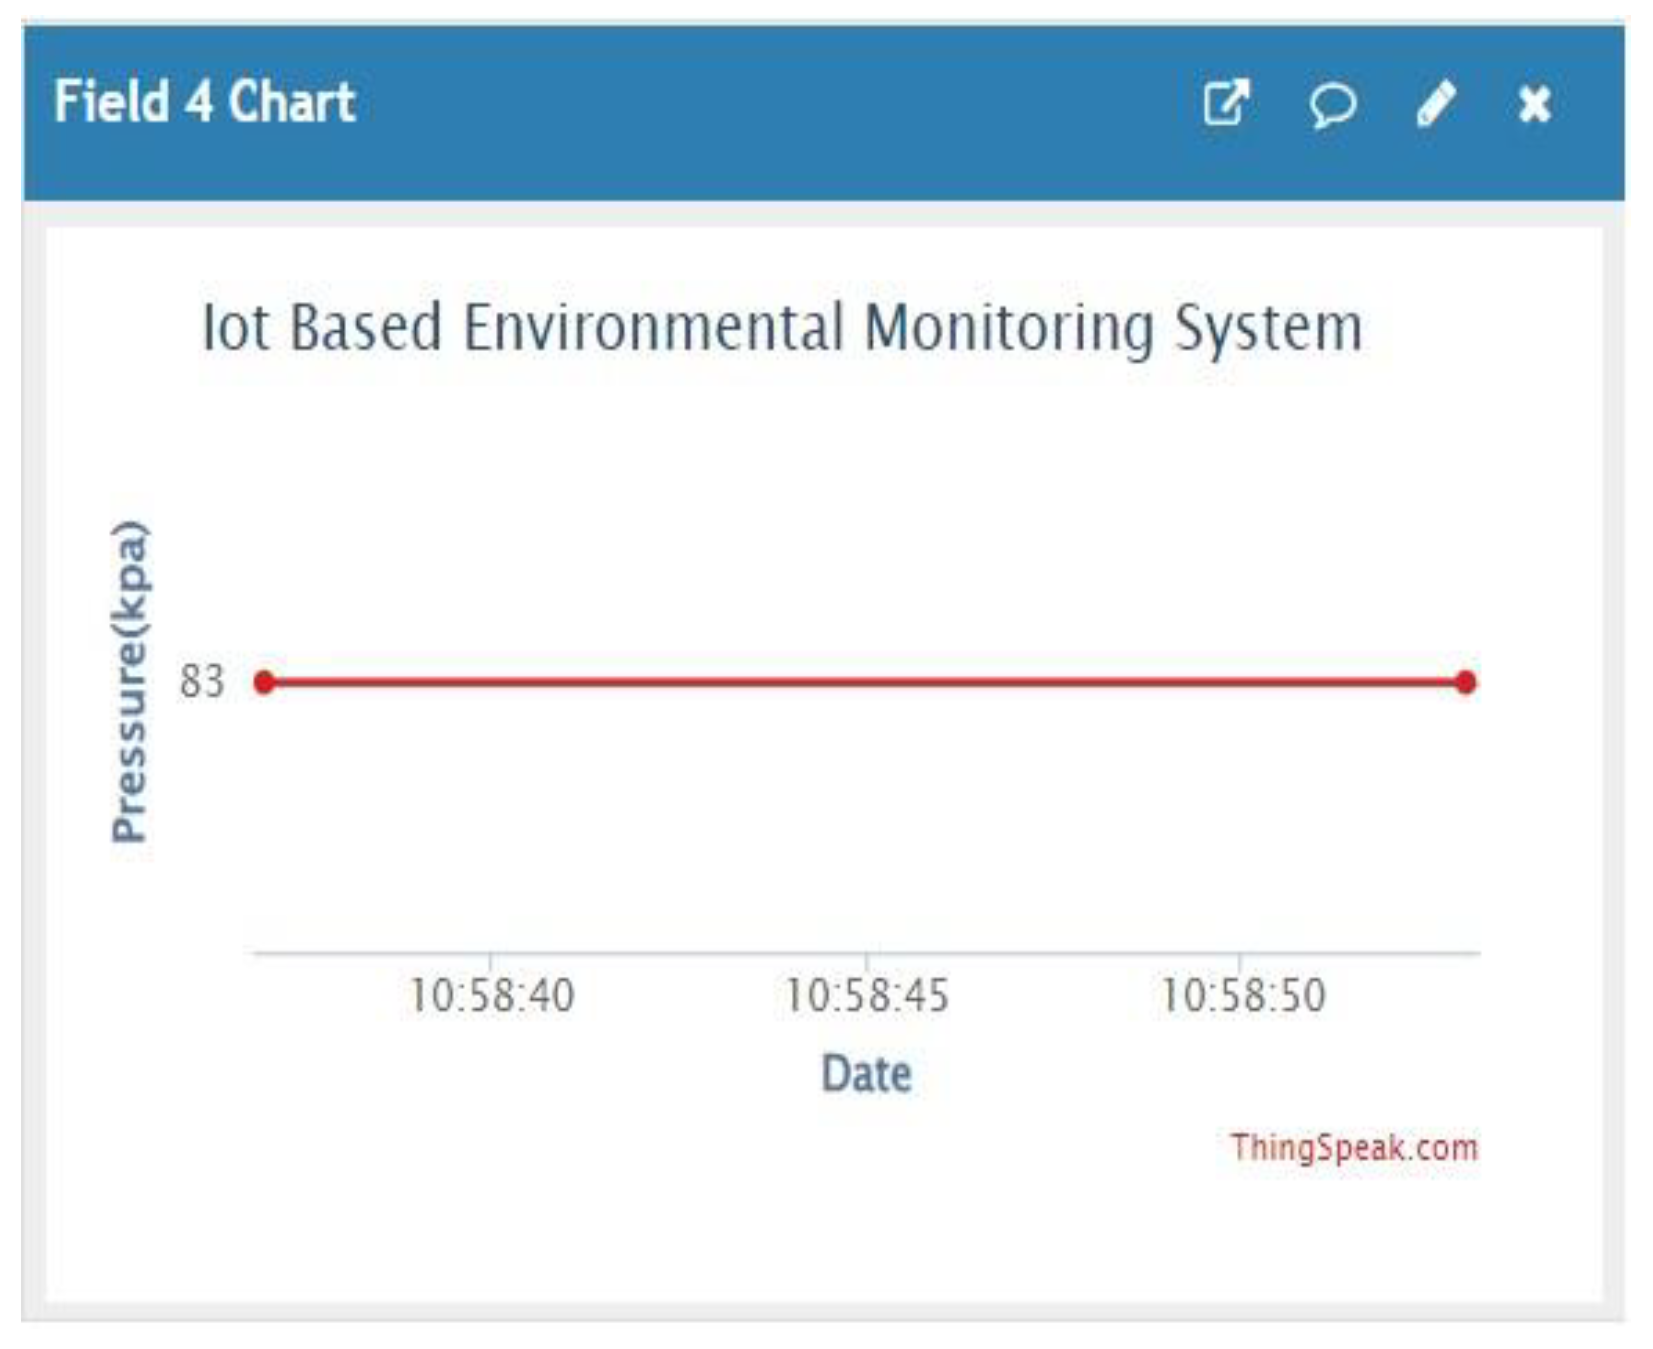
5.1. Result Graph
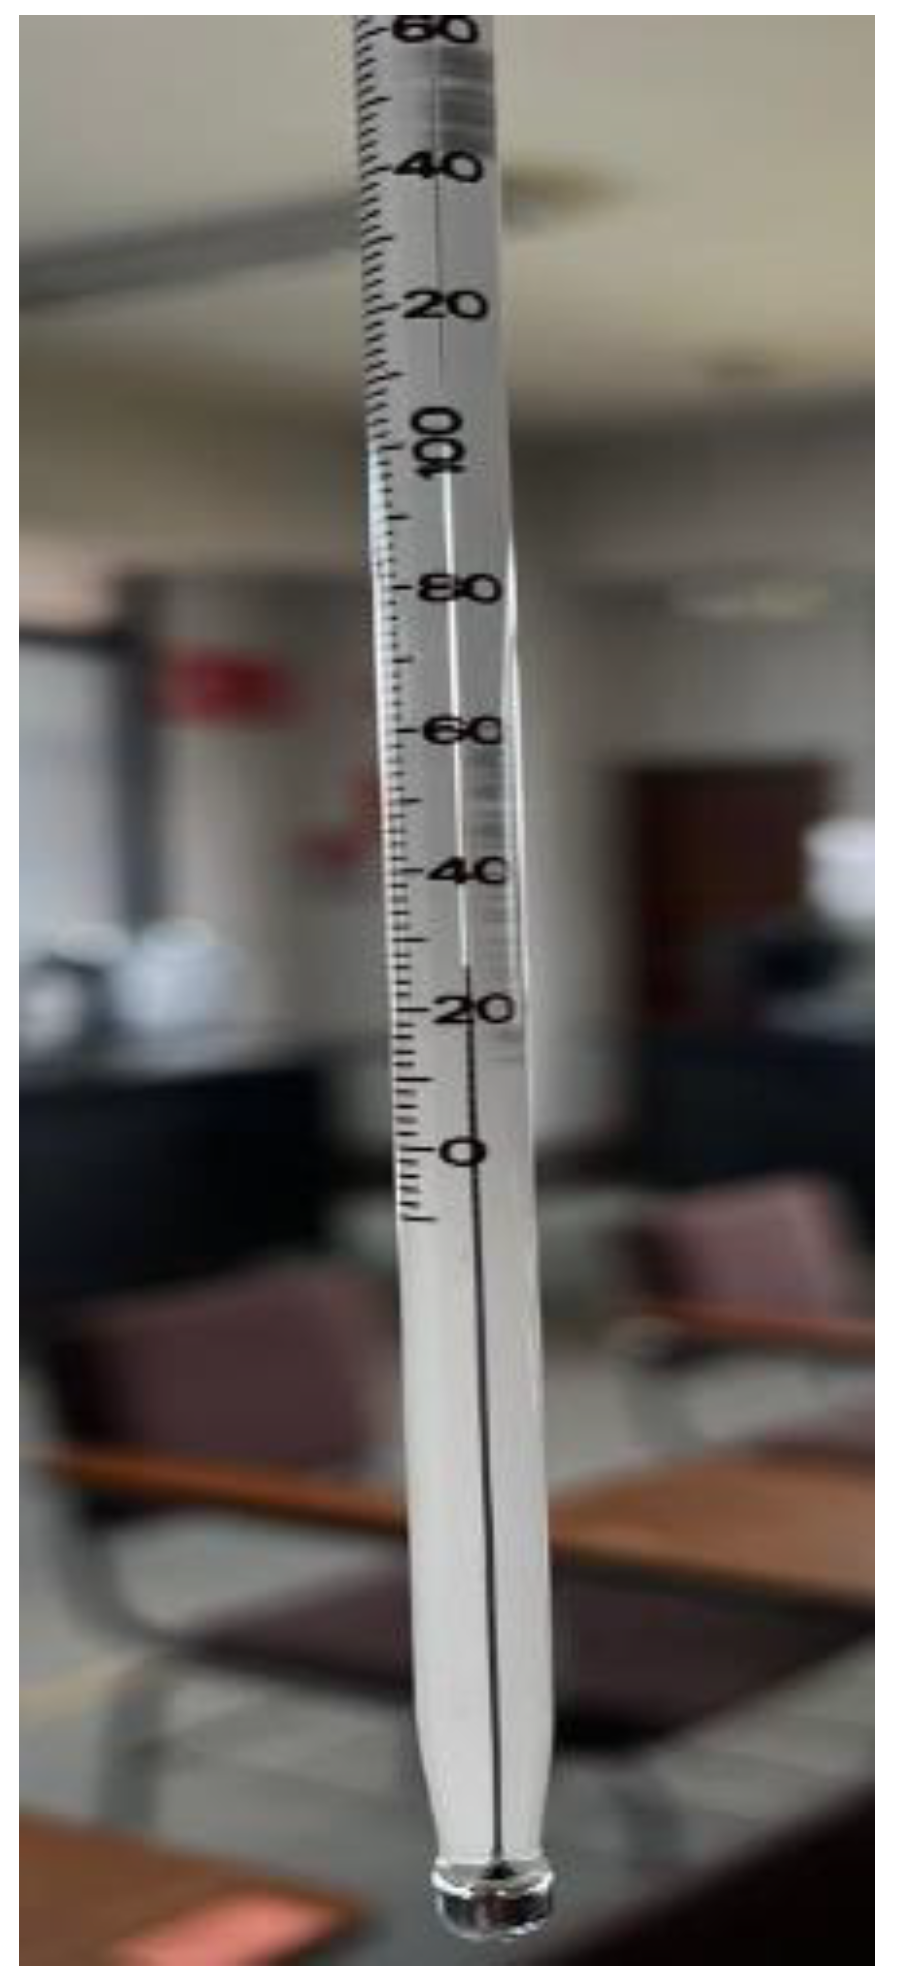
5.2. Result Validation
6. Conclusion
References
- European Parliament, 2015. The Internet of Things: Opportunities and challenges.
- Anas Tukur Balarabe, Abdurrashid Sani, Zahriya Lawal Hassan “An Arduino UNO Based Environment Monitoring System”, 2019.
- Ali Imam Sunny, Aobo Zhao, Li Li, Sambu Kanteh Sakiliba, “Low-Cost IoT-Based Sensor System: A Case Study on Harsh Environmental Monitoring”, 2020.
- Suhas Pandurang Nikam, Dr. S. M. Kulkarni, “IOT based Environmental Monitoring System”, 2021.
- Nanjundegowda K M, “IOT BASED REAL TIME ENVIRONMENTAL MONITORING SYSTEM USING BLINK APPLICATION”, 2022.
- Aparajita Das, Manash Pratim Sarma, Kandarpa Kumar Sarma, Nikos Mastorakis, “Design of an IoT based Real Time Environment Monitoring System using Legacy Sensors”, 2018.
- Mr. R. Deekshath, Ms. P. Dharanya, Ms. K. R. Dimpil Kabadia, Mr. G. Deepak Dinakaran, Ms. K. R. Dimpil Kabadia, “IoT Based Environmental Monitoring System using Arduino UNO and Thingspeak”, 2018.
- 8. Mukesh Ranjan Sahay, Muthu Kumar Sukumaran, Sudha Amarnath, Thirumalai Nambi Doss Palani, “Environmental Monitoring System Using IoT and Cloud Service at Real-Time”, 2019.
- RoboticsBD, “ESP8266 CH340 NodeMCU Wifi Module Lua V3”, 2022.
- EL-PRO-CUS, “DHT11 Sensor and Its Working”.
- RoboticsBD, “DHT11 Temperature and Relative Humidity Sensor Module for Arduino”, 2022.
- Components101, “DHT11–Temperature and Humidity Sensor”, 2021.
- Techatronic, “DHT11 TEMPERATURE AND HUMIDITY SENSOR | DHT11 SENSOR”,2022.
- Components101, “BMP180 - Atmospheric Pressure Sensor”, 2018.
- RoboticsBD, “Humidity Detection Sensor Module Rain Detection for Arduino”, 2022.
- EL-PRO-CUS, “Rain Sensor Working and Its Applications”.
- RF Wireless World, “Advantages of Rain sensor | Disadvantages of Rain sensor”, 2012.
| Temperature (C) | Humidity (%) | Pressure(kPa) | ||||
|---|---|---|---|---|---|---|
| DHT 11 Sensor | 28 | DHT 11 sensor | 51 | BMP 180 | 83 | |
| Thermometer | 27 | From Internet | 52 | From internet | 99 | |
| Error = | 3.57% | Error = | 1.96% | Error = | 19.20% | |
Disclaimer/Publisher’s Note: The statements, opinions and data contained in all publications are solely those of the individual author(s) and contributor(s) and not of MDPI and/or the editor(s). MDPI and/or the editor(s) disclaim responsibility for any injury to people or property resulting from any ideas, methods, instructions or products referred to in the content. |
© 2025 by the authors. Licensee MDPI, Basel, Switzerland. This article is an open access article distributed under the terms and conditions of the Creative Commons Attribution (CC BY) license (http://creativecommons.org/licenses/by/4.0/).


