1. Introduction
The Internet of Things (IoT) is a widespread network linking physical devices that can monitor or interact with their surroundings and communicate with other devices, systems, or computers. Data from these devices can be gathered and analyzed to uncover valuable insights, enabling actions that reduce costs, enhance efficiency, or improve products and services [
1].
During the last couple of years, the protection of the environment has become a very important issue for almost all countries in the world. Since industrialization has grown rapidly and uncontrolled for the last couple of decades, pollution has emerged as a growing menace that has pressed the need for constant monitoring of environmental data. The IoT ecosystem consists of web-enabled smart devices leveraging embedded systems of processors, sensors, and communication hardware for collecting, transmitting, and acting upon environmental data. IoT devices send the gathered sensor information to an IoT gateway or another edge device, where it is forwarded to the cloud for analysis or processed locally. Sometimes these devices also connect with other devices, sharing information utilized in making autonomous changes as needed based on the data provided. While IoT devices can generally function independently, users interact with these devices to perform setups, issue commands, or collect data. This has also made the WSNs a hotbed of research due to their very extensive applications in strategic sectors such as defense, healthcare, environmental monitoring, safety, and civil infrastructure. Several examples for WSN-based environment monitoring systems have been reported in the literature that have been developed for a wide range of purposes [
2]. An idea about IoT to measure the pressure, temperature, humidity & rainfall possibility is presented in this paper. For our major equipment for measuring temperature, the DHT-11 sensor was chosen. For pressure measurement, a BMP 180 sensor and a raindrop sensor to detect rain were chosen. A Wi-Fi module was used to power the entire system.
2. Literature Review
An IoT-based multi-purpose monitoring system, especially for nuclear storage purposes, has been implemented atop Commercial-Off-The-Shelf (COTS) hardware with a hydrogen-temperature-and-concentration-measuring system [
3]. The system strategy involves tiny autonomous wireless sensor nodes, internet-connected wireless receivers, and a cloud architecture for data storage, connecting to the Internet, and delivering to clients who stay far away. Besides being effective in the prediction of weather conditions like rain, the system suggested herein can measure humidity, temperature, and the amount of CO gas [
4]. The system is designed for the proposition of an Android app for real-time logistics monitoring. The system provides all environmental parameters, such as temperature, humidity, fire, smoke, and others, along with location. These readings are measured through sensors, and then further sent via Wi-Fi to a web server where one can access these readings from any geographical location. The findings fetched from this real-time data are displayed to the user through the created Android application [
5]. HTTP protocol was used to send data from the sensors, through the proposed system, to the ThingSpeak API, which has the provision for storing transmitted sensor data. It showed reliable performance and demonstrated that the prototype was able to monitor and analyze real-time environmental data through graphical representation [
6].
3. Project Elements
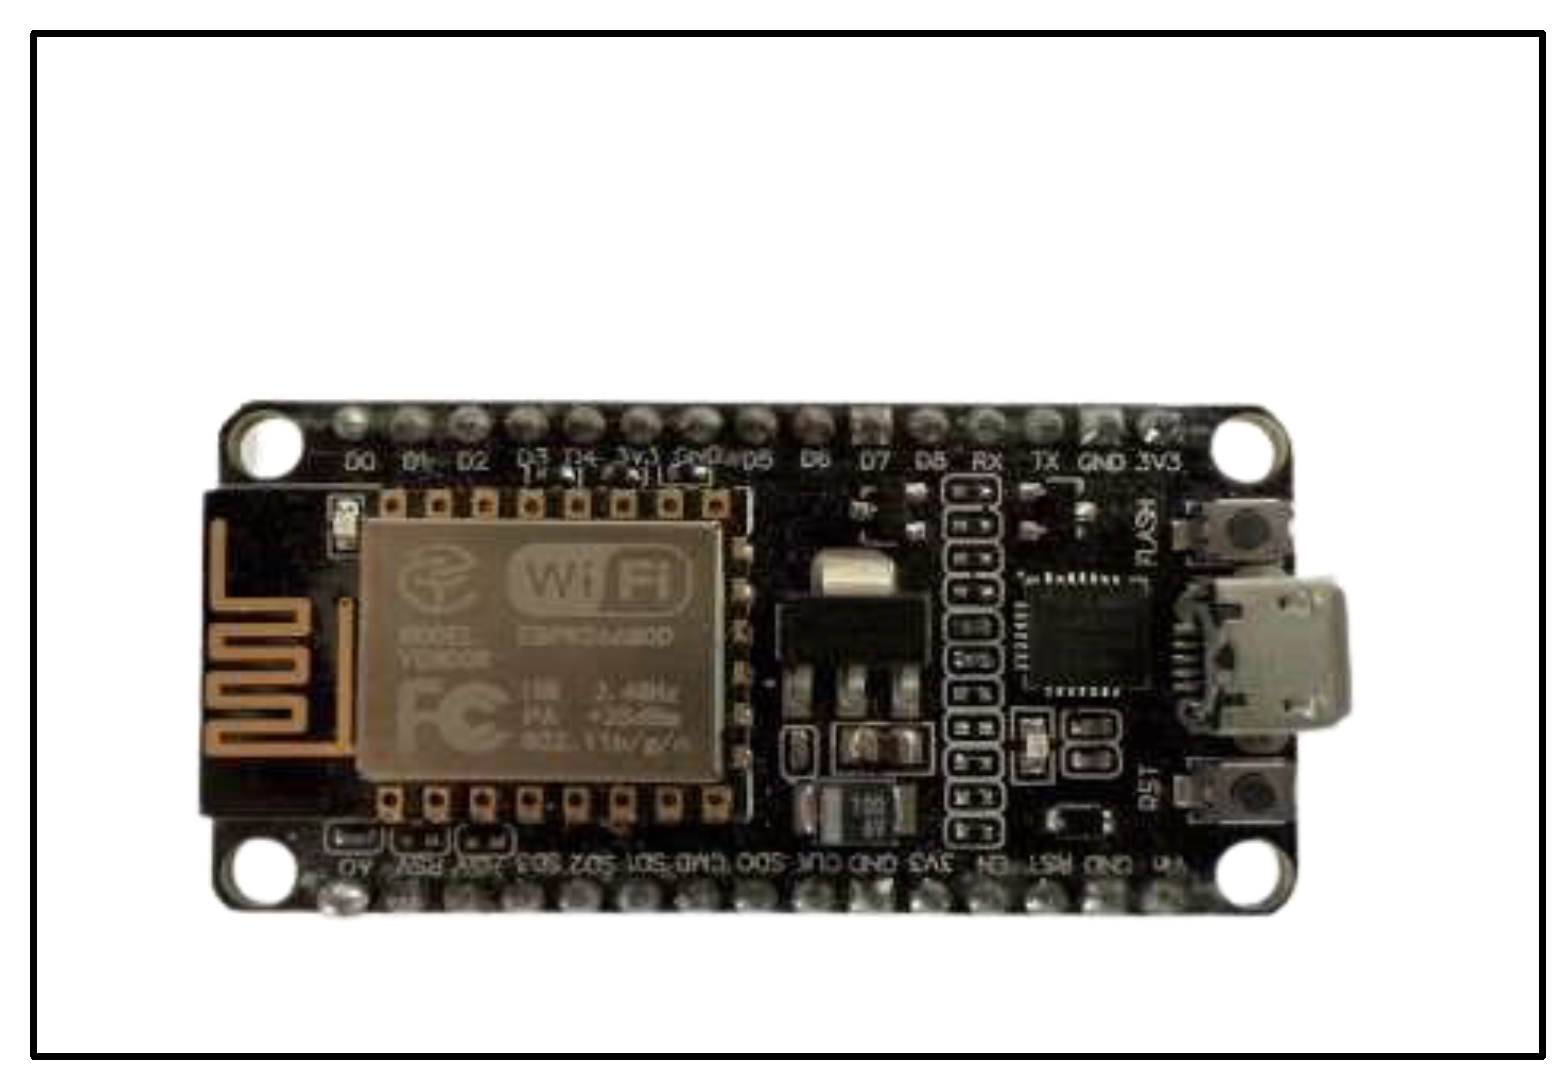
3.1. NodeMCU
The NodeMCU is an open-source software and hardware development environment, centered around an extremely low-cost System-on-a-Chip. Hardware consists of firmware based on the ESP8266 Wi-Fi SoC, as well as hardware based on the ESP12 module. Over time, there have been quite several different ESP modules, each with its pros and cons. However, NodeMCU boards are available in only two versions: 0.9 and 1.0. Given that the ESP8266 was more recent than the Arduino, its stronger specifications are unsurprising. The compact size and integrated Wi-Fi make the device perfect for IoT applications [
4].
Product specification of ESP 8266[
9]
:
Power input: 4.5V ~ 9V (10VMAX), USB-powered
Transfer rate: 110-460800bps
Support Smart Link Smart Networking
Working temperature: -40°C to 125°C
Connected to 2.4 GHz Wi-Fi
Wireless 802.11 b/g/n standard
Open-source, Interactive, Programmable, Low-cost, Simple, Smart, WI-FI enabled.
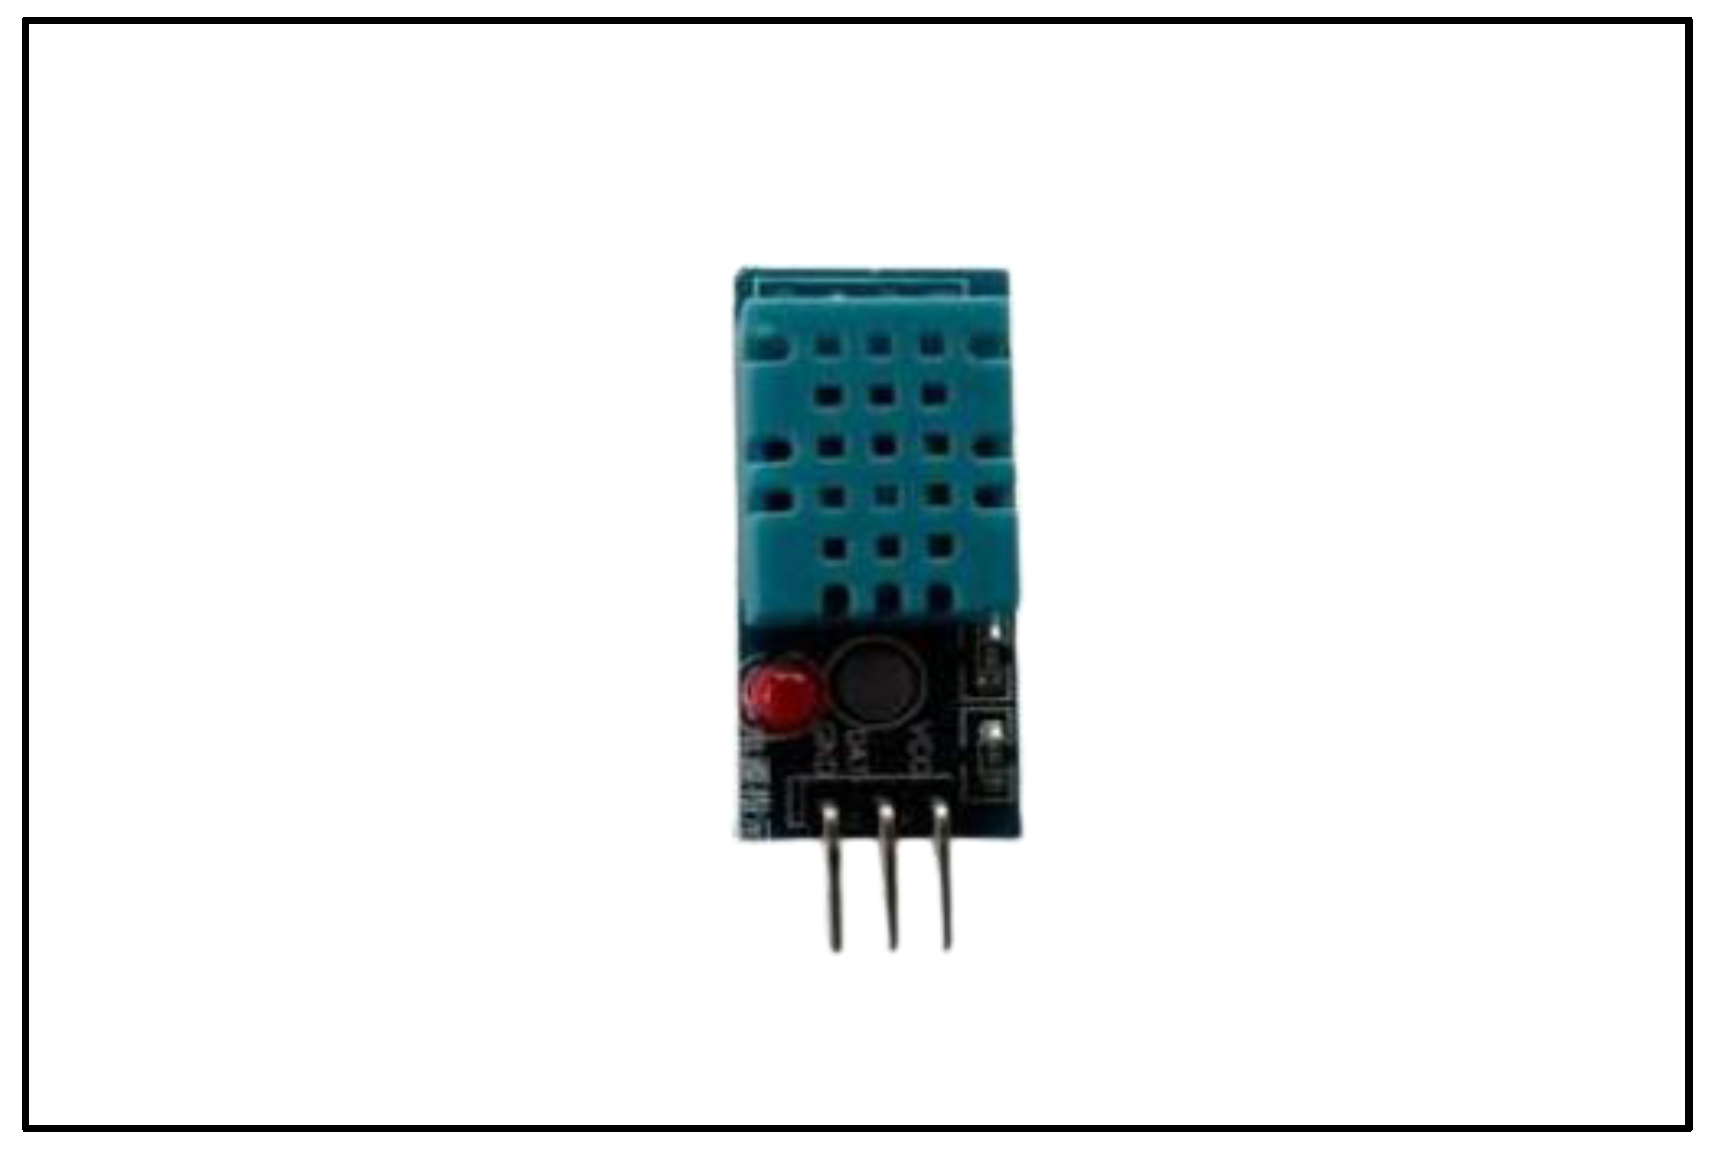
3.2. Temperature and Humidity Sensor (DHT 11)
DHT 11 collects data on humidity and temperature, making it very suitable for applications such as weather stations in remote areas, home environment control, and agricultural or garden monitoring systems. It includes a capacitive humidity-sensing element and a thermistor for temperature measurement. The humidity-sensing element contains two electrodes with a moisture-absorbing substrate as a dielectric between them; the capacitance value varies as the humidity levels change. Internal IC processes the changes in capacitance into digital form. In the case of temperature measurement, the sensor utilizes a Negative Temperature Coefficient (NTC) thermistor type of thermistor whose resistance decreases with an increase in temperature. Being very sensitive to a range of temperatures, it possesses semiconductor ceramics or polymers, and even minor temperature changes can easily provide noticeable changes in resistance.[
10]. Only three connections are required to be made to use the sensor Vcc, Gnd, and Output [
11].
Features and general specification [
11]
:
Low-cost Module.
I/O power is 5V.
Good for 20-80% humidity readings with 5% accuracy.
Good for 0-50°C temperature readings ±2°C accuracy.
No more than 1 Hz sampling rate (once every second).
Resolution: 16 bit
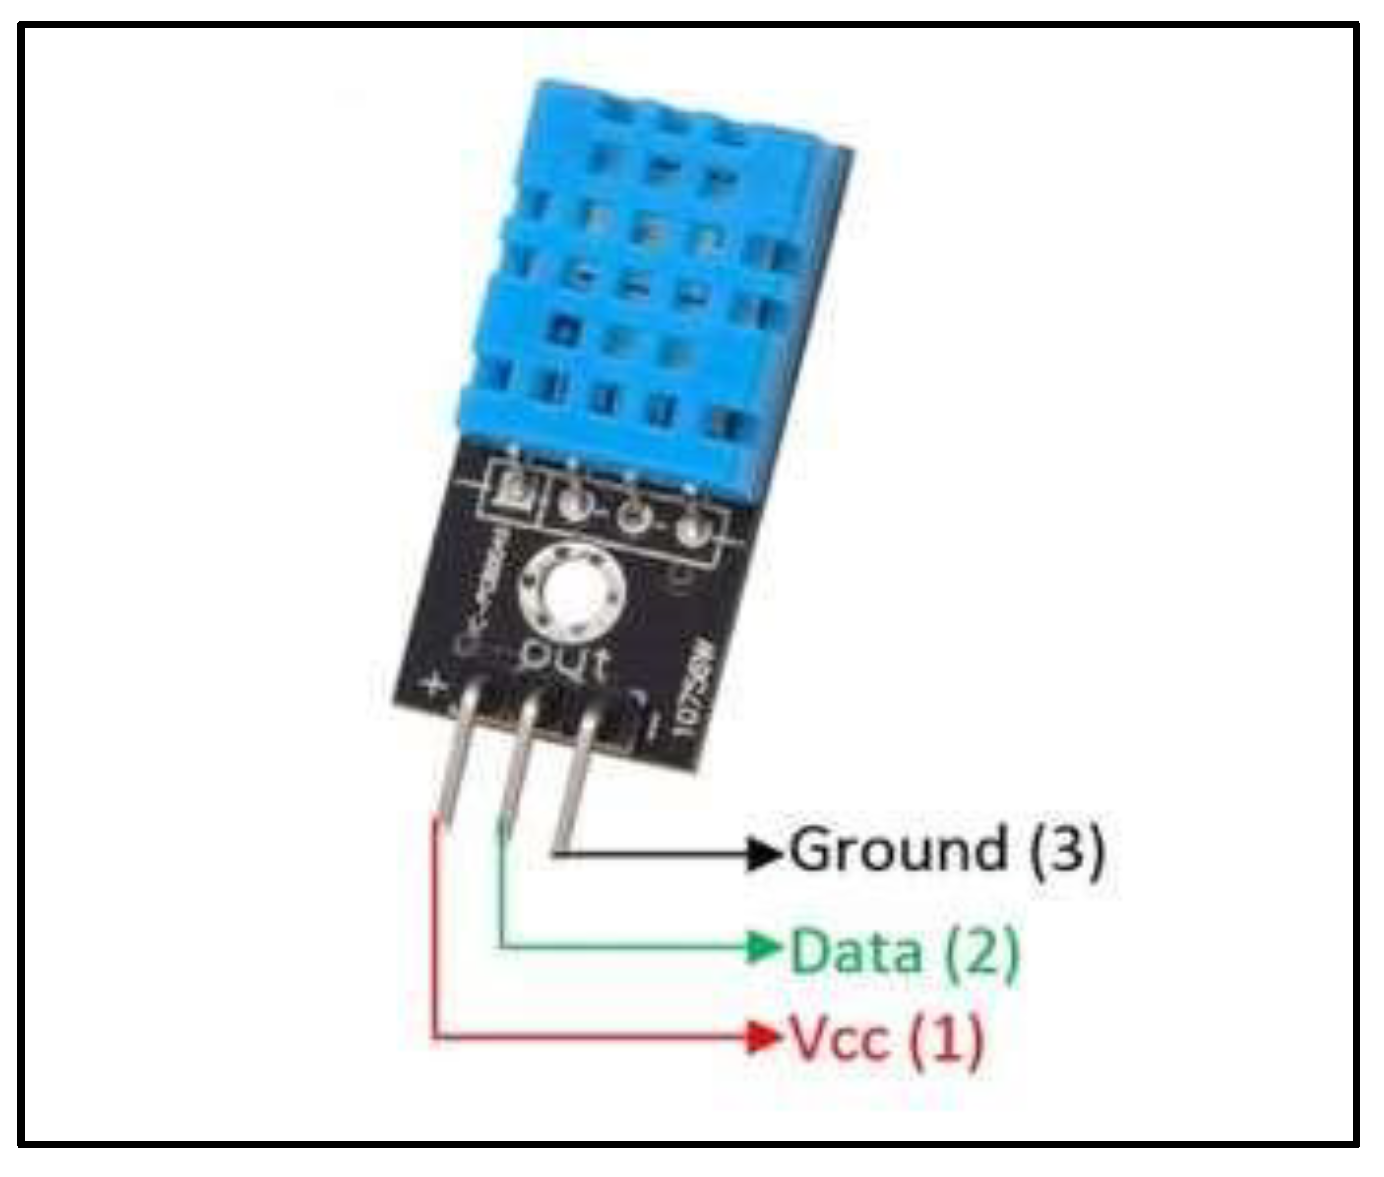
Figure 3.
Pin diagram of DHT11 [
12].
Figure 3.
Pin diagram of DHT11 [
12].
Table 1.
Pins of DHT 11 [
12].
Table 1.
Pins of DHT 11 [
12].
| Pin Name |
Description |
| VCC |
Power supply |
| Data |
Outputs of Temperature and Humidity data |
| Ground |
Connected to the ground of the circuit |
Application:
The applications of the DHT 11 sensor are given below:
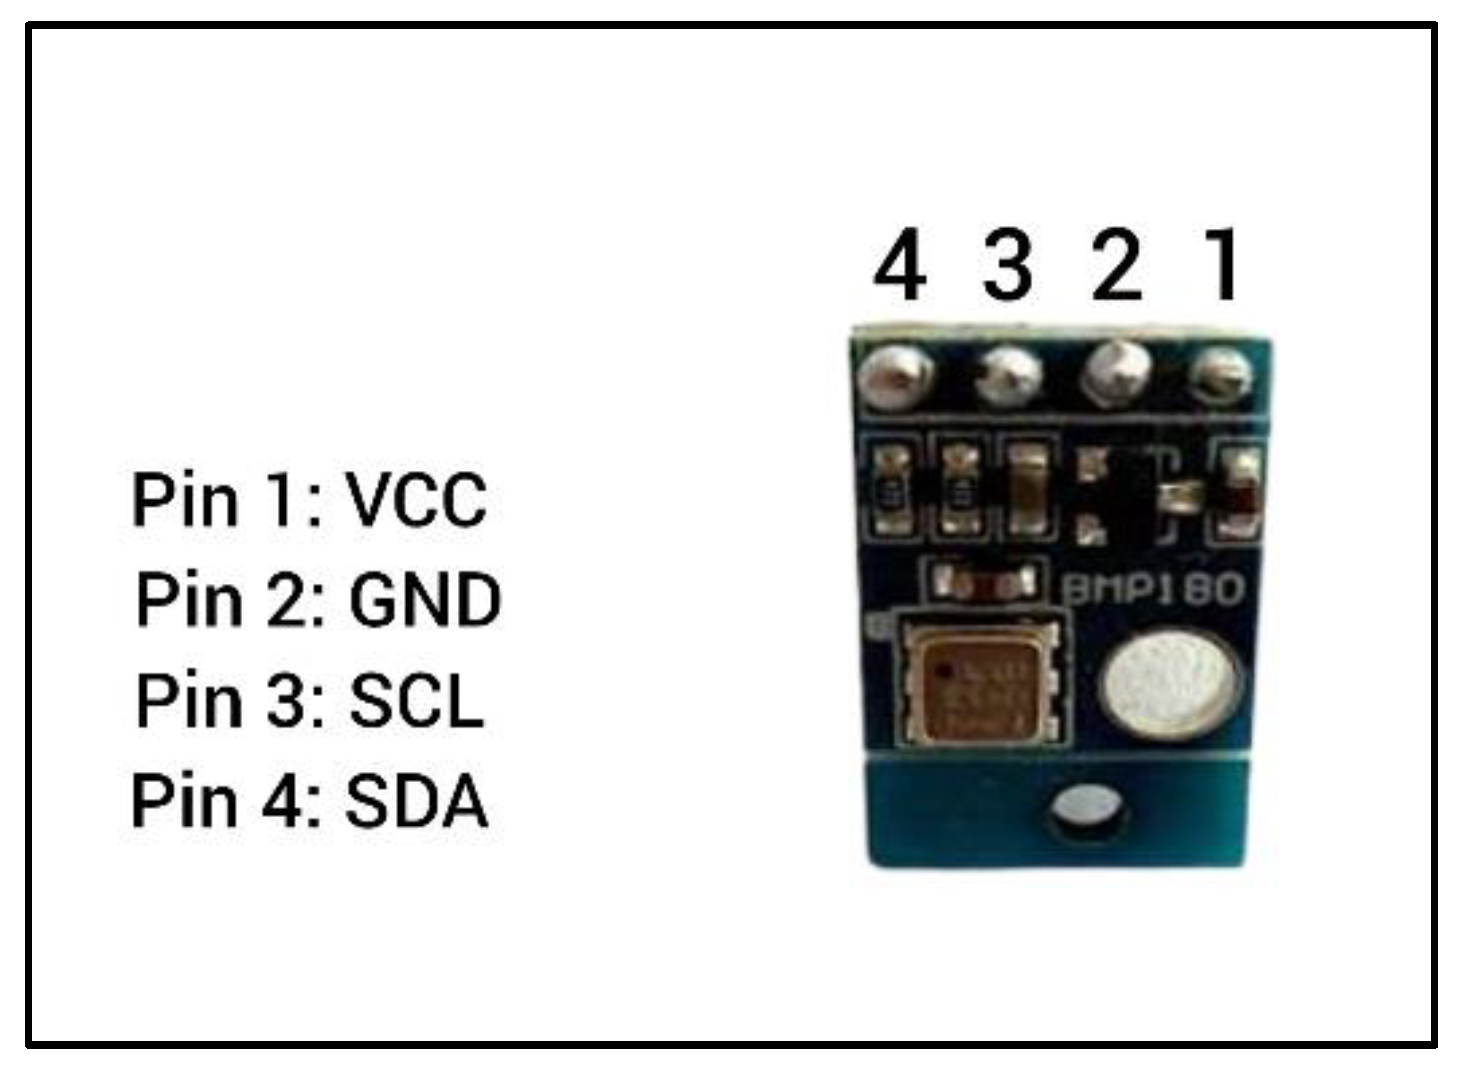
3.3. Pressure Sensor (BMP 180)
BMP180 sensors are designed for precise measurement of barometric or atmospheric pressure. Barometric pressure refers to the weight that air exerts on surfaces, and the BMP180 detects this air pressure and outputs data in digital form. Because temperature affects pressure, it requires temperature compensation in order to create accurate readings. Due to that fact, the BMP180 includes a very decent temperature sensor to provide precise compensated pressure measurements [
14].
Features and specifications [14]:
Operating temperature: -40ºC to +80ºC
Potable size
Low power consumption (3uA)
Operating voltage of BMP180: 1.3V – 3.6V
Input voltage of BMP180 MODULE: 3.3V to 5.5V
Maximum voltage at SDA, SCL: VCC + 0.3V
Figure 4.
BMP 180 sensor and pin diagram.
Figure 4.
BMP 180 sensor and pin diagram.
Table 2.
Pins of BMP 180[
14].
Table 2.
Pins of BMP 180[
14].
| Pin Name |
Description |
| VCC |
Power supply |
| Ground |
Connected to the ground of the circuit |
| SCL |
Serial Clock Pin |
| SDA |
Serial Data Pin |
Applications:
The applications of BMP 180 sensor are given below:
- i.
Indoor navigation
- i.
Vertical velocity indication
- i.
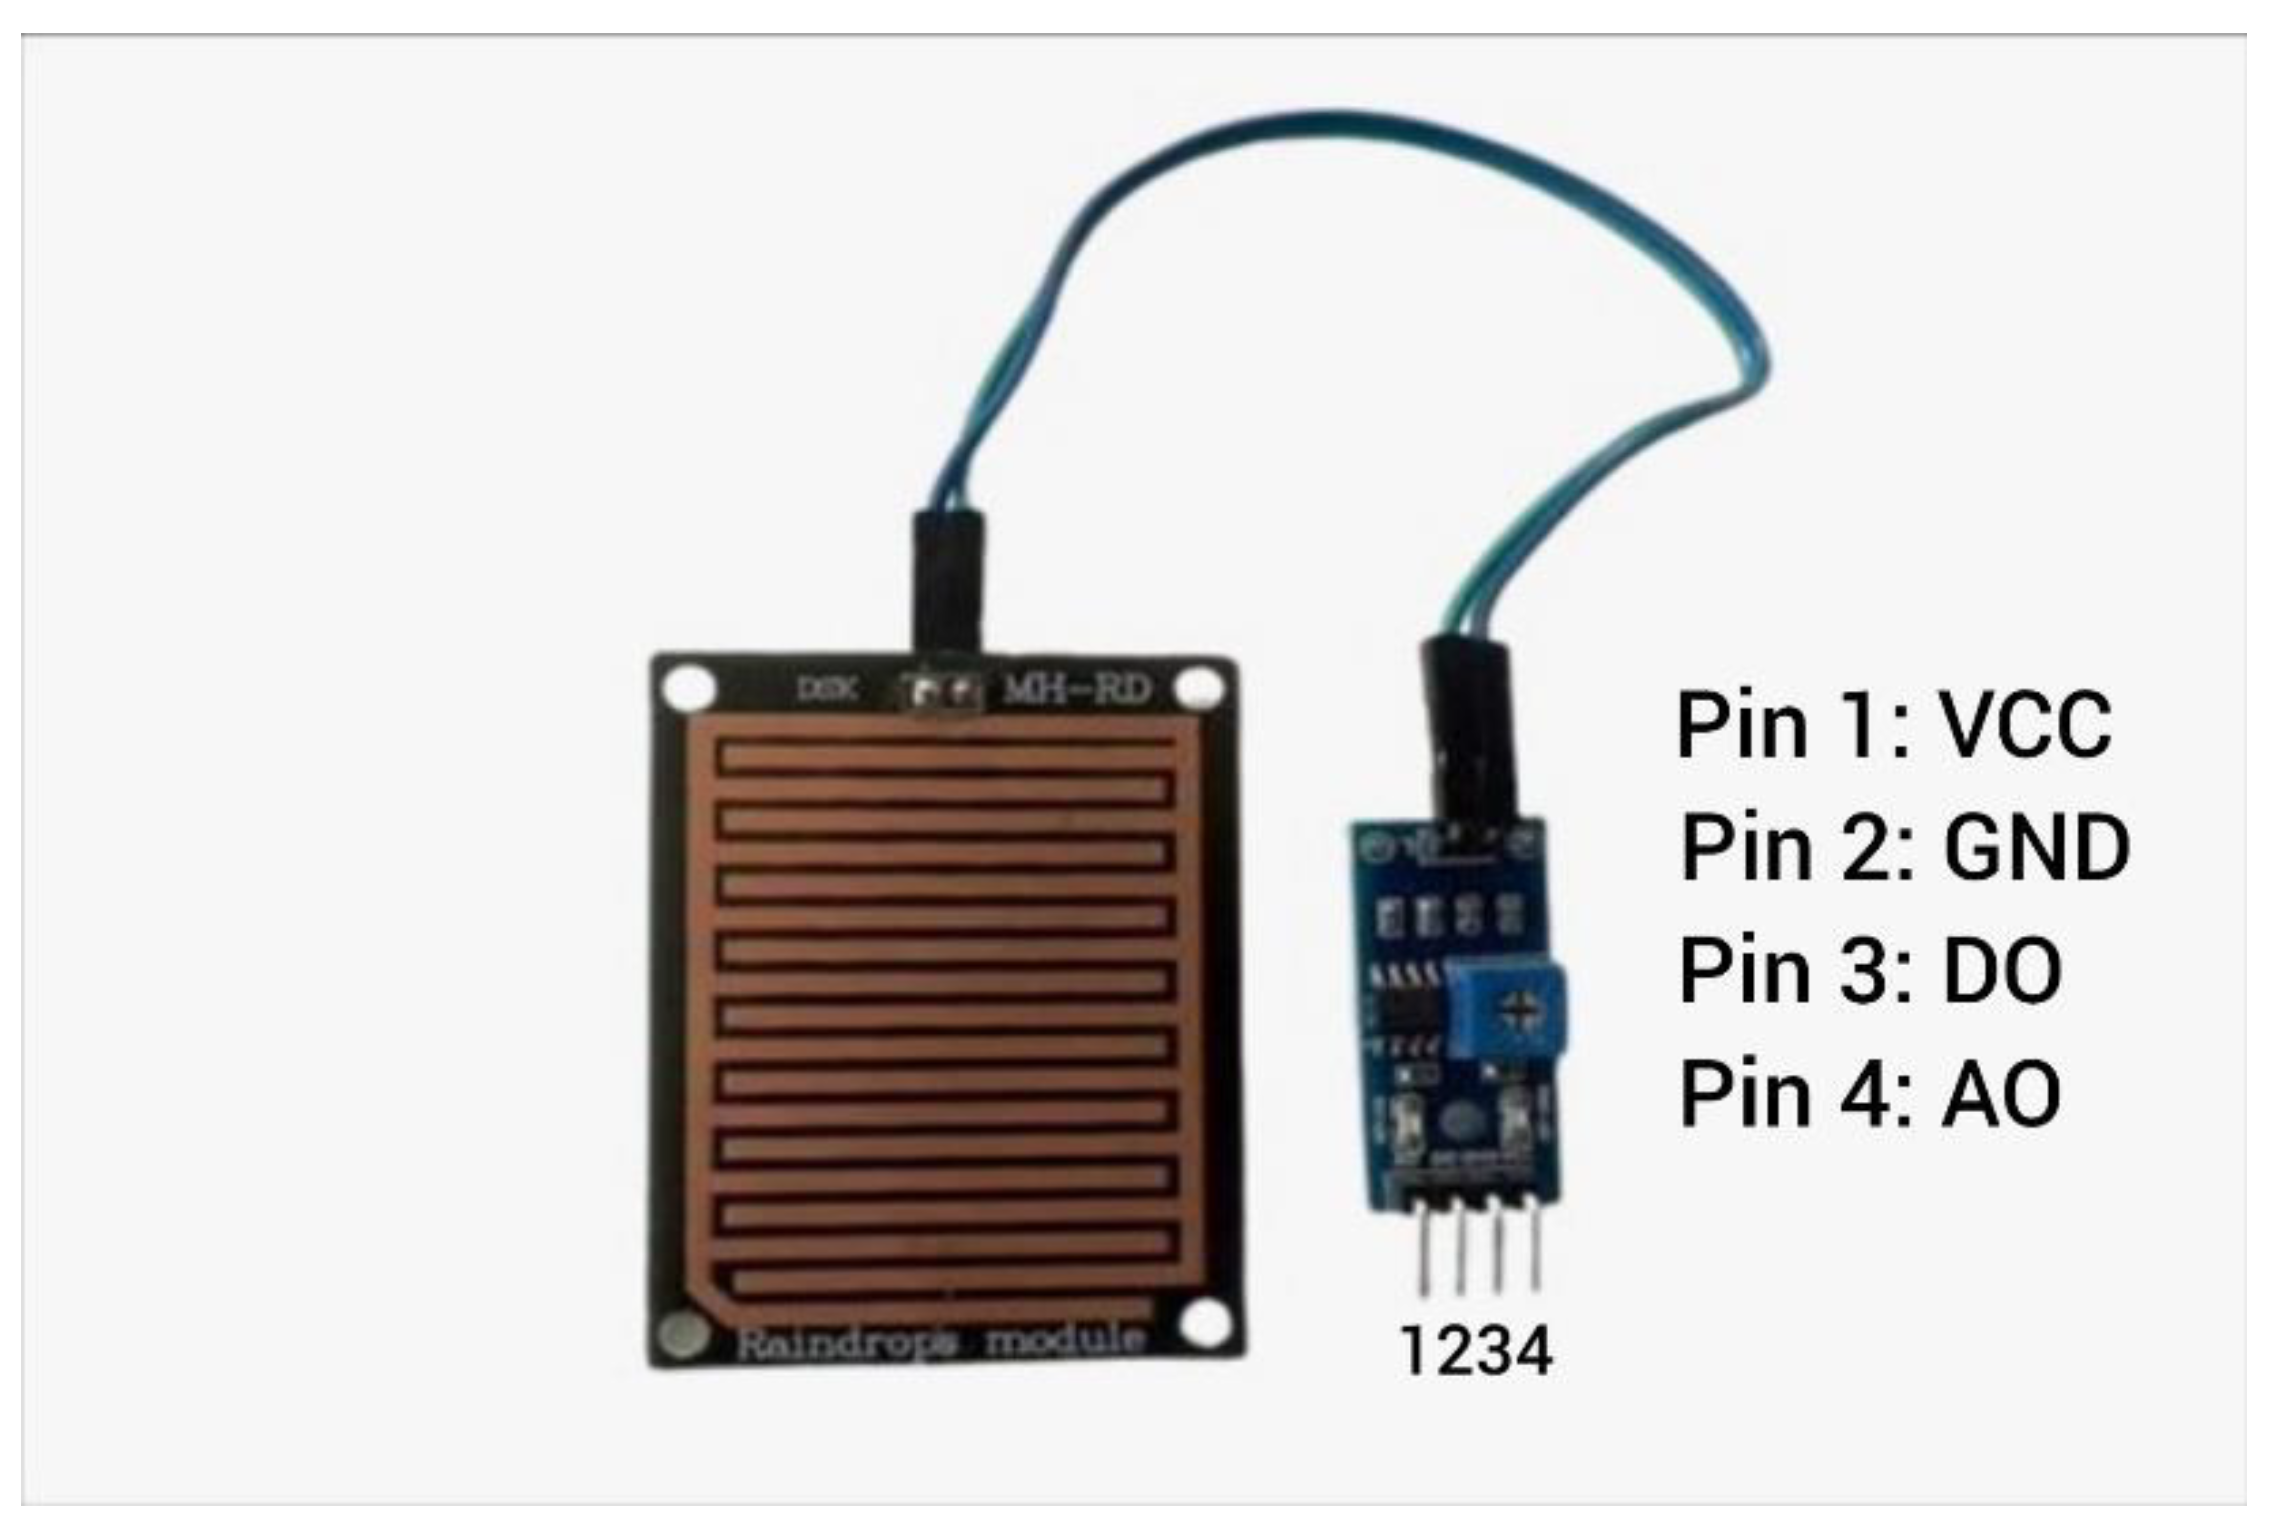
3.4. Raindrops Detection Sensor
The Raindrops Detection sensor module is specially designed for detecting rain and measuring rainfall intensity. It consists of a printed circuit board-control board that "captures" raindrop. The more raindrops that collect on the board, the more parallel resistance paths are formed, measured by the op-amp. As water increases, resistance drops, leading to a lower voltage output; with less water, the output voltage on the analog pin goes up. This module includes a separate rain board and control board for convenience, a power indicator LED, and adjustable sensitivity via a potentiometer.[
15].
Features and specifications [15]:
The LM393 uses the wide voltage comparator
Provide both digital and analog output
The output format: digital switch output (0 and 1) and analog AO voltage output
The sensor uses the high-quality FR – 04 double material, a large area of 5.5 * 4.0 CM
Table 3.
Pins of Raindrops Detection Sensor [
16].
Table 3.
Pins of Raindrops Detection Sensor [
16].
| Pin Name |
Description |
| VCC |
Power supply |
| Ground |
Connected to the ground of the circuit |
| DO |
Low/High output pin |
| AO |
Analog output pin |
Figure 5.
Raindrops Detection Sensor.
Figure 5.
Raindrops Detection Sensor.
Application:
The applications of raindrop detection sensors are given below:
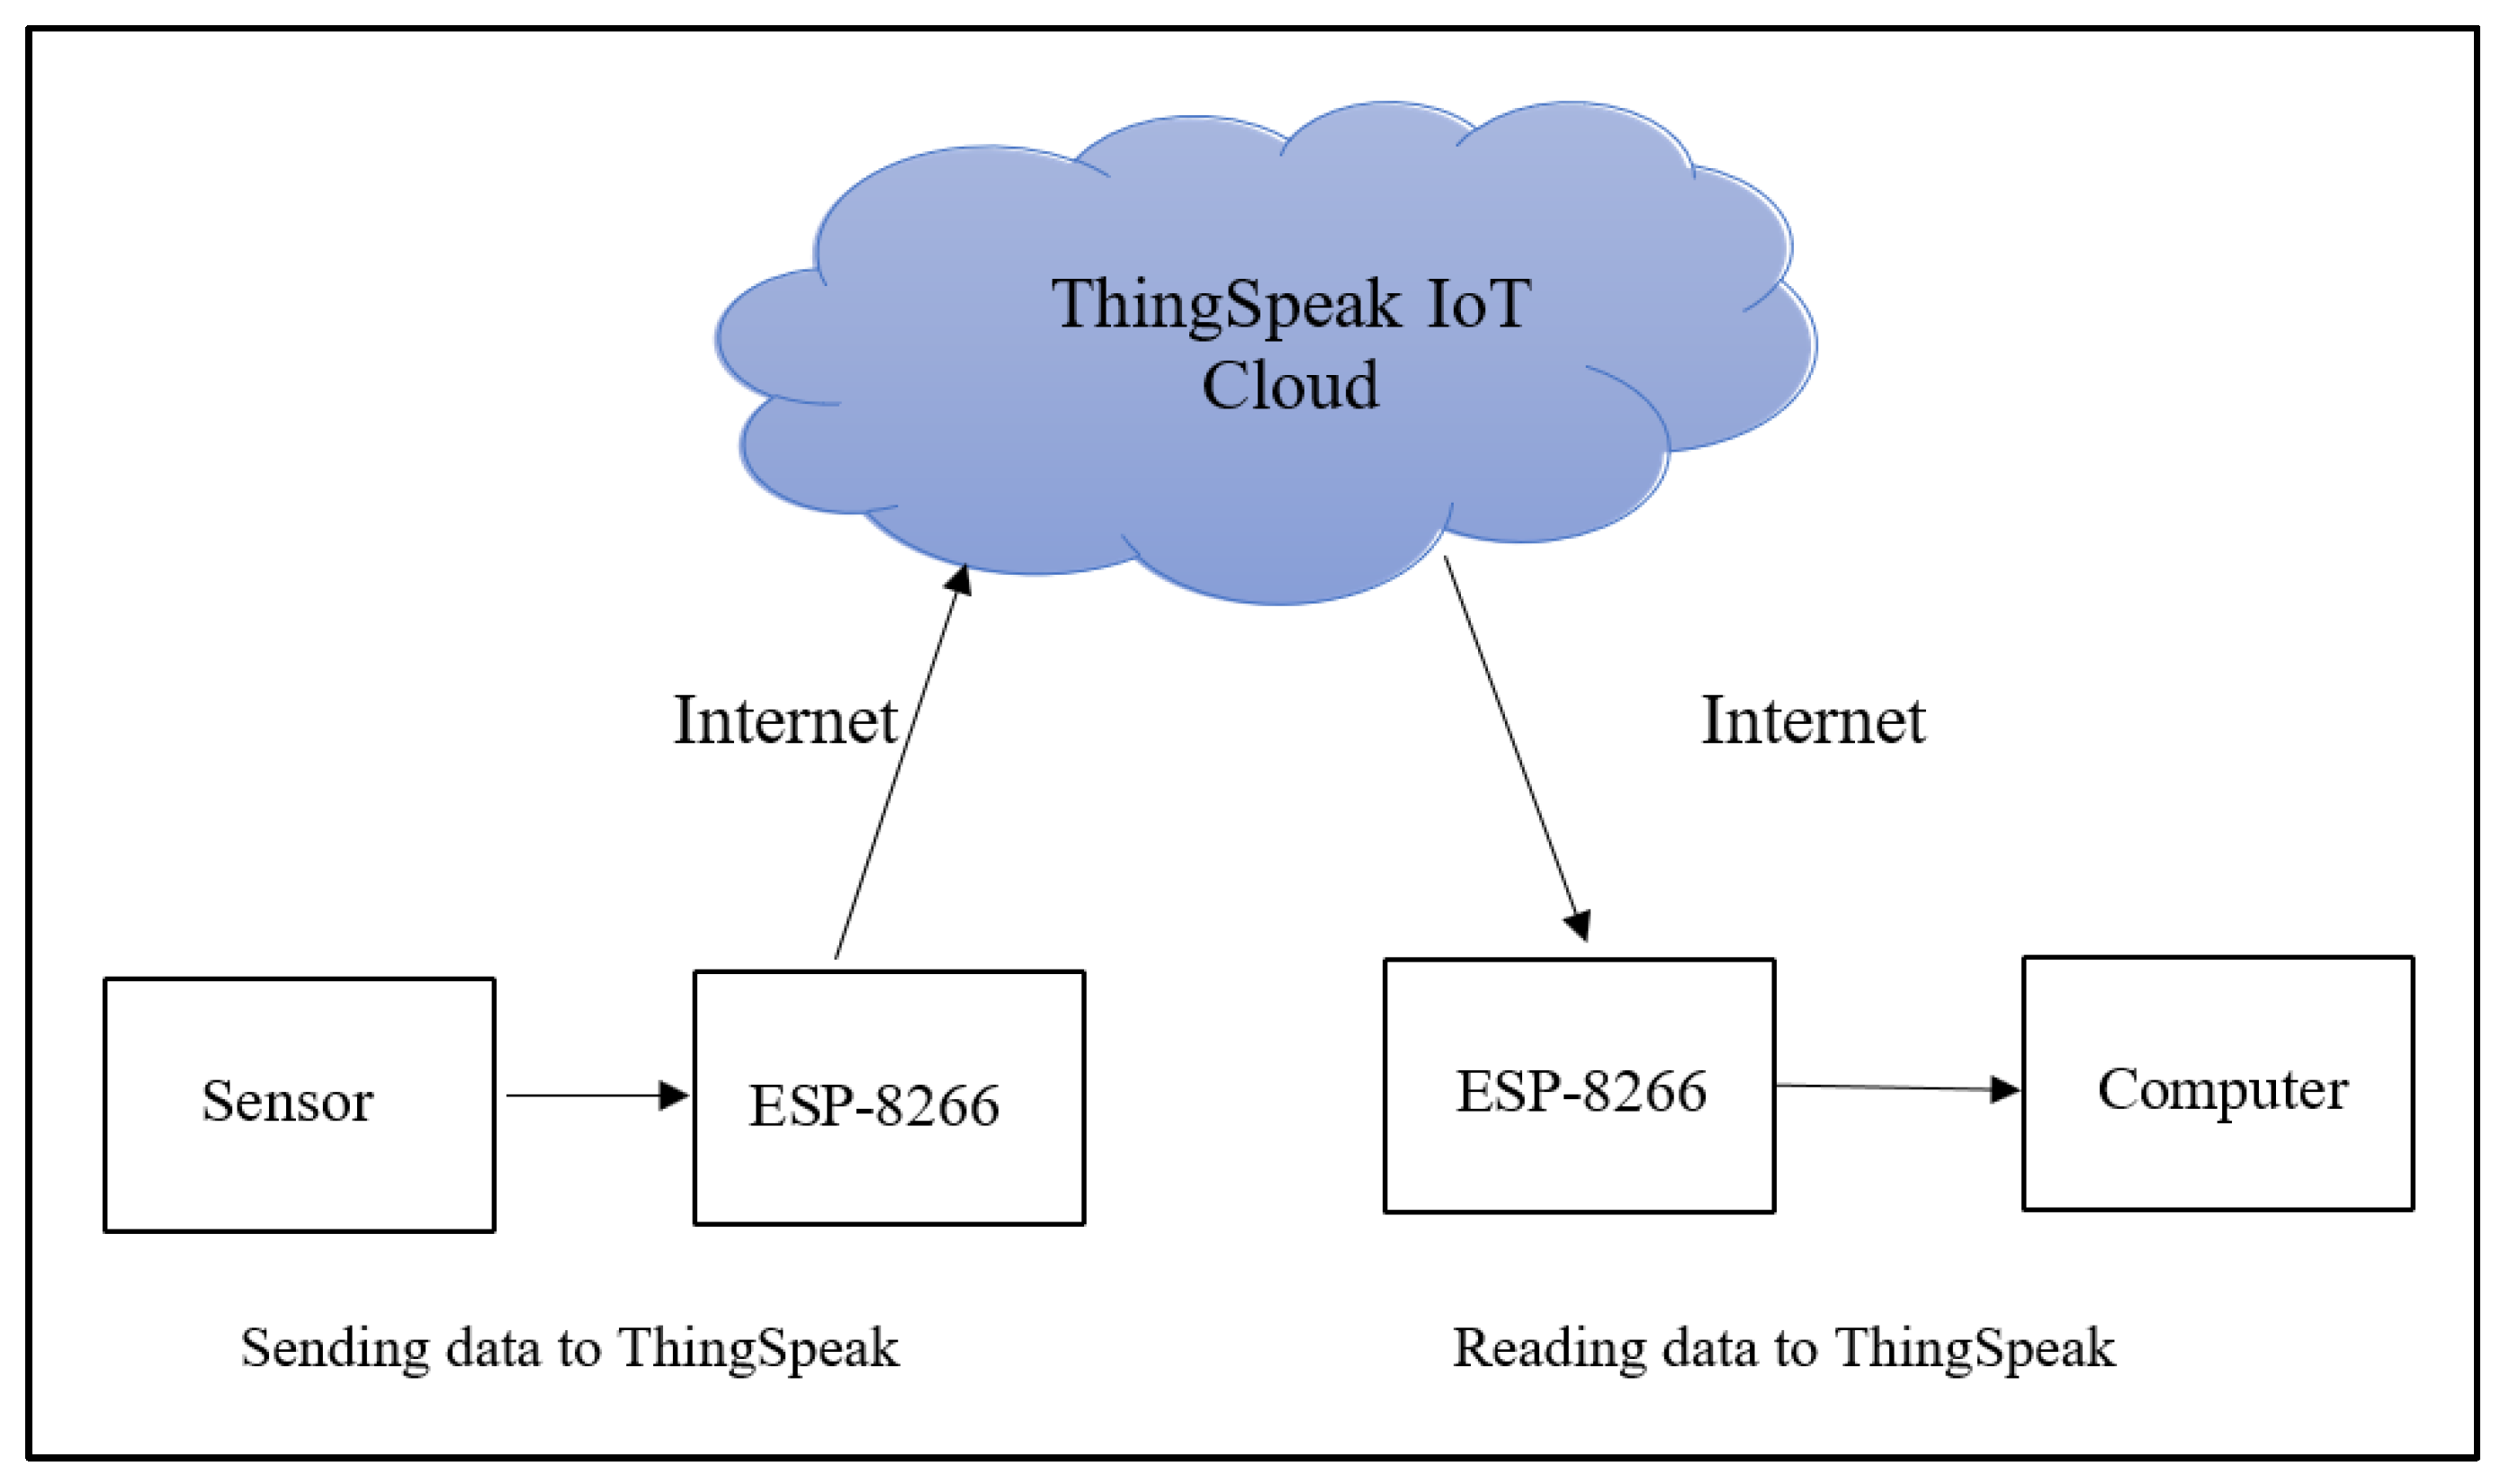
3.5. ThingSpeak
ThingSpeak is an open-source IoT application and API that uses the HTTP protocol to store and access data from sensors. It is integrated with MathWorks' MATLAB, making it possible to analyze and visualize data uploaded directly through ThingSpeak without the need for buying a MATLAB license. With APIs for both collecting data from sensors and reading that data in applications, ThingSpeak is designed for real-time data updating and management [
7].
Figure 6.
Working of ThingSpeak.
Figure 6.
Working of ThingSpeak.
4. Methodology
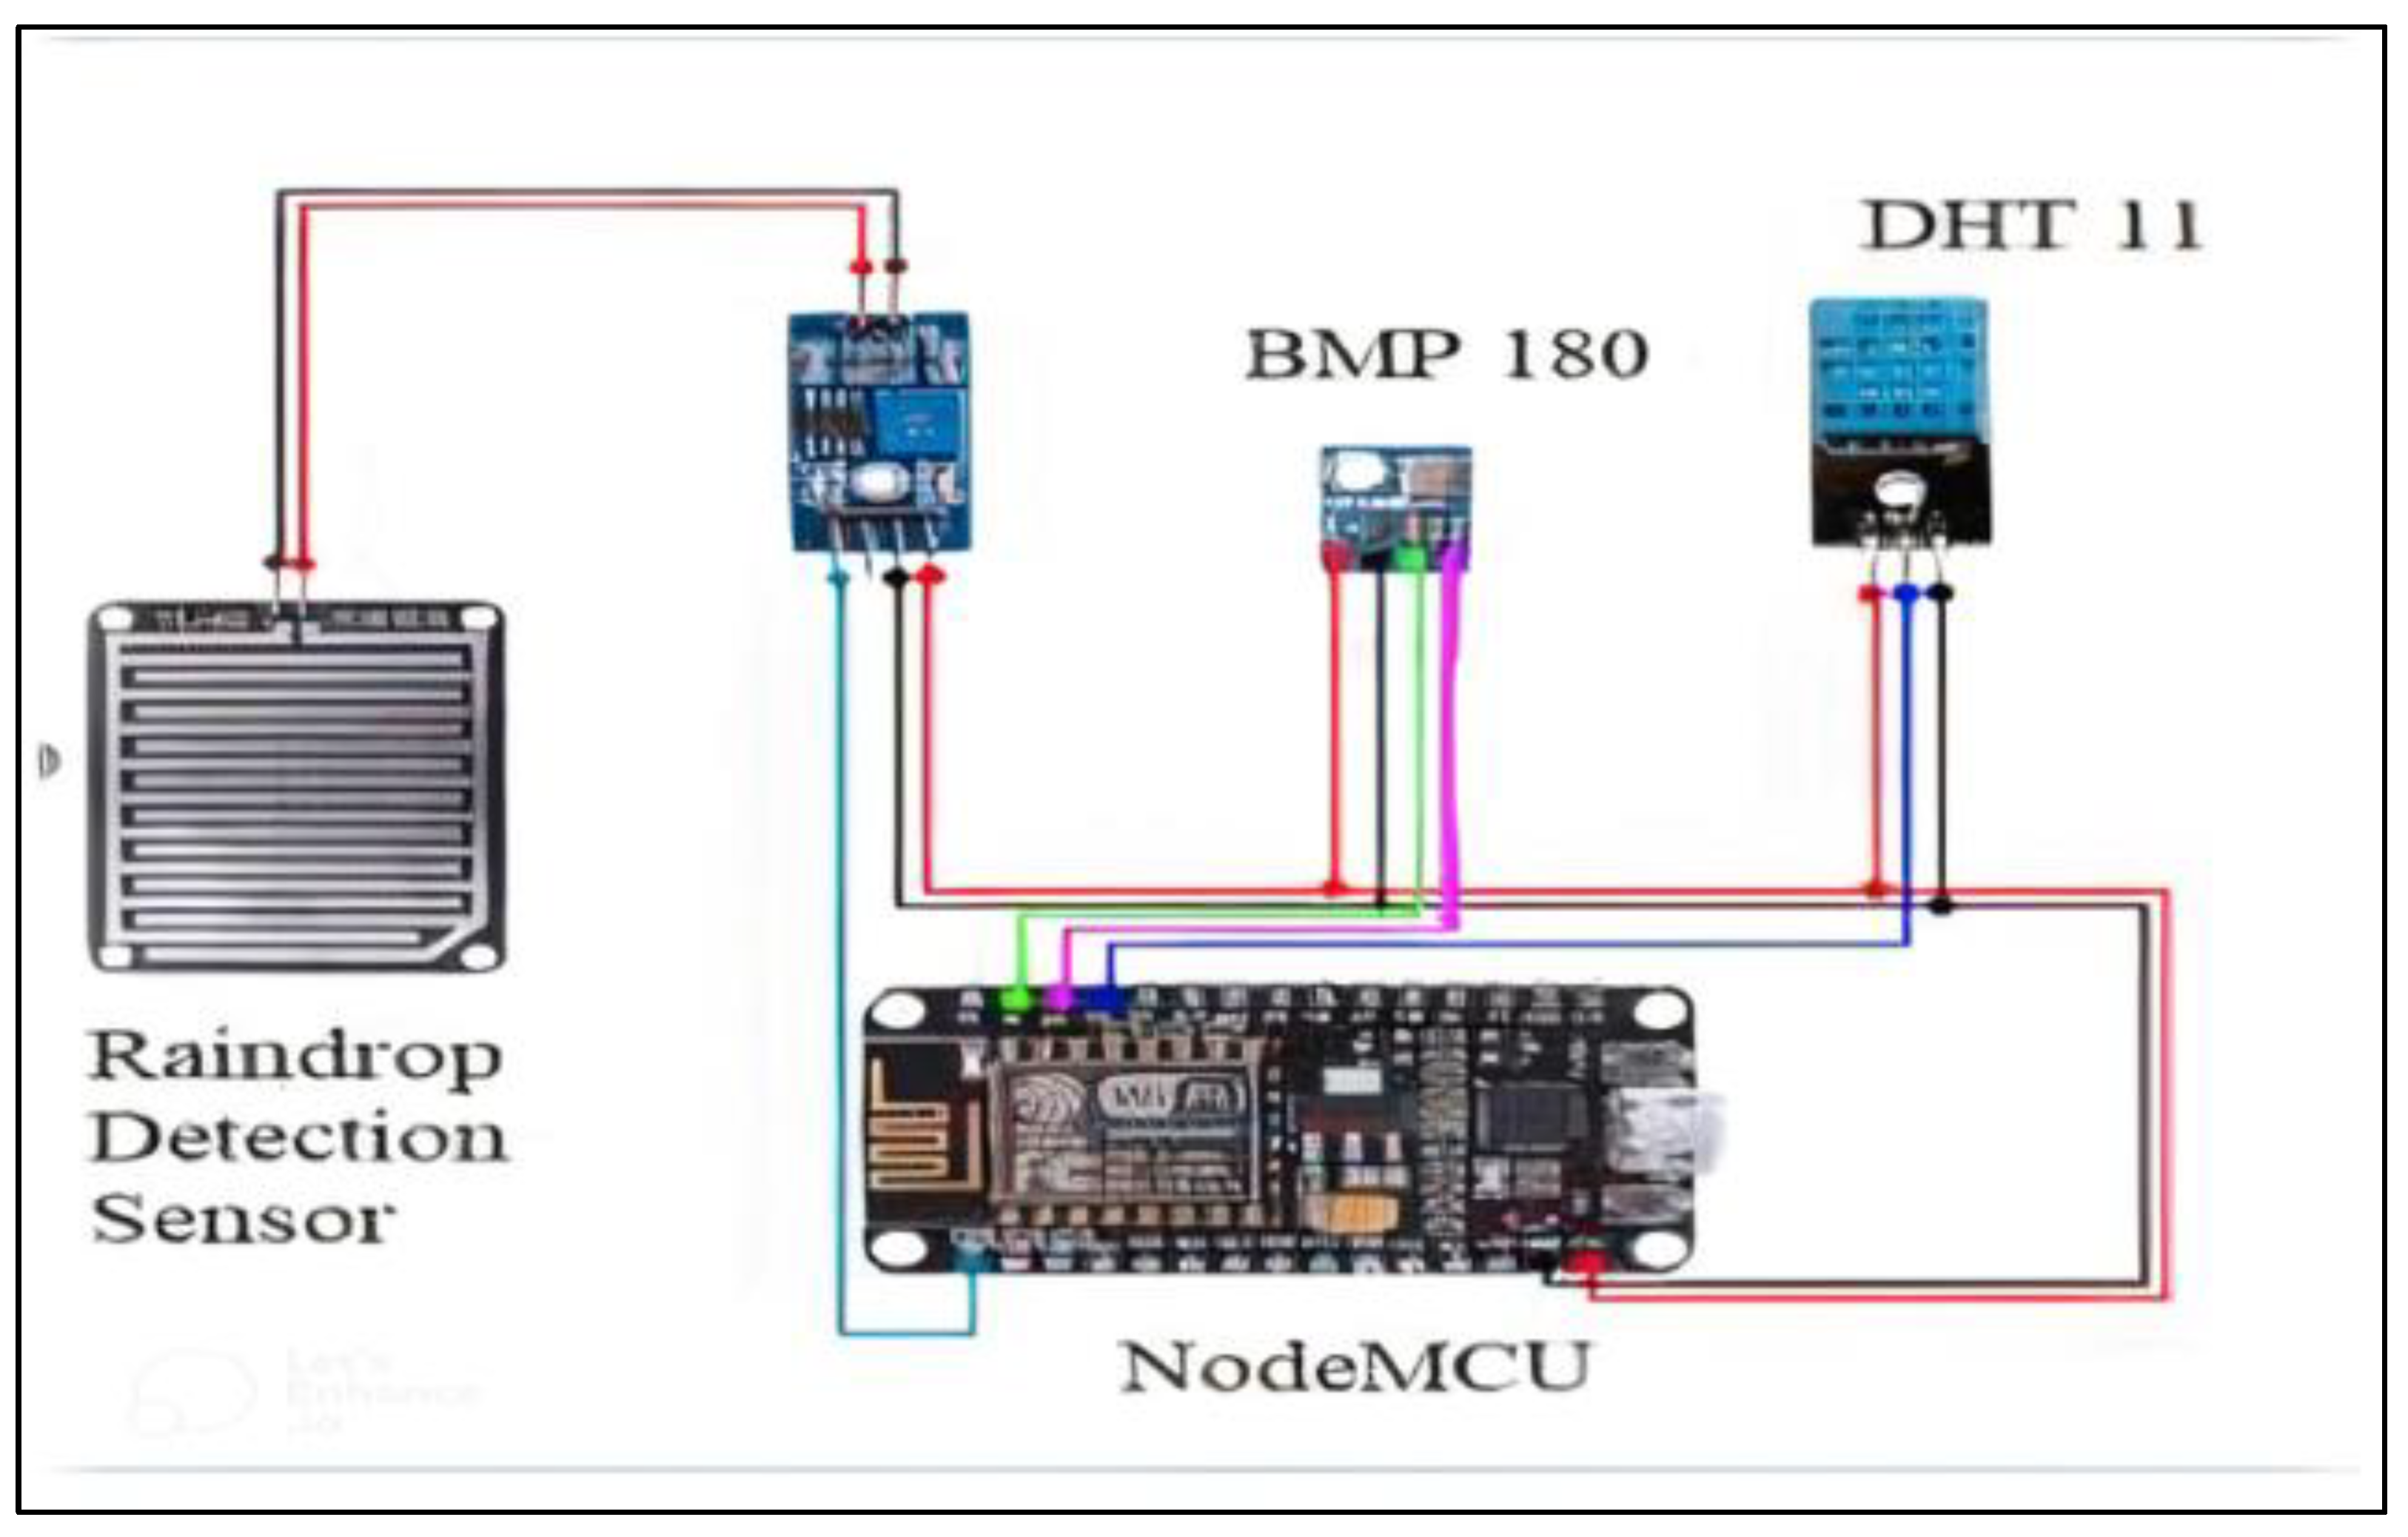
This system was developed to monitor and collect environmental data from sensors and send them via WiFi to ThingSpeak. First of all, the NodeMCU (ESP-8266) was placed on a breadboard. The V+ve and GND pins of the NodeMCU were connected to the positive (+ve) and negative (-ve) power rails on the breadboard, respectively. Then the Vcc and GND pins of the DHT 11 sensor were again connected to the positive and negative power rails of the breadboard, respectively. Further, the data output pin of DHT 11 was again connected to the D3 pin of the NodeMCU. For the BMP 180 sensor, Vcc and GND were connected to the +ve and -ve rails of the breadboard, while the SCL and SDA pins were connected to the D1 and D2 pins of the NodeMCU. Then again for the raindrops detection sensor, Vcc and Ground (GND) were connected to the positive and negative power rails of the breadboard, respectively. The analog output pin (AO) was connected to the AO pin of NodeMCU. All connections were made using jumper wires. A circuit diagram showing these connections is depicted in
Figure 7.
Figure 7.
Circuit Diagram.
Figure 7.
Circuit Diagram.
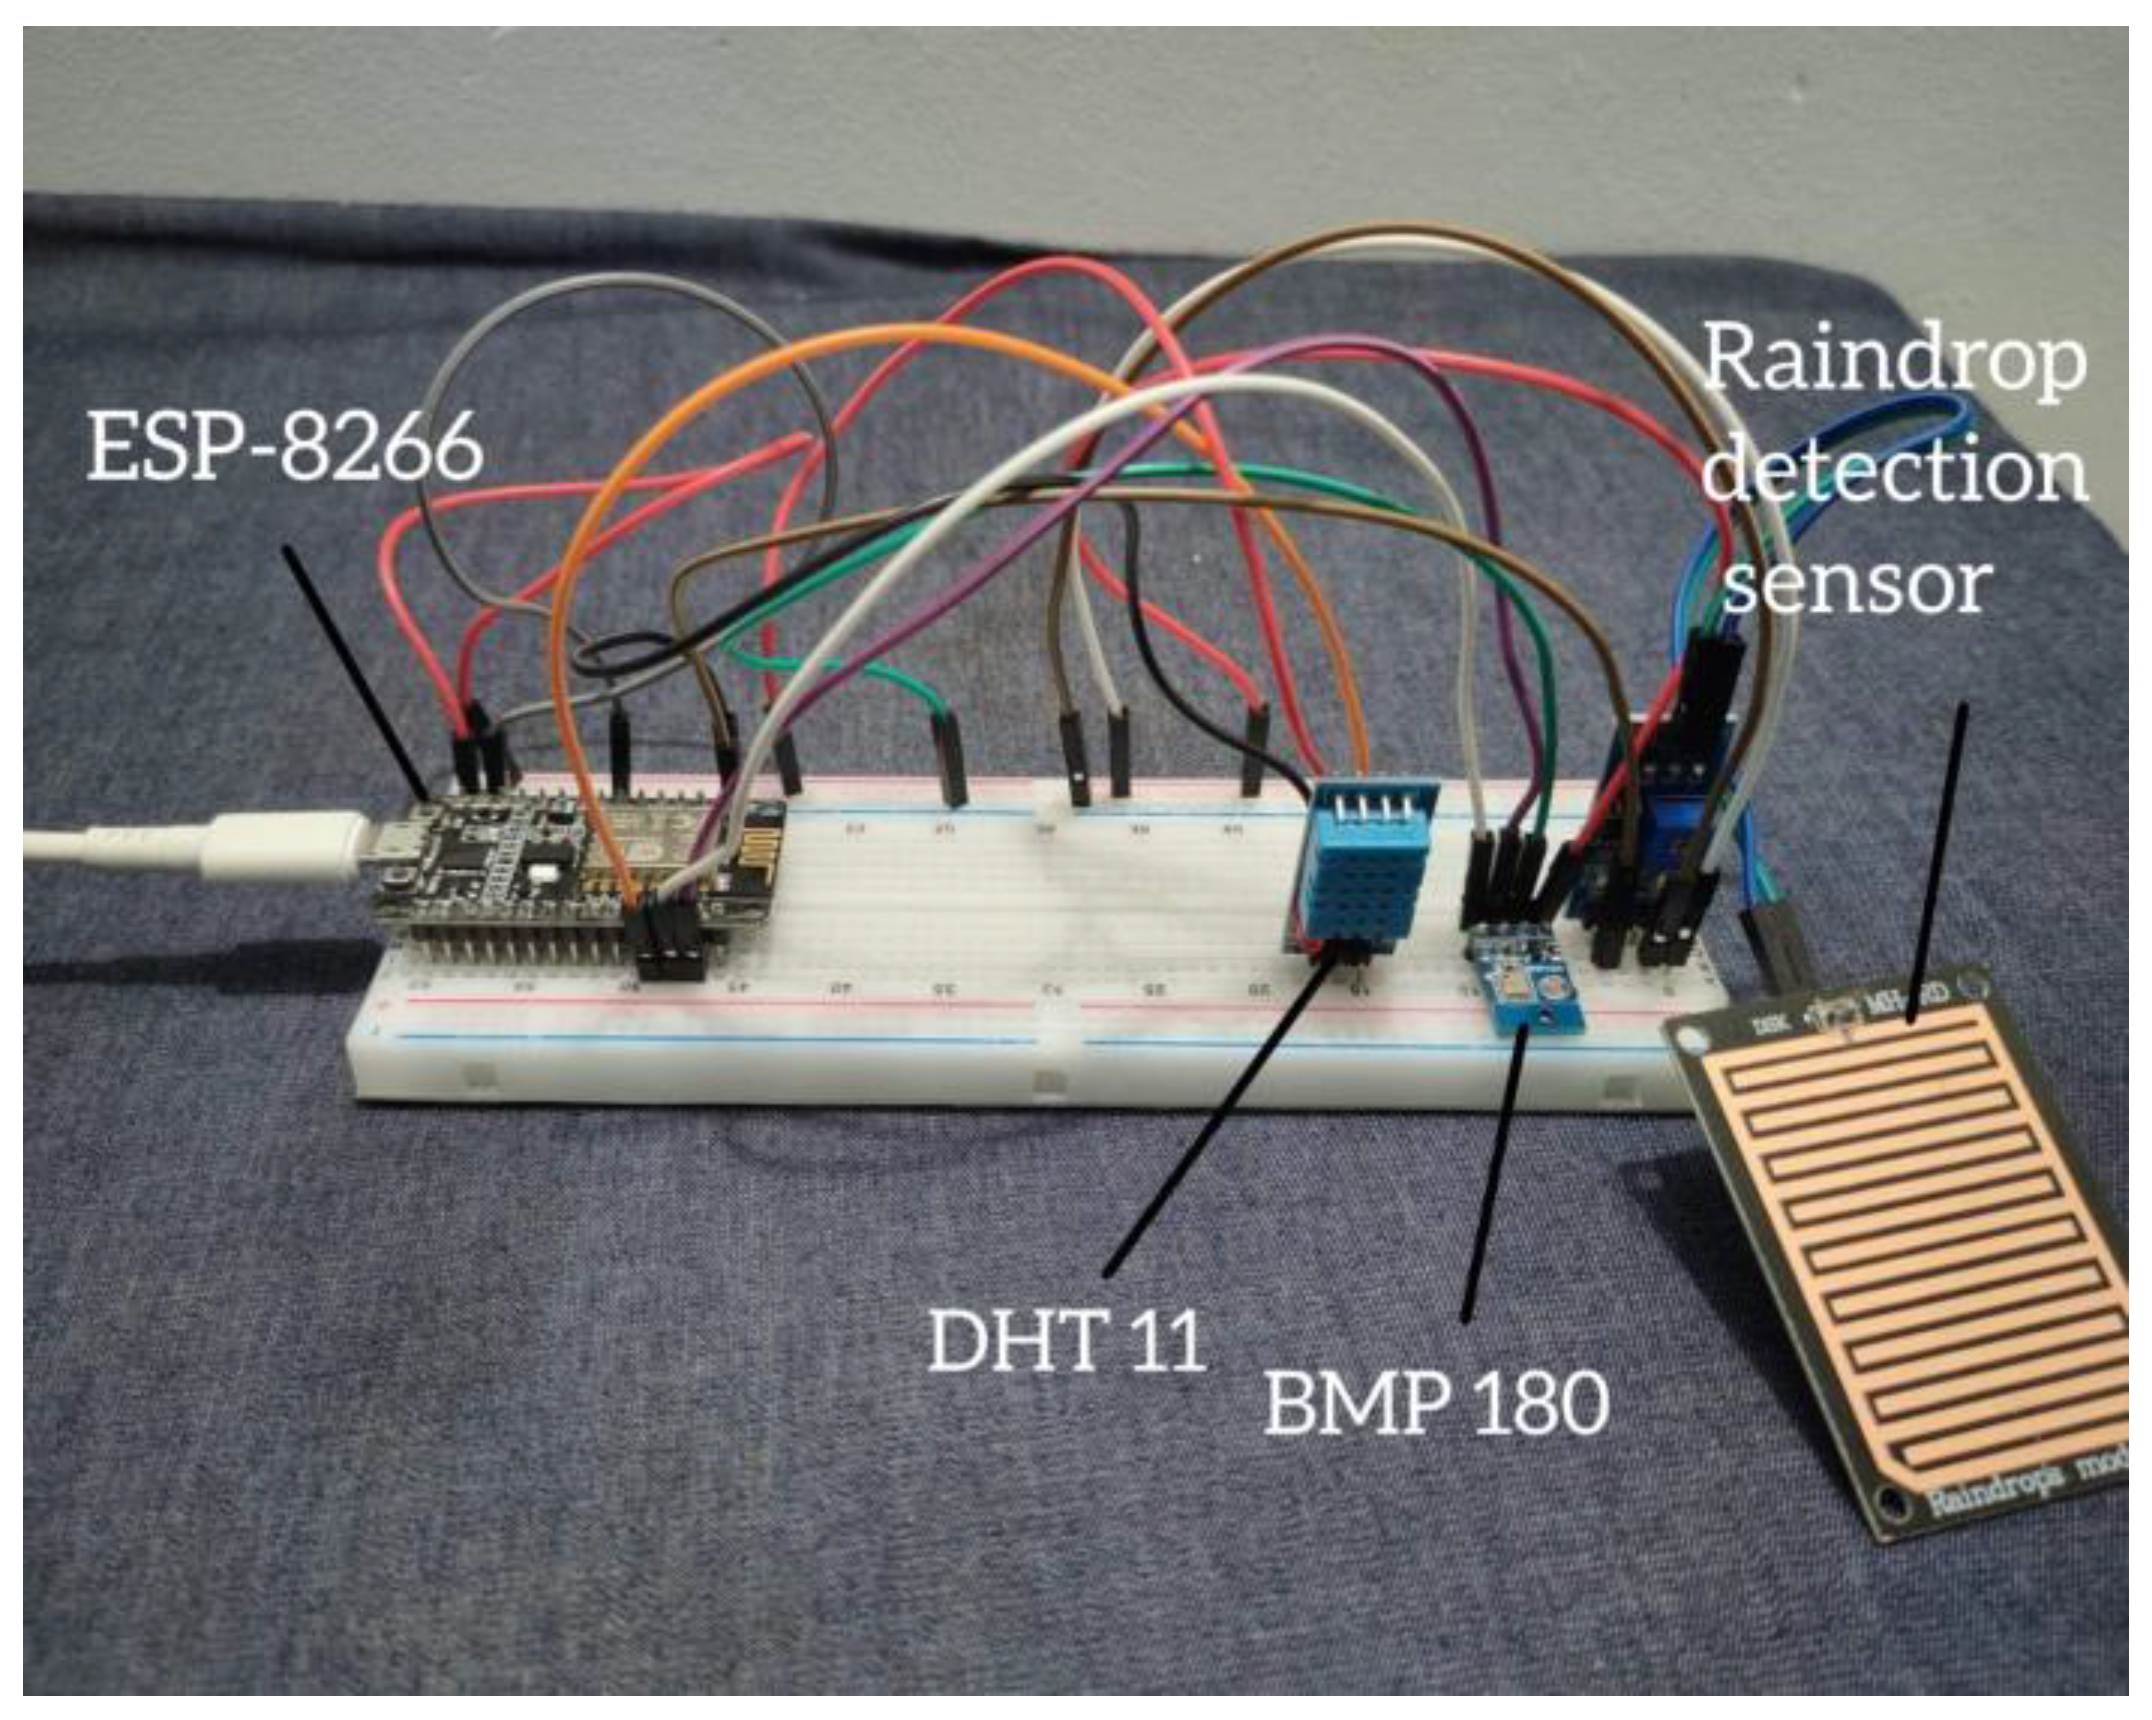
Figure 8.
Connected Components.
Figure 8.
Connected Components.
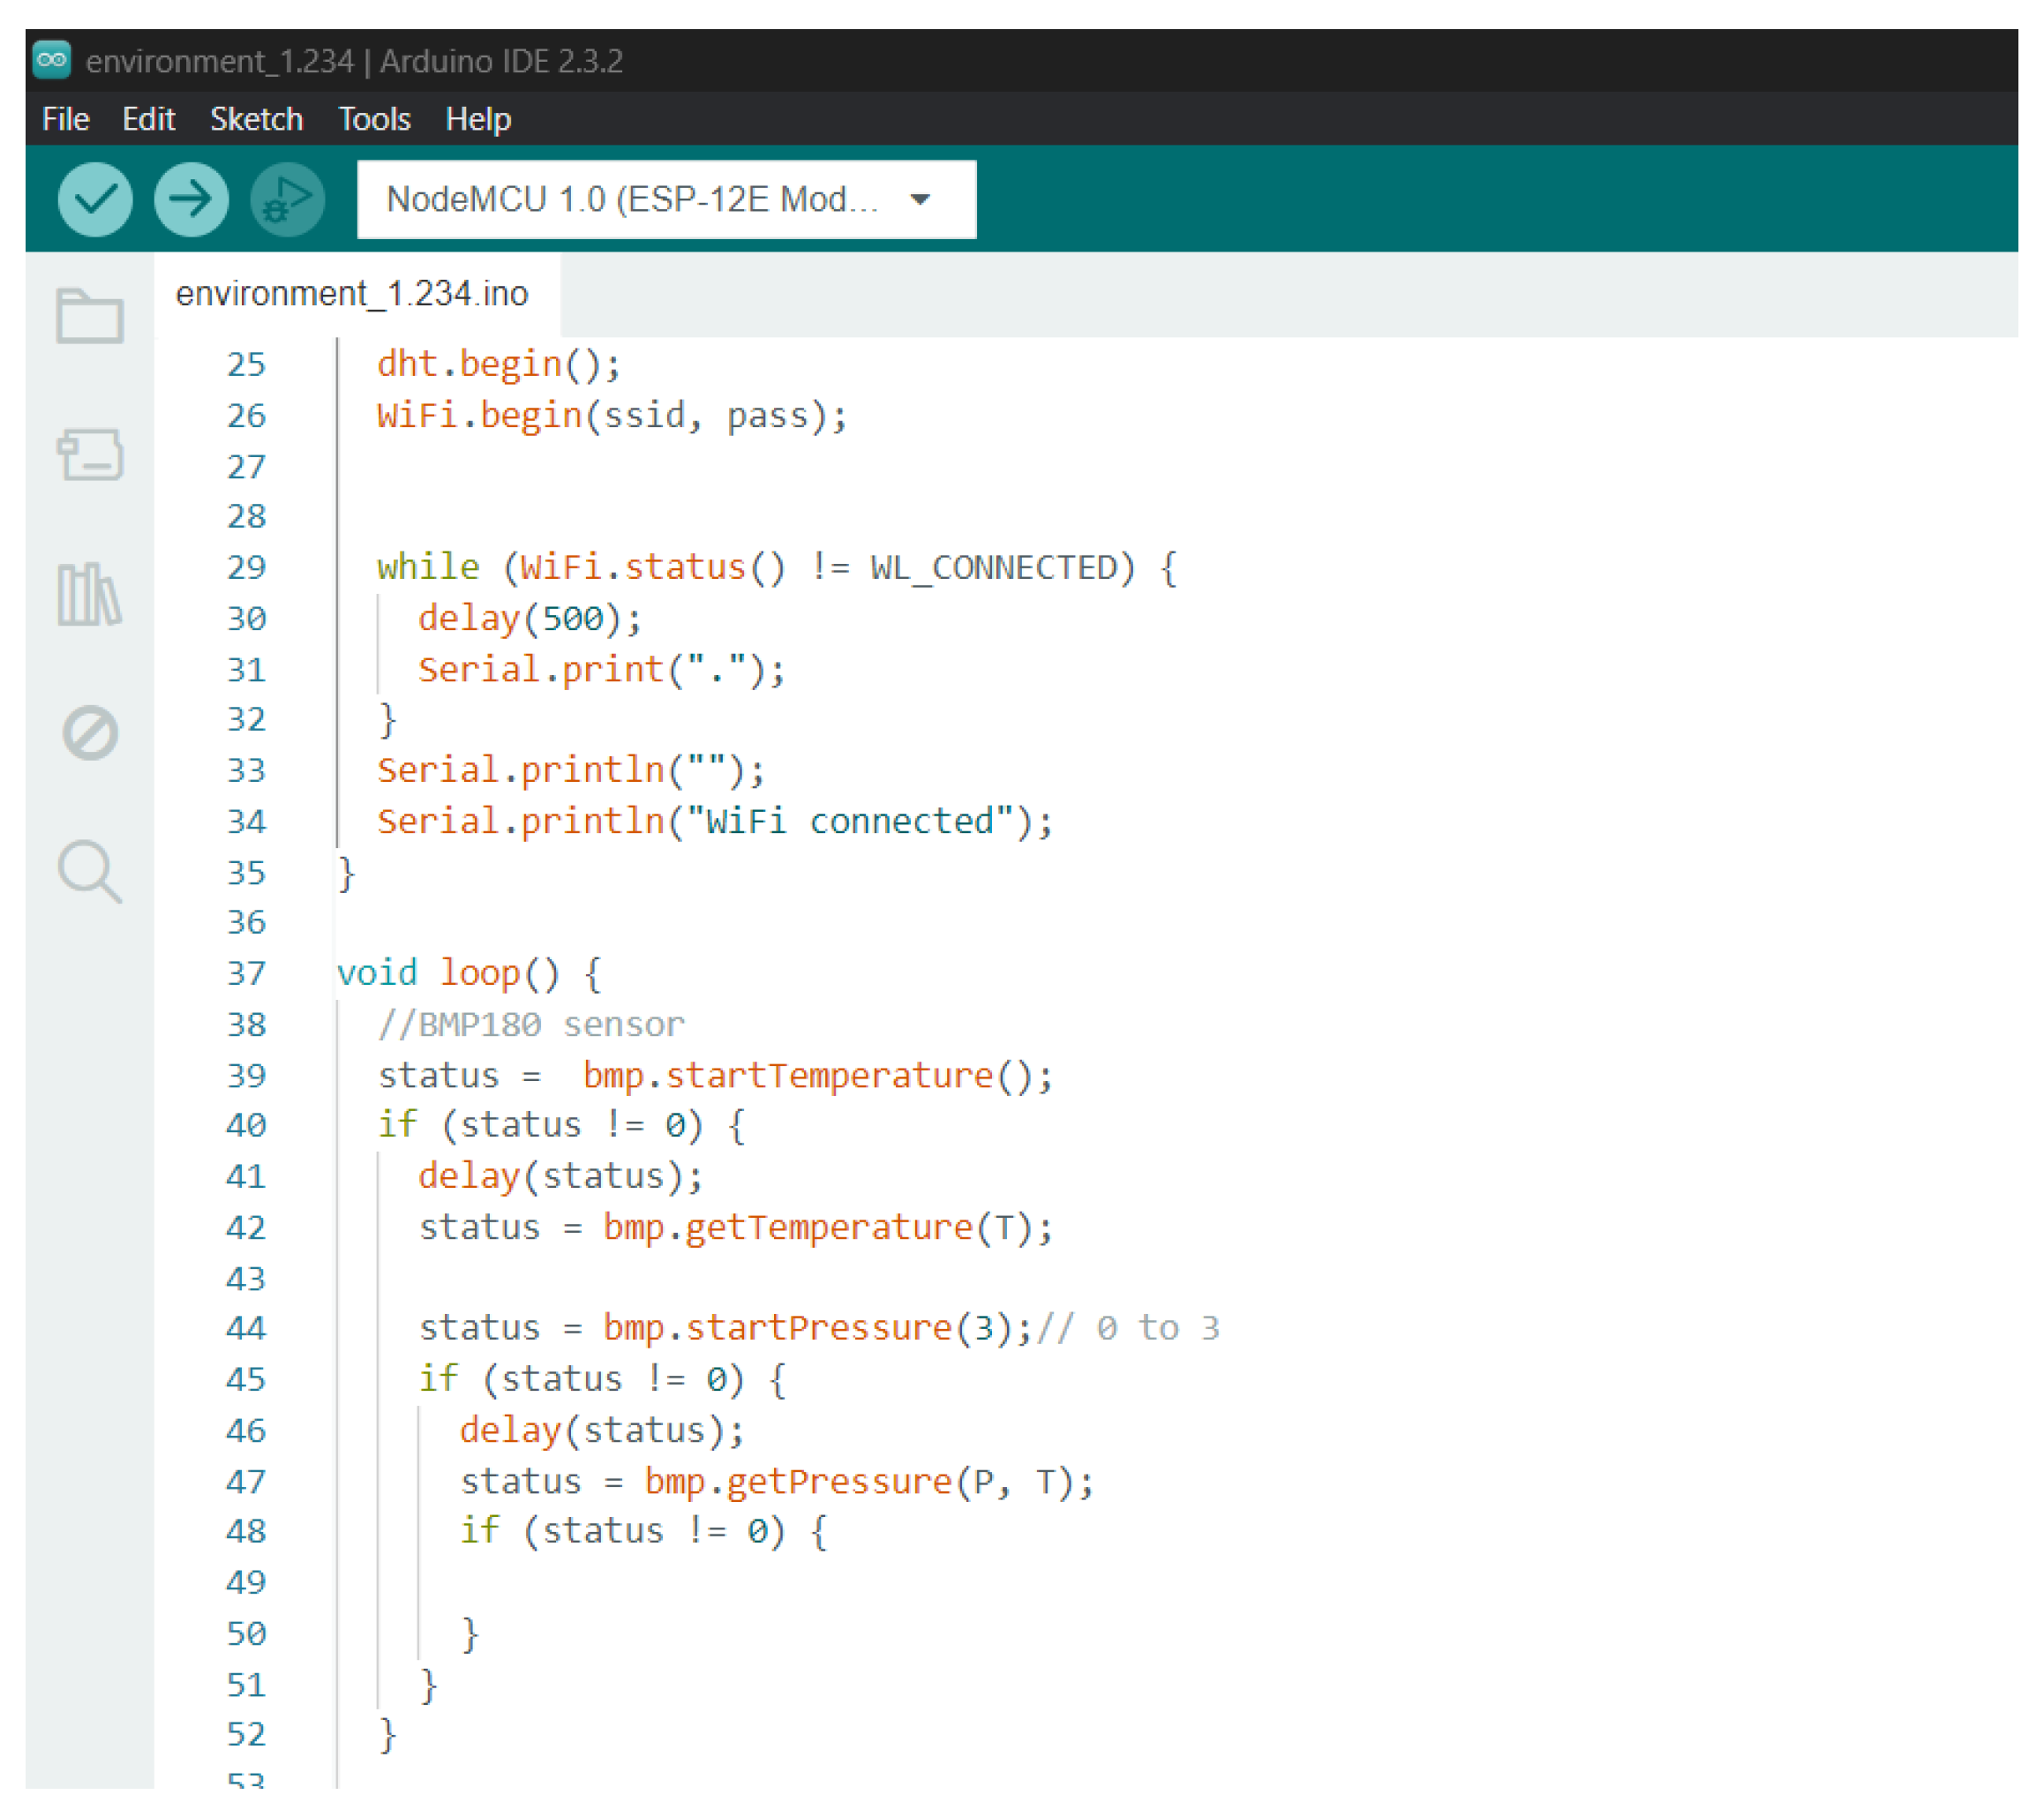
The NodeMCU was connected to a PC, and the DHT11 and BMP libraries were added in the Arduino IDE, along with the ESP-8266 board support. A ThingSpeak account was created, setting up channels for temperature, humidity, pressure, and raindrop data. The API Key generated by ThingSpeak was included in the code, along with the Wi-Fi SSID and password. After compiling, the code was uploaded to the NodeMCU board. The sensors then collected environmental data and transmitted it to the NodeMCU, which sent the data to ThingSpeak via Wi-Fi.
Figure 9.
Arduino IDE software.
Figure 9.
Arduino IDE software.
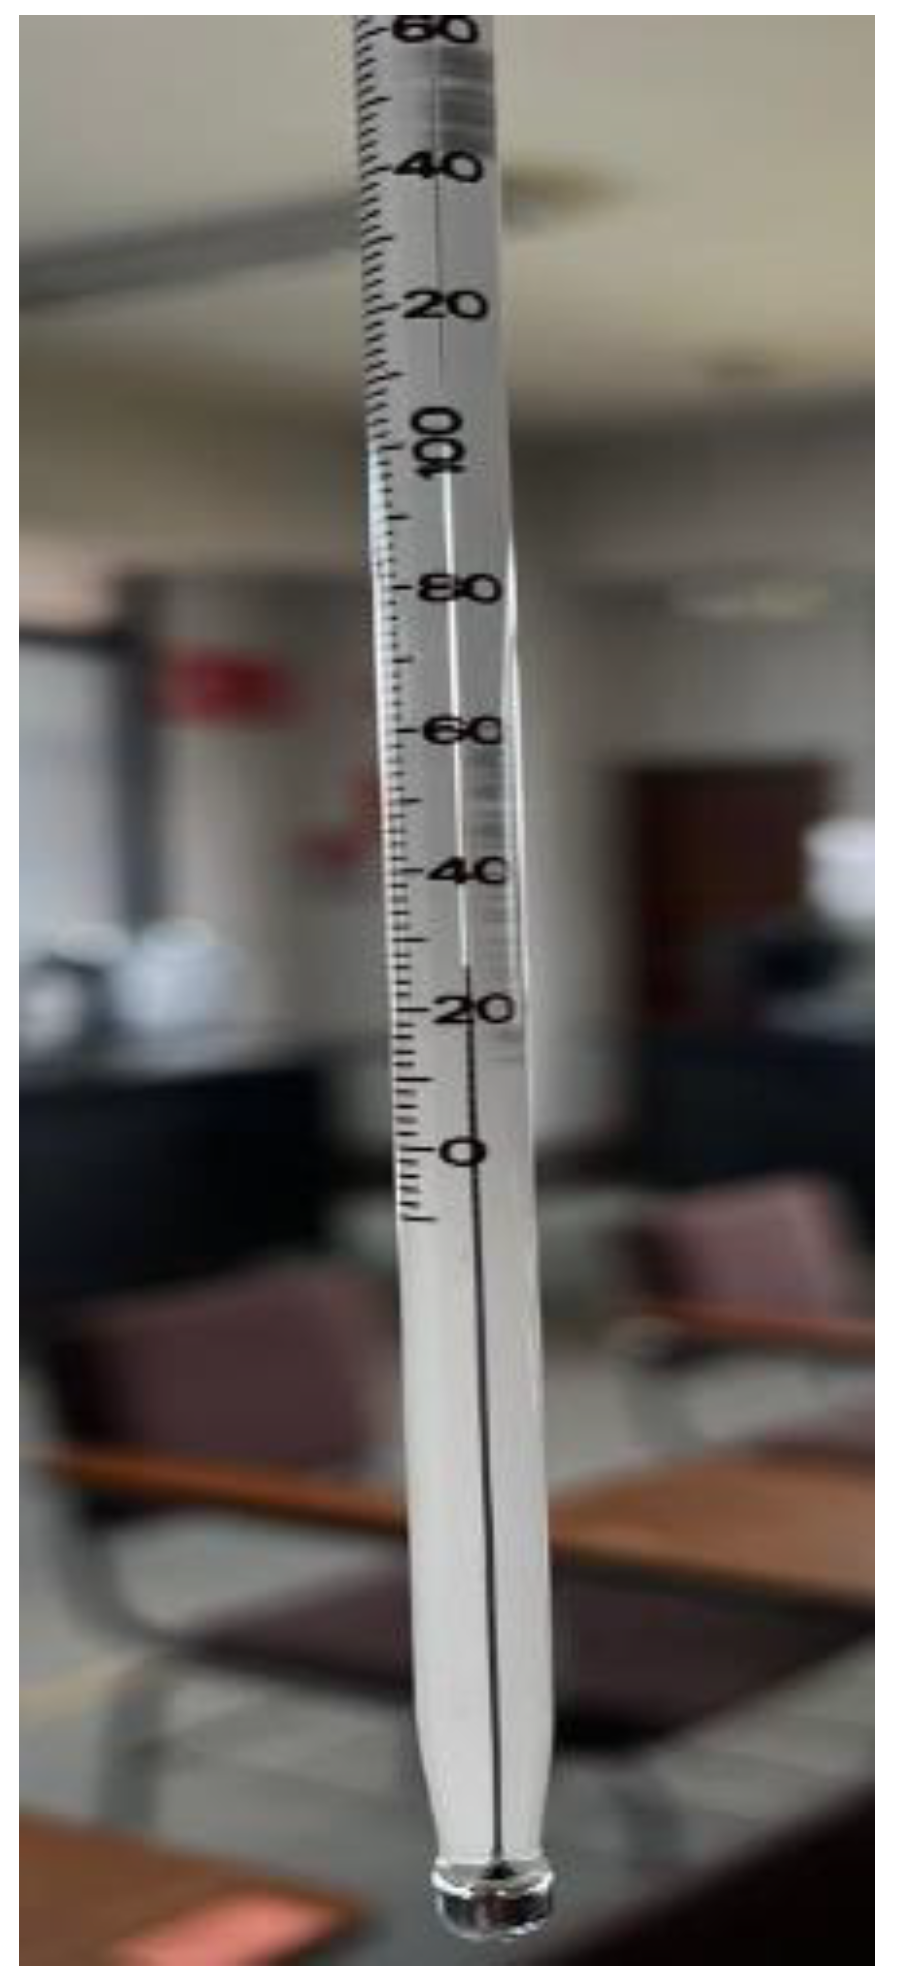
The surrounding temperature was measured by using a thermometer. Since the psychrometer was not working properly and further there was no availability of the barometer, therefore the humidity and pressure values were taken from the internet for that instant of time.
5. Result and Discussion
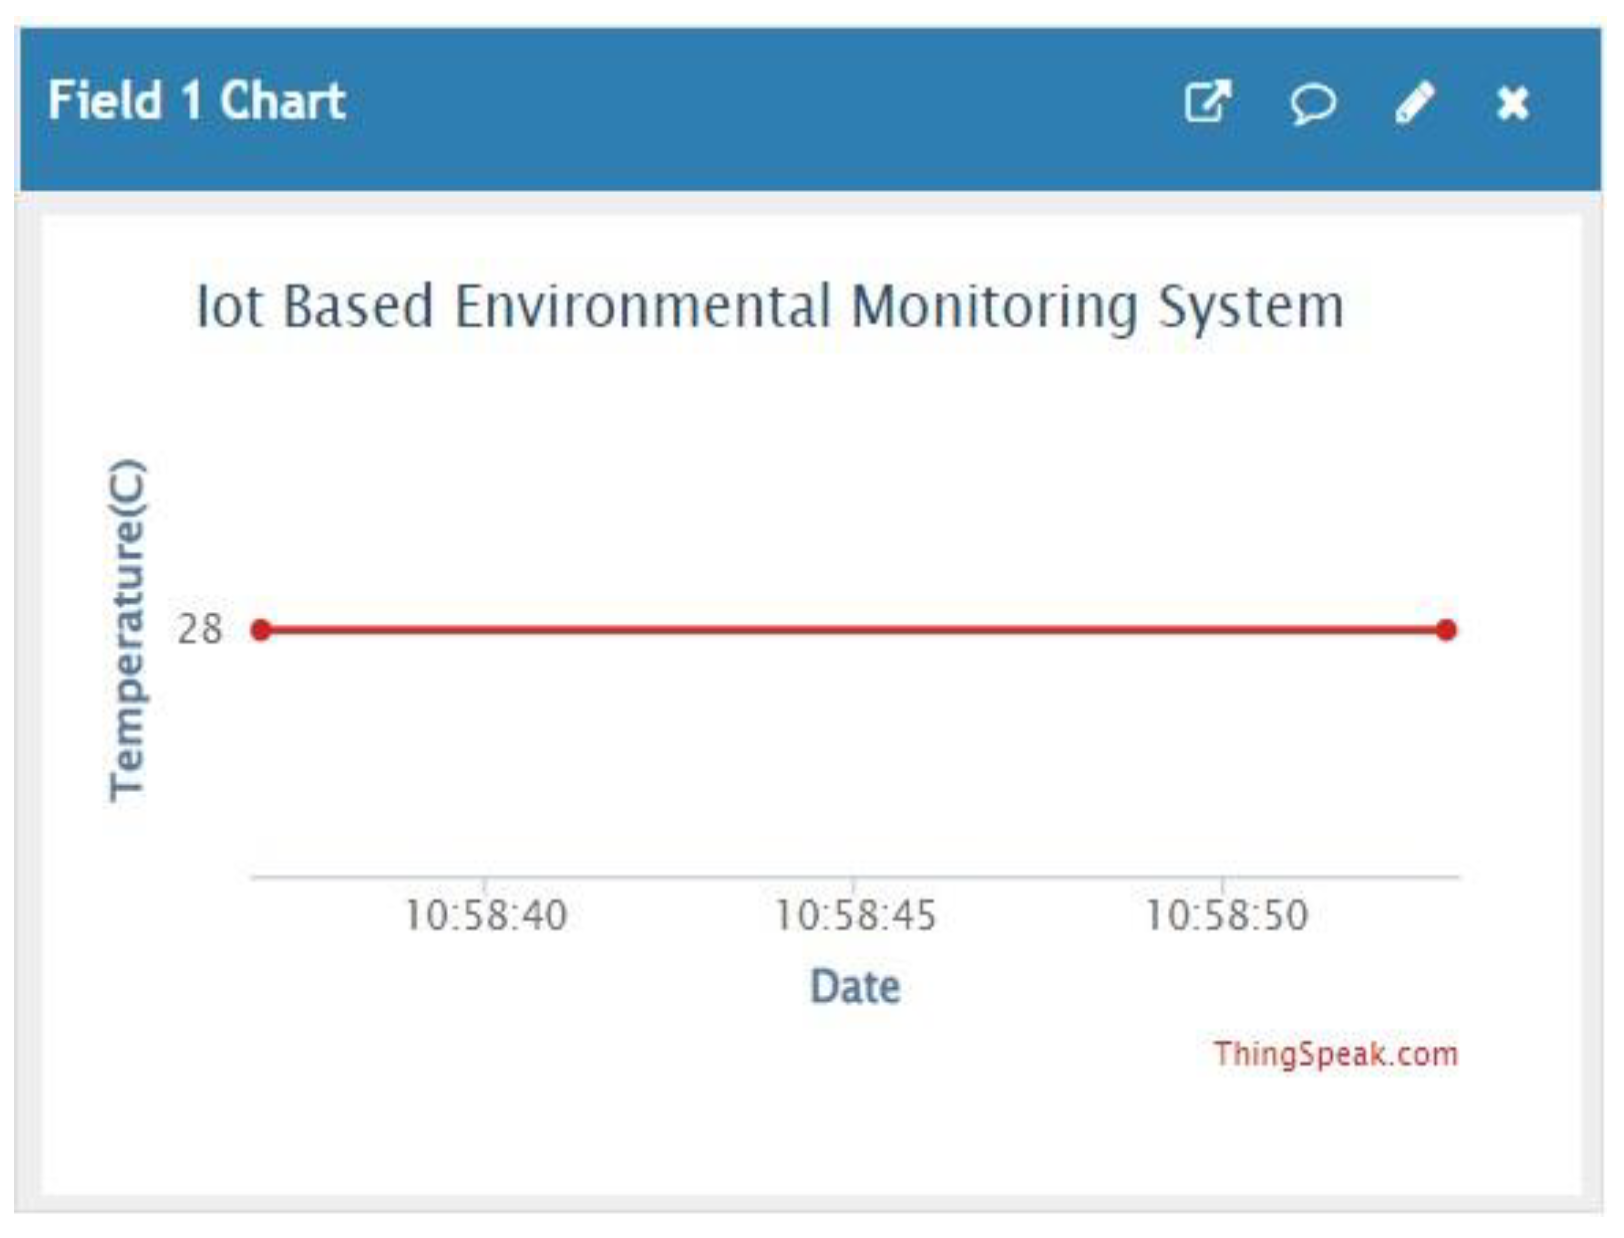
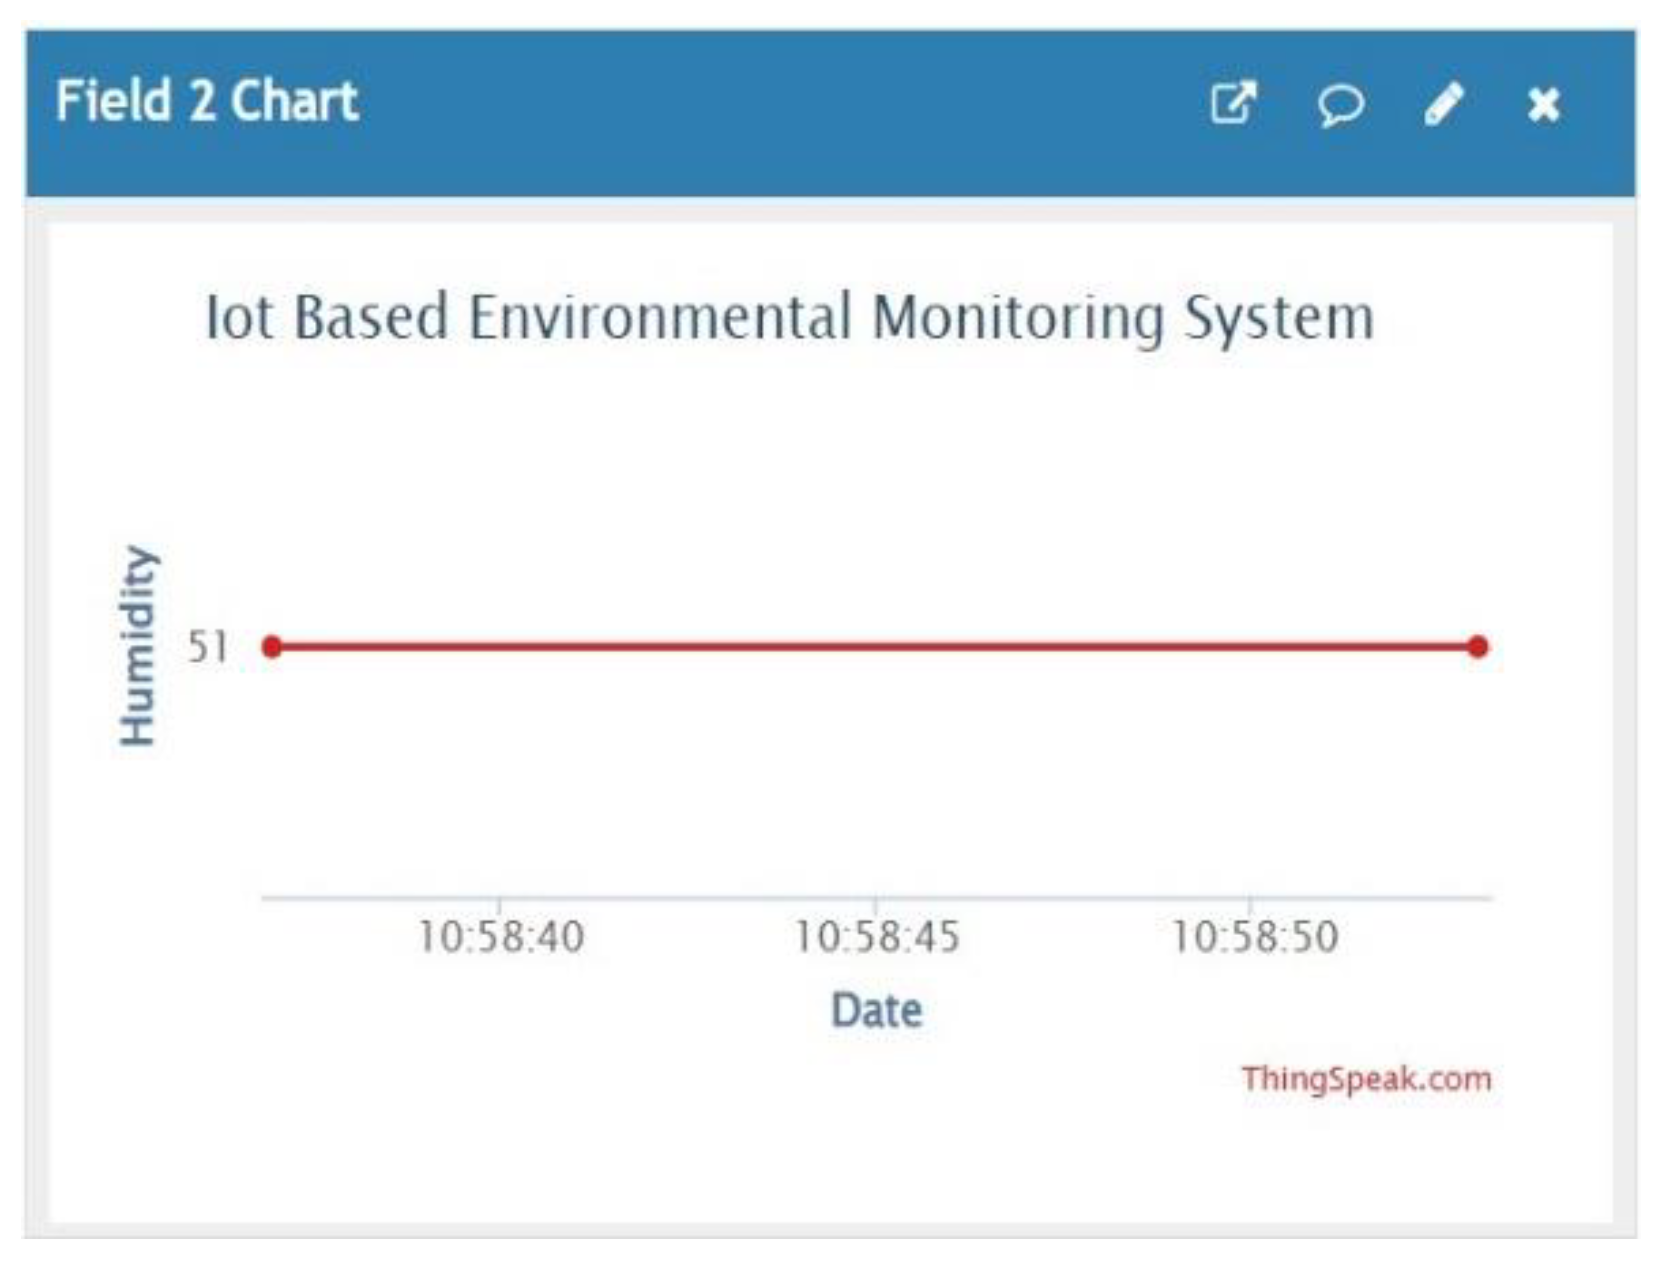
5.1. Result Graph
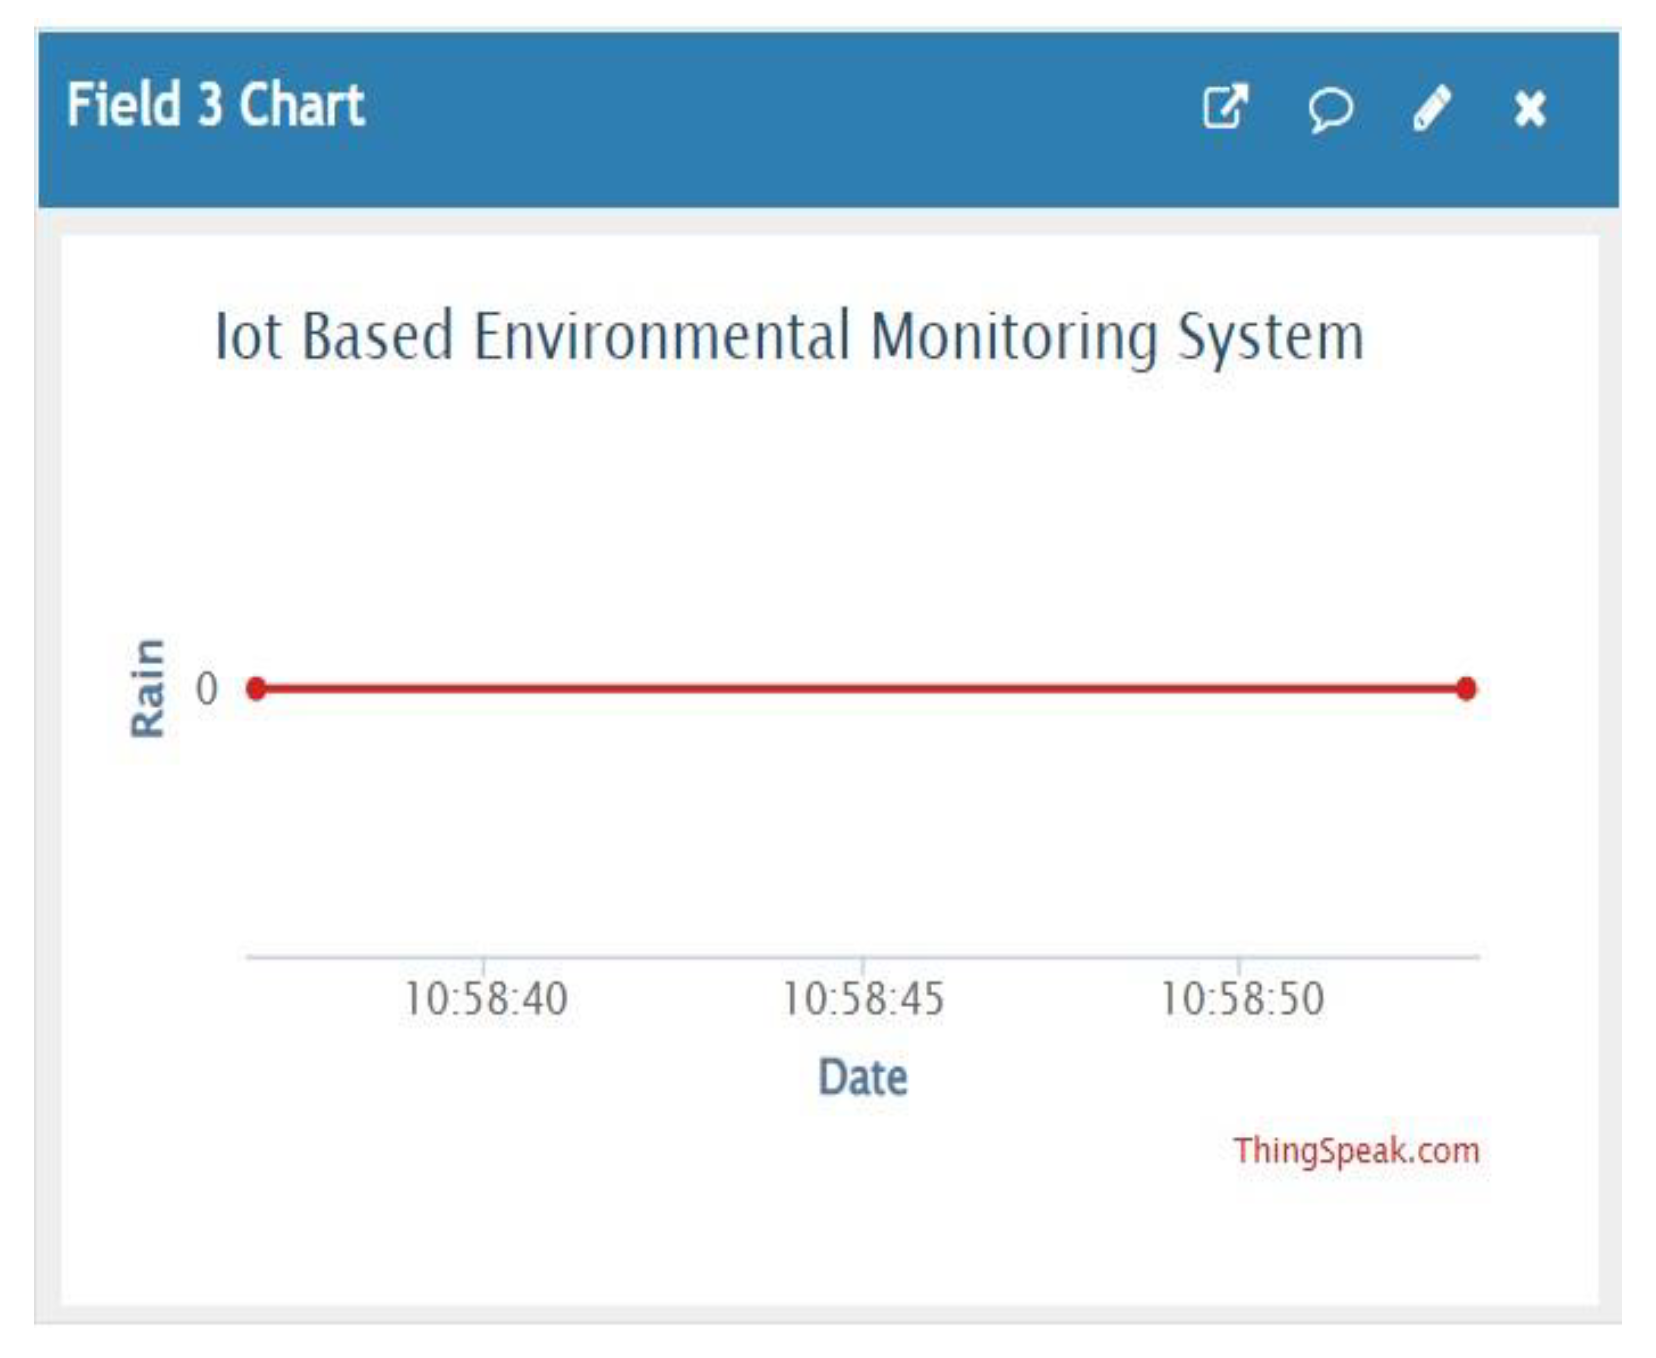
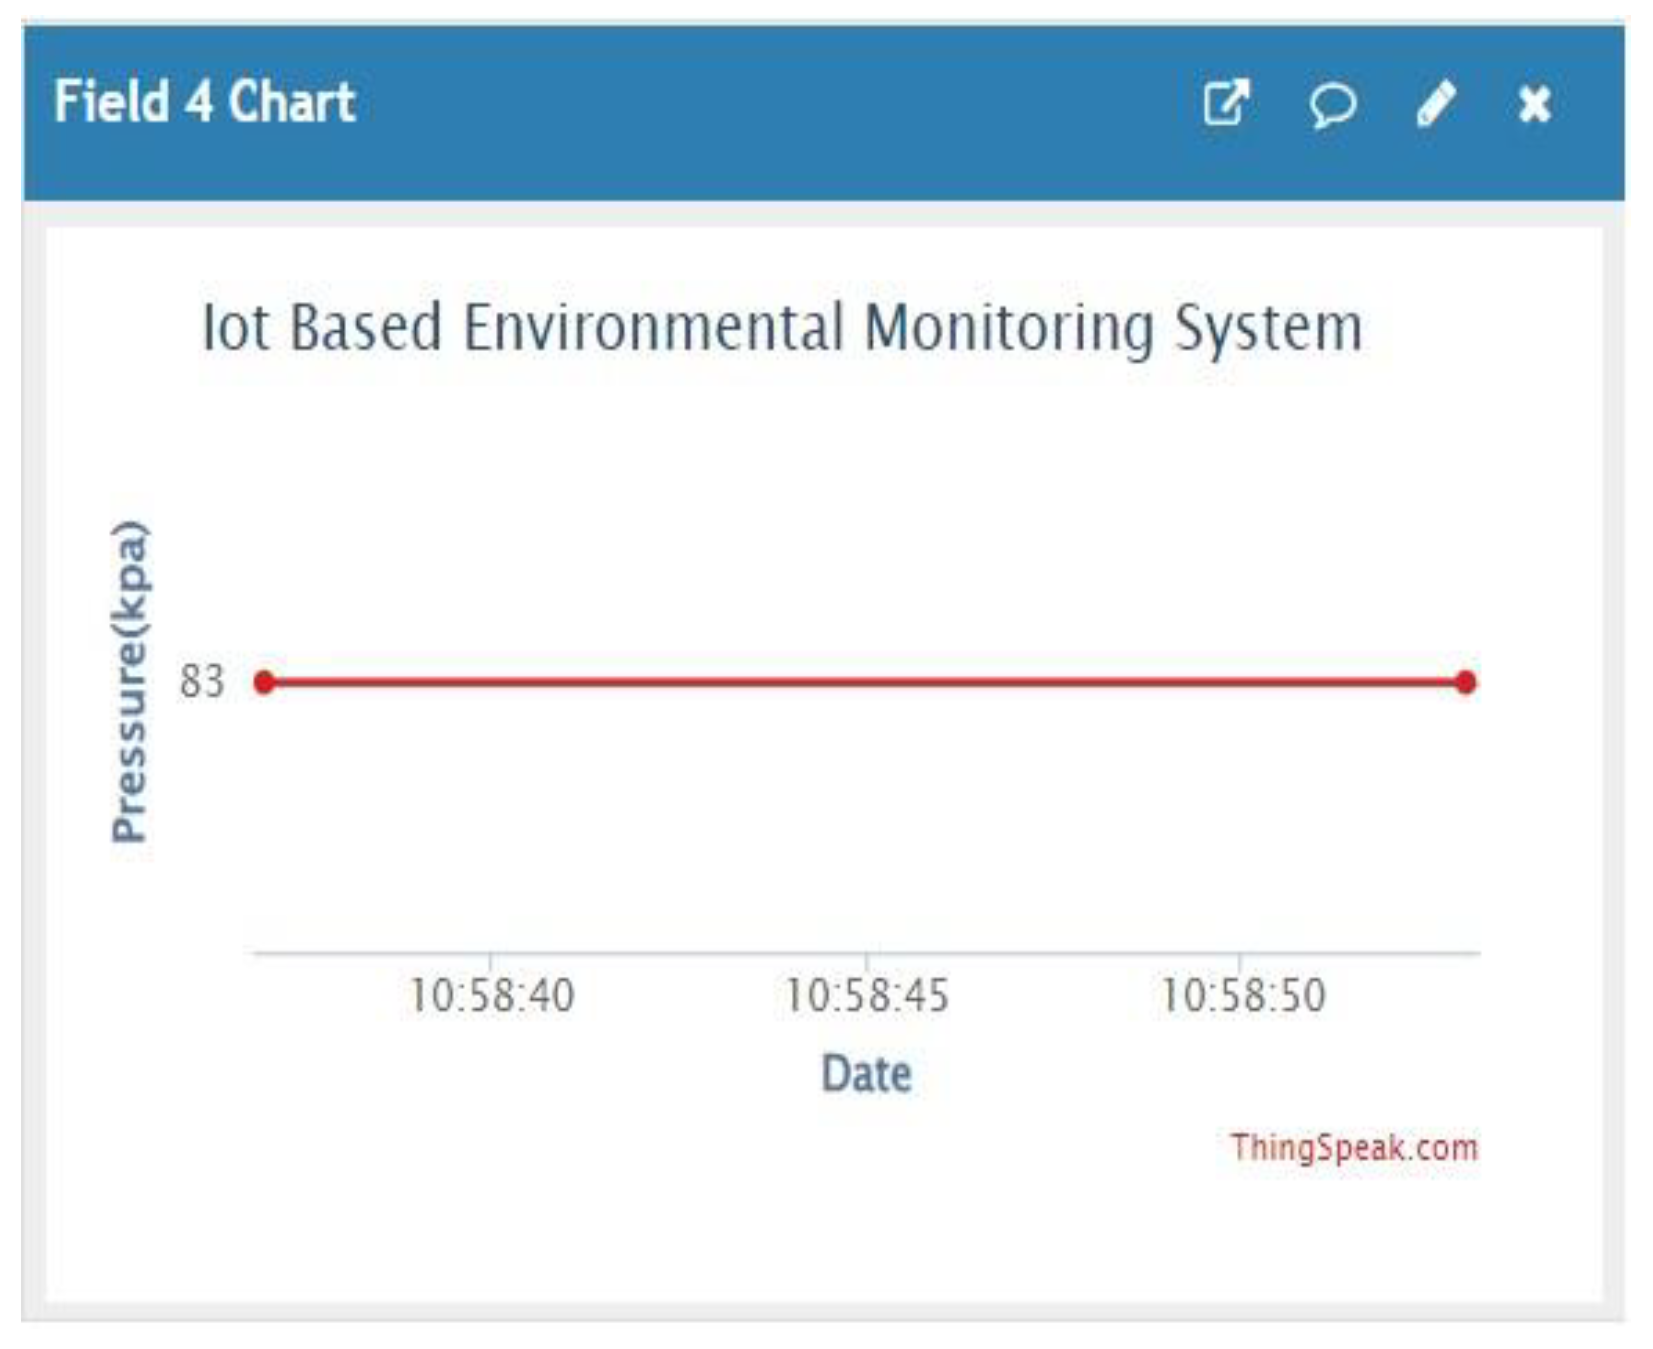
Here, the experimental results of the proposed system were presented. The ThingSpeak displayed the graphical record of temperature, humidity, pressure, and rain possibility environmental parameters. From the ThingSpeak, it was observed that the temperature, humidity, and pressure were 28 oC, 51 %, and 83 kPa. The graphical record of rain showed zero since there were no water droplets on the raindrop detection sensor.
Figure 11.
Temperature graph.
Figure 11.
Temperature graph.
Figure 12.
Humidity graph.
Figure 12.
Humidity graph.
Figure 13.
Rain possibility Graph.
Figure 13.
Rain possibility Graph.
Figure 14.
Pressure graph.
Figure 14.
Pressure graph.
5.2. Result Validation
Temperature, humidity, and pressure were obtained from the ThingSpeak as 28 oC, 51%, and 83 kPa, respectively. However, the temperature measured by the thermometer was 27 °C, while the pressure and humidity measured online were 52% and 99 kPa, respectively. These values with the error percentage are illustrated in
Table 4.
The variations between the ThingSpeak and the thermometer readings constitute a perfect case of "when sensors don't quite see eye-to-eye," reminding us that even in tech, there is a quirk or two. We could be looking at the influence of calibration nuances or subtle differences in response time, with temperature differences standing at a modest 1°C. Humidity, on the other hand, would suggest these sensors probably require a bit of fresh air or even more accurate calibration, with a variation of 1.96 % over the period. But here is the real plot twist in the pressure: ThingSpeak's 83 kPa versus the instrument's 99 kPa raise either a calibration issue worthy of its dramatic investigation or a case of the devices inhabiting different altitudes. Ultimately, this comparison is a gentle prod that sensors, much like people, work best with a little tuning and proper alignment to keep them on the same page.
6. Conclusion
This proposed system can provide a handy solution for real-time temperature, humidity, pressure, and raindrops monitoring from remote distance. When compared to the prices of devices used to measure environmental parameters, this system is small and cost-effective. In this project a program was created to transmit data and the recipient was supposed to view the data. ThingSpeak serves as an intermediary platform, simplifying both processes. The recorded data is wirelessly transmitted to the cloud, where both real-time data and graphical analyses can be accessed. This paper demonstrates a proof-of-concept IoT system for monitoring environmental parameters such as air temperature, humidity, soil moisture, and soil humidity, using readily available hardware. Additionally, this setup can be customized with various sensors or actuators for specific industrial applications.
References
- European Parliament, 2015. The Internet of Things: Opportunities and challenges.
- Anas Tukur Balarabe, Abdurrashid Sani, Zahriya Lawal Hassan “An Arduino UNO Based Environment Monitoring System”, 2019.
- Ali Imam Sunny, Aobo Zhao, Li Li, Sambu Kanteh Sakiliba, “Low-Cost IoT-Based Sensor System: A Case Study on Harsh Environmental Monitoring”, 2020.
- Suhas Pandurang Nikam, Dr. S. M. Kulkarni, “IOT based Environmental Monitoring System”, 2021.
- Nanjundegowda K M, “IOT BASED REAL TIME ENVIRONMENTAL MONITORING SYSTEM USING BLINK APPLICATION”, 2022.
- Aparajita Das, Manash Pratim Sarma, Kandarpa Kumar Sarma, Nikos Mastorakis, “Design of an IoT based Real Time Environment Monitoring System using Legacy Sensors”, 2018.
- Mr. R. Deekshath, Ms. P. Dharanya, Ms. K. R. Dimpil Kabadia, Mr. G. Deepak Dinakaran, Ms. K. R. Dimpil Kabadia, “IoT Based Environmental Monitoring System using Arduino UNO and Thingspeak”, 2018.
- 8. Mukesh Ranjan Sahay, Muthu Kumar Sukumaran, Sudha Amarnath, Thirumalai Nambi Doss Palani, “Environmental Monitoring System Using IoT and Cloud Service at Real-Time”, 2019.
- RoboticsBD, “ESP8266 CH340 NodeMCU Wifi Module Lua V3”, 2022.
- EL-PRO-CUS, “DHT11 Sensor and Its Working”.
- RoboticsBD, “DHT11 Temperature and Relative Humidity Sensor Module for Arduino”, 2022.
- Components101, “DHT11–Temperature and Humidity Sensor”, 2021.
- Techatronic, “DHT11 TEMPERATURE AND HUMIDITY SENSOR | DHT11 SENSOR”,2022.
- Components101, “BMP180 - Atmospheric Pressure Sensor”, 2018.
- RoboticsBD, “Humidity Detection Sensor Module Rain Detection for Arduino”, 2022.
- EL-PRO-CUS, “Rain Sensor Working and Its Applications”.
- RF Wireless World, “Advantages of Rain sensor | Disadvantages of Rain sensor”, 2012.
|
Disclaimer/Publisher’s Note: The statements, opinions and data contained in all publications are solely those of the individual author(s) and contributor(s) and not of MDPI and/or the editor(s). MDPI and/or the editor(s) disclaim responsibility for any injury to people or property resulting from any ideas, methods, instructions or products referred to in the content. |
© 2025 by the authors. Licensee MDPI, Basel, Switzerland. This article is an open access article distributed under the terms and conditions of the Creative Commons Attribution (CC BY) license (http://creativecommons.org/licenses/by/4.0/).