
Submitted:
30 May 2024
Posted:
31 May 2024
You are already at the latest version
Abstract
The purpose of this article is to present an IoT architecture implemented in an intelligent environment, focusing on the optimization of initial conditions and device management. A general control system was developed using an open-source platform, integrating aWi-Fi network and YAML coding to enable communication and control of the IoT architecture devices. The implementation includes actuators, sensors, and control devices that, through a graphical interface, allow the visualization of the historical record of activities and real-time measurements of connected devices. The design includes specific mechanisms and the analysis of materials through tensile tests on specimens, following the ASTM E8 standard, and deformation test simulations, in which PLA demonstrated better performance compared to materials like ABS and resin. The significance of the implemented IoT system lies in an energy saving of 58% compared to conventional structures. Additionally, the study of response times for network connections showed that using an Ethernet cable resulted in a response time of 1.21 seconds, representing a reduction of 1.65 seconds compared to the second lowest value obtained.
Keywords:
IoT architecture
; Intelligent environment
; Energy optimization
; Material performance
; Network response times
1. Introduction
Currently, with technological advancements, the integration of these technologies with the internet is revolutionizing how people interact with their environment, and research laboratories are no exception [1]. The implementation of smart laboratories, developed through automation and the Internet of Things (IoT), enables new possibilities in research within universities [2]. This work describes the design and operation of an IoT laboratory aimed at achieving greater efficiency and optimal working conditions for laboratory users.
The development of smart laboratories involves the integration of devices and technological systems that allow the automation of daily tasks, real-time data acquisition, and process optimization [3]. The aim of developing IoT devices is to facilitate the daily activities of users and to create optimal conditions that enhance overall capabilities and performance, thereby promoting innovation in academic and scientific fields. The creation of an IoT environment in the university improves resource management, security, energy efficiency, and other aspects [4].
Considering that each laboratory area has specific requirements, the project addressed aspects such as the physical structure of the laboratory, control of lights and blinds, control of existing devices such as TVs or projectors, projector security, and voice control [5]. These requirements enhance the functionality of the laboratory by integrating mechanical, electronic, and control aspects.
The architecture of an IoT laboratory is based on the interconnection of devices and systems through communication networks, as mentioned in [6]. The implementation of an IoT structure with a control center for managing and monitoring the laboratory environment requires the use of programming languages such as Python and communication protocols like Wi-Fi networks [7]. This intelligent infrastructure allows for efficient resource management and process optimization in the laboratory.
Furthermore, smart laboratories offer intelligent applications and services that improve various aspects of scientific operations [8]. From smart office systems to automated laboratory systems, these technological tools optimize research and experimentation processes, increasing productivity and the quality of results [9].
The work presented here illustrates how smart laboratories represent a unique opportunity to transform the way scientific research is conducted, leveraging technology to improve efficiency, accuracy, and the quality of results. This new paradigm in scientific workspaces promises to revolutionize the conception and management of laboratories, opening new possibilities for innovation and scientific advancement.
2. Materials and Methods
This section details the design of the IoT architecture for the monitoring and control of devices.
2.1. IoT Architecture
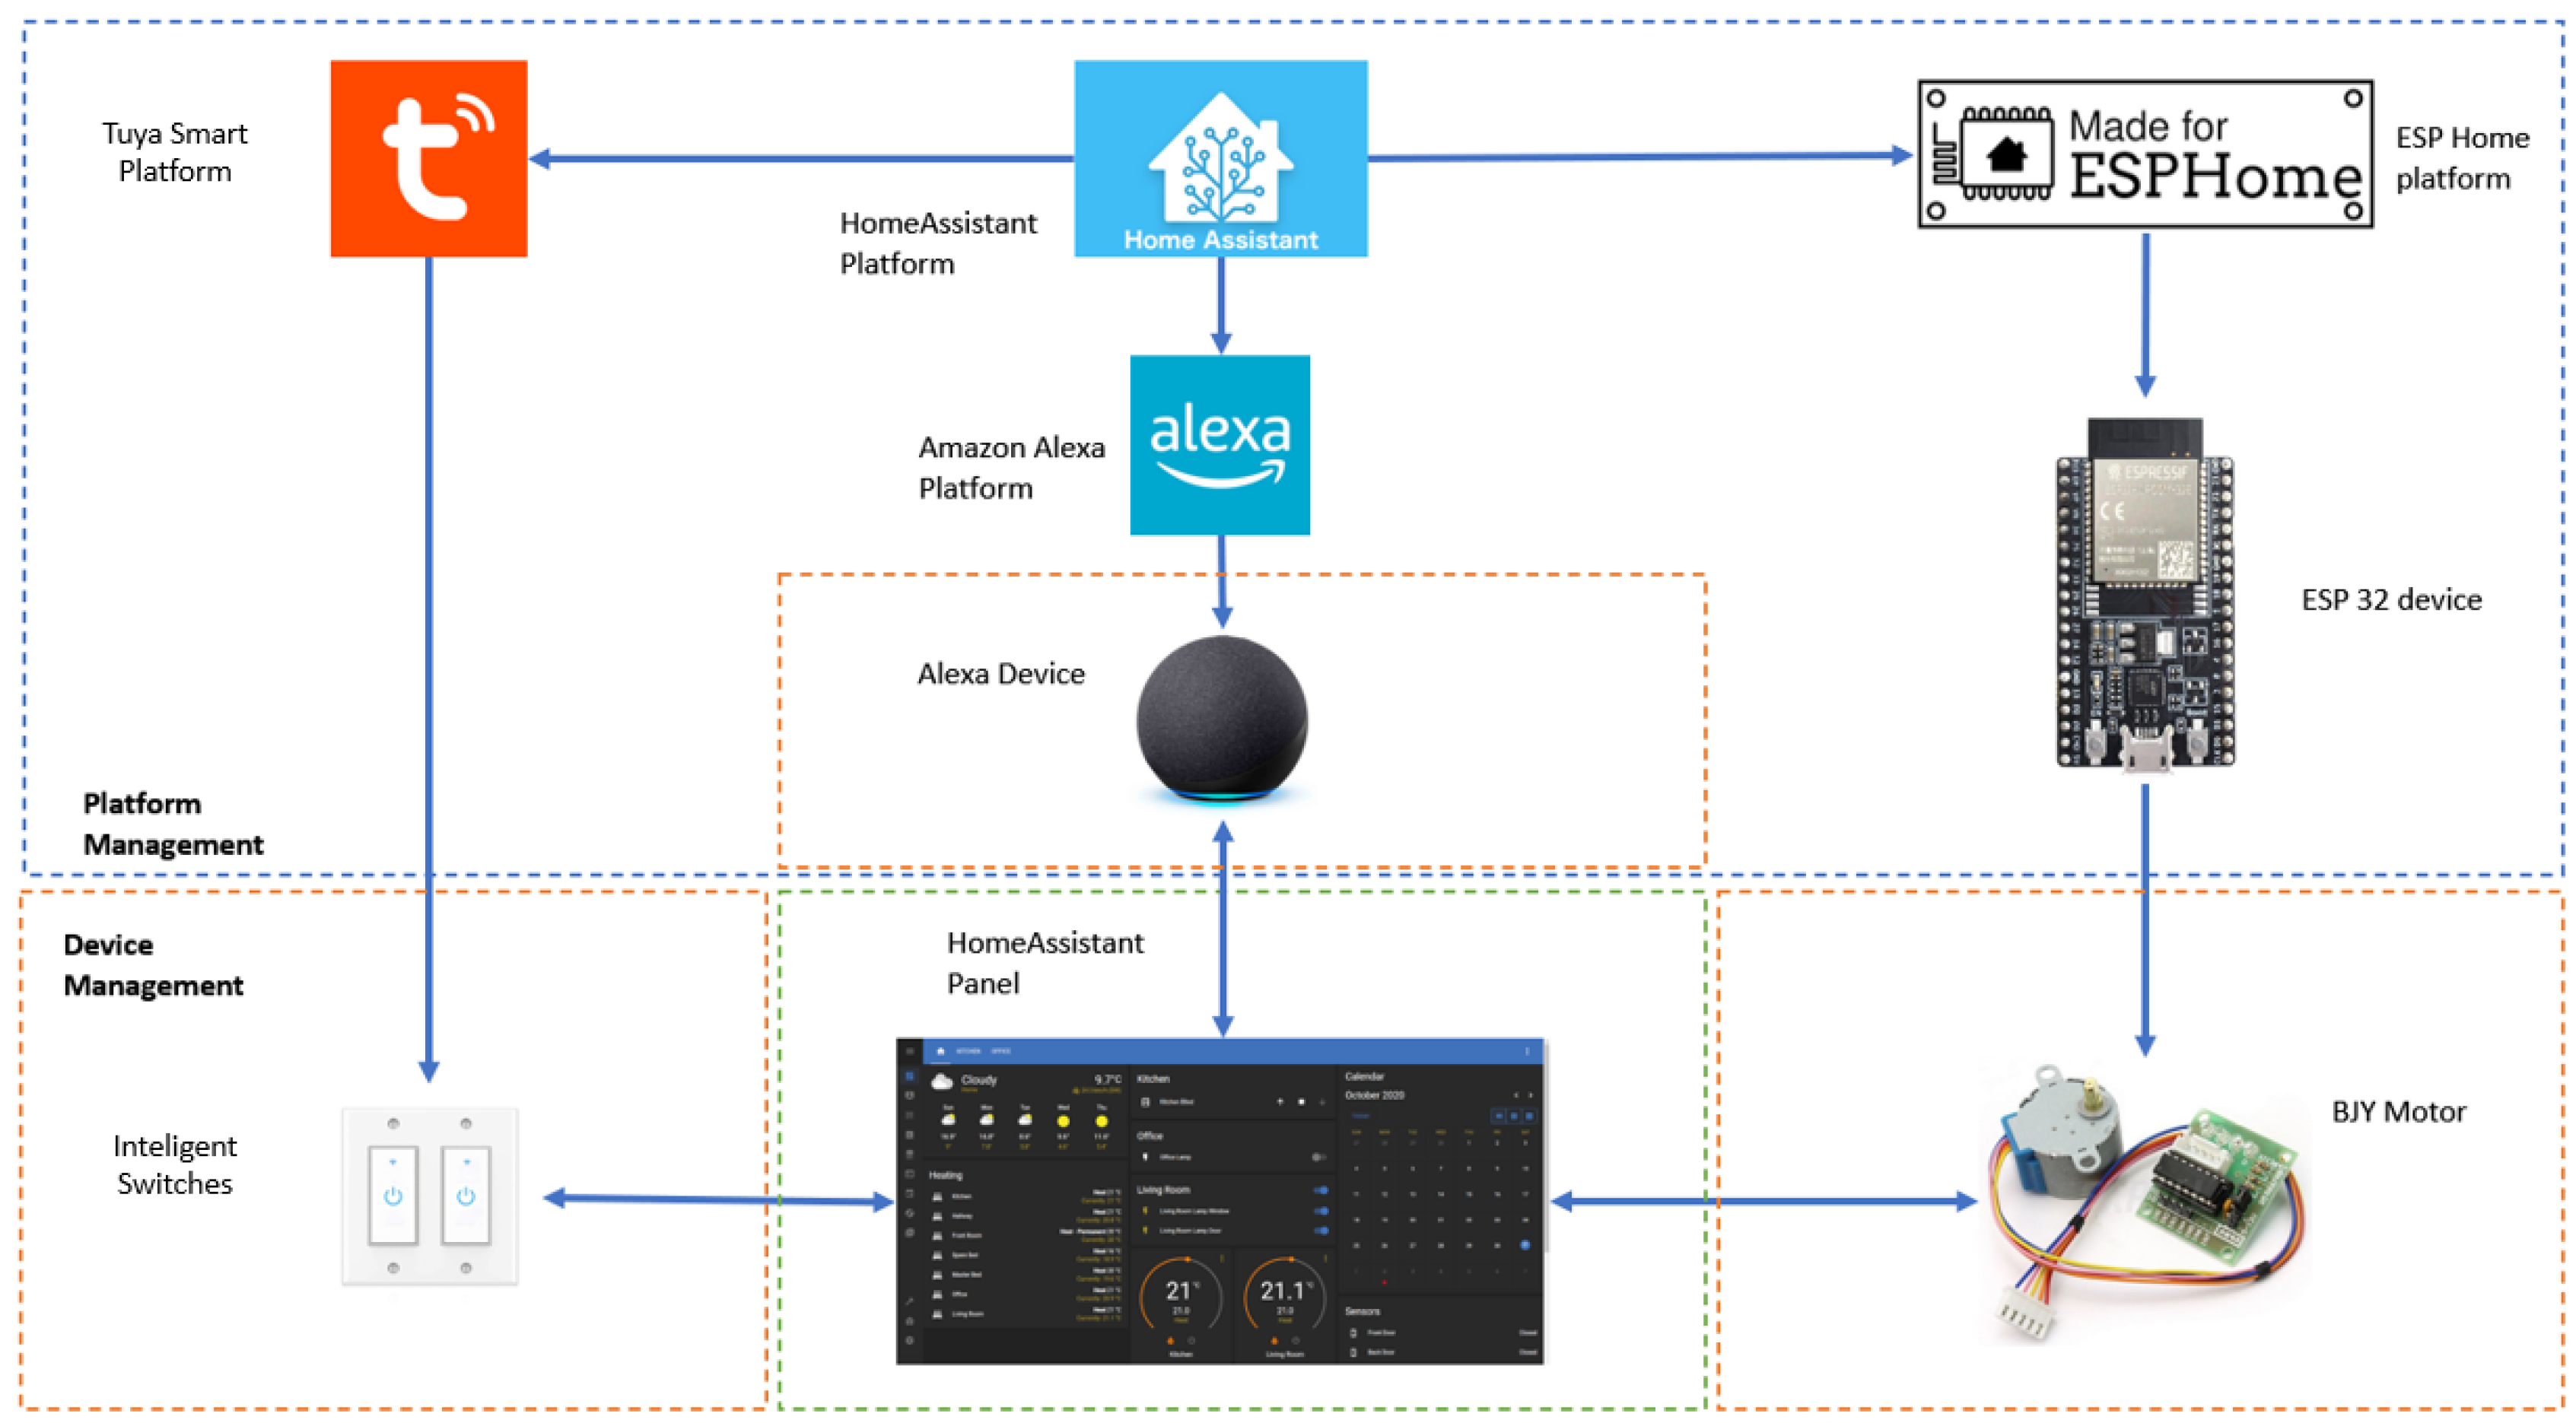
At this stage, through a communication scheme and various objectives to be achieved, the general constitution of the home automation system is presented. Additionally, devices within the requirements are listed, and how they are all interconnected with the HMI is described. The IoT architecture scheme to be used according to the components, protocols, and networks utilized is presented in Figure 1.
The IoT architecture used is a three-layer architecture, which includes: the perception layer, the network layer, and the application layer (Khanna, 2017). The perception layer corresponds to the light sensor, door opening and closing sensor, and motion detection.
The network layer corresponds to the gateway connecting smart devices and the application, referring to both the Wi-Fi network and the Tuya Smart, Amazon Alexa, Broadlink app, EZVIZ camera, Nexx Home Smart, and ESP Home applications, which allow linking devices to the Open Source Platform server.
Finally, the application layer represents the Open Source Platform, which encompasses all the control and monitoring functionalities of smart devices, providing reading modules, control, and a historical record of all actions and events occurring within the IoT environment.
2.2. IoT Topology
The designed IoT architecture is based on a Tree topology, as it is necessary for smart devices to be connected (in most cases) to their native applications provided by the manufacturer. This is because the Open Source Platform provides integrations of these applications within its platform, thereby replicating the functioning and reading of smart devices through this integration, as shown in Figure 2.
2.3. Open-Source Platform
Open-source platform that enables the implementation of a home automation environment, allowing users to integrate smart devices from different platforms and developers. This integration facilitates interaction among the devices to control various conditions and readings within the installation. Additionally, it supports control and monitoring through a graphical interface or voice controls via Alexa.
This remote server is installed on a machine running a Linux operating system, which allows us to generate an IP address to host our server online.
Figure 3.
Communication diagram of Open Source Platform.
For the implementation of the IoT structure, various devices have been selected to fulfill the following functions:
- Smart Switches: Remote on/off control of the installation’s lights.
- Door Magnetic Sensor: Security device for monitoring the entry and exit of the faculty room, verifying door opening and closing.
- Smart Door Lock: Automatic door locking and unlocking device with fingerprint and code reader.
- Broadlink IR Control: Remote control device for infrared signal-controlled devices, such as televisions and projectors.
- Blind Motors: Opening and closing of blinds based on light readings within the installation.
- Alexa: Device linked to the system for implementing voice controls for easy handling and access.
- EZVIZ C6N Video Camera: Remote surveillance camera for monitoring people and activities within the room.
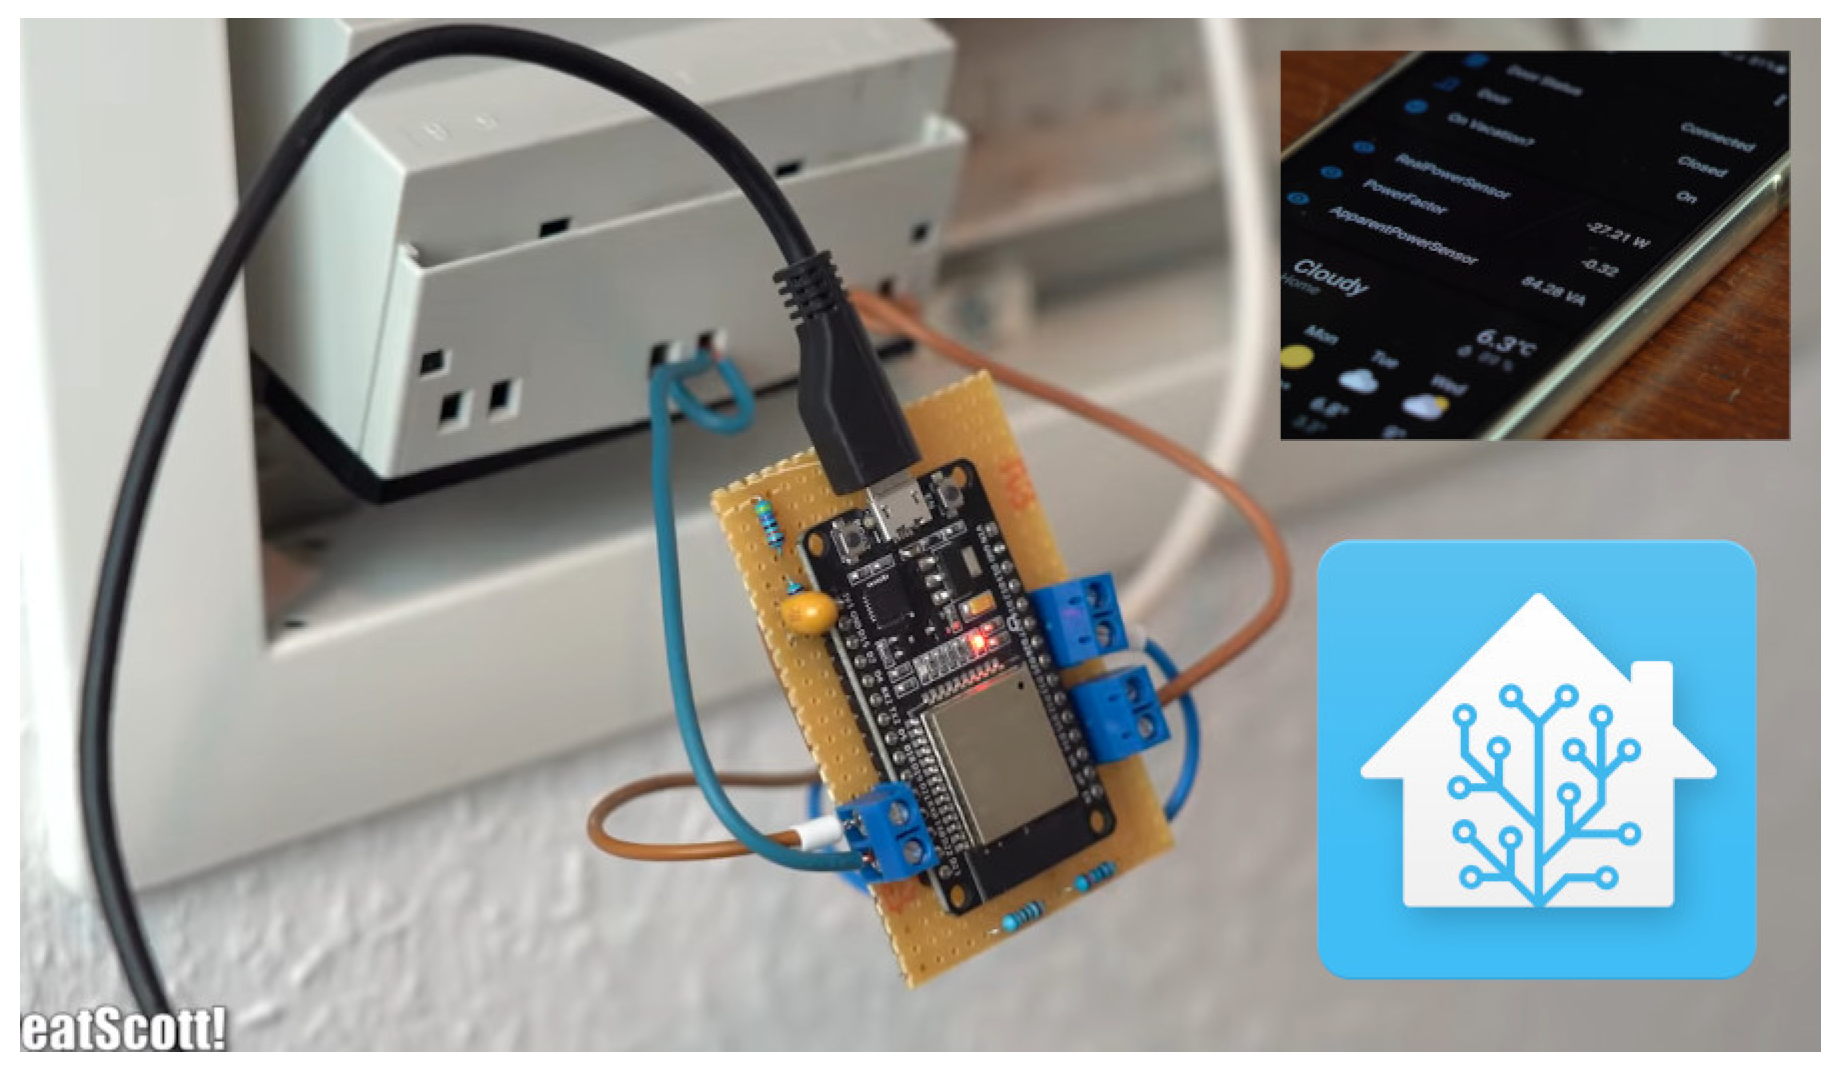
- ESP32 Boards: Control of lighting sensors and motors for the opening and closing of the projector structure.
2.4. Open Source Platform Communication Flow Diagram
The Open Source Platform communication scheme is based on TCP/IP protocols, generating a local server connected to the WiFi network. This setup creates a platform to link the various smart devices associated with the connection network, as illustrated in the diagram in Figure 4.
2.5. Open Source Platform HMI Navigation
The following modules were implemented for managing the Open Source Platform interface, with the following configuration:
Figure 5.
Layout of the Open Source Platform Interface
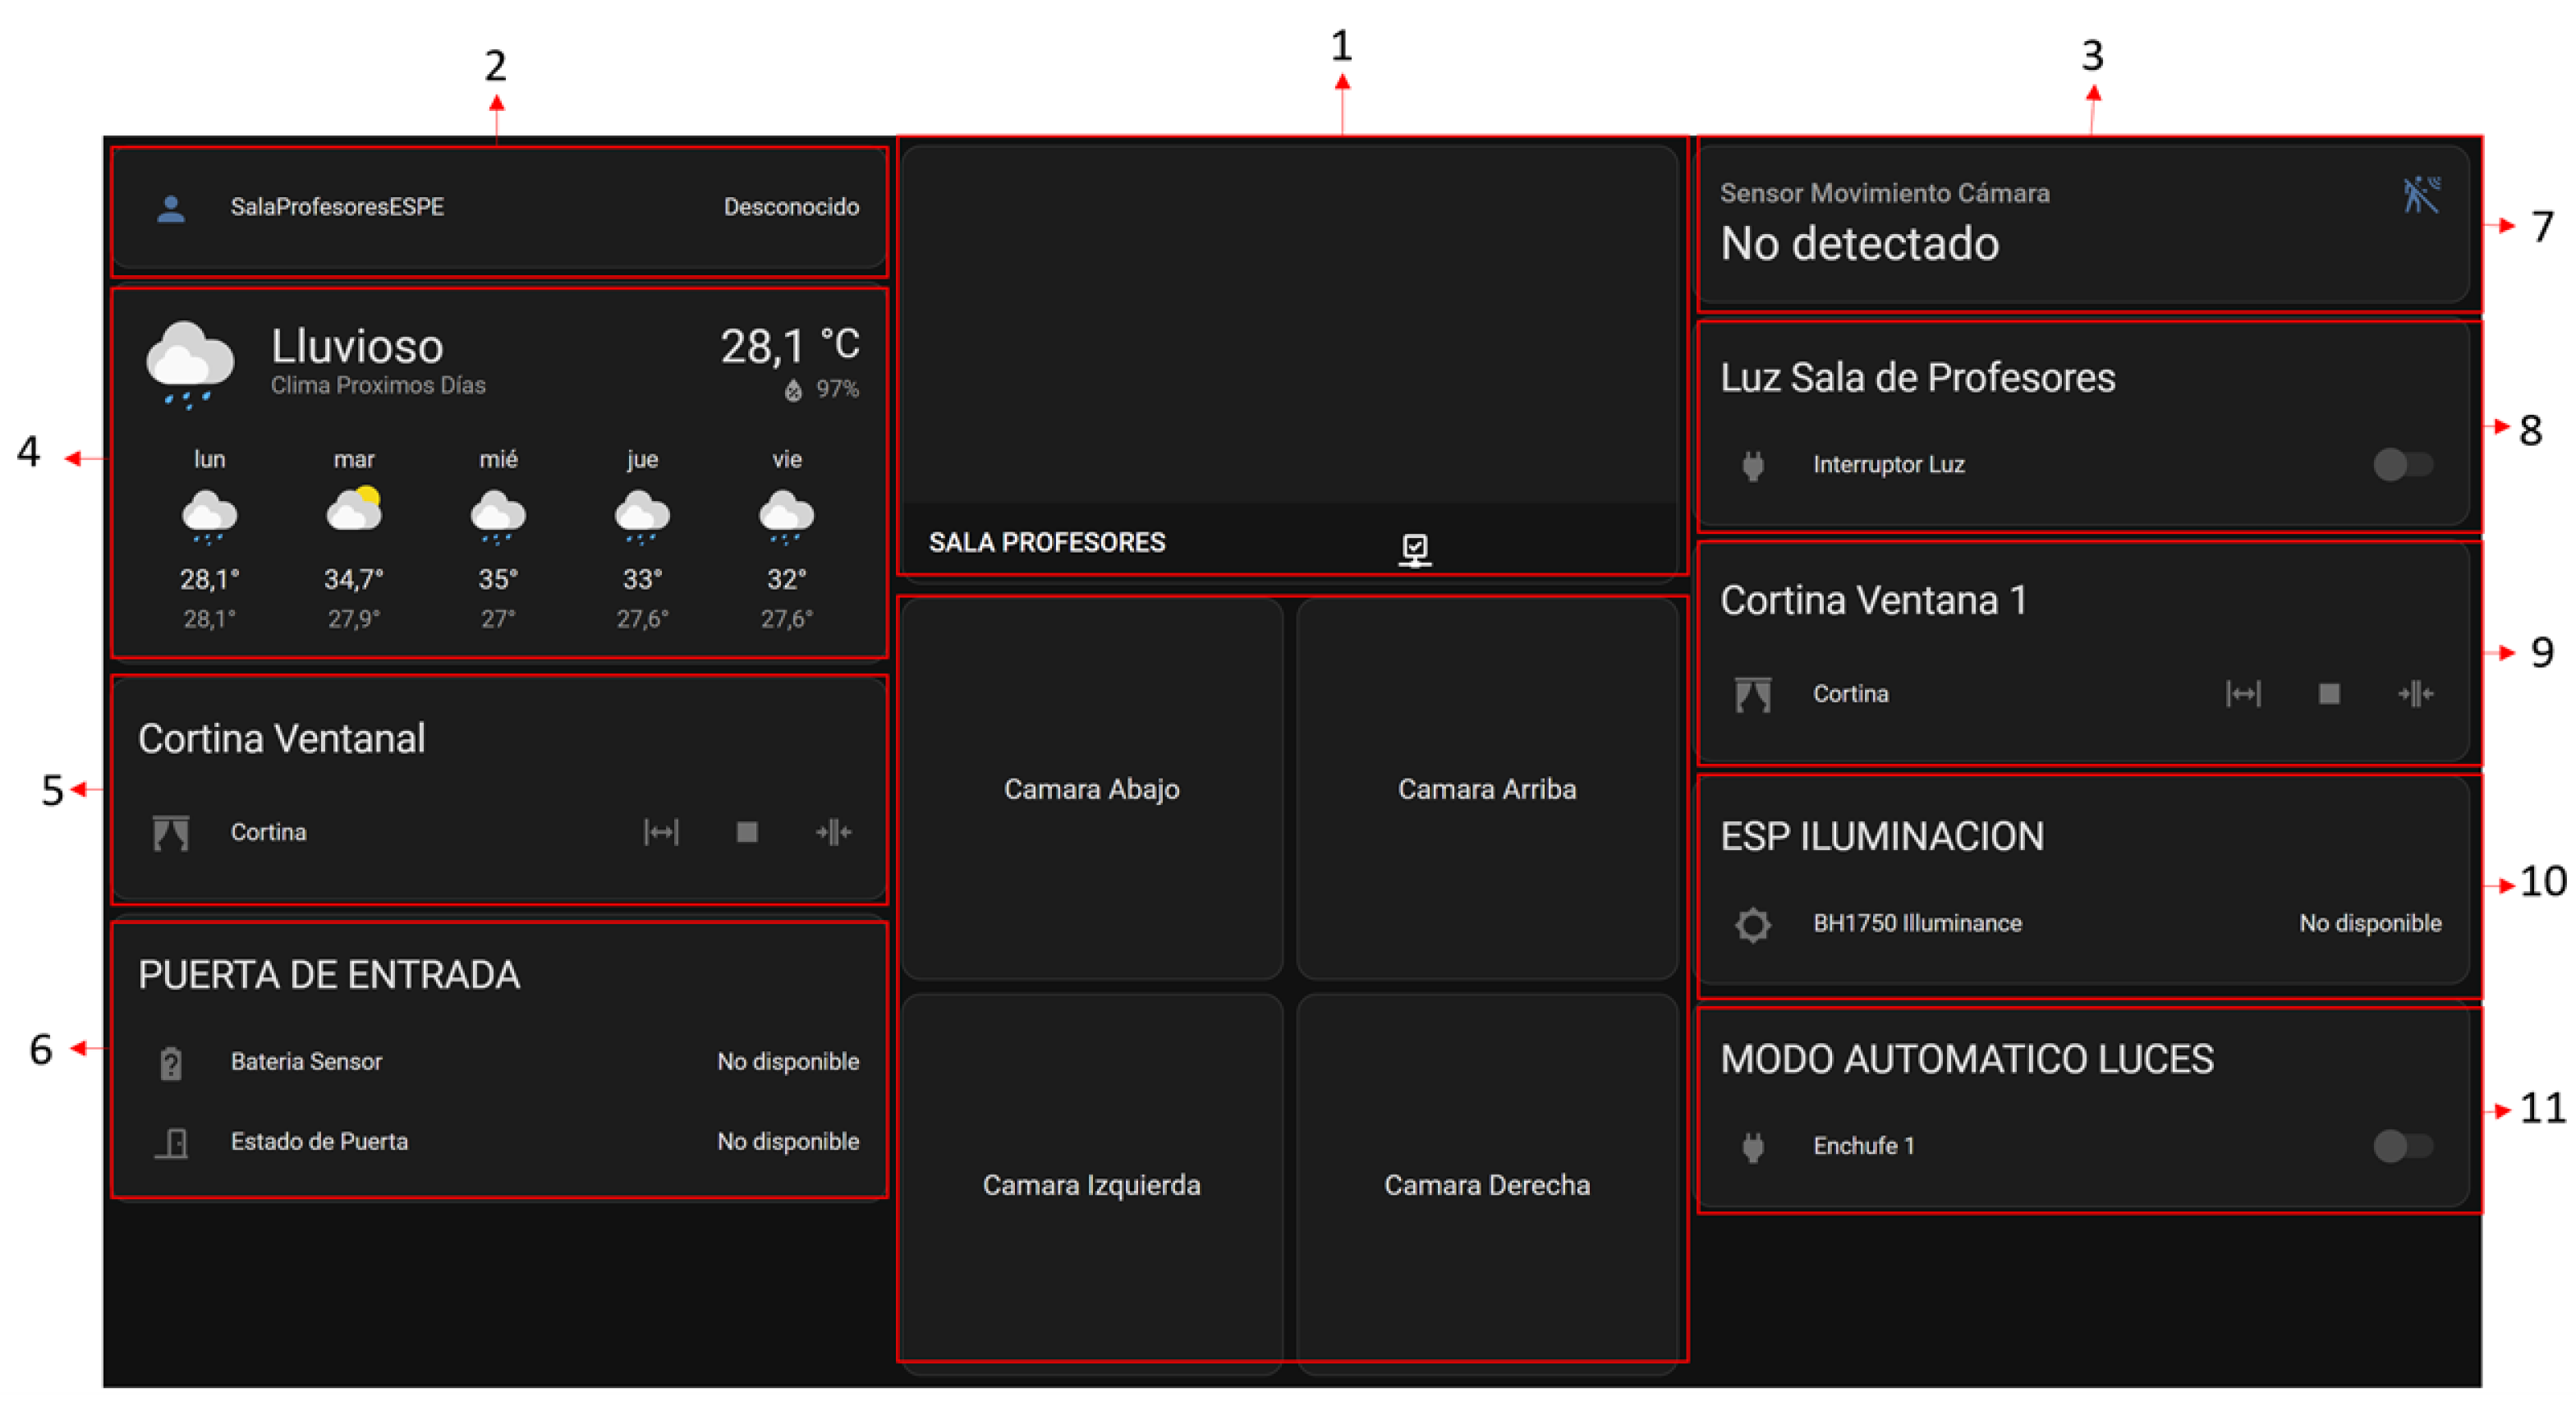
The numbered elements are as follows:
- Live video stream from the EZVIZ 360 Camera.
- Username registered on the platform.
- Motion sensor detection status from the camera.
- Weather information, including current temperature and humidity, and forecasts for the next 6 days.
- Control for opening, closing, and stopping the window curtain.
- Control for the status of the main door (open/closed) and the battery level of the sensor.
- Motion sensor status.
- On/Off control of the main lights.
- Control for opening, closing, and stopping the small window.
- BH1750 light sensor reading module.
- On/Off control for the automatic mode of the lights.
2.6. Design of the Projector Control Mechanism
Figure 6 shows the design of the mechanism for controlling the projector.
The static analysis of the gear system shown in Figure 7 is performed.
Figure 7.
Von Mises analysis of the rack and pinion

Figure 8.
Unit deformation analysis of the rack and pinion
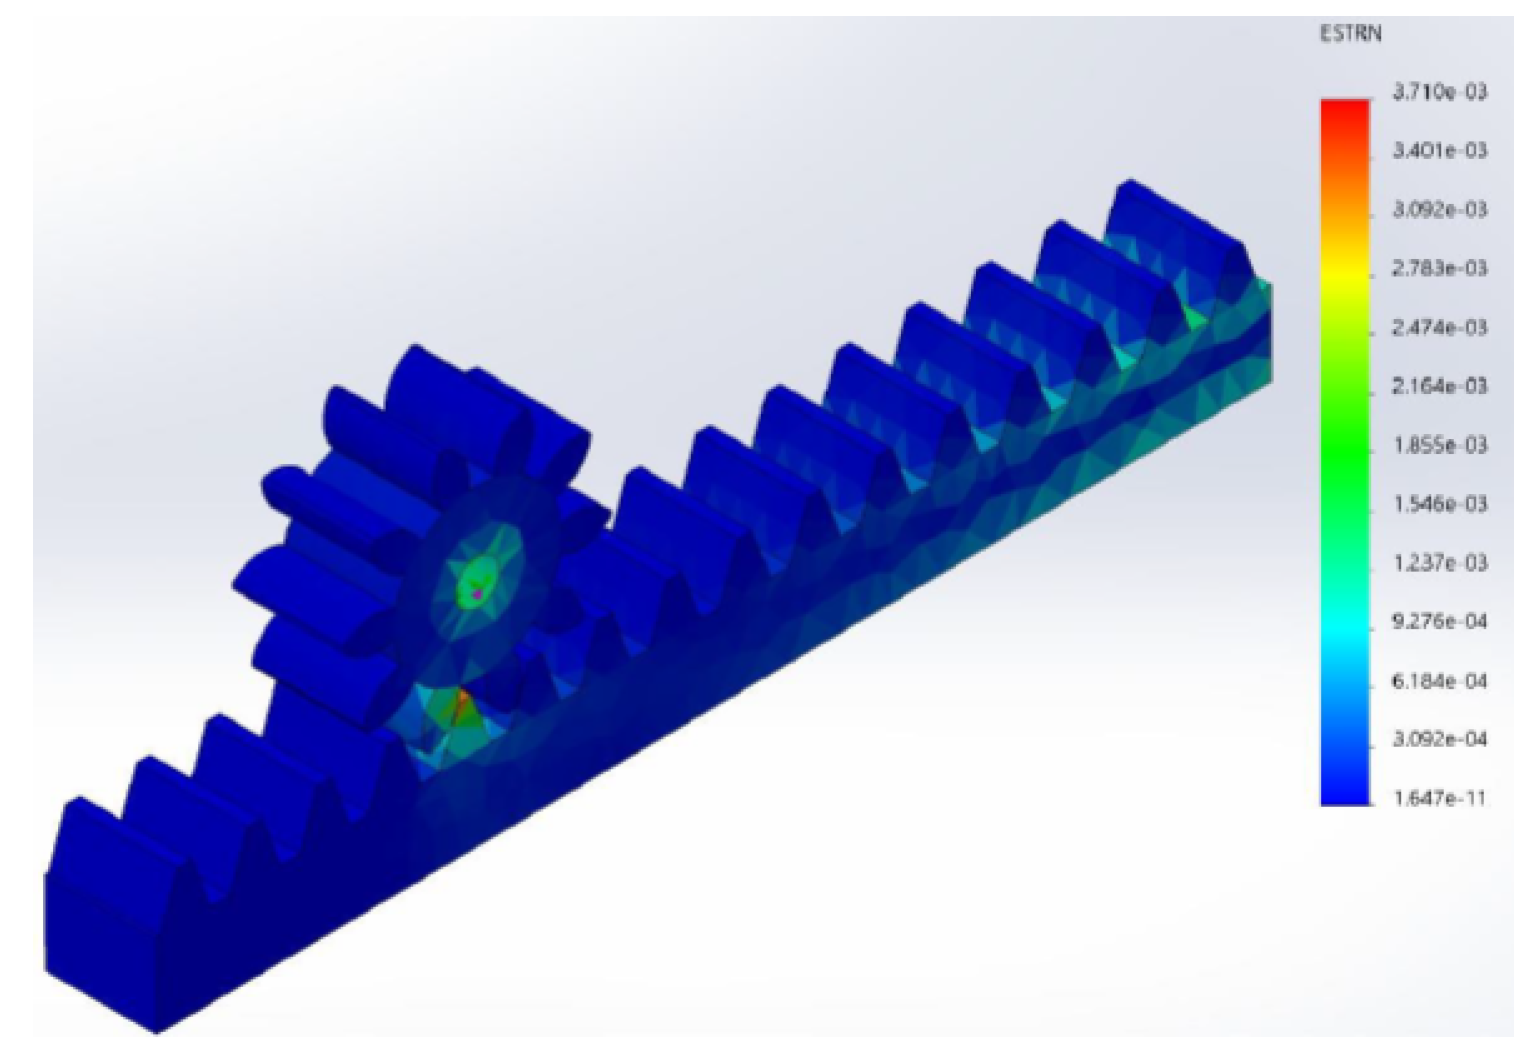
Figure 9.
Safety factor analysis of the rack and pinion
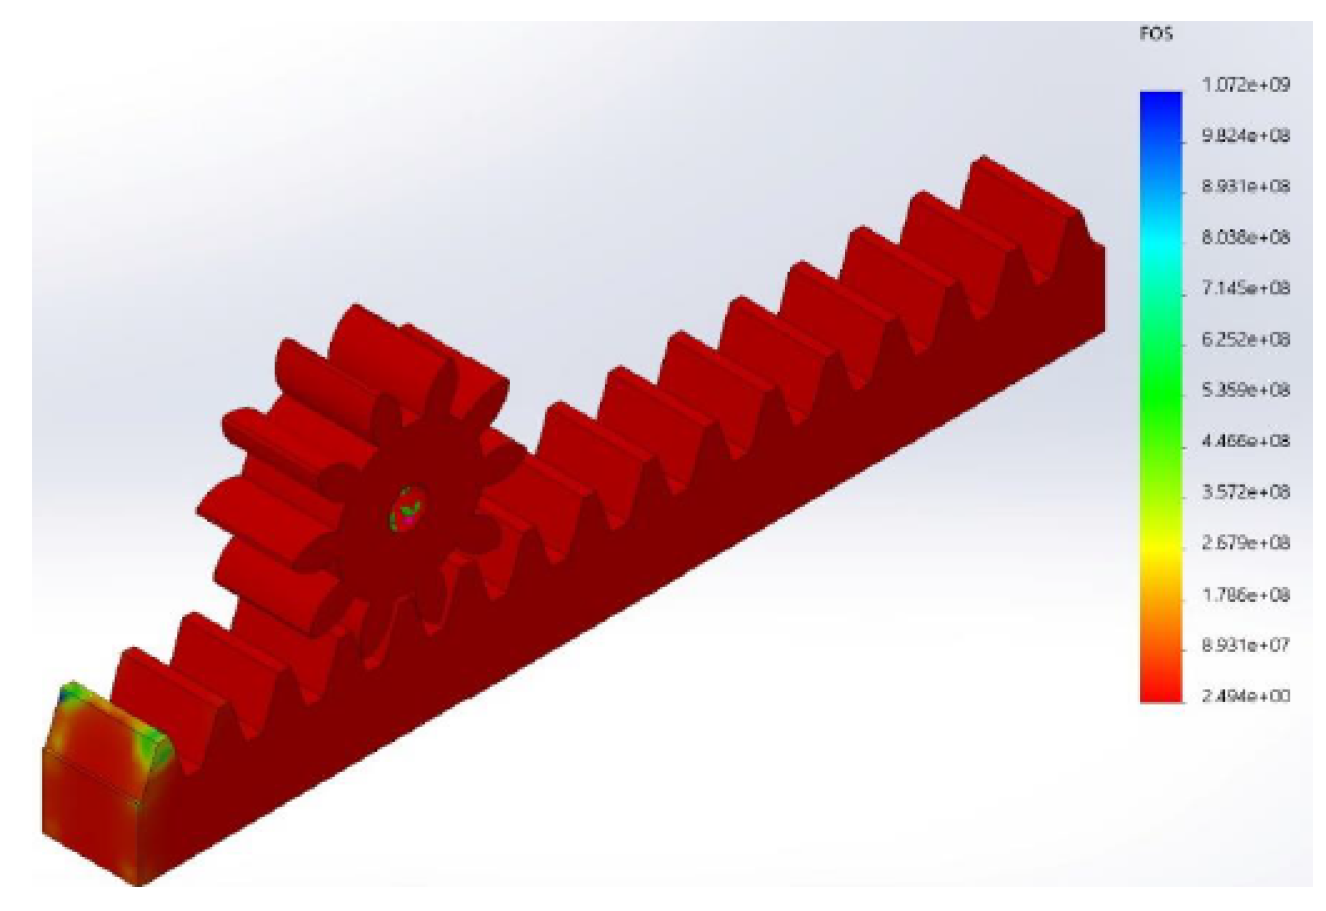
A maximum deformation value of 0.0037 in the contact of the system and an acceptable safety factor of 2.5 in the rack and pinion system were obtained, according to the sizing, motor selection, and material selection.
2.7. Design of the Projector Control Mechanism
Test specimens were designed according to the ASTM standard for tensile testing to simulate the deformation of 3D printing materials such as PLA, ABS, and Resin. Tensile simulations were performed using design software with the specimen dimensions shown in Figure 10.
3. Results
3.1. System Assembly
The assembly and operation of the automated environment began with the implementation of all the selected mechanical and electronic devices from the design stage within the faculty room. This setup ensures that all components operate within the optimal range of the WiFi network, which maintains connectivity and functionality of the entire system.
Additionally, for supplementary components such as control boxes, opening and closing mechanisms, and the projector structure, 3D printing and laser cutting on MDF were utilized to create solid and durable structures for long-term integration.
Some of the mounted objects are shown as follows:
Figure 11.
Implementation of ESP32 Boards.
Furthermore, smart devices like Alexa were used to link our system with voice control, making its usage more dynamic.
3.2. Operation
To operate the system, the Open Source Platform operating system must be started, which in this case is implemented on a virtual machine. This generates the server with a TCP/IP protocol linked to the local network, allowing access to all the devices available within the same network.
Figure 12.
Initialization of the Open Source Platform virtual machine.
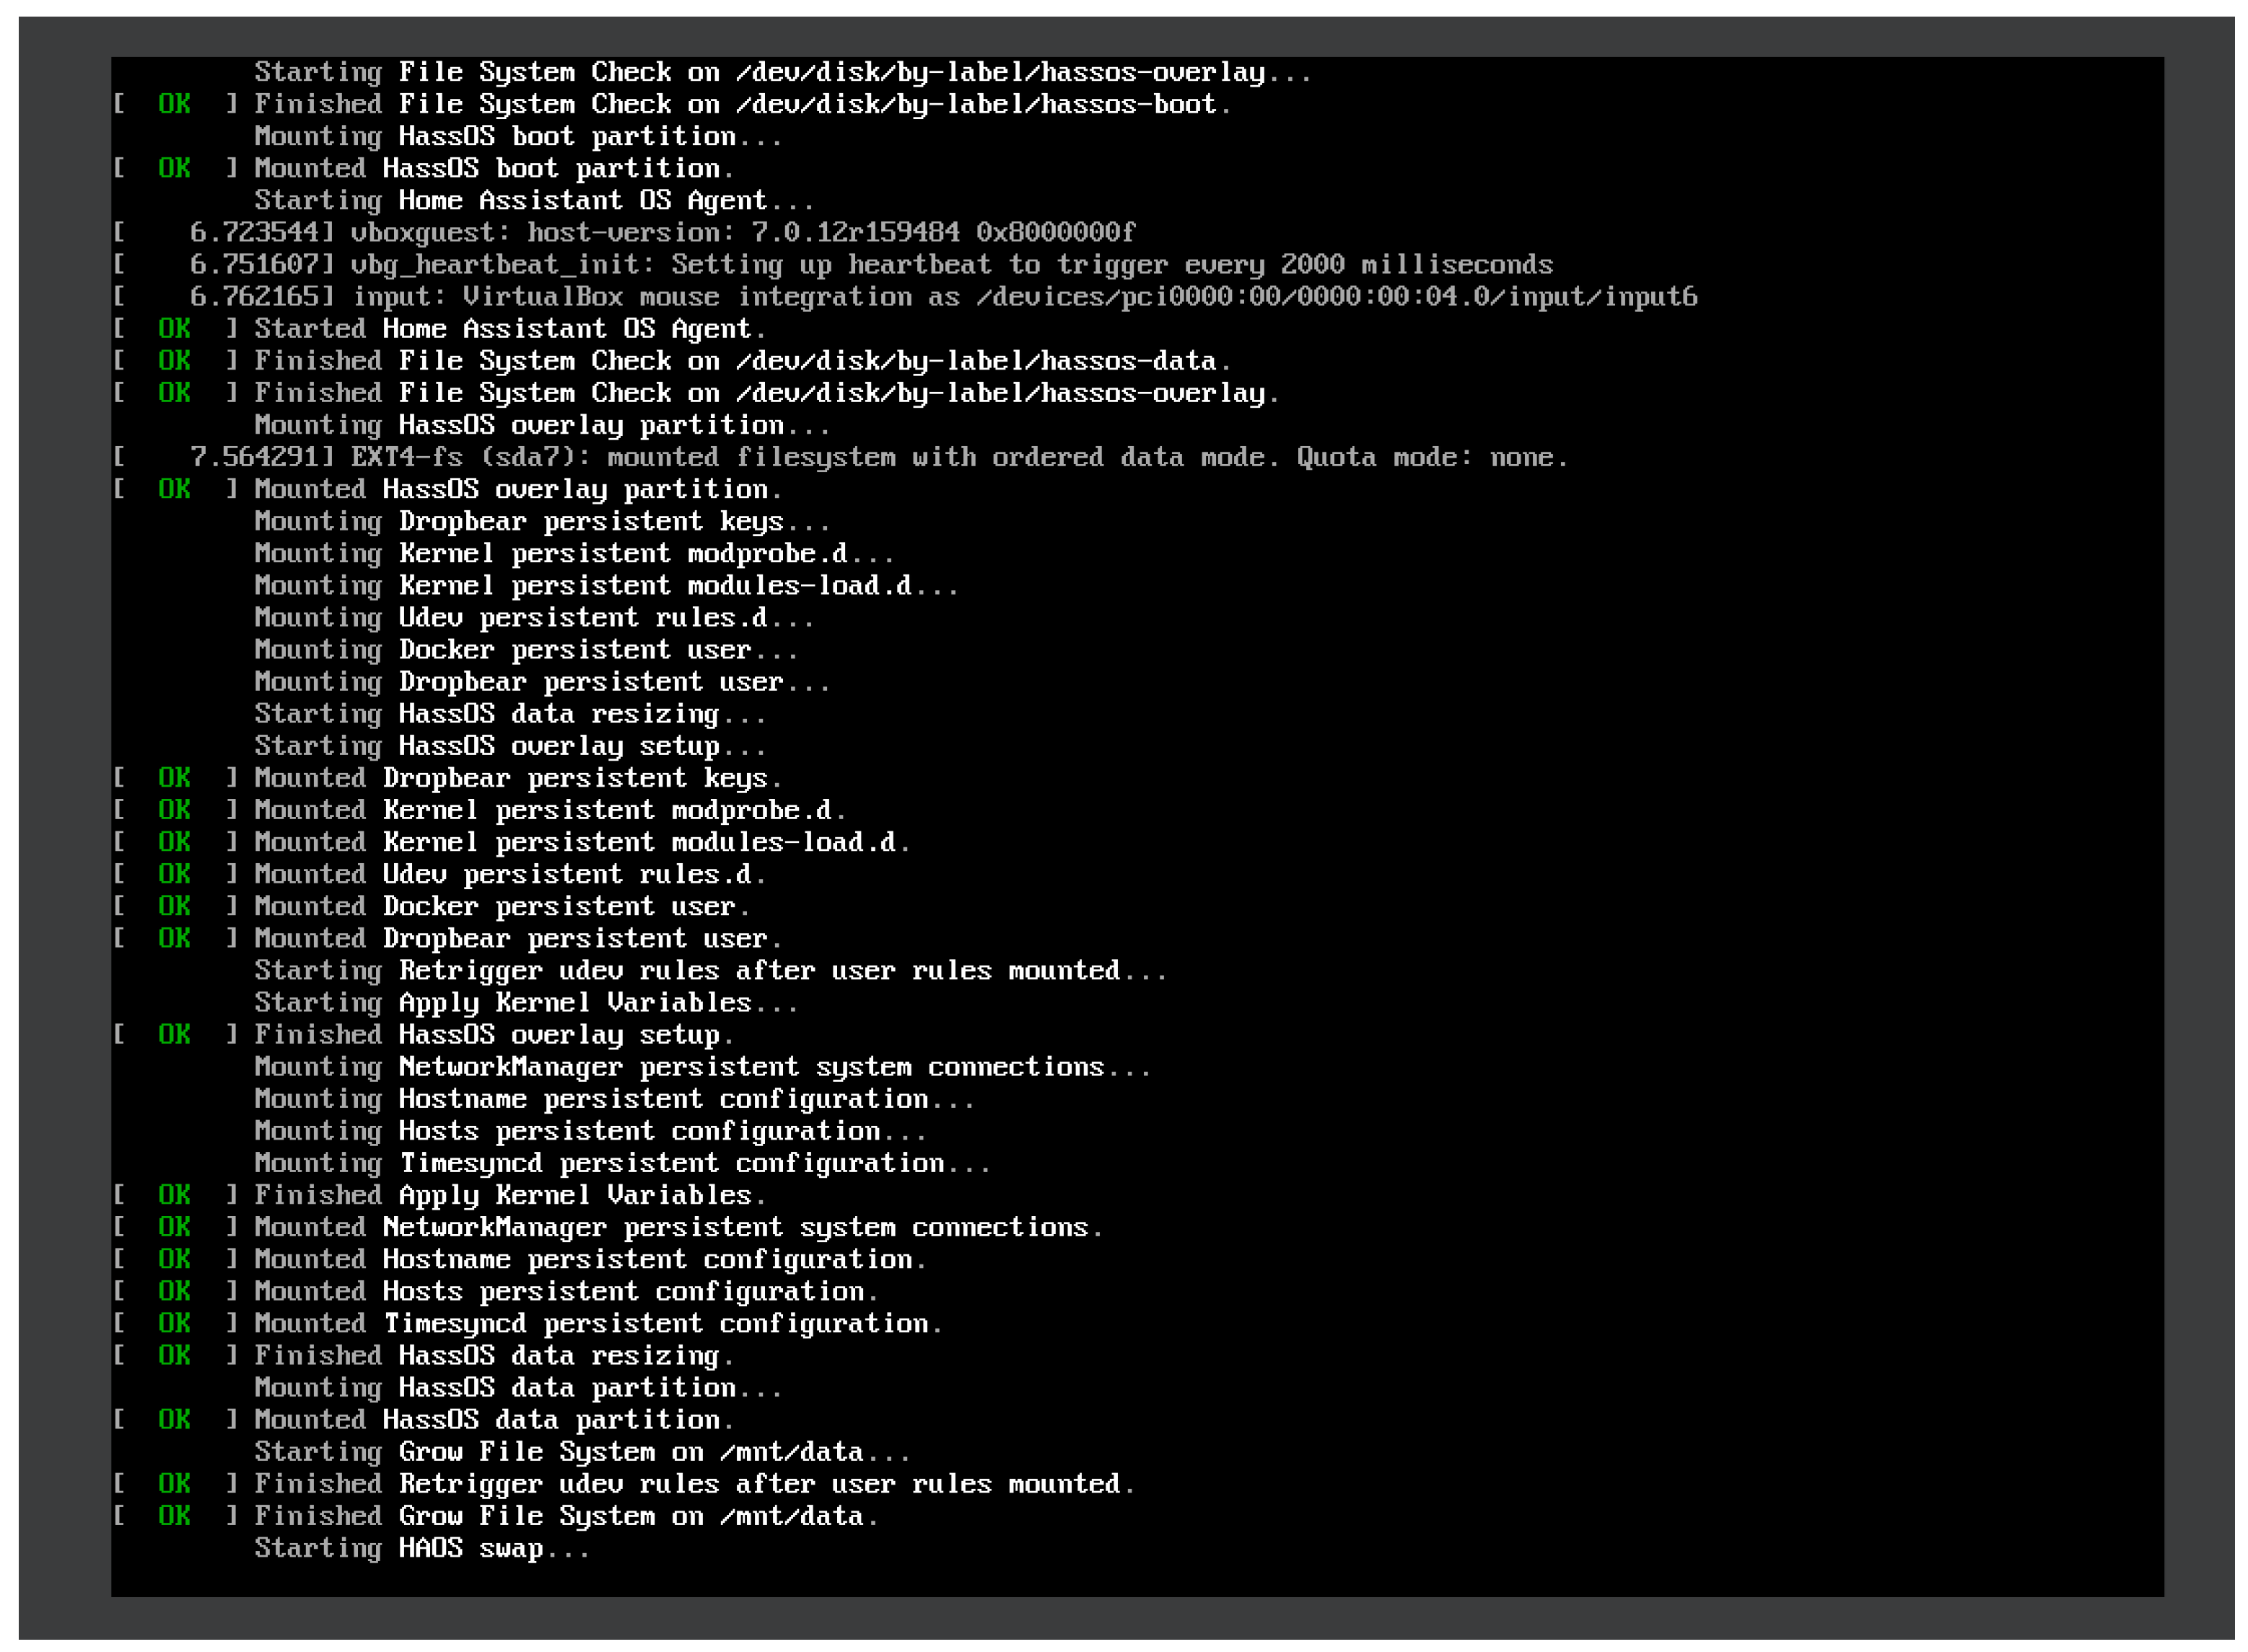
After initializing the virtual machine, it generates the address for our platform control server, allowing us to access it as follows:
Figure 13.
Open Source Platform server created.

Subsequently, the URL address can be copied, and we can log into the platform using the previously created user credentials.
Figure 14.
Open Source Platform Login Screen
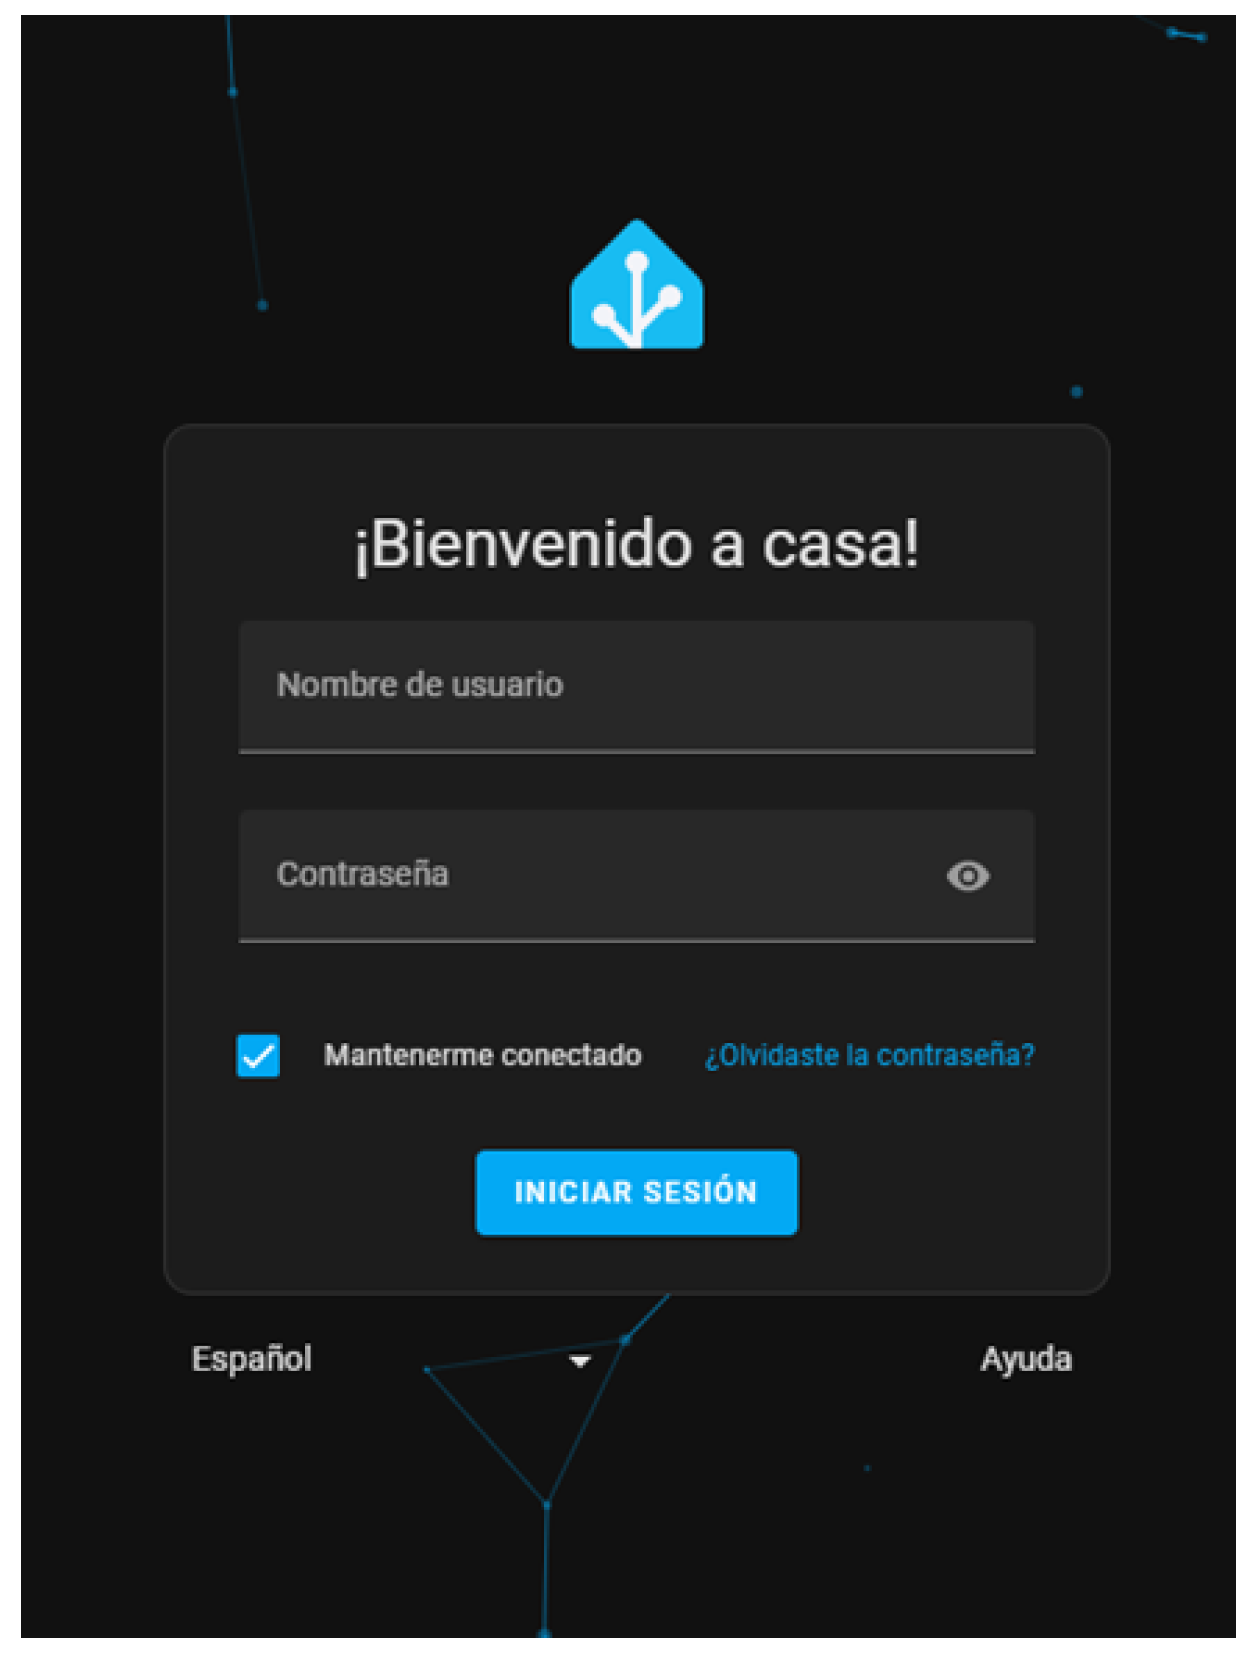
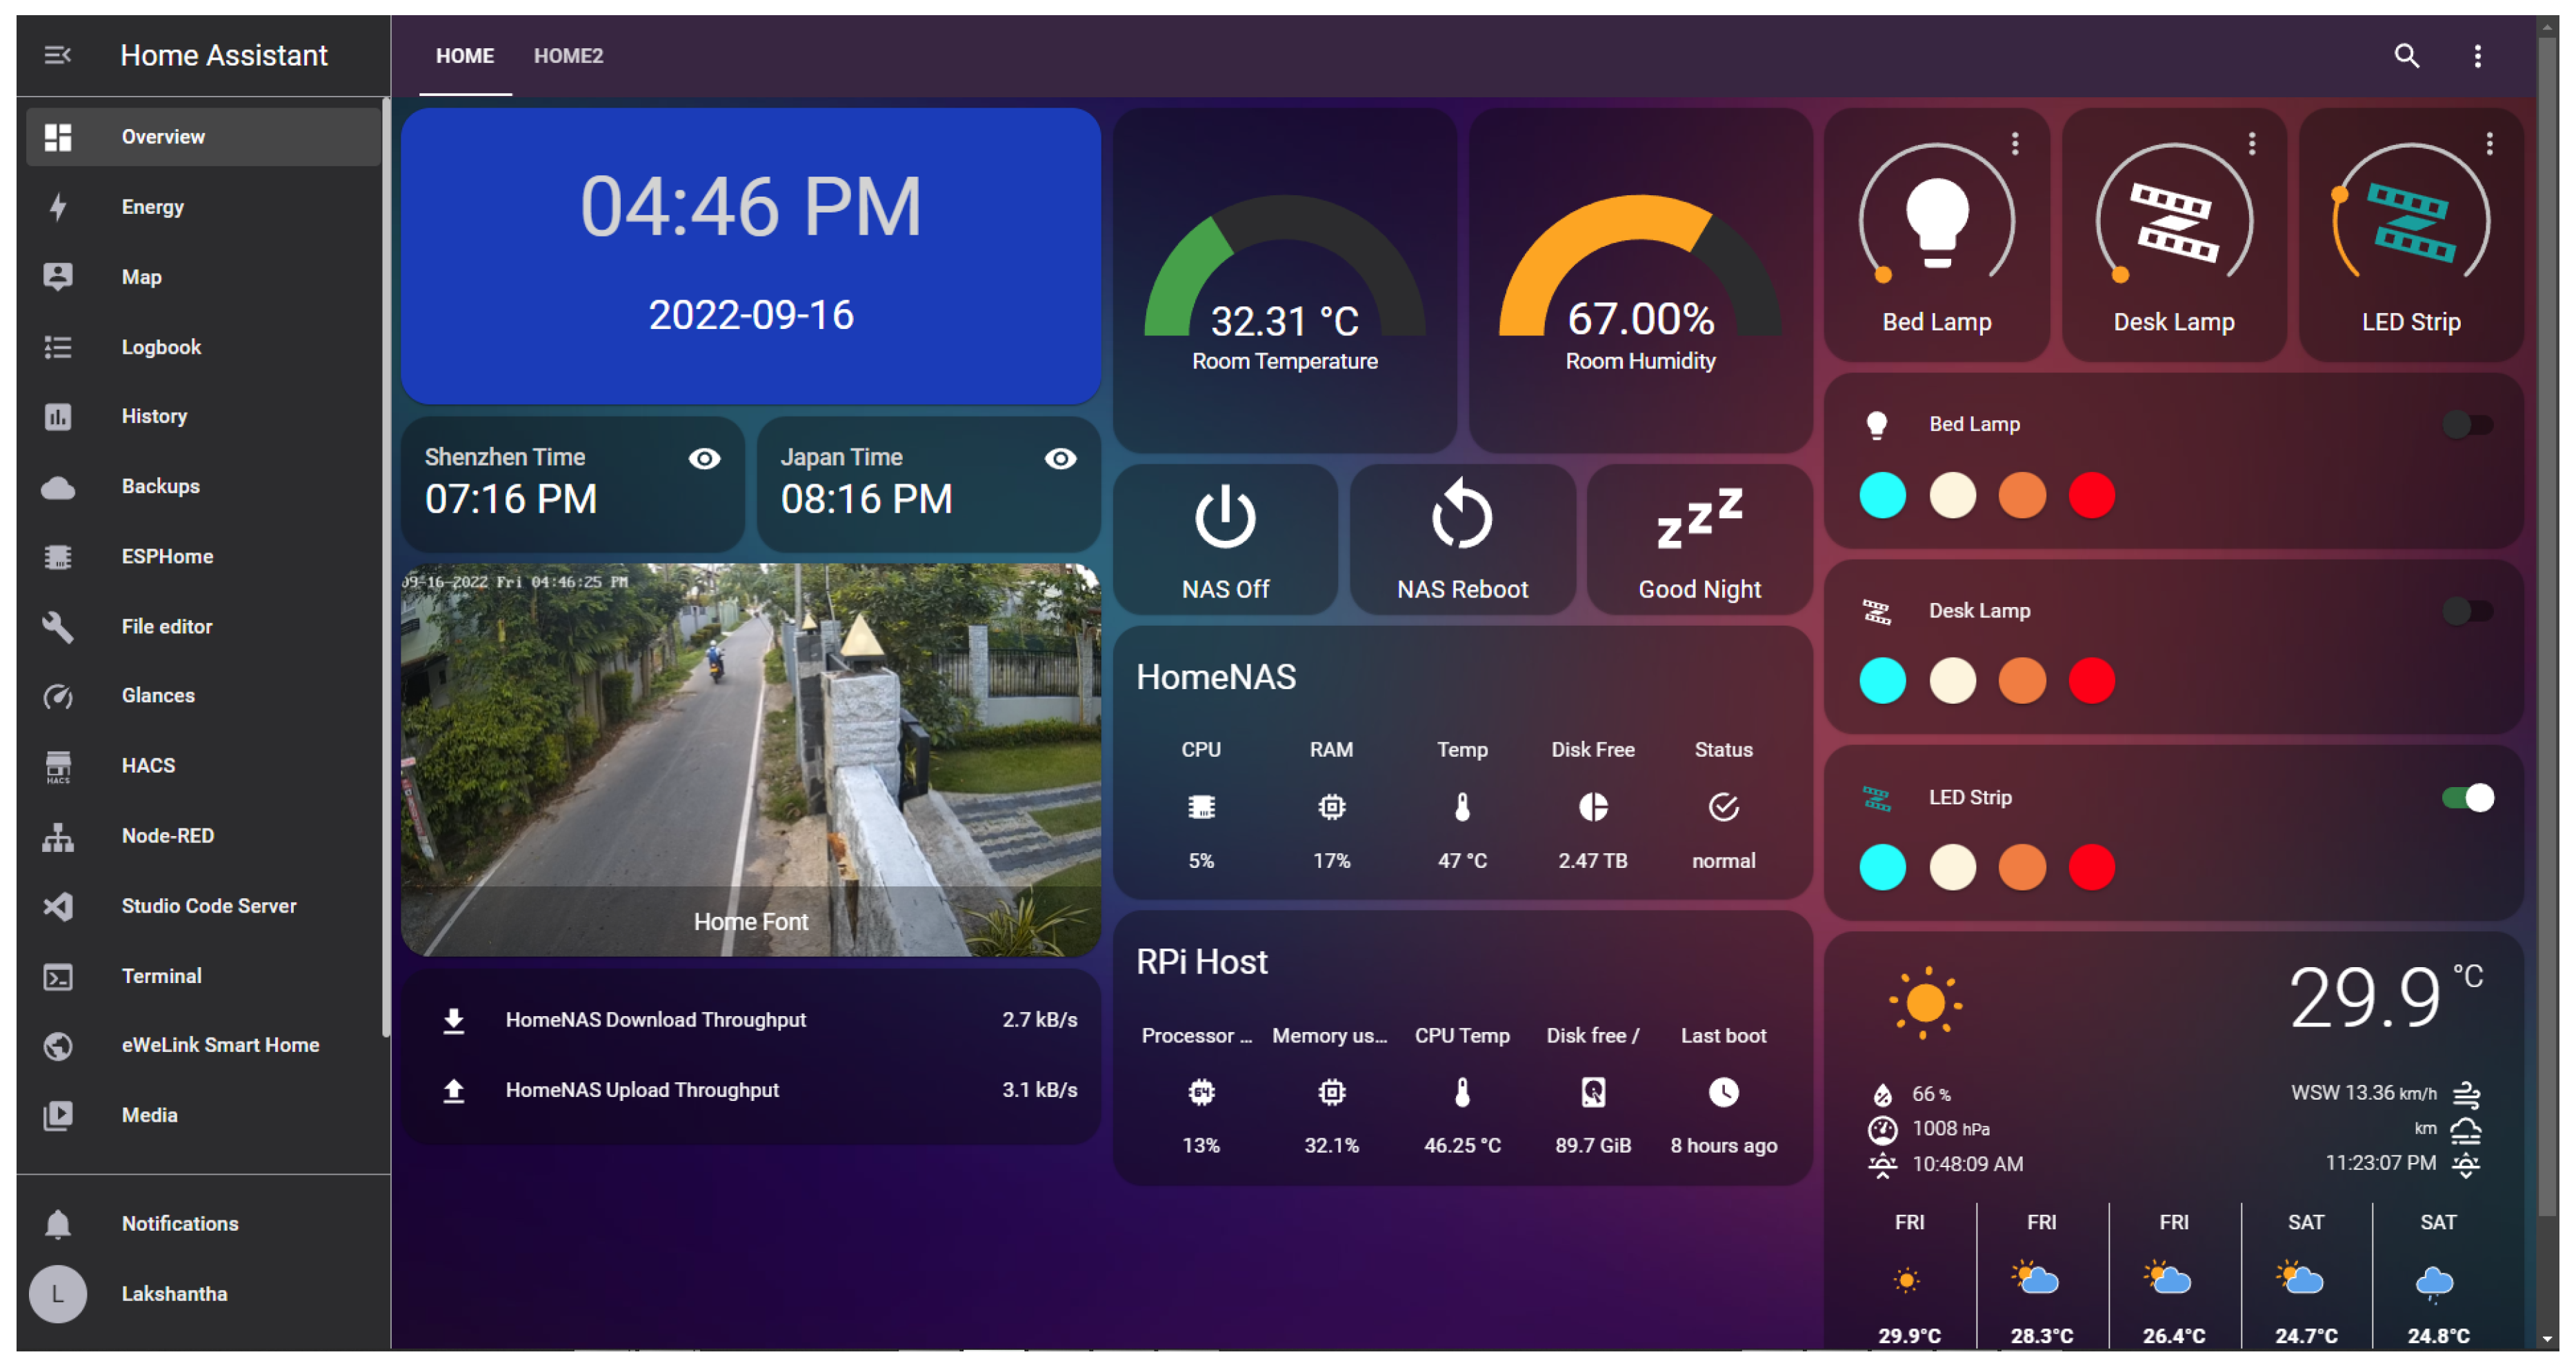
This generates the home screen for the control and monitoring of the implemented space, with the following general functionalities throughout the area:
- Remote on/off control of the lights.
- Live monitoring and position control of the surveillance camera.
- Entry and exit control via a smart lock with fingerprint and code reader.
- Reading and measurement of lighting within the room.
- Remote opening and closing of curtains as needed.
- Remote opening and closing of the projector box.
- Remote control of TV and projector functionalities.
- Voice assistant via the Alexa device for all the previously mentioned functionalities.
Figure 15.
Live operation of the Open Source Platform platform
3.3. Tensile Testing of Materials
The tensile test is performed to observe the force applied to the specimens and the displacement that occurs in them.
4. Discussion
4.1. Performance Testing
Performance testing of a home automation environment primarily focuses on response speeds, connectivity ranges, and predefined values necessary for the correct functioning of the components.
To conduct the tests, the IoT environment must be connected to a single WiFi network and be within the optimal range of the signal modem, with no objects interfering with the signal. All tests were conducted at the Universidad de las Fuerzas Armadas ESPE.
4.2. Response Speed Tests
As initial tests, the response times for the following devices were measured, specifically the on-off switches, from the activation of the platform to the reception on the device.

Table 1.
Response Time Measurement in Seconds
| Test Number | 1 | 2 | 3 | 4 | 5 | 6 | 7 | 8 | 9 | 10 |
| Smart Switch | 1.0 | 1.2 | 1.1 | 0.9 | 0.5 | 0.8 | 0.8 | 1.0 | 1.1 | 0.8 |
| Smart Plug | 0.9 | 0.9 | 0.7 | 1.2 | 1.1 | 1.4 | 1.1 | 0.9 | 0.9 | 1.1 |
| Broadlink Command | 1.5 | 1.4 | 1.3 | 1.4 | 1.4 | 1.7 | 2.0 | 1.3 | 1.4 | 1.3 |
| Curtain Control | 1.0 | 1.2 | 1.2 | 1.0 | 1.1 | 0.9 | 1.0 | 1.0 | 1.2 | 1.2 |
| Camera Movement Command | 1.3 | 1.2 | 1.2 | 1.0 | 1.1 | 0.9 | 1.0 | 1.0 | 1.2 | 1.2 |
| Box Opening Command | 1.1 | 1.4 | 1.6 | 1.0 | 1.0 | 0.9 | 0.8 | 1.0 | 1.1 | 1.5 |
This type of testing is performed to determine the reaction delay time of the system. Given the high demand for network connectivity, these tests allow us to understand the level of latency the end user will experience.
4.3. Video Transmission Testing
For video transmission, tests were conducted under the following conditions:
- Connected directly via an Ethernet cable.
- Connected to a personal WiFi network with 300 Mbps.
- Connected to the ESPE network via a repeater.
The results were as follows:
Table 2.
Measurement of Video Transmission Time
| Test Number | 1 | 2 | 3 | 4 | 5 | 6 | 7 | 8 | 9 | 10 | Average [s] |
| Ethernet Cable | 1.2 | 1.3 | 1.2 | 1.3 | 1.2 | 1.2 | 1.2 | 1.1 | 1.3 | 1.1 | 1.21 |
| Personal WiFi | 2.7 | 3.0 | 2.8 | 2.7 | 2.8 | 2.9 | 3.0 | 3.0 | 2.8 | 2.9 | 2.86 |
| ESPE Network | 3.5 | 4.0 | 3.7 | 4.0 | 3.9 | 4.0 | 4.2 | 4.0 | 4.1 | 4.2 | 3.96 |
As a consideration for the camera tests, the difference in latency and delay time of the video transmission to the platform is observed. Since video transmission is much heavier than command transmission, it operates optimally and without interruptions when connected directly to the network via an ethernet cable.
4.4. Motor Controller Test for Opening and Closing the Projector Box
For the opening and closing of the projector box, the target value for the number of steps the motor must complete should be pre-established. Various predefined values were tested in conjunction with the controller to ensure the motor covers the entire required distance.
Table 3.
Controller Operation Table
| TARGET (NUMBER OF STEPS) | Completes Full Travel | Observations |
| 10000 | YES | Exceeds working distance |
| 9000 | YES | Exceeds working distance |
| 7000 | YES | Exceeds working distance |
| 6000 | YES | Exceeds working distance |
| 5000 | YES | Completes round trip perfectly |
| 4000 | NO | Lens does not open completely |
| 4500 | NO | Slightly short of fully opening the lens |
| 5000 | YES | Slightly exceeds the travel distance |
When performing tests with varying pulse numbers, it was observed that a value of 5000 successfully covered the entire travel distance required by the rack and pinion mechanism to open and close the projector box.
4.5. Energy Consumption Tests
For the energy consumption tests, measurements were taken for the different devices, considering the average theoretical energy consumption provided by the manufacturers versus the actual measurements taken within the installations.
The following equation was used to calculate energy consumption:
This equation results in the energy consumption per hour, which is then multiplied according to the usage case, yielding the following result:
It can be observed that the energy consumption is significant within the infrastructure, excluding the consumption of external devices. However, one of the reasons for implementing automation within the platform is to safeguard energy consumption during hours when monitoring and control are not needed.
As shown in Table 4, the aim is to demonstrate the energy savings compared to consumption without external control of the devices within Open Source Platform.
Table 5 shows that energy consumption is reduced by 58% with the implementation of automation in the faculty room. This includes turning off lights and devices outside working hours, reducing light usage when there is ample natural light, and suspending video transmission after hours. Thus, the system provides economic benefits and manages energy consumption effectively with regard to device usage.
5. Conclusions
The linking and integration of Open Source Platform accounts with Amazon Alexa allow for superior control of the IoT environment. Voice controls enable the creation of scenes and automations, granting users complete management of smart devices without the need to manipulate a mobile application or interface.
The use of smart devices improves energy consumption within the infrastructure by 58%, particularly regarding lighting and the on/off state of devices. This enhancement in energy management and usage compared to a traditional infrastructure aligns with the goal of designing a home automation environment.
The response speed of each device largely depends on the network being used. For instance, video transmission from the monitoring camera to the platform shows a 1-second delay with an Ethernet cable connection, whereas a public WiFi network increases this delay to 3 or 4 seconds. This demonstrates that the response time is tripled or quadrupled. However, in the case of on/off controls or sensor readings, the response time is significantly reduced. Data consumption from the device to the network is minimal, resulting in response times for reading or state changes ranging from 1 to 2 seconds at most.
References
- M. Poongothai, P. M. (2018). Design and Implementation of IoT Based Smart Laboratory. 5th International Conference on Industrial Engineering and Applications.
- Khriji, S., El Houssaini, D., Barioul, R., Rehman, T., y Olfa, K. (13 de Octubre de 2020). Smart-Lab: Design and Implementation of an IoT-based Laboratory Platform. IEEE. [CrossRef]
- Khanna, R. (26 de Enero de 2017). Journal of Electric and Computer Engineering. Internet of Things: Architecture, Protocols, and Applications: https://www.hindawi.com/journals/jece/2017/9324035/.
- Negreiros, I., Camargo, A. C., Hashimoto, F., Faria, G., Pereira, L., Tolotto, M., . . . Silva, R. (2020). Smart Campus® as a living lab on sustainability indicators monitoring. IEEE. [CrossRef]
- Knight, N. J., Kanza, S., Cruickshank, D., Brocklesby, W. S., y Frey, J. G. (2020). Talk2Lab: the smart lab of the future. IEEE Internet of Things Journal, 7(9). [CrossRef]
- J. Salazar, S. S. (2017). Internet de las Cosas. Republica Checa: TechPedia.
- M. Espinilla, L. M. (2020). The Experience of Developing the UJ AML SmartLab. School Computing Journals.
- Tuan, P. M., Le, D. H., Nguyen, A. T., Le, K. C., Le, H. Q., Ngo, T. D., y Nguyen, T. H. (2020). Proposed Smart University Model as a Sustainable Living Lab for University Digital Transformation. IEEE. [CrossRef]
- Adhav, D., Pagar, R., Sonowane, R., y Tawade, S. (2019). Smart Laboratory. International Journal of Trend in Scientific Research and Development, Volume-3, 504-509. [CrossRef]
Figure 1.
IoT Architecture
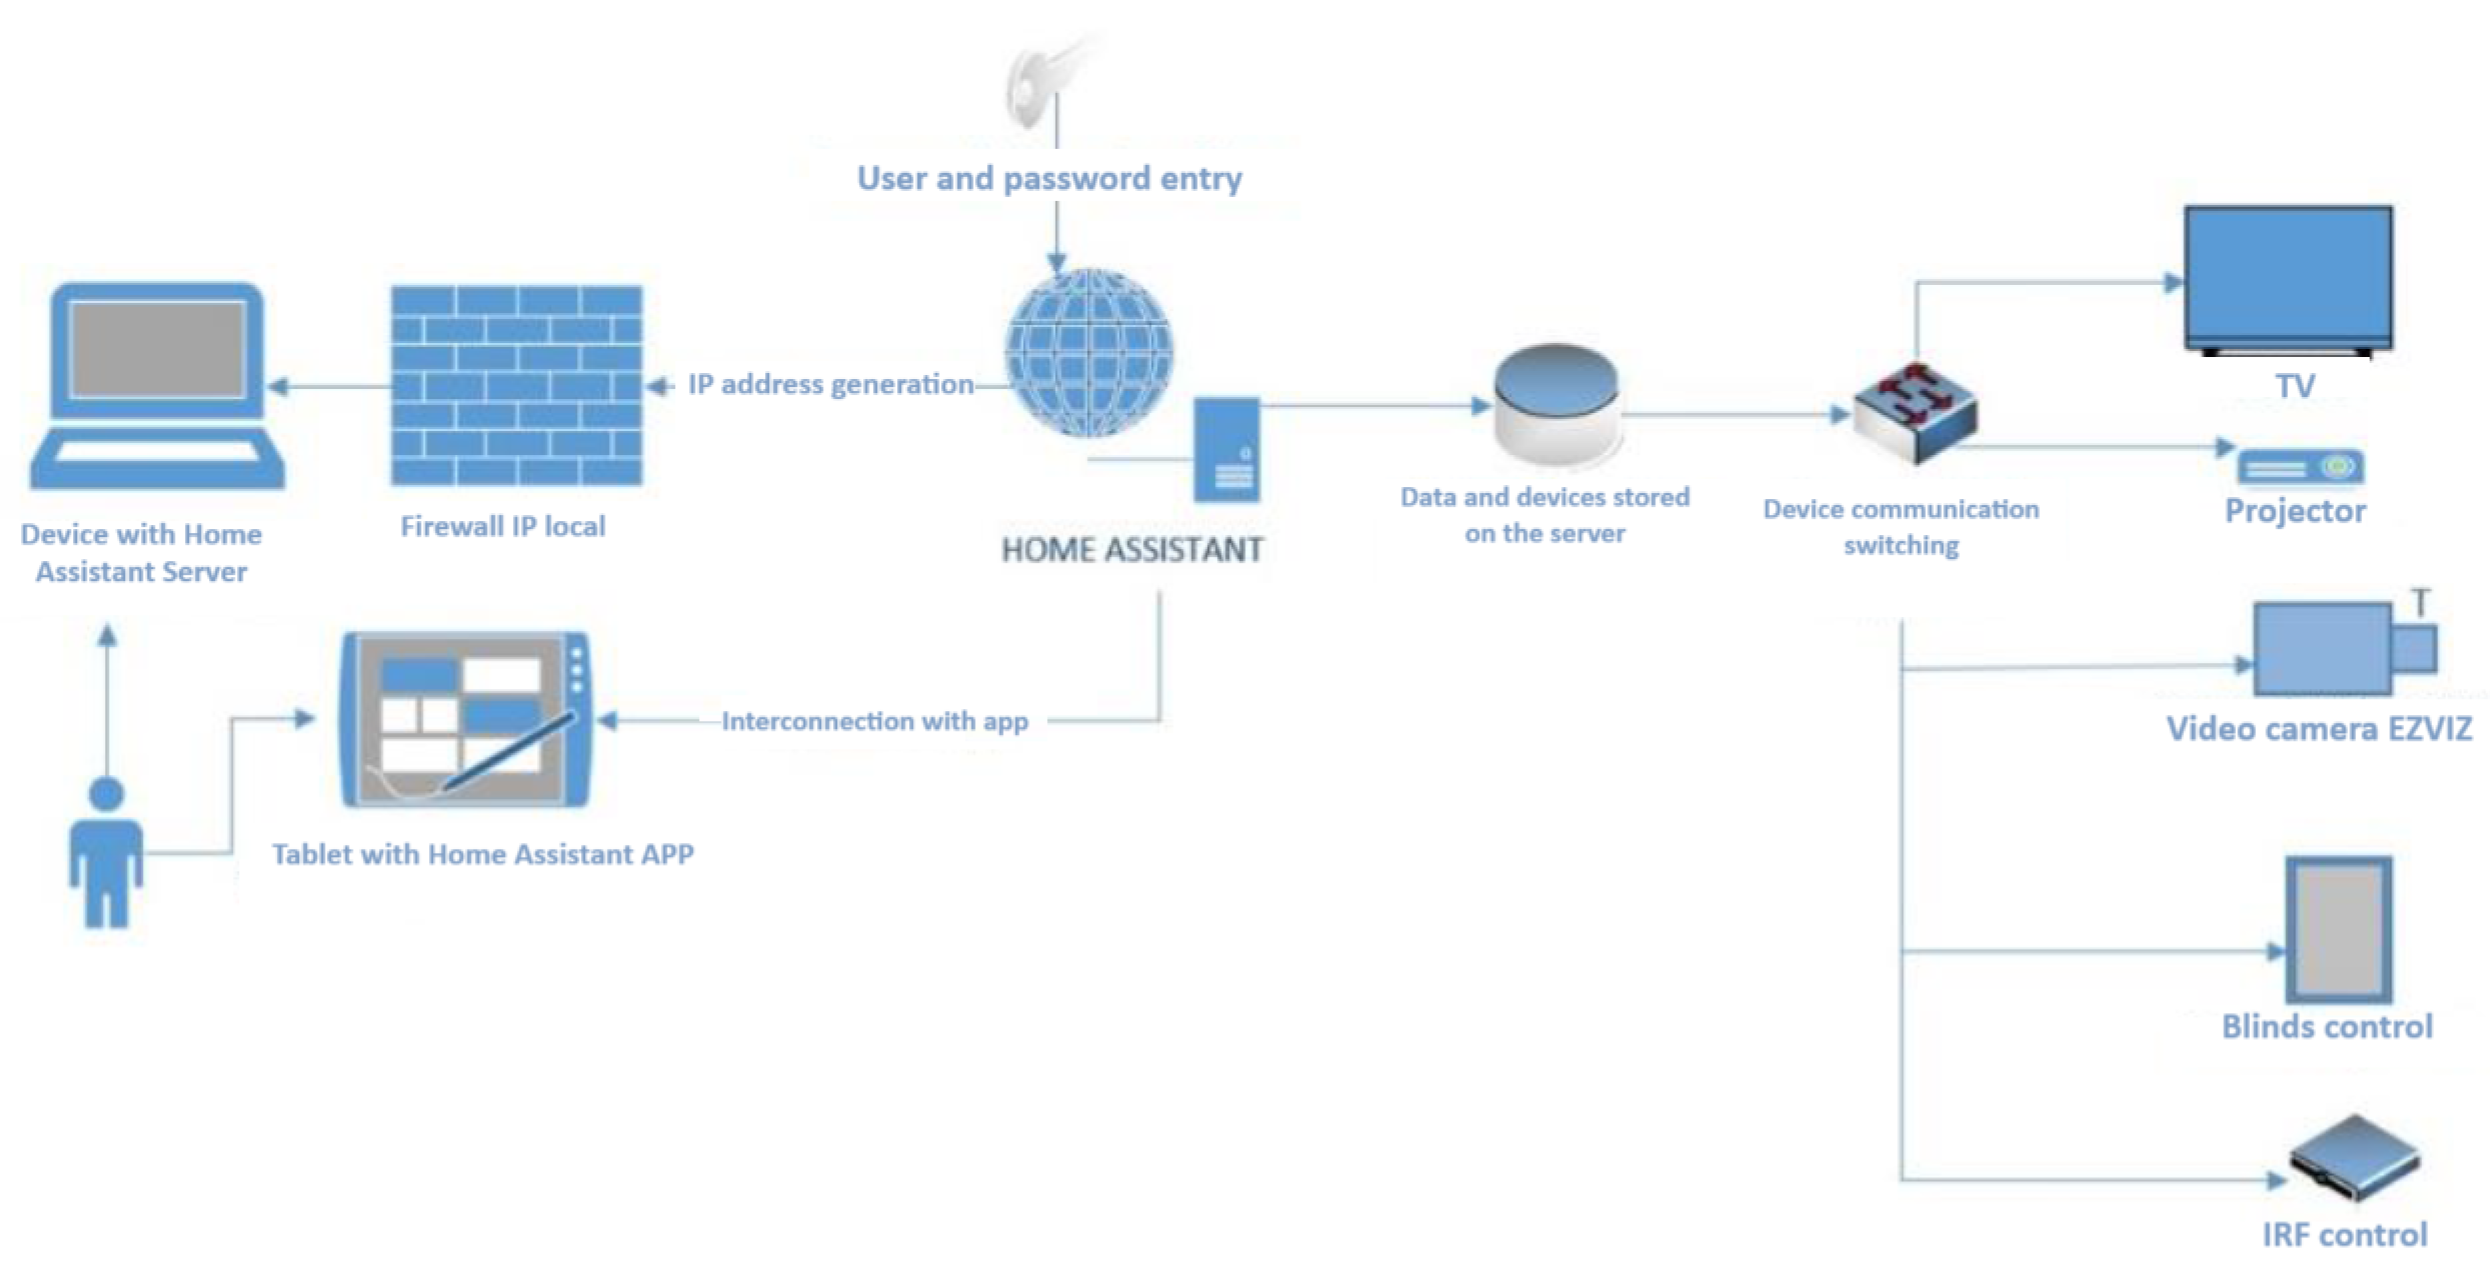
Figure 2.
IoT System Topology
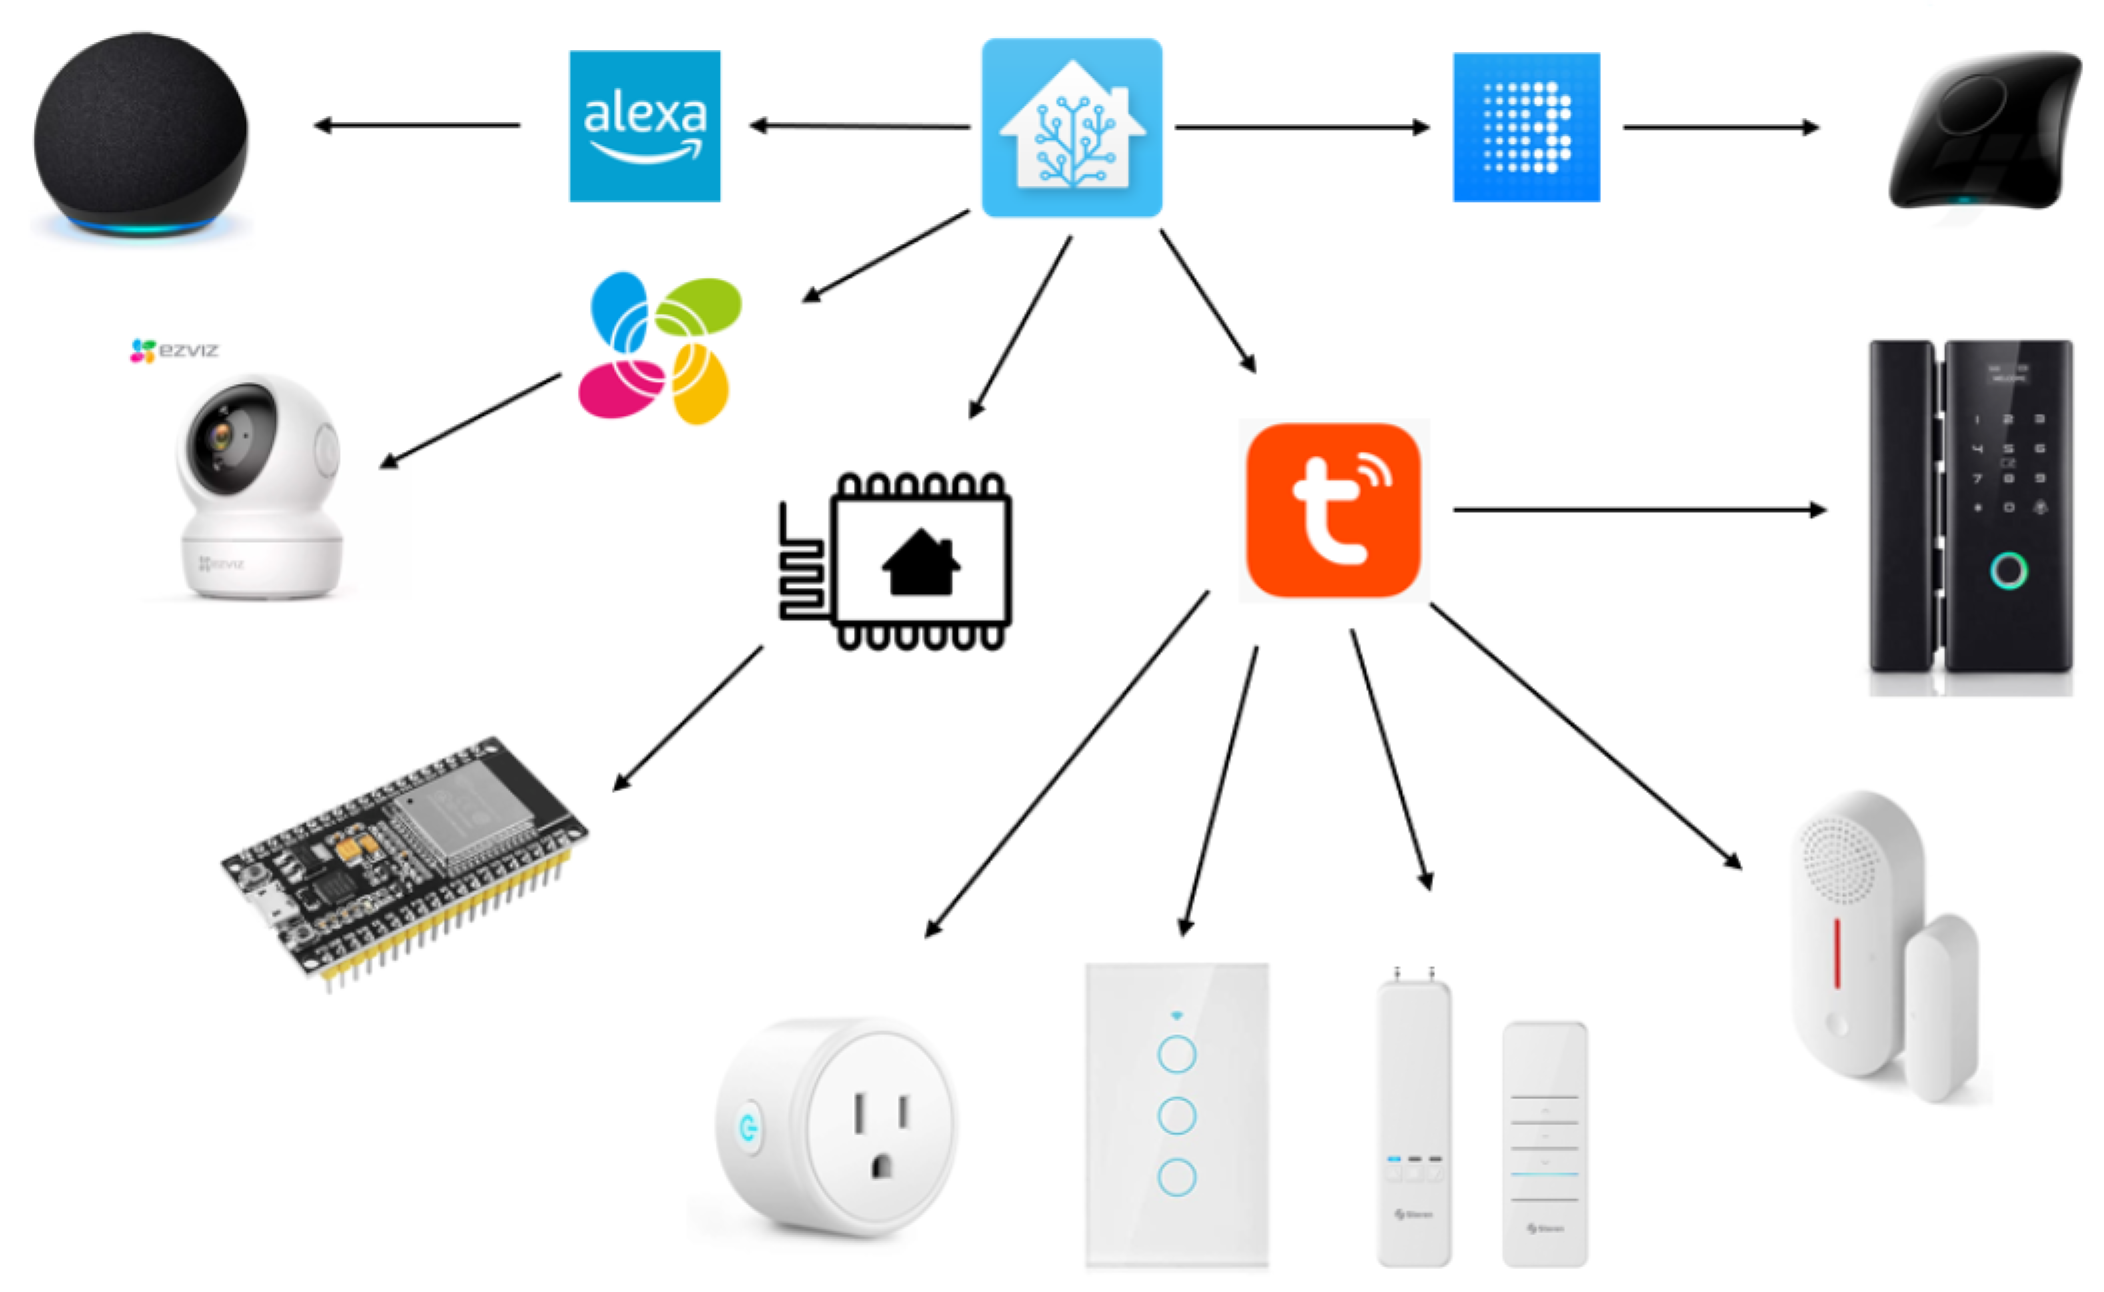
Figure 4.
Open Source Platform Communication Flow Diagram.
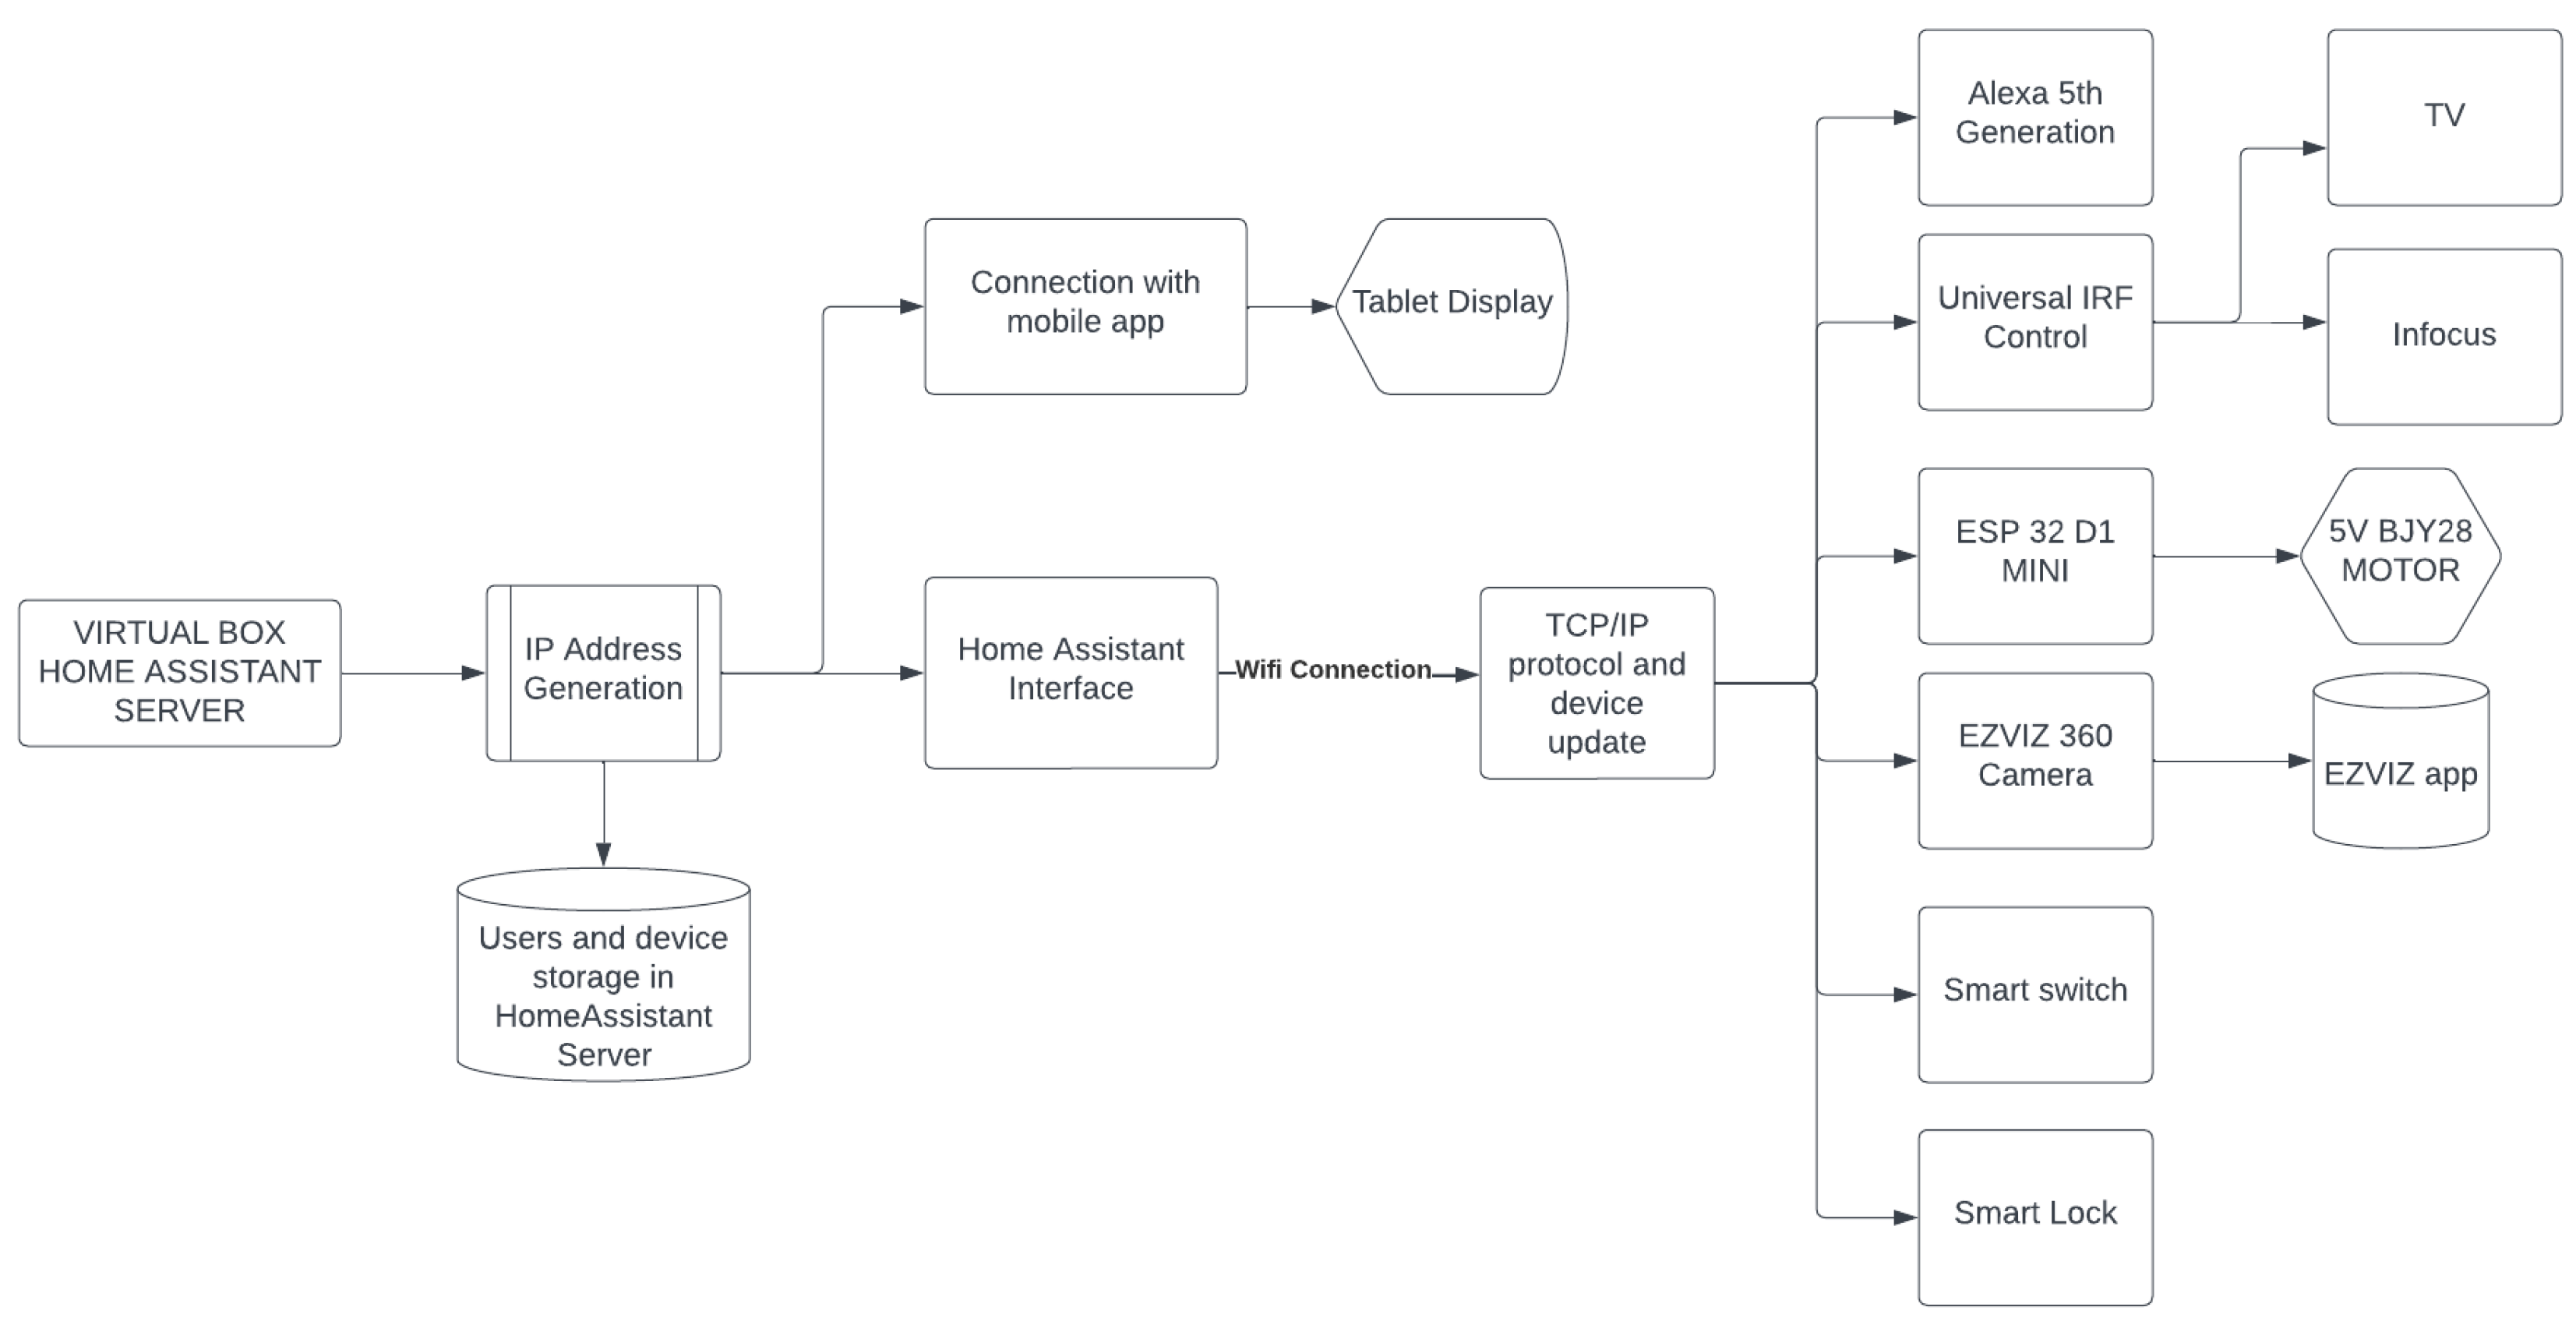
Figure 6.
Projector control mechanism
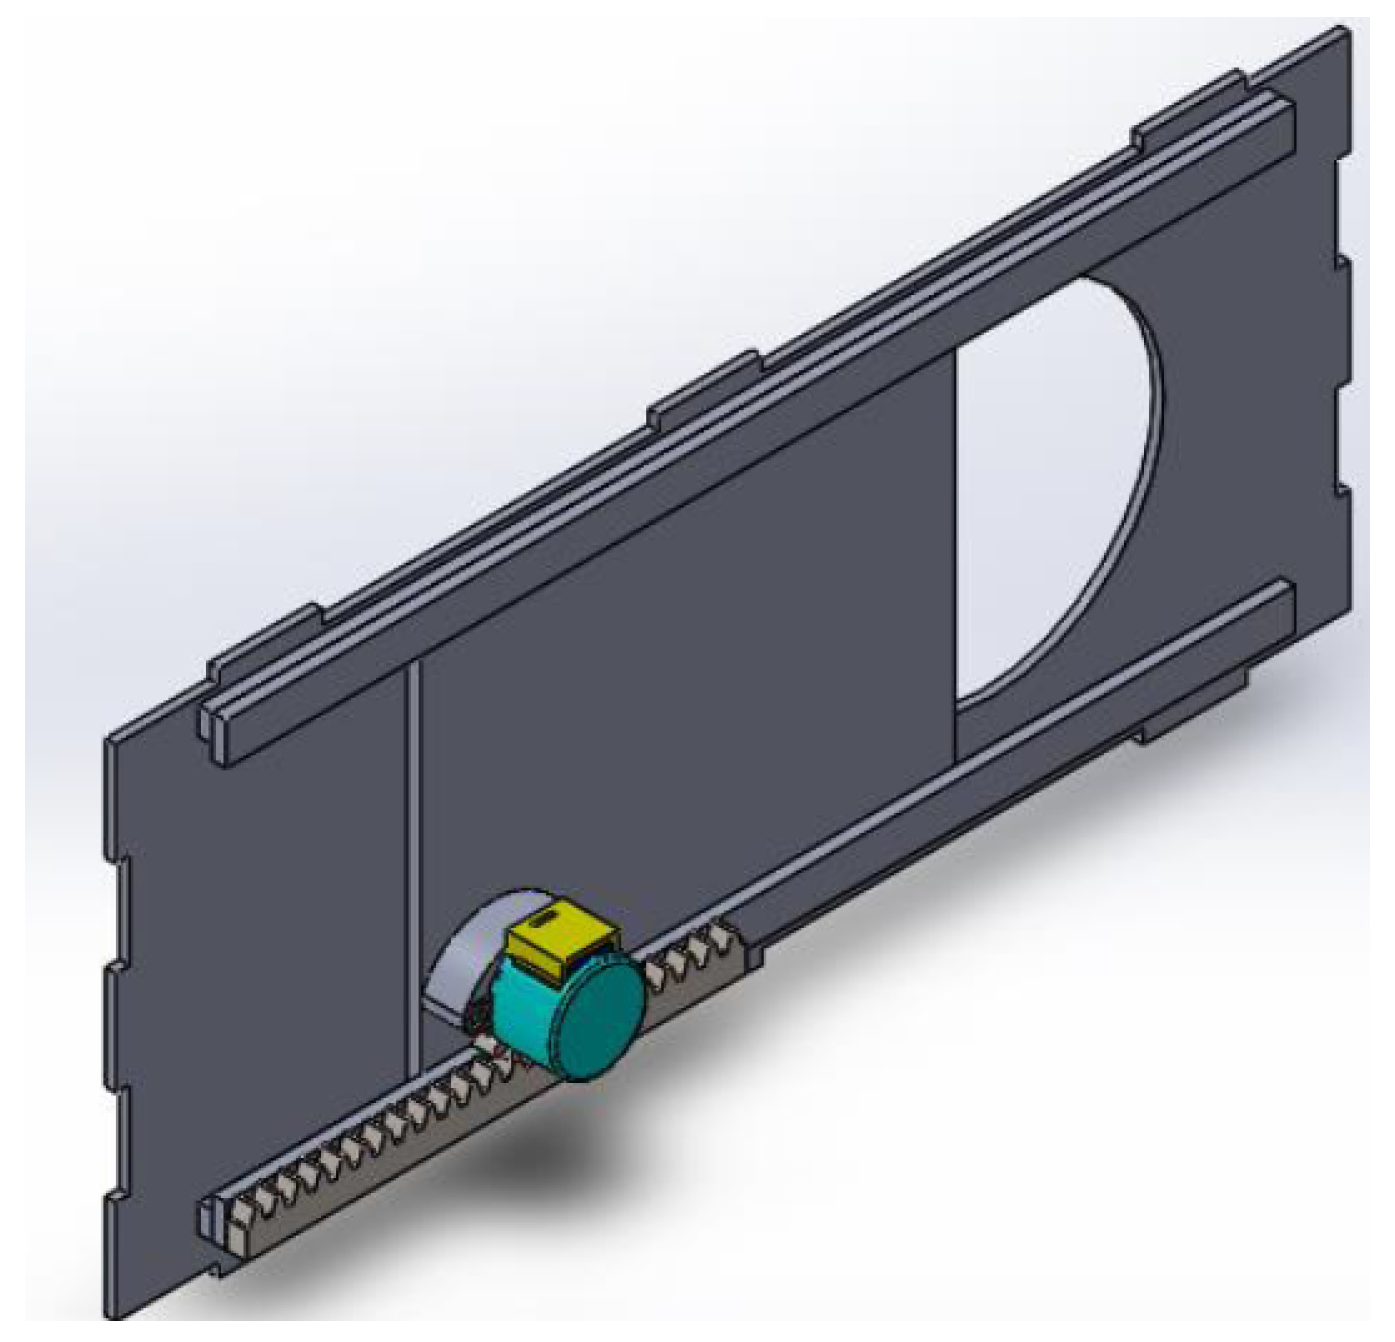
Figure 10.
Test Specimen

Figure 16.
Force vs. Displacement of ABS

Figure 17.
Force vs. Displacement of PLA
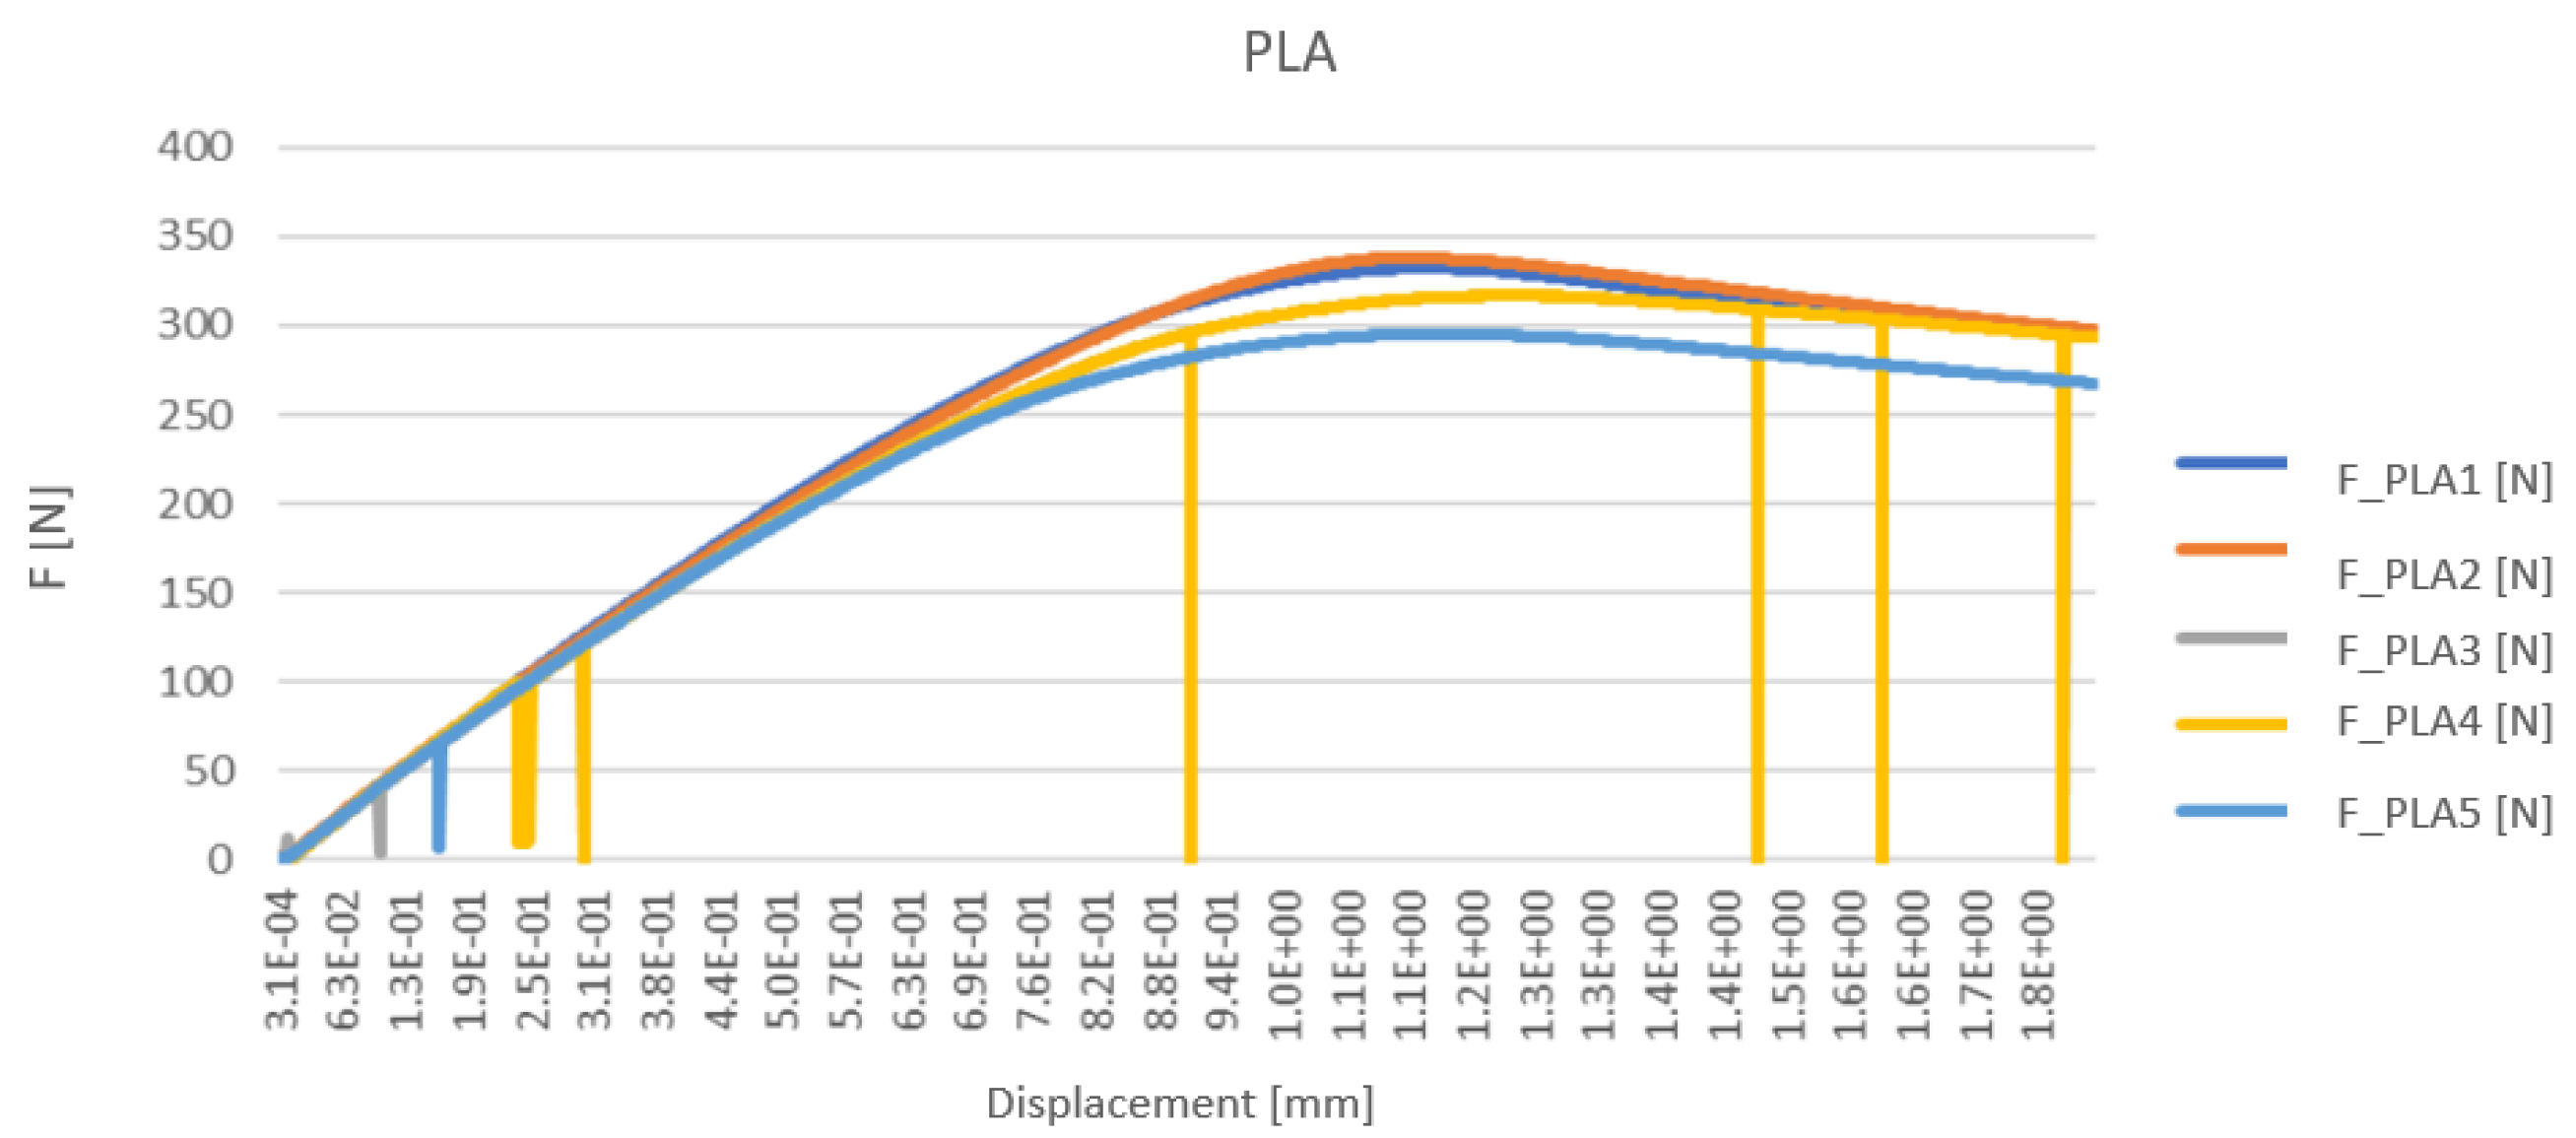
Figure 18.
Force vs. Displacement of Resin
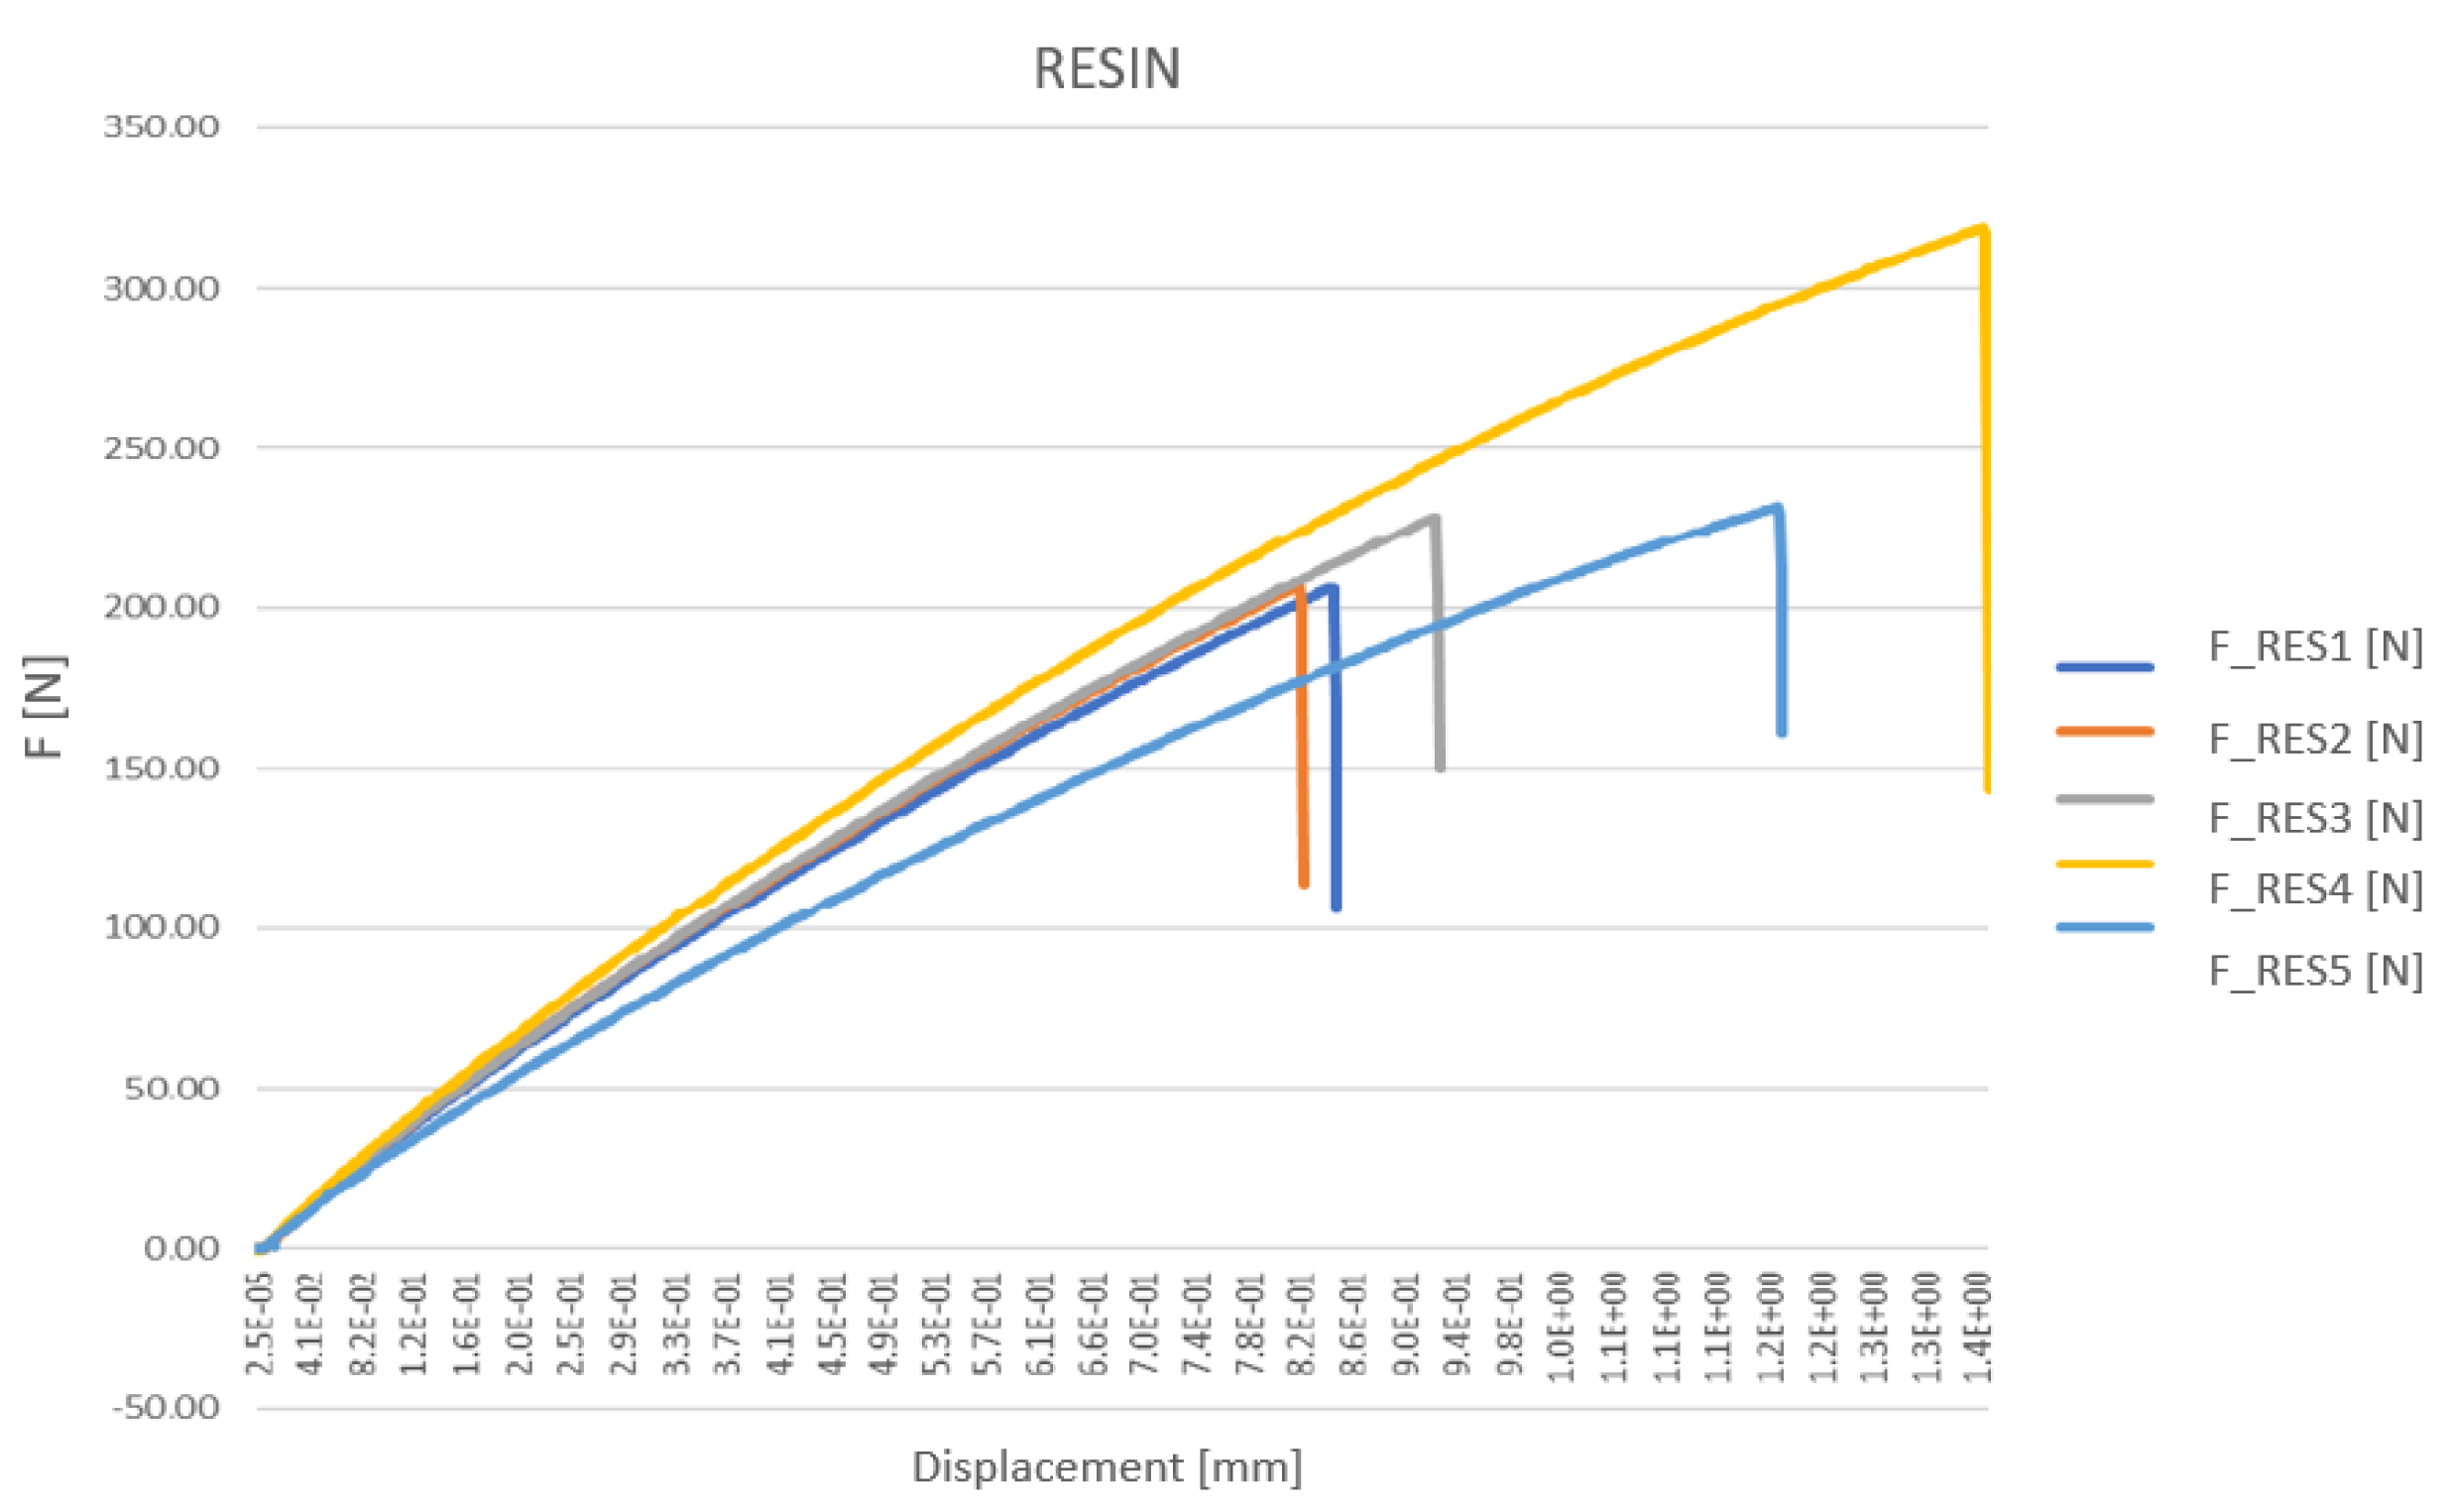
Table 4.
Theoretical vs. Actual Energy Consumption Table
| Device | Theoretical Energy Consumption per Day | Actual Energy Consumption per Day |
| ALEXA Echo Dot | 31.2 W | 26.4 W |
| LED Bulbs | 96 W | 99.2 W |
| Smart Switch | 1 W | 1.1 W |
| Broadlink RM4 Pro | 1 W | 0.8 W |
| EZVIZ C6N Camera | 120 W | 100.8 W |
| Motor for Smart Curtains | 10 W | 4-5 W |
| Smart Plug | 1 W | 1 W |
| ESP32 | 0.4 W | 0.332 W |
| Smart Lock | 0.2 W | 0.2 W |
| Proximity Sensor | 0.001 W | 0.001 W |
| TOTAL | 145.8 W | 137.73 W |
Table 5.
Energy Savings within the Installation
| Device | Energy Consumption per Day | Energy Consumption with Automations | Energy Savings |
| ALEXA Echo Dot | 26.4 W | 21.1 W | 5.3 W |
| LED Bulbs | 99.2 W | 60 W | 39.2 W |
| Smart Switch | 1.1 W | 1 W | 0.1 W |
| Broadlink RM4 Pro | 0.8 W | 0.7 W | 0.1 W |
| EZVIZ C6N Camera | 100.8 W | 48.8 W | 52 W |
| Motor for Smart Curtains | 4.5 W | 4 W | 0.5 W |
| Smart Plug | 1 W | 0.33 W | 0.67 W |
| ESP32 | 0.332 W | 0.211 W | 0.121 W |
| Smart Lock | 0.2 W | 0.2 W | 0 W |
| Proximity Sensor | 0.001 W | 0.001 W | 0 W |
| TOTAL | 234.33 W | 136.34 W | 98.09 W |
Disclaimer/Publisher’s Note: The statements, opinions and data contained in all publications are solely those of the individual author(s) and contributor(s) and not of MDPI and/or the editor(s). MDPI and/or the editor(s) disclaim responsibility for any injury to people or property resulting from any ideas, methods, instructions or products referred to in the content. |
© 2024 by the authors. Licensee MDPI, Basel, Switzerland. This article is an open access article distributed under the terms and conditions of the Creative Commons Attribution (CC BY) license (http://creativecommons.org/licenses/by/4.0/).
Copyright: This open access article is published under a Creative Commons CC BY 4.0 license, which permit the free download, distribution, and reuse, provided that the author and preprint are cited in any reuse.


