
Submitted:
05 March 2025
Posted:
05 March 2025
You are already at the latest version
Abstract
Carbon dots (CDs) are metal-free carbon-based nanoparticles. They possess excellent photoluminescent properties, various physical properties, good chemical stability, high water solubility, high biocompatibility, and tunable surface functionalities, suitable for biomedical applications. Their properties are subject to synthetic conditions such as pH, reaction time, temperature, precursor, and solvent. Until now a large amount of articles on synthesis and biomedical applications of CDs using their photoluminescent properties have been reported. However, their researches on magnetic properties and especially, diamagnetic chemical exchange saturation transfer (diaCEST) in magnetic resonance imaging (MRI) are very poor. The diaCEST MRI contrast agents are based on exchangeable protons of materials with bulk water protons and thus, different from conventional MRI contrast agents which are based on enhancements of proton spin relaxations of bulk water and tissue. In this review, various syntheses, characterizations, magnetic properties, and potential applications of CDs as diaCEST MRI contrast agents are reviewed. Finally, future perspectives of CDs as the next generation diaCEST MRI contrast agents are discussed.
Keywords:
carbon dot
; synthesis
; characterization
; magnetic properties
; diaCEST
; MRI contrast agent
1. Introduction
Carbon dots (CDs) had been noticed ~20 years ago and exhibit emission in the visible region [1]. Sun et al. had prepared bright and colorful photoluminescent CDs by a laser ablation method from graphite powder and cement [2]. CDs are great potential for applications to biomedical and environmental areas [3‒6]. For example, bioimaging and chemo-sensing, cellular imaging, drug delivery, cancer therapy, pollutant removal, waste water treatment, and environmental remediation are the possible application areas [7‒13]. Moreover, surface composition engineering through post-synthetic approaches allows to expand and optimize the range of CD applications. Recently, CDs have received great attention owing to their simple synthesis and surface functionalization, good biocompatibility, and highly stable emission [14]. CDs can contain various surface functional groups such as hydroxyl (‒OH), carboxyl (‒COOH), carbonyl (‒CO), and amine (‒NH2) groups, which are suitable for further surface functionalizations [15‒17]. Surface functional groups enhance the reactivity of CDs towards conjugation reactions and tuning their surface properties. Surface functionalization of CDs with oxygen-containing groups tend to exhibit negatively charged surfaces, while nitrogen-containing functional groups can result in positively charged surfaces, making CDs stable colloids in aqueous media. Since the discovery of CDs, two decades have gone and a lot of CD-based research papers have been published [18]. To highlight the importance of CD-based researches and progress, we used the Scopus database to find out the total number of articles related to CDs published for the last ten years (≥ 2015). Figure 1 displays the number of research papers related to CDs and definitely reveal that the trend keeps on increasing every year.
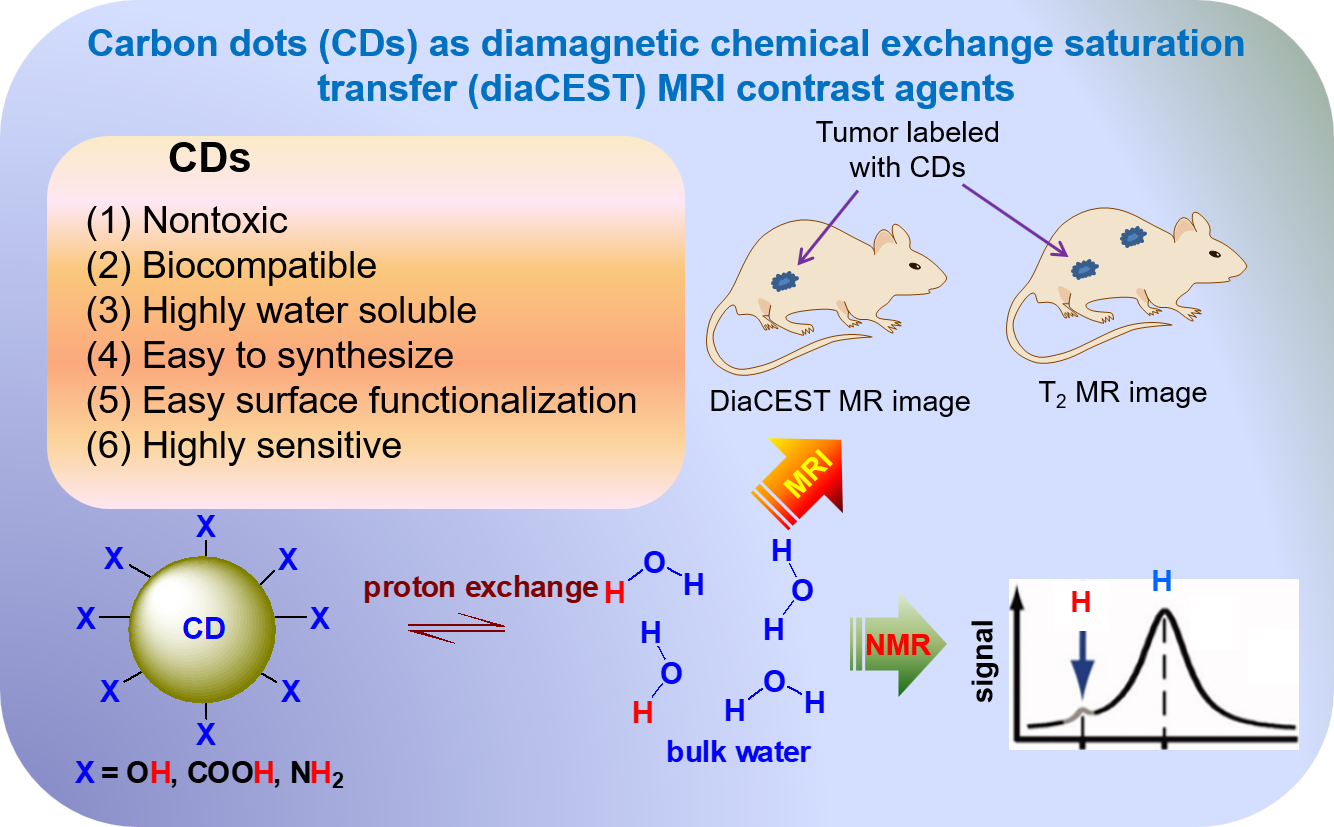
So far, CDs have been applied to various biomedical areas [7‒11,19]. However, little application studies on contrast agents in magnetic resonance imaging (MRI) exist. MRI is one of the primary techniques used in disease detection, diagnosis, and monitoring. Over the last decades, MRI technology has been continuously improved [20]. These improvements include the enhancement of the image clarity, reduction in the scan times, and development of the high-field scanners. Furthermore, MRI image qualities and diagnostic precisions have been significantly improved with the development of contrast agents. Among them, a new class of metal-free MRI contrast agents based on chemical exchange saturation transfer (CEST) had been introduced by Ward et al. [21]. This CEST works through the proton exchange of contrast agents with bulk water protons to enhance image contrasts at the accumulated region of the contrast agents.
In general, the CEST MRI contrast agents can be divided into two groups based on their compositions [21‒23]; paramagnetic CEST (paraCEST) MRI contrast agents which are paramagnetic metal ion (Eu3+, Dy3+, etc) complexes, and diamagnetic CEST (diaCEST) MRI contrast agents which are made of metal-free materials with exchangeable protons with bulk water protons. In this review, various synthetic approaches and characterization techniques of CDs are briefly reviewed. Then, magnetic properties and applications of CDs as diaCEST MRI contrast agents as a new class of metal-free MRI contrast agents are discussed and highlighted along with their future perspectives.
2. Synthesis of CDs
Until now various synthetic approaches of CDs have been reported. A well-established synthesis method will afford CDs with uniform size, high quantum yield (QY), and scalable and cost-effective production. CDs can be prepared largely by two approaches “top-down” and “bottom-up” as depicted in Figure 2.
2.1. Top-Down Approach
The top-down approach involves cleavage and exfoliation of carbon precursors such as graphite powder, activated carbon, carbon black, carbon nanotubes, and carbon fibers [24]. The top-bottom approach includes chemical oxidation, electrochemical oxidation, laser ablation, and ultrasonication as depicted in Figure 3.
2.1.1. Chemical Oxidation
Chemical oxidation method utilizes strong oxidants such as HNO3 and H2SO4 to oxidize carbon precursors to prepare CDs [26]. Chemical oxidation is a facile and convenient method for mass production of CDs.
Qiao et al. prepared multicolor photoluminescent CDs from three different activated carbon precursors by chemical oxidation [27]. Coal-activated carbon (CAC), wood-activated carbon (WAC), and coconut-activated carbon (CAC) were treated with HNO3 to obtain CDs. Further, the CDs were coated with amine-terminated compounds. Figure 4a‒4c exhibit TEM images and size distribution of CDs prepared from CAC, WAC, and CAC precursors; they had average diameters of 4.5±0.6 nm, 4.2±0.8 nm, and 4.2±0.6 nm, respectively. The CDs were water-soluble and displayed multicolor photoluminescent properties with high quantum yields and good biocompatibility.
2.1.2. Electrochemical Oxidation
Electrochemical oxidation is suitable to tune the properties of CDs by controlling electrochemical parameters, solvent, and carbon precursors [28]. The size of CDs can be tuned by changing the applied potential [29].
Liu et al. prepared monodispersed and highly crystalline CDs using electrochemical oxidation of graphite electrode precursor in alkaline solution [30]. The CDs exhibited temperature-dependent color change such that colorless CDs synthesized at 4 oC tinted bright-yellow color at room temperature. This color change was attributed to the oxygenation of CD surfaces. Figure 5a and 5b display the TEM and HRTEM images, size distribution, and photograph of the colorless CDs, and Figure 5c and 5d exhibit the TEM and HRTEM images, size distribution, and photograph of the bright-yellow CDs. TEM images revealed that colorless CDs were monodispersed in size with an average diameter of 4.0±0.2 nm, while bright-yellow CDs afforded two-size distributions; one from monodispersed CDs, similar to the colorless CDs, and the other from aggregated CDs with an average diameter of 8.0±0.3 nm.
2.1.3. Laser Ablation
In laser ablation, a graphite precursor is exposed to laser irradiation and CDs are produced from the precursor [31,32]. Laser ablation is classified into two categories: laser ablation in solution and that of powdered sample [32]. Notably, the double beam laser ablation method provided smaller CDs with a narrower size distribution than the single beam laser ablation method [33].
Hu et al. prepared CDs by laser ablation of graphite flakes in polyethylene glycol (Mn = 1500 amu) solution [34]. The size of CDs were tuned by controlling the laser pulse width. The longer laser pulse width provided a larger particle size of CDs. Figure 6a‒6c exhibit the HRTEM images and Figure 6d‒6f display the size distributions of CDs prepared by 0.3, 0.9, and 1.5 ms laser pulse widths, respectively. Figure 6a exhibits the single crystalline CDs whereas CDs in Figure 6b and 6c are composed of two or more crystalline grains.
2.1.4. Ultrasonic-Assisted Method
This method utilizes ultrasound irradiation to synthesize CDs [35]. The ultrasonic-assisted method has an advantage of low cost and simplicity in operation to synthesize CDs.
Wu et al. prepared water-soluble photoluminescent CDs by an ultrasonic-assisted chemical oxidation method of petroleum coke [36]. The CD surfaces were rich in oxygen-containing functional groups. Then, CDs were further treated hydrothermally in ammonia to prepare N-CDs. Figure 7a and 7b exhibit the TEM and HRTEM images and size distribution of CDs with an average size of 5.0 nm. Figure 7c and 7d display the TEM and HRTEM images and size distribution of N-CDs with an average size of 2.7 nm. The HRTEM images of CDs and N-CDs showed their lattice spaces of 0.332 and 0.334 nm, respectively.
2.2. Bottom-Up Approach
The bottom-up approach involves the carbonization of organic molecules as carbon sources or precursors. The carbonizing molecules are coupled together to form sp2 carbons in CDs [37]. Owing to commercial availability and facile carbonization, organic molecules with hydroxy (‒OH), carboxylic acid (‒COOH), and amine (‒NH2) functional groups are generally used as precursors [38]. Figure 8 exhibits the examples of organic carbon precursors such as melamine, citric acid, and phloroglucinol as well as the synthesis of CDs through ‘‘bottom-up” approaches.
2.2.1. Microwave-Assisted Method
The microwave method involves microwave irradiation to precursors to produce CDs. This method is conveniently applied to various kinds of precursors to prepare CDs in a short reaction time [40,41]. For example, Yu et al. prepared CDs using phthalic acid and triethylenediamine as precursors in a 60 s reaction time [42].
Jiang et al. prepared RNA targeting CDs by microwave thermal decomposition method of neutral red and levofloxacin as precursors for the liver cell imaging [43]. Figure 9a and 9b exhibit a TEM image with size distribution and an HRTEM image of CDs, respectively. The TEM image revealed that CDs were well-dispersed with an average size diameter of 1.60 nm. The HRTEM image exhibited 0.18 and 0.29 nm lattice fringes.
2.2.2. Hydrothermal Method
Hydrothermal method is considered as an ecofriendly, nontoxic, and cost-effective method for preparing CDs using diverse carbon sources [44‒47].
Bao et al. prepared dual-function fluorescent CD probe by hydrothermal method using citric acid as a carbon source and o-phenylenediamine as a nitrogen source [48]. Figure 10a displays the TEM image and particle size distribution of the CDs with spherical morphology and good desperation. The particle size of CDs ranged from 1.24 to 6 nm, with the average diameter of 3.23 nm. The HRTEM image exhibited that the CDs had a lattice spacing of 0.21 nm as depicted in Figure 10b. The CDs worked as a dual-function fluorescent probe for the detection of Fe3+ in the brown sugar and sunset yellow dye in beverages.
2.2.3. Pyrolysis Method
This method involves thermal decomposition of carbon precursors at high temperatures to produce CDs. The pyrolysis method is considered an easy operation, low cost, solvent free, and fast reaction method.
Wang et al. successfully prepared CDs using one-pot solid phase pyrolysis in an autoclave (closed environment) and a crucible (open environment) [49]. The CDs prepared in open environment had a longer emission wavelength, a higher crystallinity, and less surface state emission than CDs prepared in closed environment. Figure 11a and 11b exhibit the TEM image with size distribution and the HRTEM image with lattice fringes of CDs-1, respectively, and Figure 11c and 11d display the TEM with size distribution, and the HRTEM image with lattice fringes of CDs-2. Both CDs were well dispersed with average sizes of 2.08 and 2.09 nm, respectively.
2.2.4. Templated Method
The templated method involves a support material (i.e., a template) to produce CDs. The size, morphology, and surface properties of CDs can be controlled using templates.
Yang et. al. prepared monodispersed photoluminescent CDs by soft-hard template approach [39]. Photoluminescent CDs were prepared using copolymer Pluronic P123 as a soft-template, ordered mesoporous silica (OMS) as a hard-template, and 1,3,5-trimethylbenzene (TMB), diaminebenzene (DAB), pyrene (PY) and phenanthroline (PHA) as carbon sources. Figure 12a‒12d exhibit HRTEM images of CDs, which were prepared using TMB, DAB, PY, and PHA, respectively. The copolymers served as micelles (i.e., soft template) to encapsulate carbon precursors and the OMS served as separator (i.e., hard template) of the micelles. The HRTEM image revealed that the soft-hard templated approach prevented the aggregation of CDs during pyrolysis.
3. Characterizations
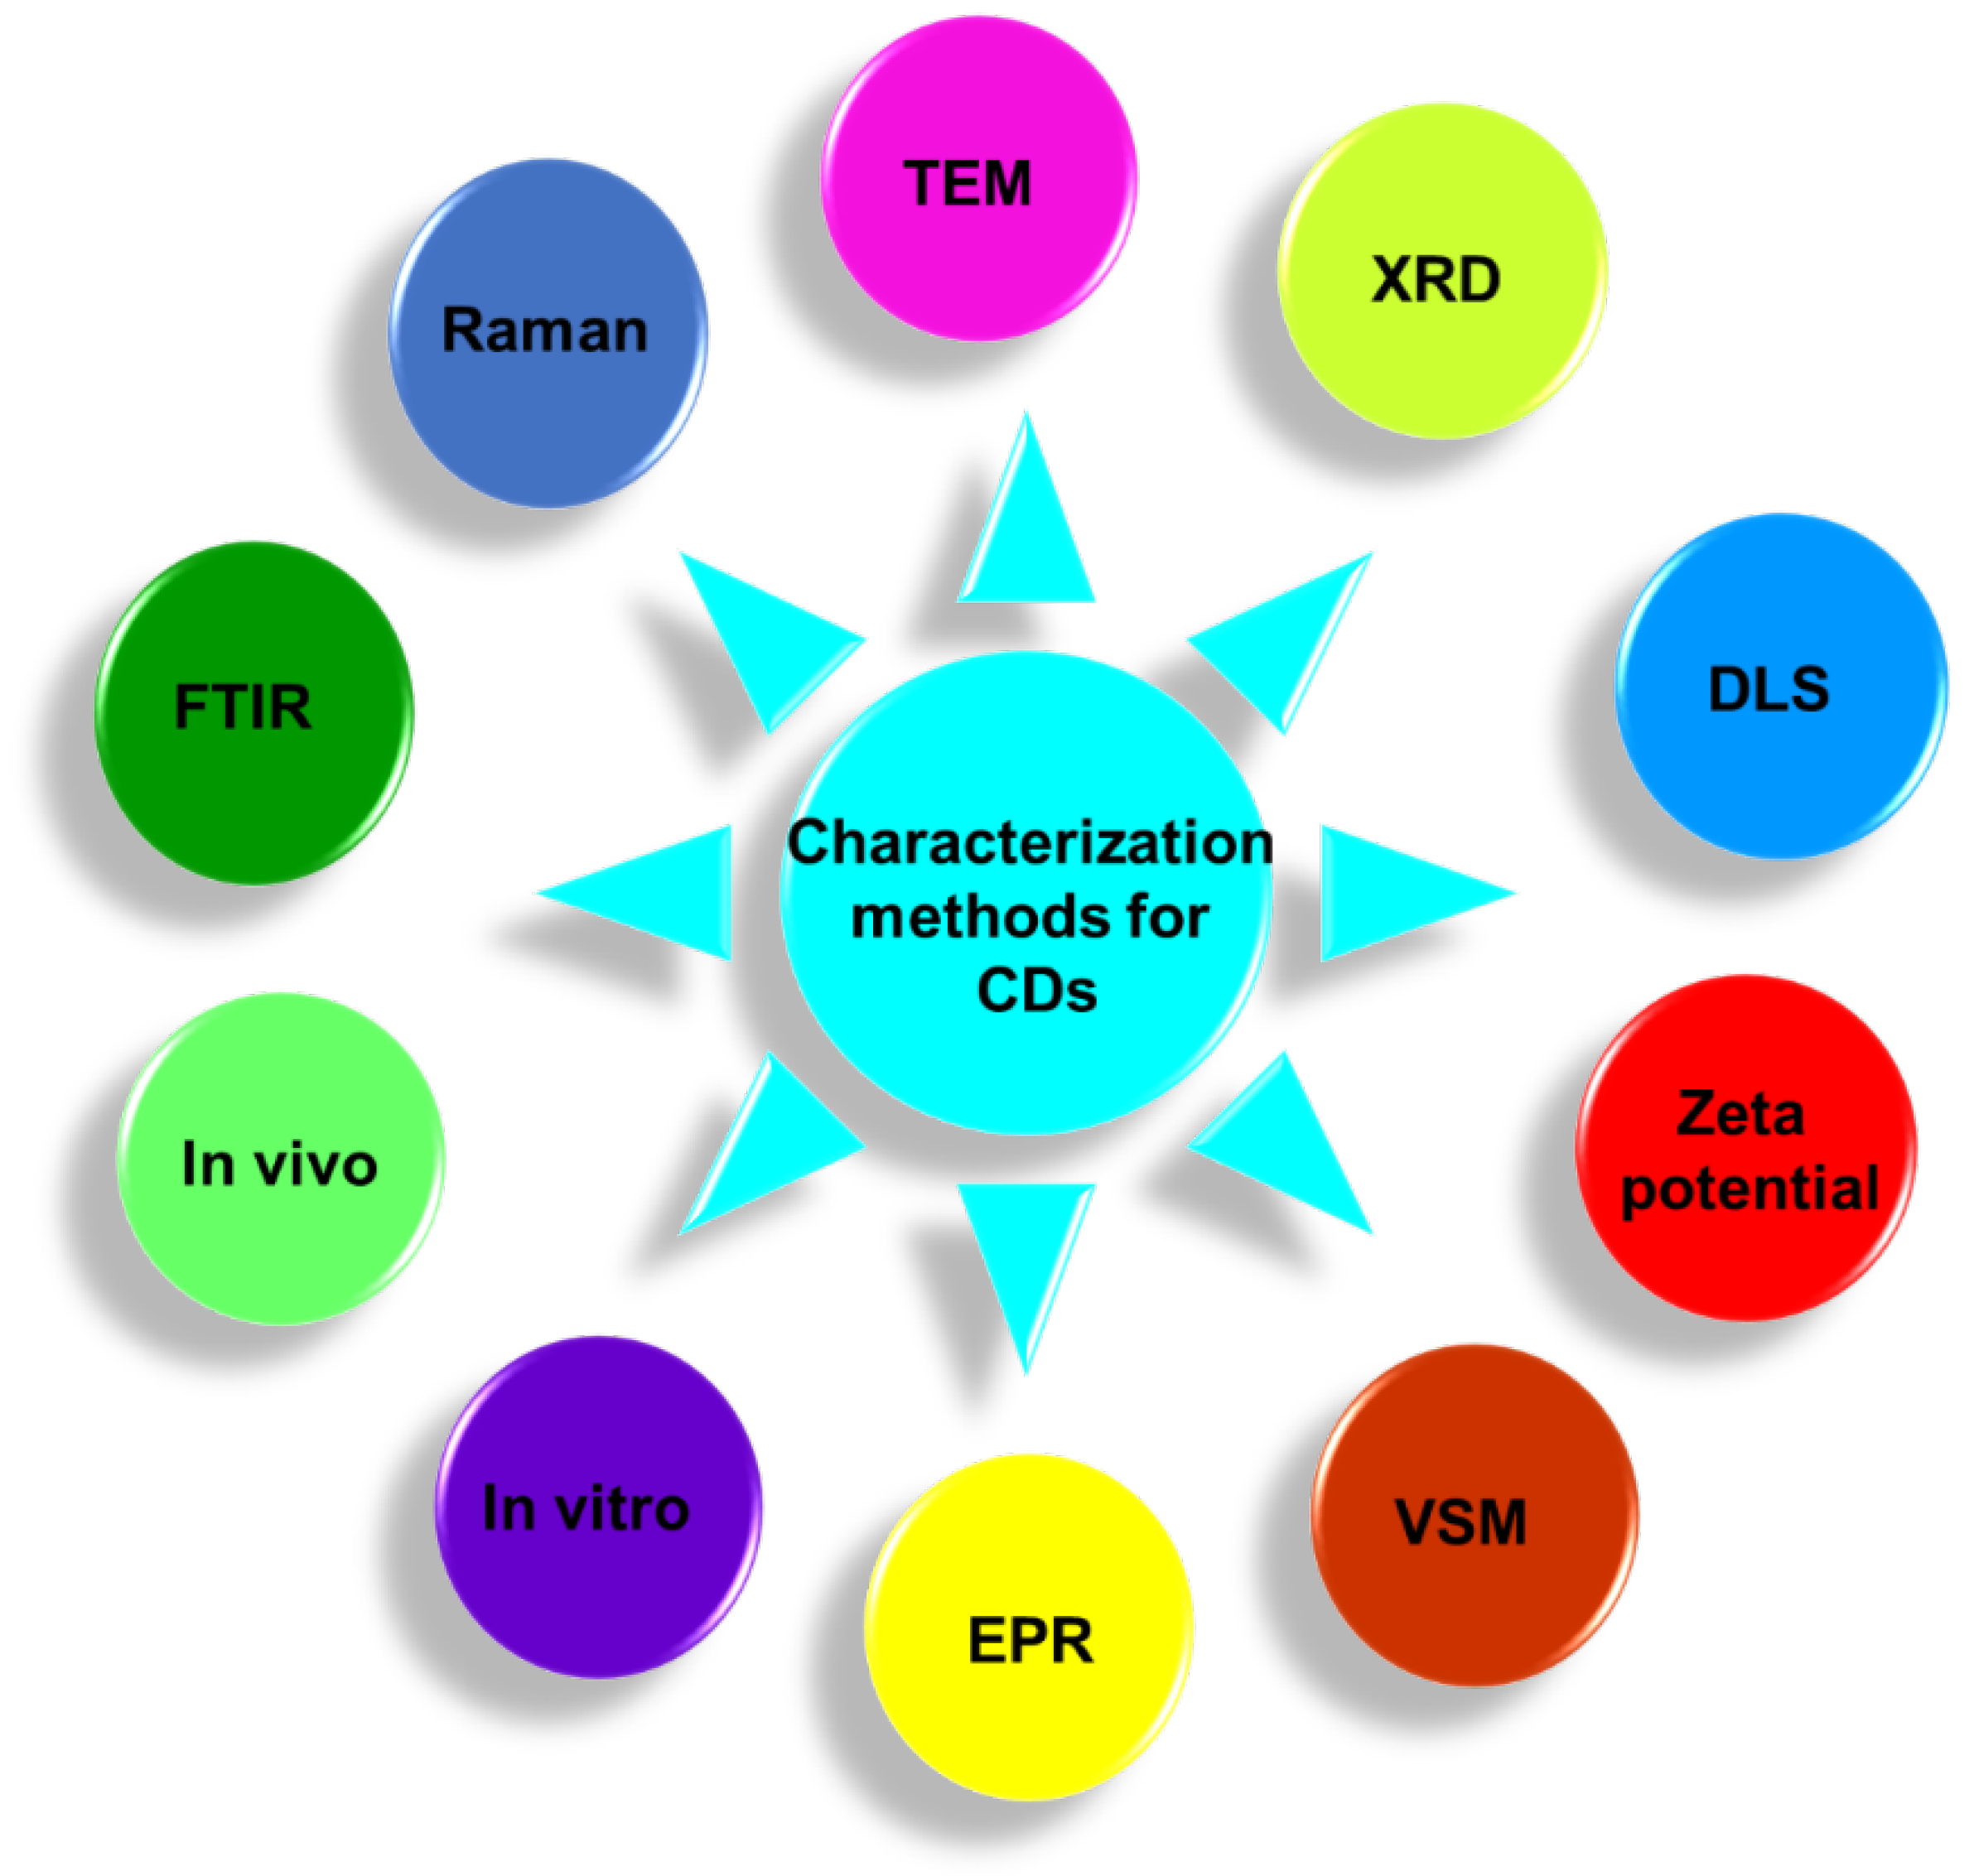
Several analytical techniques have been used to characterize various physicochemical properties of CDs such as the size, crystal structure, elemental composition, surface charge, hydrodynamic diameter, cytotoxicity, and magnetic properties. The characterization helps to modify and optimize the synthesis. This section will provide overviews of various characterization methods to analyze various physicochemical properties of CDs. TEM, Fourier transform-infrared (FT-IR) absorption spectroscopy, Raman spectroscopy, X-ray diffraction (XRD), dynamic light scattering (DLS), zeta potential measurement, vibrating sample magnetometry (VSM), electron paramagnetic resonance (EPR) spectroscopy, in vitro and in vivo cytotoxicity measurement are such methods to elucidate properties of CDs.
Figure 13.
Schematic illustration of various characterization methods to elucidate various physicochemical properties of CDs.
Figure 13.
Schematic illustration of various characterization methods to elucidate various physicochemical properties of CDs.
3.1. FT-IR Absorption Spectroscopy
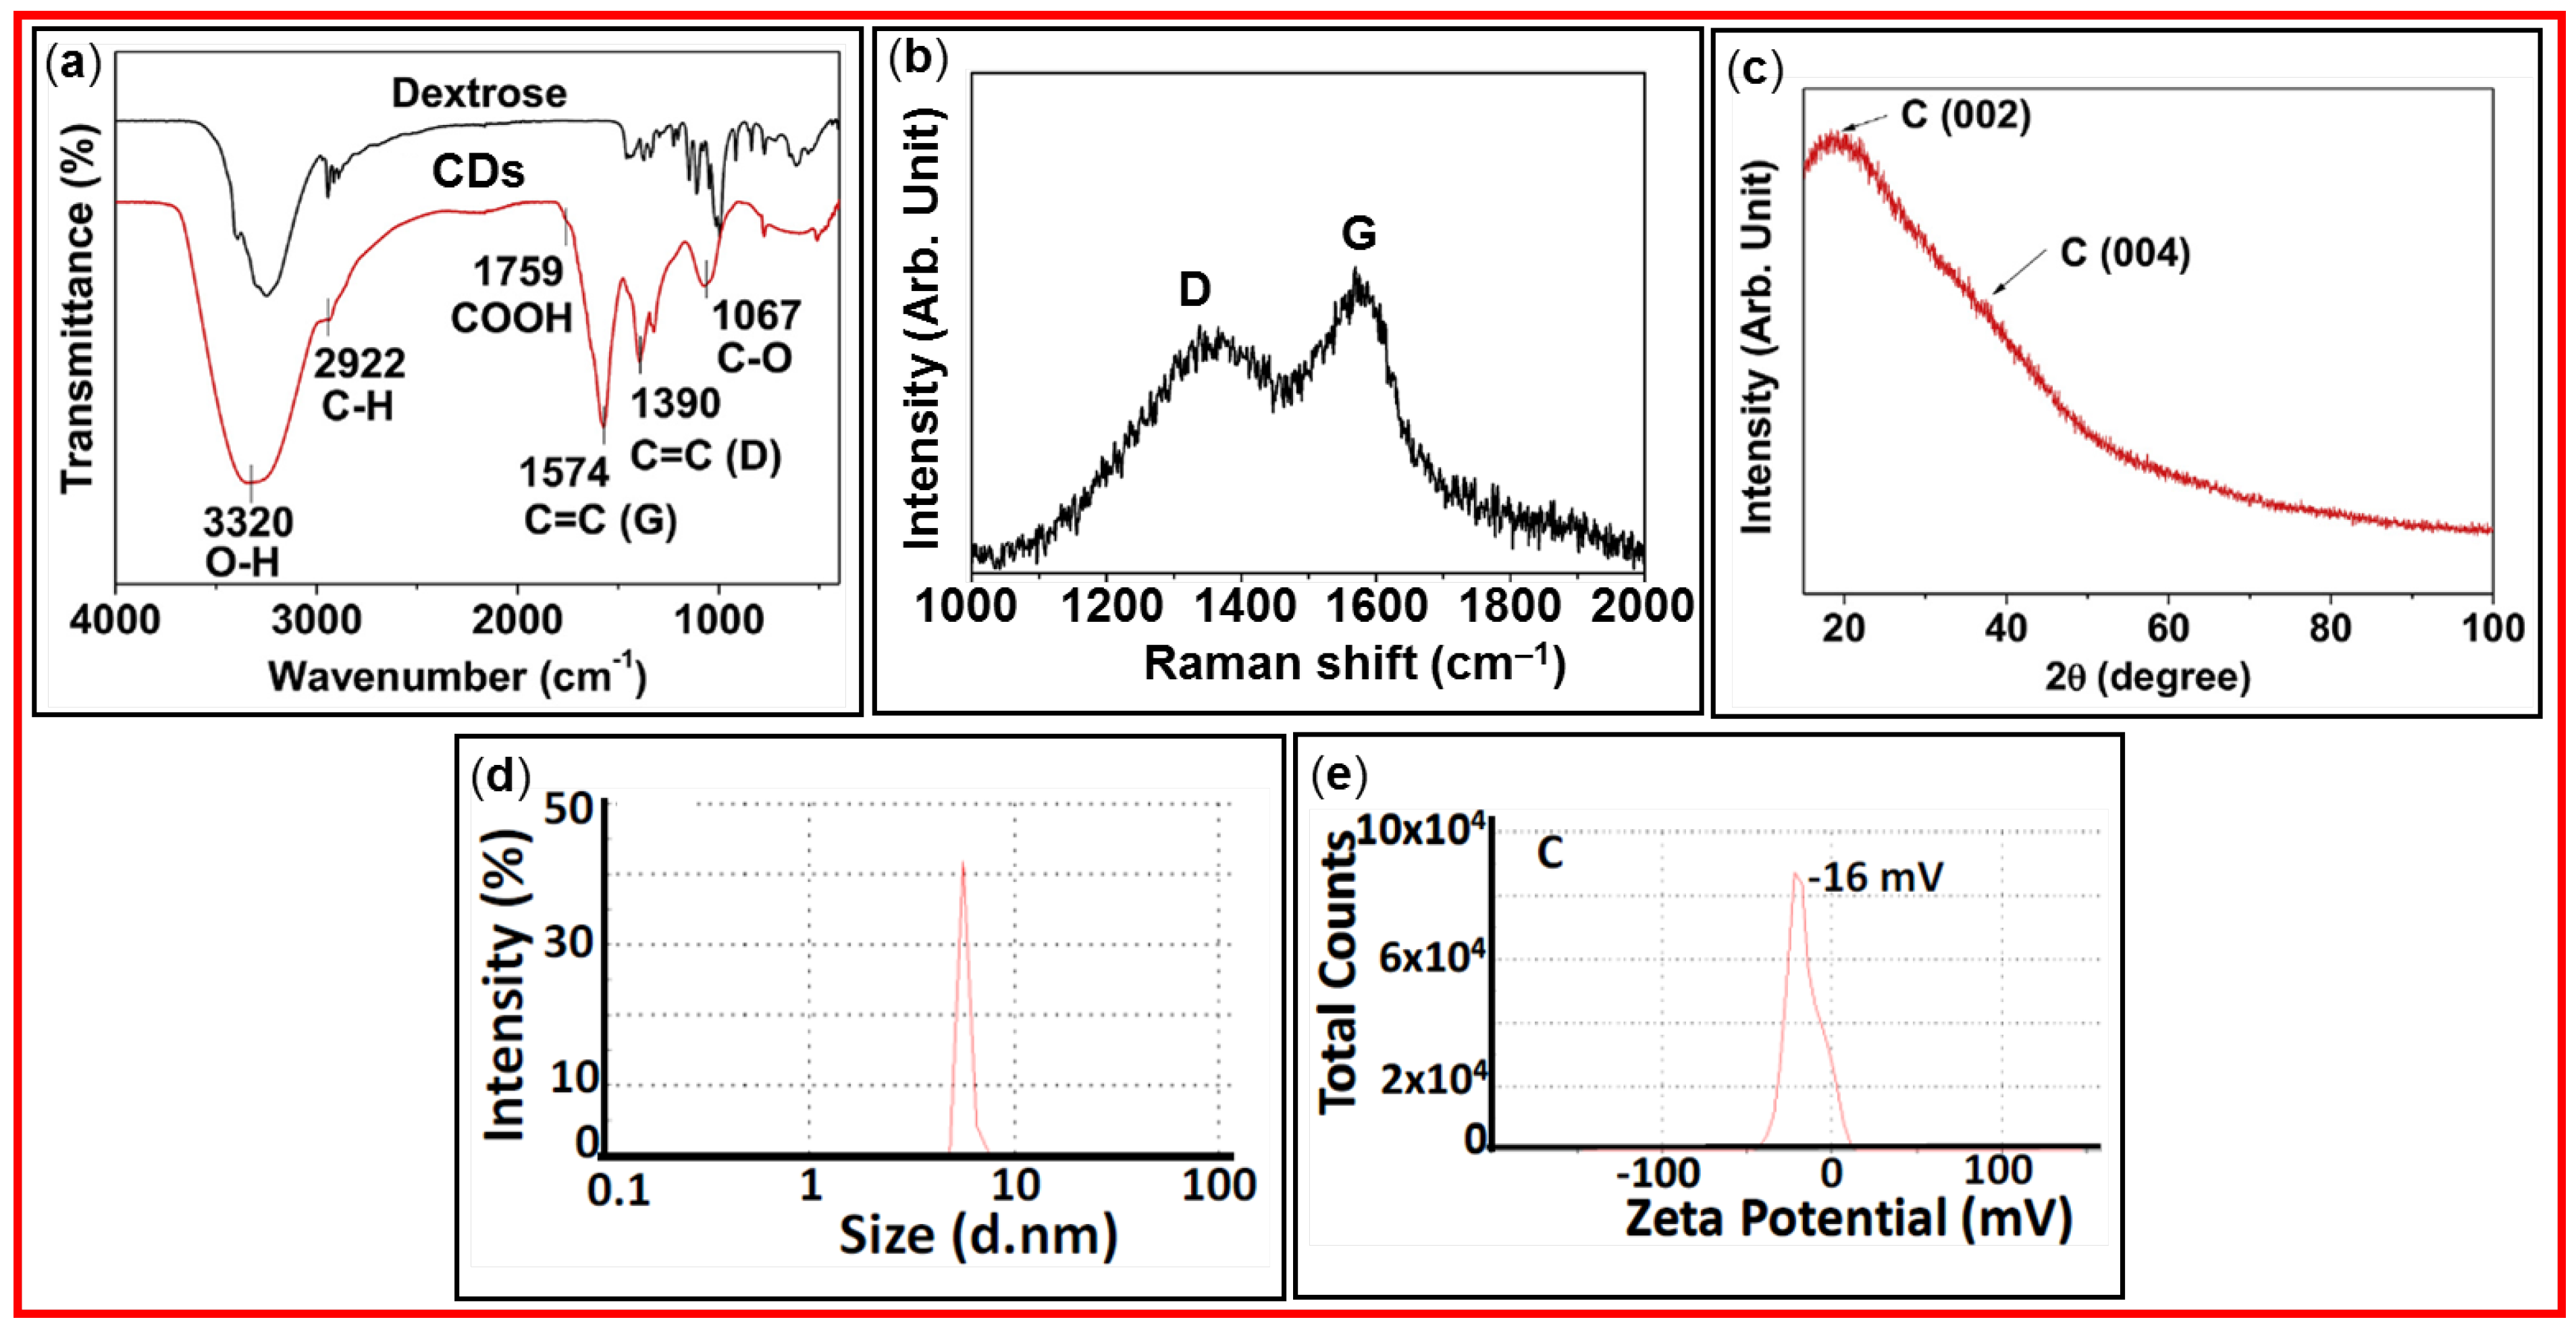
FT-IR absorption spectroscopy is used to identify the functional groups present on the surfaces of CDs and allows to follow the post-surface modification progress [50]. FT-IR absorption spectroscopy is suitable to measure gaseous, liquid, and solid-state samples. Figure 14a exhibits FT-IR absorption spectra of amorphous CDs and dextrose precursor [51], and Table 1 lists the FT-IR absorption wavenumbers of characteristic vibrations of CDs prepared from different carbon sources.
3.2. Raman Spectroscopy
Raman spectroscopy can be used to identify CDs and evaluate crystalline or amorphous nature of CDs [52]. Raman spectrum of CDs displays two distinct peaks, D and G bands at ~1360 and ~1580 cm‒1, respectively, arising from sp2 carbons (i.e., C=C double bonds). D band appears due to the vibrations of defect sp2 graphitic carbons, whereas G band is the primary mode in graphene and graphite which is due to planar sp2 graphitic carbons; therefore, highly crystalline graphene and graphite have a strong G and weak D bands. Figure 14b shows Raman spectrum of the CDs prepared from citric acid and neutral red [56] and Table 1 lists D and G bands of CDs prepared from different carbon sources.
3.3. XRD
XRD is used to determine the crystal structure of CDs. It also allows us to examine chemical composition, phase purity, and particle size of CDs [60,61]. In XRD patterns, broad peaks indicate the poor degree of crystallinity (or amorphous) of CDs. Figure 14c shows two broad peaks at 2θ = ~19° and ~38° from the graphitic carbon C(002) and C(004) crystal planes in the amorphous CDs [51].
3.4. DLS
3.5. Zeta Potential
Zeta potential of CDs reflects their surface charge [62,64]. It helps to predict the functional groups, hydrophilicity, and electrostatic stability of the CDs in aqueous solution. For instance, CDs with -COOH groups will have negative zeta potentials, while CDs with NH2 groups will have positive zeta potentials [65]. Figure 14e shows the zeta potential of CDs prepared from citric acid with a value of ‒16 mV [63], indicating that the CDs have negatively charged surfaces owing to -COOH groups.
3.6. Magnetic Properties
The magnetic ordering of CDs makes them magnetic materials [66]. The magnetic ordering of CDs is due to the presence of intrinsic disorder and surface defects, providing unpaired electrons [67]. The unpaired electrons cause magnetic ordering in CDs [68].
3.6.1. VSM
Tripti et al. prepared CDs using the biomass precursor pennisteum glaucum and a simple pyrolysis method [69]. Magnetic properties of the synthesized CDs, i.e., B 1 h, B 2 h, and B 3 h where “B” represents the biomass precursor and “1 h”, “2 h”, and “3 h” represent the pyrolysis times, were investigated. The magnetic ordering was attributed to the interaction of unpaired electrons. Figure 15a shows the saturation magnetization values of 0.02412, 0.02006, and 0.01872 emu/g for B 1 h, B 2 h, and B 3 h CDs, respectively, revealing that as the pyrolysis time increased, the saturation magnetization decreased; this implies that defect structures and unpaired electrons increased with increasing pyrolysis time. Tegafaw et al. prepared amorphous CDs with an average diameter of 2.2 nm using dextrose precursor and a wet-chemical method. The M‒H curve of the CDs revealed that the amorphous CDs had a weak paramagnetic property at room temperature as depicted in Figure 15b [51]. Therefore, magnetic properties of CDs depend on synthesis method and carbon precursor.
3.6.2. EPR
Bhunia et al. prepared fluorescent CDs using carbohydrate derivatives and chemical method [70]. Four kinds of fluorescent CDs with different emission colors were prepared by changing synthesis conditions; they were CDblue, CDgreen, CDyellow, and CDred. Figure 16a displays the EPR spectra of four kinds of CDs with different emission colors at 25 oC, confirming the existence of free electrons in CDs. Zhao et al. prepared CDs with a 2‒4 nm diameter using a microwave approach and glucose and PEG 1500 as the carbon sources [71]. Figure 16b exhibits the EPR spectra of CDs. g-value of 2.00094 revealed that the ground state of CDs was singly occupied in orbital. When NaOH was added into CD solution, the peak intensity and area increased, indicating more singly occupied orbitals by free electrons in CDs.
3.7. In Vitro and In Vivo Cytotoxicity
CDs are potential candidates in biological and biomedical applications owing to their very low or nontoxic performance [72‒74]. Furthermore, their cytotoxicity can be improved through surface modifications [75].
Wang et al. prepared ultrasmall and highly biocompatible CDs using the natural plant Pollen Typhae (PT) and a one-pot pyrolysis method [76]. Figure 17a‒17c exhibit the cell viability of mouse macrophage tumor (RAW 264.7), cervical cancer line HeLa derivative (L02), and human embryonic kidney (293T) cells, respectively, at the concentration range from 19.53 to 2,500 µg CDs/mL, displaying almost no cellular toxicity. Figure 15d presents the in vitro cytotoxicity of amorphous CDs using human prostate cancer (DU145) and normal mouse hepatocyte (NCTC1469) cells, indicating nontoxicity up to the treated carbon concentration of 500 µM in both cells [51]. Wang et al. explored the in vivo toxicity of CDs in various organs (i.e., heart, liver, spleen, lung, and kidneys) 1 and 14 days after injection of CD solution into rats [77]. Figure 17e shows no significant histological changes in the organs after injection as compared with those of the control, confirming nontoxicity of the CDs.
4. CDs as diaCEST MRI Contrast Agents
4.1. Principle of CEST
Advancement of MRI transformed with the development of contrast agents because they improved the images and enhanced diagnostic precision through contrast enhancements. Until now various kinds of metal-based MRI contrast agents have been developed; these are Gd(III)-chelates, Mn(II)-chelates, and iron oxide nanoparticles [78‒84]. However, these metal-based MRI contrast agents are restricted to low-concentration injection owing to their toxicity. Therefore, metal-fee MRI contrast agents such as CEST MRI contrast agents have been recently introduced [85‒90].
Figure 18a displays the principle of CEST mechanism in which the saturated solute protons are exchanged with bulk water protons at the rate Ksw and the unsaturated bulk water protons return to the solutes at the rate Kws [86,90]. The left spectrum in Figure 18b presents the solute protons which resonate at a different frequency from that of bulk water protons. The saturated solute protons at a specific resonance frequency are transferred to bulk water through exchange with unsaturated water protons, decreasing the water proton resonance signal, as depicted in the right spectrum in Figure 18b. Figure 18c exhibits the normalized proton spectrum; this spectrum is called as the Z-spectrum or CEST spectrum. Figure 18d displays the result of magnetization transfer ratio (MTR) asymmetry analysis in % of the Z-spectrum after removing the effect of water proton signals. Figure 18e displays the chemical shift of various exchangeable proton sources and their MTR efficiencies [91], showing that the higher MTR efficiency and the higher saturation offset from H2O will provide sharper and stronger CEST signals. Therefore, the effective CEST MRI contrast agents should have the high MTR efficiency and the high saturation offset from H2O.
4.2. Applications of CDs as diaCEST MRI Contrast Agents
The CEST MRI contrast agents can be divided into two catagories based on their composition: paramagnetic CEST (paraCEST) agents [22,92,93] and diamagnetic CEST (diaCEST) agents [94‒96]. The metal-free CDs can be used as diaCEST MRI contrast agents to amplify MRI contrast efficiency.
Zhang et al. prepared arginine-modified carbon dots (AC-dots) as a new class of diaCEST MRI contrast agents [94]. Figure 19a shows the synthesis of AC-dots with an average diameter of 4.7 nm using glucose and arginine as precursors and microwave irradiation. The arginine was used to modify the surfaces of CDs. Figure 19b and 19c display the Z-spectra and MTRasym plots, respectively, with an increment of AC-dot concentration in which MTRasym plots exhibited the signal increment with the increase of AC-dot concentration. Figure 19d exhibits that MTRasym plots at pH = 6.1 and 6.5 had maximum signals at ~1 ppm owing to hydroxyl protons of AC-dots, but at pH ≥ 7, maximum signals were observed at ~2 ppm because the CEST signals were replaced into guanidinium protons. Figure 19e and 19f show that liposome (Lipo)-AC-dot-labeled cells had higher CEST contrast enhancements than the control liposome-labeled cells. Importantly, as shown in Figure 19f, the T2 MR images showed similar contrasts at the left and right mouse brains, but the CEST image showed higher contrasts at the left brain (Lipo-AC-dot-labeled cells injected) than the right brain (control Lipo-labeled cells injected). This work clearly demonstrated the effectiveness of the CDs as new class of diaCEST MRI contrast agents in sensitively detecting diseases with minimal artificial defect contrasts.
Pandey et al. prepared water-soluble CDs as diaCEST MRI contrast agents [95]. The amino-thioamide precursor was ineffective as a diaCEST MRI contrast agent owing to its poor water solubility. However, CDs prepared using thermal treatment served as diaCEST contrast agents owing to their improved water-solubility. Figure 20a exhibits the synthesis of CDs using hydrothermal treatment and Figure 20b displays the CEST effect as a function of pH for the amide (pink) and ammonium (green) exchangeable protons in Figure 20a. As shown in Figure 20c, the precursor in PBS at pH = 5.5 exhibited a broad diaCEST spectrum with 9.7% maximum efficiency of MTRasym at Δω = 2.25 ppm. The CEST results of CDs are presented in Figure 20d‒20f. At pH = 9.9, a strong and sharp diaCEST signal with 50.3% MTRasym was observed from amide protons of CDs at Δω = 5.25 ppm (Figure 20d). However, as shown in Figure 20e, the diaCEST efficiency was poor at physiological pH = 7.4. However, improved diaCEST efficiency was obtained at physiological pH by the variation of the reaction time, temperature, and precursor concentration [96]. At pH = 5.5, the CDs exhibited the maximum MTRasym of ~69% from ammonium protons owing to improved water solubility of CDs (Figure 20f). This pH dependent CEST experiment indicated that the best CEST image using CDs prepared using amino-thioamide precursor could be obtained at pH = 9.9.
5. Conclusions and Future Perspectives
This review overviewed the progress and advancements of synthesis, characterizations, and MRI application of CDs as diaCEST MRI contrast agents. As reviewed here, only a few studies on diaCEST MRI contrast agents based on CDs exist. Nonetheless, the CDs demonstrated the excellent performance suitable for applications as a new class of nontoxic and next generation MRI, i.e., diaCEST MRI contrast agents.
The CDs have received a great attention owing to their great potential for biomedical applications [97‒99]. Until now CDs have been synthesized using various methods with explanations of their plausible formation mechanisms. Although numerous synthetic methods have been introduced, a standard synthetic methodology producing high-quality CDs with required morphology, size, properties, and surface functional groups has not been developed. Therefore, the future research should address this issue to improve and optimize the performance and applications of CDs. Above all, the synthesis should satisfy the high water-solubility of CDs with many exchangeable protons with bulk water protons to apply them as effective diaCEST MRI contrast agents.
To improve the MR image quality, contrast agents can be used [100]. As reviewed here, the diaCEST MRI contrast agents correspond to a new class of MRI contrast agents. They do not rely on metal ions, but exchangeable protons with bulk water protons. The diaCEST MRI technique can provide resonance frequency selectivity because the resonance comes from exchangeable protons of materials, but not the bulk water protons, providing image contrasts with minimal artificial defects from bulk water proton signals. In addition, compared with conventional Gd-chelates [101] and iron oxide-based superparamagnetic nanoparticles [102], diaCEST MRI contrast agents have considerably lower biotoxicity because they are made of nontoxic elements such as C, H, O, and N.
The CD-based diaCEST MRI contrast agents can provide several advantages over conventional MRI contrast agents. Besides non-toxicity and resonance frequency selectivity, they can be easily synthesized using various carbon precursors and various synthetic methods. They can be made highly hydrophilic with many exchangeable protons with bulk water protons. Furthermore, their surfaces can be easily modified to conjugate with various functional molecules such as targeting ligands and drugs to increase specificity and treat diseases. The present status of CD-based diaCEST MRI contrast agents is just beginning at the research level as can be evidenced from only a few research papers published so far. However, based on previous reports, the future of CD-based diaCEST MRI contrast agents is very promising. The high sensitivity and frequency selectivity of the CD-based diaCEST MRI contrast agents will allow us to detect and monitor diseases at the molecular level. Therefore, metal-free CDs as promising potential diaCEST MRI contrast agents will open a new journey to MRI.
Author Contributions
Conceptualization, E.M. and T.T.; methodology, E.M.; validation, Y.L., D.Z. and A.B.; writing—original draft preparation, E.M.; writing—review and editing, Y.C. and G.H.L.; funding acquisition, J.K., Y.C. and G.H.L. All authors have read and agreed to the published version of the manuscript.
Funding
This research was funded by the Basic Science Research Program of the National Research Foundation (NRF) funded by the Korea government (Ministry of Science, and Information and Communications Technology: MSIT) (Basic Research Laboratory, No. RS-2024-00406209) and NRF funded by the Ministry of Education (Post-Doc. Growth Type Cooperational Research, No. RS-2024-00459895).
Informed Consent Statement
Not applicable.
Data Availability Statement
Not applicable.
Conflicts of Interest
The authors declare no conflicts of interest.
References
- Xu, X.; Ray, R.; Gu, Y.; Ploehn, H.J.; Gearheart, L.; Raker, K.; Scrivens, W.A. Electrophoretic Analysis and Purification of Fluorescent Single-Walled Carbon Nanotube Fragments. J. Am. Chem. Soc. 2004, 126, 12736–12737. [CrossRef]
- Sun, Y.-P.; Zhou, B.; Lin, Y.; Wang, W.; Fernando, K.S.; Pathak, P.; Meziani, M.J.; Harruff, B.A.; Wang, X.; Wang, H. Quantum-Sized Carbon Dots for Bright and Colorful Photoluminescence. J. Am. Chem. Soc. 2006, 128, 7756–7757. [CrossRef]
- Su, W.; Wu, H.; Xu, H.; Zhang, Y.; Li, Y.; Li, X.; Fan, L. Carbon dots: a booming material for biomedical applications. Mater. Chem. Front. 2020, 4, 821–836. [CrossRef]
- Salvi, A.; Kharbanda, S.; Thakur, P.; Shandilya, M.; Thakur, A. Biomedical application of carbon quantum dots: A review. Carbon Trends 2024, 17. [CrossRef]
- Hebbar, A.; Selvaraj, R.; Vinayagam, R.; Varadavenkatesan, T.; Kumar, P.S.; Duc, P.A.; Rangasamy, G. A critical review on the environmental applications of carbon dots. Chemosphere 2022, 313, 137308. [CrossRef]
- Long, C.; Jiang, Z.; Shangguan, J.; Qing, T.; Zhang, P.; Feng, B. Applications of carbon dots in environmental pollution control: A review. Chem. Eng. J. 2021, 406. [CrossRef]
- Hu, J.; Sun, Y.; Aryee, A.A.; Qu, L.; Zhang, K.; Li, Z. Mechanisms for carbon dots-based chemosensing, biosensing, and bioimaging: A review. Anal. Chim. Acta 2022, 1209, 338885. [CrossRef]
- Khan, M.E.; Mohammad, A.; Yoon, T. State-of-the-art developments in carbon quantum dots (CQDs): Photo-catalysis, bio-imaging, and bio-sensing applications. Chemosphere 2022, 302, 134815. [CrossRef]
- Ali, H.; Ghosh, S.; Jana, N.R. Fluorescent carbon dots as intracellular imaging probes. WIREs Nanomed. Nanobiotechnology 2020, 12, e1617. [CrossRef]
- Wang, Z.-X.; Wang, Z.; Wu, F.-G. Carbon Dots as Drug Delivery Vehicles for Antimicrobial Applications: A Minireview. ChemMedChem 2022, 17 (13), e202200003.
- Jia, Q.; Zhao, Z.; Liang, K.; Nan, F.; Li, Y.; Wang, J.; Ge, J.; Wang, P. Recent advances and prospects of carbon dots in cancer nanotheranostics. Mater. Chem. Front. 2019, 4, 449–471. [CrossRef]
- Tran, N.-A.; Hoang, N.M.; Dang, H.-L.T.; Huy, D.Q.; Van Quy, T.; Hanh, N.T.; Vu, N.H.; Dao, V.-D. Carbon dots in environmental treatment and protection applications. Desalination 2022, 548. [CrossRef]
- Xiao, Y.; Wang, Z.; Fu, J.; Zhang, J.; He, Q.; Lu, H.; Zhou, Q.; Wang, H. Recent Advances in the Synthesis, Characterization, and Application of Carbon Dots in the Field of Wastewater Treatment: A Comprehensive Review. Water 2025, 17, 210. [CrossRef]
- Yang, H.-L.; Bai, L.-F.; Geng, Z.-R.; Chen, H.; Xu, L.-T.; Xie, Y.-C.; Wang, D.-J.; Gu, H.-W.; Wang, X.-M. Carbon quantum dots: Preparation, optical properties, and biomedical applications. Mater. Today Adv. 2023, 18. [CrossRef]
- Hu, S.; Zhang, W.; Chang, Q.; Yang, J.; Lin, K. A chemical method for identifying the photocatalytic active sites on carbon dots. Carbon 2016, 103, 391–393. [CrossRef]
- Dhenadhayalan, N.; Lin, K.-C.; Suresh, R.; Ramamurthy, P. Unravelling the Multiple Emissive States in Citric-Acid-Derived Carbon Dots. J. Phys. Chem. C 2016, 120, 1252–1261. [CrossRef]
- Alam Qureshi, Z.; Dabash, H.; Ponnamma, D.; Abbas, M. Carbon dots as versatile nanomaterials in sensing and imaging: Efficiency and beyond. Heliyon 2024, 10, e31634. [CrossRef]
- Mandal, S. Elucidating carbon dot research coupled with bibliometric analysis. Next Res. 2024, 1. [CrossRef]
- Tu, L.; Li, Q.; Qiu, S.; Li, M.; Shin, J.; Wu, P.; Singh, N.; Li, J.; Ding, Q.; Hu, C.; et al. Recent developments in carbon dots: a biomedical application perspective. J. Mater. Chem. B 2023, 11, 3038–3053. [CrossRef]
- Kabasawa, H. MR Imaging in the 21st Century: Technical Innovation over the First Two Decades. Magn. Reson. Med Sci. 2022, 21, 71–82. [CrossRef]
- Ward, K.; Aletras, A.; Balaban, R. A New Class of Contrast Agents for MRI Based on Proton Chemical Exchange Dependent Saturation Transfer (CEST). J. Magn. Reson. 2000, 143, 79–87. [CrossRef]
- Hancu, I.; Dixon, W.T.; Woods, M.; Vinogradov, E.; Sherry, A.D.; Lenkinski, R.E. CEST and PARACEST MR contrast agents. Acta Radiol. 2010, 51, 910–923. [CrossRef]
- Yang, X.; Song, X.; Li, Y.; Liu, G.; Banerjee, S.R.; Pomper, M.G.; McMahon, M.T. Salicylic Acid and Analogues as diaCEST MRI Contrast Agents with Highly Shifted Exchangeable Proton Frequencies. Angew. Chem. Int. Ed. Engl. 2013, 52, 8116–8119. [CrossRef]
- Cui, L.; Ren, X.; Sun, M.; Liu, H.; Xia, L. Carbon Dots: Synthesis, Properties and Applications. Nanomaterials 2021, 11, 3419.
- El-Azazy, M.; Osman, A.I.; Nasr, M.; Ibrahim, Y.; Al-Hashimi, N.; Al-Saad, K.; Al-Ghouti, M.A.; Shibl, M.F.; Al-Muhtaseb, A.H.; Rooney, D.W.; et al. The interface of machine learning and carbon quantum dots: From coordinated innovative synthesis to practical application in water control and electrochemistry. Co-ord. Chem. Rev. 2024, 517. [CrossRef]
- Tao, H.; Yang, K.; Ma, Z.; Wan, J.; Zhang, Y.; Kang, Z.; Liu, Z. In Vivo NIR Fluorescence Imaging, Biodistribution, and Toxicology of Photoluminescent Carbon Dots Produced from Carbon Nanotubes and Graphite. Small 2011, 8, 281–290. [CrossRef]
- Qiao, Z.-A.; Wang, Y.; Gao, Y.; Li, H.; Dai, T.; Liu, Y.; Huo, Q. Commercially activated carbon as the source for producing multicolor photoluminescent carbon dots by chemical oxidation. Chem. Commun. 2009, 46, 8812–8814. [CrossRef]
- Rocco, D.; Moldoveanu, V.G.; Feroci, M.; Bortolami, M.; Vetica, F. Electrochemical Synthesis of Carbon Quantum Dots. ChemElectroChem 2023, 10, e202201104. [CrossRef]
- Bao, L.; Zhang, Z.-L.; Tian, Z.-Q.; Zhang, L.; Liu, C.; Lin, Y.; Qi, B.; Pang, D.-W. Electrochemical Tuning of Luminescent Carbon Nanodots: From Preparation to Luminescence Mechanism. Adv. Mater. 2011, 23, 5801–5806. [CrossRef]
- Liu, M.; Xu, Y.; Niu, F.; Gooding, J.J.; Liu, J. Carbon quantum dots directly generated from electrochemical oxidation of graphite electrodes in alkaline alcohols and the applications for specific ferric ion detection and cell imaging. Anal. 2016, 141, 2657–2664. [CrossRef]
- Gayen, B.; Palchoudhury, S.; Chowdhury, J. Carbon Dots: A Mystic Star in the World of Nanoscience. J. Nanomater. 2019, 2019, 3451307. [CrossRef]
- Kumar, P.; Dua, S.; Kaur, R.; Kumar, M.; Bhatt, G. A review on advancements in carbon quantum dots and their application in photovoltaics. RSC Adv. 2022, 12, 4714–4759. [CrossRef]
- Cui, L.; Ren, X.; Wang, J.; Sun, M. Synthesis of homogeneous carbon quantum dots by ultrafast dual-beam pulsed laser ablation for bioimaging. Mater. Today Nano 2020, 12, 100091. [CrossRef]
- Hu, S.; Liu, J.; Yang, J.; Wang, Y.; Cao, S. Laser synthesis and size tailor of carbon quantum dots. J. Nanoparticle Res. 2011, 13, 7247–7252. [CrossRef]
- Park, S.Y.; Lee, H.U.; Park, E.S.; Lee, S.C.; Lee, J.-W.; Jeong, S.W.; Kim, C.H.; Lee, Y.-C.; Huh, Y.S.; Lee, J. Photoluminescent Green Carbon Nanodots from Food-Waste-Derived Sources: Large-Scale Synthesis, Properties, and Biomedical Applications. ACS Appl. Mater. Interfaces 2014, 6, 3365–3370. [CrossRef]
- Wu, M.; Wang, Y.; Wu, W.; Hu, C.; Wang, X.; Zheng, J.; Li, Z.; Jiang, B.; Qiu, J. Preparation of functionalized water-soluble photoluminescent carbon quantum dots from petroleum coke. Carbon 2014, 78, 480–489. [CrossRef]
- Nikita, V. T.; Evgeny, V. K.; Pavel, D. K.; Yuan, X.; Mikhail, Y. L.; Weiren, Z.; Alexander, V. B.; Anatoly, V. F.; Andrey L. R.; Ivan D. R. sp2-sp3-Hybridized Atomic Domains Determine Optical Features of Carbon Dots. ACS Nano 2019, 13, 10737-10744.
- Choi, Y.; Choi, Y.; Kwon, O.-H.; Kim, B.-S. Carbon Dots: Bottom-Up Syntheses, Properties, and Light-Harvesting Applications. Chem. Asian J. 2018, 13, 586-598.
- Yang, Y.; Wu, D.; Han, S.; Hu, P.; Liu, R. Bottom-up fabrication of photoluminescent carbon dots with uniform morphology via a soft–hard template approach. Chem. Commun. 2013, 49, 4920–4922. [CrossRef]
- Zhu, H.; Wang, X.; Li, Y.; Wang, Z.; Yang, F.; Yang, X. Microwave synthesis of fluorescent carbon nanoparticles with electrochemiluminescence properties. Chem. Commun. 2009, 5118–5120. [CrossRef]
- Choi, Y.; Thongsai, N.; Chae, A.; Jo, S.; Kang, E.B.; Paoprasert, P.; Park, S.Y.; In, I. Microwave-assisted synthesis of luminescent and biocompatible lysine-based carbon quantum dots. J. Ind. Eng. Chem. 2017, 47, 329–335. [CrossRef]
- Yu, T.; Wang, H.; Guo, C.; Zhai, Y.; Yang, J.; Yuan, J. A Rapid Microwave Synthesis of Green-Emissive Carbon Dots with Solid-State Fluorescence and pH-Sensitive Properties. Royal. Soc. Open Sci. 2018, 5, 180245.
- Jiang, L.; Cai, H.; Zhou, W.; Li, Z.; Zhang, L.; Bi, H. RNA-Targeting Carbon Dots for Live-Cell Imaging of Granule Dynamics. Adv. Mater. 2023, 35, 2210776.
- Wang, R.; Lu, K.-Q.; Tang, Z.-R.; Xu, Y.-J. Recent progress in carbon quantum dots: synthesis, properties and applications in photocatalysis. J. Mater. Chem. A 2017, 5, 3717–3734. [CrossRef]
- Li, J.-Y.; Liu, Y.; Shu, Q.-W.; Liang, J.-M.; Zhang, F.; Chen, X.-P.; Deng, X.-Y.; Swihart, M.T.; Tan, K.-J. One-Pot Hydrothermal Synthesis of Carbon Dots with Efficient Up- and Down-Converted Photoluminescence for the Sensitive Detection of Morin in a Dual-Readout Assay. Langmuir 2017, 33, 1043–1050. [CrossRef]
- Lin, L.; Wang, Y.; Xiao, Y.; Liu, W. Hydrothermal synthesis of carbon dots codoped with nitrogen and phosphorus as a turn-on fluorescent probe for cadmium(II). Microchim. Acta 2019, 186, 147. [CrossRef]
- Liu, Y.; Li, W.; Wu, P.; Ma, C.; Wu, X.; Xu, M.; Luo, S.; Xu, Z.; Liu, S. Hydrothermal synthesis of nitrogen and boron co-doped carbon quantum dots for application in acetone and dopamine sensors and multicolor cellular imaging. Sensors Actuators B: Chem. 2019, 281, 34–43. [CrossRef]
- Bao, W.; Lan, Y.; Lu, H.; Li, G.; Yu, M.; Yang, J.; Wei, L.; Su, Q. A Dual-Function Carbon Quantum Dot Fluorescent Probe for the Detection of Fe3+ and Sunset Yellow. ChemistrySelect 2022, 7. [CrossRef]
- Wang, C.; Yang, M.; Shi, H.; Yao, Z.; Liu, E.; Hu, X.; Guo, P.; Xue, W.; Fan, J. Carbon quantum dots prepared by pyrolysis: Investigation of the luminescence mechanism and application as fluorescent probes. Dye. Pigment. 2022, 204. [CrossRef]
- Ţucureanu, V.; Matei, A.; Avram, A.M. FTIR Spectroscopy for Carbon Family Study. Crit. Rev. Anal. Chem. 2016, 46, 502–520. [CrossRef]
- Tegafaw, T.; Oh, I.T.; Cha, H.; Yue, H.; Miao, X.; Ho, S.L.; Ahmad, M.Y.; Marasini, S.; Ghazanfari, A.; Kim, H.-K.; et al. Facile synthesis of stable colloidal suspension of amorphous carbon nanoparticles in aqueous medium and their characterization. J. Phys. Chem. Solids 2018, 120, 96–103. [CrossRef]
- John, B.K.; Abraham, T.; Mathew, B. A Review on Characterization Techniques for Carbon Quantum Dots and Their Applications in Agrochemical Residue Detection. J. Fluoresc. 2022, 32, 449–471. [CrossRef]
- Liu, Y.; Zhou, Q.; Yuan, Y.; Wu, Y. Hydrothermal synthesis of fluorescent carbon dots from sodium citrate and polyacrylamide and their highly selective detection of lead and pyrophosphate. Carbon 2017, 115, 550–560. [CrossRef]
- Edison, T.N.J.I.; Atchudan, R.; Sethuraman, M.G.; Shim, J.-J.; Lee, Y.R. Microwave assisted green synthesis of fluorescent N-doped carbon dots: Cytotoxicity and bio-imaging applications. J. Photochem. Photobiol. B: Biol. 2016, 161, 154–161. [CrossRef]
- Shen, T.-Y.; Jia, P.-Y.; Chen, D.-S.; Wang, L.-N. Hydrothermal synthesis of N-doped carbon quantum dots and their application in ion-detection and cell-imaging. Spectrochim. Acta Part A: Mol. Biomol. Spectrosc. 2020, 248, 119282. [CrossRef]
- Wang, Y.; Chang, X.; Jing, N.; Zhang, Y. Hydrothermal synthesis of carbon quantum dots as fluorescent probes for the sensitive and rapid detection of picric acid. Anal. Methods 2018, 10, 2775–2784. [CrossRef]
- Yu, C.; Xuan, T.; Chen, Y.; Zhao, Z.; Sun, Z.; Li, H. A facile, green synthesis of highly fluorescent carbon nanoparticles from oatmeal for cell imaging. J. Mater. Chem. C 2015, 3, 9514–9518. [CrossRef]
- Xue, M.; Zou, M.; Zhao, J.; Zhan, Z.; Zhao, S. Green preparation of fluorescent carbon dots from lychee seeds and their application for the selective detection of methylene blue and imaging in living cells. J. Mater. Chem. B 2015, 3, 6783–6789. [CrossRef]
- Gao, W.; Song, H.; Wang, X.; Liu, X.; Pang, X.; Zhou, Y.; Gao, B.; Peng, X. Carbon Dots with Red Emission for Sensing of Pt2+, Au3+, and Pd2+ and Their Bioapplications in Vitro and in Vivo. ACS Appl. Mater. Interfaces 2018, 10, 1147-1154.
- Qiang, R.; Yang, S.; Hou, K.; Wang, J. Synthesis of carbon quantum dots with green luminescence from potato starch. New J. Chem. 2019, 43, 10826–10833. [CrossRef]
- Thambiraj, S.; Shankaran, D.R. Green Synthesis of Highly Fluorescent Carbon Quantum Dots from Sugarcane Bagasse Pulp. Appl. Surf. Sci. 2016, 390, 435-443.
- Rodriguez-Loya, J.; Lerma, M.; Gardea-Torresdey, J.L. Dynamic Light Scattering and Its Application to Control Nanoparticle Aggregation in Colloidal Systems: A Review. Micromachines 2023, 15, 24. [CrossRef]
- Boruah, J.S.; Sankaranarayanan, K.; Chowdhury, D. Insight into carbon quantum dot–vesicles interactions: role of functional groups. RSC Adv. 2022, 12, 4382–4394. [CrossRef]
- Pudza, M.Y.; Abidin, Z.Z.; Rashid, S.A.; Yasin, F.M.; Noor, A.S.M.; Issa, M.A. Eco-Friendly Sustainable Fluorescent Carbon Dots for the Adsorption of Heavy Metal Ions in Aqueous Environment. Nanomaterials 2020, 10, 315. [CrossRef]
- Lee, K.H.; A. Noesges, B.; McPherson, C.; Khan, F.; J. Brillson, L.; O. Winter, J. Oxidation of Quantum Dots Encapsulated in Block Copolymer Micelles as a Function of Polymer Terminal Charge. Nanoscale 2022, 14, 11779-11789.
- Parkansky, N.; Alterkop, B.; Boxman, R.; Leitus, G.; Berkh, O.; Barkay, Z.; Rosenberg, Y.; Eliaz, N. Magnetic properties of carbon nano-particles produced by a pulsed arc submerged in ethanol. Carbon 2008, 46, 215–219. [CrossRef]
- Lähderanta, E.; Lashkul, A.V.; Lisunov, K.G.; A Zherebtsov, D.; Galimov, D.M.; Titkov, A.N. Magnetic properties of carbon nanoparticles. IOP Conf. Series: Mater. Sci. Eng. 2012, 38. [CrossRef]
- Liu, J.; Bi, H.; Morais, P.C.; Zhang, X.; Zhang, F.; Hu, L. Room-temperature Magnetism in Carbon Dots and Enhanced Ferromagnetism in Carbon Dots-Polyaniline Nanocomposite. Sci. Rep. 2017, 7, 2165. [CrossRef]
- Tripti; Kumar, S.; Kumar, P. Pennisteum glaucum-derived carbon dots, synthesized through green approach to degrade Rose Bengal and Methylene Blue dyes photocatalytically. Diam. Relat. Mater. 2024, 148. [CrossRef]
- Bhunia, S.K.; Saha, A.; Maity, A.R.; Ray, S.C.; Jana, N.R. Carbon Nanoparticle-based Fluorescent Bioimaging Probes. Sci. Rep. 2013, 3, srep01473. [CrossRef]
- Zhao, L.; Di, F.; Wang, D.; Guo, L.-H.; Yang, Y.; Wan, B.; Zhang, H. Chemiluminescence of carbon dots under strong alkaline solutions: a novel insight into carbon dot optical properties. Nanoscale 2013, 5, 2655–2658. [CrossRef]
- Yang, S.-T.; Wang, X.; Wang, H.; Lu, F.; Luo, P.G.; Cao, L.; Meziani, M.J.; Liu, J.-H.; Liu, Y.; Chen, M.; et al. Carbon Dots as Nontoxic and High-Performance Fluorescence Imaging Agents. J. Phys. Chem. C 2009, 113, 18110–18114. [CrossRef]
- Belkahla, H.; Boudjemaa, R.; Caorsi, V.; Pineau, D.; Curcio, A.; Lomas, J.S.; Decorse, P.; Chevillot-Biraud, A.; Azaïs, T.; Wilhelm, C.; et al. Carbon dots, a powerful non-toxic support for bioimaging by fluorescence nanoscopy and eradication of bacteria by photothermia. Nanoscale Adv. 2019, 1, 2571–2579. [CrossRef]
- Das, S.; Mondal, S.; Ghosh, D. Carbon quantum dots in bioimaging and biomedicines. Front. Bioeng. Biotechnol. 2024, 11, 1333752. [CrossRef]
- Havrdova, M.; Hola, K.; Skopalik, J.; Tomankova, K.; Petr, M.; Cepe, K.; Polakova, K.; Tucek, J.; Bourlinos, A. B.; Zboril, R. Toxicity of Carbon Dots-Effect of Surface Functionalization on the Cell Viability, Reactive Oxygen Species Generation and Cell Cycle. Carbon 2016, 99, 238-248.
- Wang, X.; Wu, T.; Yang, Y.; Zhou, L.; Wang, S.; Liu, J.; Zhao, Y.; Zhang, M.; Zhao, Y.; Qu, H.; et al. Ultrasmall and highly biocompatible carbon dots derived from natural plant with amelioration against acute kidney injury. J. Nanobiotechnology 2023, 21, 1–16. [CrossRef]
- Wang, L.; Li, B.; Xu, F.; Li, Y.; Xu, Z.; Wei, D.; Feng, Y.; Wang, Y.; Jia, D.; Zhou, Y. Visual in vivo degradation of injectable hydrogel by real-time and non-invasive tracking using carbon nanodots as fluorescent indicator. Biomaterials 2017, 145, 192–206. [CrossRef]
- Oluwasola, I.E.; Ahmad, A.L.; Shoparwe, N.F.; Ismail, S. Gadolinium based contrast agents (GBCAs): Uniqueness, aquatic toxicity concerns, and prospective remediation. J. Contam. Hydrol. 2022, 250, 104057. [CrossRef]
- Luo, N.; Yang, C.; Tian, X.; Xiao, J.; Liu, J.; Chen, F.; Zhang, D.; Xu, D.; Zhang, Y.; Yang, G.; et al. A general top-down approach to synthesize rare earth doped-Gd2O3 nanocrystals as dualmodal contrast agents. J. Mater. Chem. B 2014, 2, 5891–5897. [CrossRef]
- Yao, Y.-Y.; Gedda, G.; Girma, W.M.; Yen, C.-L.; Ling, Y.-C.; Chang, J.-Y. Magnetofluorescent Carbon Dots Derived from Crab Shell for Targeted Dual-Modality Bioimaging and Drug Delivery. ACS Appl. Mater. Interfaces 2017, 9, 13887–13899. [CrossRef]
- Wang, H.; Shen, J.; Li, Y.; Wei, Z.; Cao, G.; Gai, Z.; Hong, K.; Banerjeem P.; Zhou, S. Magnetic iron oxide-fluorescent carbon dots integrated nanoparticles for dual-modal imaging, near-infrared light-responsive drug carrier and photothermal therapy. Biomater. Sci. 2014, 2, 915-923.
- Liu, X.; Jiang, H.; Ye, J.; Zhao, C.; Gao, S.; Wu, C.; Li, C.; Li, J.; Wang, X. Nitrogen-Doped Carbon Quantum Dot Stabilized Magnetic Iron Oxide Nanoprobe for Fluorescence, Magnetic Resonance, and Computed Tomography Triple-Modal In Vivo Bioimaging. Adv. Funct. Mater. 2016, 26, 8694-8706.
- Huang, C.-C.; Khu, N.-H.; Yeh, C.-S. The characteristics of sub 10 nm manganese oxide T1 contrast agents of different nanostructured morphologies. Biomaterials 2010, 31, 4073–4078. [CrossRef]
- Pan, D.; Schmieder, A.H.; Wickline, S.A.; Lanza, G.M. Manganese-based MRI contrast agents: past, present, and future. Tetrahedron 2011, 67, 8431–8444. [CrossRef]
- Abdul, W.; Muhammad, S.; Tatiana, E.; Khurram, S.; Ozioma U. A.; Zahoor, A.; Zhichao, S.; M. Zubair, I.; Xiangdong, K. Innovative perspectives on metal free contrast agents for MRI: Enhancing imaging efficacy, and AI-driven future diagnostics. Acta Biomater. 2025, 193, 83-106.
- Van Zijl, P. C. M.; Yadav, N. N. Chemical Exchange Saturation Transfer (CEST): What Is in a Name and What Isn’t? Magn. Reson. Med. 2011, 65, 927-948.
- Wu, B.; Warnock, G.; Zaiss, M.; Lin, C.; Chen, M.; Zhou, Z.; Mu, L.; Nanz, D.; Tuura, R.; Delso, G. An overview of CEST MRI for non-MR physicists. EJNMMI Phys. 2016, 3, 1–21. [CrossRef]
- Chan, K.W.; Bulte, J.W.; McMahon, M.T. Diamagnetic chemical exchange saturation transfer (diaCEST) liposomes: physicochemical properties and imaging applications. WIREs Nanomed. Nanobiotechnology 2013, 6, 111–124. [CrossRef]
- Vinogradov, E.; Sherry, A.D.; Lenkinski, R.E. CEST: From basic principles to applications, challenges and opportunities. J. Magn. Reson. 2013, 229, 155–172. [CrossRef]
- Su, H.; Chan, K.W.Y. Design Chemical Exchange Saturation Transfer Contrast Agents and Nanocarriers for Imaging Proton Exchange in Vivo. ACS Nano 2024, 18, 33775–33791. [CrossRef]
- Yu, Q.; Yu, Z.; Yang, L.; Yuan, Y. Recent progress on diaCEST MRI for tumor imaging. JUSTC 2023, 53, 0601–0601-14. [CrossRef]
- Woods, M.; Woessner, D.E.; Sherry, A.D. Paramagnetic lanthanide complexes as PARACEST agents for medical imaging. Chem. Soc. Rev. 2006, 35, 500–511. [CrossRef]
- Aime, S.; Barge, A.; Delli Castelli, D.; Fedeli, F.; Mortillaro, A.; Nielsen, F. U.; Terreno, E. Paramagnetic Lanthanide(III) Complexes as pH-Sensitive Chemical Exchange Saturation Transfer (CEST) Contrast Agents for MRI Applications. Magn. Reson. Med. 2002, 47, 639-648.
- Zhang, J.; Yuan, Y.; Gao, M.; Han, Z.; Chu, C.; Li, Y.; van Zijl, P.C.M.; Ying, M.; Bulte, J.W.M.; Liu, G. Carbon Dots as a New Class of Diamagnetic Chemical Exchange Saturation Transfer (diaCEST) MRI Contrast Agents. Angew. Chem. Int. Ed. Engl. 2019, 58, 9871–9875. [CrossRef]
- Pandey, S.; Keerthana, A.C.; Madhulika, S.; Prasad, P.; Peruncheralathan, S.; Ghosh, A. Hydrothermal treatment as a means of improving the solubility and enhancing the diaCEST MRI contrast efficiency. New J. Chem. 2022, 46, 14888–14893. [CrossRef]
- Pandey, S.; Ghosh, R.; Ghosh, A. Preparation of Hydrothermal Carbon Quantum Dots as a Contrast Amplifying Technique for the diaCEST MRI Contrast Agents. ACS Omega 2022, 7, 33934–33941. [CrossRef]
- Ghosal, K.; Ghosh, A. Carbon dots: The next generation platform for biomedical applications. Mater. Sci. Eng. C 2019, 96, 887–903. [CrossRef]
- Ding, H.; Xiao, T.; Ren, F.; Qiu, Y.; Shen, Z.; Chen, X.; Mijowska, E.; Chen, H. Carbon-based nanodots for biomedical applications and clinical transformation prospects. BMEMat 2024, 2. [CrossRef]
- Wang, B.; Lu, S. The light of carbon dots: From mechanism to applications. Matter 2022, 5, 110–149. [CrossRef]
- Xiao, Y.-D.; Paudel, R.; Liu, J.; Ma, C.; Zhang, Z.-S.; Zhou, S.-K. MRI contrast agents: Classification and application (Review). Int. J. Mol. Med. 2016, 38, 1319–1326. [CrossRef]
- Sieber, M.A.; Lengsfeld, P.; Walter, J.; Schirmer, H.; Frenzel, T.; Siegmund, F.; Weinmann, H.; Pietsch, H. Gadolinium-based contrast agents and their potential role in the pathogenesis of nephrogenic systemic fibrosis: The role of excess ligand. J. Magn. Reson. Imaging 2008, 27, 955–962. [CrossRef]
- Geppert, M.; Himly, M. Iron Oxide Nanoparticles in Bioimaging – An Immune Perspective. Front. Immunol. 2021, 12. [CrossRef]
Figure 1.
The annual number of research articles related to CDs. (The statistical data is from the Scopus database up to February 2025).
Figure 1.
The annual number of research articles related to CDs. (The statistical data is from the Scopus database up to February 2025).
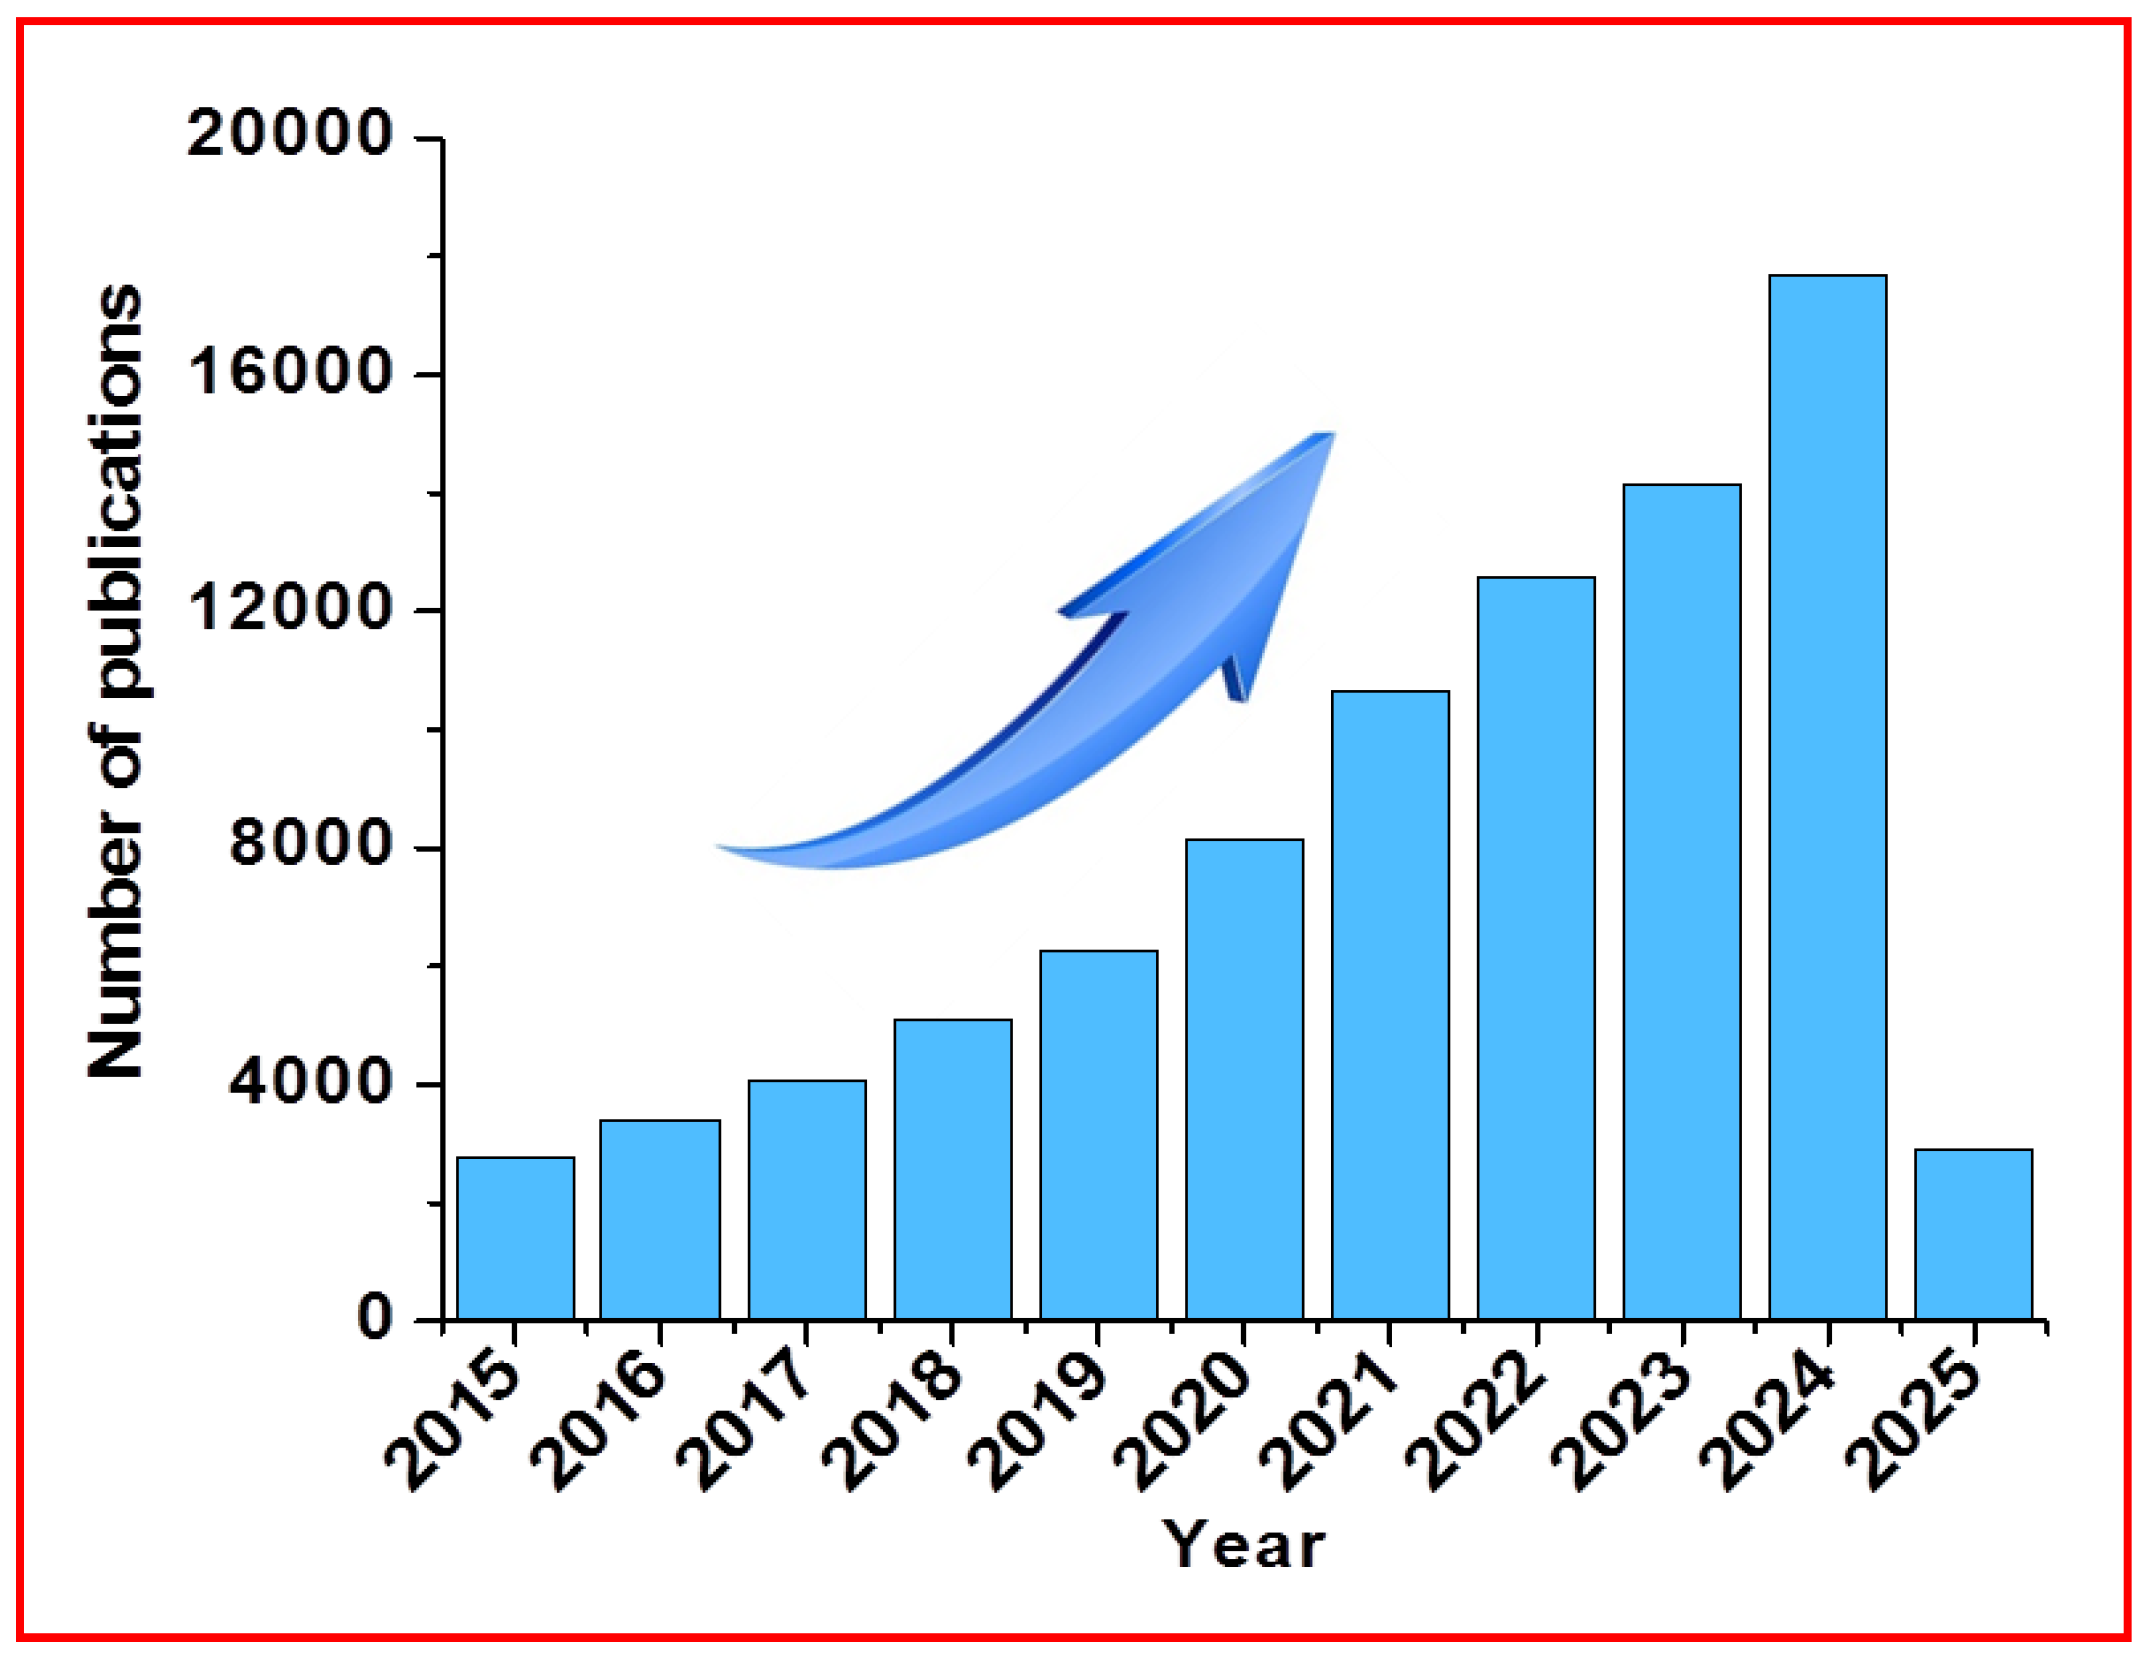
Figure 2.
Schematic representation of ‘‘top-down” and ‘‘bottom-up” approaches in CD syntheses.
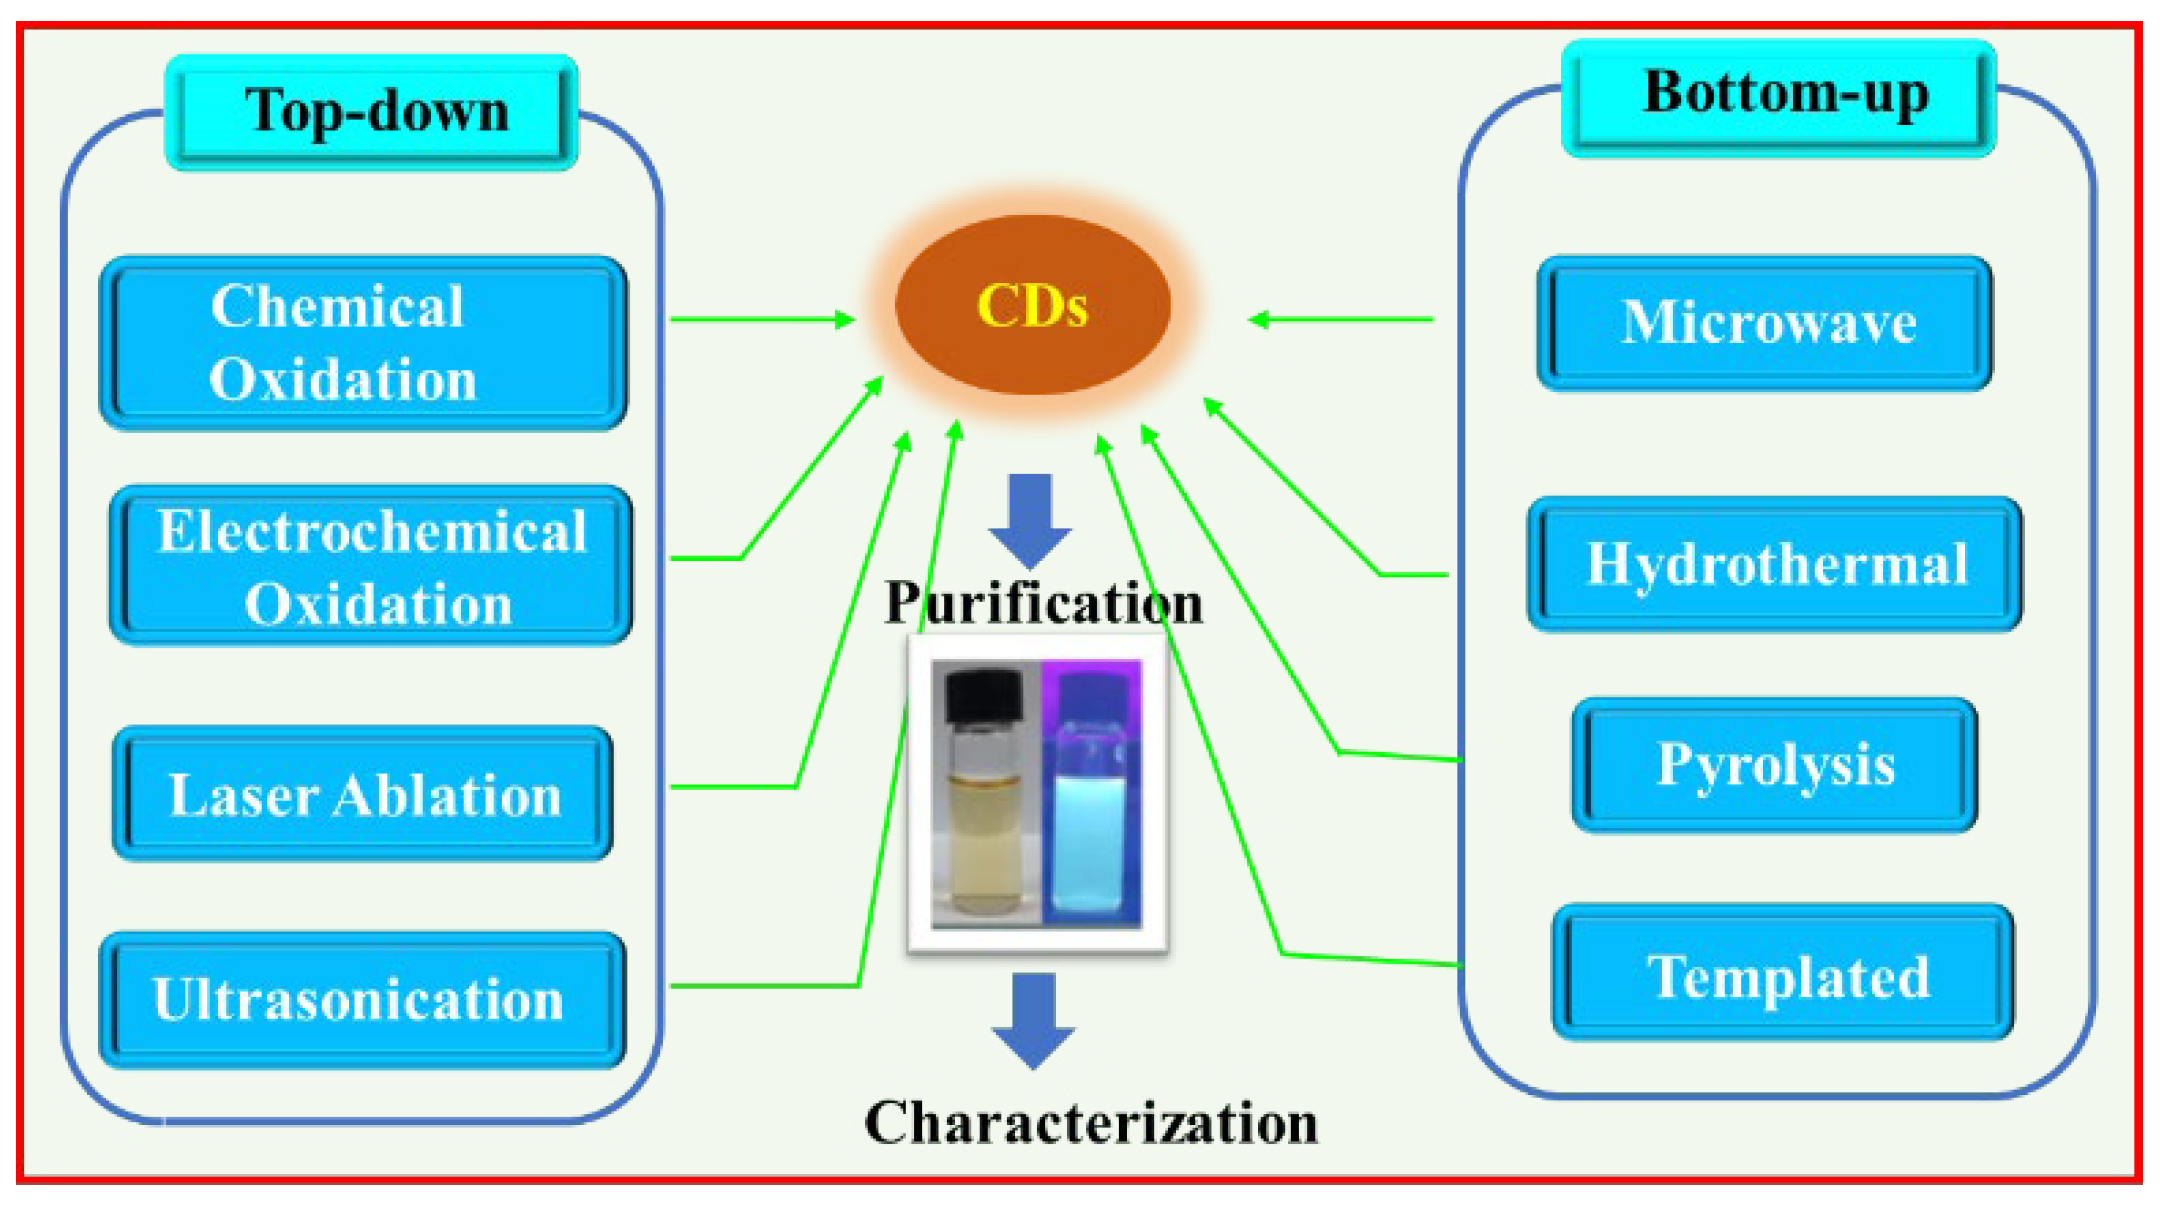
Figure 3.
Schematic representation of top-down approaches of CD synthesis: (a) chemical oxidation, (b) electrochemical oxidation, (c), laser ablation, and (d) ultrasonication. Reproduced with permission [25].
Figure 3.
Schematic representation of top-down approaches of CD synthesis: (a) chemical oxidation, (b) electrochemical oxidation, (c), laser ablation, and (d) ultrasonication. Reproduced with permission [25].
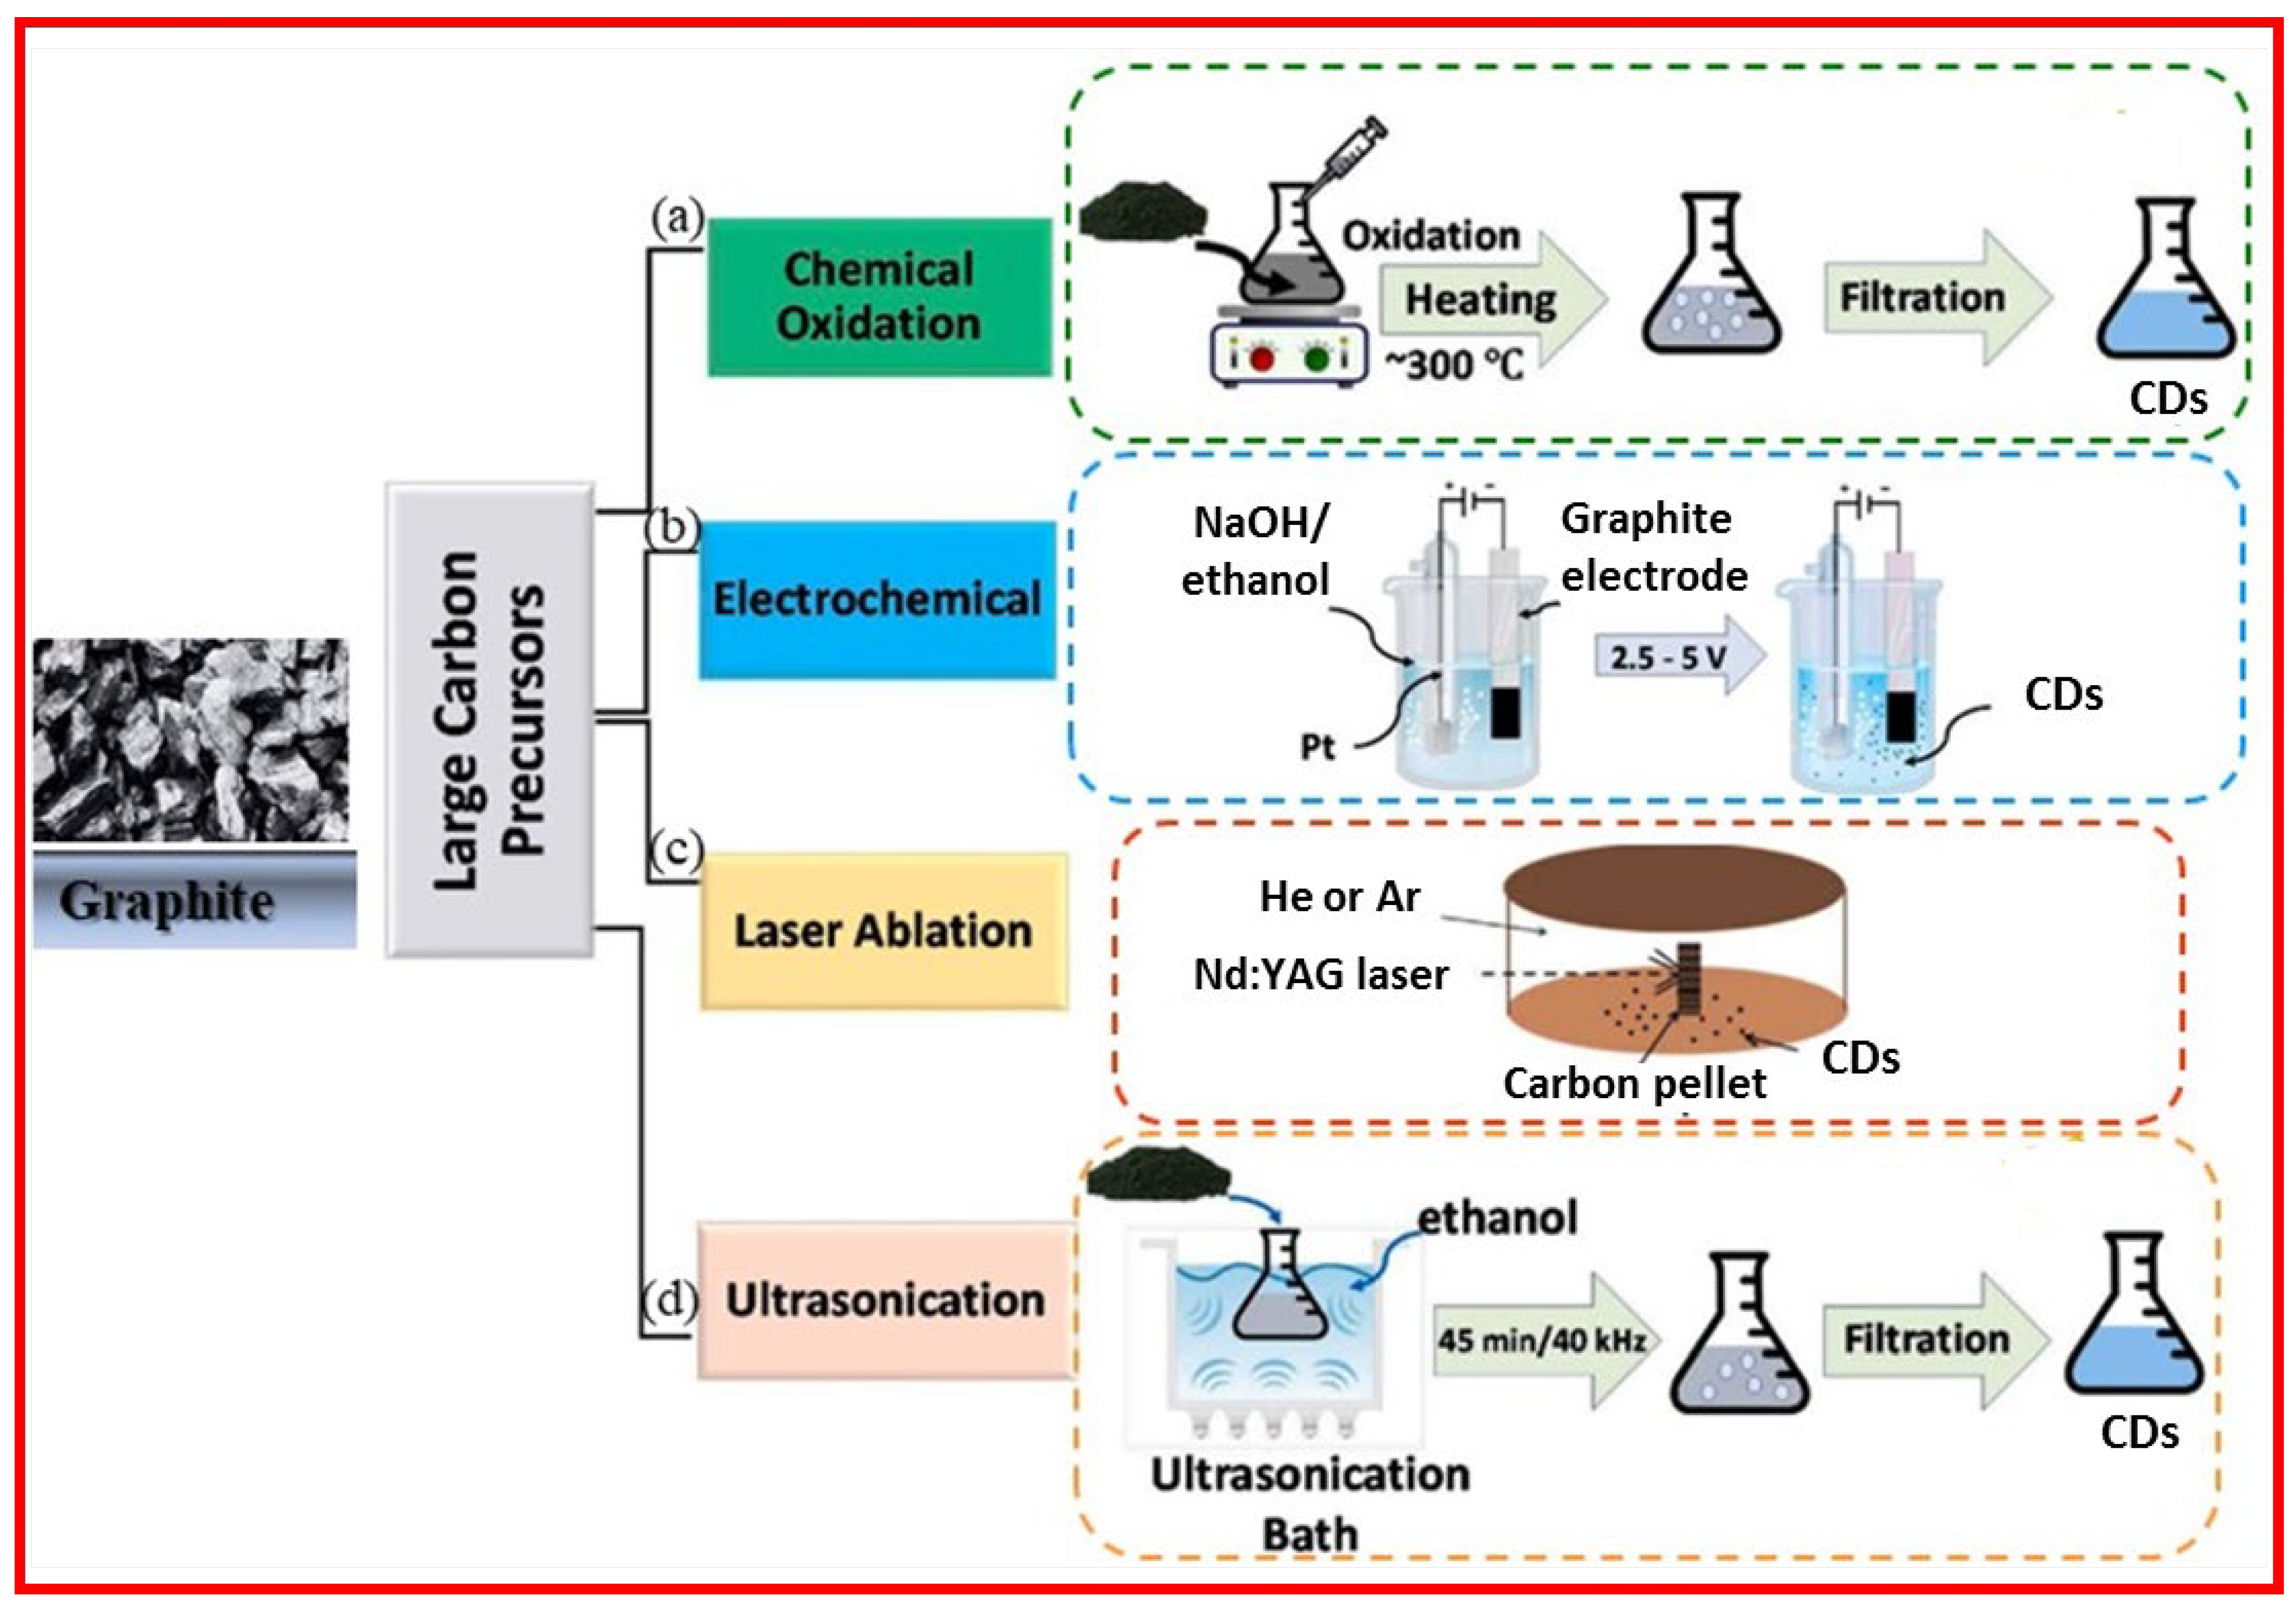
Figure 4.
TEM images and size distributions of CDs prepared from (a) CAC, (b) WAC, and (c) CAC precursors. Reproduced with permission [27].
Figure 4.
TEM images and size distributions of CDs prepared from (a) CAC, (b) WAC, and (c) CAC precursors. Reproduced with permission [27].
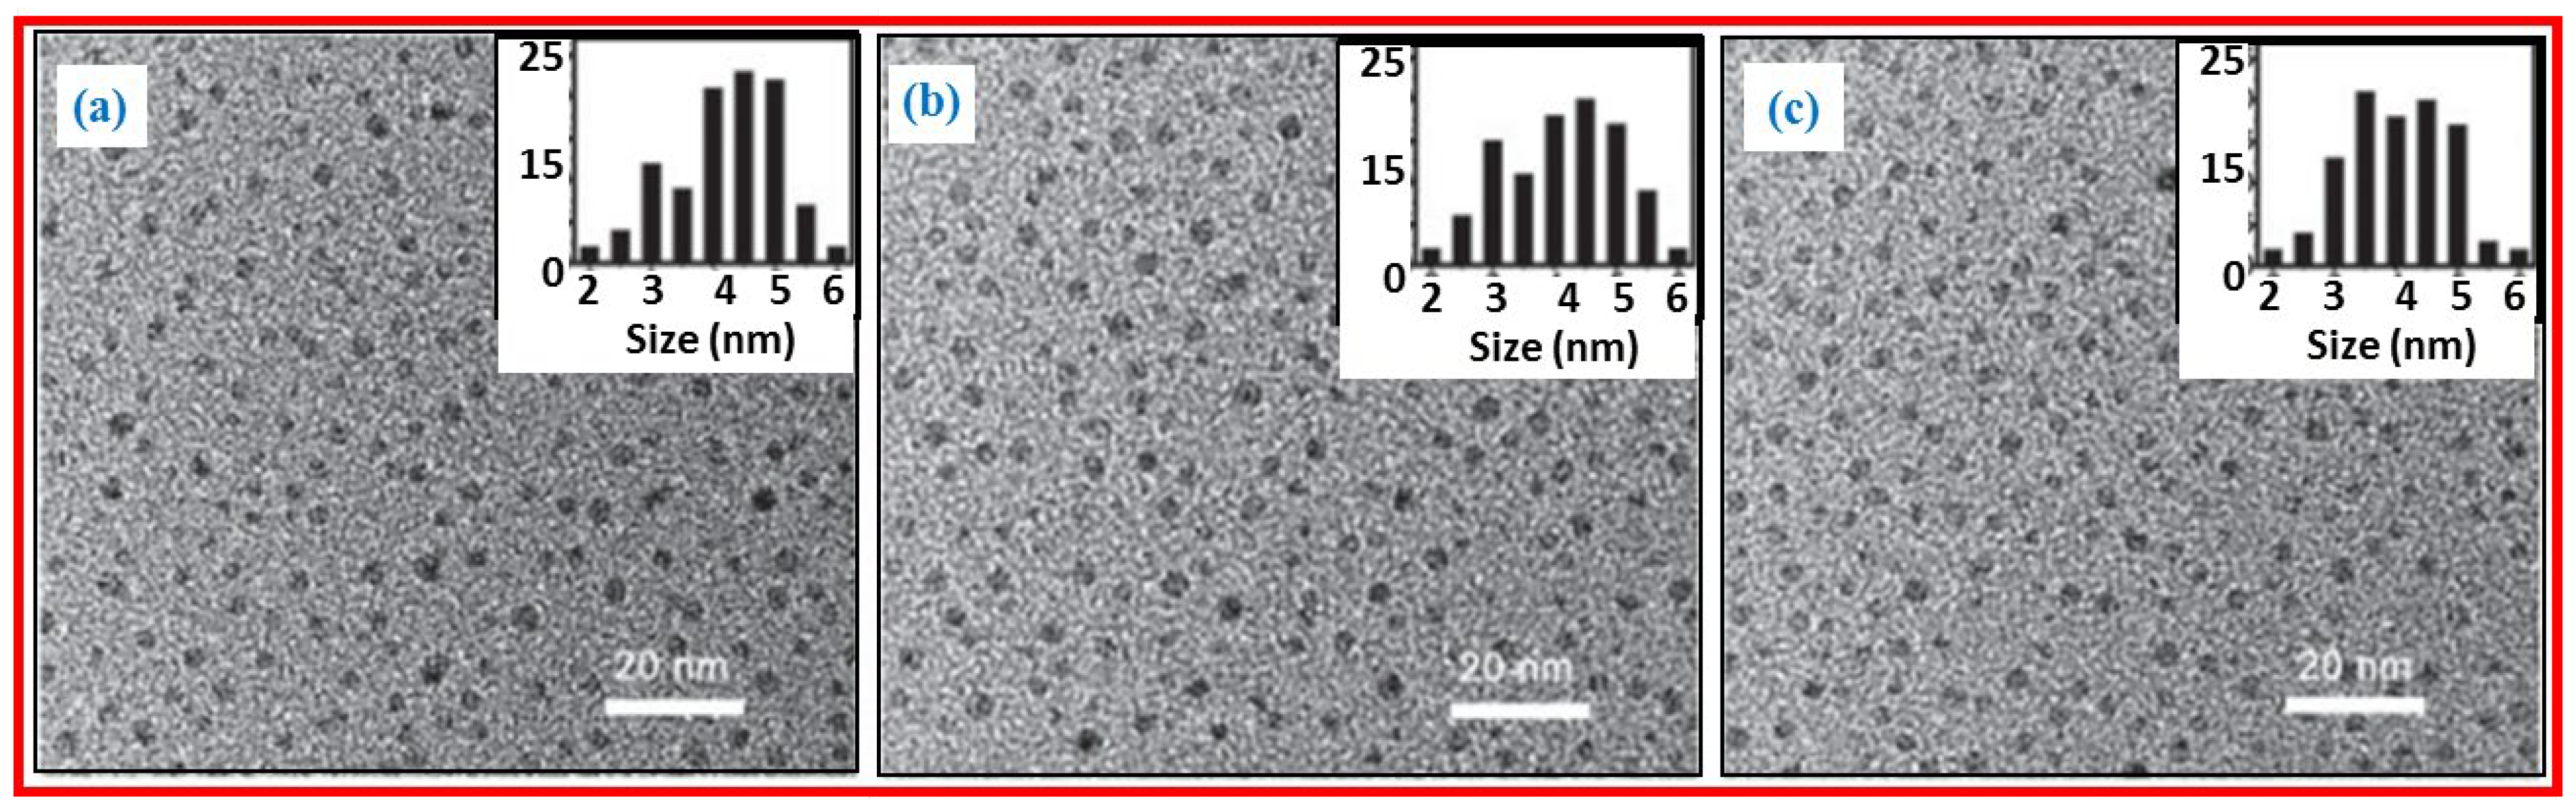
Figure 5.
(a) TEM and HRTEM images and (b) size distribution and photograph of colorless CDs. (c) HRTEM and TEM images and (d) size distribution and photograph of bright-yellow CDs. Reproduced with permission [30].
Figure 5.
(a) TEM and HRTEM images and (b) size distribution and photograph of colorless CDs. (c) HRTEM and TEM images and (d) size distribution and photograph of bright-yellow CDs. Reproduced with permission [30].
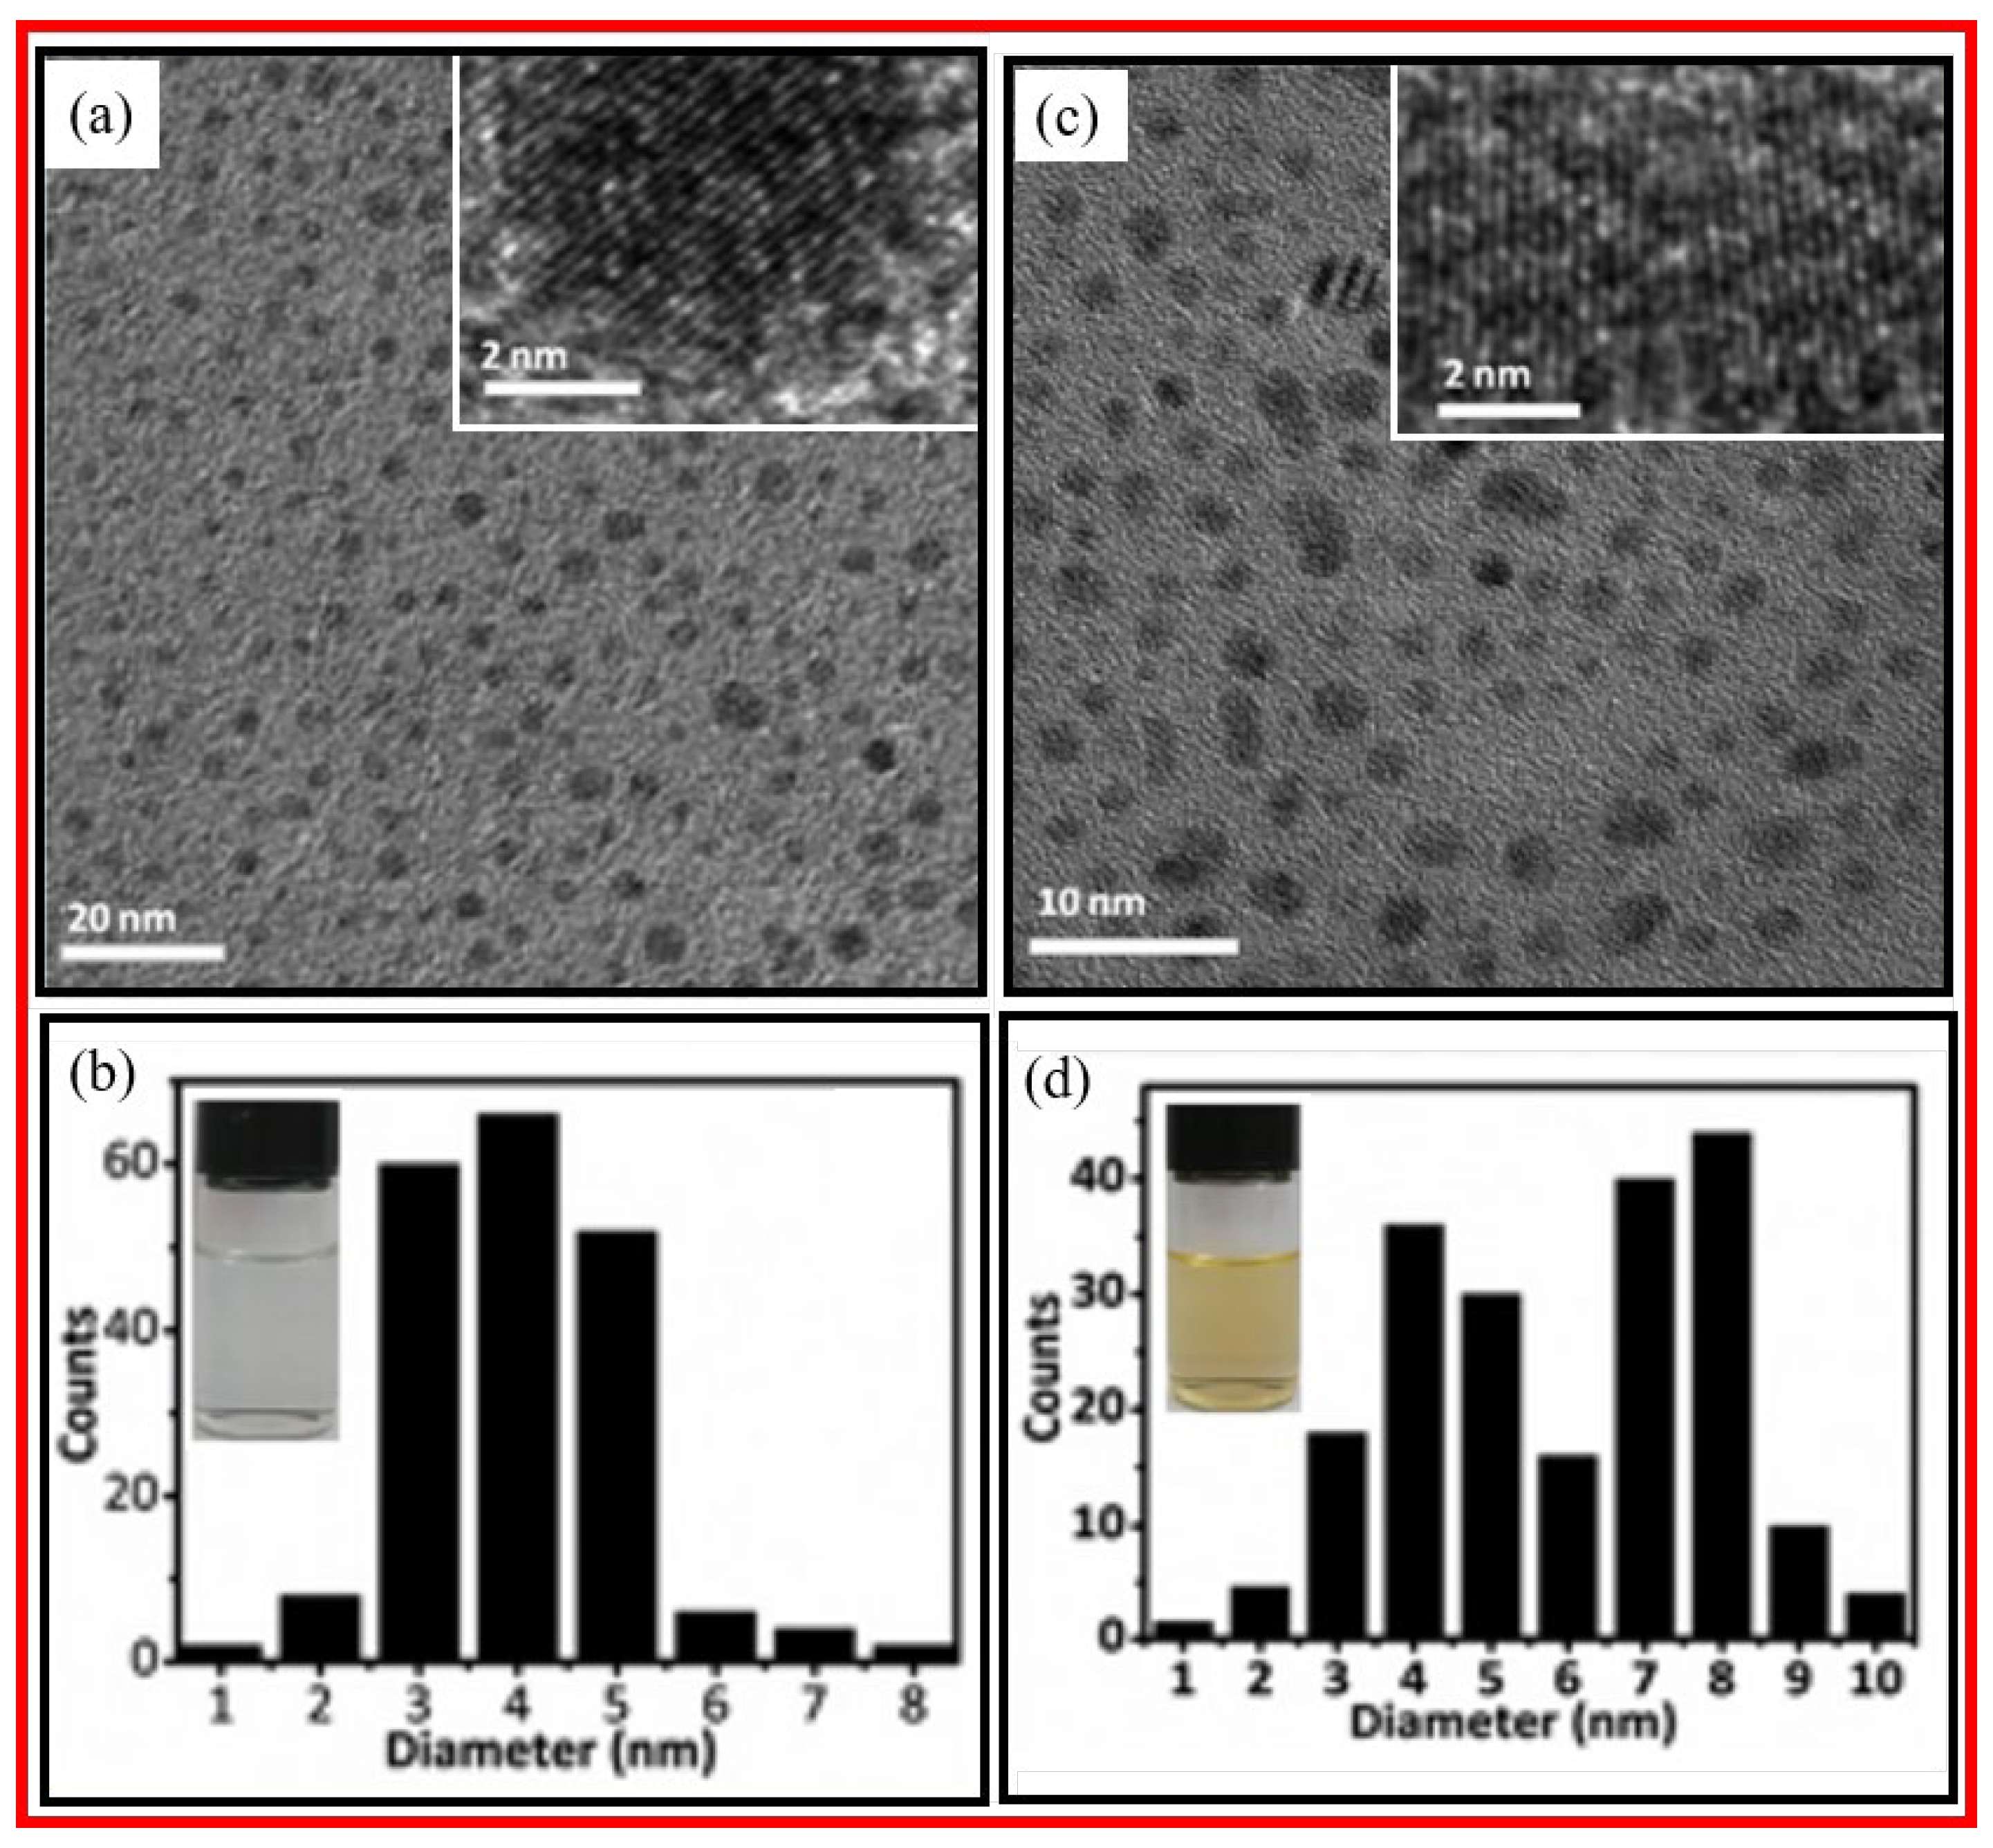
Figure 6.
HRTEM images of CDs prepared using (a) 0.3, (b) 0.9, and (c) 1.5 ms laser pulse widths, respectively. (d)‒(f) The corresponding size distributions. Reproduced with permission [34]. “Interface” (as labeled with arrows) indicates boundaries between CDs.
Figure 6.
HRTEM images of CDs prepared using (a) 0.3, (b) 0.9, and (c) 1.5 ms laser pulse widths, respectively. (d)‒(f) The corresponding size distributions. Reproduced with permission [34]. “Interface” (as labeled with arrows) indicates boundaries between CDs.
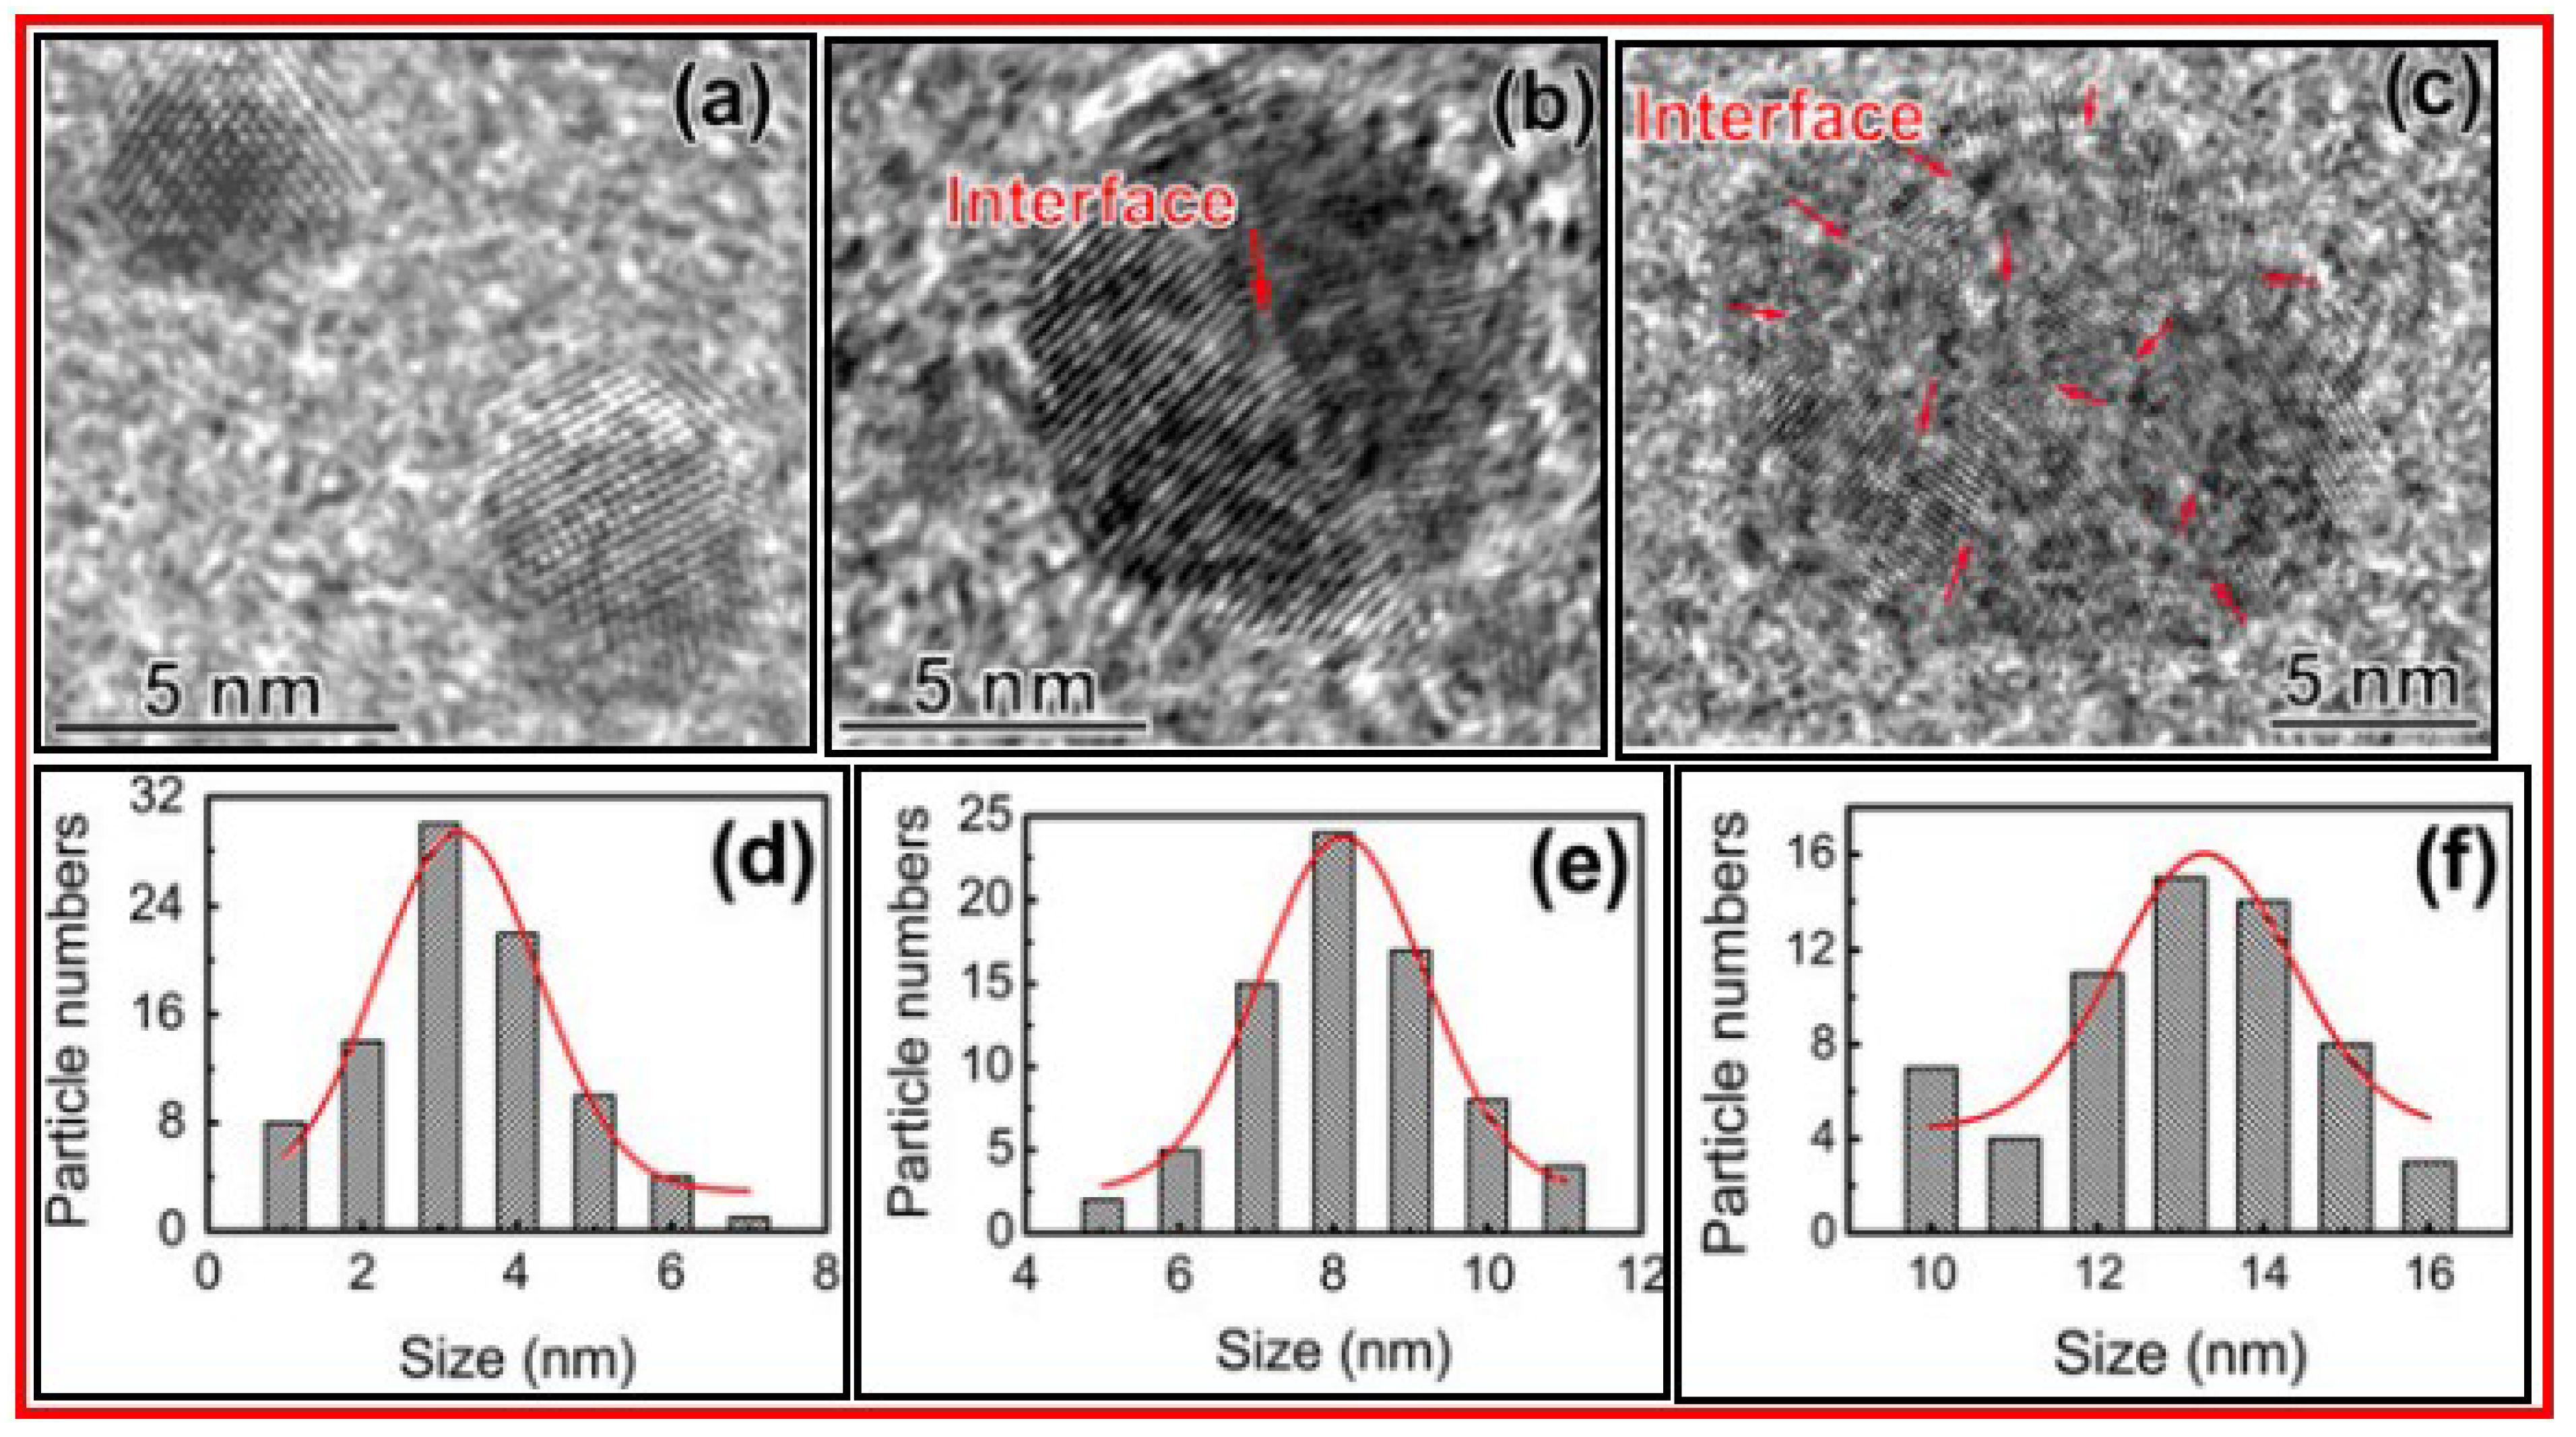
Figure 7.
(a) TEM and HRTEM images and (b) size distribution of CDs. (c) TEM and HRTEM images and (d) size distribution of N-CDs. Reproduced with permission [36].
Figure 7.
(a) TEM and HRTEM images and (b) size distribution of CDs. (c) TEM and HRTEM images and (d) size distribution of N-CDs. Reproduced with permission [36].
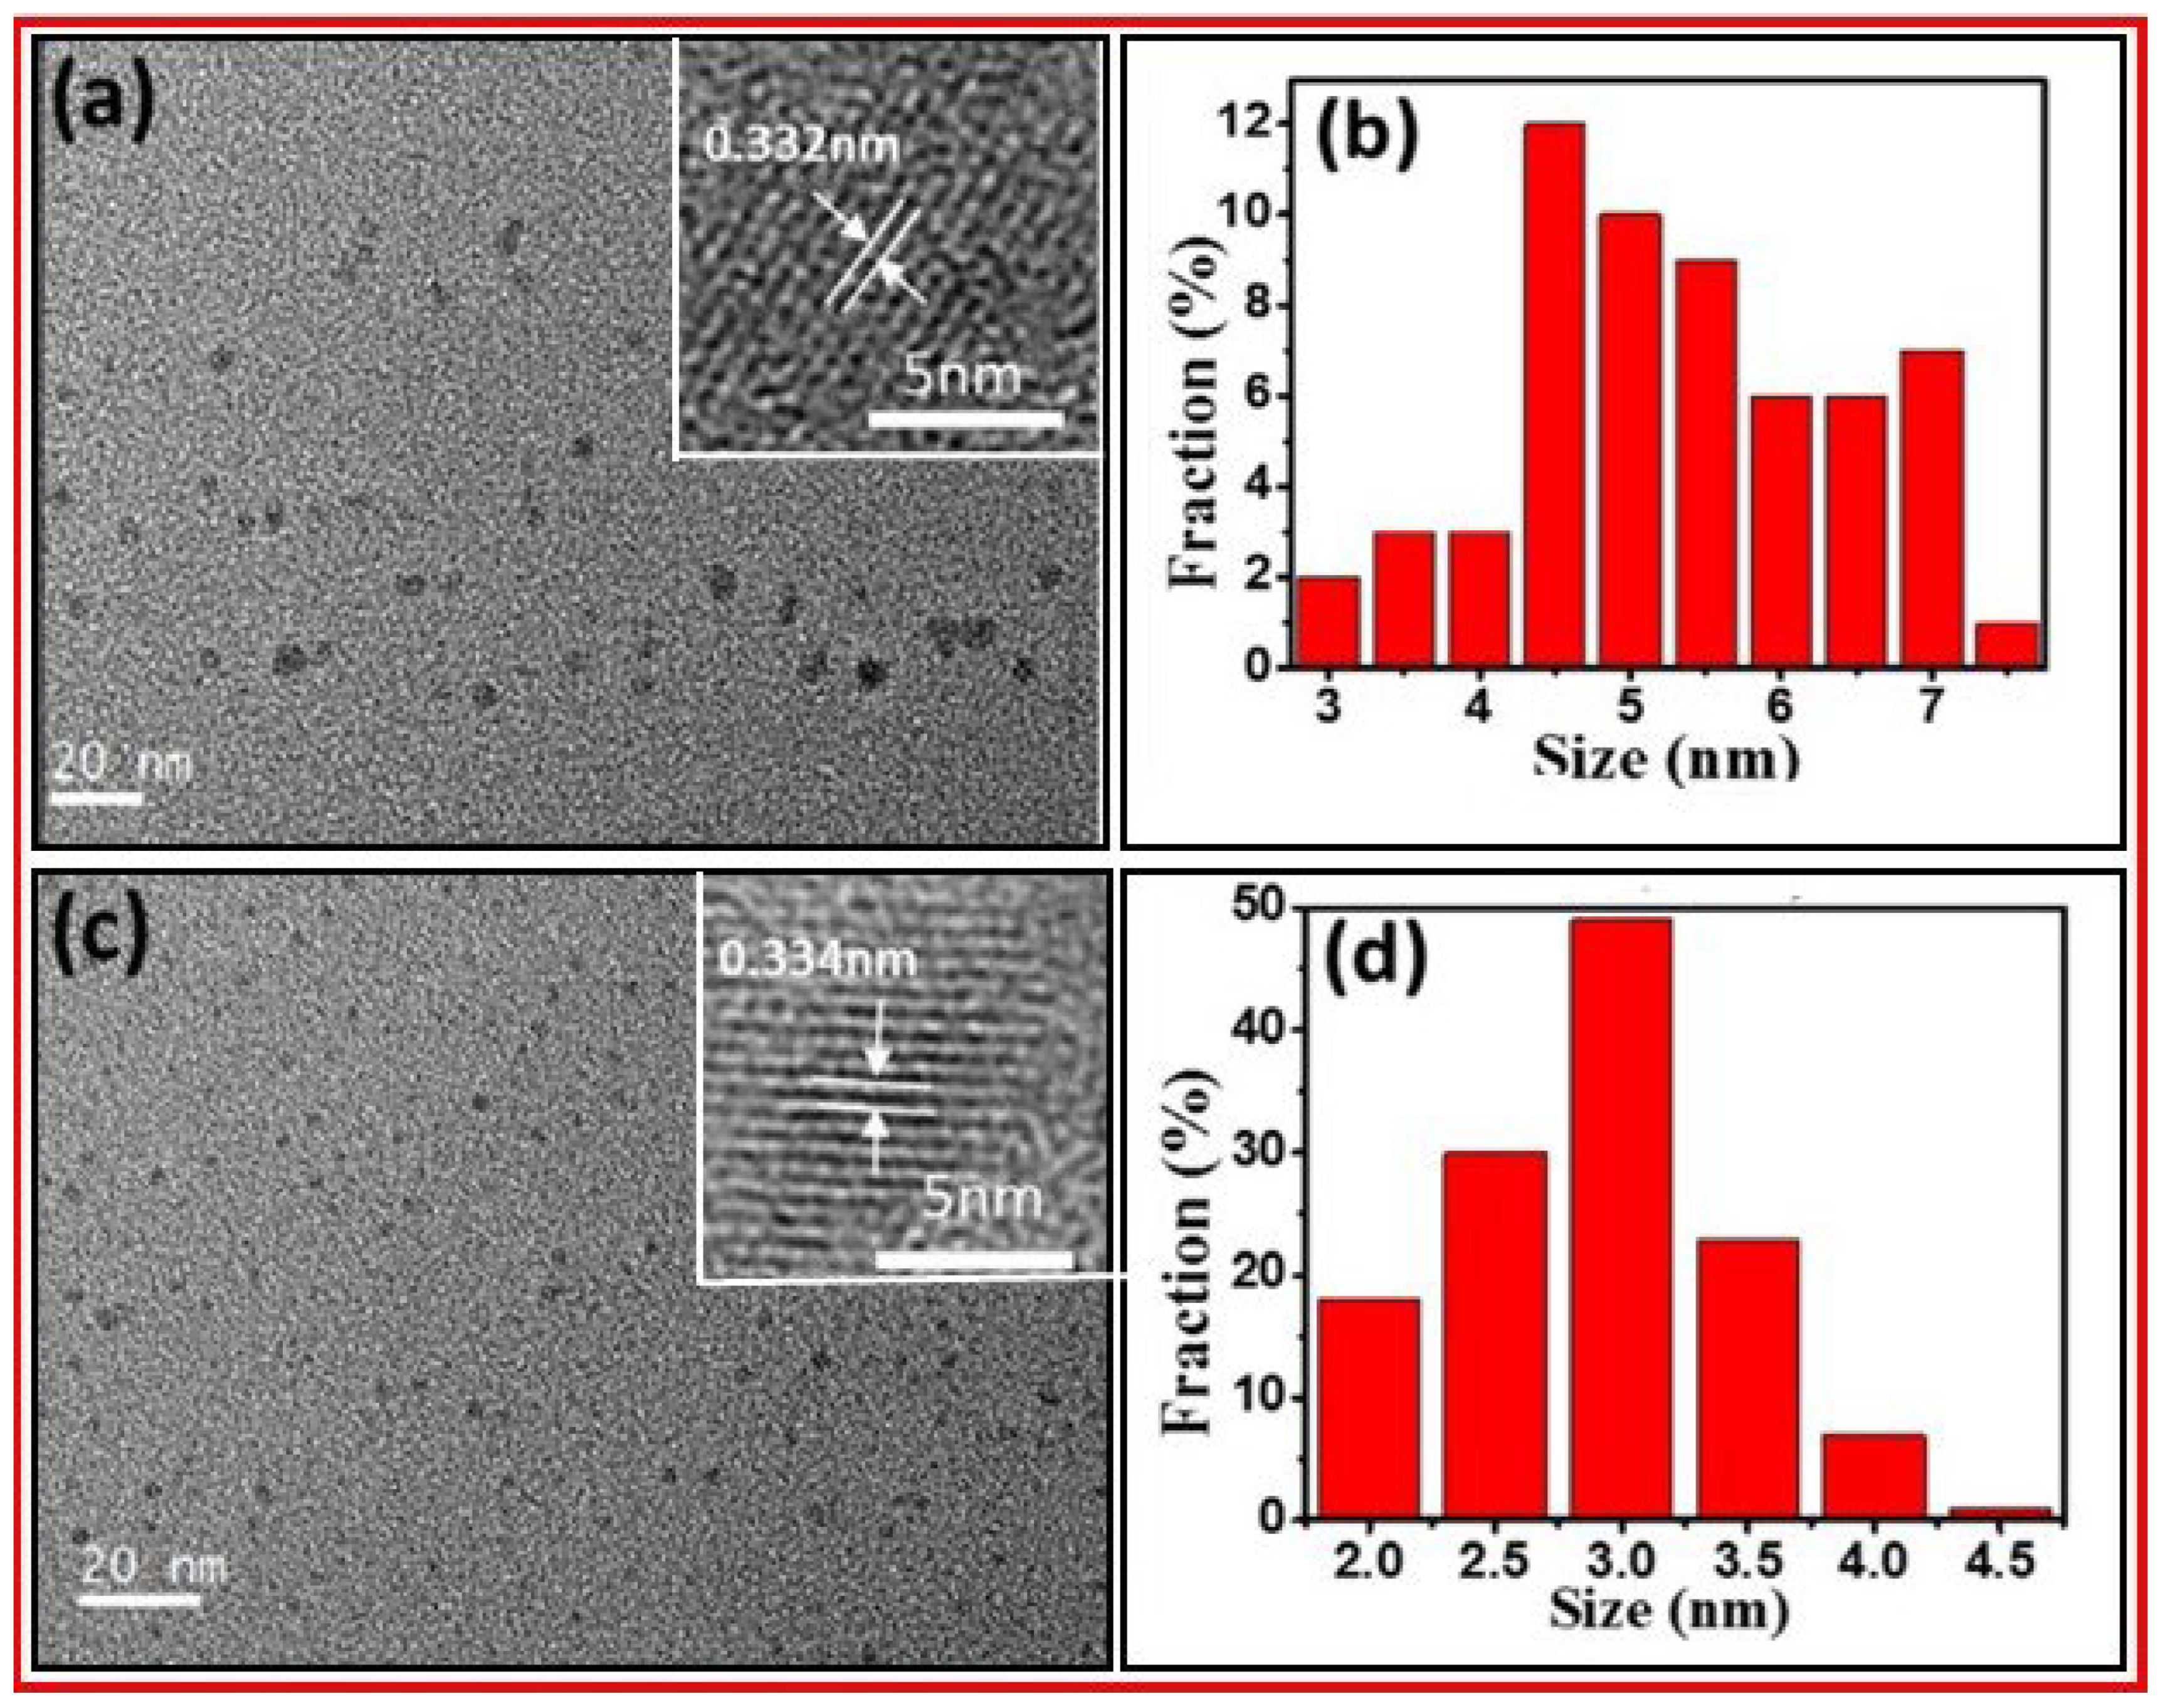
Figure 8.
Schematic of ‘‘bottom-up” approaches to prepare CDs: (a) microwave [25], (b) hydrothermal [25], (c) pyrolysis [25], and (d) templated methods: TMB = 1,3,5-trimethylbenzene; TEOS = tetraethoxysilane; P123 = copolymer Pluronic P123; OMS = ordered mesoporous silica [39].
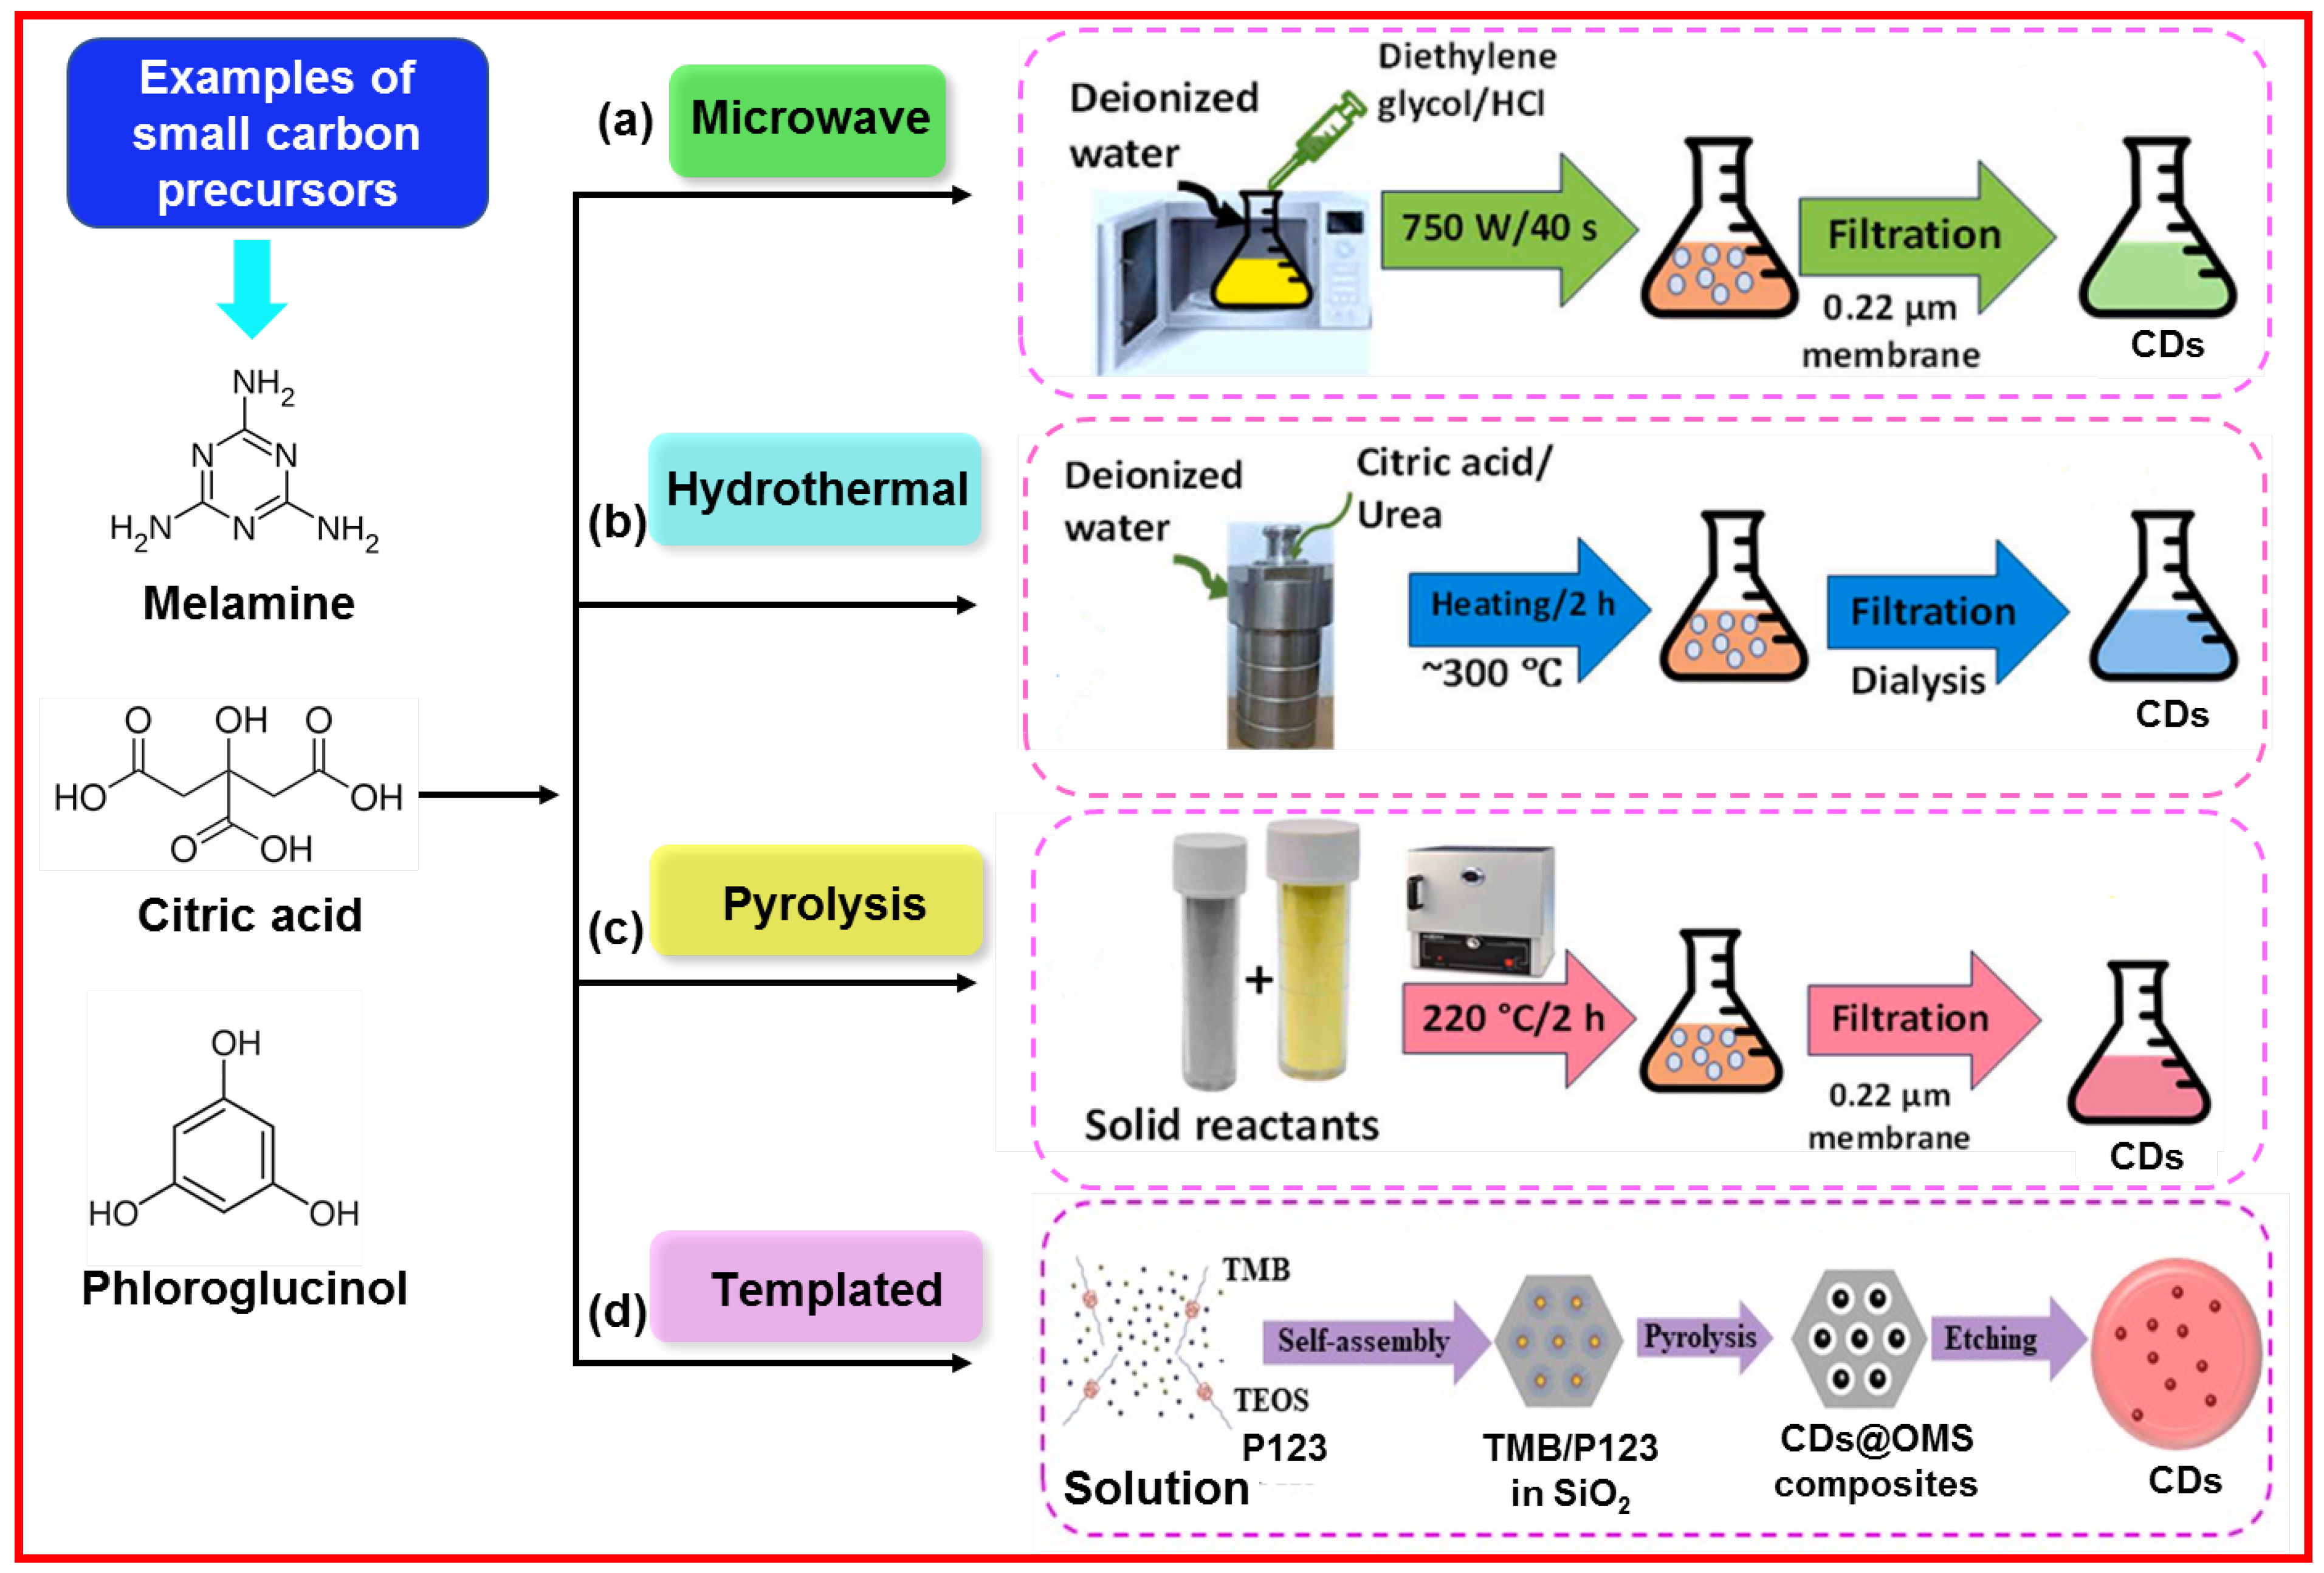
Figure 9.
(a) TEM image and size distribution, and (b) HRTEM image and lattice fringes of CDs. Reproduced with permission [43].
Figure 9.
(a) TEM image and size distribution, and (b) HRTEM image and lattice fringes of CDs. Reproduced with permission [43].
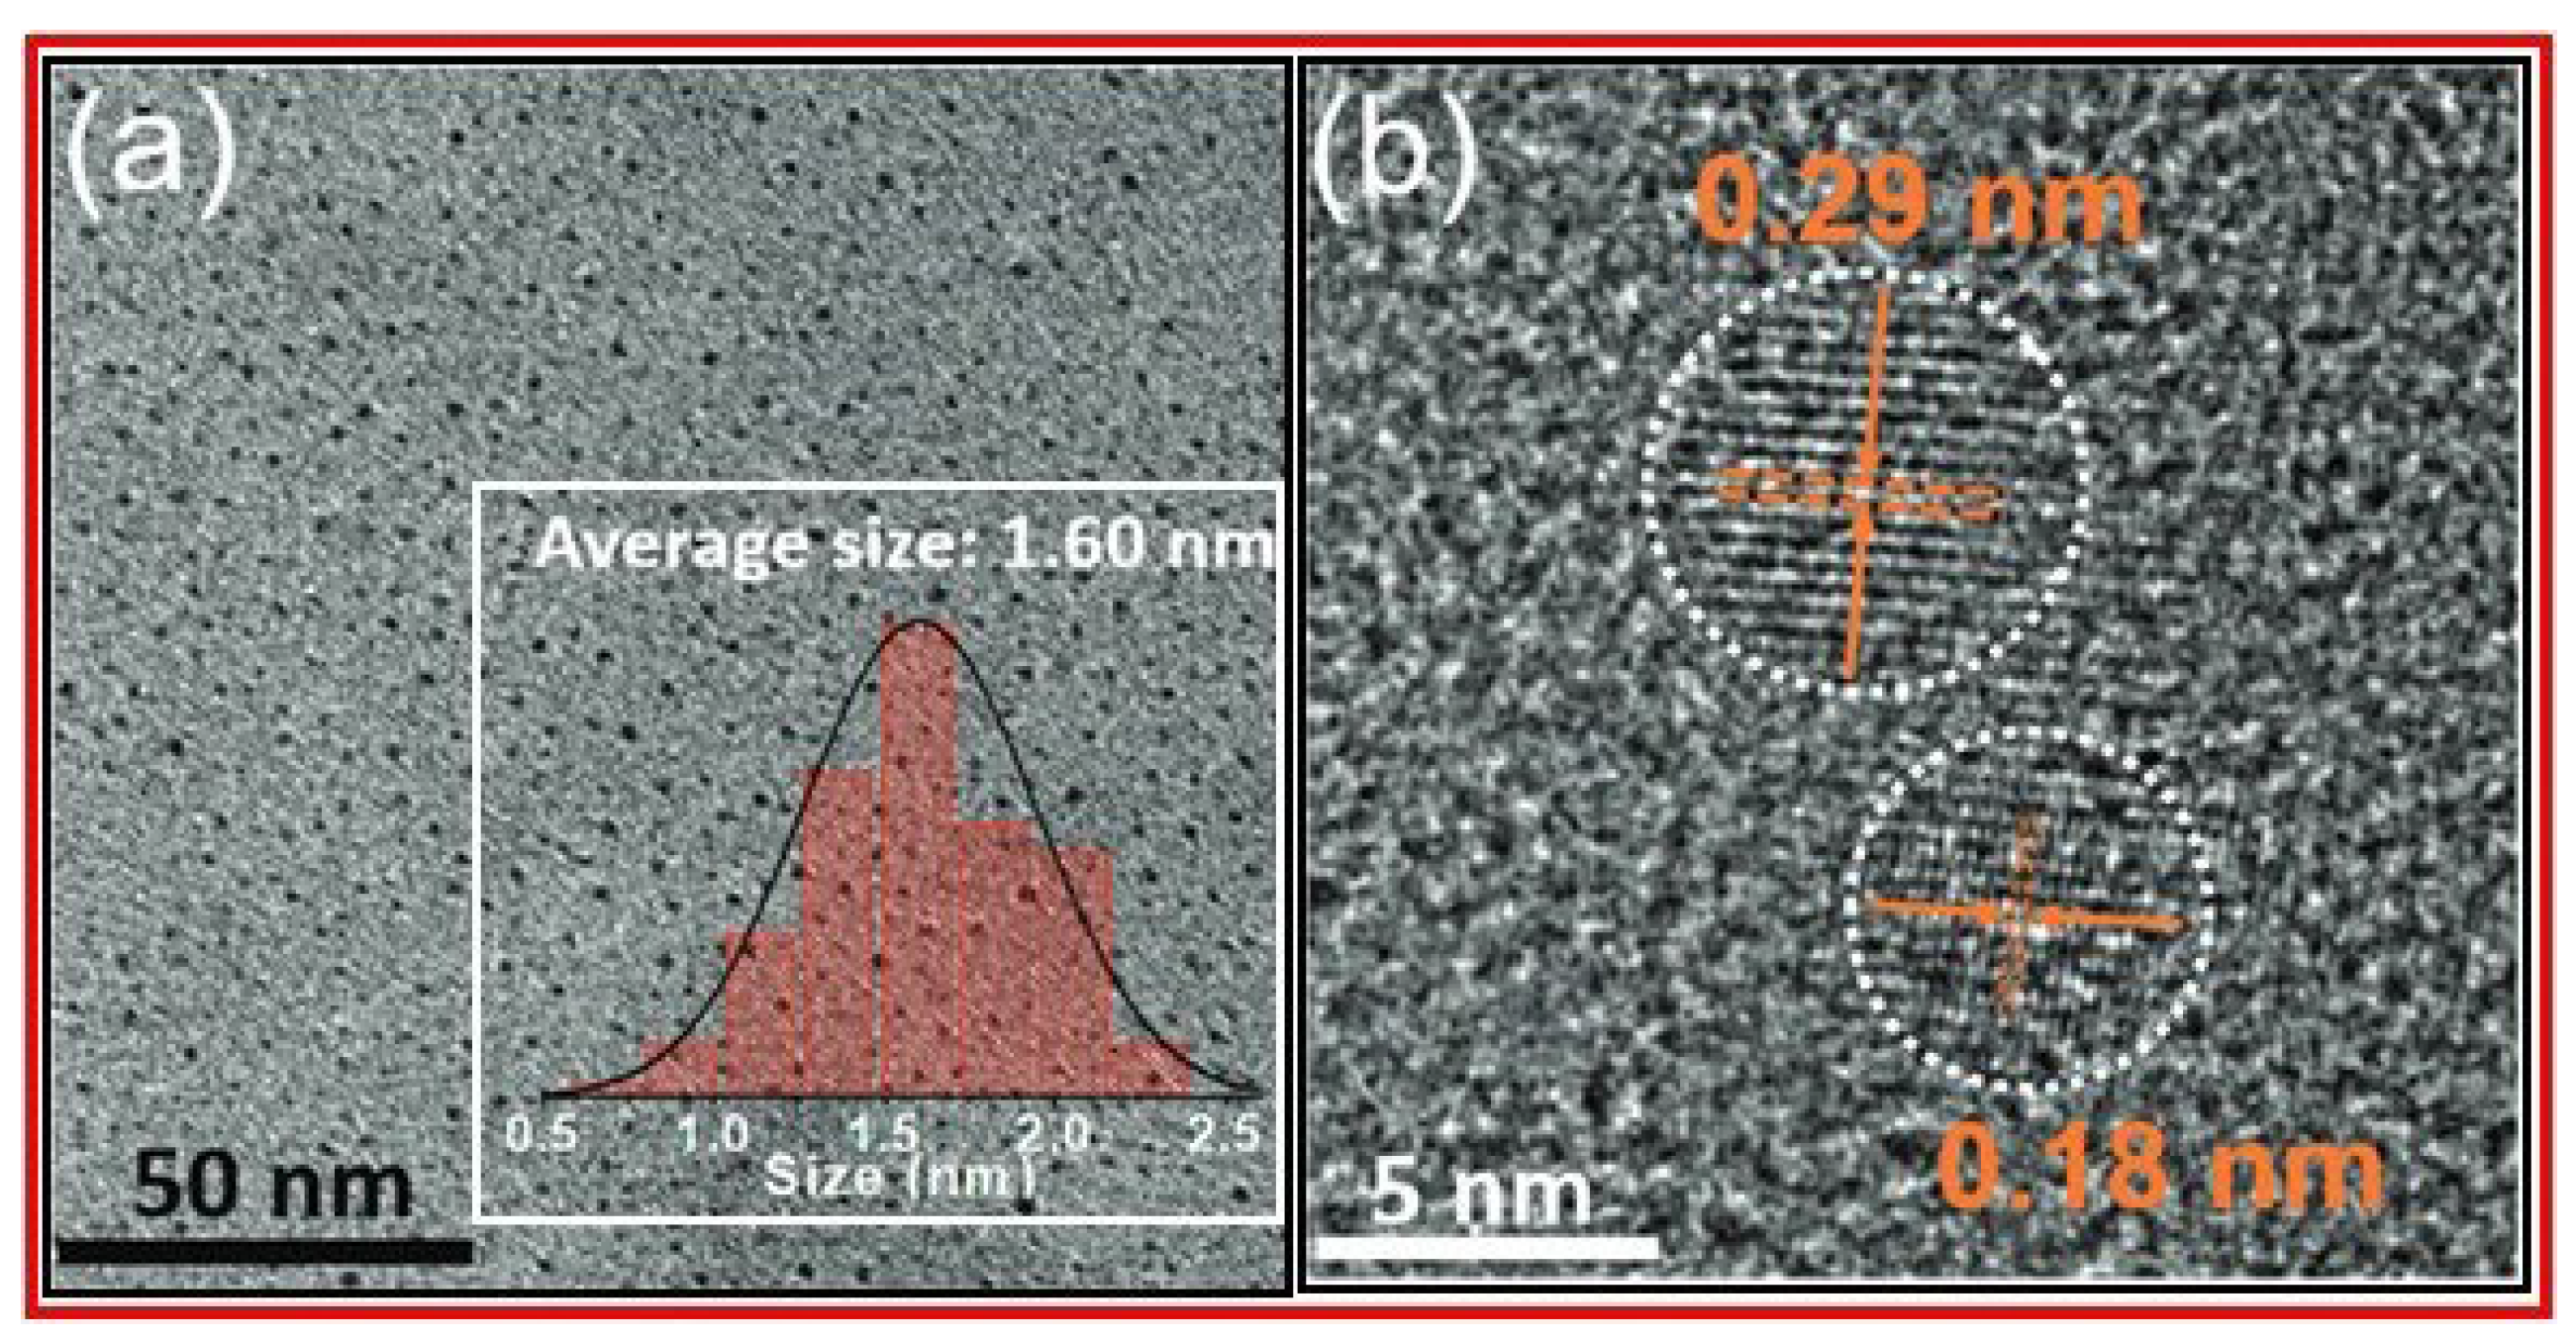
Figure 10.
(a) TEM image and particle size distribution of CDs. (b) HRTEM image and lattice fringes of CDs. Reproduced with permission [48].
Figure 10.
(a) TEM image and particle size distribution of CDs. (b) HRTEM image and lattice fringes of CDs. Reproduced with permission [48].
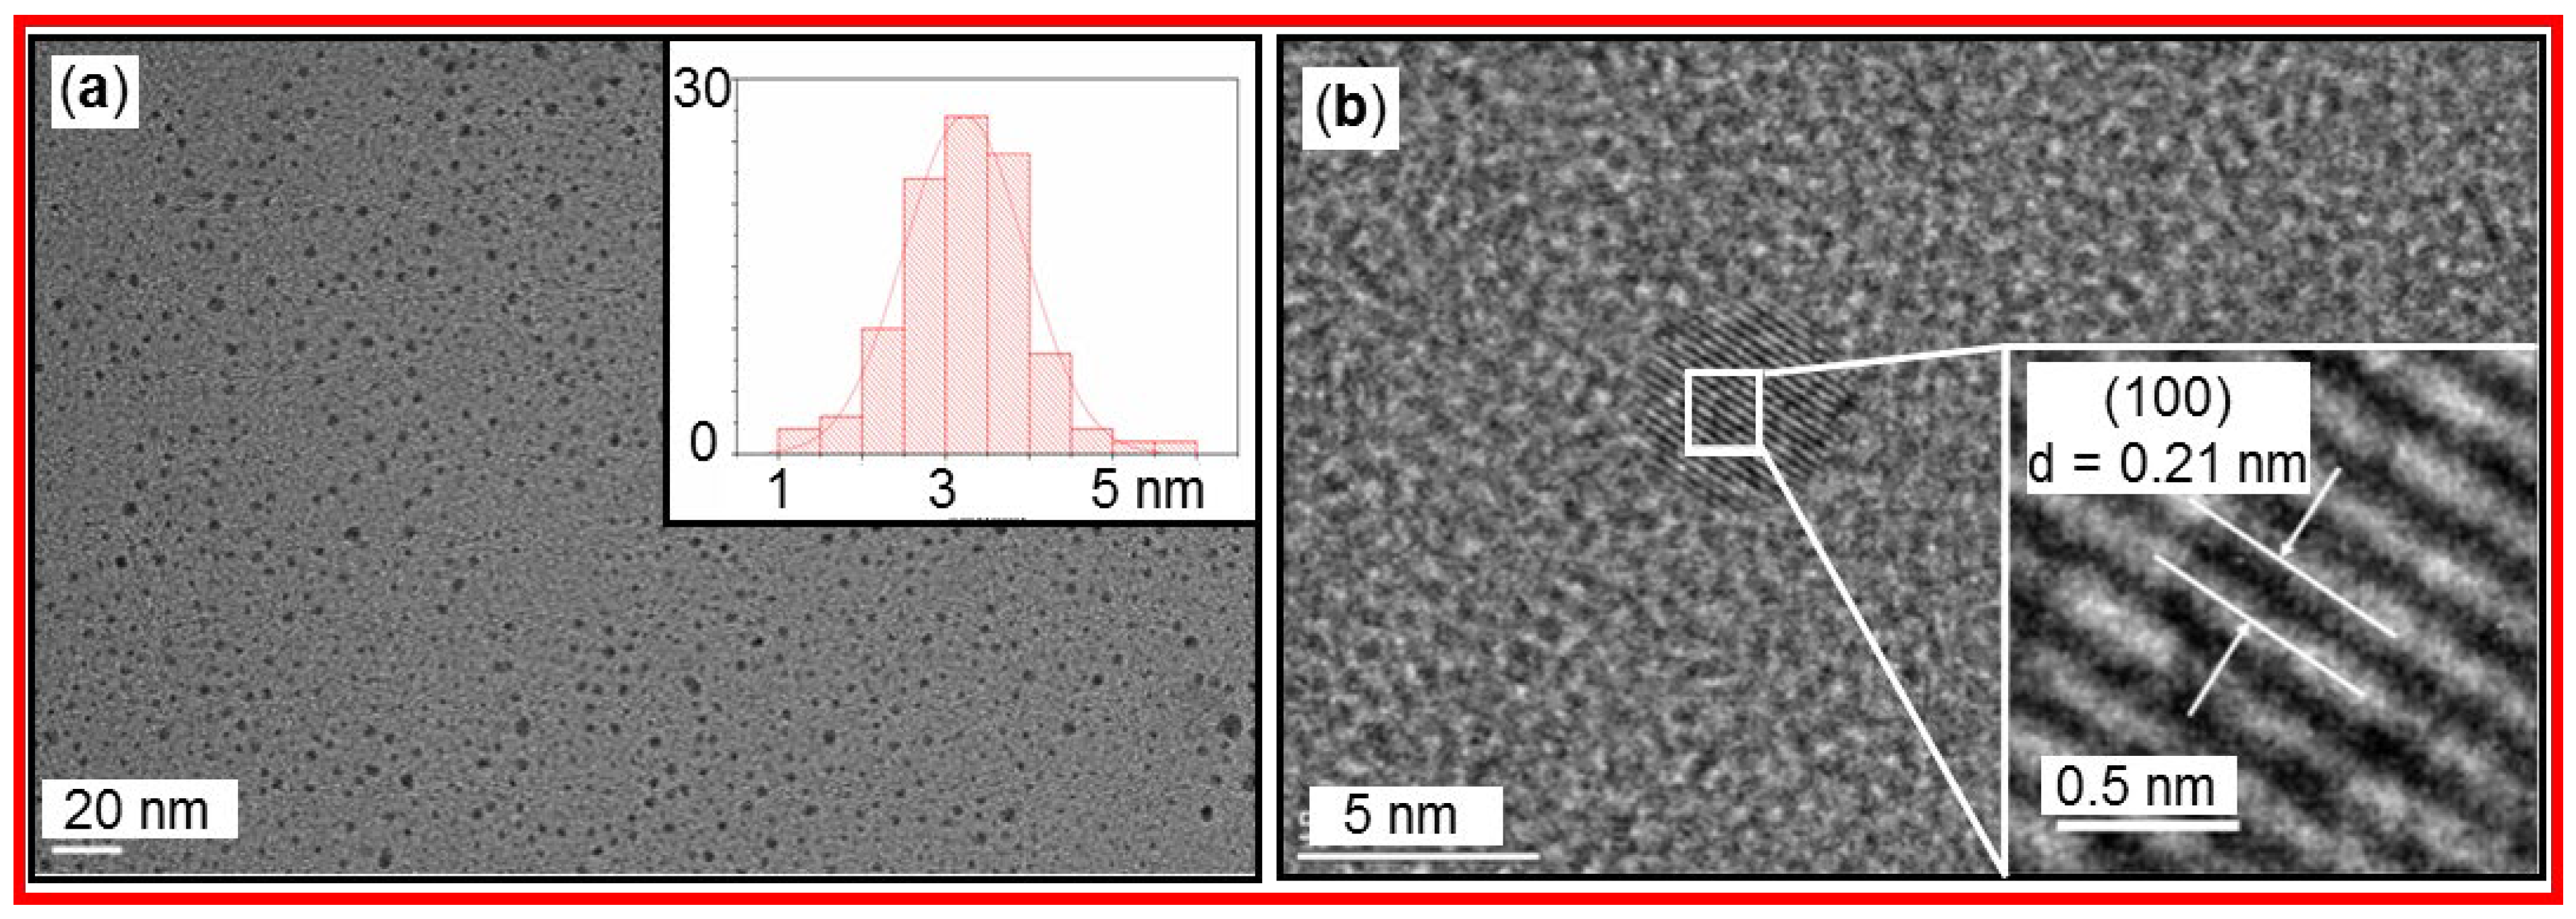
Figure 11.
CDs-1: (a) TEM image with size distribution histogram (inset) and (b) HRTEM image with lattice fringes. CDs-2: (c) TEM image with size distribution histogram (inset) and (d) HRTEM image with lattice fringes. Reproduced with permission [49].
Figure 11.
CDs-1: (a) TEM image with size distribution histogram (inset) and (b) HRTEM image with lattice fringes. CDs-2: (c) TEM image with size distribution histogram (inset) and (d) HRTEM image with lattice fringes. Reproduced with permission [49].
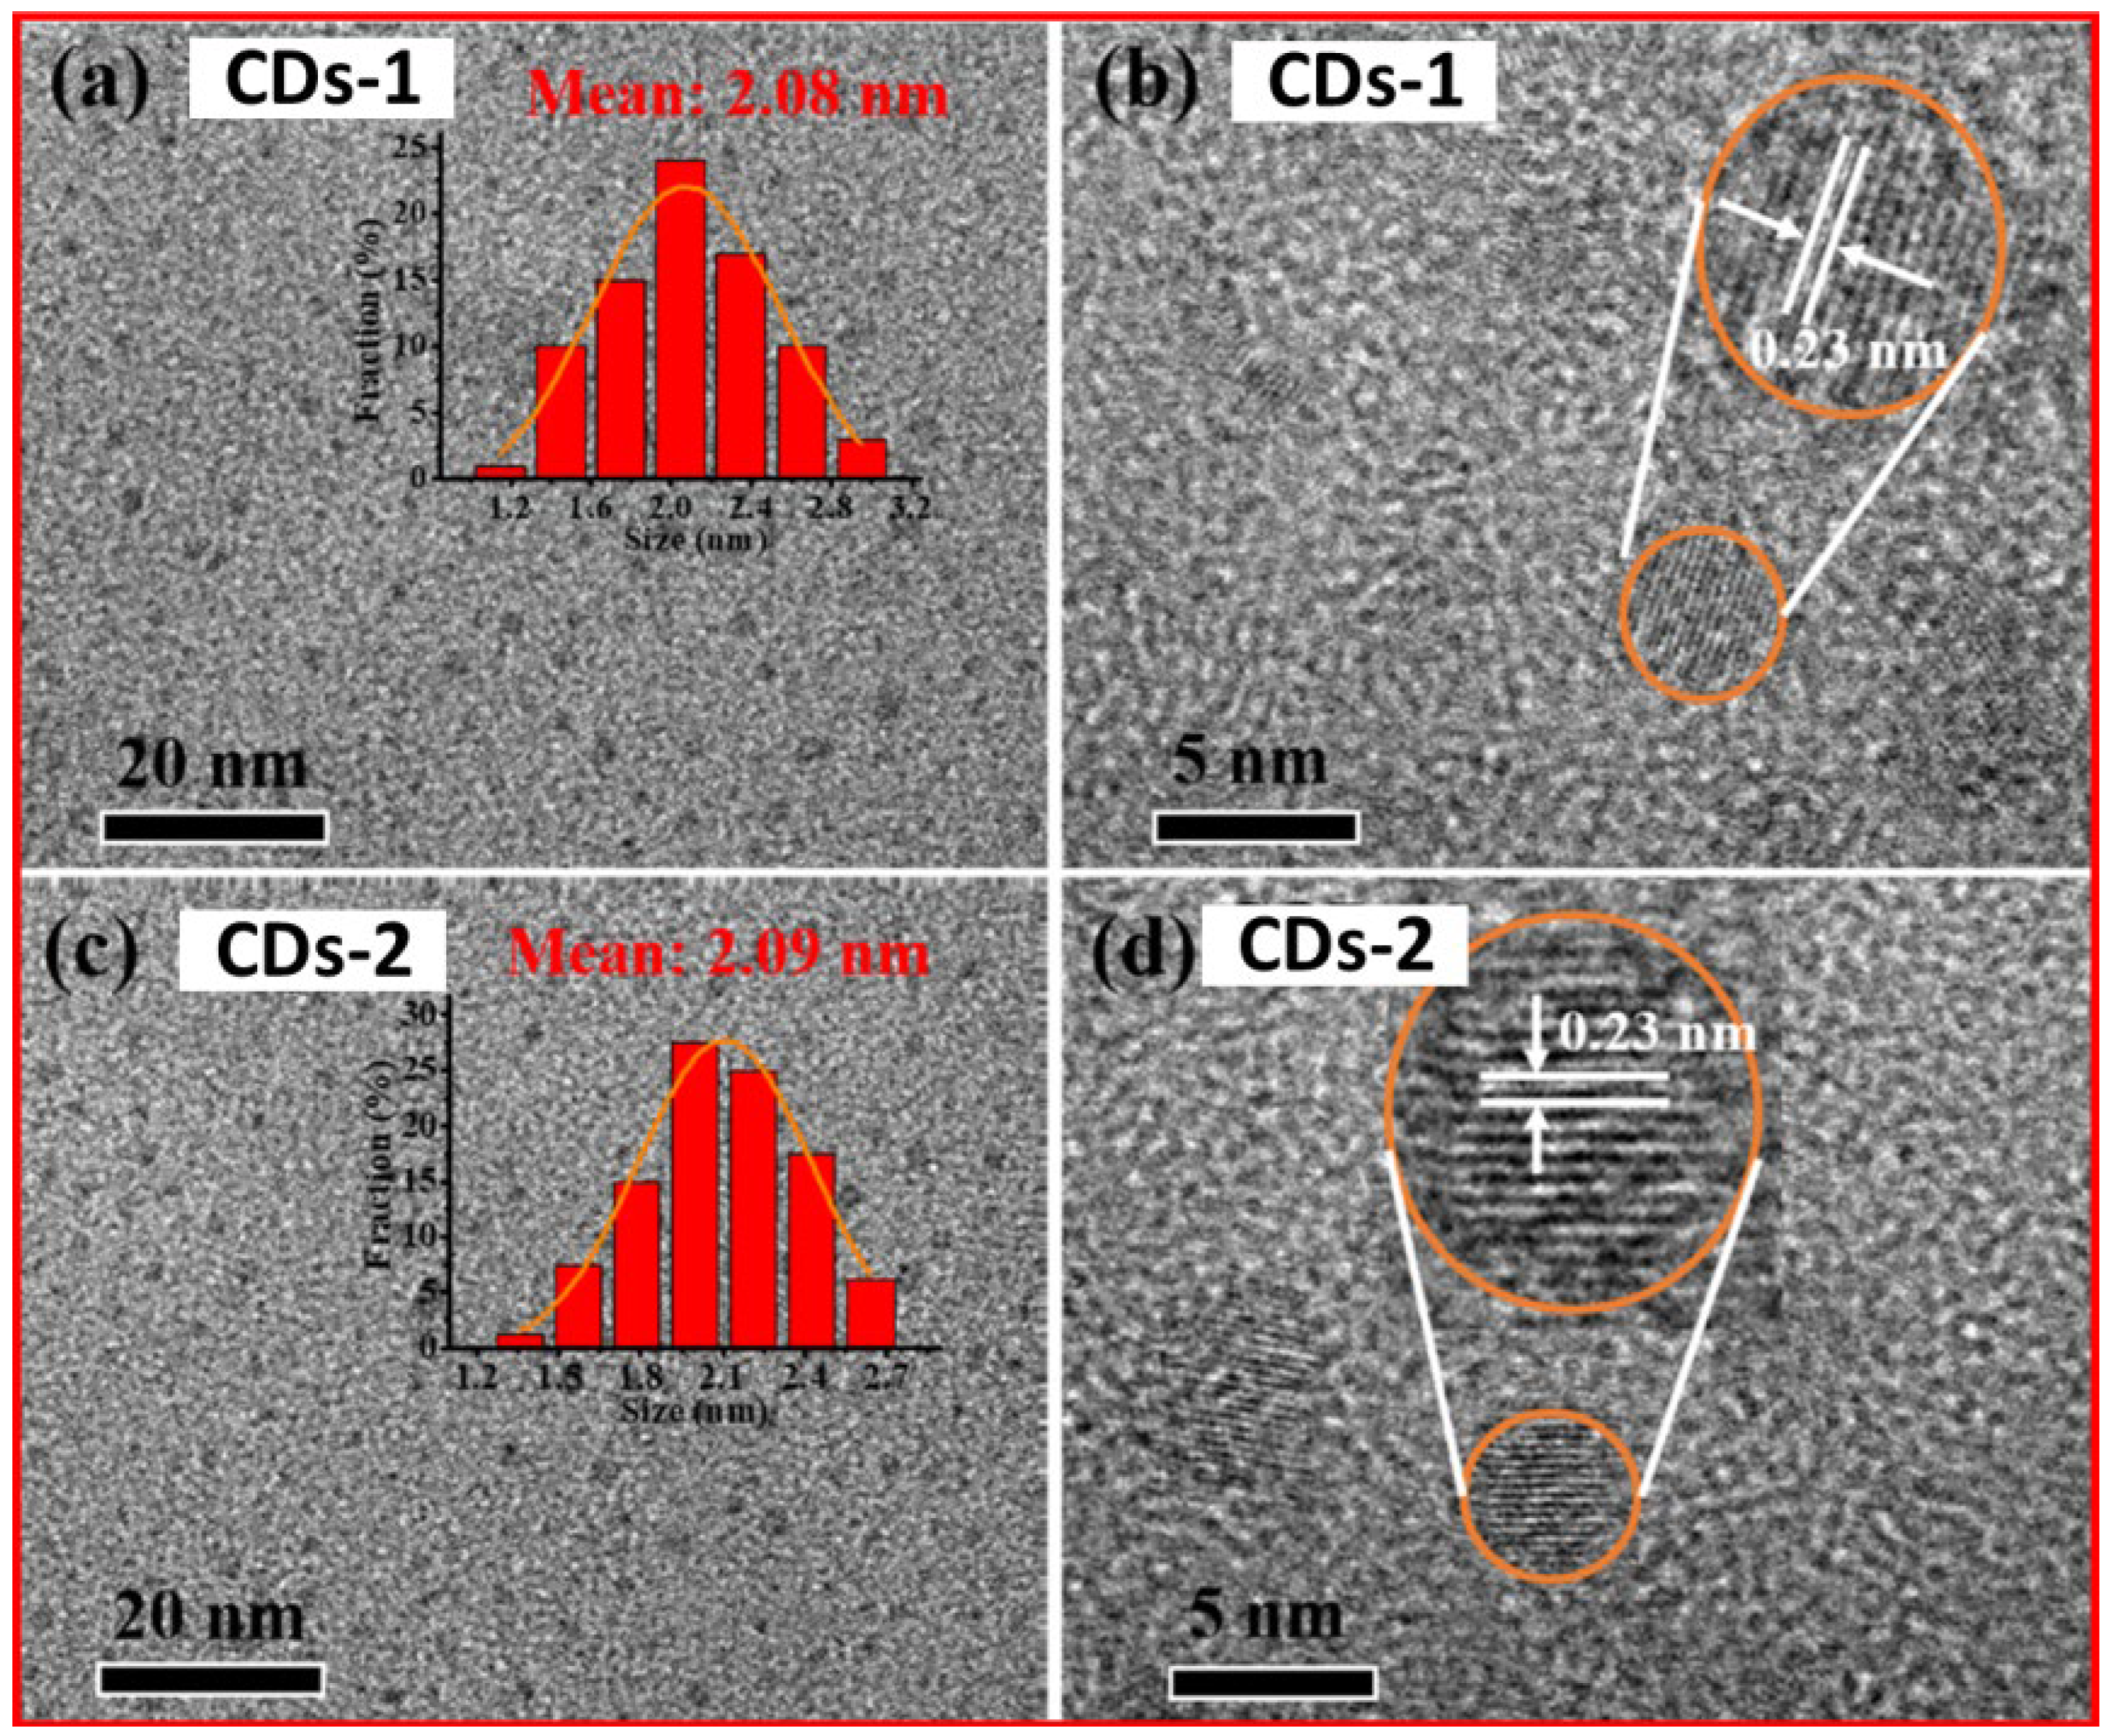
Figure 12.
HRTEM images of CDs: (a) CDTMB, (b) CDDAB, (c) CDPY, and (d) CDPHA. Reproduced with permission [39].
Figure 12.
HRTEM images of CDs: (a) CDTMB, (b) CDDAB, (c) CDPY, and (d) CDPHA. Reproduced with permission [39].
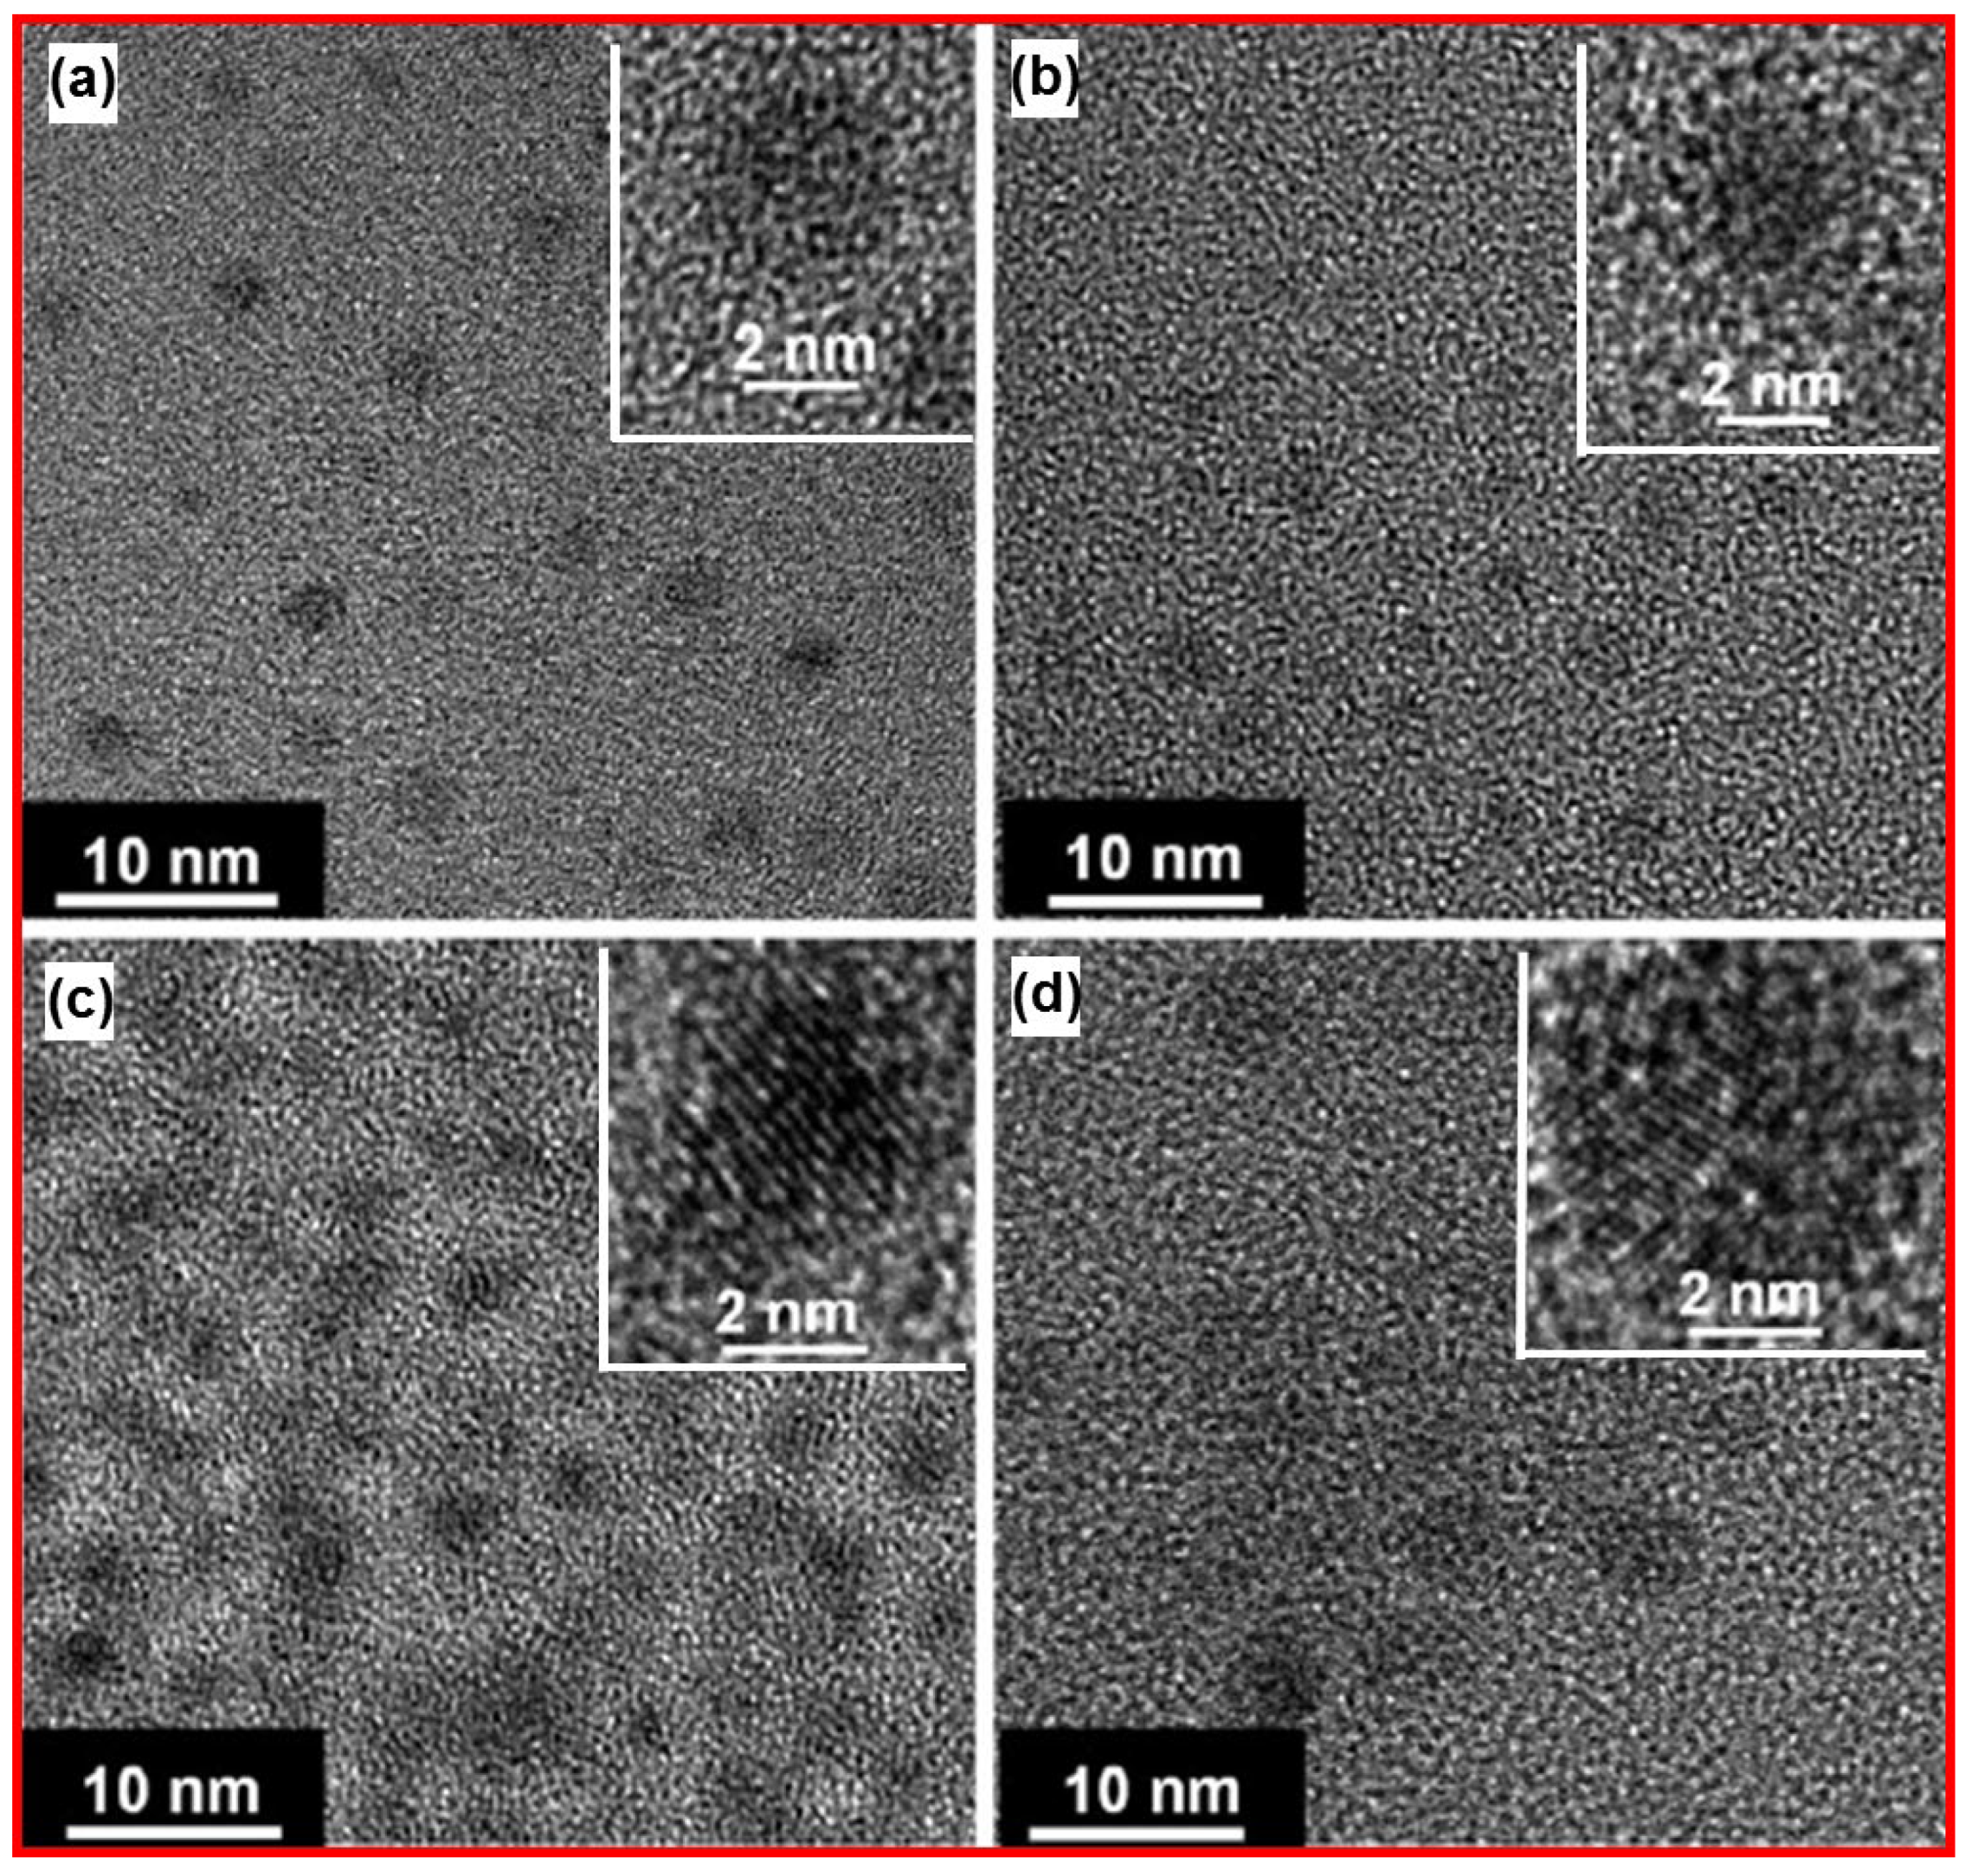
Figure 15.
(a) Magnetization curves of B 1 h, B 2 h and B 3 h CDs at room temperature (pennisteum glaucum as the precursor) [69]. (b) Magnetization curve of amorphous CDs at room temperature (dextrose as the carbon precursor) [51].
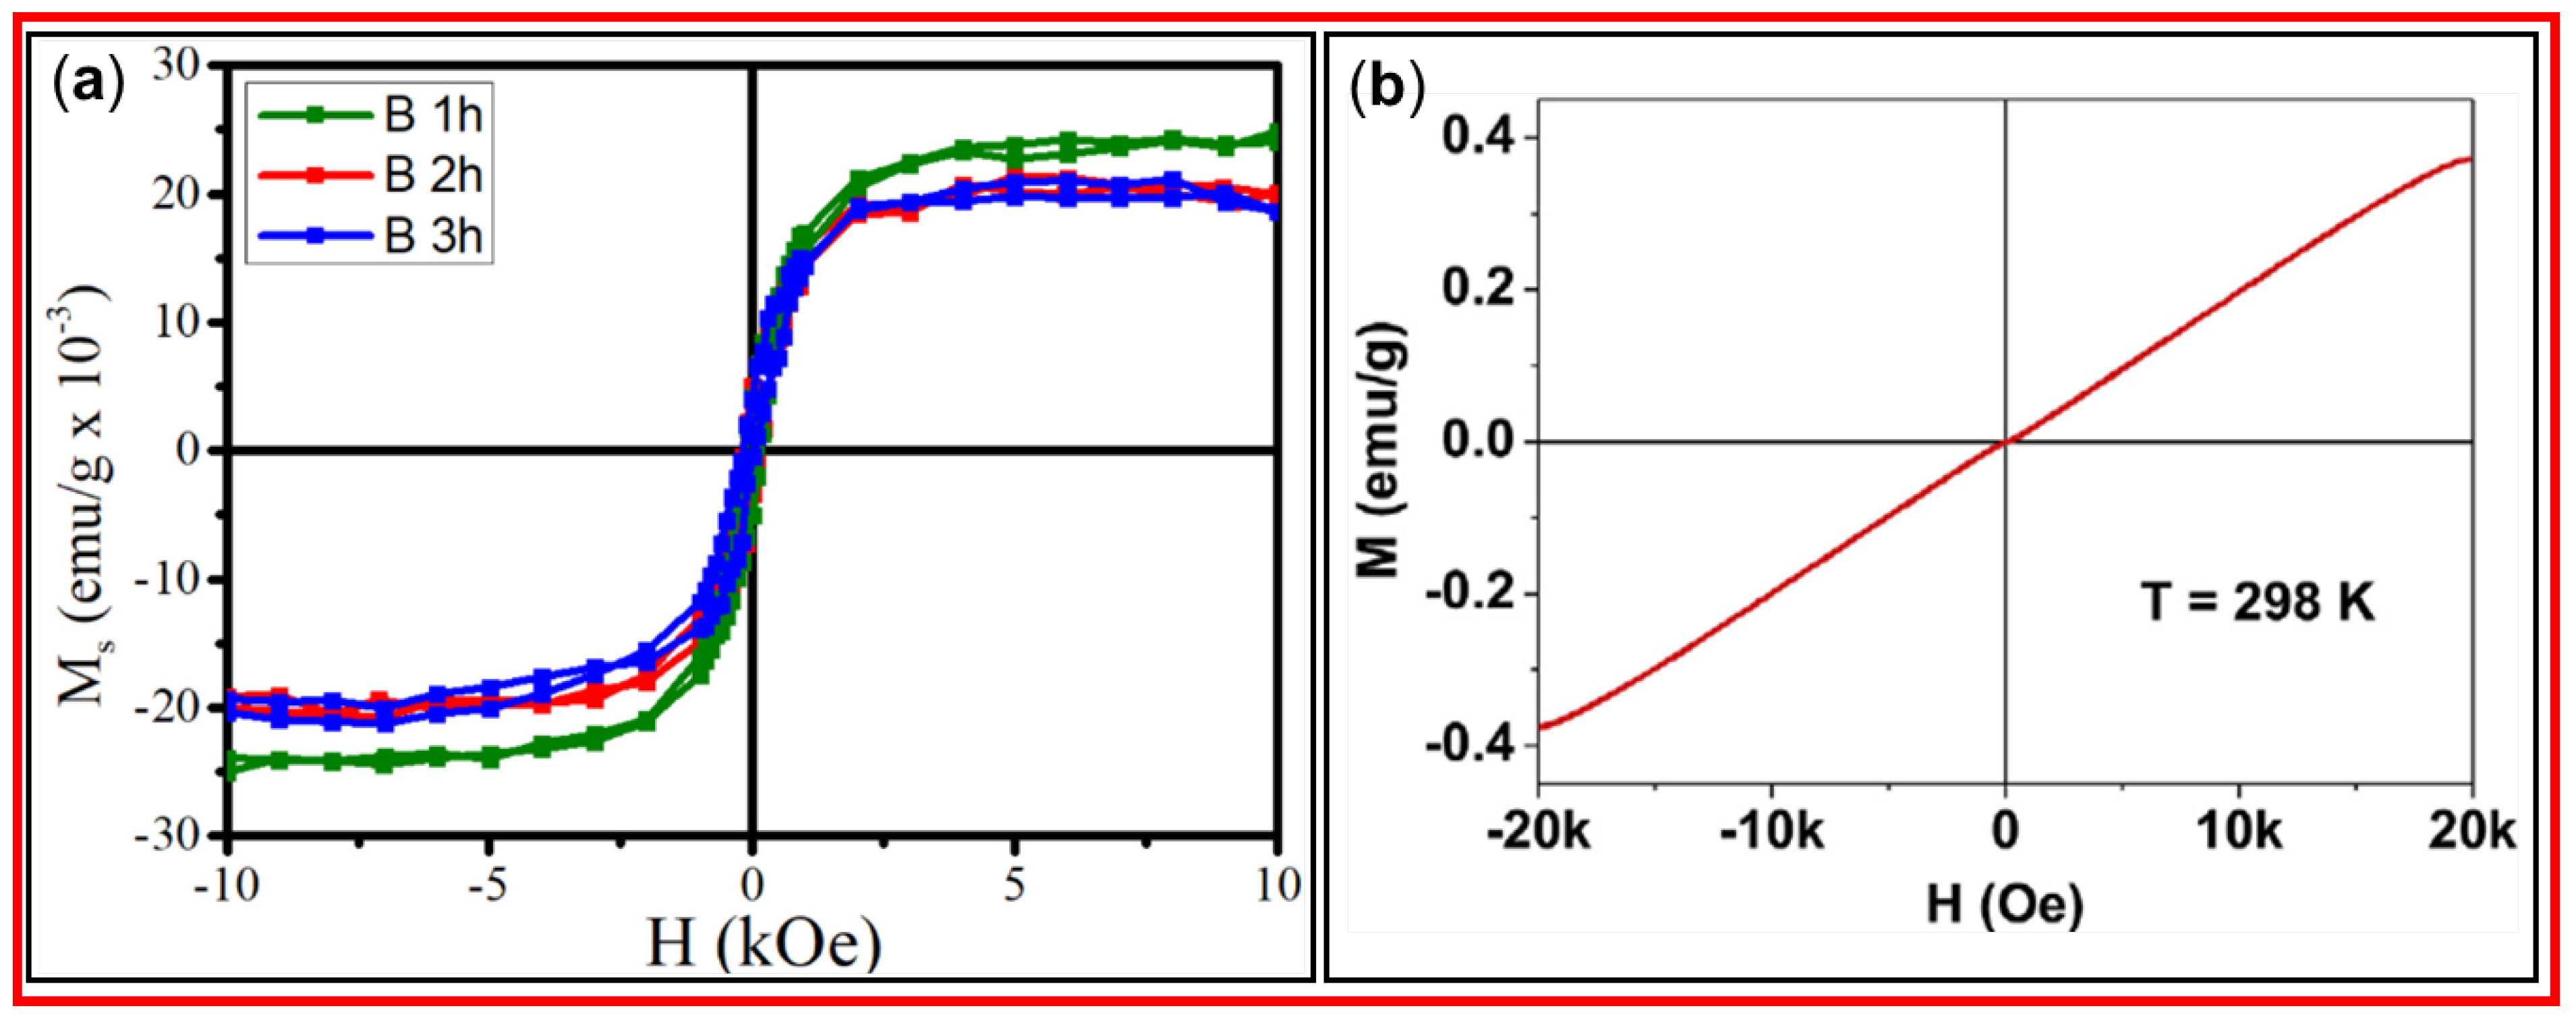
Figure 16.
(a) EPR spectra of four different CDs at 25 oC: control corresponds to CDs with poor fluorescence [70]. (b) EPR spectra of CDs before (black) and after (green) NaOH addition to solution [71].
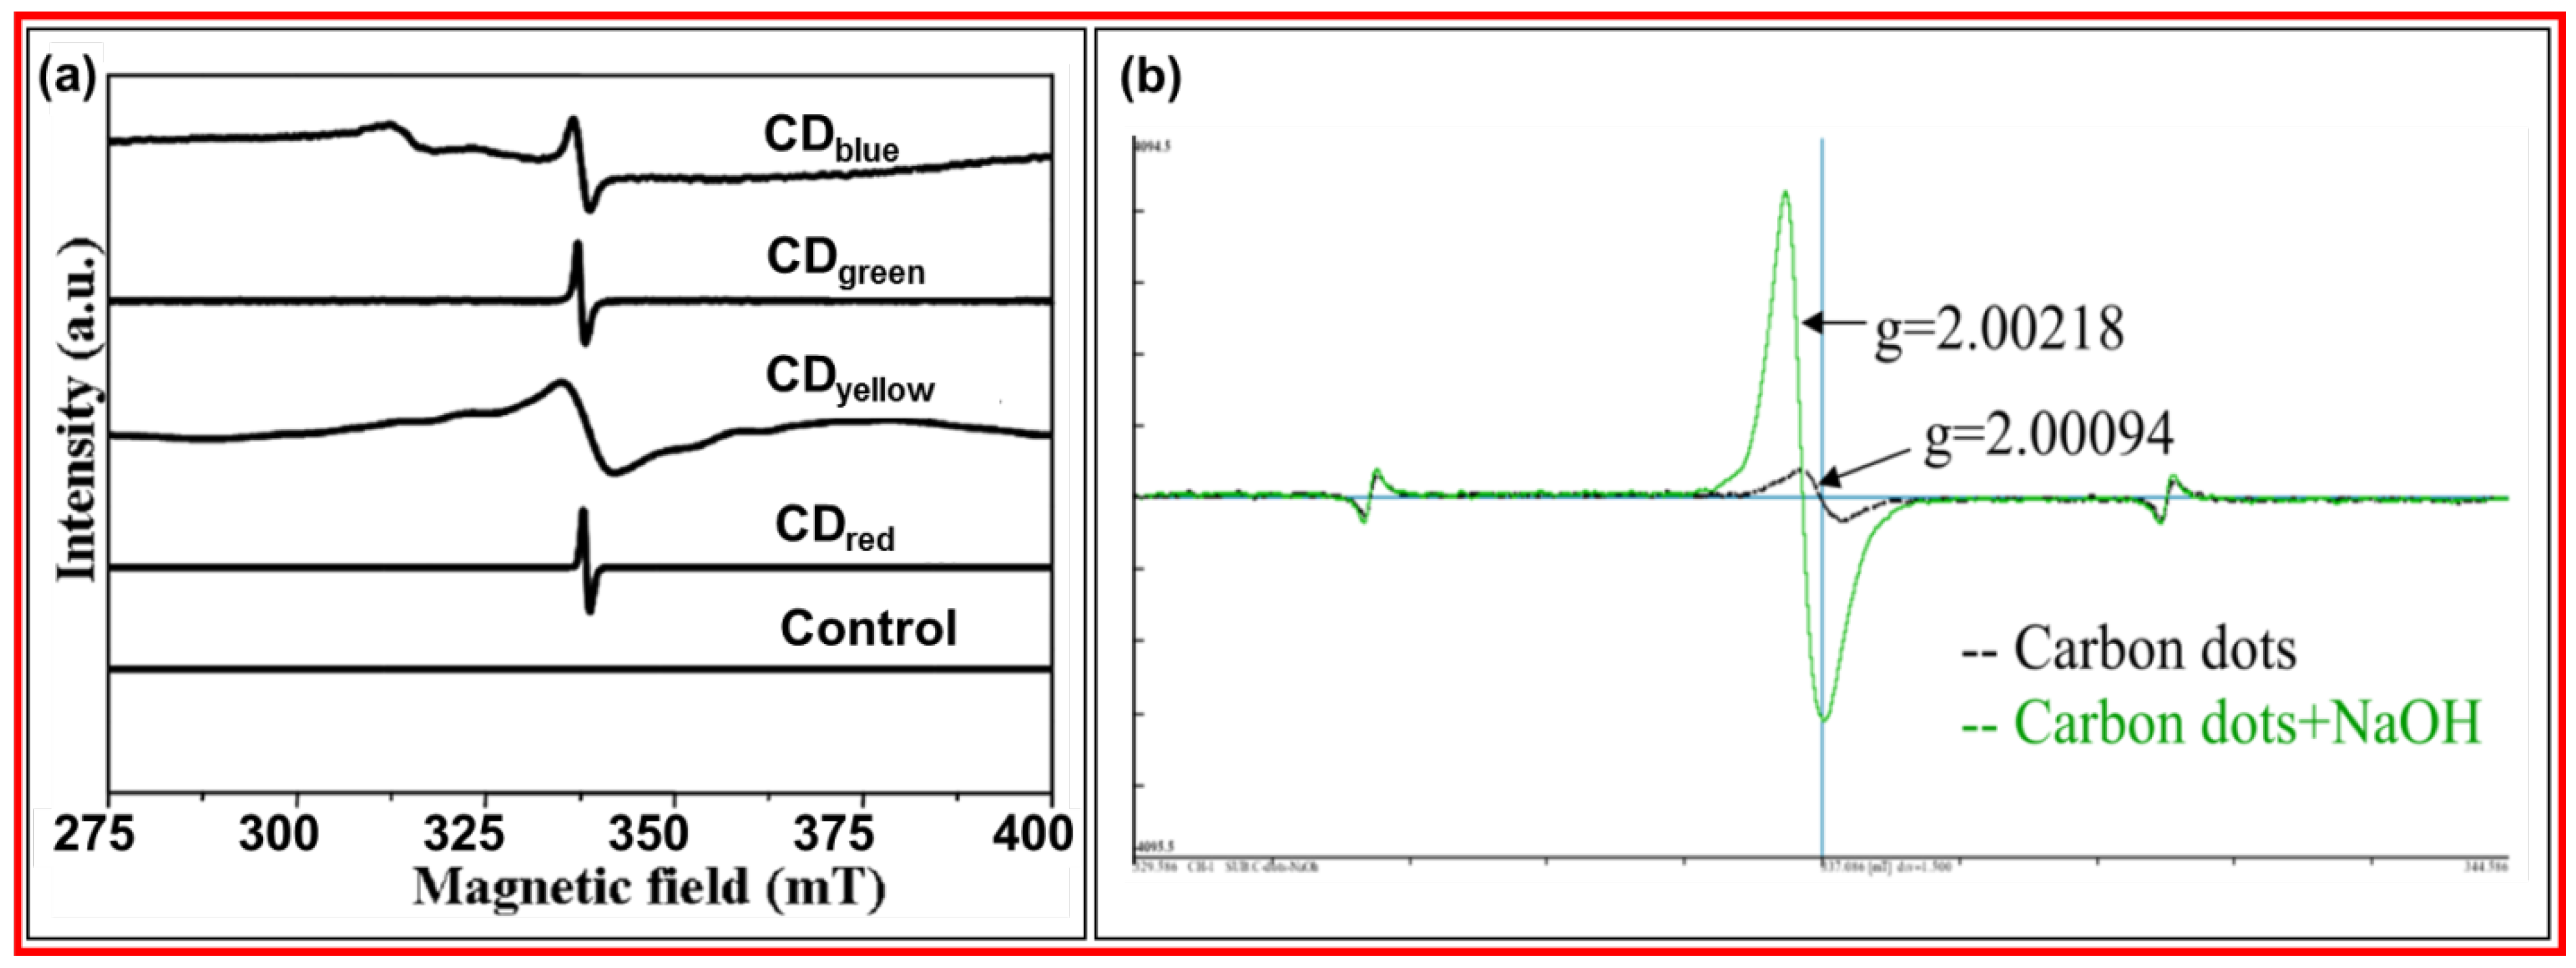
Figure 17.
In vitro cytotoxicity of CDs: (a) RAW 264.7, (b) L02, (c) 293T [76], and (d) DU145 and NCTC1469 cells [51]. (e) Hematoxylin and eosin stained tissue slices (liver, spleen, kidney, heart, and lung) of mice at 1 and 14 days after injection (dose = 23 mg CDs/kg) [77].
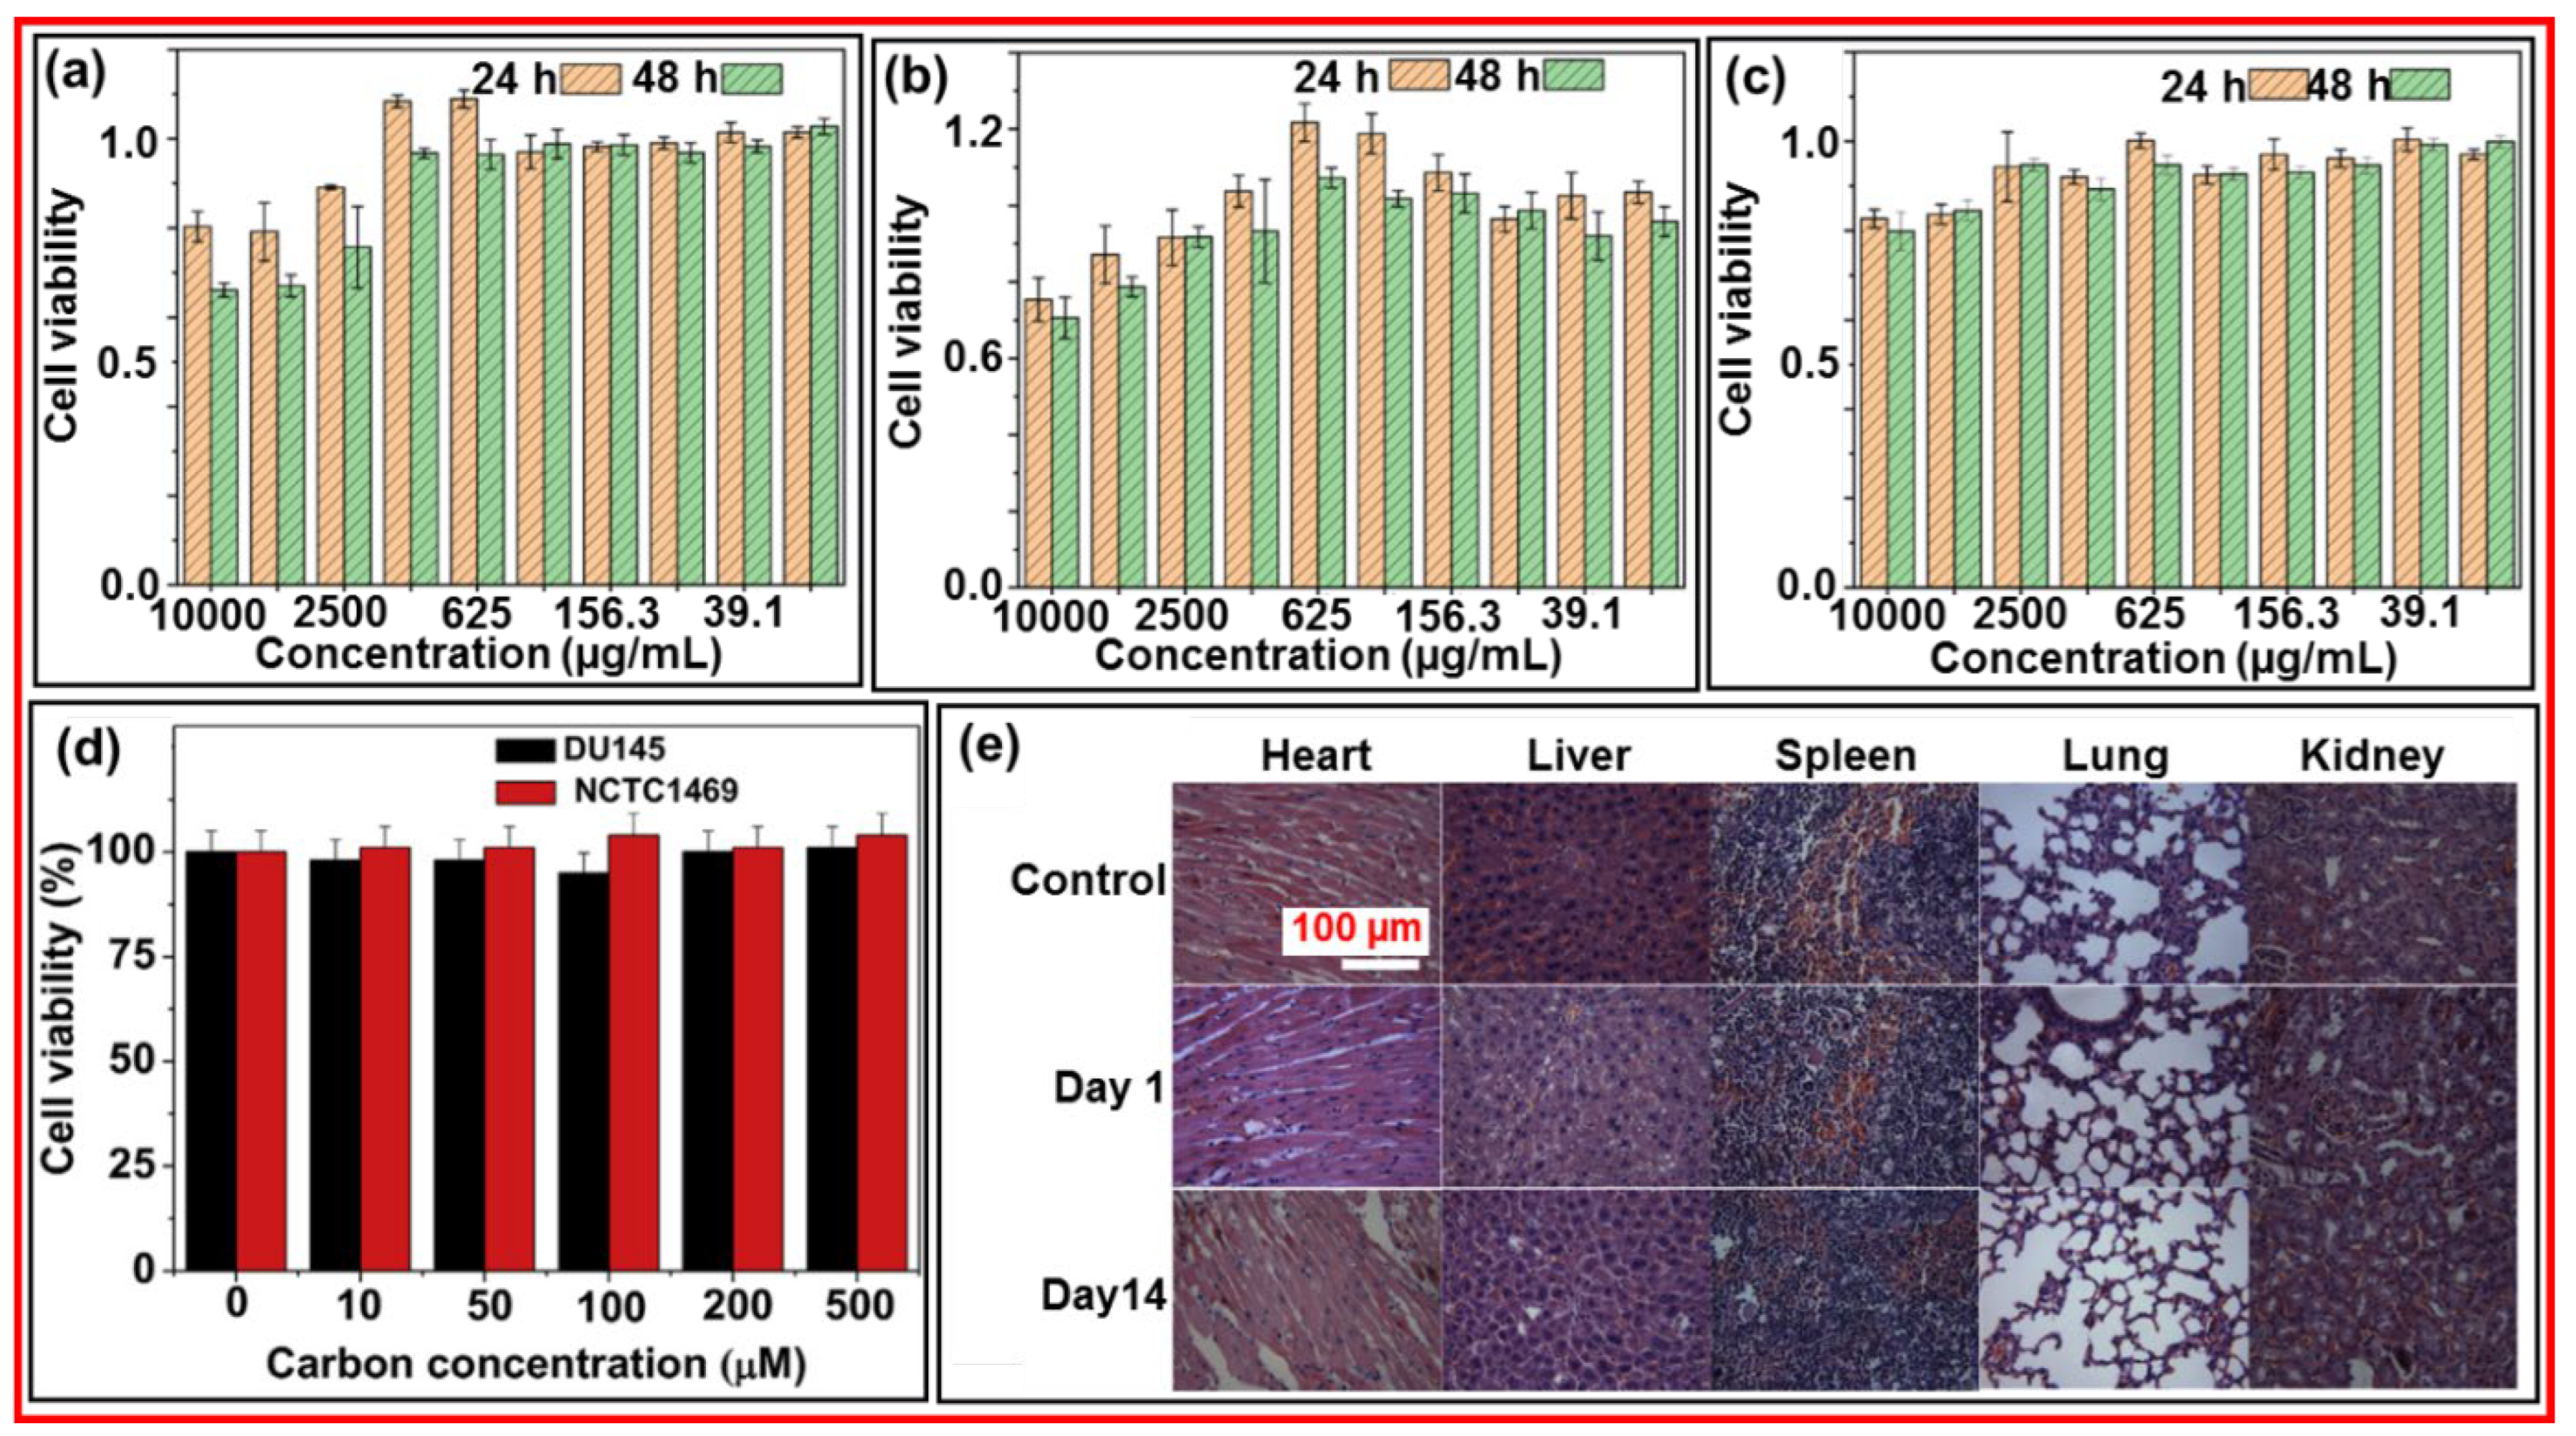
Figure 18.
(a) Principle of CEST mechanism: the saturated solute protons are exchanged with bulk water protons at the rate Ksw and the unsaturated bulk water protons return to the solutes at the rate Kws. Measurement of CEST: (b) solute protons are saturated at their specific resonance frequency at 8.25 ppm and bulk water protons at 4.75 ppm (left spectrum) and the proton exchange leads to the bulk water proton signal reduction after a period (tsat) (right spectrum), (c) normalized proton signal spectrum, called the Z-spectrum or CEST spectrum, and (d) MTR asymmetry (MTRasym) plot of the Z-spectrum after removing the effect of bulk water proton signal [86]. (e) MTRasym plots for the three agents: salicylic acid (1), barbituric acid (2), and D-glucose (3) [91].
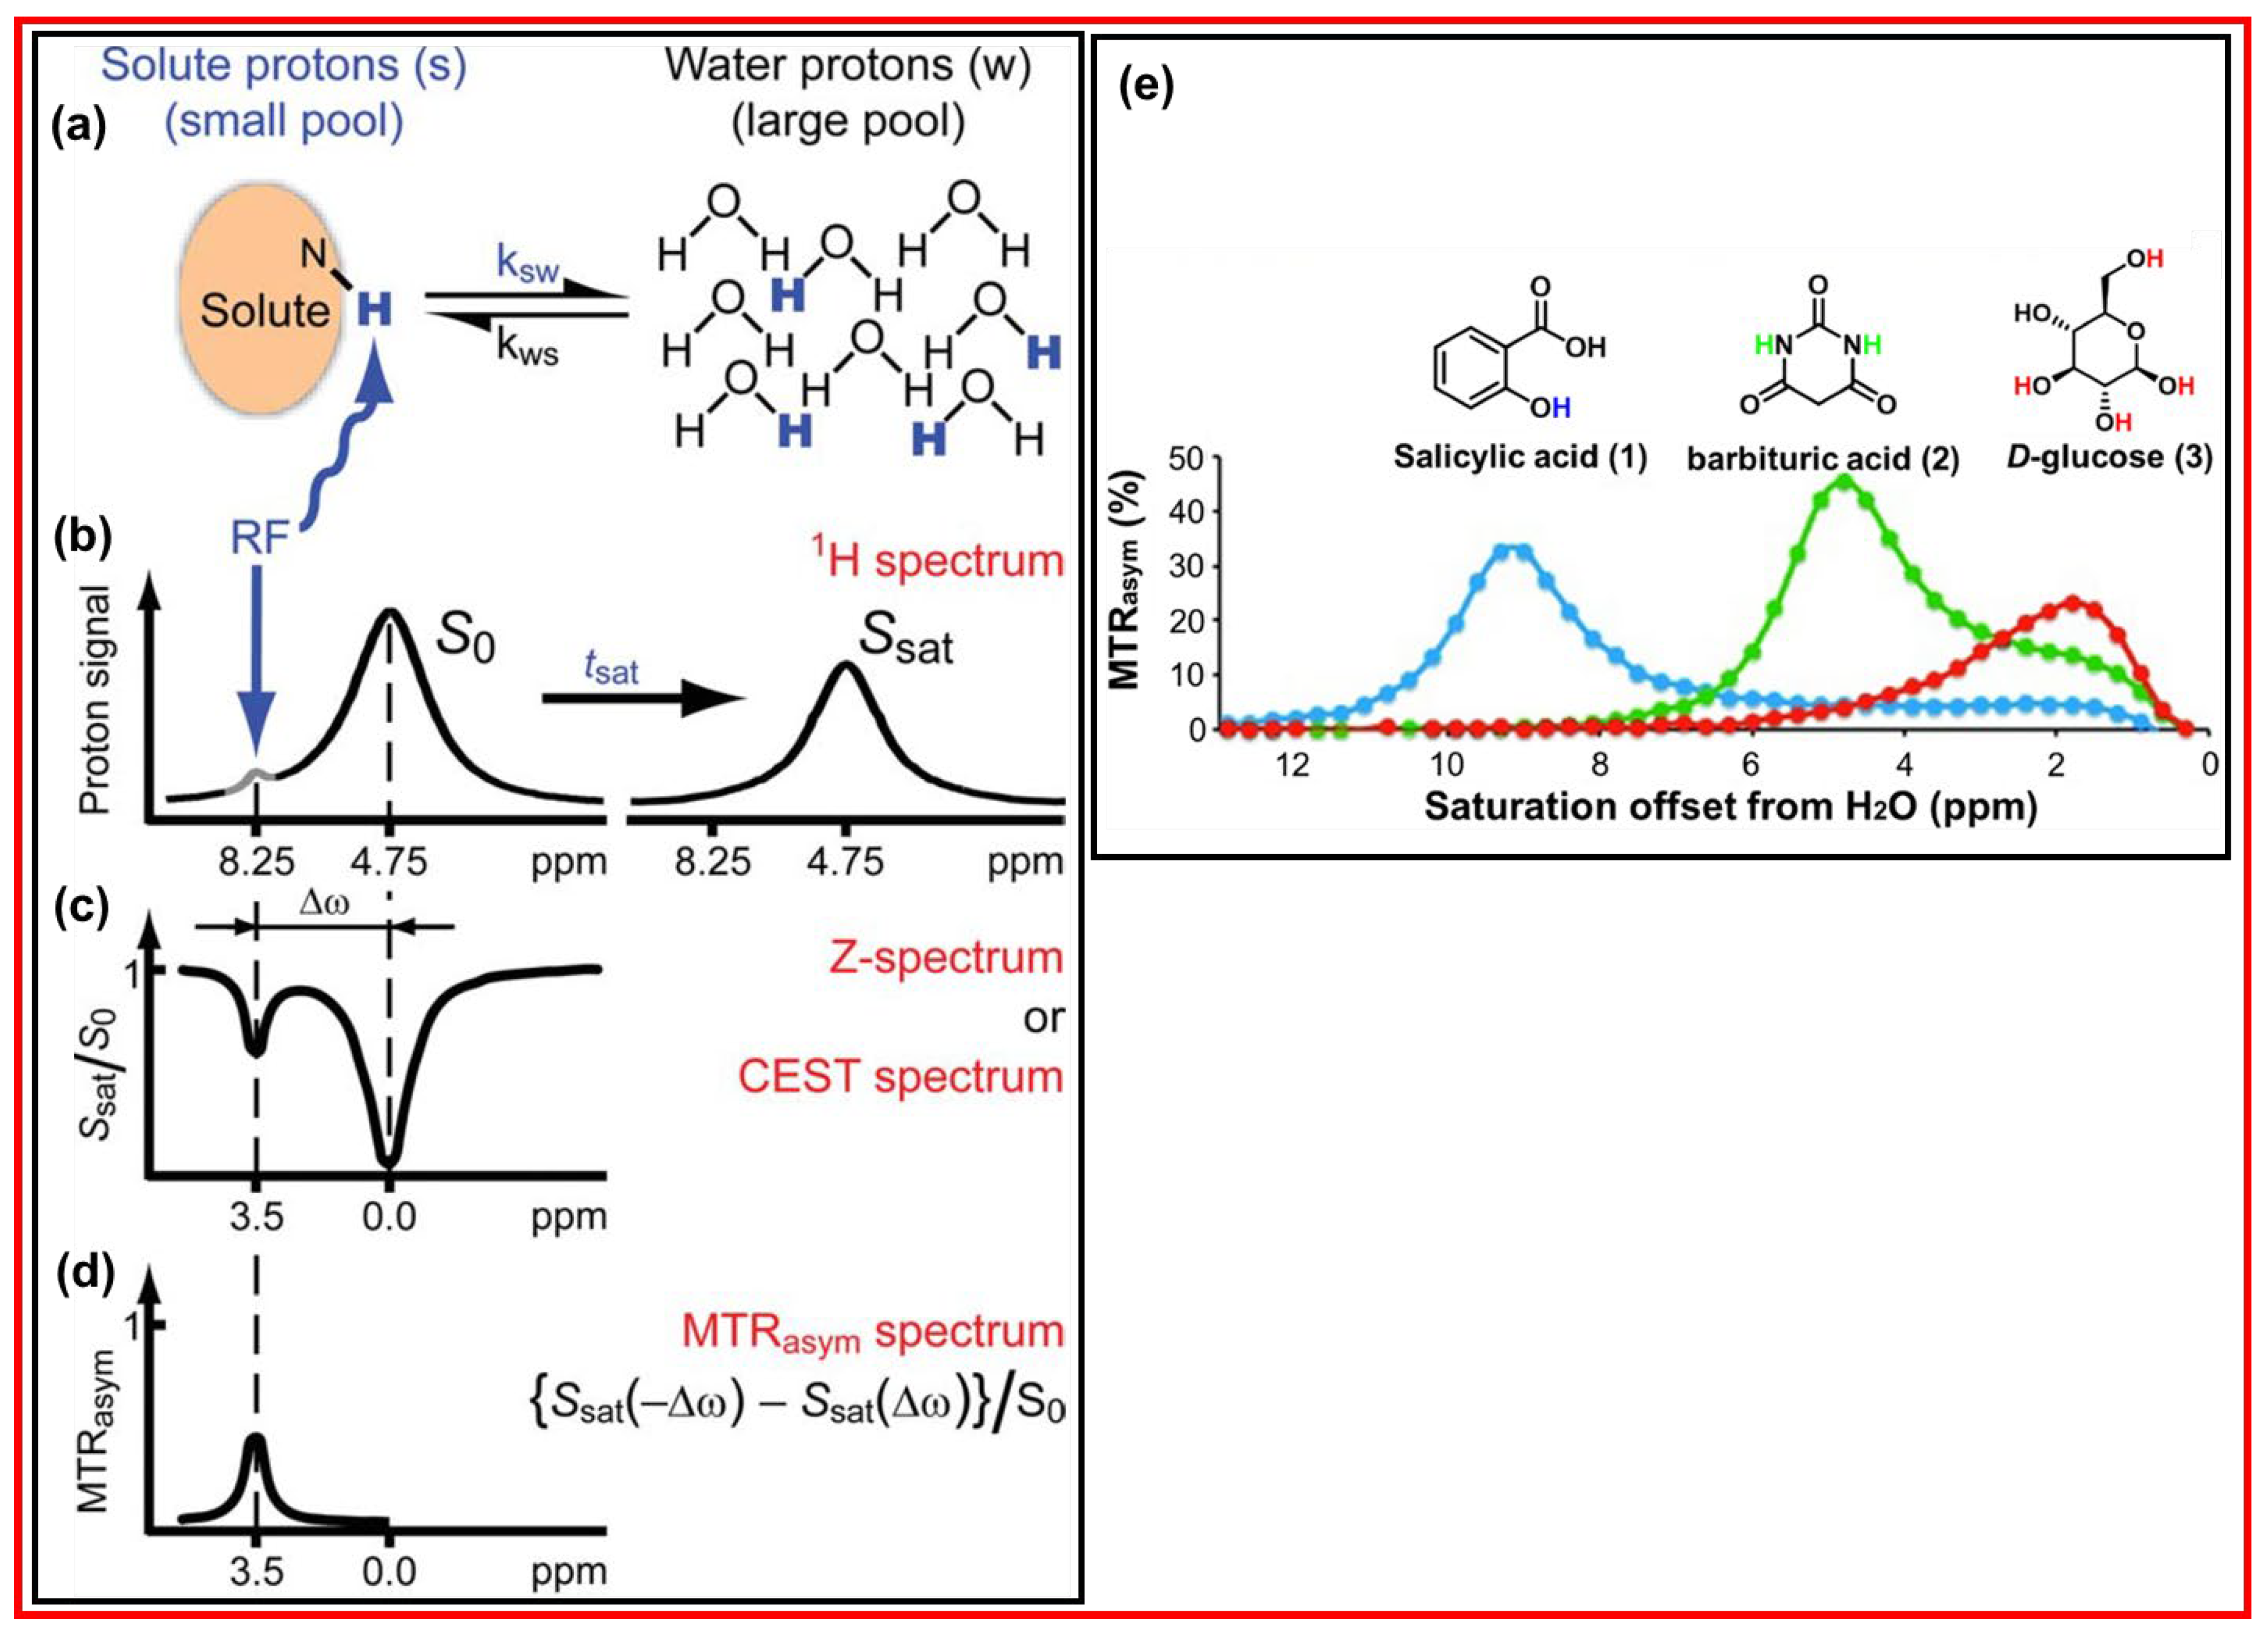
Figure 19.
(a) Synthesis of AC-dots. (b) Ac-dot concentration dependent Z-spectra. (c) Ac-dot concentration dependent MTRasym plots at pH = 7.4. (d) pH-dependent MTRasym plots of AC-dots (10 mg/ml) in PBS. (e) MTRasym plots of Lipo-AC-dots-labeled cells and Lipo-labeled cells as control. (f) T2-weighted MR image (left) and corresponding CEST image (right) at 2 ppm of a mouse brain at 24 h after implantation [94].
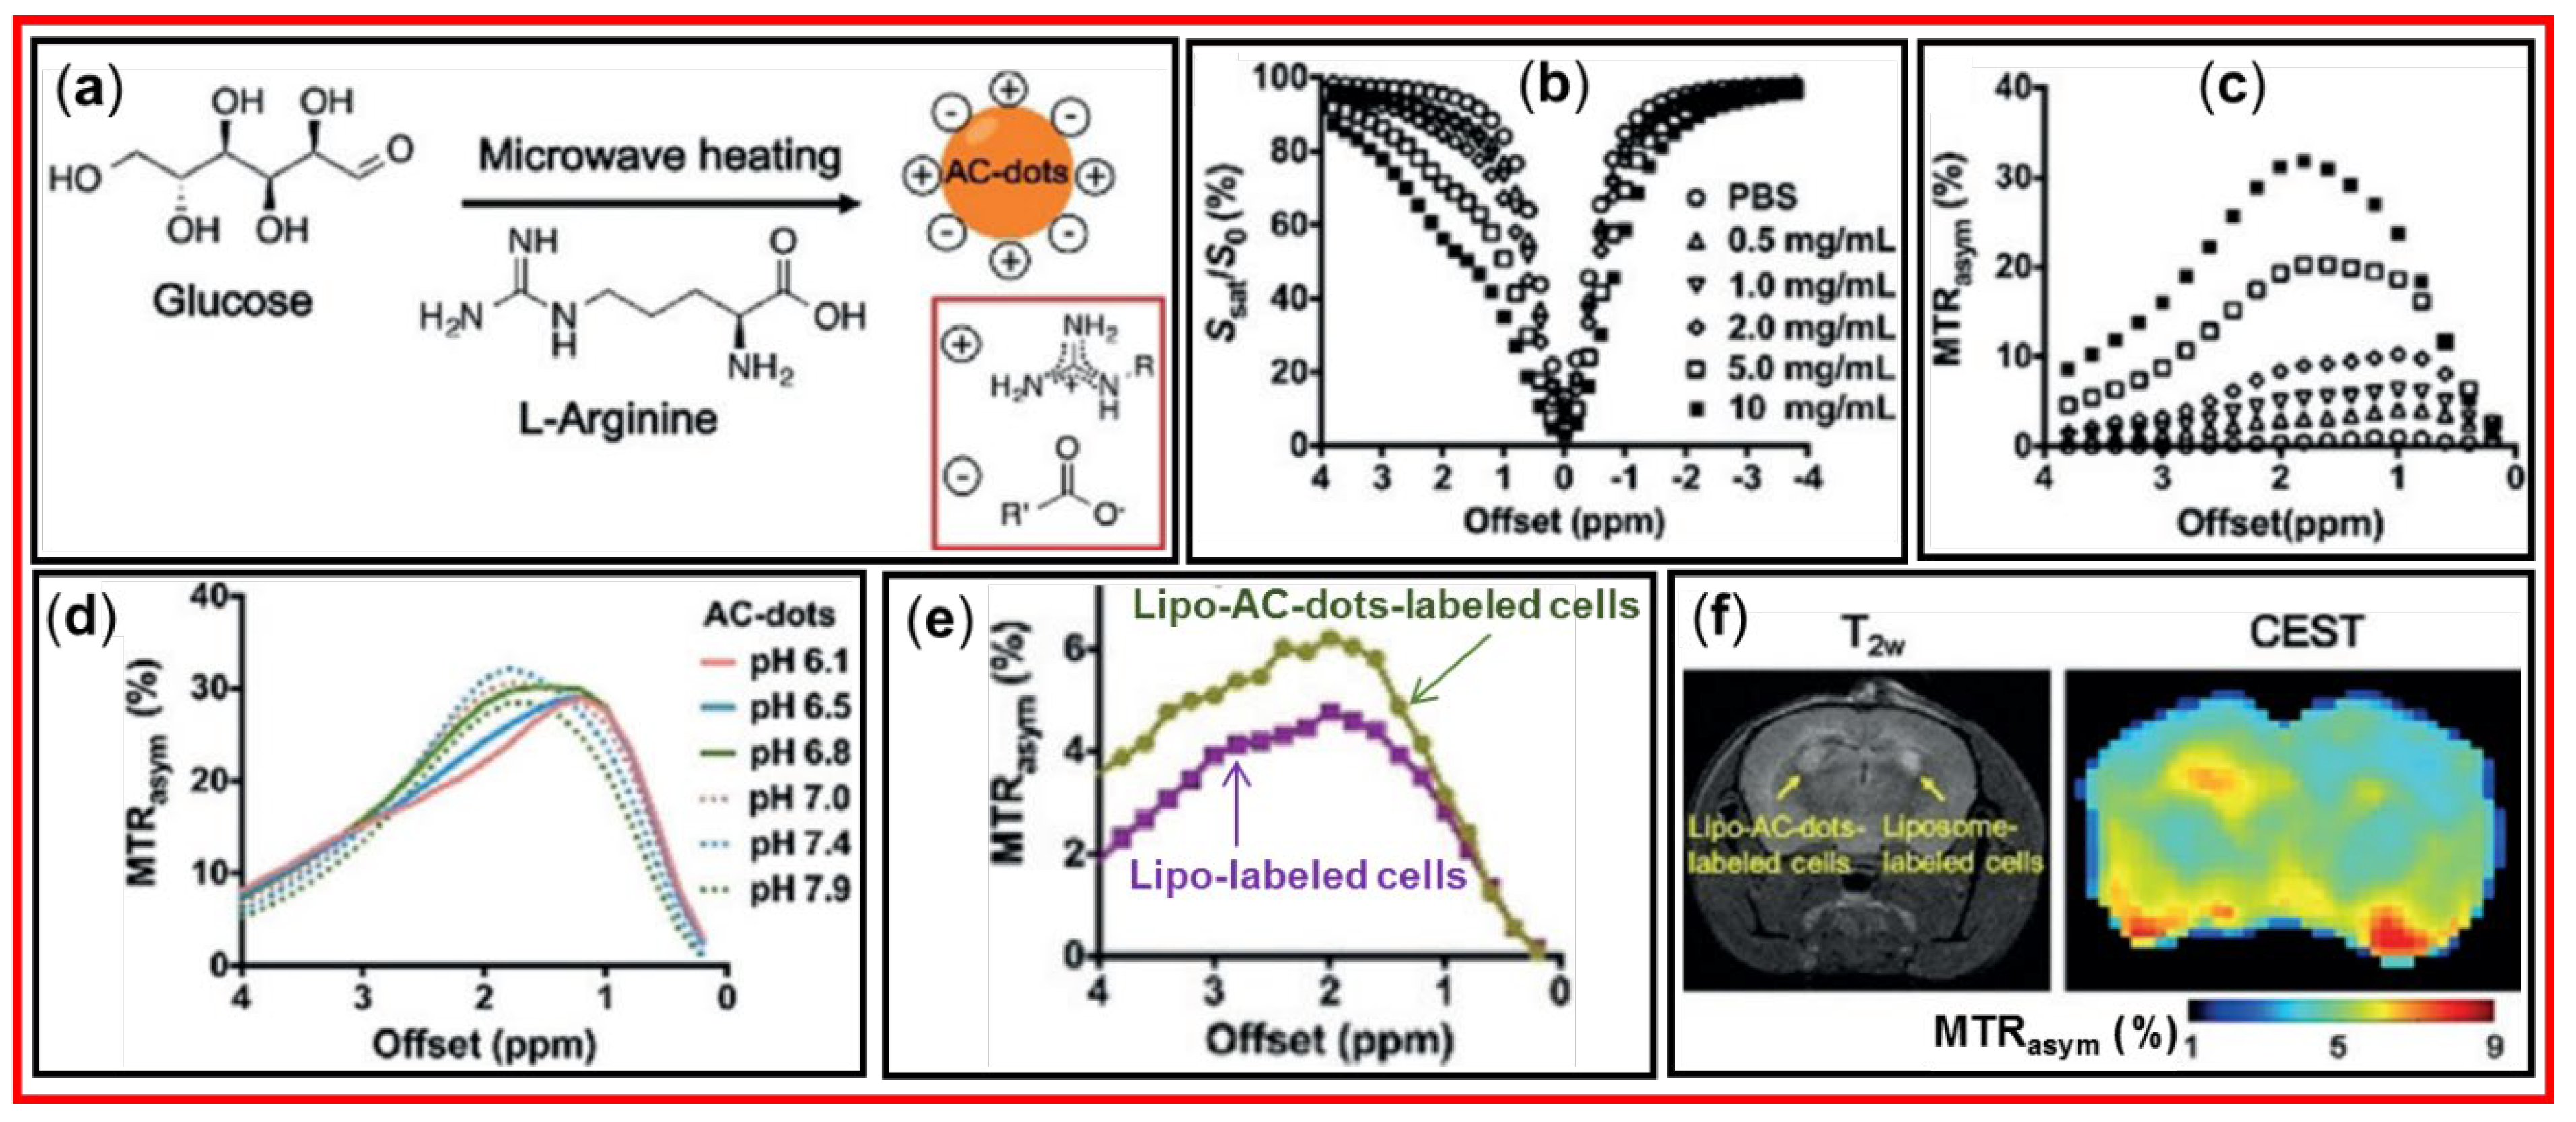
Figure 20.
(a) Synthesis of CDs showing amide (pink) and ammonium (green) protons exchangeable with bulk water protons in diaCEST MRI, (b) CEST effects (%) of the precursor estimated from Z-spectra for the two types of protons at different pH values. (c) Z-spectrum and MTRasym of the precursor at pH = 5.5. Z-spectra and MTRasym of the CDs at pH = (d) 9.9, (e) 7.4, and (f) 5.5 [95].
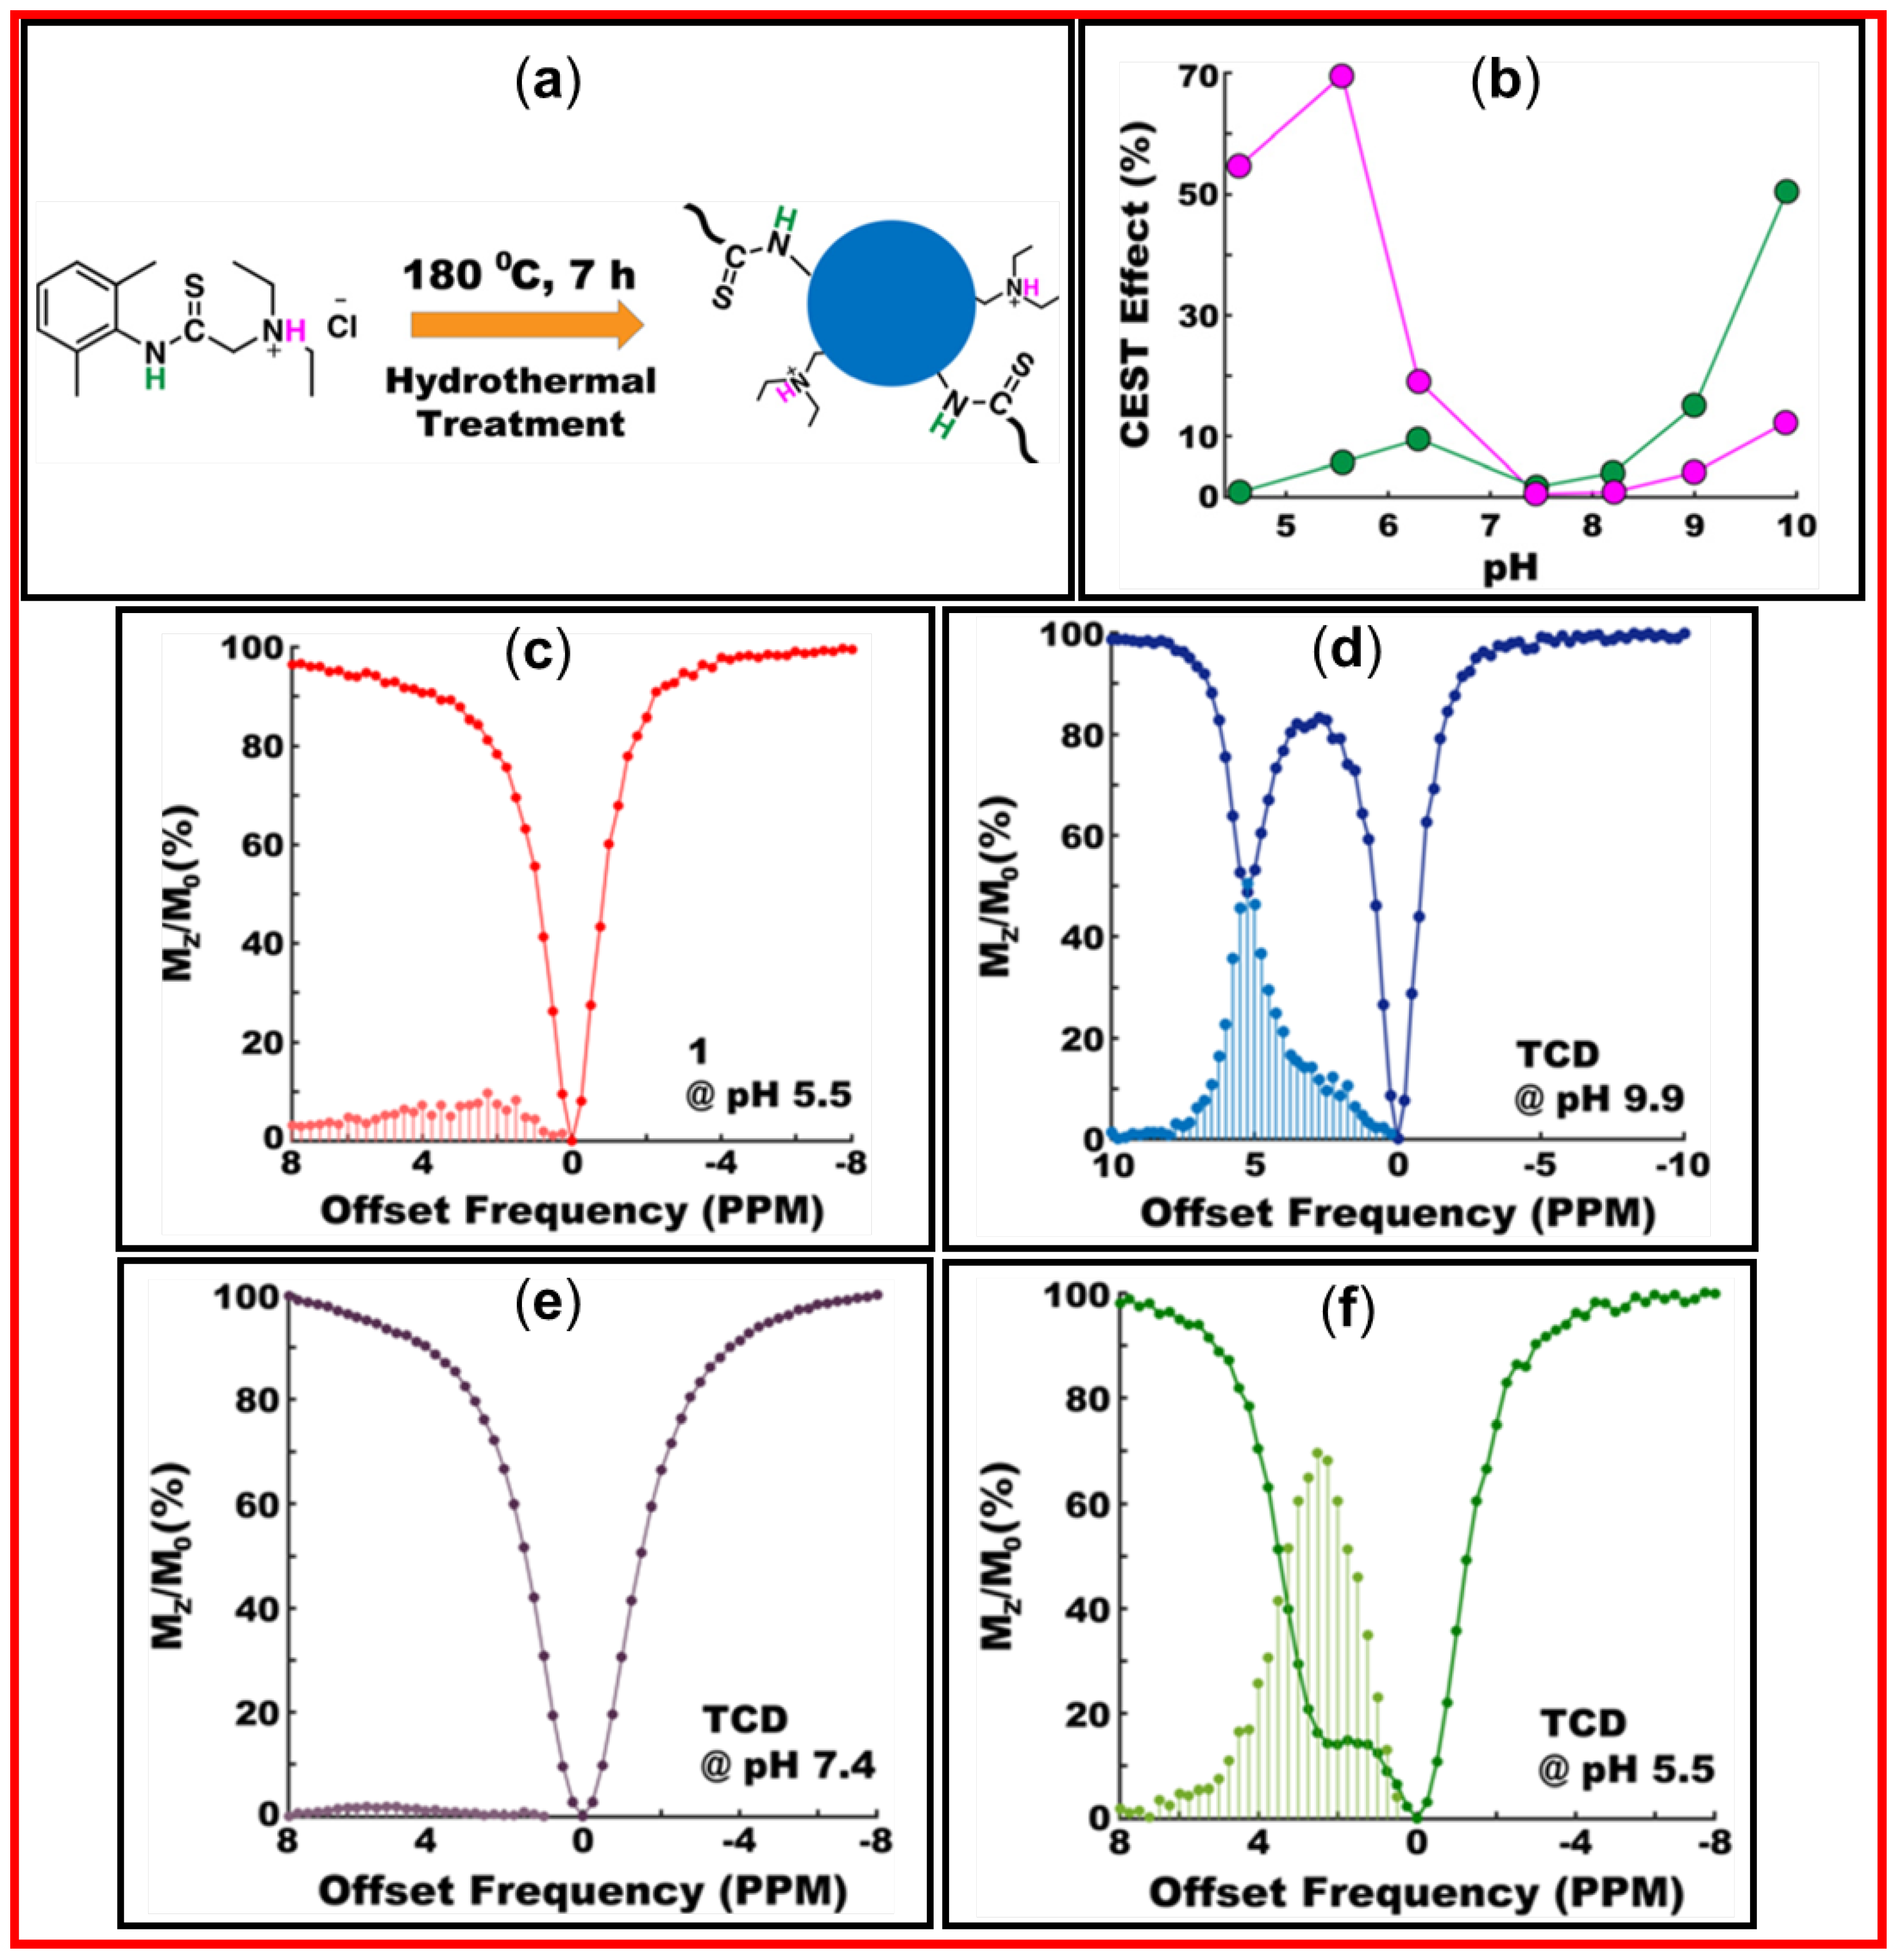

Table 1.
FT-IR absorption and Raman shift (cm‒1) of CDs.
| Carbon precursor | FT-IR (cm‒1) | Raman shift (cm‒1) | Ref | ||
| Wavenumber | Vibration mode | D band | G band | ||
| Sodium citrate and polyacrylamide | 3436 and 1410 | N-H/O-H stretching and O-H bending, respectively | 1363 | 1582 | [53] |
| 1590 | N-H bending or asymmetric stretching of carboxylate anions | ||||
| 1648 and 1059 | C=O stretching and C-N stretching, respectively | ||||
| L-ascorbic acid and β-alanine | 1720 | C=O stretching | 1365 | 1595 | [54] |
| 1370 | O-H bending | ||||
| 1214 | C-O stretching | ||||
| 1050 | C-N stretching | ||||
| Glucose and m-phenylenediamine | 3400 | N-H/O-H stretching | 1357 | 1565 | [55] |
| 1605 | C=N or C=O stretching | ||||
| 1137 | Benzene C-H stretching | ||||
| Mandelic acid and ethylenediamine | 3352 to 3031 | O-H and N-H stretching | 1358 | 1574 | [56] |
| 2926 and 1367 | C-H stretching and bending, respectively | ||||
| 1570 | C=O stretching | ||||
| 1059 | C-O stretching | ||||
| 692 | N-H deformation | ||||
| Oatmeal | 3432 | O-H/N-H stretching | 1359 | 1584 | [57] |
| 2921 | C-H stretching | ||||
| 1625 and 1382 | C=O asymmetric and symmetric stretching, respectively | ||||
| 1241 and 1151 | C-N and C-OH stretching, respectively | ||||
| 1091 | C-O stretching | ||||
| Lychee seeds | 3443 | O-H or N-H stretching | 1387 | 1585 | [58] |
| 2981 | C-H stretching | ||||
| 1633 | C=O stretching | ||||
| 1055 | C-O stretching | ||||
| Citric acid and neutral red | 3496 | O-H stretching | 1340 | 1596 | [59] |
| 1720 | C=O stretching | ||||
| 1210 | C-O-C stretching | ||||
| 3296 | N-H stretching | ||||
| 1551 and 1412 | C=C and C-N stretching, respectively | ||||
Disclaimer/Publisher’s Note: The statements, opinions and data contained in all publications are solely those of the individual author(s) and contributor(s) and not of MDPI and/or the editor(s). MDPI and/or the editor(s) disclaim responsibility for any injury to people or property resulting from any ideas, methods, instructions or products referred to in the content. |
© 2025 by the authors. Licensee MDPI, Basel, Switzerland. This article is an open access article distributed under the terms and conditions of the Creative Commons Attribution (CC BY) license (http://creativecommons.org/licenses/by/4.0/).
Copyright: This open access article is published under a Creative Commons CC BY 4.0 license, which permit the free download, distribution, and reuse, provided that the author and preprint are cited in any reuse.


