Submitted:
05 March 2025
Posted:
05 March 2025
You are already at the latest version
Abstract
In this study, machine learning techniques for identification of brain tumor were compared with the BraTS 2024 dataset. A variety of models included traditional machine learning algorithms such as Random Forest or more advanced deep learning architectures including Simple CNN, VGG16, VGG19, ResNet50, Inception-ResNetV2, and Efficient Net are investigated within the research. Preprocessing techniques were adopted to optimize the model performance on the dataset. The Random Forest algorithm gave the best result, with an accuracy of 87%, which was much better than the deep learning models, which had an
accuracy between 47% and 70%. These findings have important applications for automated brain tumor diagnosis. They emphasize the criticality of the correct selection and tuning of the algorithm to improve the classification of tumor subtypes. First, this research shows that deep learning models are typically considered to be state of the art deep learning models for image analysis tasks, but in some cases traditional machine learning methods such as random forest might still achieve better results than the most complex of neural networks. This delineates the importance of a fine-grained approach to model selection, with regard for details of the dataset as well as computational constraints and particular diagnostic requirements. The aim of the study is to improve patient outcome for more accurate and efficient brain tumor identification by refinement and optimization of these automated diagnosis systems.
Keywords:
Brain tumor
; Classification Accuracy
; Machine learning Techniques
; High-Grade Gliomas (HGG)
I. Introduction
The combination of deep learning and machine learning techniques has resulted in advancement of brain tumor segmentation and classification. The application of these approaches has been a revolution in the field of medical imaging primarily by automating the traditional manually driven processes and accuracy of the tumor identification and classification. As demonstrated by U-Net and Convolutional Neural Networks (CNNs) type of deep learning models, tumor regions in 2D MRI images can be accurately delineated with high Dice similarity coefficients for tumor regions (Alagarsamy et al., 2024, Breesha et al., 2024). In addition to this, mathematical and machine learning methods such as thresholding, K-Means clustering, and CNN are employed to solve the segmentation problem as an optimization problem by using extracted features to precisely pinpoint tumor edges (Pathak, 2024). The segmentation process has been further refined by such other advanced image processing techniques as noise reduction, image enhancement and wavelet analysis (Kakarwal, 2024).
As for classification, CNNs have been used effectively for differentiating various tumor types with high classification (Alagarsamy et al., 2024; Mostafa et al., 2024). Support Vector Machines (SVMs) and
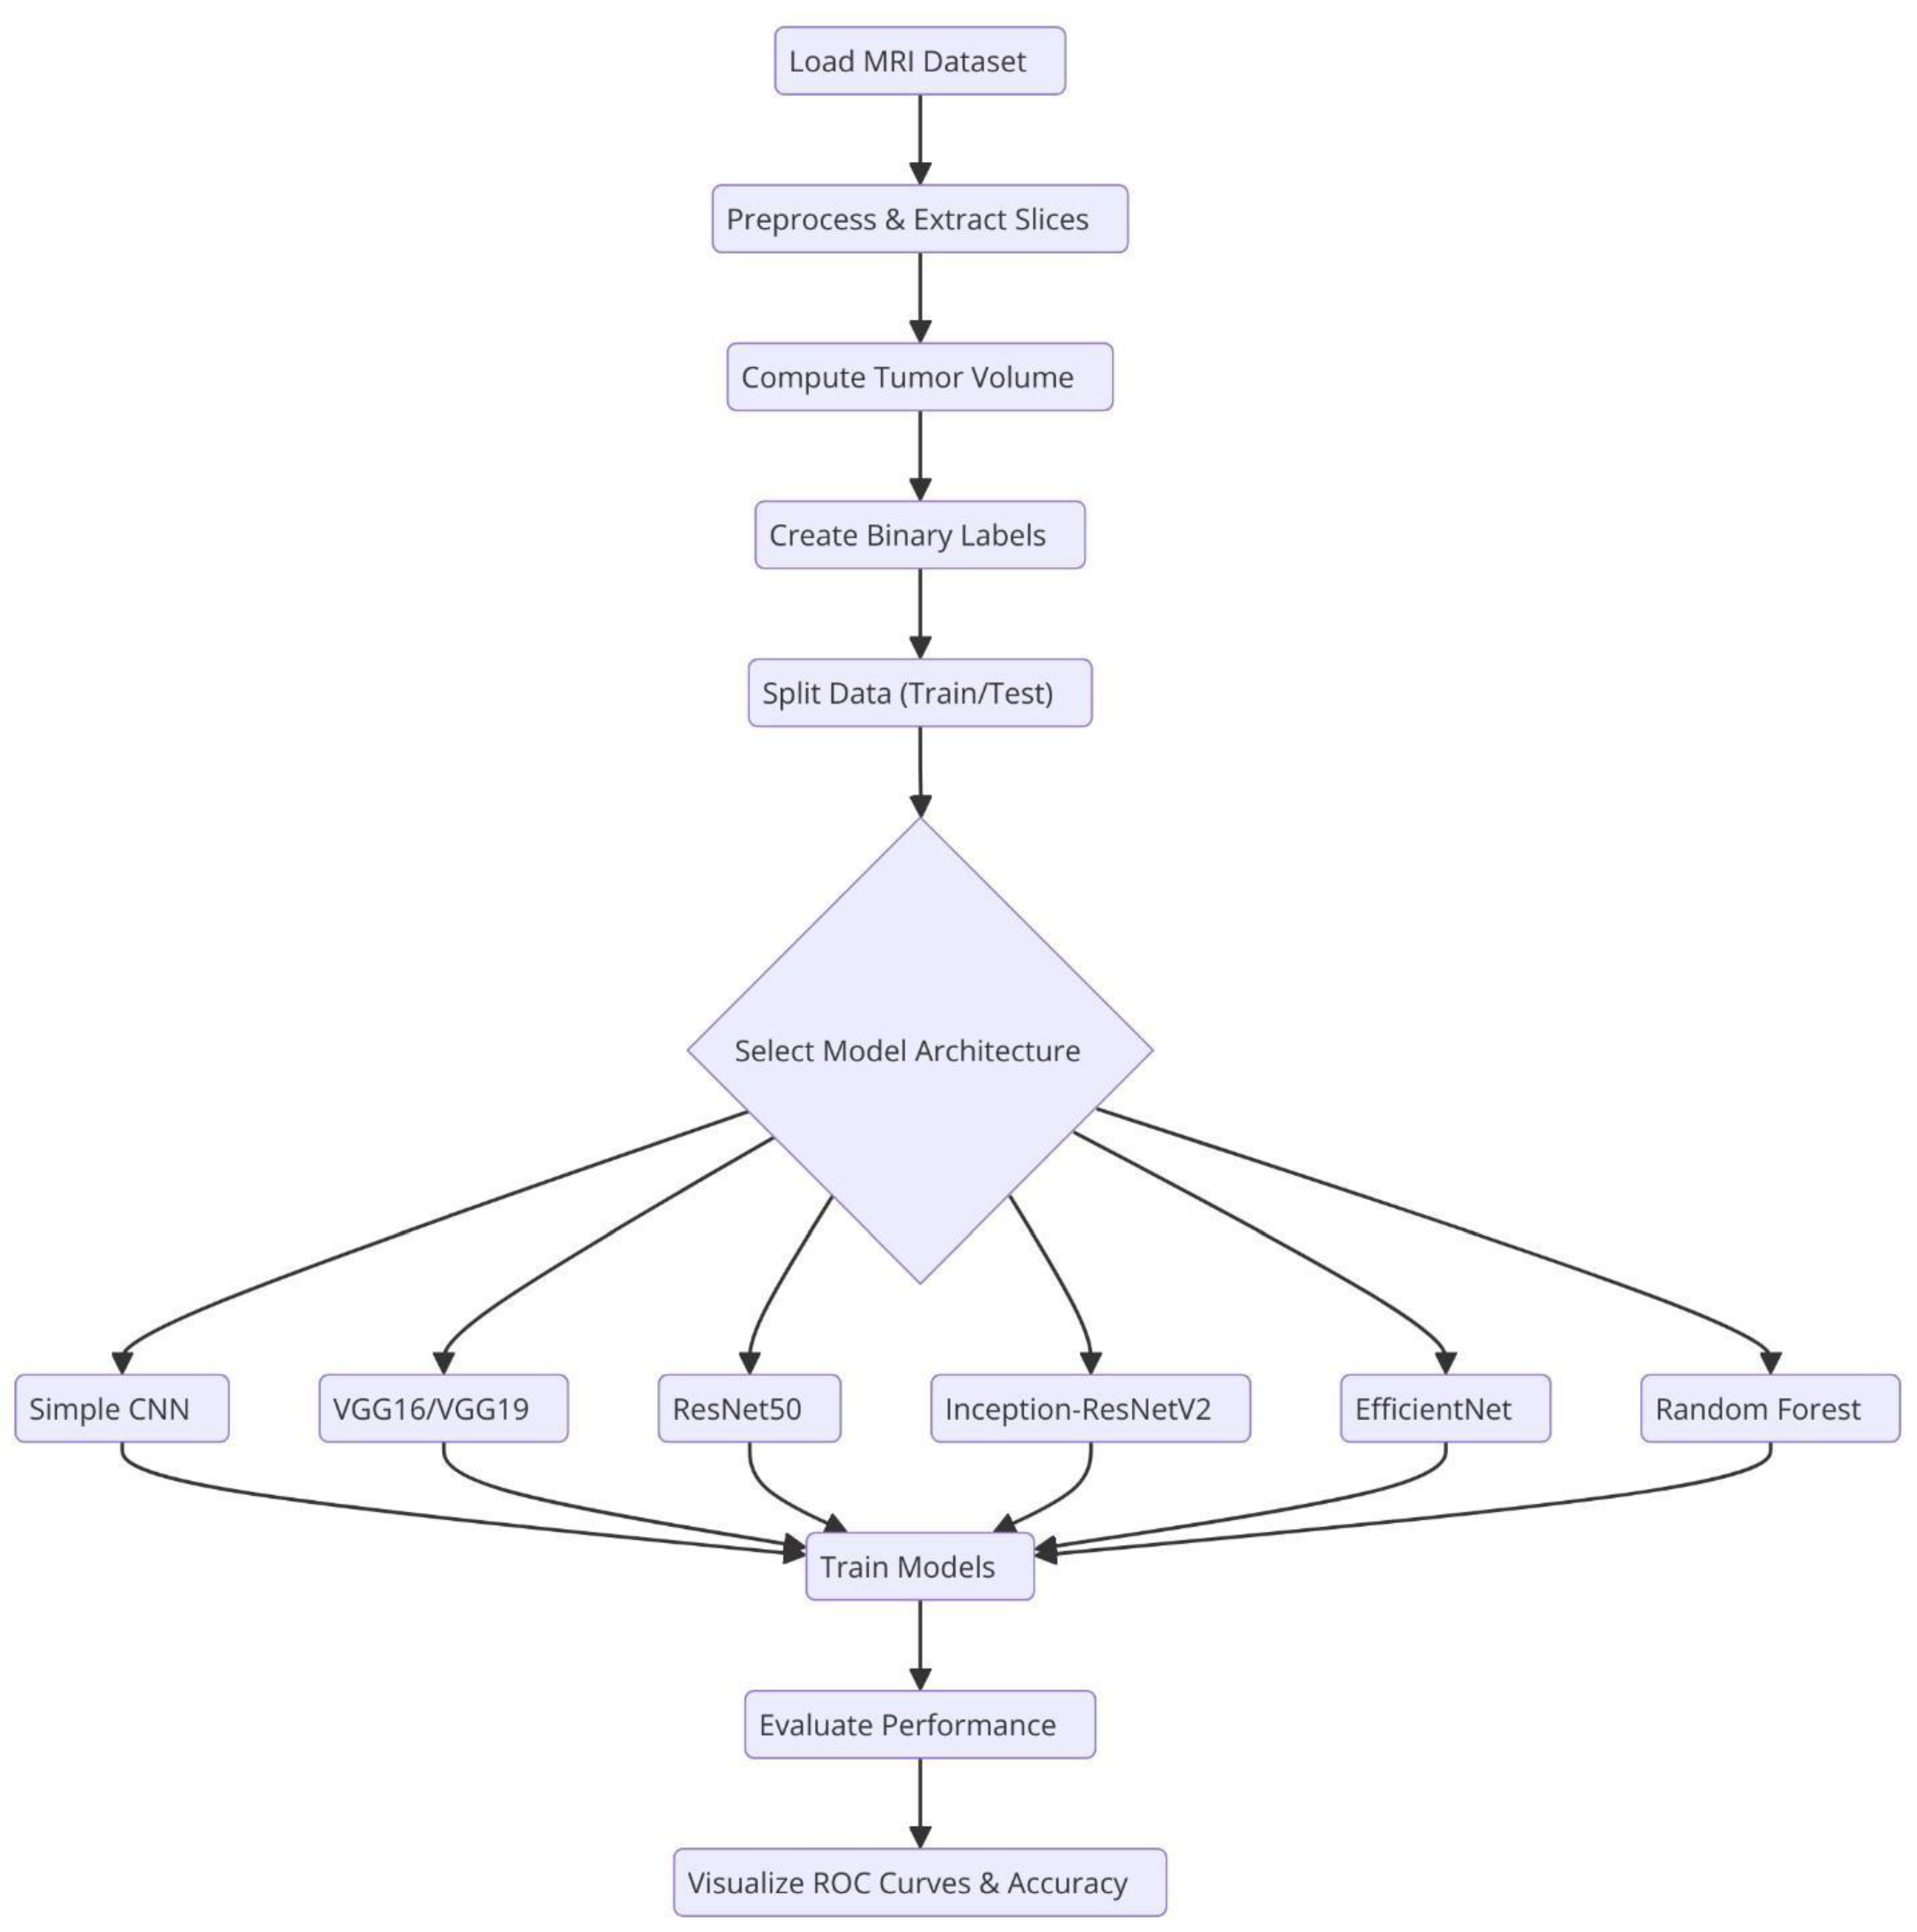
Figure.
Overall system architecture of the system. .
Random Forests have also been used for tumor classification by finding best separating hyperplanes or decision trees grown in the feature space (extracted using other set of features) (Pathak, 2024). New and more sophisticated neural network architectures, such as NeuraClassNet (Jayachandran & Anisha, 2024) and MDCNet (ThamilSelvi et al., 2024) have reached 99.67% accuracies via novel optimization techniques and multi-view analyses. However, these advancements do not guarantee solution, mainly due to data and model complexity. By using the traditional image processing and the contemporary computational intelligence methods, we may gain robust solutions for diverse imaging modalities, whereby these constraints are addressed to improve clinical applicability (Batool & Byun, 2024).
Convolutional Neural Networks (CNNs) and Pre-trained Models>
Convolutional Neural Networks (CNNs) have become essential for brain tumor classification because they perform automatic feature extraction from medical imaging data. Pre-trained CNN models have received validation from multiple research studies for their effectiveness in this area. In brain tumor classification medical imaging applications VGG-16 demonstrated its effectiveness by reaching a high 98% accuracy rate according to studies by Vellanki et al., 2024 and Vetrivelan et al., 2024. The ResNet architecture, especially ResNet50, produced strong results with validation accuracies reaching up to 89.47% according to Muftic et al. and Padmakala & Maheswari both in 2024. The EfficientNetB0 and EfficientNetB3 models shows effectiveness by achieving high accuracy levels of 98.36% and 99.44%, respectively (Gencer & Gencer, 2025; Muftic et al., 2024; Rasa et al., 2024). DenseNet models have superior performance by achieving validation accuracies upto 95% (Padmakala & Maheswari, 2024). The pretrained models that use transfer learning mechanism has the capability to reuse features from large datasets thereby providing significant benefits for medical imaging applications that has limited dataset availability.
Hybrid and ensemble learning approaches are used to further enhance the classification accuracy by combining the advantages of multiple models. As an example, the PDSCNN-RRELM combines a lightweight parallel depthwise separable convolutional neural network (PDSCNN) with a hybrid ridge regression extreme learning machine (RRELM) and achieves a great average precision of 99.35% (Nahiduzzaman et al., 2025)). The custom four residual deep learning architecture (4RDL-DCNN) optimized by particle swarm optimization achieved high effectiveness with the accuracy of 98.60 % (Ullah et al., 2024) is another noteworthy model. Additionally, a classification accuracy of 95 (Gasmi et al., 2024) was achieved on a ViT and EfficientNet-V2 ensemble combined through a genetic algorithm. Ensemble methods demonstrated consistently better results than individual models, benefitting from the strength of combining different architectures to obtain better results.
Improvement of model performance and building trust rely heavily on explainability and optimization techniques. The accuracies achieved for various datasets (Gencer & Gencer, 2025) with the integration of the Quantum Genetic Algorithm (QGA) with EfficientNetB0 are 98.36 and 98.25. In a similar manner, the Particle Swarm Optimization (PSO) algorithm is introduced to optimize the feature extraction process in the custom 4RDL-DCNN model obtaining an accuracy of 98.60% (Ullah et al., 2024). Moreover, weights in the combined system of Vision Transformers (ViT) and EfficientNet-V2 models are optimized using the Genetic Algorithm (GA) to achieve 95% classification accuracy (Gasmi et al., 2024). The optimization approaches also improve the feature selection and model weight adjustments to yield improved classification performance.
Although deep learning models dominate the field, conventional machine learning (ML) techniques have shown potential in brain tumor classification. The Gaussian Process Classifier (GPC), combined with principal component analysis (PCA), has exhibited notable improvements in accuracy, precision, recall, and F1-score (Gu & Ren, 2024). Support Vector Machines (SVMs) have also been utilized alongside feature selection methods like the Gini index and mutual information, yielding competitive results (Gu & Ren, 2024; Abdfilminaam et al., 2024). Despite their inherent advantages, traditional machine learning (ML) models generally underperform compared to deep learning architectures in image-based classification tasks.
In medical applications, explainability is extremely important in order to achieve clinical trust in model decisions. To clarify its decision making process, the PDSCNN-RRELM model has been incorporated with Shapley Additive Explanations (SHAP) (Nahiduzzaman et al., 2025). Moreover, Gradient-weighted Class Activation Mapping (Grad-CAM) has been employed to visualize the decision making of deep learning models in order to increase their interpretability (Li & Dib, 2024). These approaches make deep learning models in clinical environments transparent and reliable.
Significant improvement of model performance was achieved through the application of transfer learning and advanced data preprocessing techniques. We fine tune pre trained models like VGG16, Resnet50, EfficientNetB3 on brain tumor datasets to achieve the state of the art results (Muftic et al., 2024; Rasa et al., 2024). Additionally, data augmentation techniques such as sparse autoencoder based augmentation and contrast limited adaptive histogram equalization (CLAHE) (Ullah et al., 2024; Li & Dib, 2024) were used to enhance the diversity of the dataset and improve model generalization.
Different performance metrics such as accuracy, precision, recall and F1 score have been used to evaluate various models effectiveness. Vellanki et al. made noteworthy findings, namely that VGG-16 has achieved 98% accuracy in brain tumor classification while Gencer & Gencer obtained 98.36% accuracy over traditional methods with EfficientNetB0. The denseNet has shown good generalization to a validation accuracy of 95% (Padmakala & Maheswari, 2024). In addition, the accuracies of ensemble models using multiple deep learning architectures (Patro et al., 2024) can reach up to 99.43%.
There has been progress, but there are still a lot of obstacles. We observe that trained with a small amount of data, models such as EfficientNetB3 and VGG-19 have signs of overfitting (Muftic et al., 2024; Rasa et al., 2024). In order to train more complex models, larger datasets are required (Muftic et al., 2024; Rasa et al., 2024). Furthermore, most of the models have been tested on the standard datasets, which makes it important to evaluate them further in real clinical settings (Padmakala & Maheswari, 2024; Srinivasan & Regan, 2024). Other issues should be tackled in future studies and new architectures and optimization methods explored to improve model accuracy and dependability.
- B. Overview of the BraTS 2024 Dataset
The BraTS 2024 database contains T1w, T1w contrast enhancement (T1c), T2w, and FLAIR sequence types, each offering distinct information for imaging various aspects of tumor morphology and structure (de Verdier et al., 2024). This research concentrated on utilizing a subset of these modalities, specifically contrast-enhanced T1 (T1c), T2w, and T2-FLAIR (or T2w) images for tumor classification. Additionally, the corresponding segmentation masks were employed to extract quantitative measurements (such as tumor size) used to create binary labels. Patients with tumor volumes exceeding the median were classified as having high tumor burden, while those below the median were categorized as having low tumor burden.
- C. Motivation for a Comparative Study
For decades, deep learning has the potential to solve the complex patterns in medical images. The architectures that we use in these are VGG16 (Yang et al., 2021), VGG19 (Wen et al., 2019), ResNet50 (Wen et al., 2020), Inception-ResNetV2 (Li et al., 2022) and EfficientNet (Tan et al., 2019) that are known to achieve current state of the art for many image classification tasks. Even in this case, classical machine learning techniques, e.g., Random Forests, are very competitive (and in combination with PCA robust feature extraction, which is in particular useful when there is a lack of data and/or the features are very discriminative).
- D. Objectives and Contributions of the Study
Despite numerous studies using these methods, to the best of our knowledge, there has not been an such a comprehensive evaluation on the BraTS 2024 dataset in the literature. This gap is filled by evaluating several state of the art deep learning models as well as Random Forest classifier on PCA reduced features. Secondly, we compared these models in terms of accuracy, loss, and confusion matrices and made visualisations of the results at the individual and aggregate levels.
- E. Objectives
This research has three main goals.
First, it evaluates how different deep learning models and a traditional Random Forest classifier perform when applied to the BraTS 2024 dataset.
Second, it examines how various data preprocessing techniques and labeling approaches affect model effectiveness.
Lastly, this investigation provides valuable insights and suggestions for enhancing brain tumor classification methods. The findings are intended to inform future studies and practical applications of automated brain tumor detection and analysis.
II. Dataset and Preprocessing
In this section, we describe the BraTS 2024 dataset used in our study and detail the preprocessing pipeline implemented to prepare the data for model training. The focus was on leveraging multimodal MRI scans, extracting relevant features, and generating labels for binary classification.
- A. Dataset Description
The BraTS 2024 dataset provides a comprehensive collection of multimodal MRI scans of patients with brain tumors. Each patient folder in the dataset contained several NIfTI files corresponding to different imaging modalities, including:
T1c (Contrast-Enhanced T1): Highlights regions with blood–brain barrier disruption.
T2w (T2-Weighted): Provides a high signal intensity for fluid regions.
T2-FLAIR (Fluid-Attenuated Inversion Recovery): Suppresses cerebrospinal fluid signals to better visualise the lesions.
Segmentation Masks: Contain expert annotations delineating the tumor regions.
In our study, we utilised the T1c, T2w, and T2-FLAIR modalities to construct a 3-channel input image for each patient, while the segmentation mask was used to derive quantitative measures, such as tumor volume.
B. Data Acquisition and Directory Structure
The dataset was obtained from a Kaggle repository and organised into patient-specific folders. For example, a typical folder (for example, BraTS-GLI-02632-102) contains files named according to the following pattern:
- BraTS-GLI-02632-102-t1c.nii
- BraTS-GLI-02632-102-t2w.nii
- BraTS-GLI-02632-102-t2f.nii
- BraTS-GLI-02632-102-seg.nii
This hierarchical structure facilitates individual patient-level processing, ensuring that each modality and its corresponding segmentation mask are correctly associated with each other.
- C. Preprocessing Pipeline
Harmonising data for training requires a preprocessing step. For the data preprocessing pipeline, nibabel library was used to load the NIfTI files. Middle slices were extracted from each modality (T1c, T2w, and T2-FLAIR) assuming that they represent the tumor region. Finally, each extracted slice was resized to 128×128 pixels using the resize function from skimage.transform and normalised to the [0,1] range to reduce variability across scans. A stack of 3 channel image was formed for each patient by stacking the processed slices from the three modalities along the channel dimension. Then, a segmentation mask was used to compute the tumor volume by counting nonzero voxels, which served as a quantitative measure used to develop classification labels.
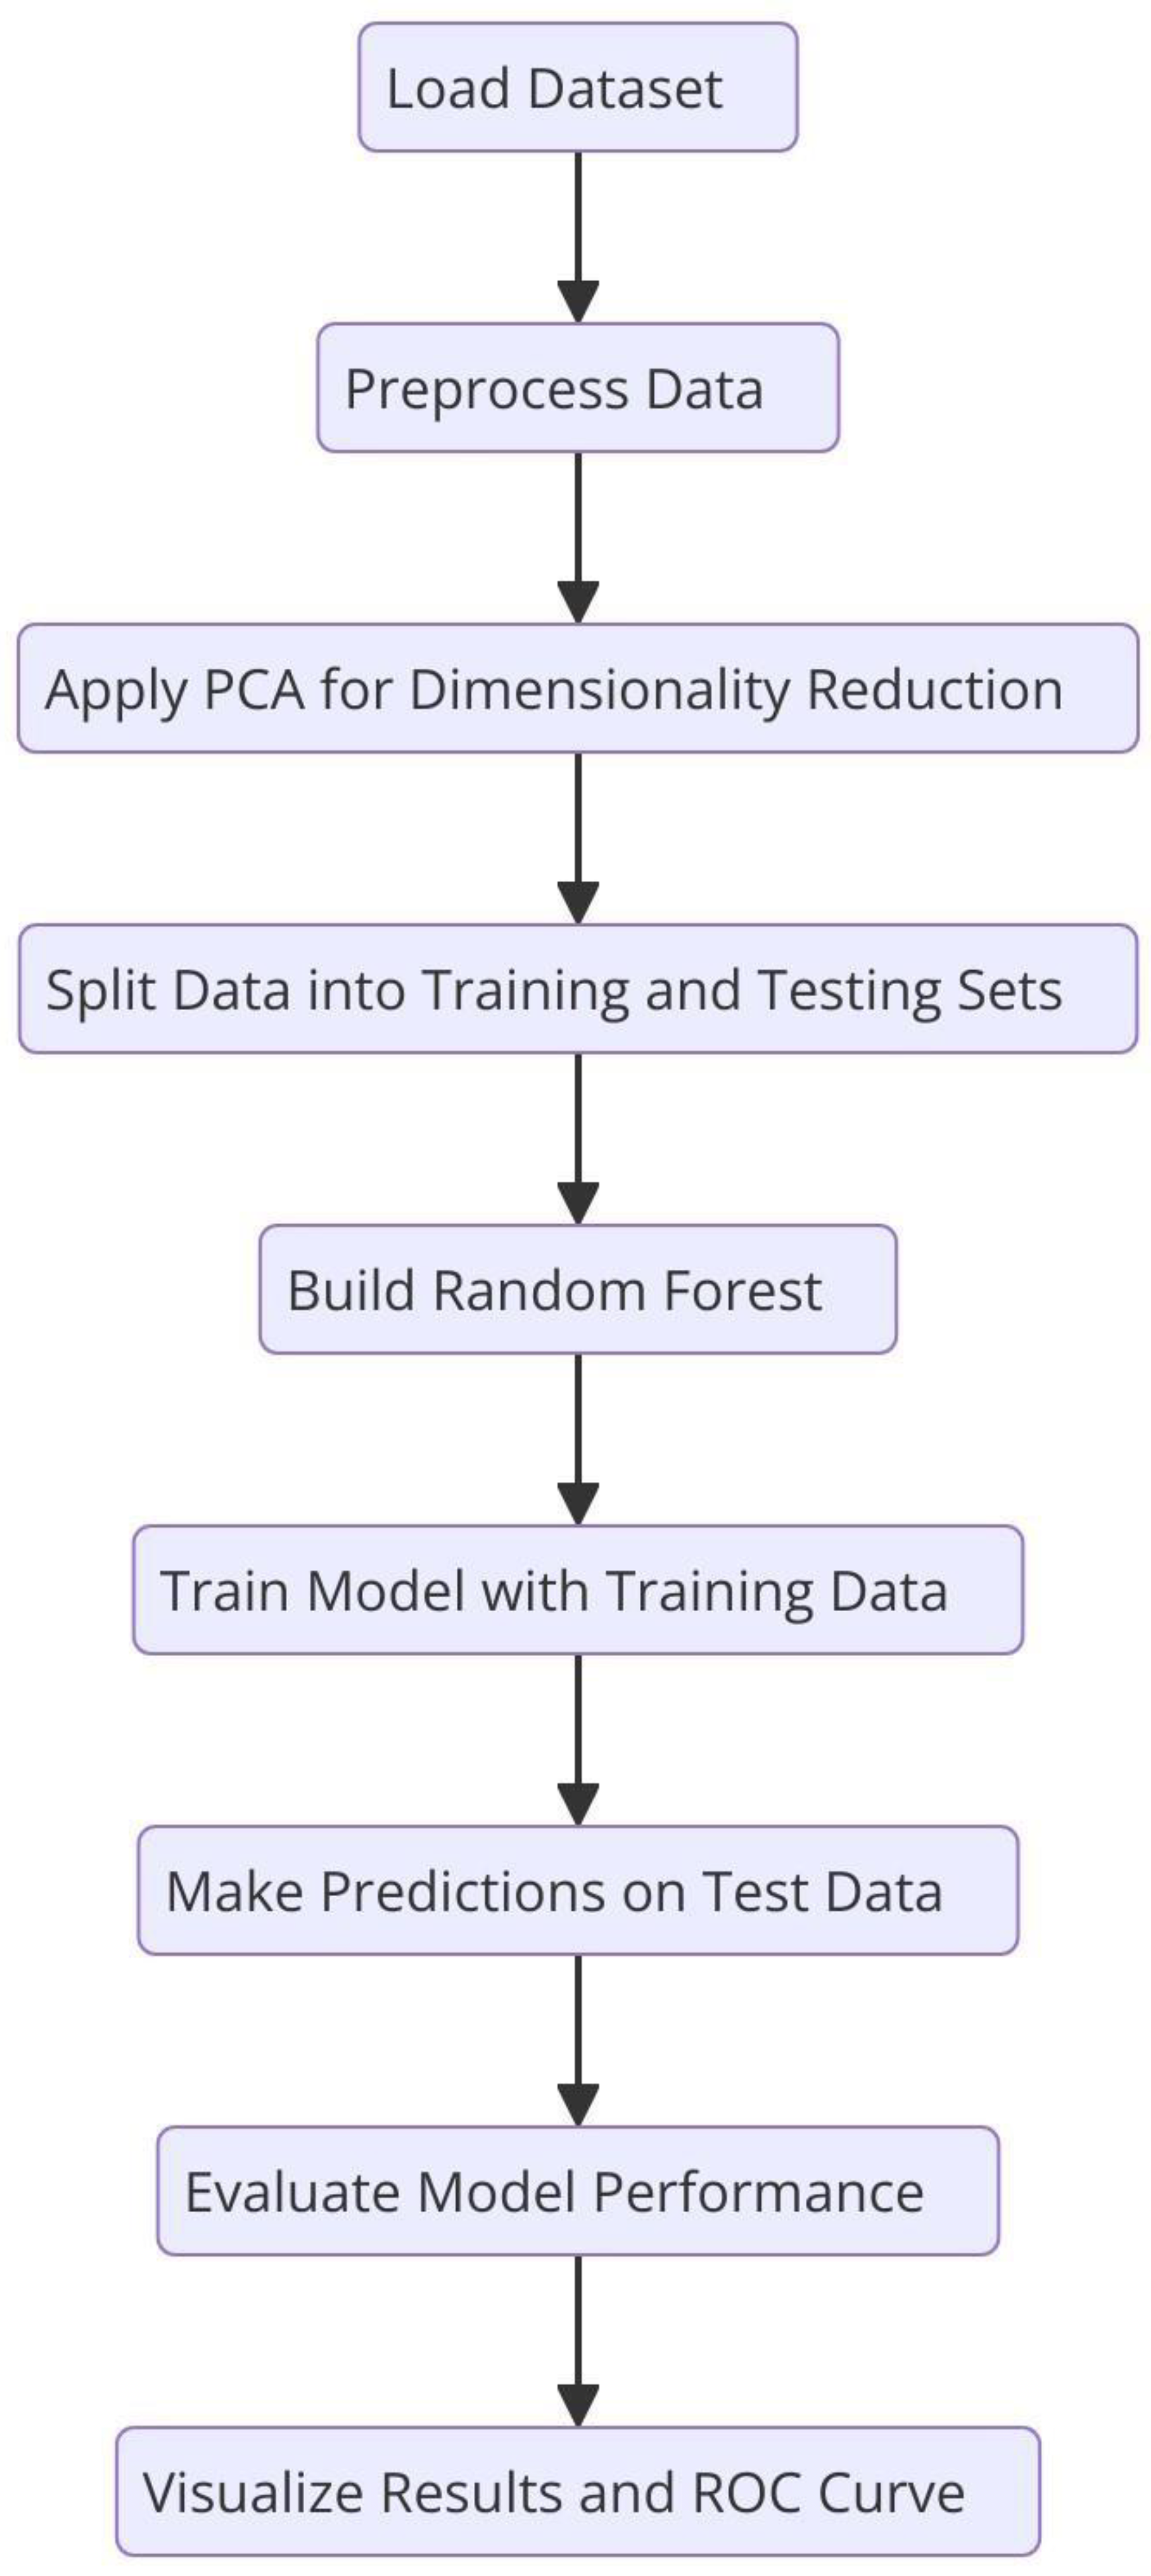
Figure.
Flowchart of the Random Forest algorithm. .
- D. Label Generation
As there is no explicit clinical labels in the dataset, the binary classification labels were computed based on the tumor volume. More specifically, for all patients the median tumor volume was calculated and if a tumor volume exceeded the median, 1 was assigned as its label (indicative of a high tumor burden). Patients with volumes above the median were labelled with a value of 1, indicating a high tumor burden, and patients with volumes below the median were given a label of 0. It also leads to a balanced binary labelling scheme for the classification task.
- E. Data Splitting
The data were preprocessed and labeled, and the data were partitioned into training and testing subsets by 80/20 ratio. The partition was done at patient level so that there are no patient data in both the training and the testing sets. This approach helps in keeping the independence of the evaluation data and gives a fair estimate of the model performance. The following section details how the BraTS 2024 dataset was prepared for classification. The first step of preprocessing made sure that the imaging data were the same size and intensity, and the second step ensured that the label generation step allowed for a clear definition of classes in terms of the tumor burden. These procedures were used to guide subsequent model training and evaluation as laid out in the next sections.
III. Methodology
In this section, we describe the overall experimental design, including the models evaluated, training procedures, and evaluation metrics and visualisations used to compare performance.
- A. Models Evaluated
To capture the intricate patterns in brain MRI data present, we used several state-of-the-art deep learning architectures using transfer learning. The foundational model of ours baseline was a Simple CNN, or a custom designed convolutional neural network. Later we use VGG16, 16-layer architecture which is suitable for transfer learning by freezing the convolutions base and appending custom fully connected layers, then we use VGG19 that extends the to 19 layers in order to include more abstract features. And we also incorperated ResNet50, which is a 50-layer residual network with shortcut connections, to train slower models. Inceptioins modules and residual connection based advanced hybrid (InceptionResNetV2), were introduced to capture features at different scales. The EfficientNet balanced model depth, width, and resolution through compound scaling, signifying a current design body of a model.
A Random Forest classifier is the classical machine learning approach which, in addition to deep learning models, was used for classification. Then, for this method, image detecting features were extracted through flattening the pixel intensities and followed by the dimensionality reduction method of Principal Component Analysis (PCA). Under conditions where the dataset size was limited, this classical technique acted as a benchmark for the deep learning models.
- MATHEMATICAL FORMULATION OF THE RANDOM FOREST CLASSIFIER
In our study on brain tumor classification using the BraTS2024 dataset, we employ a Random Forest classifier to distinguish between cases of high and low tumor volumes. Prior to classification, each patient’s multi-modal brain MRI comprising t1c, t2w, and t2f sequences is preprocessed and flattened into a high-dimensional feature vector x. To reduce dimensionality and mitigate overfitting, Principal Component Analysis (PCA) is applied to project these feature vectors onto a lower-dimensional space.
This transformation is mathematically expressed as:
where x represents the mean of the training data and W is the projection matrix containing the top principal components. The transformed feature vector z thus captures the most significant variance in the data while discarding redundant information.
𝑧 = 𝑤𝑇(𝑥 − 𝑥 )
The Random Forest classifier then operates on these PCA-reduced features. Let Tk(z) denote the prediction made by the k − tℎ decision tree in the ensemble for the transformed input z. In a binary classification setting (with class labels 0 for low tumor volume and 1 for high tumor volume), the final prediction y^ is obtained through a majority voting scheme:
𝑦^ = 𝑚𝑜𝑑𝑒{𝑇1(𝑧), 𝑇2(𝑧), … , 𝑇𝐾(𝑧)}.
This process can also be formulated as:
where 1{Tk(z) = c}is an indicator function that equals 1 if the k − tℎ tree predicts class c and 0 otherwise.
𝑦^ = 𝑎𝑟𝑔 𝑚𝑎𝑥 𝑐∈{0,1}Σk = 1K1{TK(z) = c},
Alternatively, if each tree provides a probabilistic
estimate pk(y = c | z) for class c, the ensemble’s class
probability is calculated as the average of these estimates:
𝑘
𝑝^(y = c |z) = 1/𝐾 Σ p k(y = c | z).
𝑘
The final class label is then determined by selecting the class with the highest average probability:
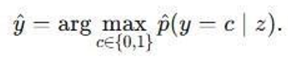
In the context of the BraTS2024 dataset, this approach leverages the multi-modal imaging data by first condensing it via PCA and subsequently classifying patients based on tumor volume. The ensemble strategy inherent in Random Forests enhances robustness and generalization, making it a valuable complement to deep learning models in our comparative analysis.
- B. Training Setup and Hyperparameters
Each model was trained using a consistent pipeline to ensure fair comparison. The following steps outline our training setup.
- Data Preprocessing:
We extracted the middle slice from each modality (T1c, T2w, and T2-FLAIR) and resized it to 128×128 pixels. Next, the three modalities were stacked to form a three-channel image, ensuring that each channel corresponded to a specific modality. Finally, all images were normalised to the [0, 1] range to maintain consistency across the models.
- Data Splitting and Augmentation:
The dataset was split into training and testing sets using an 80/20 ratio, ensuring that no patient appeared in both sets. To further enhance model generalisation, data augmentation techniques, such as rotation, flip, and scaling, were applied during the training process, effectively increasing the sample size and diversity of the data.
- Hyperparameter Settings:
We employed the Adam optimiser with learning rates ranging from 1e-4 to 1e-3, depending on the model, and utilised Categorical Cross-Entropy as the loss function to handle binary classification with one-hot encoded labels. A batch size of 8 was used, and training initially spanned five epochs, which was increased as needed for improved performance. In terms of transfer learning, the convolutional bases of the pretrained models were frozen during the early experiments, with the option of unfreezing and finetuning additional layers in future trials.
For the Random Forest approach, images were flattened, and Principal Component Analysis (PCA) was applied to reduce feature dimensionality by setting n_components to the minimum of 50 or the number of training samples. Subsequently, the Random Forest classifier was trained with 100 estimators and default parameters, serving as a classical benchmark alongside the deep learning models.
- C. Evaluation Metrics and Visualizations
The model performance was evaluated in terms of metrics and visualisations to cover almost all aspects of it. First, the training and validation accuracies and loss of each deep learning model was plotted against number of epochs in order to examine the learning behaviour and convergence. To help understand the classification performance, true positives, false positives, true negatives, false negatives, etc., were used to create confusion matrices to elucidated class imbalances, or systematic misclassifications. ROC curve analysis then completed with the associated AUC values which includes information about trade-off between sensitivity and specificity in levels of classification threshold. Individual model visualisations as well as aggregate plots between the final accuracies and losses were produced for direct comparison between the different approaches, and a grid layout of all matrices of confusion. The BraTS 2024 dataset is used to collectively evaluate these methods as a robust evaluation framework for brain tumor classification using the data, their descriptions, training strategies, and assessment techniques combined both for deep learning and classical machine learning.
IV. Experimental Results
This section presents the experimental results of the BraTS dataset 2024 used in this study. Deep learning models and classical Random Forest classifier are evaluated for comparison. The performances of both individual and aggregated models are visualized in terms of accuracy, loss and confusion matrices.
- A. Performance Overview
The experiments are evaluated using the BraTS 2024 dataset. The data in the dataset is preprocessed for each patient by extracting the middle slices of three imaging modalities (T1c, T2w, T2-FLAIR) and normalizing them. To create binary labels from the tumor volume computed based on the segmentation masks, the median volume was chosen as the threshold. The following accuracy results were obtained for the test set:

Table.
Comparison table of percentage accuracies of various machine learning models. The Random Forest
model with PCA features had the highest accuracy of 87.5%. More complex CNN models performed with
lower accuracy rates. .
Table.
Comparison table of percentage accuracies of various machine learning models. The Random Forest
model with PCA features had the highest accuracy of 87.5%. More complex CNN models performed with
lower accuracy rates. .
| S. No | Model | Accuracy |
|---|---|---|
| 1 | Random Forest (with PCA features) | 87.5% |
| 2 | Simple CNN | 70.0% |
| 3 | VGG16 | 67.5% |
| 4 | VGG19 | 62.5% |
| 5 | Inception-ResNetV2 | 60.0% |
| 6 | ResNet50 | 47.5% |
| 7 | Efficient Net | 47.5% |
The above results suggest that in our experiments the deep learning models that we applied failed to match the performance of classical Random Forest classifier by large margin. On the other side of comparison, different deep models showed more ranges of performance, simple architecture (Simple CNN and VGG based networks) got higher accuracy than complex networks (ResNet50 and EfficientNet).
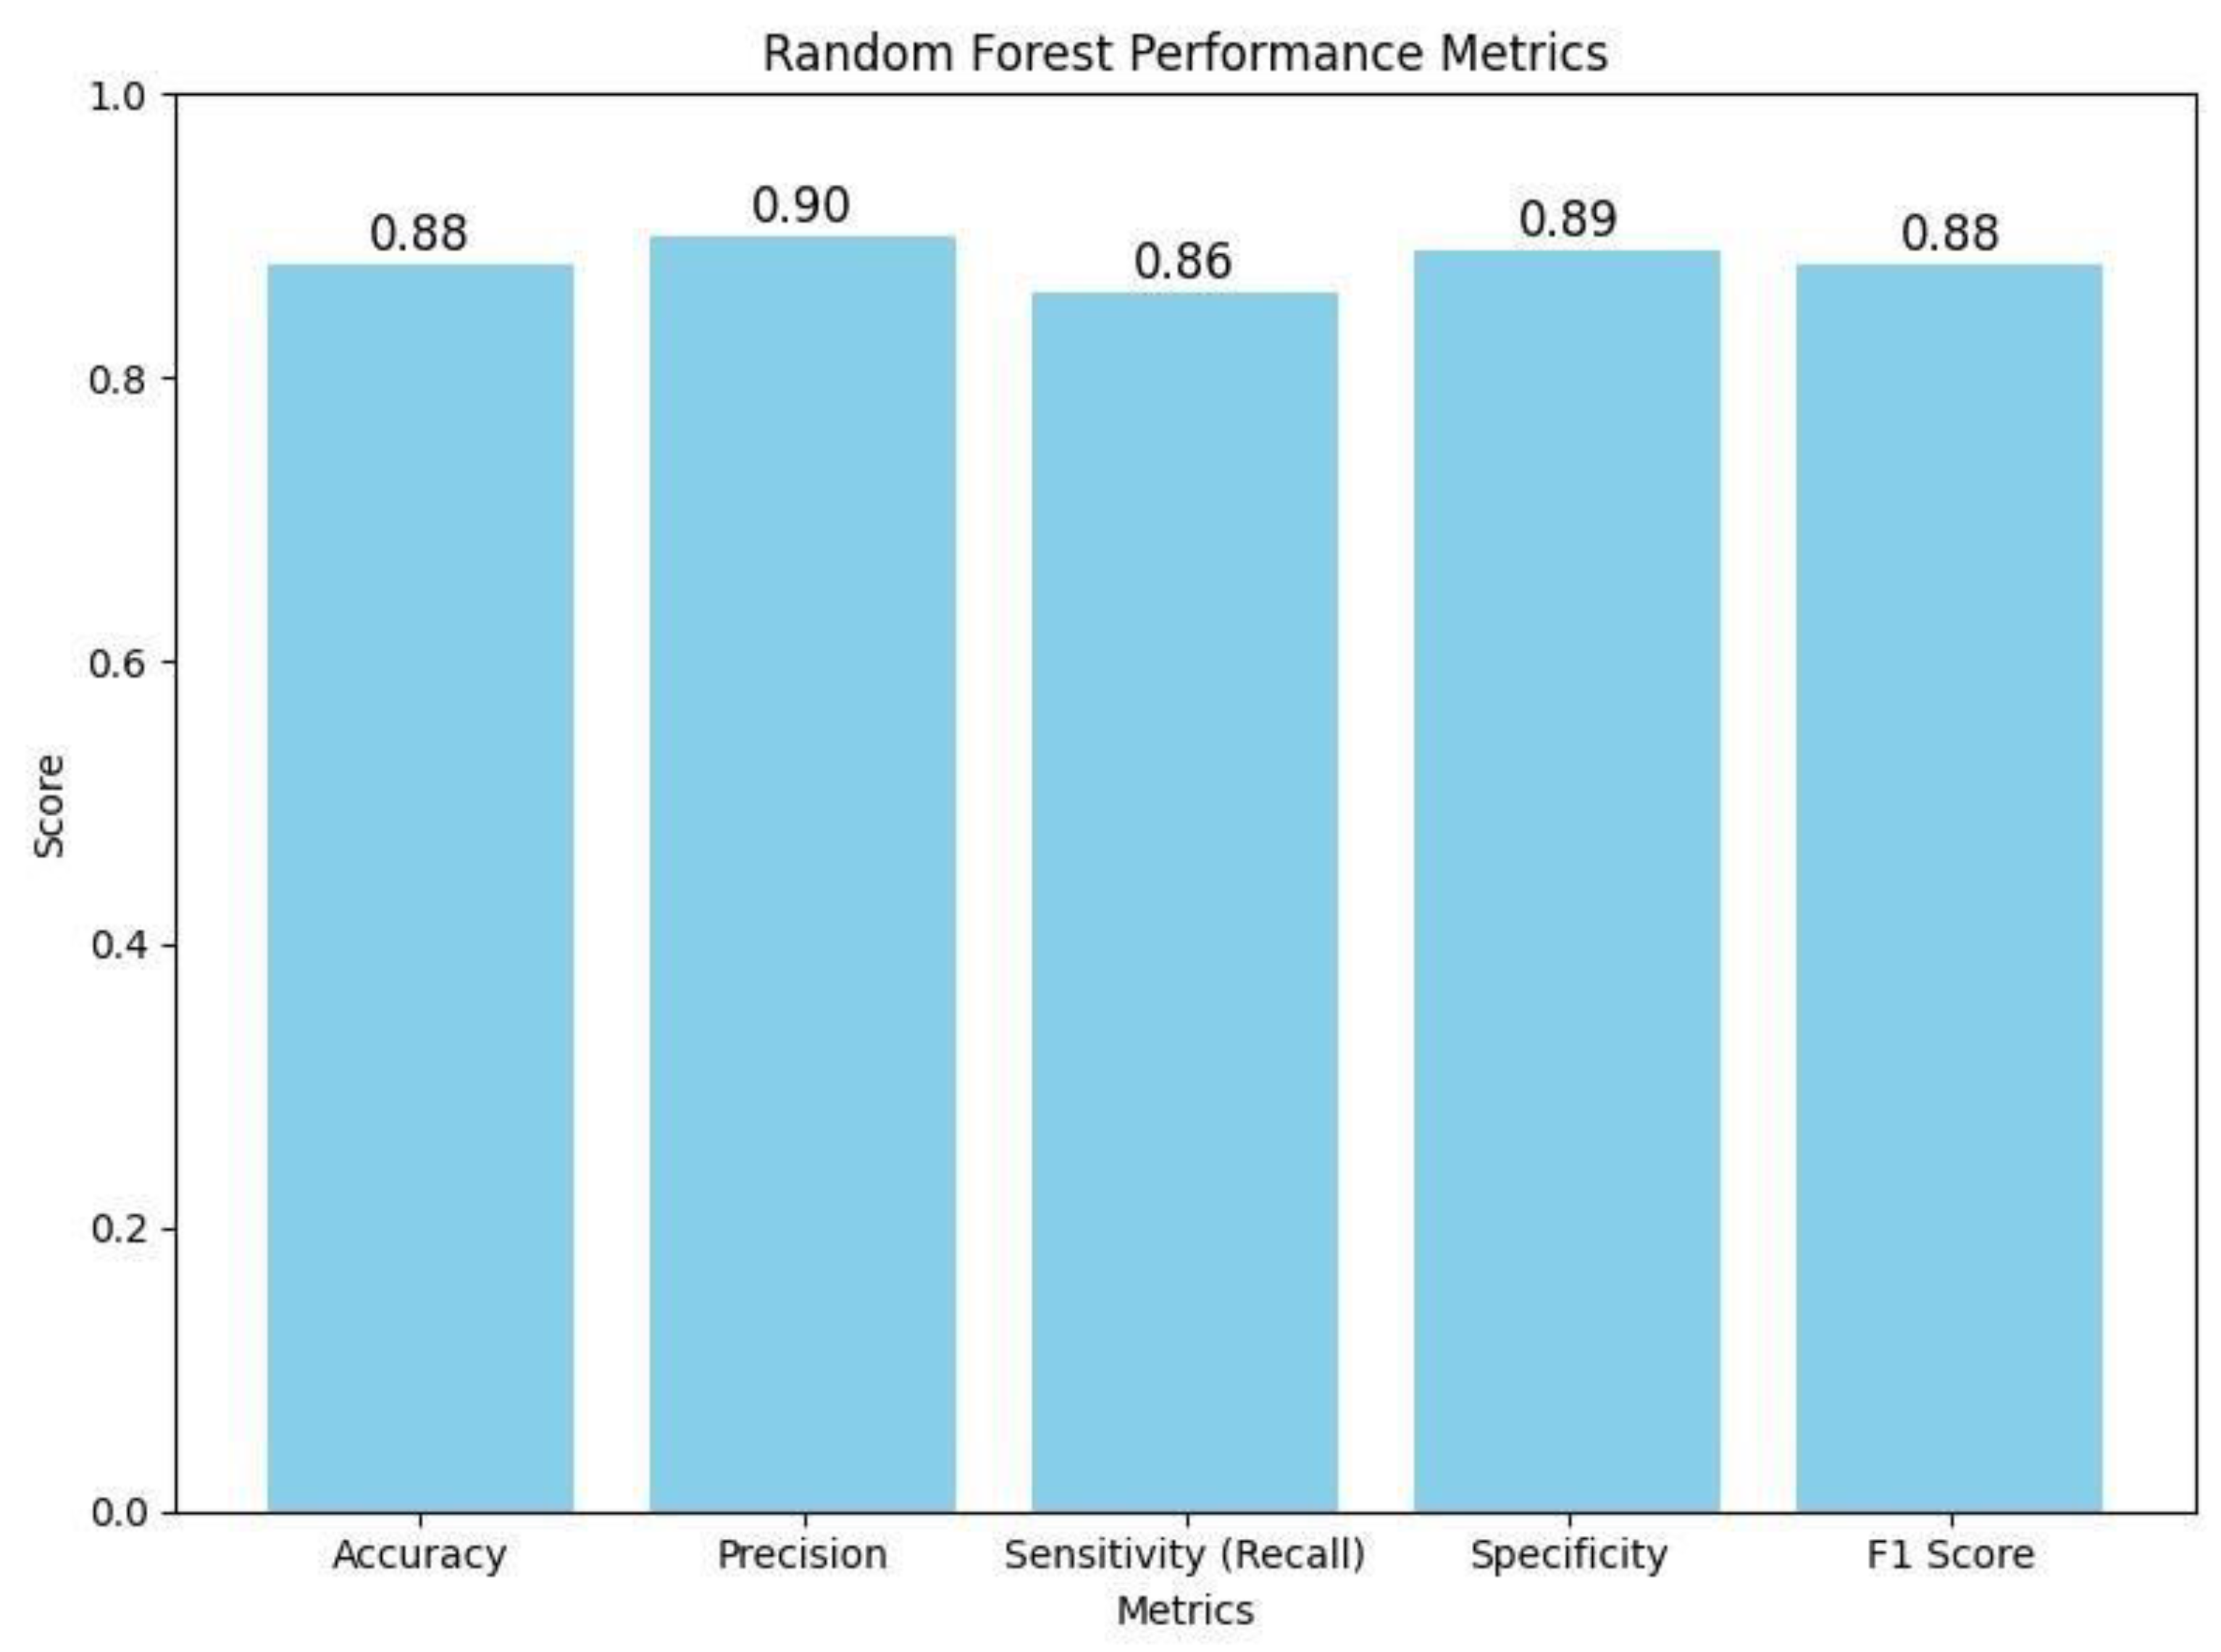
Table.
The table summarizes the key performance metrics for a Random Forest classifier. It displays the
model's overall accuracy (0.88) along with more detailed measures: precision (0.90) indicates how many of the
positive predictions were correct; sensitivity or recall (0.86) shows the model's ability to correctly identify
actual positive cases; specificity (0.89) reflects how well the model identifies negative cases; and the F1 Score
(0.88) provides a balance between precision and recall. Together, these metrics offer a comprehensive overview
of the classifier's performance. .
| Performance Metric | Accuracy |
|---|---|
| Accuracy | 0.88 |
| Precision | 0.90 |
| Sensitivity (Recall) | 0.86 |
| Specificity | 0.89 |
| F1 Score | 0.88 |
Figure.
This bar chart illustrates the Random Forest classifier's performance metrics on the BraTS 2024 dataset. The graph displays an accuracy of 0.88, precision of 0.90, sensitivity (recall) of 0.86, specificity of 0.89, and an F1 score of 0.88. These metrics collectively demonstrate that the classifier effectively balances true positive and true negative rates, ensuring robust discrimination between high and low tumor burden cases. The visualization underscores the efficacy of the traditional Random Forest approach, particularly when leveraging PCA-reduced features for brain tumor classification. .
- B. Detailed Visualizations for Each Model
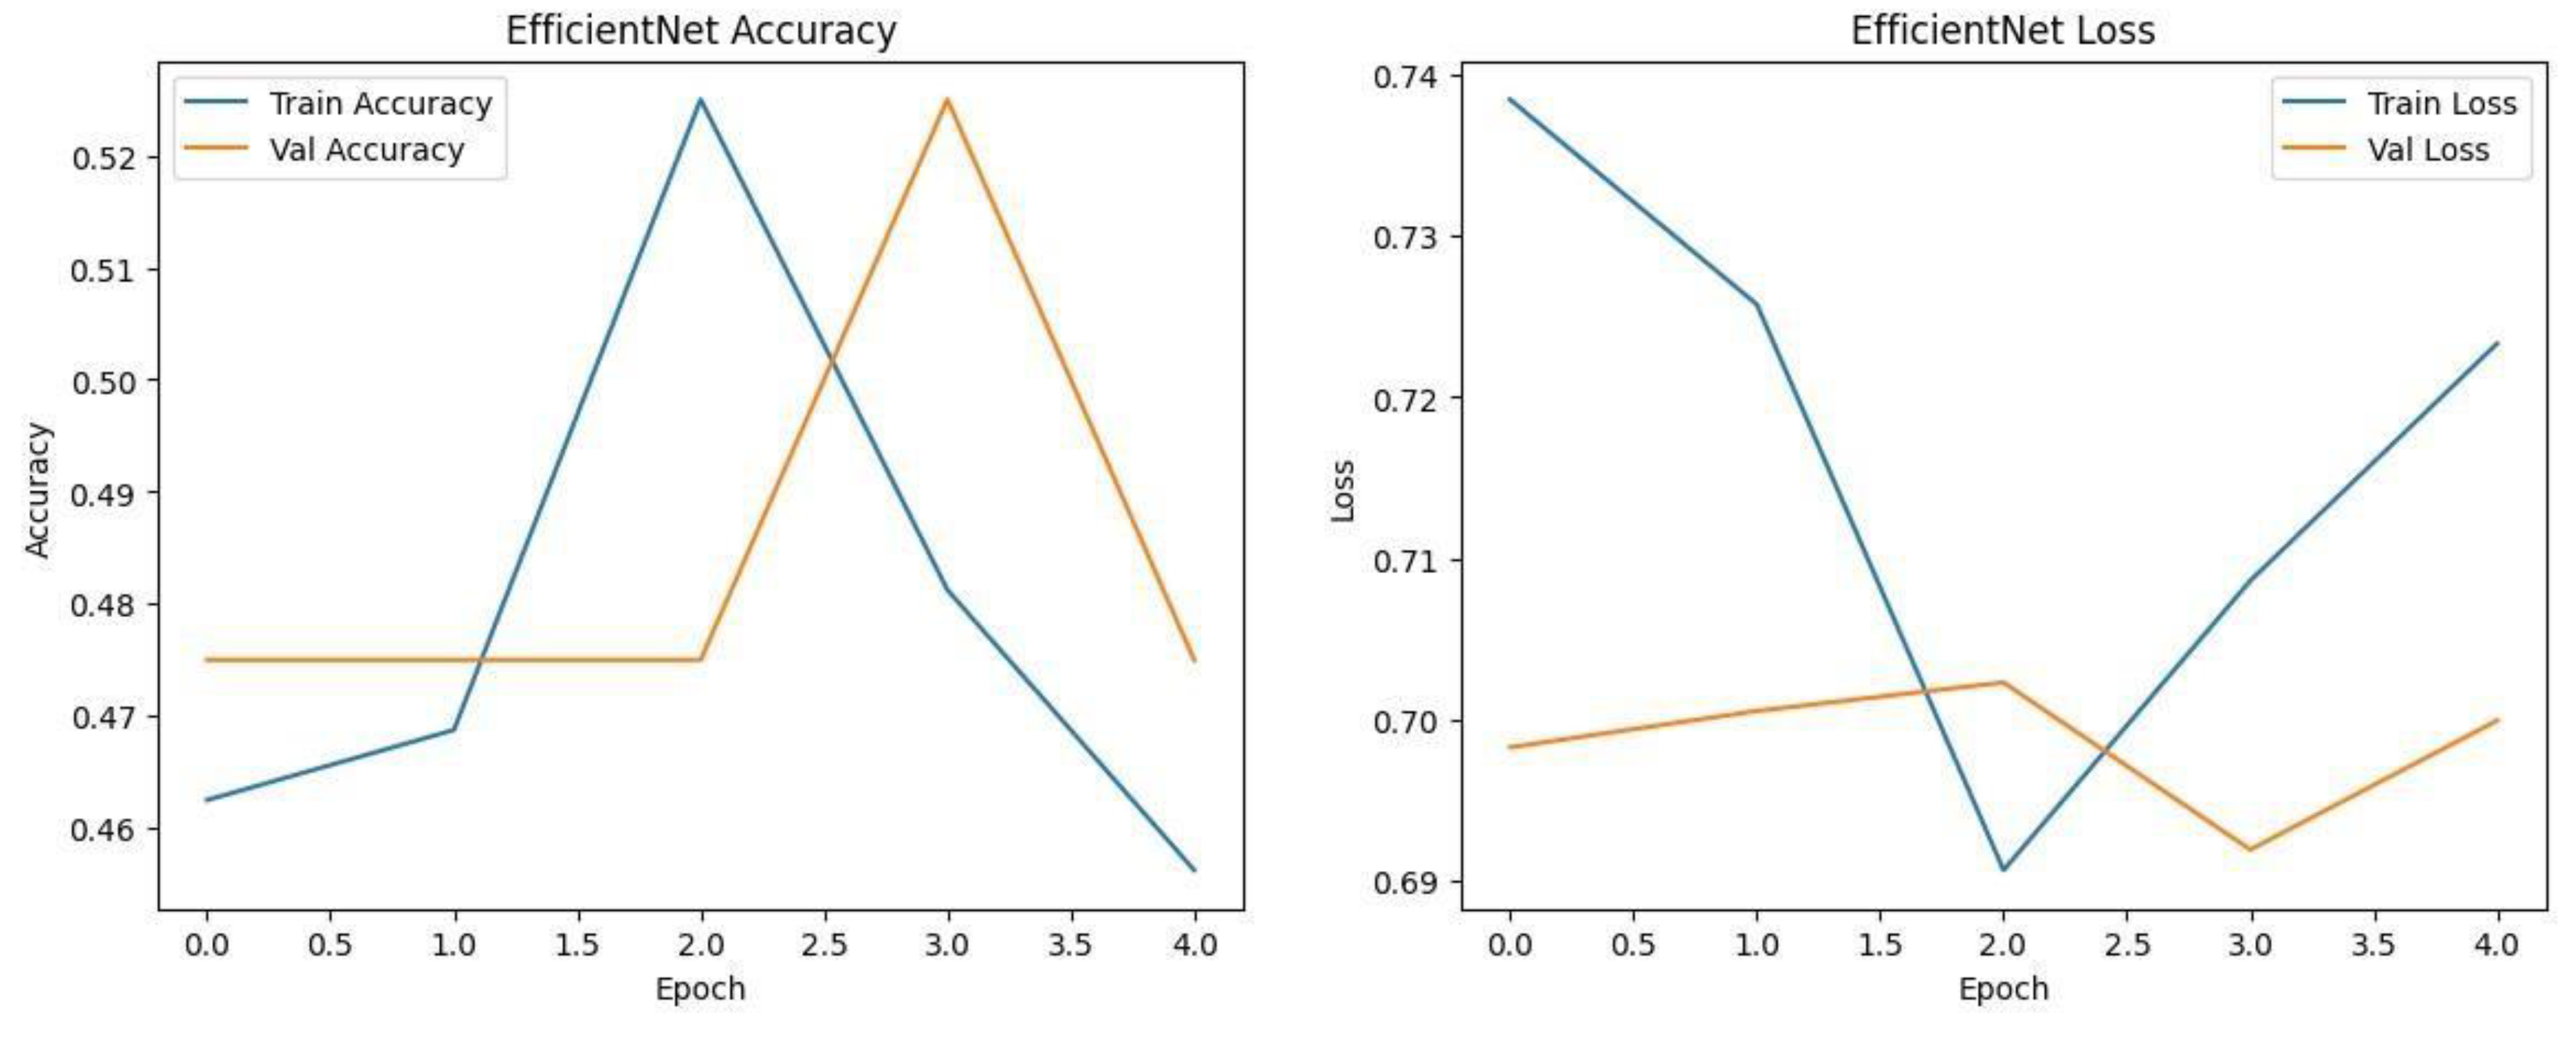
Each model was trained and validated independently in their respective loss curves and plotted the training and validation accuracies, and revealed themselves to be very good at learning. Accuracy of the Simple CNN increased with each training epoch and corresponding loss decreased. Same trends were observed in VGG16 and VGG19, but with slightly worse final accuracies. On the other hand, much harder architectures like ResNet50 and EfficientNet were not converging well as we see from the static accuracy curve and its relatively high loss values. At the same time, the better performance of the shallow architectures was complemented by moderate improvement of the InceptionResNetV2 model, which, however, could not achieve performance levels comparable to the straight architectures.
Figure.
Training graphs showing Accuracy and Loss curve of Simple CNN and VGG16 with transfer learning.
Figure.
Training graphs showing Accuracy and Loss curve of Simple CNN and VGG16 with transfer learning.
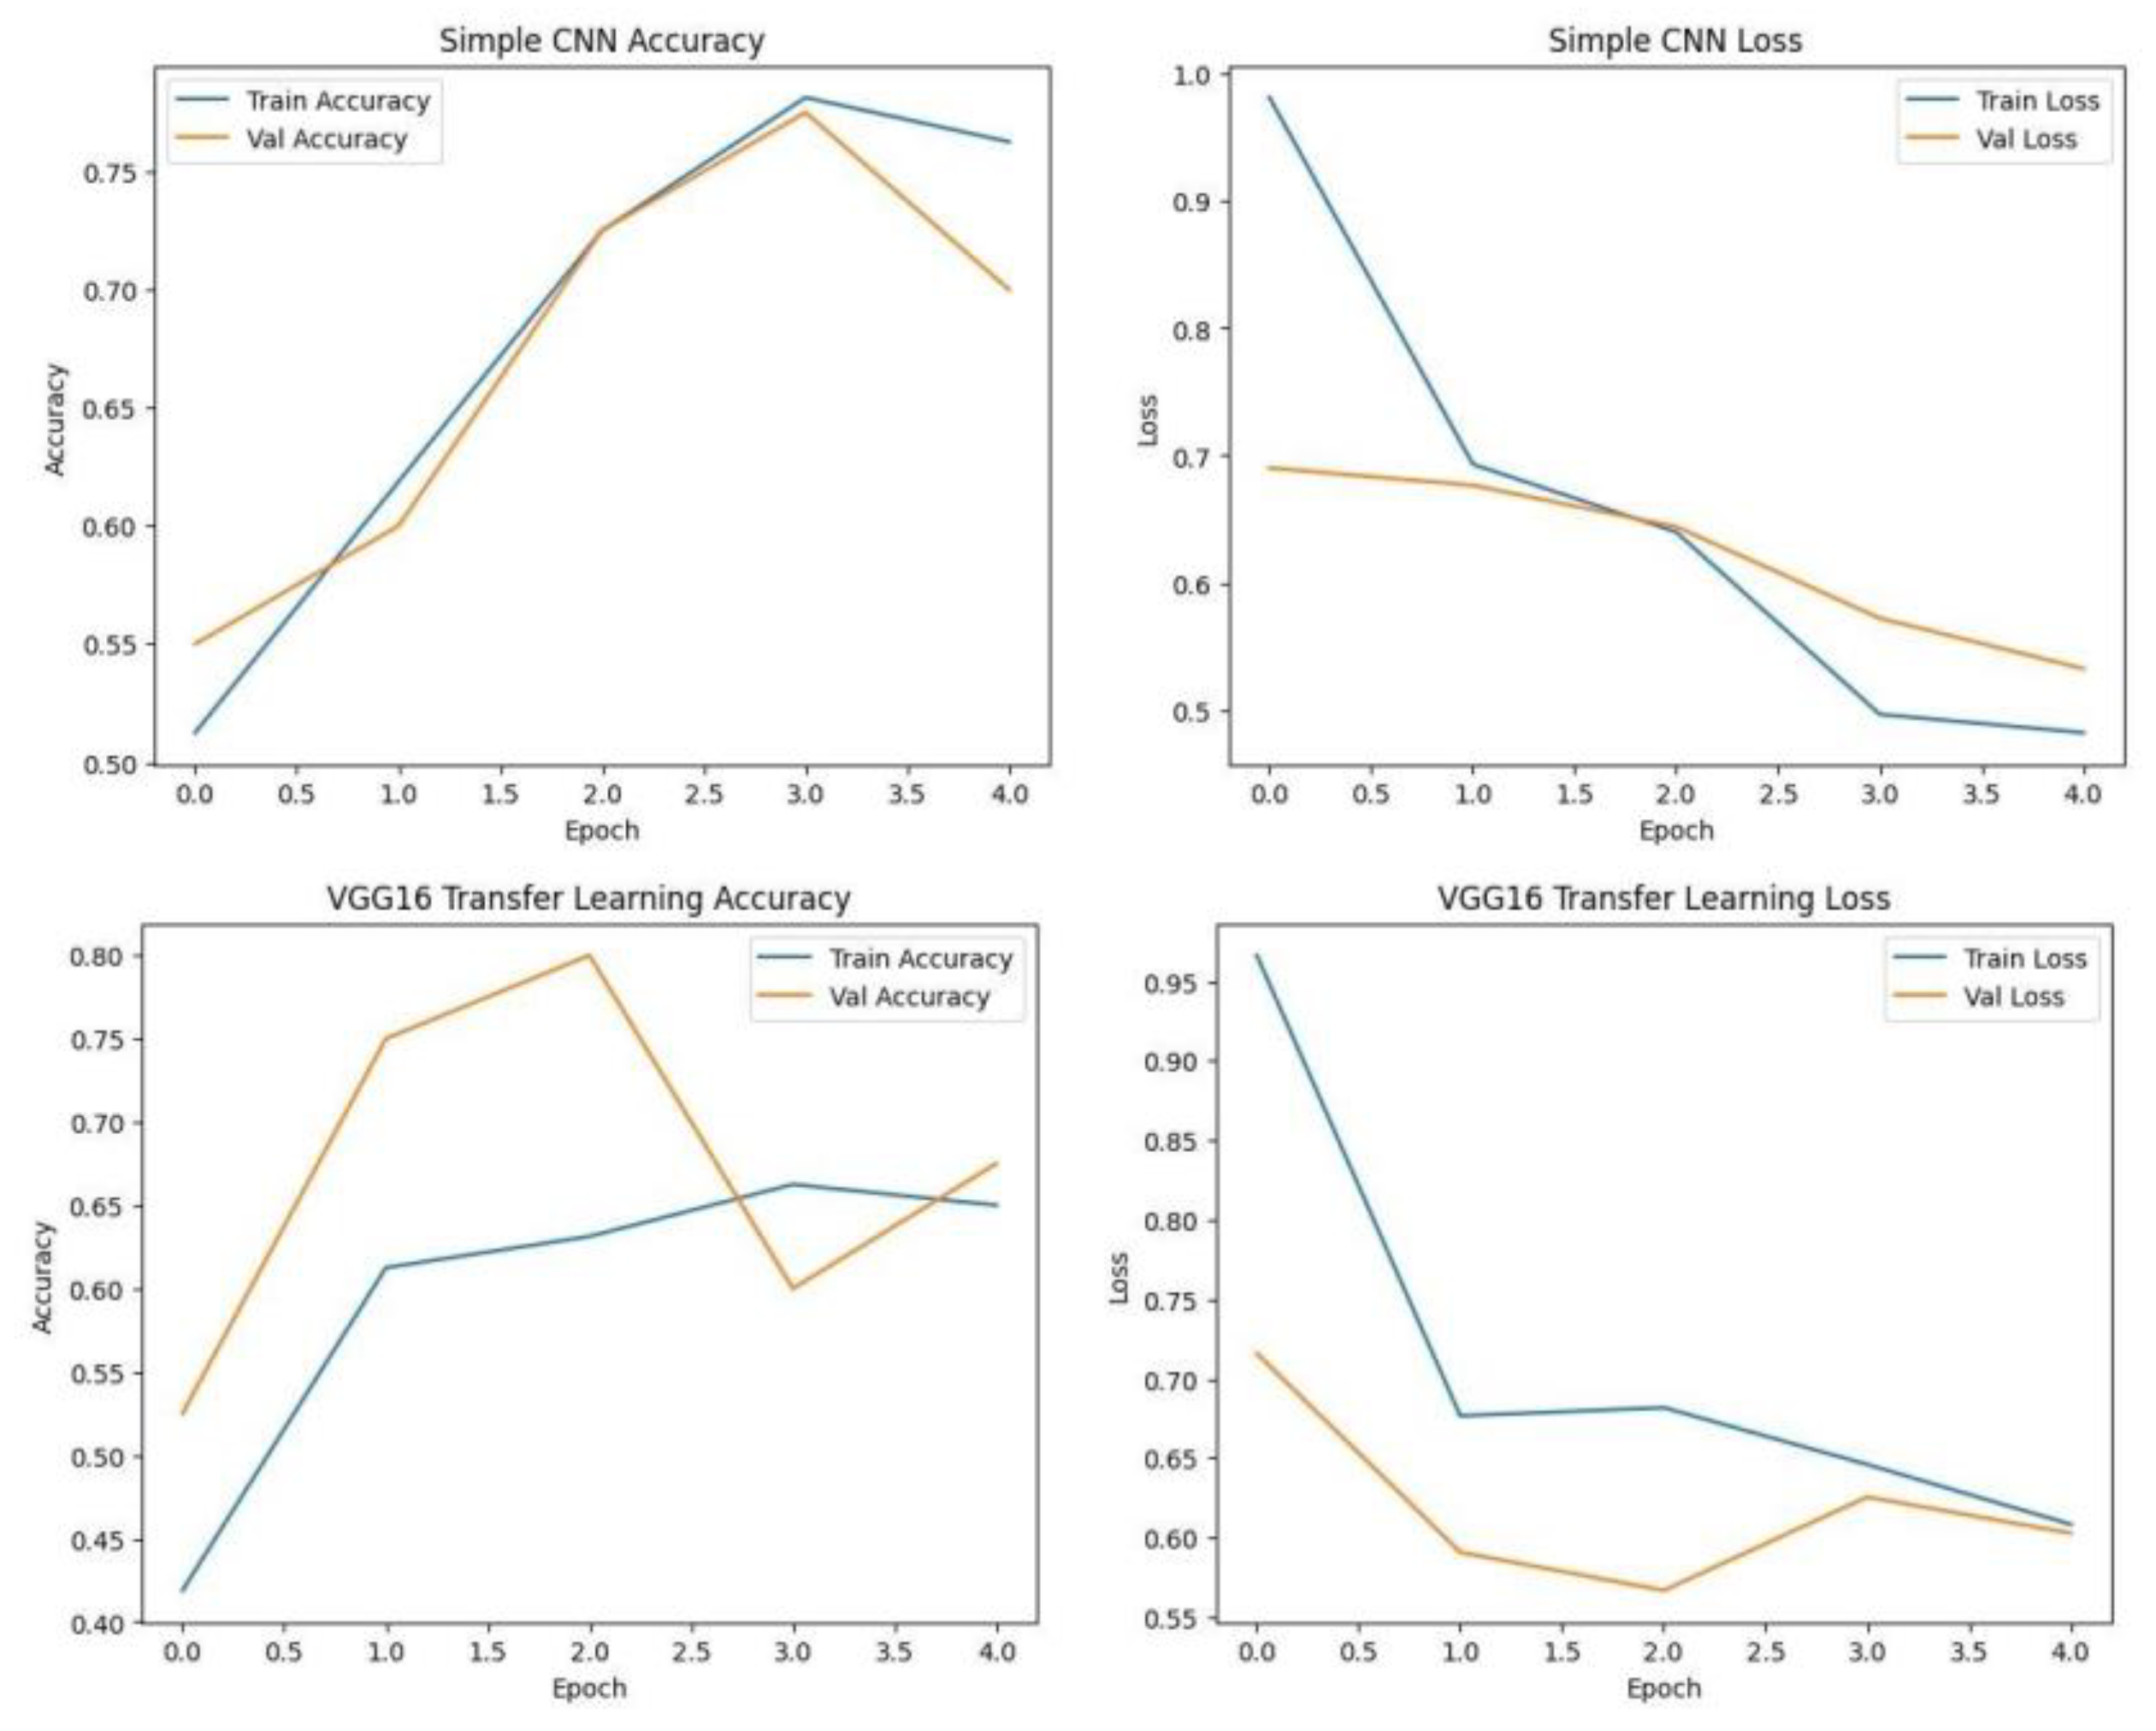
Figure.
Training graphs showing Accuracy and Loss curve of RESNET50, Inception-ResNet V2 and VGG19. .
Figure.
Training graphs showing Accuracy and Loss curve of RESNET50, Inception-ResNet V2 and VGG19. .
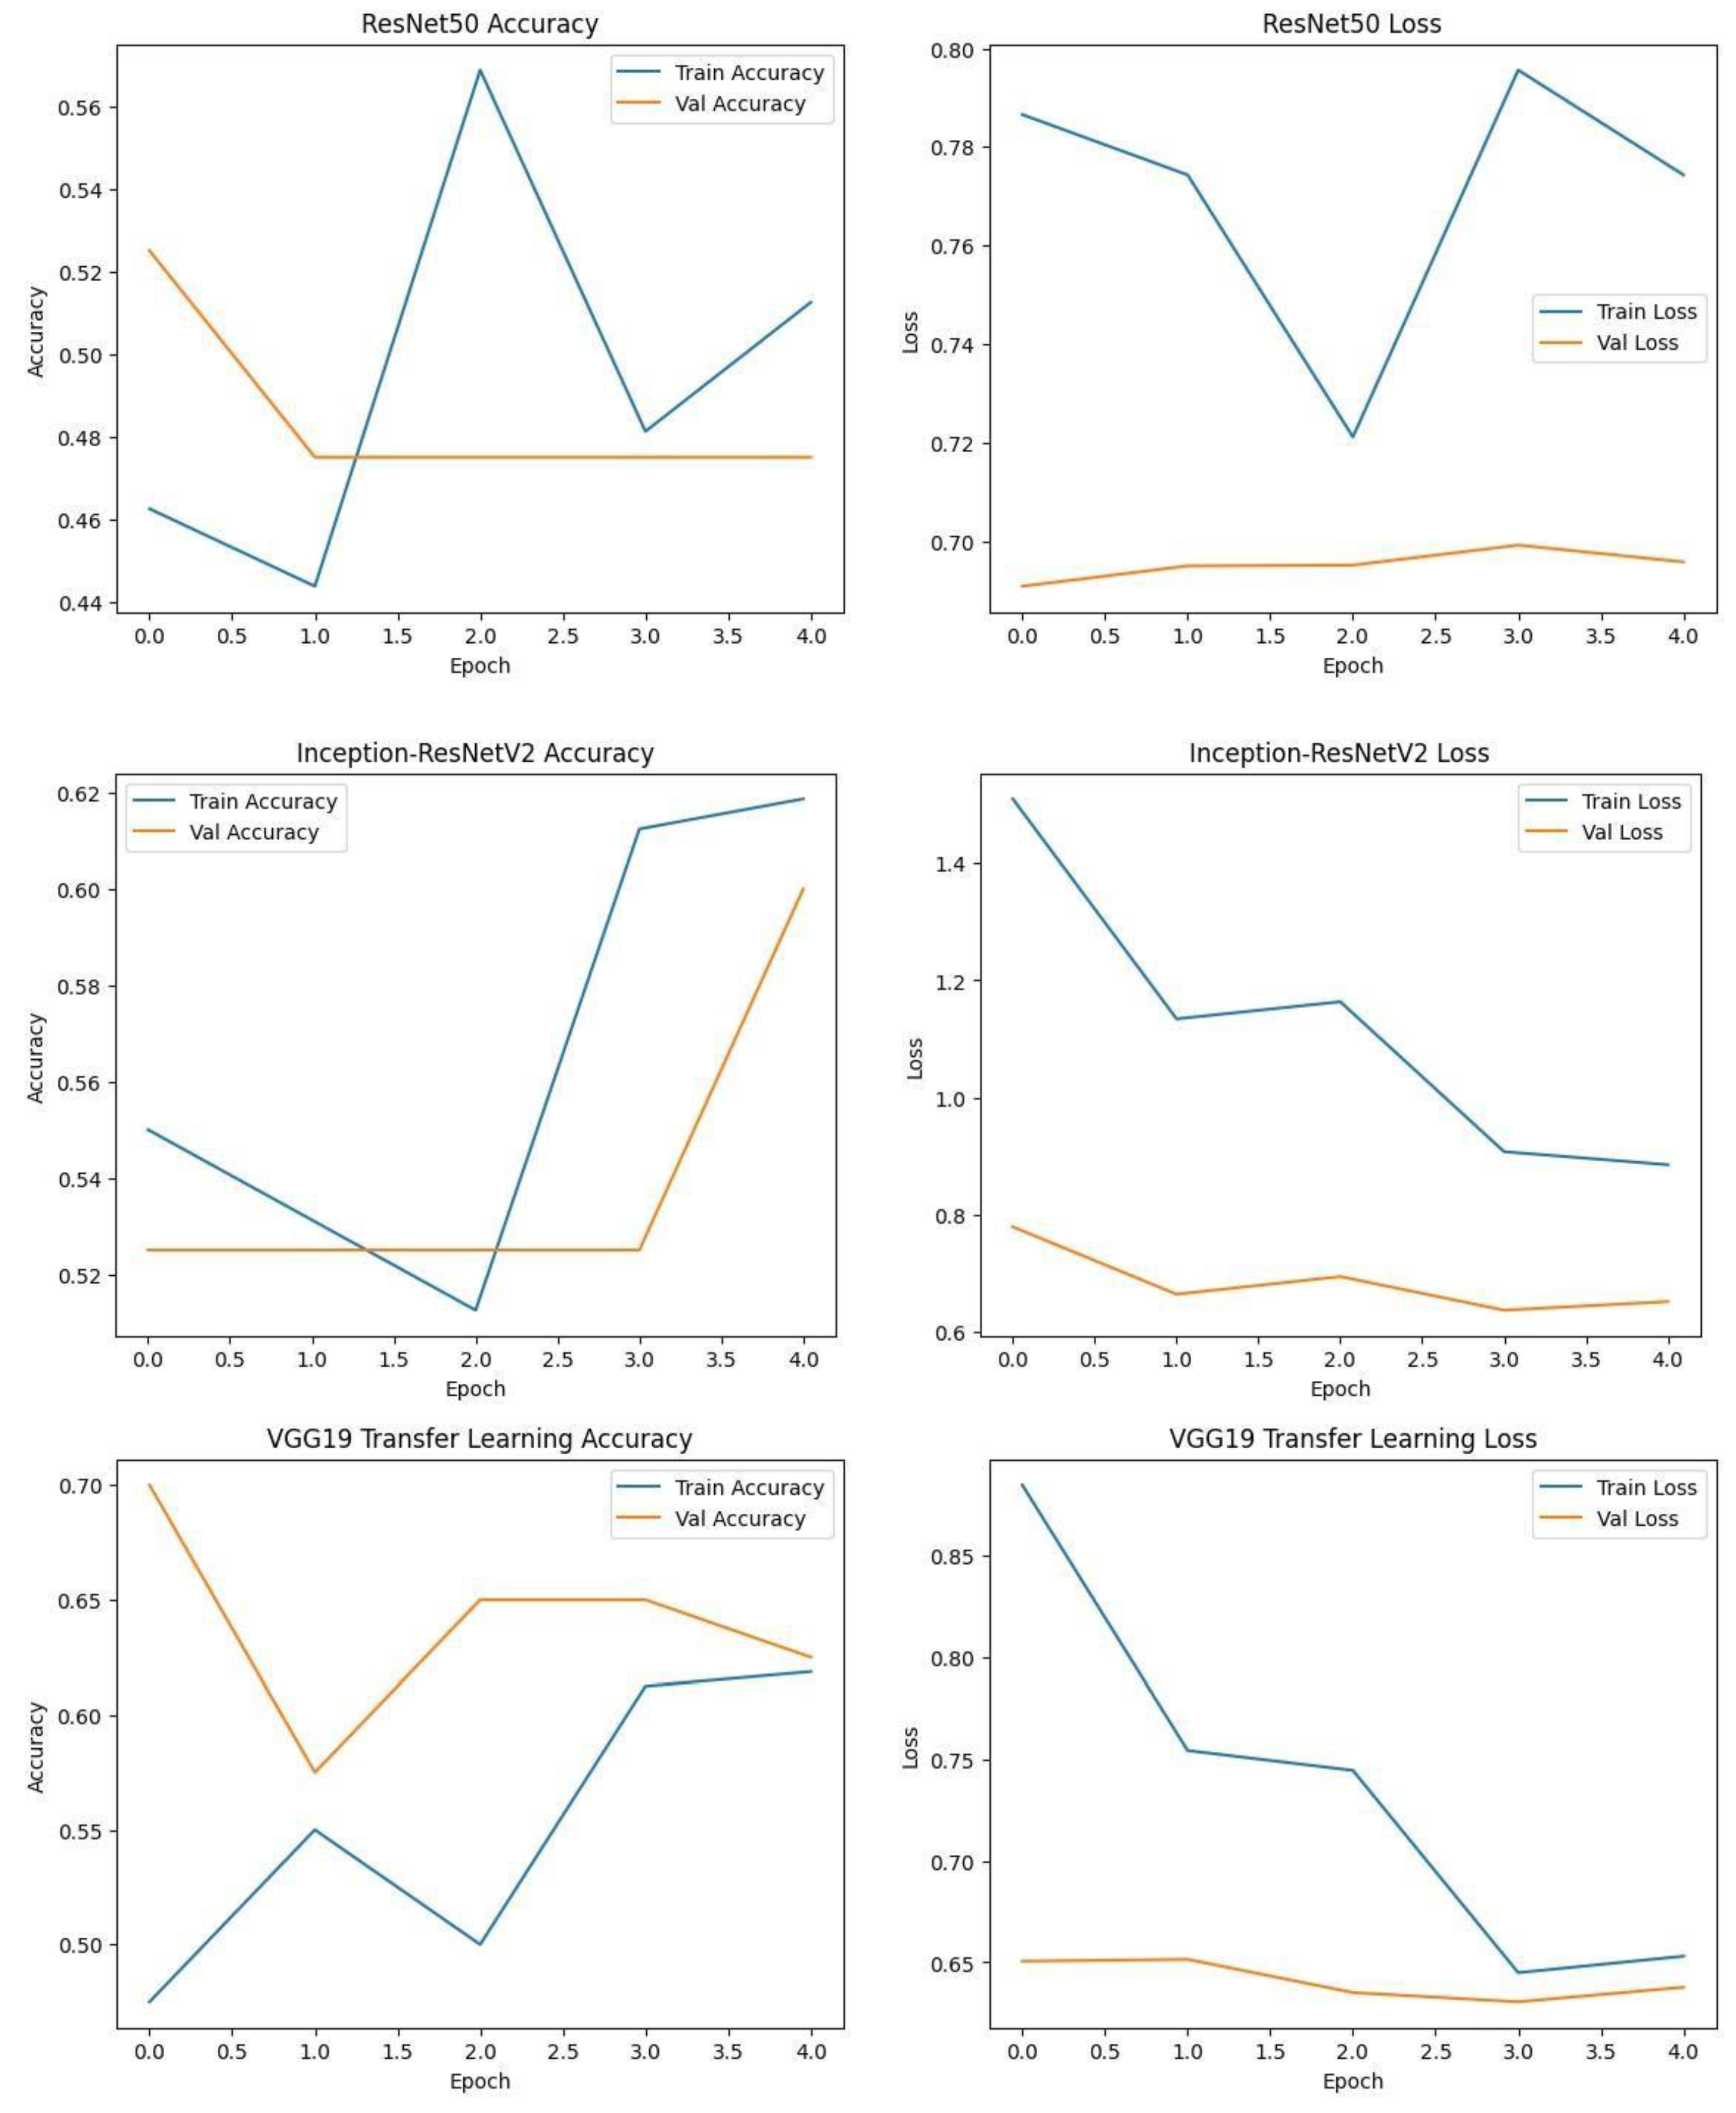
Figure.
Training graphs showing Accuracy and Loss curve of EfficientNet. .
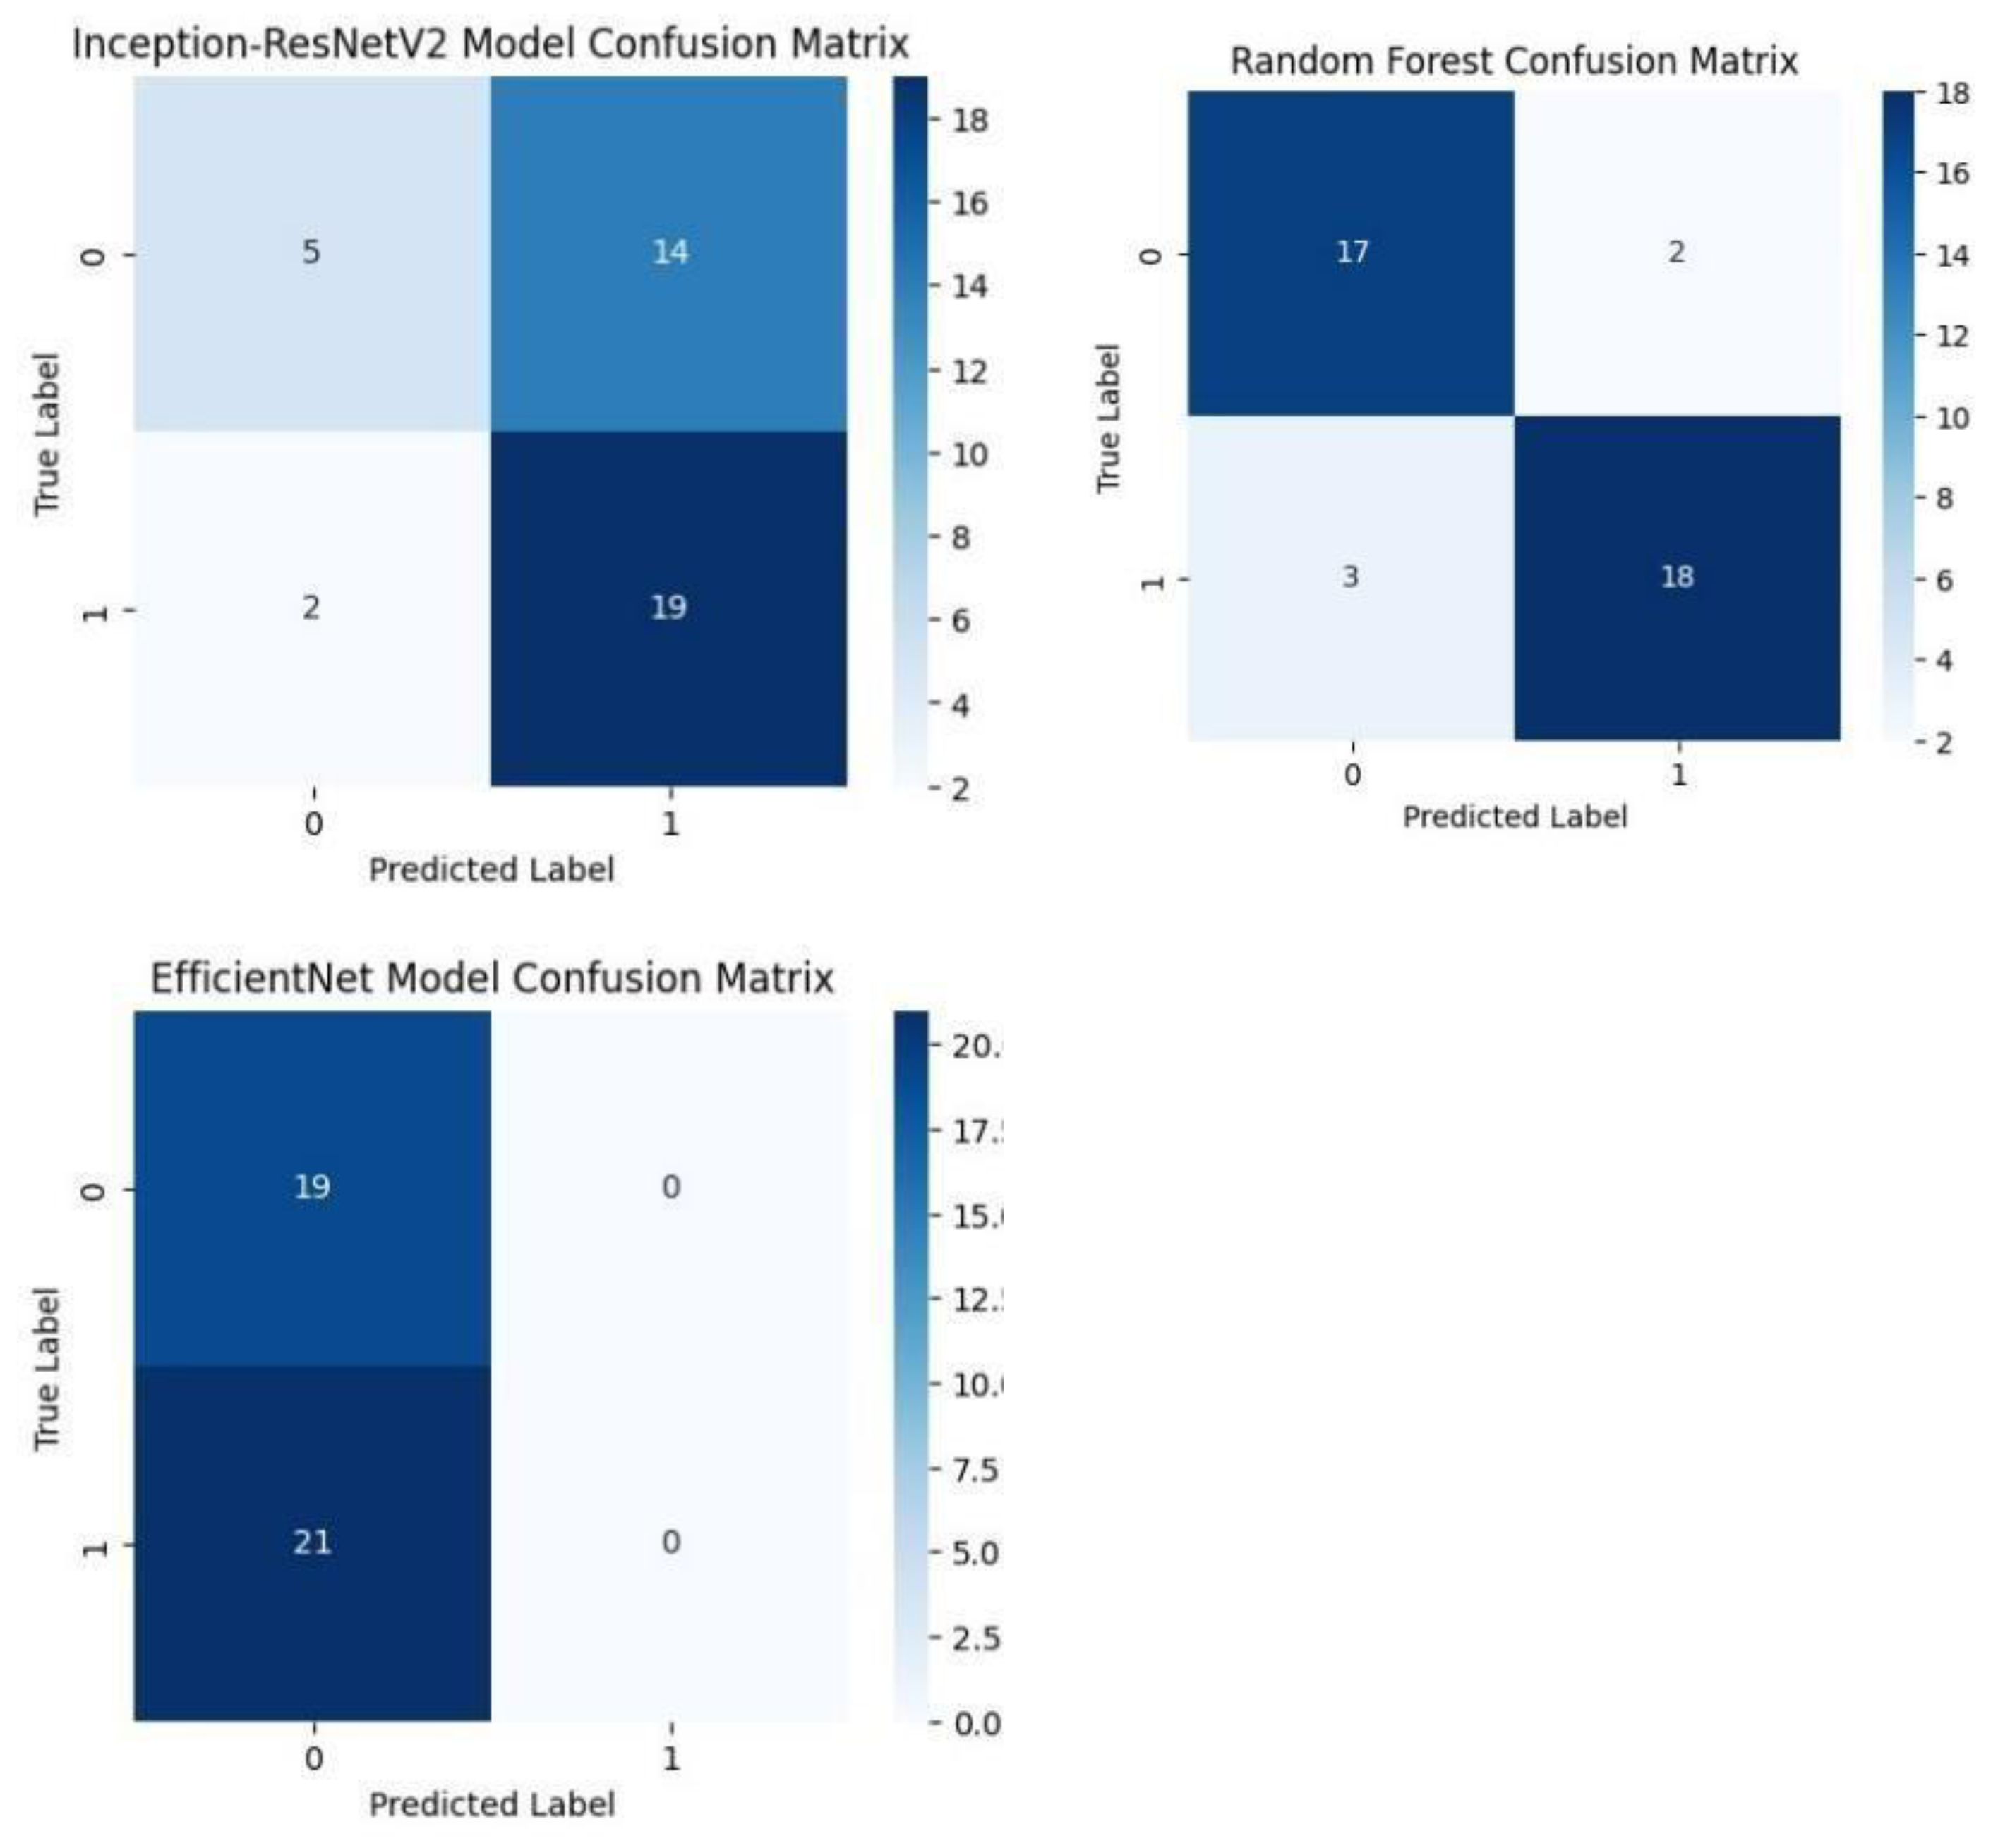
- Confusion Matrices
Each model was used to generate its own class specific confusion matrix. Overall accuracy for the Random Forest classifier was quite high, and the confusion matrix of the classifier revealed strong discrimination between the two classes. A balanced distribution of true positive vs. true negative was observed for the Simple CNN and VGG16 although some misclassifications could be found. On the contrary, models including ResNet50 and EfficientNet had slightly higher confusion rate between the classes, which matched their slightly lower accuracy values for a couple of seconds.
The Random Forest classifier had high overall accuracy and had a robust discrimination of the two classes in the confusion matrix of the predicted model. The true positives and true negatives were distributed balanced with some misclassifications for the Simple CNN and VGG16 models. On the other hand, ResNet50 and EfficientNet showed higher level of confusion between classes as they had lower accuracy scores.
Figure.
Confusion matrices of various deep learning models such as Simple CNN, VGG 19, VGG19, and RESNET50 Models. .
Figure.
Confusion matrices of various deep learning models such as Simple CNN, VGG 19, VGG19, and RESNET50 Models. .
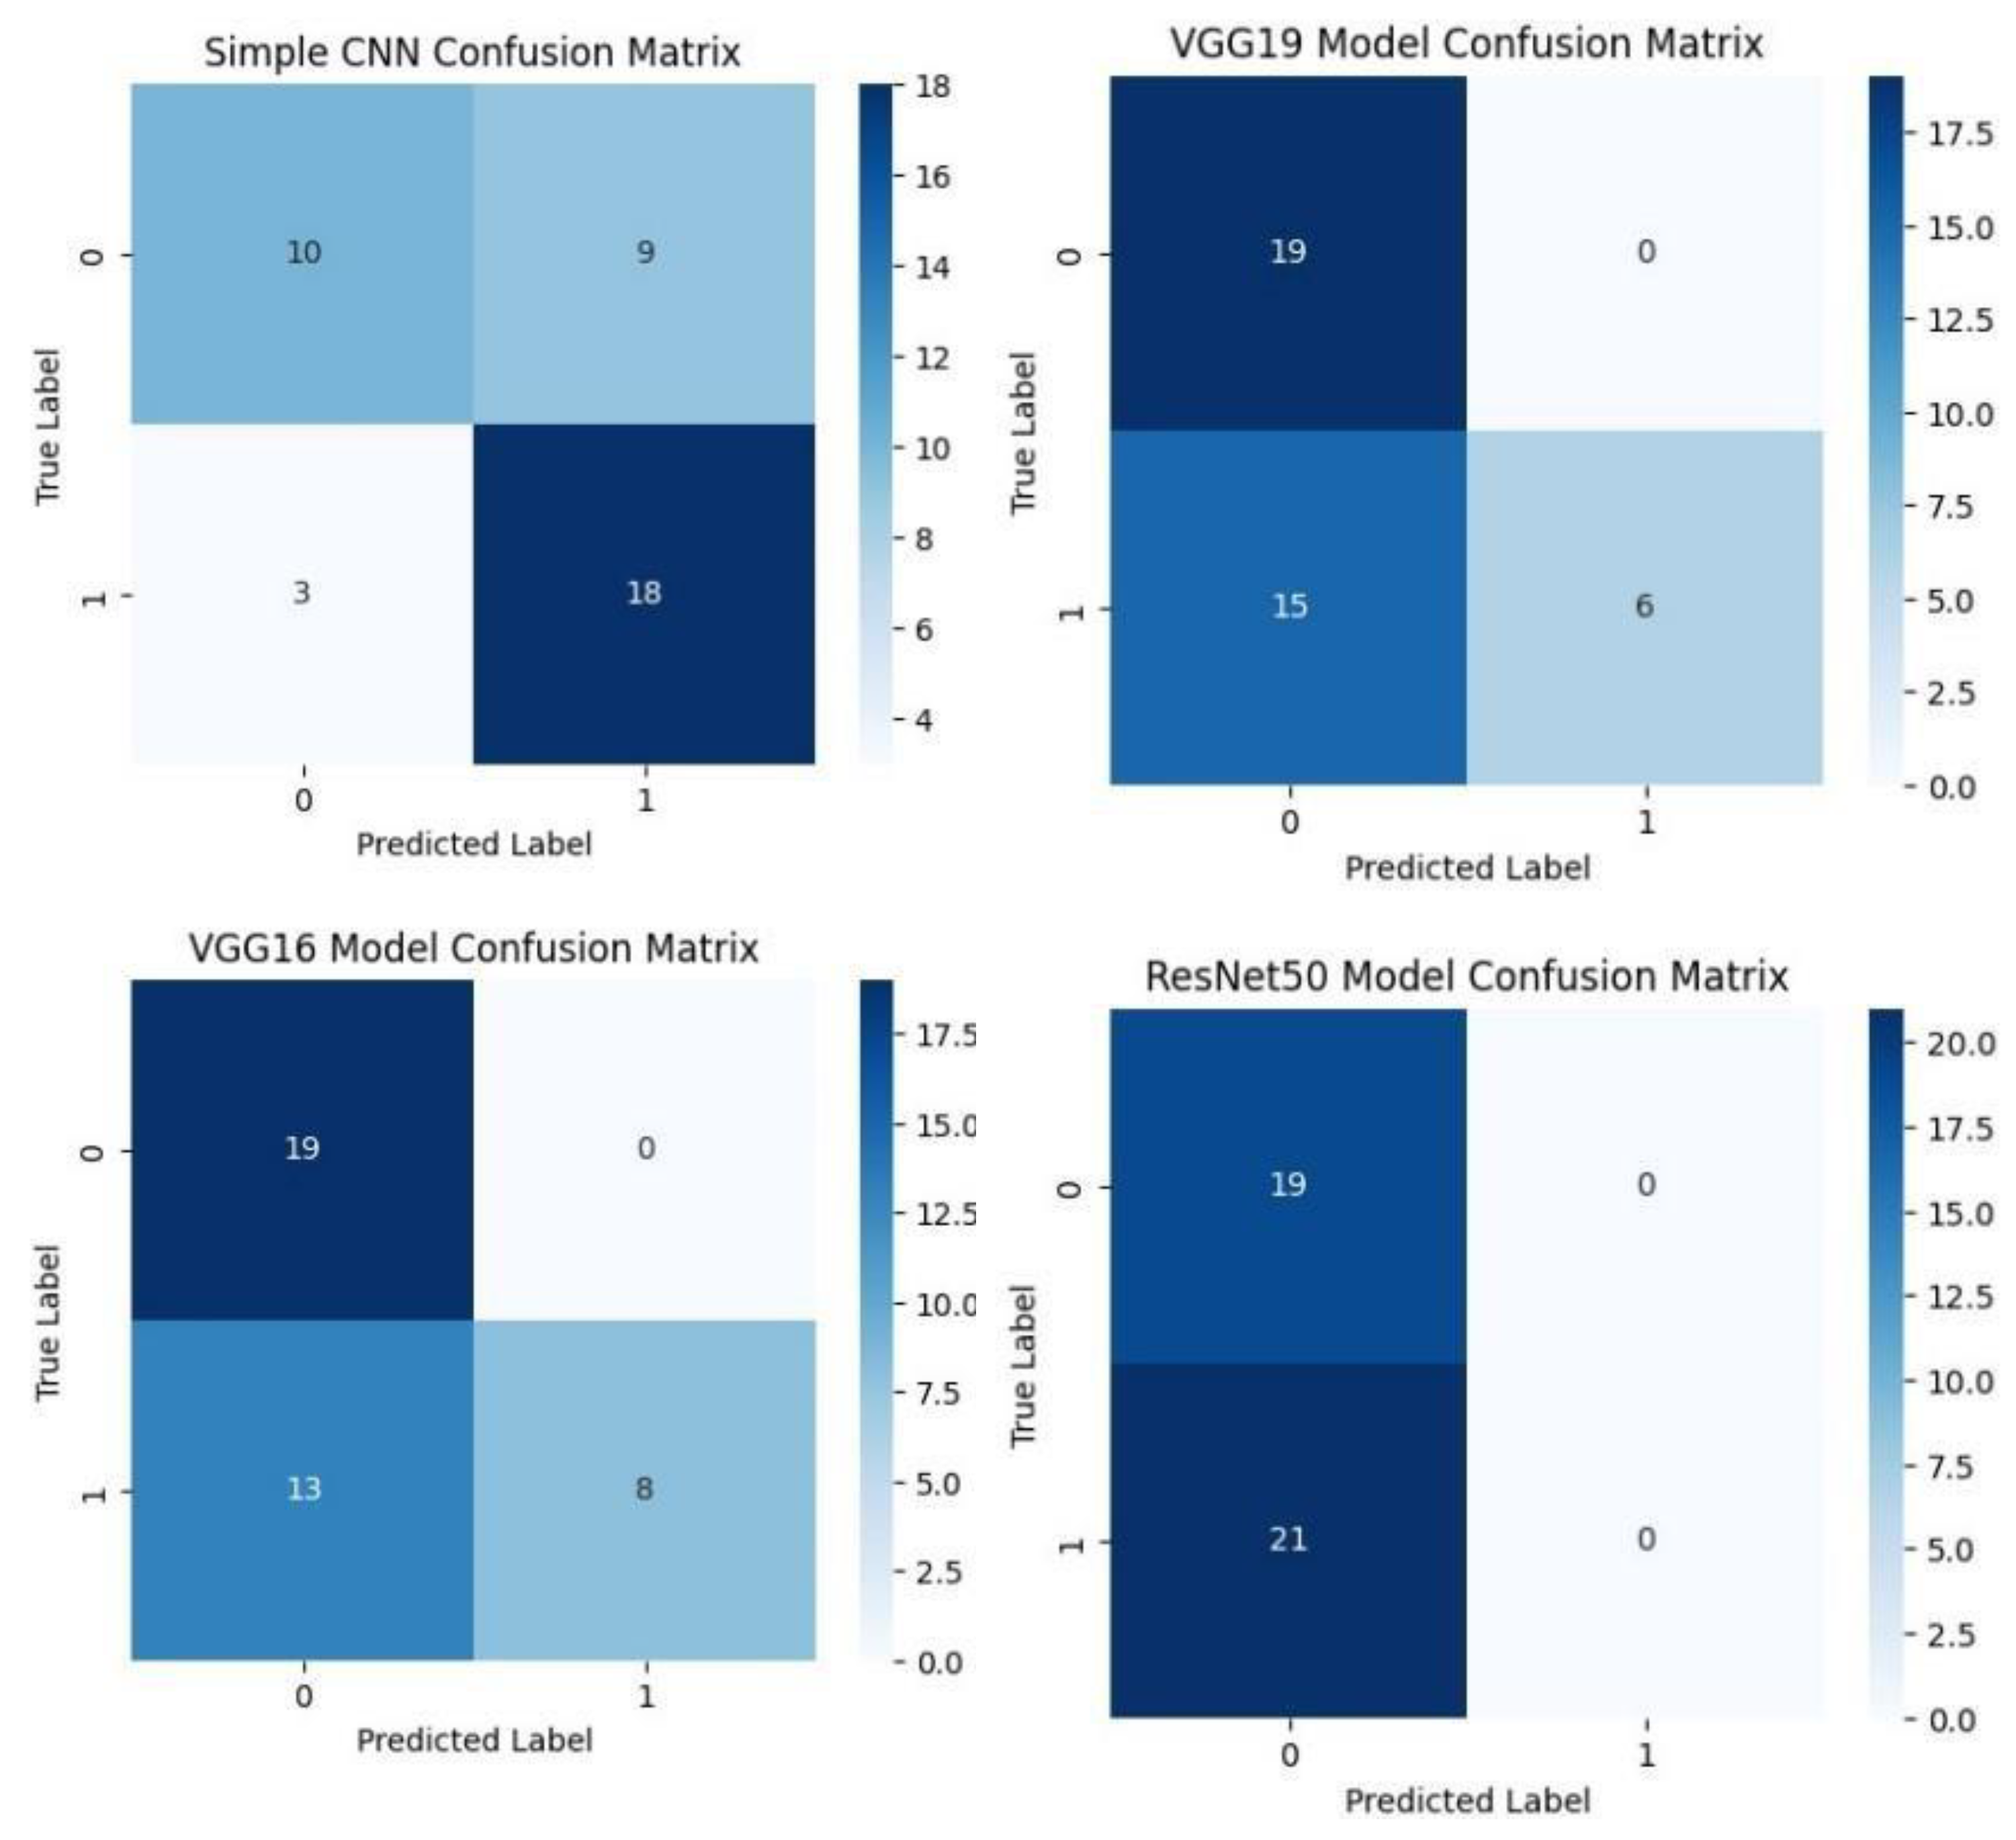
Figure.
Confusion matrices of Inception-ResNet V2, EfficientNet and Random Forest classifiers. .
- 1. ROC Curve Analysis
Softmax probabilities were plotted as ROC curves for each of deep learning models. Additional evidence of performance disparities between the models was obtained through the area under the curve (AUC) values.
Figure.
ROC curve of VGG16, VGG19, RESNET50, Inception-ResNet V2, and EfficientNet models. .
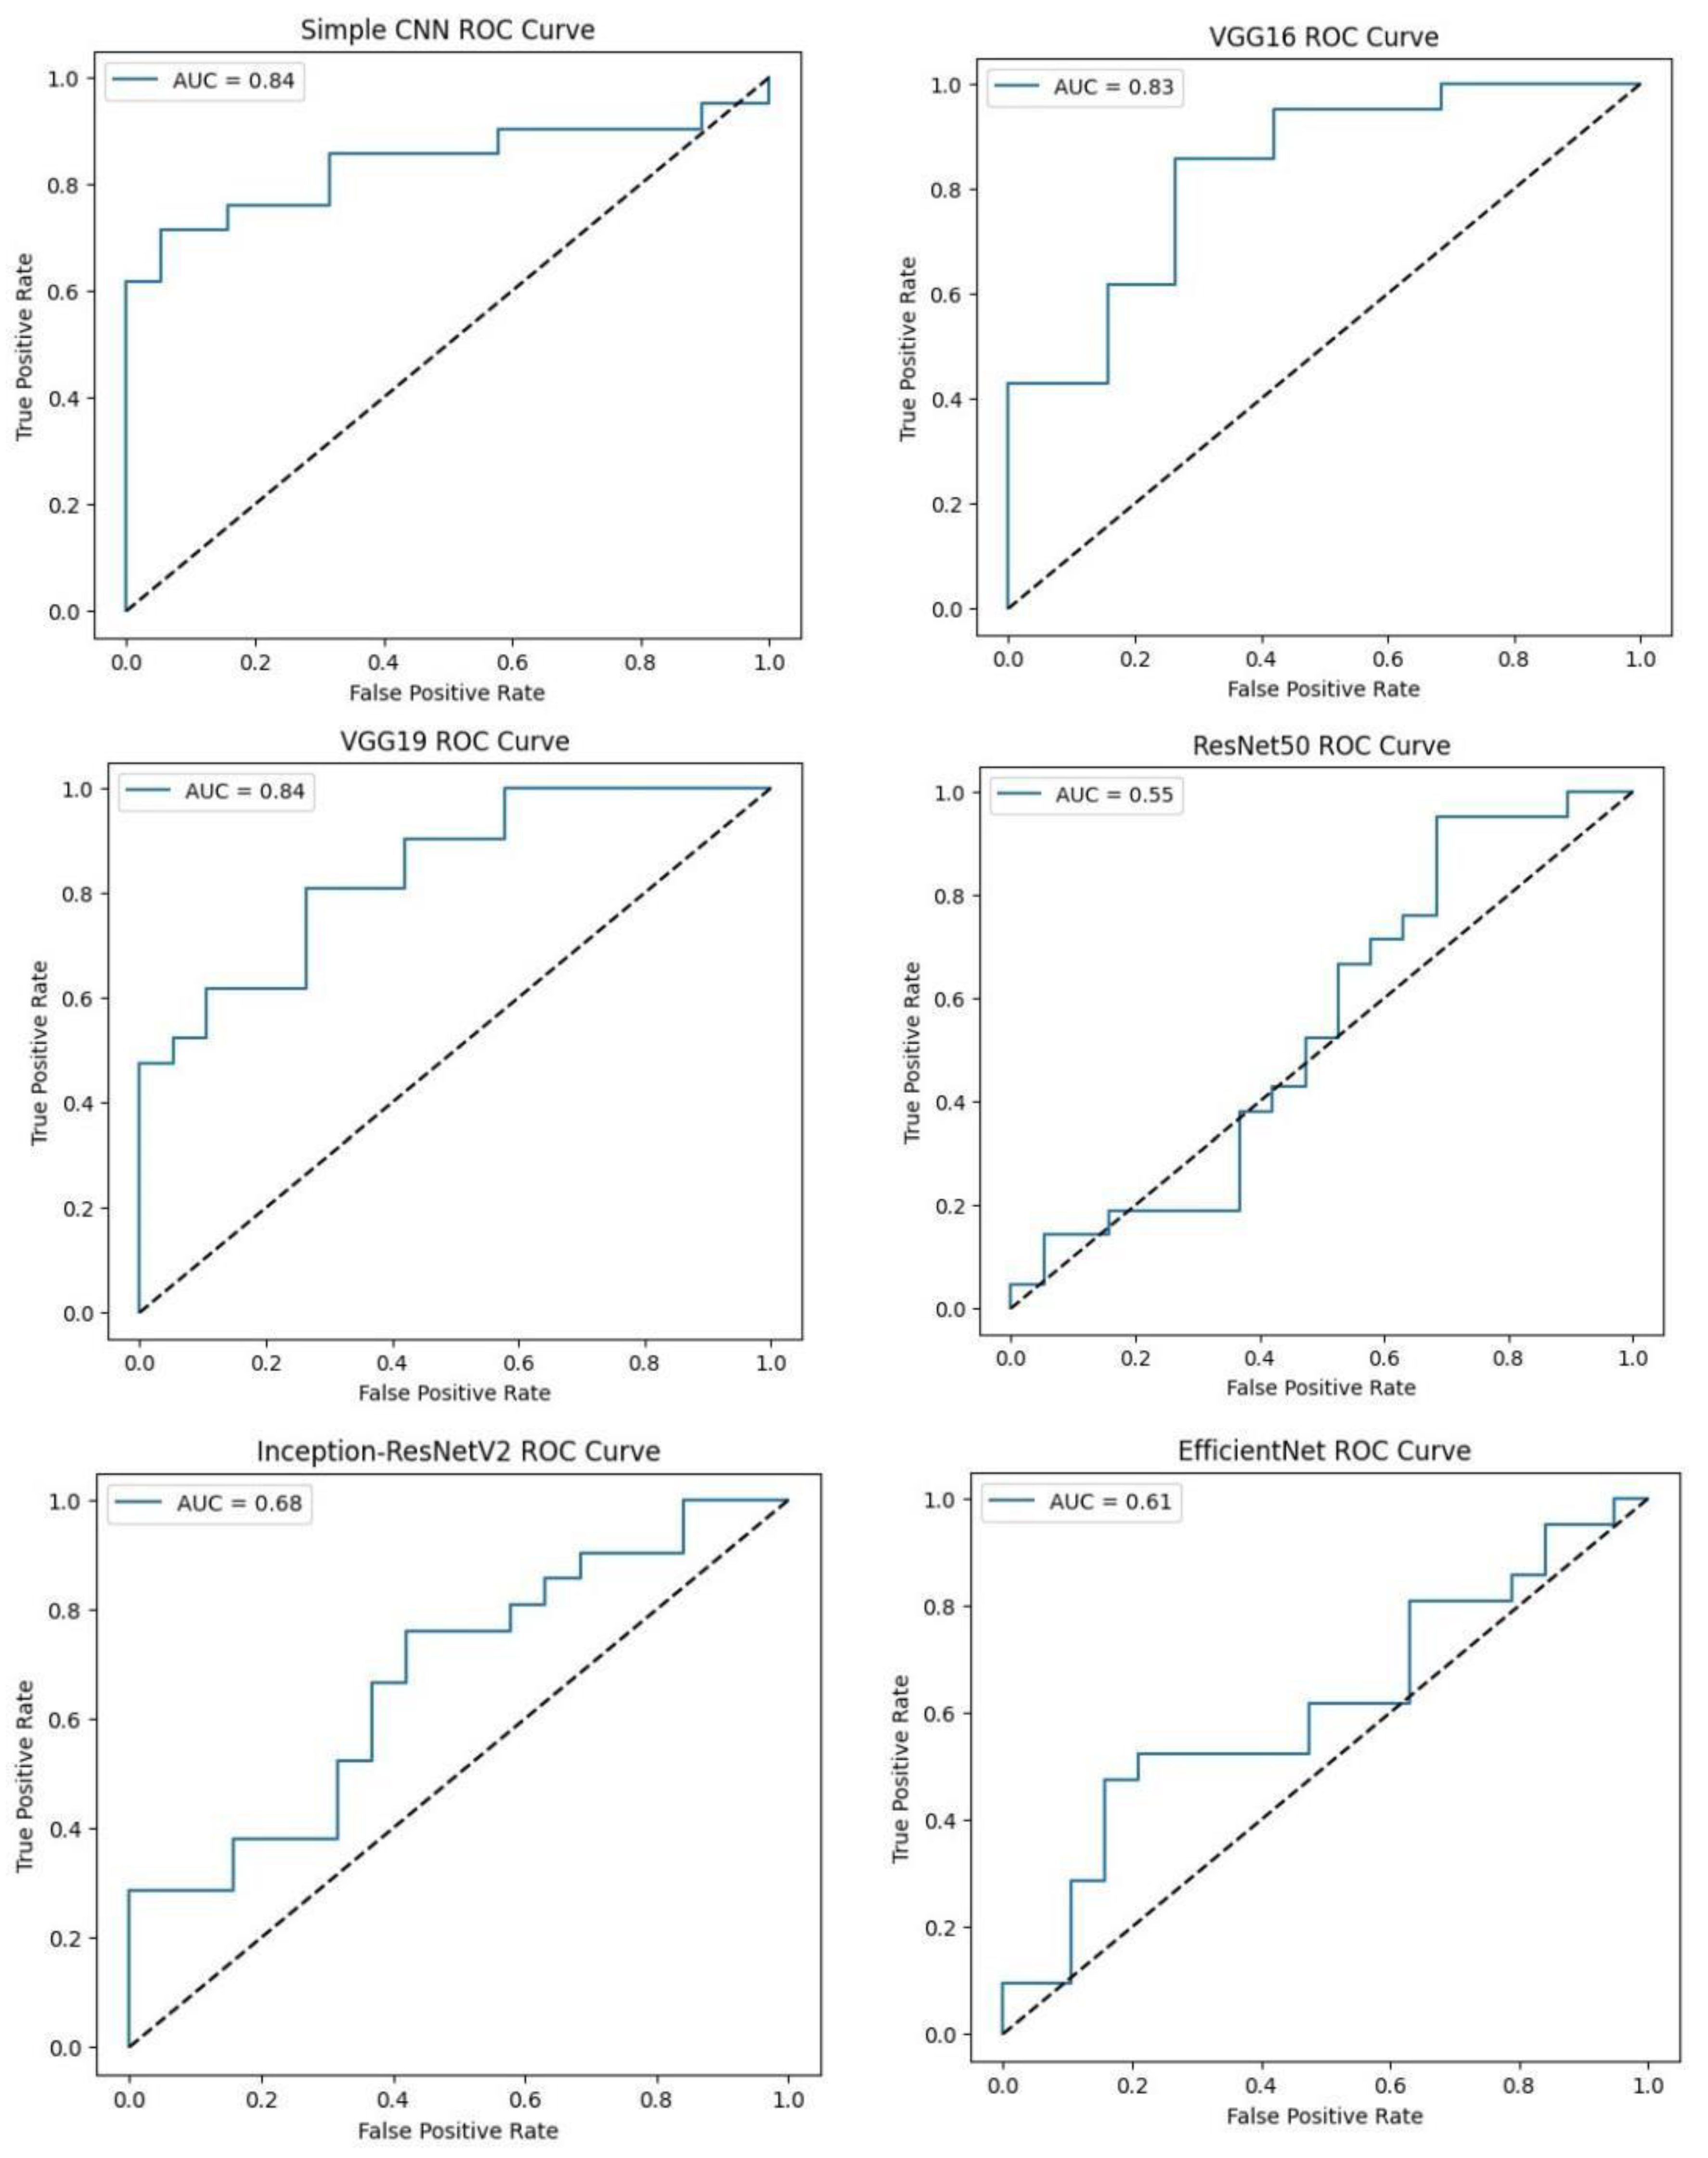
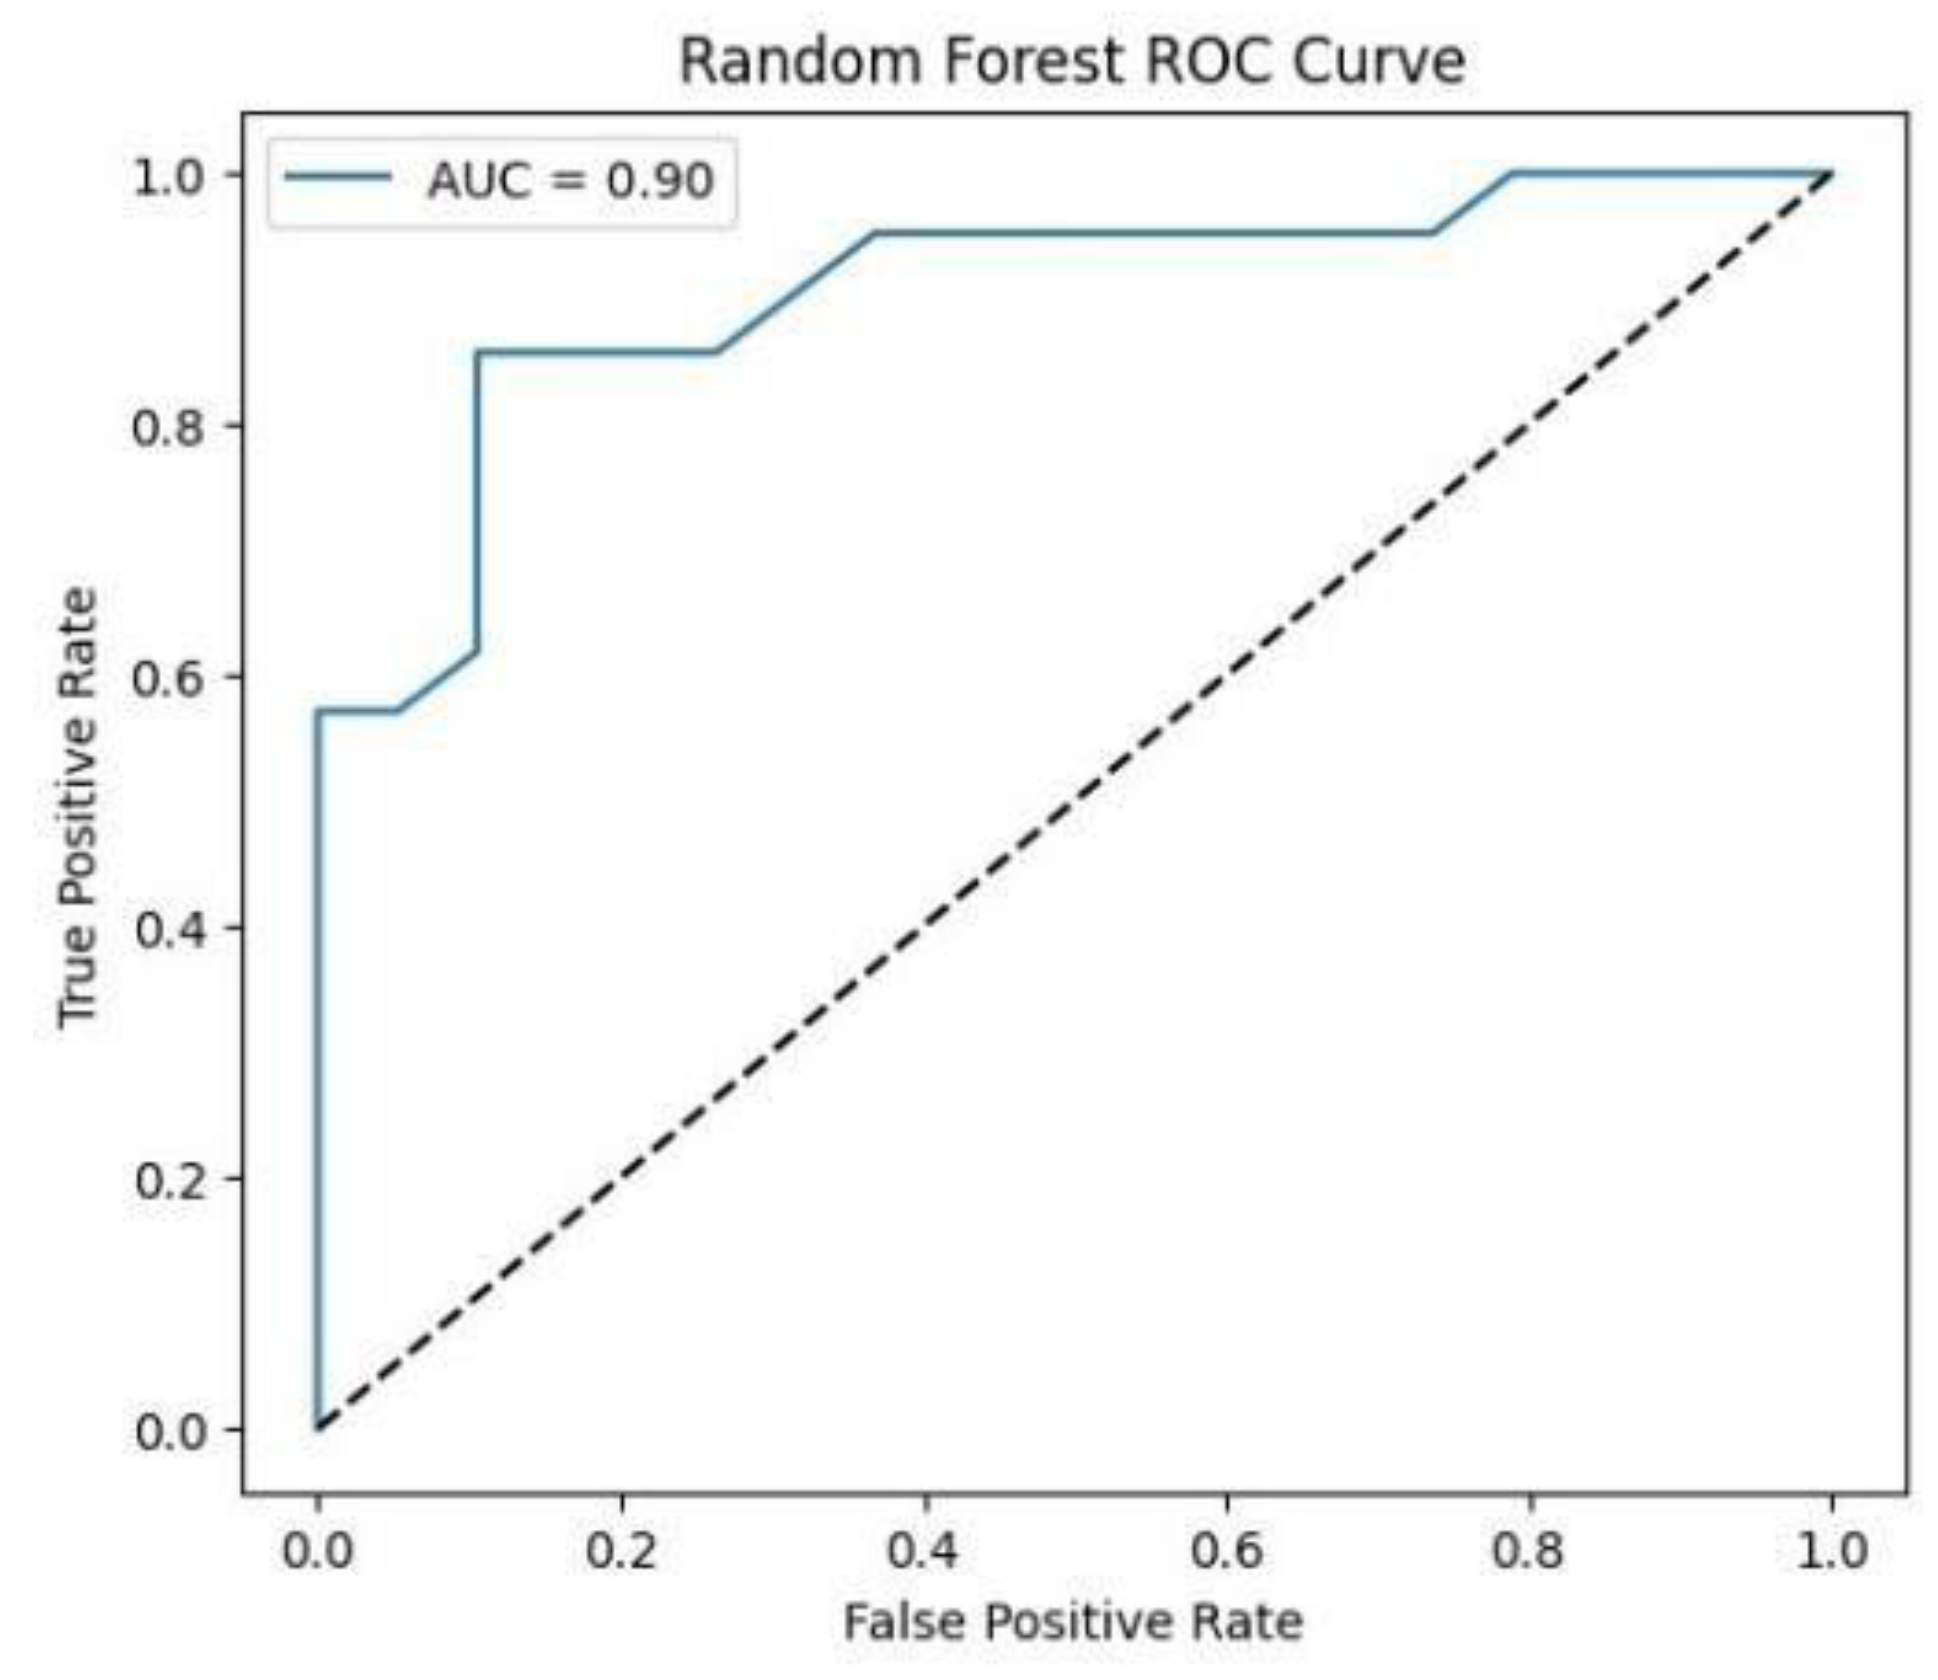
Figure.
ROC curve for Random Forest classifier. .
- C. Combined Visualization
To facilitate a holistic comparison across all models, we aggregated the final performance metrics and visualisations as follows:
Figure.
Combined ROC curve of VGG16, VGG19, RESNET50, Inception-ResNet V2, EfficientNet and Random Forest classifiers. .
Figure.
Combined ROC curve of VGG16, VGG19, RESNET50, Inception-ResNet V2, EfficientNet and Random Forest classifiers. .
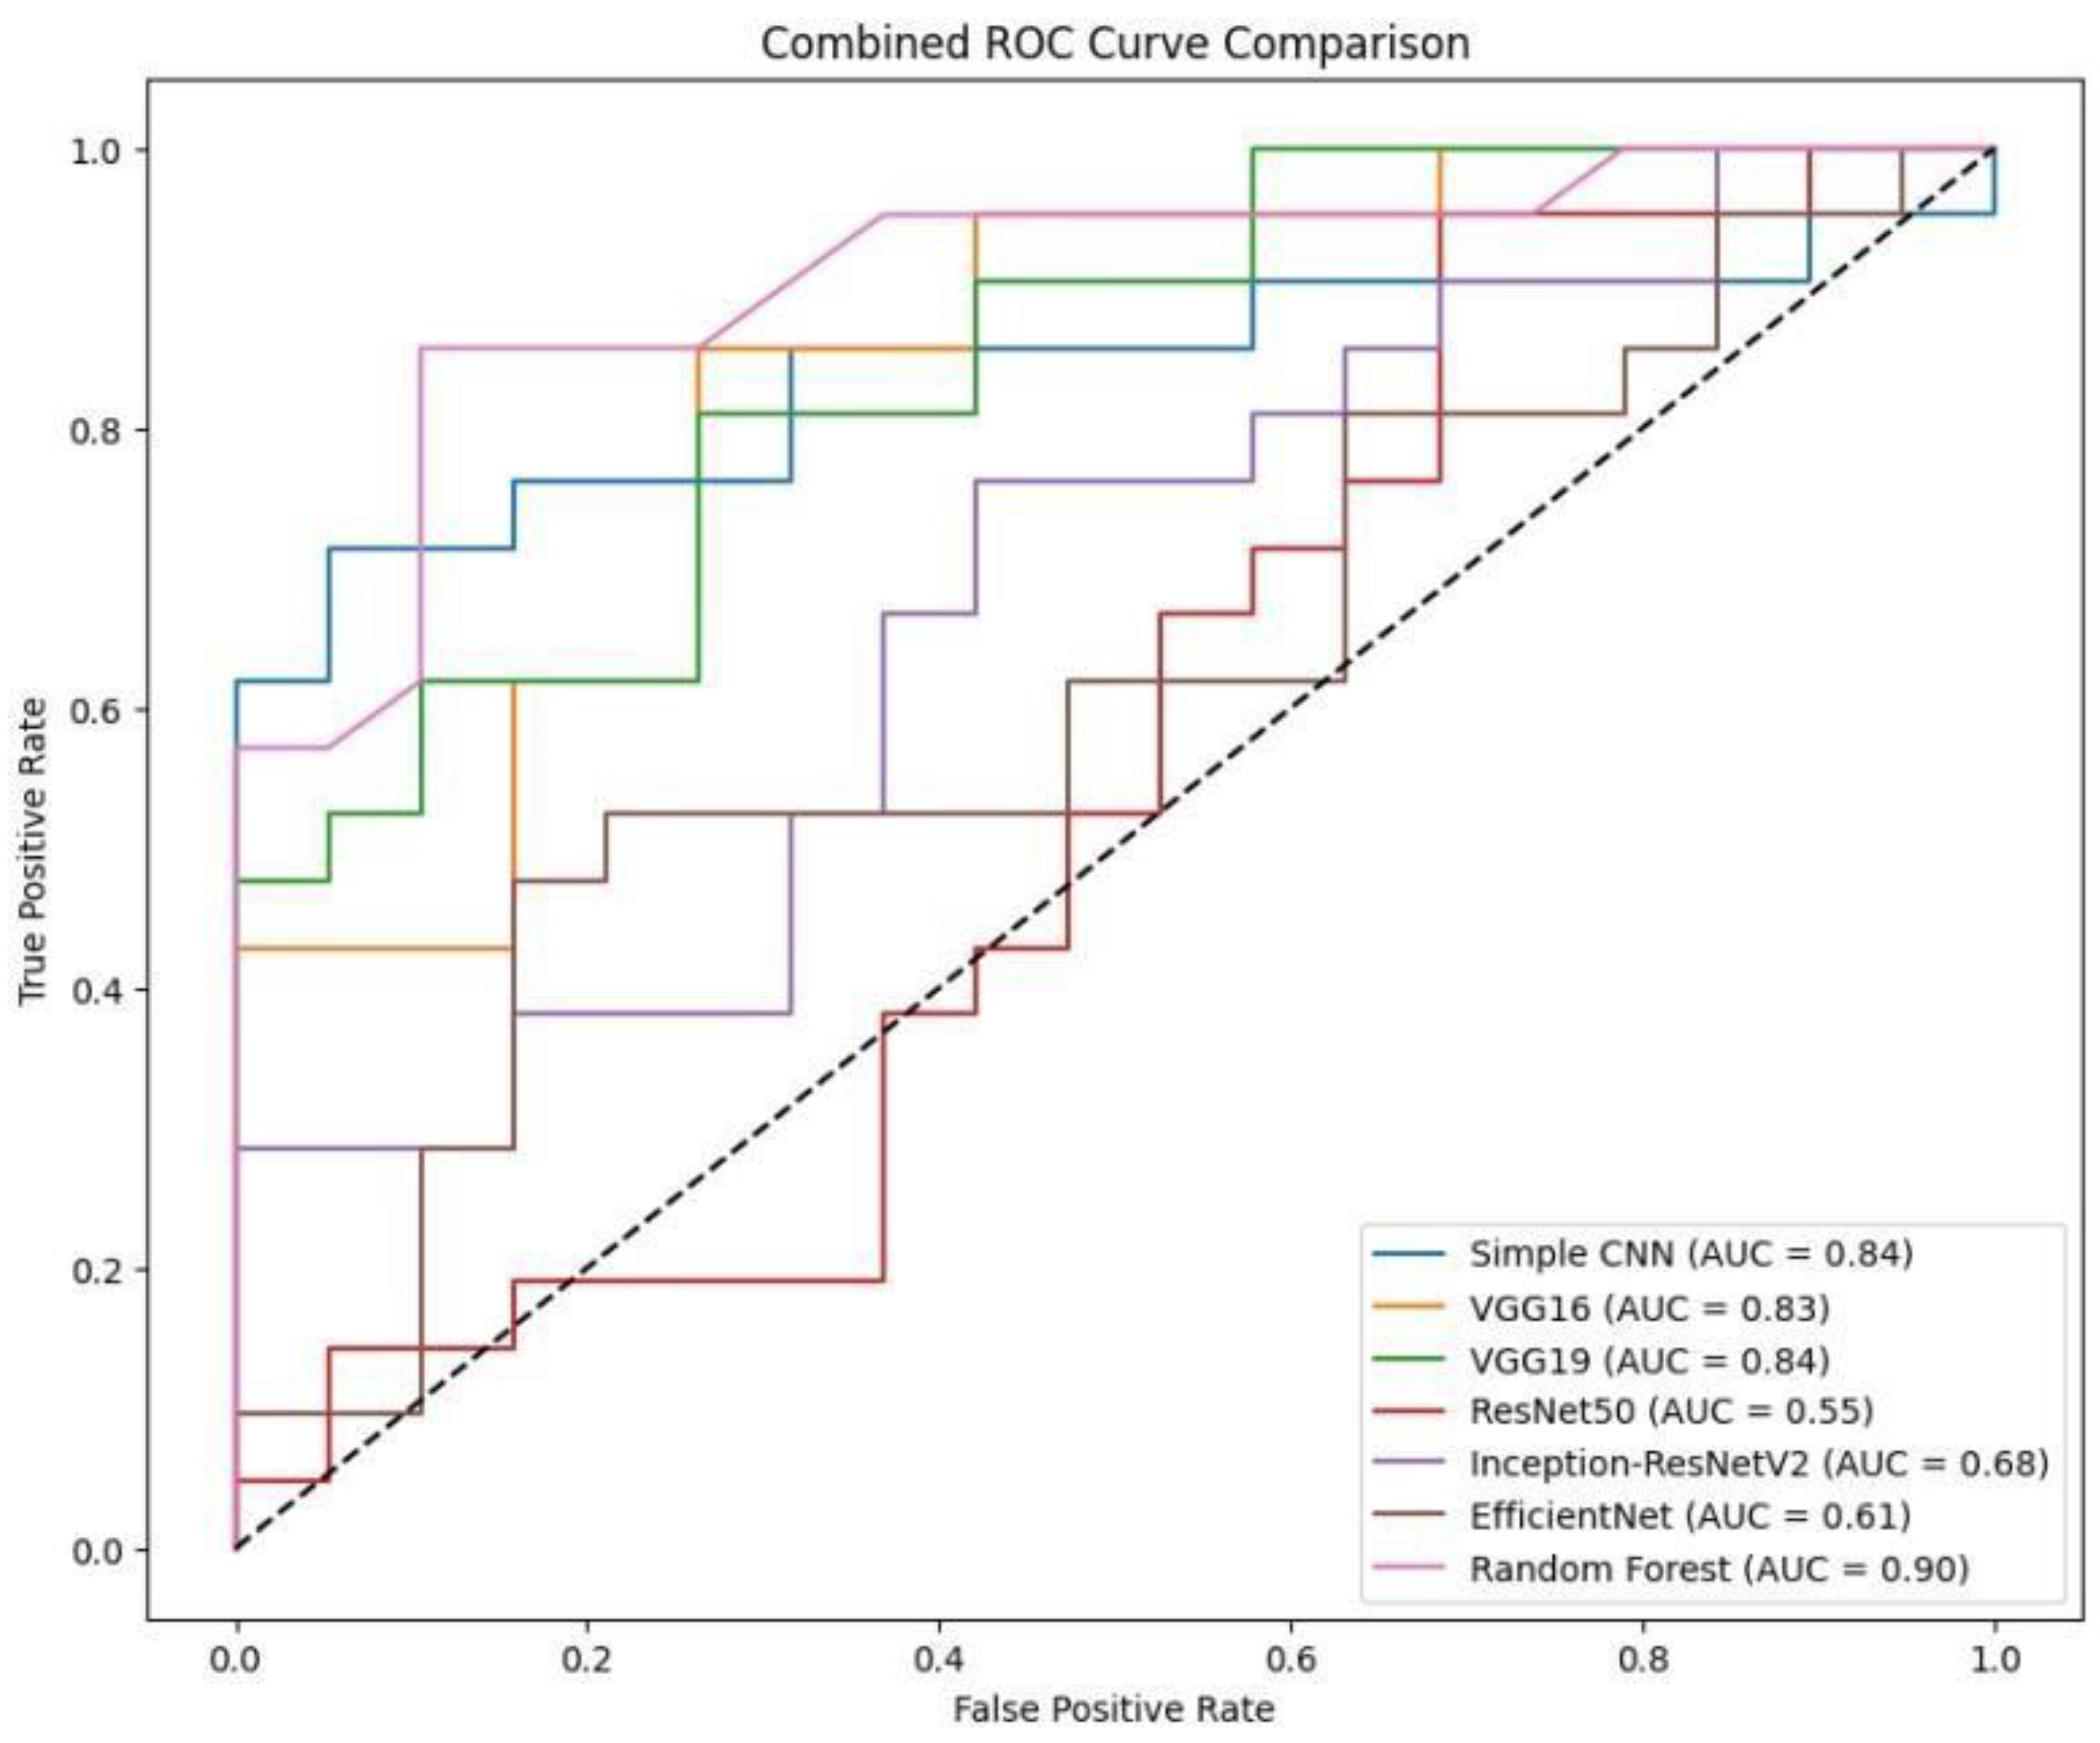
Figure.
Accuracy comparison of various deep learning models (VGG16, VGG19, RESNET50, Inception-ResNet V2, EfficientNet) and Random Forest classifiers. It is clear that Random Forest outperforms other models with an accuracy of 87%. .
Figure.
Accuracy comparison of various deep learning models (VGG16, VGG19, RESNET50, Inception-ResNet V2, EfficientNet) and Random Forest classifiers. It is clear that Random Forest outperforms other models with an accuracy of 87%. .
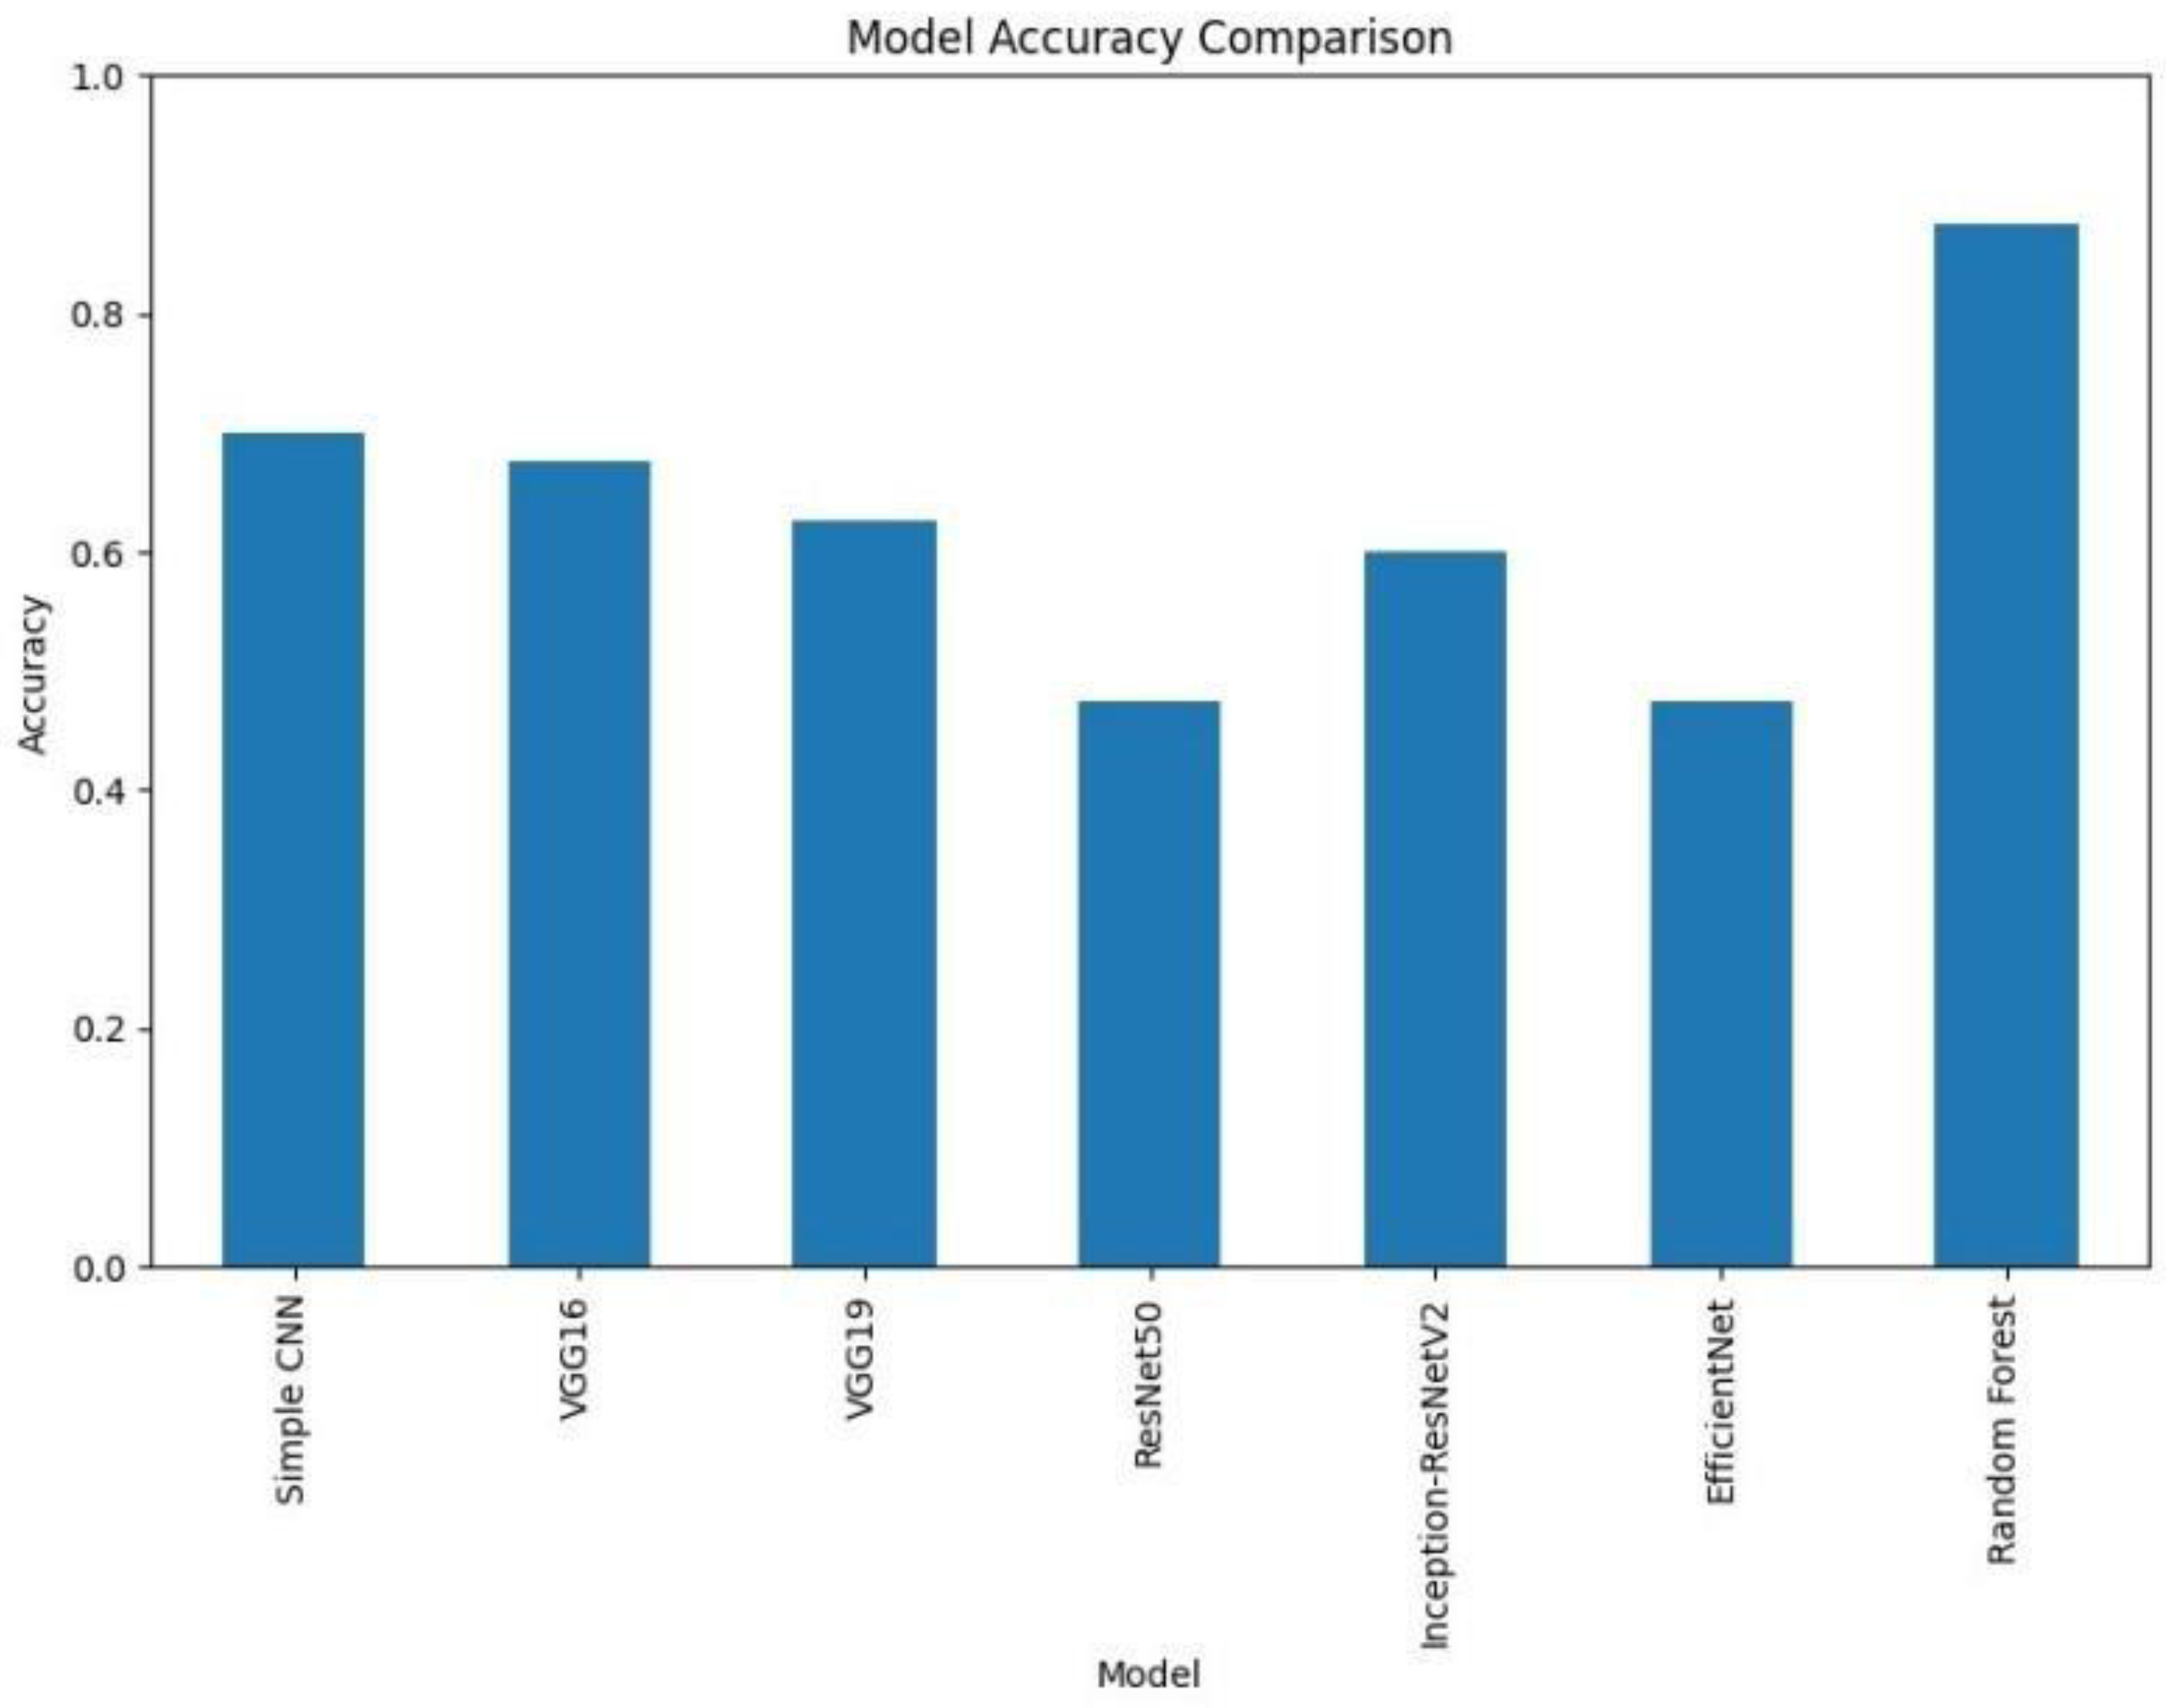
- Accuracy and Loss Comparison
A bar chart was used to compare the final validation accuracies of all models whereas another bar chart shows the final validation losses of the deep learning models. Overall, these aggregated plots show that the Random Forest classifier achieved the highest accuracy on the whole. They also worked moderately well on deep learning architectures in terms of accuracy and loss metrics and far worse than Simple CNN, VGG16 and VGG19, ResNet50, Inception-ResNetV2 and EfficientNet.
- Aggregated Confusion Matrix Grid
Aside from the individual plots we arranged all the confusion matrices into a single grid. Therefore, by looking at this, we could have a direct visual comparison of the class prediction by the different models. This grid shows that Random Forest classifier excels more than the deep learning models with respect to class separation and confusion.
However, under these preprocessing and training conditions, it was shown that the Random Forest classifier with PCA reduced features outperformed the evaluated deep learning models. This indicates that feature extraction through PCA and the robustness of the classical machine learning methods can be incredibly effective for this task in the presence of a small dataset or when a deep model is not well finetuned. Detailed visualizations here help extend and understand each model’s behavior before hyperparameter tuning, fine tuning of pre trained networks and data augmentation strategies to achieve better performance if any of these potential deep learning model performance improvement techniques.
V. Discussion
- A. Analysis of Results
Thus, our experimental results showed big gaps in classical and deep learning approaches’ performance. Notably, the feature set obtained using PCA gave an accuracy of 87.5% with Random Forest classifier working on the same, while all deep learning models fail to achieve it. Simple CNN got 70% accuracy, while models like these VGG16, VGG 19, ResNet50, Inception-ResNetV2, EfficientNet got smaller accuracy (from 47.5% to 67.5%).
PCA features captured within the current experimental setup prove to be a robust basis for classification along with classical algorithms, giving rise to these findings. However, although deep learning models appear highly complex and likely to have a lot of potential, they also face problems such as limited training data volume, overfitting, or not realizing the maximum of amount of fine-tuning from pre trained networks.
- B. Impact of Data Preprocessing and Labeling Strategy
Processing pipeline in which we were extracting middle slice of each MRI modality and normalizing images were an important component of our study. In addition, segmentation masks were used to compute tumor volumes with a median threshold being the cutoff, and binary labels were derived.
However, although these strategies provide a consistent framework of the comparison of models, they might also pose some limitations. For example, instead of picking one middle slice, you may not be picking the true heterogeneity of the spatial characteristics of a tumor. Just as, labelling may be problematic if the only criterion is tumor volume, as high and low grade tumors are clinically more complex and should not be understood as dichotomous entities. These preprocessing / labelling methods could have been refined so as to make the deep learning models perform better.
- C. Potential Causes for Underperformance of Certain Deep Learning Models
It seems that the underperformance of some deep learning architectures (such as ResNet50 and EfficientNet) versus simpler models (Simple CNN) is mainly caused by several mechanisms. The first issue is that complicated models, such as deep architectures, frequently require large datasets for robust feature learning, while ours is still relatively small and drawn from a real-world dataset, which may have precluded their effectiveness. In addition, fine tuning constraints also played a role, since these pretrained networks were used mainly as fixed feature extractors, which did not allow them to adapt nicely to the special characteristics of brain-tumor MRI scans. In order to learn more domain-relevant features, they can selectvely unfreeze deeper layers. Finally, it is most likely that the reason why these more complex architectures overfitted is because data augmentation is not very extensive, and regularisation was applied quite strongly. However, rotation, flipping, intensity variation, or other similar augmentation techniques could potentially help improve the generalisation.
- D. Limitations and Considerations
The current study has several limitations. First, although the dataset comprises real BraTS 2024 images, the effective sample size, particularly after splitting into training and testing sets remains relatively small, potentially preventing more complex deep learning models from achieving optimal performance. Next, the choice to extract only the middle slice from each modality simplifies the data representation but may forfeit valuable spatial information that could enhance the classification. Furthermore, employing tumor volume as the basis for binary labels offers a straightforward mechanism for class differentiation but may not encompass all clinically relevant factors. Future studies should consider alternative or supplementary labelling strategies that integrate additional clinical data. Finally, our reliance on fixed, pre-trained models could limit their potential in the medical imaging context. A more nuanced fine-tuning process tailored to the BraTS dataset might yield better adaptation and improved outcomes for these architectures. Although the Random Forest classifier currently outperforms the deep learning models in our experiments, the discussion highlights several avenues for improving deep learning performance. Addressing these issues through enhanced data preprocessing, fine-tuning strategies, and robust augmentation may bridge the performance gap and lead to more clinically useful models in the future.
VII. Conclusion
In this study, we perform a complete, comparative analysis of different machine learning techniques in intra brain tumor classification in conjunction with BraTS 2024 dataset. Additionally, we considered other deep learning architectures, represented by Simple CNN, VGG16, VGG19, ResNet50, Inception ResNetV2 and EfficientNet, and one of the classical random forest classifiers over PCA reduced features. It was found in the experimental results that the two models had significant differences in performance. Among all approaches, Random Forest classifier yielded the highest accuracy (87.5%) which indicates that PCA extracted features are highly discriminative feature for the current classification task. In contrast, deep learning models were able to learn complex representations but some of them like ResNet50 as well as EfficientNet were unable to perform at or above the chance level in the current training session. Such results highlight the necessity of selecting appropriate architectures, setting proper hyperparameters, pretraining networks and optimizing preprocessing pipeline.
In fact, our analysis finds that even when classical machine learning techniques lead to poor performance generally, they remain robust when the dataset has small sample size or high interpatient variability. This is, however, possible for deep learning models if there are further enhanced training strategies, such as wide data augmentation, selective unfreezing of pre trained networks, as well as more exhaustive hyperparameter optimisation in clinical settings. In future, it is recommended that these training methodologies should be refined, particularly for exploiting more advanced data augmentation techniques, re-tuning of the transfer learning process, and ensemble-based approaches. Furthermore, deep and classical machine learning methods can also be combined. These methods are important for reliable automated diagnostic tools that will help clinicians to accurately classify brain tumors. Overall, this study provides not only a head-to-head comparison of state-of-the-art brain tumor classifiers, but also identifies the challenges and potential of applying machine learning to medical imaging and lays the groundwork for future work aimed at highly diagnostic accuracy and ultimately improving patient outcomes in neuro-oncology.
References
- Jayachandran, A., & Anisha, N. (2024). Multiclass brain tumor classification system in MRI images using cascade neural network. Computational Intelligence, 40(4). [CrossRef]
- Batool, A., & Byun, Y. (2024). Brain tumor detection with integrating traditional and computational intelligence approaches across diverse imaging modalities - Challenges and future directions. Computers in Biology and Medicine. [CrossRef]
- ThamilSelvi, C. P., Kumar, V. S., Asaad, R. R., Palanisamy, P., & Rajappan, L. K. (2024). An integrative framework for brain tumor segmentation and classification using neuraclassnet. Intelligent Data Analysis, 1-26. [CrossRef]
- Mostafa, H., Haddad, N., Mohamed, H., & Taha, Z. A. E. H. (2024). Brain MRI classification and segmentation of glioma, pituitary and meningioma tumors using deep learning approaches. Proceedings of the 2024 11th International Conference on Information and Communication Technology and Accessibility (ICTA), 482-488. [CrossRef]
- Mir, M., Madhi, Z. S., AbdulHussein, A. H., Al Dulaimi, M. K. H., Suliman, M., Alkhayyat, A., Ihsan, A., & LU, L. (2024). Detection and isolation of brain tumors in cancer patients using neural network techniques in MRI images. Scientific Reports, 14(1). [CrossRef]
- Pathak, M. (2024). Mathematical modelling for brain tumor segmentation and classification using machine learning. Panamerican Mathematical Journal, 34(4). [CrossRef]
- Breesha, R., Kumar, T. R. D., Ravi, V., Raj, V. K., Raj, V. K., & Raj, G. P. (2024). Segmentation and classification of brain tumor using CNN algorithm. Proceedings of the 2024 7th International Conference on Computing and Communication Networks (ICCCN), 813-819. [CrossRef]
- Kakarwal, S. (2024). A novel approach for detection, segmentation, and classification of brain tumors in MRI images using neural network and special C means fuzzy clustering techniques. Advances in Nonlinear Variational Inequalities, 27. [CrossRef]
- Alagarsamy, S., Velusamy, D., Shahina, A., Anish, L. S., Kameshwar, A., & Madeshwaran, A. (2024). Brain tumor segmentation and classification using deep neural networks. Proceedings of the 2024 4th International Conference on Electronics, Communication and Aerospace Technology (ICECA), 1124-1129. [CrossRef]
- Dash, Y., Anand, P., Deepali, Chaudhary, P., Sarangi, S. C., & Abraham, A. (2024). Enhancing brain tumor classification and segmentation using ResNet50. Proceedings of the 2024 13th.
- International Conference on Computing Communication and Networking Technologies (ICCCNT), 1-5. [CrossRef]
- de Verdier, M. C., Saluja, R., Gagnon, L., LaBella, D., Baid, U., Tahon, N. H., ... & Rudie, J. D. (2024). The 2024 Brain Tumor Segmentation (BraTS) challenge: glioma segmentation on posttreatment MRI. arXiv preprint arXiv:2405.18368.
- Yang, H., Ni, J., Gao, J., Han, Z., & Luan, T. (2021). A novel method for peanut variety identification and classification by Improved VGG16. Scientific Reports, 11(1), 15756.
- Wen, L., Li, X., Li, X., & Gao, L. (2019, May). A new transfer learning based on VGG-19 network for fault diagnosis. In 2019 IEEE 23rd international conference on computer supported cooperative work in design (CSCWD) (pp. 205-209). IEEE.
- Wen, L., Li, X., & Gao, L. (2020). A transfer convolutional neural network for fault diagnosis based on ResNet-50. Neural Computing and Applications, 32(10), 6111-6124.
- Li, Z., Tian, X., Liu, X., Liu, Y., & Shi, X. (2022). A two-stage industrial defect detection framework based on improved-yolov5 and optimized-inception-resnetv2 models. Applied Sciences, 12(2), 834.
- Tan, M., & Le, Q. (2019, May). Efficientnet: Rethinking model scaling for convolutional neural networks. In International conference on machine learning (pp. 6105-6114). PMLR.
- Abd Elminaam, D. S., Alfarouk, S. A. O., Fouad, K. O. M., Slait, R. A., & Wasfy, R. S. (2024). Optimizing brain tumor detection: Enhancing diagnostic accuracy in brain tumor detection using a hybrid approach of machine learning and deep learning models. Proceedings of the 2024 11th.
- Mediterranean International Conference on Ultra Modern Telecommunications and Control.
- Systems and Workshops (MIUCC), 1–8. [CrossRef]
- Bansal, S., & Ramu, B. (2024). Accurate detection and classification of brain tumors using U-Net and extreme learning module. Proceedings of the 2024 International Conference on Security and Cryptography (ICOSEC), 902–909. [CrossRef]
- Bsoul, Q., Bsoul, R., Al jawazneh, F. y. S., Bsoul, R. W., Abd Elminaam, D. S., Abdelghany, M. A., Alkady, Y., & Gomaa, I. (2024). Brain tumor detection: Integrating machine learning and deep learning for robust brain tumor classification. Journal of Intelligent Systems and Internet of Things, 15(1), 01–16. [CrossRef]
- David, S. A., Begum, A., Kalilulah, S. I., N, R. N., Rajathi, K., & Hemalatha, D. (2024). Deep learning advances in brain tumor classification: Leveraging VGG16 and MobileNetV2 for accurate MRI diagnostics. Proceedings of the 2024 9th International Conference on Power Electronics, Control and Transmission Systems (ICPECTS), 1–6. [CrossRef]
- Gasmi, K., Aoun, N. B., Alsalem, K., Ltaifa, I. B., Alrashdi, I., Ammar, L. B., Mrabet, M., & Shehab, A. (2024). Enhanced brain tumor diagnosis using combined deep learning models and weight selection technique. Frontiers in Neuroinformatics, 18, Article 1444650. [CrossRef]
- Gencer, K., & Gencer, G. (2025). Hybrid deep learning approach for brain tumor classification using EfficientNetB0 and novel quantum genetic algorithm. PeerJ Computer Science, 11, Article e2556. [CrossRef]
- Gu, C., & Ren, S. (2024). Enhancing brain cancer type prediction through machine learning algorithms and feature selection techniques. Journal of Physics A: Mathematical and Theoretical,.
- 57(42), Article 425601. [CrossRef]
- Jade, S., Shende, S., Shinde, S., Vidhate, S., & Joshi, A. H. (2023). NeuroML - Brain tumor classification using machine learning and deep learning. International Journal of Advanced Research in Science, Communication and Technology, 10(10), 136–142. [CrossRef]
- Khan, M. A., Nazeeruddin, E., Rubab, S., & Ullah, M. S. (2024). Brain tumor classification from MRI scans using a custom 4-residual deep learning architecture and particle swarm optimization. Proceedings of the 2024 IEEE International Symposium on Applications of Electromagnetics and Computational Electromagnetics (ISAEC), 1–6. [CrossRef]
- Kowalski, M., Abdulrazak, L. F., Kibria, H. B., Khandakar, A., Ayari, M. A., Ahamed, M. F., Ahsan, M., Haider, J., Moni, M. A., & Nahiduzzaman, M. (2025). A hybrid explainable model based on advanced machine learning and deep learning models for classifying brain tumors using MRI images. Scientific Reports, 15(1), Article 24778. [CrossRef]
- Li, Z., & Dib, O. (2024). Empowering brain tumor diagnosis through explainable deep learning. Machine Learning and Knowledge Extraction, 6(4), 2248–2281. [CrossRef]
- Muftic, F., Kadunic, M., Musinbegovic, A., Almisreb, A. A., & Ja’afar, H. (2024). Deep learning for magnetic resonance imaging brain tumor detection: Evaluating ResNet, EfficientNet, and VGG-19. International Journal of Power Electronics and Drive Systems, 14(6), 6360–6372. [CrossRef]
- Padmakala, S., & Maheswari, S. (2024). Deep learning-based MRI analysis for brain tumor detection: Insights from ResNet and DenseNet models. Proceedings of the 2024 International Conference on Electronics, Communication and Aerospace Technology (ICECA), 1620–1626. [CrossRef]
- Panda, J., & Sachdeva, B. (2023). A review on brain tumour detection and classification using deep learning techniques. Proceedings of the 2023 Advances in Electrical and Communication Engineering (AECE), 71–75. [CrossRef]
- Patro, S. G. K., Govil, N., Saxena, S., Mishra, B. K., Zamani, A. T., Miled, A. B., Parveen, N., Elshafie, H., & Hamdan, M. (2024). Brain tumor classification using an ensemble of deep learning techniques. IEEE Access, 12, 171658–171672. [CrossRef]
- Rasa, S. M., Islam, M. M., Talukder, M. A., Uddin, M. A., Khalid, M., Kazi, M., & Kazi, M. Z. (2024). Brain tumor classification using fine-tuned transfer learning models on magnetic resonance imaging (MRI) images. Digital Health, 10, Article 2055207624128614. [CrossRef]
- Regan, M., & Srinivasan, P. S. (2024). Enhancing brain tumor diagnosis with substructure aware graph neural networks and fuzzy linguistic segmentation. Proceedings of the 2024 International Conference on Computational Intelligence and Computing Innovations (ICOCICI), 1613–1618. [CrossRef]
- Sridhar, K., Tiwari, V., Mounica, R., & Tejaswi, K. (2024). Brain tumor classification using enhanced CNN and optimization with metaheuristic algorithms. Proceedings of the 2024 International Conference on Signal Processing and Intelligent Systems (ICSPIS), 1–6. [CrossRef]
- Vellanki, Y., Popuri, S., Maram, L. Y., & Kamepalli, S. (2024). Enhanced brain tumor detection with deep learning: A comparative study of CNN, VGG16 and ResNet models. Proceedings of the 2024 International Conference on Inventive Computation and Electrical Circuits (ICICEC), 1–8. [CrossRef]
- Vetrivelan, P., Sanjay, K., Shreedhar, G. D., S, K. V., & Nithyan, R. (2024). Brain tumor detection and classification using deep learning. Proceedings of the 2024 International Conference on Sustainable Smart Cities and Emerging Economies (ICSSEECC), 1–6. [CrossRef]
Disclaimer/Publisher’s Note: The statements, opinions and data contained in all publications are solely those of the individual author(s) and contributor(s) and not of MDPI and/or the editor(s). MDPI and/or the editor(s) disclaim responsibility for any injury to people or property resulting from any ideas, methods, instructions or products referred to in the content. |
© 2025 by the authors. Licensee MDPI, Basel, Switzerland. This article is an open access article distributed under the terms and conditions of the Creative Commons Attribution (CC BY) license (https://creativecommons.org/licenses/by/4.0/).
Copyright: This open access article is published under a Creative Commons CC BY 4.0 license, which permit the free download, distribution, and reuse, provided that the author and preprint are cited in any reuse.


