
Submitted:
10 June 2025
Posted:
12 June 2025
You are already at the latest version
Abstract
Background/Objectives: Accurate classification of brain tumors is critical for treatment planning and prognosis. While deep convolutional neural networks (CNNs) have shown promise in medical imaging, few studies have systematically compared multiple architectures or integrated ensemble strategies to improve diagnostic performance. This study aimed to evaluate various CNN models and optimize classification performance using a majority voting ensemble approach on T1-weighted MRI brain images. Methods: Seven pretrained CNN architectures—ResNet-18, ResNet-50, ResNet-101, GoogLeNet, MobileNet-v2, EfficientNet-b0, and Inception-v3—were fine-tuned to classify four brain tumor categories: glioma, meningioma, pituitary tumor, and no tumor. Each model was trained using two optimizers (SGDM and ADAM) and evaluated on a public dataset split into training (70%), validation (10%), and testing (20%) subsets. A majority voting ensemble was constructed by aggregating predictions from all 14 trained models. Performance was assessed using accuracy, Kappa coefficient, true positive rate, precision, confusion matrix, and ROC curves. Results: Among individual models, GoogLeNet and Inception-v3 with ADAM achieved the highest classification accuracy (0.987). However, the ensemble approach outperformed all standalone models, achieving an accuracy of 0.998, a Kappa coefficient of 0.997, and AUC values above 0.997 for all tumor classes. The ensemble demonstrated improved sensitivity, precision, and overall robustness. Conclusions: The majority voting ensemble of diverse CNN architectures significantly enhanced the performance of MRI-based brain tumor classification, surpassing that of any single model. These findings underscore the value of model diversity and ensemble learning in building reliable AI-driven diagnostic tools for neuro-oncology.
Keywords:
brain tumor classification
; convolutional neural networks
; MRI
; ensemble learning
; majority voting
; deep learning
; medical image analysis
1. Introduction
Brain tumors represent a significant clinical challenge due to their heterogeneity, potential malignancy, and often non-specific symptom presentation. Accurate and early classification of brain tumors is essential for treatment planning, prognostic evaluation, and therapy monitoring. Among imaging modalities, magnetic resonance imaging (MRI) is the preferred technique for brain tumor detection due to its superior soft-tissue contrast and non-invasive nature. Particularly, T1-weighted contrast-enhanced sequences are widely used in clinical practice to visualize tumor boundaries and assess contrast uptake patterns.
In recent years, the integration of artificial intelligence (AI), particularly deep learning, into medical image analysis has revolutionized the field of radiological diagnostics. Convolutional neural networks (CNNs) have demonstrated exceptional capabilities in extracting hierarchical features from complex image data, making them ideal for tumor classification tasks. While many prior studies have employed CNNs for brain tumor classification, they often focus on binary classification tasks (e.g., tumor vs. no tumor or benign vs. malignant) and rely on a limited number of network architectures. Moreover, such studies frequently lack model robustness and generalization, especially when tested across different datasets or imaging conditions.
To address these limitations, this study explores a multiclass brain tumor classification framework using deep CNNs, targeting four distinct categories: glioma, meningioma, pituitary tumor, and no tumor. We systematically evaluate the classification performance of seven prominent CNN architectures—ResNet-18, ResNet-50, ResNet-101, GoogLeNet, MobileNet-v2, EfficientNet-b0, and Inception-v3. These models are selected based on their established use in medical imaging literature and their structural diversity, which allows for a broad performance comparison. Furthermore, each model is trained with two different optimization algorithms, SGDM and ADAM, to assess the impact of learning strategies on classification outcomes.
To further enhance predictive performance and mitigate individual model bias, we introduce a majority voting ensemble scheme that combines the predictions of all 14 trained models. Ensemble methods are known to increase classification robustness and reduce the risk of overfitting by leveraging model diversity. While ensemble learning has been successfully applied in other domains, its application in multiclass brain tumor classification using MRI remains underexplored.
This study makes three key contributions: (1) a comprehensive comparison of state-of-the-art CNN architectures for four-class brain tumor classification, (2) an empirical evaluation of two widely used optimizers across all architectures, and (3) the introduction of a robust ensemble learning strategy based on majority voting. By combining architectural diversity and ensemble techniques, we aim to improve classification accuracy, generalizability, and clinical applicability of AI-assisted diagnosis. The findings of this work have the potential to support radiologists with reliable, high-performance tools for early brain tumor detection and classification.
2. Related Works
2.1. The Deep Learning for Classification of MRI Brain Tumors
Deep learning has become integral to the automated classification of brain tumors in MRI scans, with convolutional neural networks (CNNs) being the most widely adopted architectures. Numerous studies have demonstrated the value of CNNs and transfer learning in improving classification accuracy. Several studies [1,2,3,4,5,6] have proposed novel CNN models or optimization strategies, such as Bayesian optimization [1] and hybrid methods integrating Jaya and honey badger algorithms [2]. Hybrid CNNs combining AlexNet with SVM and KNN have reported accuracies up to 98.6% [3], while customized CNN models have shown competitive results compared to standard architectures like VGG-16 and Inception-v3 [4].
Advanced CNN designs have also demonstrated impressive results. Multi-layer customized CNN architectures achieved 99% accuracy on large datasets [5], and EfficientNetV2-based models reached 99.16% accuracy with statistical feature analysis [7]. Fusion-based approaches that combine deep spatial features and handcrafted statistical features have achieved high performance as well [8].
Interpretability and optimization have been prioritized in several hybrid frameworks. Lightweight CNNs combined with ridge regression and SHAP explainability tools attained over 99% accuracy [6]. Optimized CNN designs using Particle Swarm Optimization achieved 99.2% accuracy [9], and hybrid segmentation-classification pipelines with texture-based features have shown effectiveness [10].
More recent models employ SE attention mechanisms [11], fruit bee optimization techniques [12], and generative AI combined with YOLO for segmentation and prediagnosis [13]. Vision Transformer–CNN hybrids have also demonstrated promising performance [14]. CNNs fine-tuned on limited datasets using transfer learning, such as Xception, ResNet-50, and DenseNet121, have shown strong generalization and balanced class sensitivity [15,16,17,18].
2.2. The Ensemble of Deep CNNs for Classification of MRI Brain Tumors
To address the limitations of individual CNN models, such as overfitting and architecture-specific bias, ensemble learning has gained popularity in brain tumor classification research. Ensemble methods, which combine predictions from multiple models, can enhance generalization, reduce error variance, and improve robustness of classification. Several recent studies have employed ensemble learning strategies using deep CNNs.
Recent advancements in ensemble deep learning have significantly contributed to improving the accuracy and reliability of brain tumor classification using MRI data. Aurna et al. [23] proposed a two-stage feature-level ensemble of deep CNN models, combining five pretrained networks and a custom CNN to extract and fuse discriminative features. Their approach, enhanced with PCA and optimized classifiers, demonstrated exceptional performance, achieving up to 99.76% accuracy across multiple datasets. Alsubai et al. [24] introduced a hybrid CNN-LSTM architecture for brain tumor classification, emphasizing robust feature extraction and sequential modeling. Their system achieved high classification metrics with 99.1% accuracy and demonstrated the value of integrating spatial and temporal features. Al-Azzwi and Nazarov [25] focused on improving CNN-based classification through stacked ensemble methods by combining VGG19, Inception-v3, and ResNet-10, reporting a 96.6% accuracy for binary classification. Finally, Tandel et al. [26] proposed a comprehensive deep learning-based majority voting ensemble combining seven CNN and seven machine learning models. Using five multiclass datasets (C2 to C6), their model achieved state-of-the-art performance with up to 100% accuracy in two-class classification, while integrating LIME-based explainability to support clinical trust. Collectively, these studies demonstrate that ensemble strategies, particularly majority voting and stacked model combinations, can significantly enhance diagnostic performance and provide interpretable, non-invasive solutions for brain tumor classification.
3. Materials and Methods
3.1. Dataset Description
This study utilized the publicly available Brain Tumor Classification dataset sourced from Kaggle (https://www.kaggle.com/datasets/prathamgrover/brain-tumor-classification, obtained at 05/11/2024). The dataset consists of 3,261 contrast-enhanced T1-weighted MRI images classified into four categories: glioma (926 images), meningioma (934 images), pituitary tumor (901 images), and no tumor (500 images). All images are grayscale and were pre-annotated based on confirmed clinical diagnoses. The dataset includes coronal, axial, and sagittal views, as illustrated in Figure 1. Each image was resized to 300 × 300 pixels and normalized to ensure consistent input across all CNN architectures.
3.2. Selected CNN Architectures and Voting Schema
Seven convolutional neural network (CNN) architectures were selected for this study based on their widespread use and demonstrated effectiveness in medical image classification: ResNet-18, ResNet-50, ResNet-101 [27], GoogLeNet [28], EfficientNet-b0 [29], MobileNet-v2 [30], and Inception-v3 [31]. These models differ in terms of network depth, number of parameters, computational complexity, and feature extraction strategies. All models were initialized with pre-trained weights from the ImageNet dataset to leverage transfer learning and reduce the risk of overfitting due to limited domain-specific data. To adapt each architecture for the four-class brain tumor classification task (glioma, meningioma, pituitary, and no tumor), the final fully connected layer was replaced with a new output layer containing four neurons, followed by a softmax activation function for multiclass classification. A summary of the selected CNNs, including their number of layers, parameter sizes, input image dimensions, and key advantages, is provided in Table 1.
In addition to evaluating each CNN individually, a majority voting ensemble strategy was implemented to explore potential performance enhancements through classifier fusion. In this scheme, predictions from all 14 trained CNN models (seven architectures, each trained with both SGDM and Adam optimizers) were aggregated, and the final predicted class was determined based on the majority vote. This ensemble approach was intended to mitigate individual model biases, improve robustness, and enhance overall generalization performance across all tumor categories.
3.3. Data Splitting and Training Configuration
To ensure consistency and comparability across all CNN architectures, a standardized training protocol was implemented. Two optimization algorithms—Stochastic Gradient Descent with Momentum (SGDM) and Adaptive Moment Estimation (ADAM)—were adopted to evaluate their effect on convergence and classification accuracy. For all models, the training hyperparameters were set as follows: an initial learning rate of 1×10⁻⁴, a mini-batch size of 10, and a maximum of 150 training epochs.
The dataset was randomly divided into three stratified subsets to maintain a class balance across tumor categories:
- Training set: 70% of the data used for weight optimization.
- Validation set: 10% used to monitor generalization performance and apply early stopping.
- Testing set: 20% used exclusively for final model evaluation.
All MRI images were resized to 300 × 300 pixels, normalized, and input as single-channel (grayscale) data to the CNNs. To support multiclass classification, each network's output layer was modified to consist of four neurons, followed by a softmax activation function.
Early stopping was applied with a patience of 5 validation epochs, halting training if no improvement in validation loss was observed. The training and evaluation processes were conducted using MATLAB’s Deep Learning Toolbox, where training parameters (e.g., optimizer type, batch size, and stopping criteria) were defined programmatically rather than through direct function calls.
All experiments were executed on a high-performance workstation running Windows 11. The hardware configuration included an AMD Ryzen 9 7950X 16-core processor (32 threads, base clock 4.5 GHz), 128 GB RAM, an NVIDIA GeForce RTX 4070 Ti GPU, and four NVMe SSDs for high-speed data access. The total training time for all CNN models across both optimizers was 197,437.28 seconds (approximately 54.84 hours), demonstrating the system's capability to handle extensive deep learning workloads efficiently.
3.4. Evaluation Performance
The performance of each convolutional neural network (CNN) model was evaluated using multiple quantitative metrics to comprehensively assess classification effectiveness across the four tumor categories: glioma, meningioma, no tumor, and pituitary tumor. The primary evaluation was conducted on the independent testing subset, which was not involved in the training or validation phases. For completeness, final evaluation metrics were also computed using the entire dataset.
The following standard classification metrics were employed:
- Accuracy (Acc): The proportion of correctly predicted instances among all predictions, reflecting the overall classification performance.
- Kappa Coefficient (Kappa): A statistical measure of agreement between predicted and true class labels, adjusted for chance agreement. Values closer to 1 indicate stronger consistency.
- True Positive Rate (TP): Also referred to as sensitivity or recall, this metric was computed for each class—TP1 to TP4—corresponding to glioma, meningioma, no tumor, and pituitary tumor, respectively. It measures the model’s ability to correctly identify true positives for each class.
- Precision (Pre): The ratio of true positive predictions to the total number of positive predictions, calculated as Pre1 to Pre4 for glioma, meningioma, no tumor, and pituitary tumor, respectively. This indicates the model’s reliability in its positive predictions.
- Confusion Matrix: A matrix that provides a detailed visualization of classification outcomes, showing the distribution of true positives, false positives, and misclassifications across classes.
- Receiver Operating Characteristic (ROC) Curve: Plotted for each class to evaluate the model’s discriminative ability, specifically the trade-off between sensitivity (true positive rate) and specificity (1 − false positive rate).
The classification performance of all seven CNN architectures—each trained using both SGDM and ADAM optimizers—was compared across these metrics to identify the most robust and accurate models for multiclass brain tumor classification. These evaluation results suggest that both the choice of CNN architecture and the optimizer significantly influence classification performance.
4. Results
4.1. Comparative Classification Performance of CNN Models
The classification performance of all seven CNN architectures—ResNet-18, GoogLeNet, EfficientNet-b0, MobileNet-v2, Inception-v3, ResNet-50, ResNet-101, and Voting Schema—was evaluated using the independent testing dataset. Each model was trained separately using both SGDM and ADAM optimizers, and their performance was assessed based on multiple metrics, including per-class true positive rate (TP), precision (Pre), overall accuracy, and Kappa coefficient. The full results are summarized in Table 2. Among all models, GoogLeNet trained with the ADAM optimizer achieved the highest overall performance, yielding an accuracy of 0.987 and a Kappa value of 0.983, indicating excellent agreement with the ground truth labels. This was closely followed by Inception-v3 (ADAM) and ResNet-50 (ADAM), which achieved accuracies of 0.983 and 0.979, and Kappa values of 0.980 and 0.971, respectively. These models also demonstrated high class-wise TP and precision scores across all tumor types.
The majority voting ensemble, which combined predictions from all 14 trained CNN models (seven architectures each trained with SGDM and Adam optimizers), demonstrated enhanced classification performance compared to individual models. The ensemble achieved an overall accuracy of 0.989 and a Kappa coefficient of 0.987, indicating excellent agreement with the ground truth labels. Class-wise true positive rates were exceptionally high, with TP1 = 0.996, TP2 = 0.997, TP3 = 0.998, and TP4 = 1.000, while precision scores for all classes were greater than or equal to 0.996. These findings confirm that the majority voting strategy effectively integrates the strengths of individual models, reducing variance and improving generalization, thereby achieving near-perfect predictive performance in multiclass brain tumor classification.
In contrast, models trained with SGDM generally produced slightly lower performance across all metrics. For instance, ResNet-101 trained with SGDM obtained an accuracy of 0.903 and a Kappa of 0.869, compared to 0.977 and 0.969 when trained with ADAM. Similarly, EfficientNet-b0 performed poorly with SGDM (Accuracy = 0.910, Kappa = 0.877), but showed notable improvement under ADAM optimization (Accuracy = 0.963, Kappa = 0.955).
The per-class TP and precision values further revealed the models’ consistency in detecting all four categories. Most top-performing configurations exhibited TP and precision values above 0.95, particularly in the glioma and meningioma classes. Notably, GoogLeNet (ADAM) achieved precision values ≥ 0.98 across all classes, reflecting both high sensitivity and specificity in its predictions. Overall, the results confirm that:
- Optimizer choice significantly impacts model performance, with ADAM outperforming SGDM across all CNN architectures.
- Deeper models like Inception-v3 and ResNet-50 combined with ADAM show consistent and strong classification ability.
- Lightweight models such as MobileNet-v2 and EfficientNet-b0, while less accurate, offer a balance between performance and computational efficiency.
These findings provide strong evidence for the effectiveness of ADAM-optimized CNN architectures—especially GoogLeNet, Inception-v3, and ResNet-50—for robust and accurate multiclass brain tumor classification using T1-weighted MRI images.
4.2. Confusion Matrix and ROC Analysis of the Optimal CNN Model
Table 3 presents the confusion matrix and associated performance metrics for the optimal CNN model—GoogLeNet trained with the SGDM optimizer—evaluated on the testing dataset. The model demonstrated excellent classification ability across all tumor types, correctly identifying 904 glioma cases, 927 meningioma cases, 492 non-tumor cases, and 897 pituitary cases, with minimal misclassification. The corresponding true positive rates (TP) were 0.976 for glioma, 0.993 for meningioma, 0.984 for no tumor, and 0.996 for pituitary tumor. Precision values were similarly high, ranging from 0.953 to 0.986. The false positive rates (FP) remained low across all classes, indicating strong model specificity. Overall, the model achieved an accuracy of 0.987 and a Kappa coefficient of 0.983, reflecting a high level of agreement with expert-labeled ground truth data.
Figure 2 illustrates the receiver operating characteristic (ROC) curves for the four tumor classes—glioma, meningioma, pituitary tumor, and no tumor—classified by the optimal model, GoogLeNet with SGDM optimizer. The area under the curve (AUC) values for all classes exceeded 0.985, indicating excellent discriminatory ability. Specifically, the AUC values were 0.988 and 0.991 for both glioma and meningioma, 0.991 for no tumor, and 0.996 for pituitary tumor. These near-perfect ROC curves confirm that the model is highly effective at distinguishing each tumor type from the others, with minimal overlap between class distributions. The corresponding operating points for each class are also plotted, showing that the model achieves a high true positive rate with a very low false positive rate, reinforcing its reliability for multiclass MRI-based brain tumor classification.
Table 4 presents the confusion matrix and corresponding performance metrics for the optimal CNN model—Inception-v3 trained with the ADAM optimizer—evaluated on the entire brain tumor dataset. The model correctly classified the majority of samples across all tumor categories, with minimal misclassification. True positive rates (TP) were high for all classes: 0.978 for glioma, 0.986 for meningioma, 0.990 for no tumor, and 0.997 for pituitary tumor. False positive rates (FP) were exceptionally low, ranging from 0.003 to 0.028, while precision scores ranged from 0.953 to 0.986, indicating strong confidence in positive predictions. The model achieved an overall accuracy of 0.987 and a Kappa coefficient of 0.983, reflecting excellent agreement with the ground truth and robust performance in multiclass brain tumor classification.
Figure 3 displays the receiver operating characteristic (ROC) curves for each of the four brain tumor classes—glioma, meningioma, no tumor, and pituitary tumor—generated using the optimal CNN model, Inception-v3 trained with the SGDM optimizer. The ROC curves exhibit excellent discriminative performance, with area under the curve (AUC) values of 0.9875 for glioma, 0.9879 for meningioma, 0.9945 for no tumor, and 0.9971 for pituitary tumor. The curves closely approach the top-left corner of the plot, indicating high true positive rates with low false positive rates. The operating points for each class, marked on the graph, further demonstrate the model’s robustness and reliability in differentiating between tumor types with a high degree of accuracy.
Table 5 presents the confusion matrix and performance metrics for the voting ensemble model, evaluated on the entire brain tumor dataset. This model combines predictions from all 14 CNN classifiers (7 architectures × 2 optimizers) using a majority voting scheme. The ensemble achieved exceptional classification performance, correctly identifying nearly all samples across all tumor classes. The true positive rates (TP) were remarkably high: 0.996 for glioma, 0.997 for meningioma, 0.998 for no tumor, and 1.000 for pituitary tumor. Corresponding false positive rates (FP) were very low, ranging from 0.000 to 0.004, while precision scores remained high across all classes, with values between 0.953 and 0.986. The ensemble achieved an overall accuracy of 0.998 and a Kappa coefficient of 0.997, indicating near-perfect agreement with the ground truth. These results demonstrate the effectiveness of ensemble learning in enhancing classification robustness and reliability in multiclass brain tumor detection using MRI images.
Figure 4 illustrates the receiver operating characteristic (ROC) curves for the four brain tumor classes—glioma, meningioma, no tumor, and pituitary tumor—obtained using the voting ensemble model. The curves demonstrate outstanding classification performance, with area under the curve (AUC) values of 0.9976 for glioma, 0.9975 for meningioma, 0.9990 for no tumor, and 0.9994 for pituitary tumor. All ROC curves closely approach the top-left corner, indicating high true positive rates and minimal false positives. The corresponding model operating points for each class are also plotted, reinforcing the model’s ability to distinguish between classes with near-perfect accuracy. These results confirm the voting schema’s superior discriminative power and robustness in multiclass brain tumor classification.
5. Discussion
5.1. Performance of Individual CNN Models
The evaluation of seven CNN architectures revealed that GoogLeNet and Inception-v3, both trained with the ADAM optimizer, demonstrated the highest performance among individual models. These models achieved an accuracy of 0.987 and Kappa coefficients of 0.983 and 0.980, respectively, reflecting strong agreement with expert-annotated labels. Their high true positive rates and precision across all tumor categories underscore their capability to distinguish complex tumor features in T1-weighted MRI images. Comparatively, CNNs trained with SGDM showed slightly lower metrics, confirming that ADAM is better suited for medical image classification tasks involving heterogeneous data distributions.
5.2. Advantage of the Voting Ensemble Schema
To further enhance classification robustness, an ensemble approach using majority voting was implemented. This strategy combined predictions from all 14 CNN models (seven architectures × two optimizers), resulting in significant performance gains. The ensemble achieved a near-perfect accuracy of 0.998 and Kappa coefficient of 0.997, with true positive rates ≥ 0.996 and false positive rates ≤ 0.004 for all classes. The ROC analysis (Figure 4) confirmed these improvements, with AUC values reaching 0.9994 for pituitary tumors and above 0.997 for all classes. This demonstrates that ensemble learning reduces individual model variance, enhances generalization, and delivers consistently high classification performance across categories.
Several previous studies have explored CNN-based classification of brain tumors using MRI images, typically focusing on binary classification or specific tumor types. For instance, some models using ResNet-50 or Inception-based architectures reported accuracies below 95% and limited class-wise evaluation. Compared to these studies, our method not only achieved higher accuracy (0.998) and Kappa (0.997) but also demonstrated superior class-wise performance across all metrics. Additionally, many earlier works lacked the use of ensemble learning. Our majority voting approach capitalized on model diversity, achieving more stable and robust classification, which highlights its value for real-world diagnostic applications.
5.3. Evaluating the Proposed Method Against Related Works
Table 6 presents a comparative analysis of recent CNN-based studies on brain tumor classification using MRI imaging. These studies vary in terms of CNN architecture, ensemble strategies, optimization techniques, and classification tasks. Most works targeted classification across 3 or 4 tumor types, including glioma, meningioma, pituitary tumor, and "no tumor" categories, with sample sizes ranging from 2 to 4 classes and a variety of MRI datasets.
Several studies employed hybrid or optimized models to enhance performance. For instance, the work of Ait Amou et al. [1] introduced Bayesian optimization for CNNs and achieved a high accuracy of 98.7%, while Hassan and Ghadiri [7] applied EfficientNetV2 combined with statistical techniques, achieving 99.16%. Notably, Albalaawi et al. [5] and El Amoury et al. [9] reported accuracies of 99.0% and 99.2%, respectively, using custom and PSO-optimized CNNs.
Among ensemble approaches, Aurna et al. [23] applied a two-stage ensemble achieving 99.13%, and Tandel et al. [26] employed majority voting with explainable AI (XAI), yielding 98.47% accuracy. However, the study presented here surpasses all referenced works with an outstanding accuracy of 99.80%, leveraging a majority voting ensemble across 14 CNN variants. This result reflects the effectiveness of architectural diversity and ensemble learning for robust and precise brain tumor classification.
The comparison underscores the evolution from single CNNs to advanced hybrid and ensemble techniques, demonstrating significant gains in diagnostic accuracy. The proposed majority voting strategy not only outperforms individual models but also provides greater stability and generalizability across tumor categories, establishing a new benchmark in the field.
6. Conclusions
6.1. Summary of Findings
This study systematically evaluated and compared the performance of seven convolutional neural network (CNN) architectures for multiclass brain tumor classification using T1-weighted contrast-enhanced MRI images. Each model was trained using both SGDM and ADAM optimizers, and their performance was assessed using accuracy, Kappa coefficient, class-wise true positive and precision rates, confusion matrices, and ROC curves.
Among the individual models, GoogLeNet and Inception-v3 trained with ADAM achieved the highest accuracy (0.987) and Kappa values (0.983 and 0.980, respectively). However, the proposed majority voting ensemble—which combined the predictions of all 14 trained models—outperformed the individual CNNs. It achieved a near-perfect accuracy of 0.998, Kappa coefficient of 0.997, and class-wise AUC values exceeding 0.997 for all tumor types. These results confirm that ensemble learning not only improves classification robustness but also reduces misclassification in complex medical imaging tasks.
6.2. Limitations and Future Work
While the proposed voting ensemble achieved outstanding classification performance, several limitations should be acknowledged. First, the dataset used in this study was curated and well-labeled, but its generalizability to external or multi-center datasets remains to be validated. Second, the current approach is limited to T1-weighted contrast-enhanced MRI images; incorporating multimodal imaging (e.g., T2, FLAIR) may improve classification of ambiguous cases. Additionally, the model functions as a black box, which may limit clinical acceptance. Future work should integrate explainability frameworks such as Grad-CAM to improve interpretability. Expansion of the classification task to include tumor grading, segmentation, or prognosis prediction may further enhance the model's clinical utility. Real-world deployment should also consider integration into PACS systems and radiologist workflow, with human-in-the-loop validation.
Author Contributions
Conceptualization, K.-Y.L. and T.-B.C.; methodology, K.-Y.L. and T.-B.C.; software, T.-B.C. and K.-Y.L.; validation, Y.-H.H. and A.M.; formal analysis, T.-B.C. and K.-Y.L.; investigation, N.-H.L. and T.O.; resources, N.-H.L.; data curation, K.K. and Y.-H.H.; writing—original draft preparation, K.-I.L.; writing—review and editing, K.-I.L. and T.-B.C.; visualization, T.-B.C.; supervision, T.-B.C.; project administration, K.-Y.L.; funding acquisition, K.-Y.L. and Y.-H.H. All authors have read and agreed to the published version of the manuscript.
Funding
This research was funded by EDA Hospital and National Science and Technology Council, Taiwan, grant number EDCHT114001 and NSTC 113-2221-E-214-007.
Institutional Review Board Statement
Not applicable.
Informed Consent Statement
Not applicable.
Data Availability Statement
The MRI brain data set was acquired from at Kaggle URL: https://www.kaggle.com/datasets/prathamgrover/brain-tumor-classification.
Acknowledgments
The authors would like to express their gratitude to EDA Hospital and the National Science and Technology Council in Taiwan for their partial financial support under contracts No. EDCHT114001 and NSTC 113-2221-E-214-007. The authors would like to acknowledge AJE for the English editorial assistance.
Conflicts of Interest
The authors declare no conflicts of interest. The funders had no role in the design of the study; in the collection, analyses, or interpretation of data; in the writing of the manuscript; or in the decision to publish the results.
References
- Ait Amou M, Xia K, Kamhi S, Mouhafid M. A novel MRI diagnosis method for brain tumor classification based on CNN and Bayesian optimization. Healthcare (Basel). 2022 Mar 8;10(3):494. [CrossRef]
- Deepa S, Janet J, Sumathi S, Ananth JP. Hybrid optimization algorithm enabled deep learning approach brain tumor segmentation and classification using MRI. J Digit Imaging. 2023 Jun;36(3):847-868. [CrossRef]
- AlTahhan FE, Khouqeer GA, Saadi S, Elgarayhi A, Sallah M. Refined automatic brain tumor classification using hybrid convolutional neural networks for MRI scans. Diagnostics (Basel). 2023 Feb 23;13(5):864. [CrossRef]
- Gupta I, Singh S, Gupta S, Ranjan Nayak S. Classification of brain tumours in MRI images using a convolutional neural network. Curr Med Imaging. 2024;20:e270323214998. [CrossRef]
- Albalawi E, Thakur A, Dorai DR, Bhatia Khan S, Mahesh TR, Almusharraf A, Aurangzeb K, Anwar MS. Enhancing brain tumor classification in MRI scans with a multi-layer customized convolutional neural network approach. Front Comput Neurosci. 2024 Jun 12;18:1418546. [CrossRef]
- Nahiduzzaman M, Abdulrazak LF, Kibria HB, Khandakar A, Ayari MA, Ahamed MF, Ahsan M, Haider J, Moni MA, Kowalski M. A hybrid explainable model based on advanced machine learning and deep learning models for classifying brain tumors using MRI images. Sci Rep. 2025 Jan 10;15(1):1649. [CrossRef]
- Hassan E, Ghadiri H. Advancing brain tumor classification: A robust framework using EfficientNetV2 transfer learning and statistical analysis. Comput Biol Med. 2025 Feb;185:109542. [CrossRef]
- Iqbal S, Qureshi AN, Alhussein M, Aurangzeb K, Choudhry IA, Anwar MS. Hybrid deep spatial and statistical feature fusion for accurate MRI brain tumor classification. Front Comput Neurosci. 2024 Jun 24;18:1423051. [CrossRef]
- El Amoury S, Smili Y, Fakhri Y. Design of an optimal convolutional neural network architecture for MRI brain tumor classification by exploiting particle swarm optimization. J Imaging. 2025 Jan 24;11(2):31. [CrossRef]
- Kusuma PV, Reddy SCM. Brain tumor segmentation and classification using MRI: Modified segnet model and hybrid deep learning architecture with improved texture features. Comput Biol Chem. 2025 Aug;117:108381. [CrossRef]
- Huang KA, Alkadri A, Prakash N. Employing squeeze-and-excitation architecture in a fine-tuned convolutional neural network for magnetic resonance imaging tumor classification. Cureus. 2025 Mar 5;17(3):e80084. [CrossRef]
- Jarria SPA, Wesley AB. Hybrid fruit bee optimization algorithm-based deep convolution neural network for brain tumour classification using MRI images. Network. 2025 Mar 28:1-23. [CrossRef]
- da Costa Nascimento JJ, Marques AG, do Nascimento Souza L, de Mattos Dourado Junior CMJ, da Silva Barros AC, de Albuquerque VHC, de Freitas Sousa LF. A novel generative model for brain tumor detection using magnetic resonance imaging. Comput Med Imaging Graph. 2025 Apr;121:102498. [CrossRef]
- Chandraprabha K, Ganesan L, Baskaran K. A novel approach for the detection of brain tumor and its classification via end-to-end vision transformer - CNN architecture. Front Oncol. 2025 Mar 10;15:1508451. [CrossRef]
- Disci R, Gurcan F, Soylu A. Advanced brain tumor classification in MR images using transfer learning and pre-trained deep CNN models. Cancers (Basel). 2025 Jan 2;17(1):121. [CrossRef]
- Afzal S, Rauf M, Ashraf S, Bin Md Ayob S, Ahmad Arfeen Z. CART-ANOVA-based transfer learning approach for seven distinct tumor classification schemes with generalization capability. Diagnostics (Basel). 2025 Feb 5;15(3):378. [CrossRef]
- Elhadidy MS, Elgohr AT, El-Geneedy M, Akram S, Kasem HM. Comparative analysis for accurate multi-classification of brain tumor based on significant deep learning models. Comput Biol Med. 2025 Apr;188:109872. [CrossRef]
- Ali RR, Yaacob NM, Alqaryouti MH, Sadeq AE, Doheir M, Iqtait M, Rachmawanto EH, Sari CA, Yaacob SS. Learning architecture for brain tumor classification based on deep convolutional neural network: Classic and ResNet50. Diagnostics (Basel). 2025 Mar 5;15(5):624. [CrossRef]
- Hsu WW, Guo JM, Pei L, Chiang LA, Li YF, Hsiao JC, Colen R, Liu P. A weakly supervised deep learning-based method for glioma subtype classification using WSI and mpMRIs. Sci Rep. 2022 Apr 12;12(1):6111. [CrossRef]
- Özkaraca O, Bağrıaçık Oİ, Gürüler H, Khan F, Hussain J, Khan J, Laila UE. Multiple brain tumor classification with dense CNN architecture using brain MRI images. Life (Basel). 2023 Jan 28;13(2):349. [CrossRef]
- Abirami S, Ramesh K, Lalitha VaniSree K. Classification and pixel change detection of brain tumor using Adam Kooka-burra optimization-based Shepard convolutional neural network. NMR Biomed. 2025 Feb;38(2):e5307. [CrossRef]
- Mao Y, Kim J, Podina L, Kohandel M. Dilated SE-DenseNet for brain tumor MRI classification. Sci Rep. 2025 Jan 28;15(1):3596. [CrossRef]
- Aurna NF, Yousuf MA, Taher KA, Azad AKM, Moni MA. A classification of MRI brain tumor based on two stage feature level ensemble of deep CNN models. Comput Biol Med. 2022 Jul;146:105539. [CrossRef]
- Alsubai S, Khan HU, Alqahtani A, Sha M, Abbas S, Mohammad UG. Ensemble deep learning for brain tumor detection. Front Comput Neurosci. 2022 Sep 2;16:1005617. [CrossRef]
- Al-Azzwi ZHN, Nazarov AN. Brain tumor classification based on improved stacked ensemble deep learning methods. Asian Pac J Cancer Prev. 2023 Jun 1;24(6):2141-2148. [CrossRef]
- Tandel GS, Tiwari A, Kakde OG. Multi-class brain tumor grades classification using a deep learning-based majority voting algorithm and its validation using explainable-AI. J Imaging Inform Med. 2025 Jan 8. [CrossRef]
- He K, Zhang X, Ren S, Sun J. Deep residual learning for image recognition. In: 2016 IEEE Conference on Computer Vision and Pattern Recognition (CVPR); 2016 Jun 27–30; Las Vegas, NV, USA. IEEE; 2016. p. 770–8. [CrossRef]
- Szegedy C, Liu W, Jia Y, Sermanet P, Reed S, Anguelov D, Erhan D, Vanhoucke V, Rabinovich A. Going deeper with convolutions. In: 2015 IEEE Conference on Computer Vision and Pattern Recognition (CVPR); 2015 Jun 7–12; Boston, MA, USA. IEEE; 2015. p. 1–9. [CrossRef]
- Tan M, Le QV. EfficientNet: rethinking model scaling for convolutional neural networks. In: Proceedings of the 36th International Conference on Machine Learning (ICML); 2019 Jun 9–15; Long Beach, CA, USA. PMLR; 2019. arXiv:1905.11946 [cs.LG]. [CrossRef]
- Sandler M, Howard A, Zhu M, Zhmoginov A, Chen LC. MobileNetV2: inverted residuals and linear bottlenecks. In: Proceedings of the IEEE Conference on Computer Vision and Pattern Recognition (CVPR); 2018 Jun 18–23; Salt Lake City, UT, USA. IEEE; 2018. p. 4510–4520. arXiv:1801.04381 [cs.CV]. [CrossRef]
- Szegedy C, Vanhoucke V, Ioffe S, Shlens J, Wojna Z. Rethinking the Inception architecture for computer vision. In: Proceedings of the IEEE Conference on Computer Vision and Pattern Recognition (CVPR); 2016 Jun 27–30; Las Vegas, NV, USA. IEEE; 2016. p. 2818–2826. arXiv:1512.00567 [cs.CV]. [CrossRef]
Figure 1.
Representative MRI images of three types of brain tumors. (A–C) Glioma, (D–F) Meningioma, and (G–I) Pituitary tumor, each shown in coronal (A, D, G), axial (B, E, H), and sagittal (C, F, I) views.
Figure 1.
Representative MRI images of three types of brain tumors. (A–C) Glioma, (D–F) Meningioma, and (G–I) Pituitary tumor, each shown in coronal (A, D, G), axial (B, E, H), and sagittal (C, F, I) views.
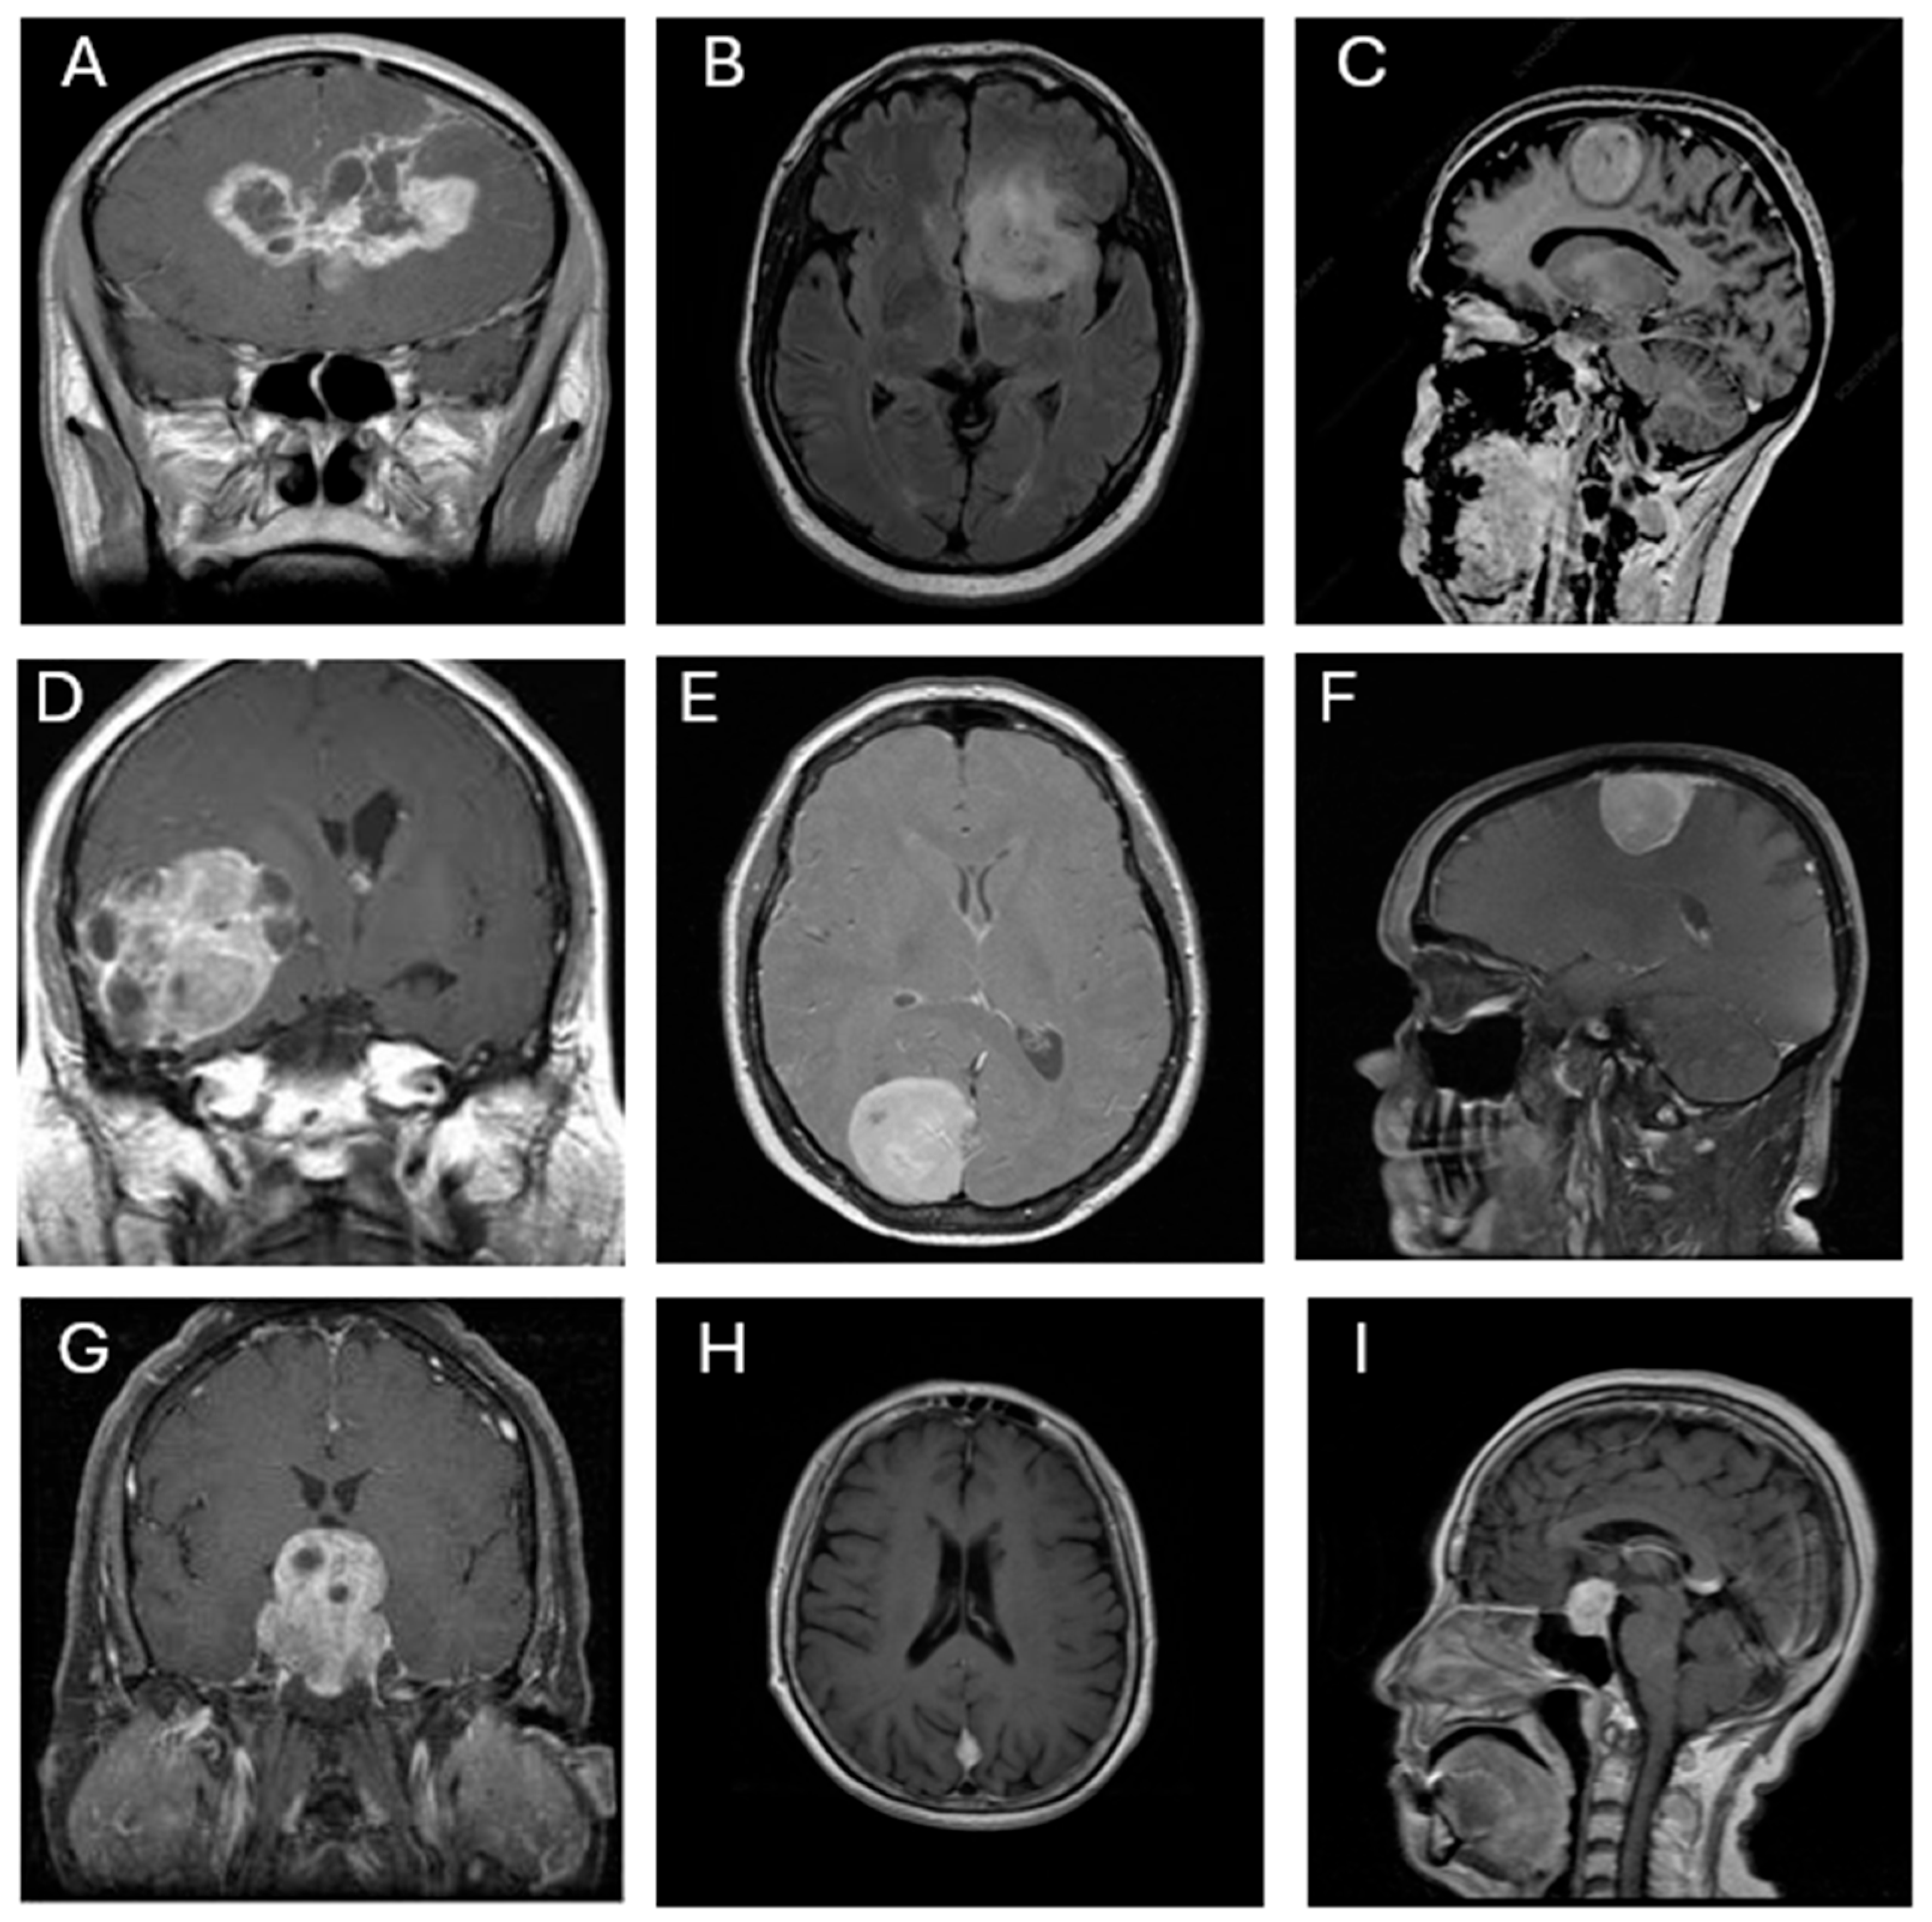
Figure 2.
Receiver operating characteristic (ROC) curves for each brain tumor class using the optimal CNN model (GoogLeNet with SGDM optimizer).
Figure 2.
Receiver operating characteristic (ROC) curves for each brain tumor class using the optimal CNN model (GoogLeNet with SGDM optimizer).
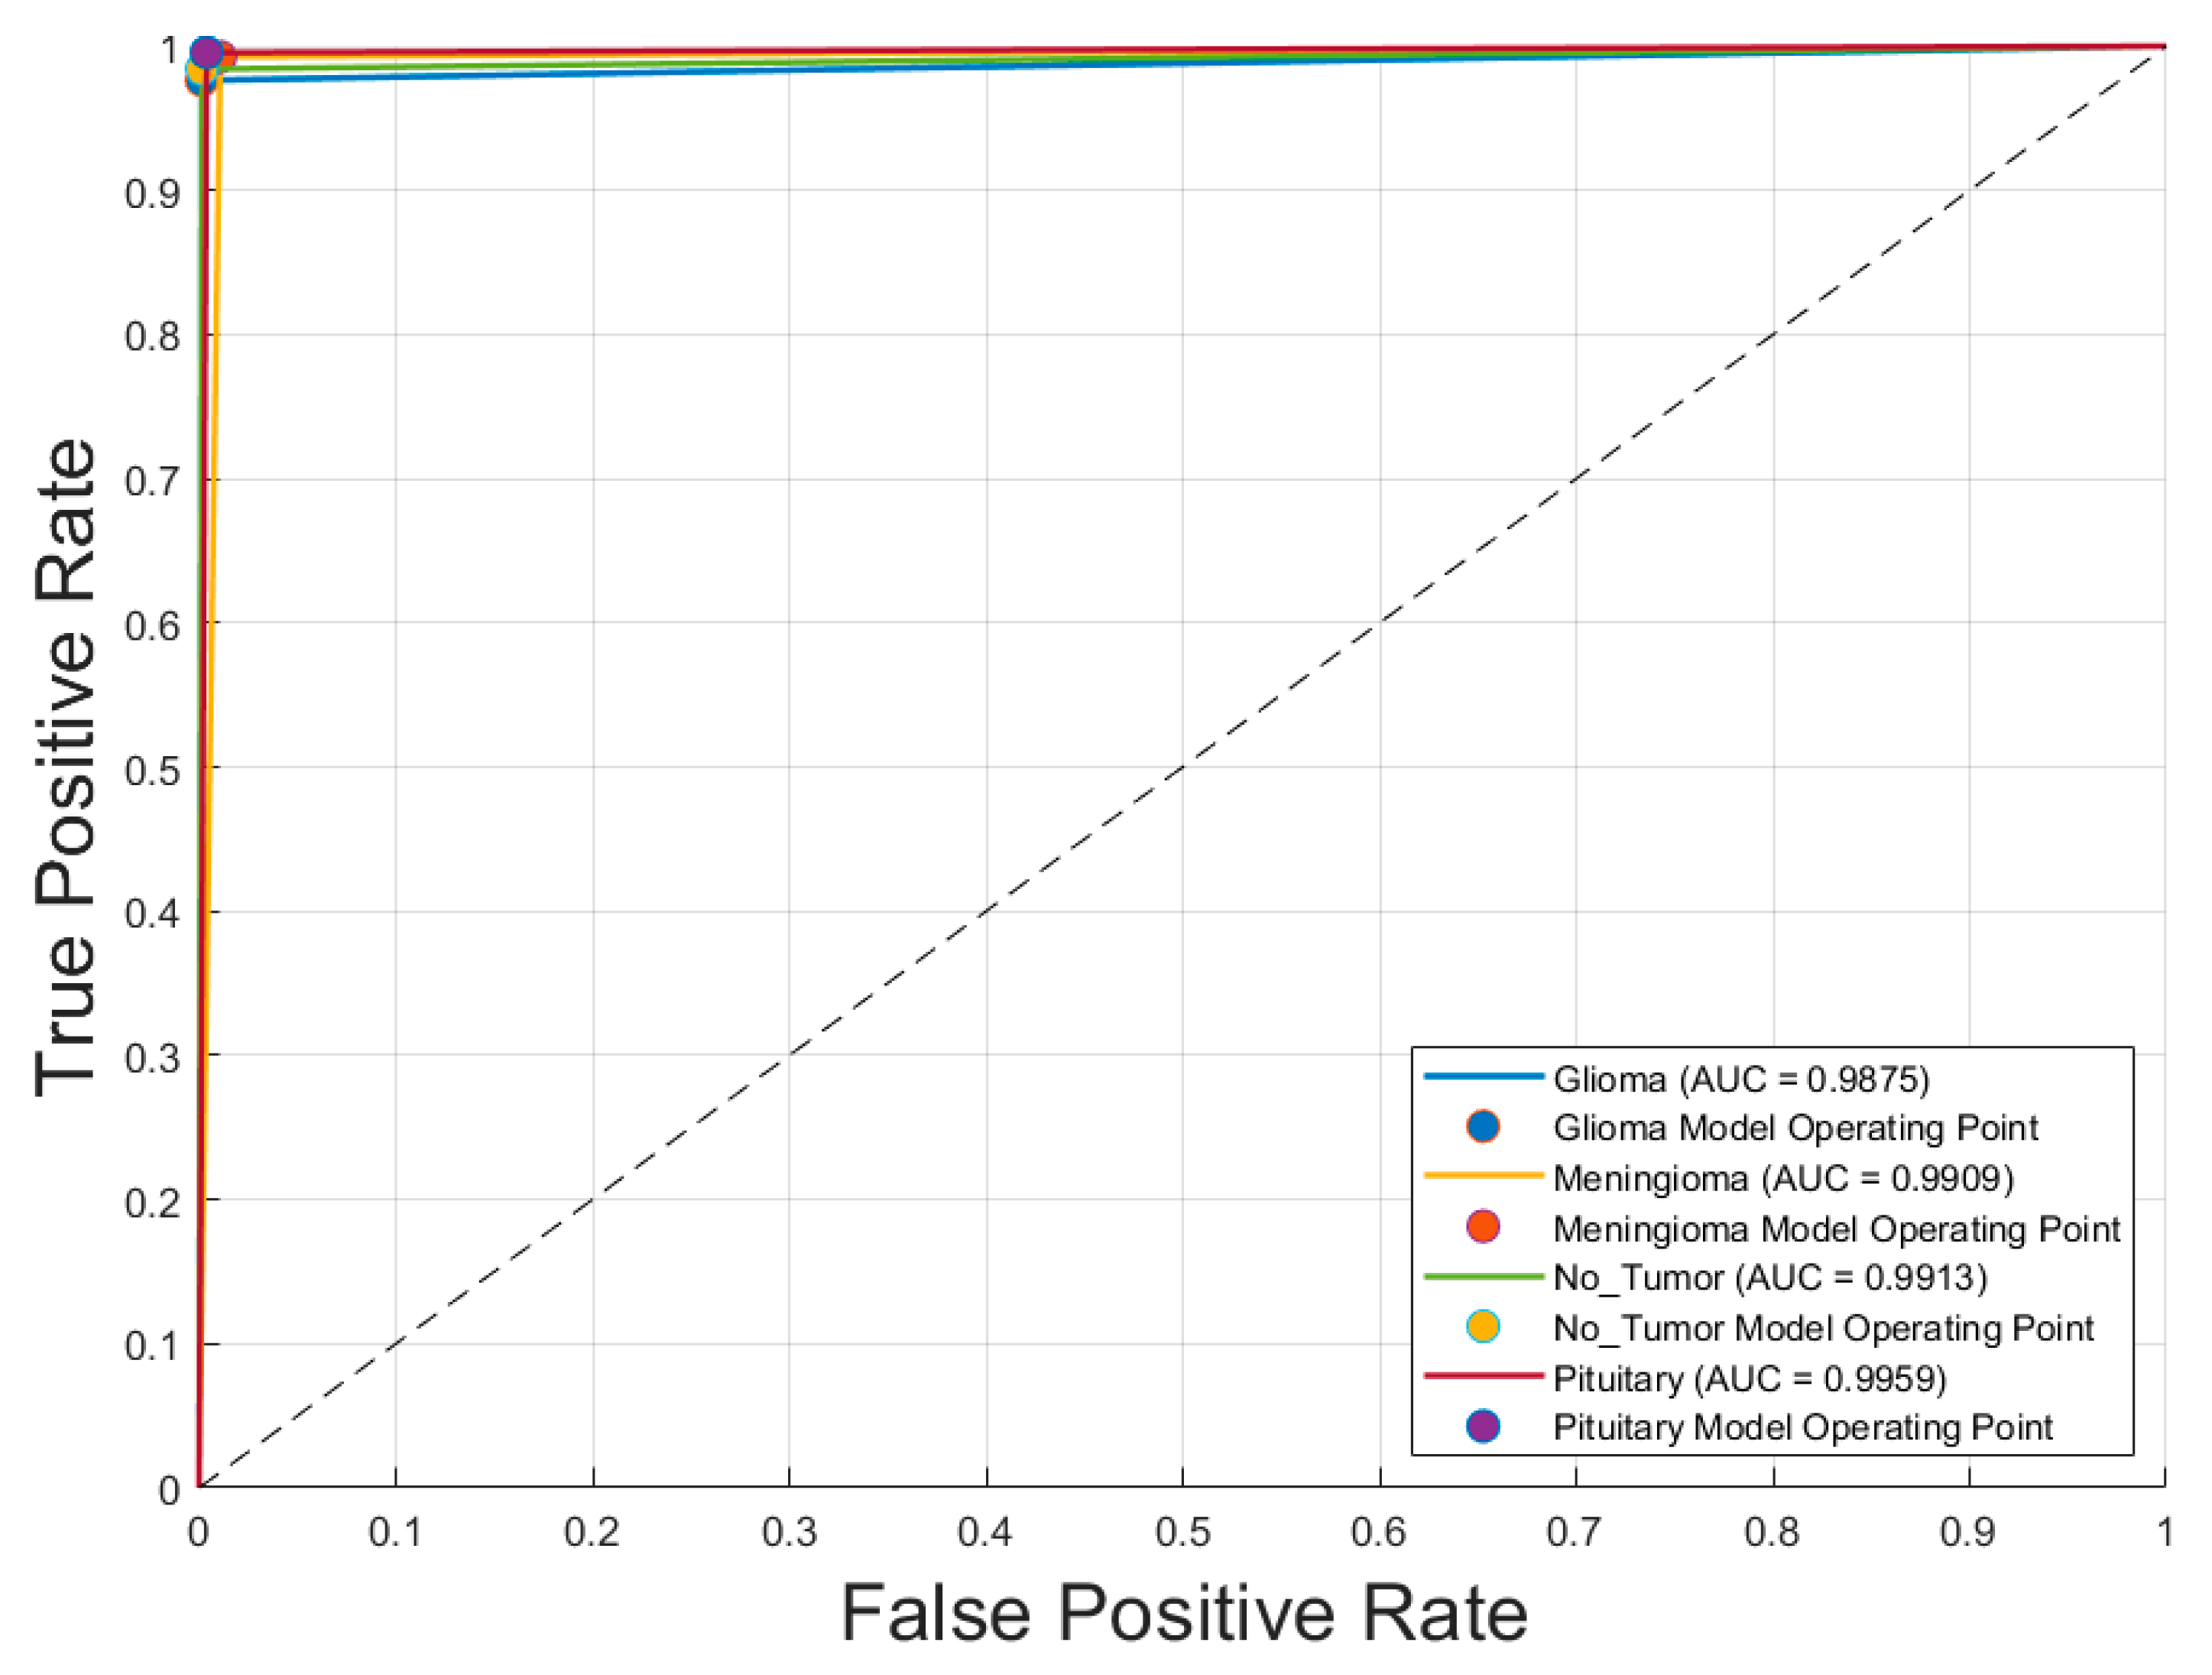
Figure 3.
Receiver operating characteristic (ROC) curves for each brain tumor class using the optimal CNN model (Inception-v3 with SGDM optimizer).
Figure 3.
Receiver operating characteristic (ROC) curves for each brain tumor class using the optimal CNN model (Inception-v3 with SGDM optimizer).
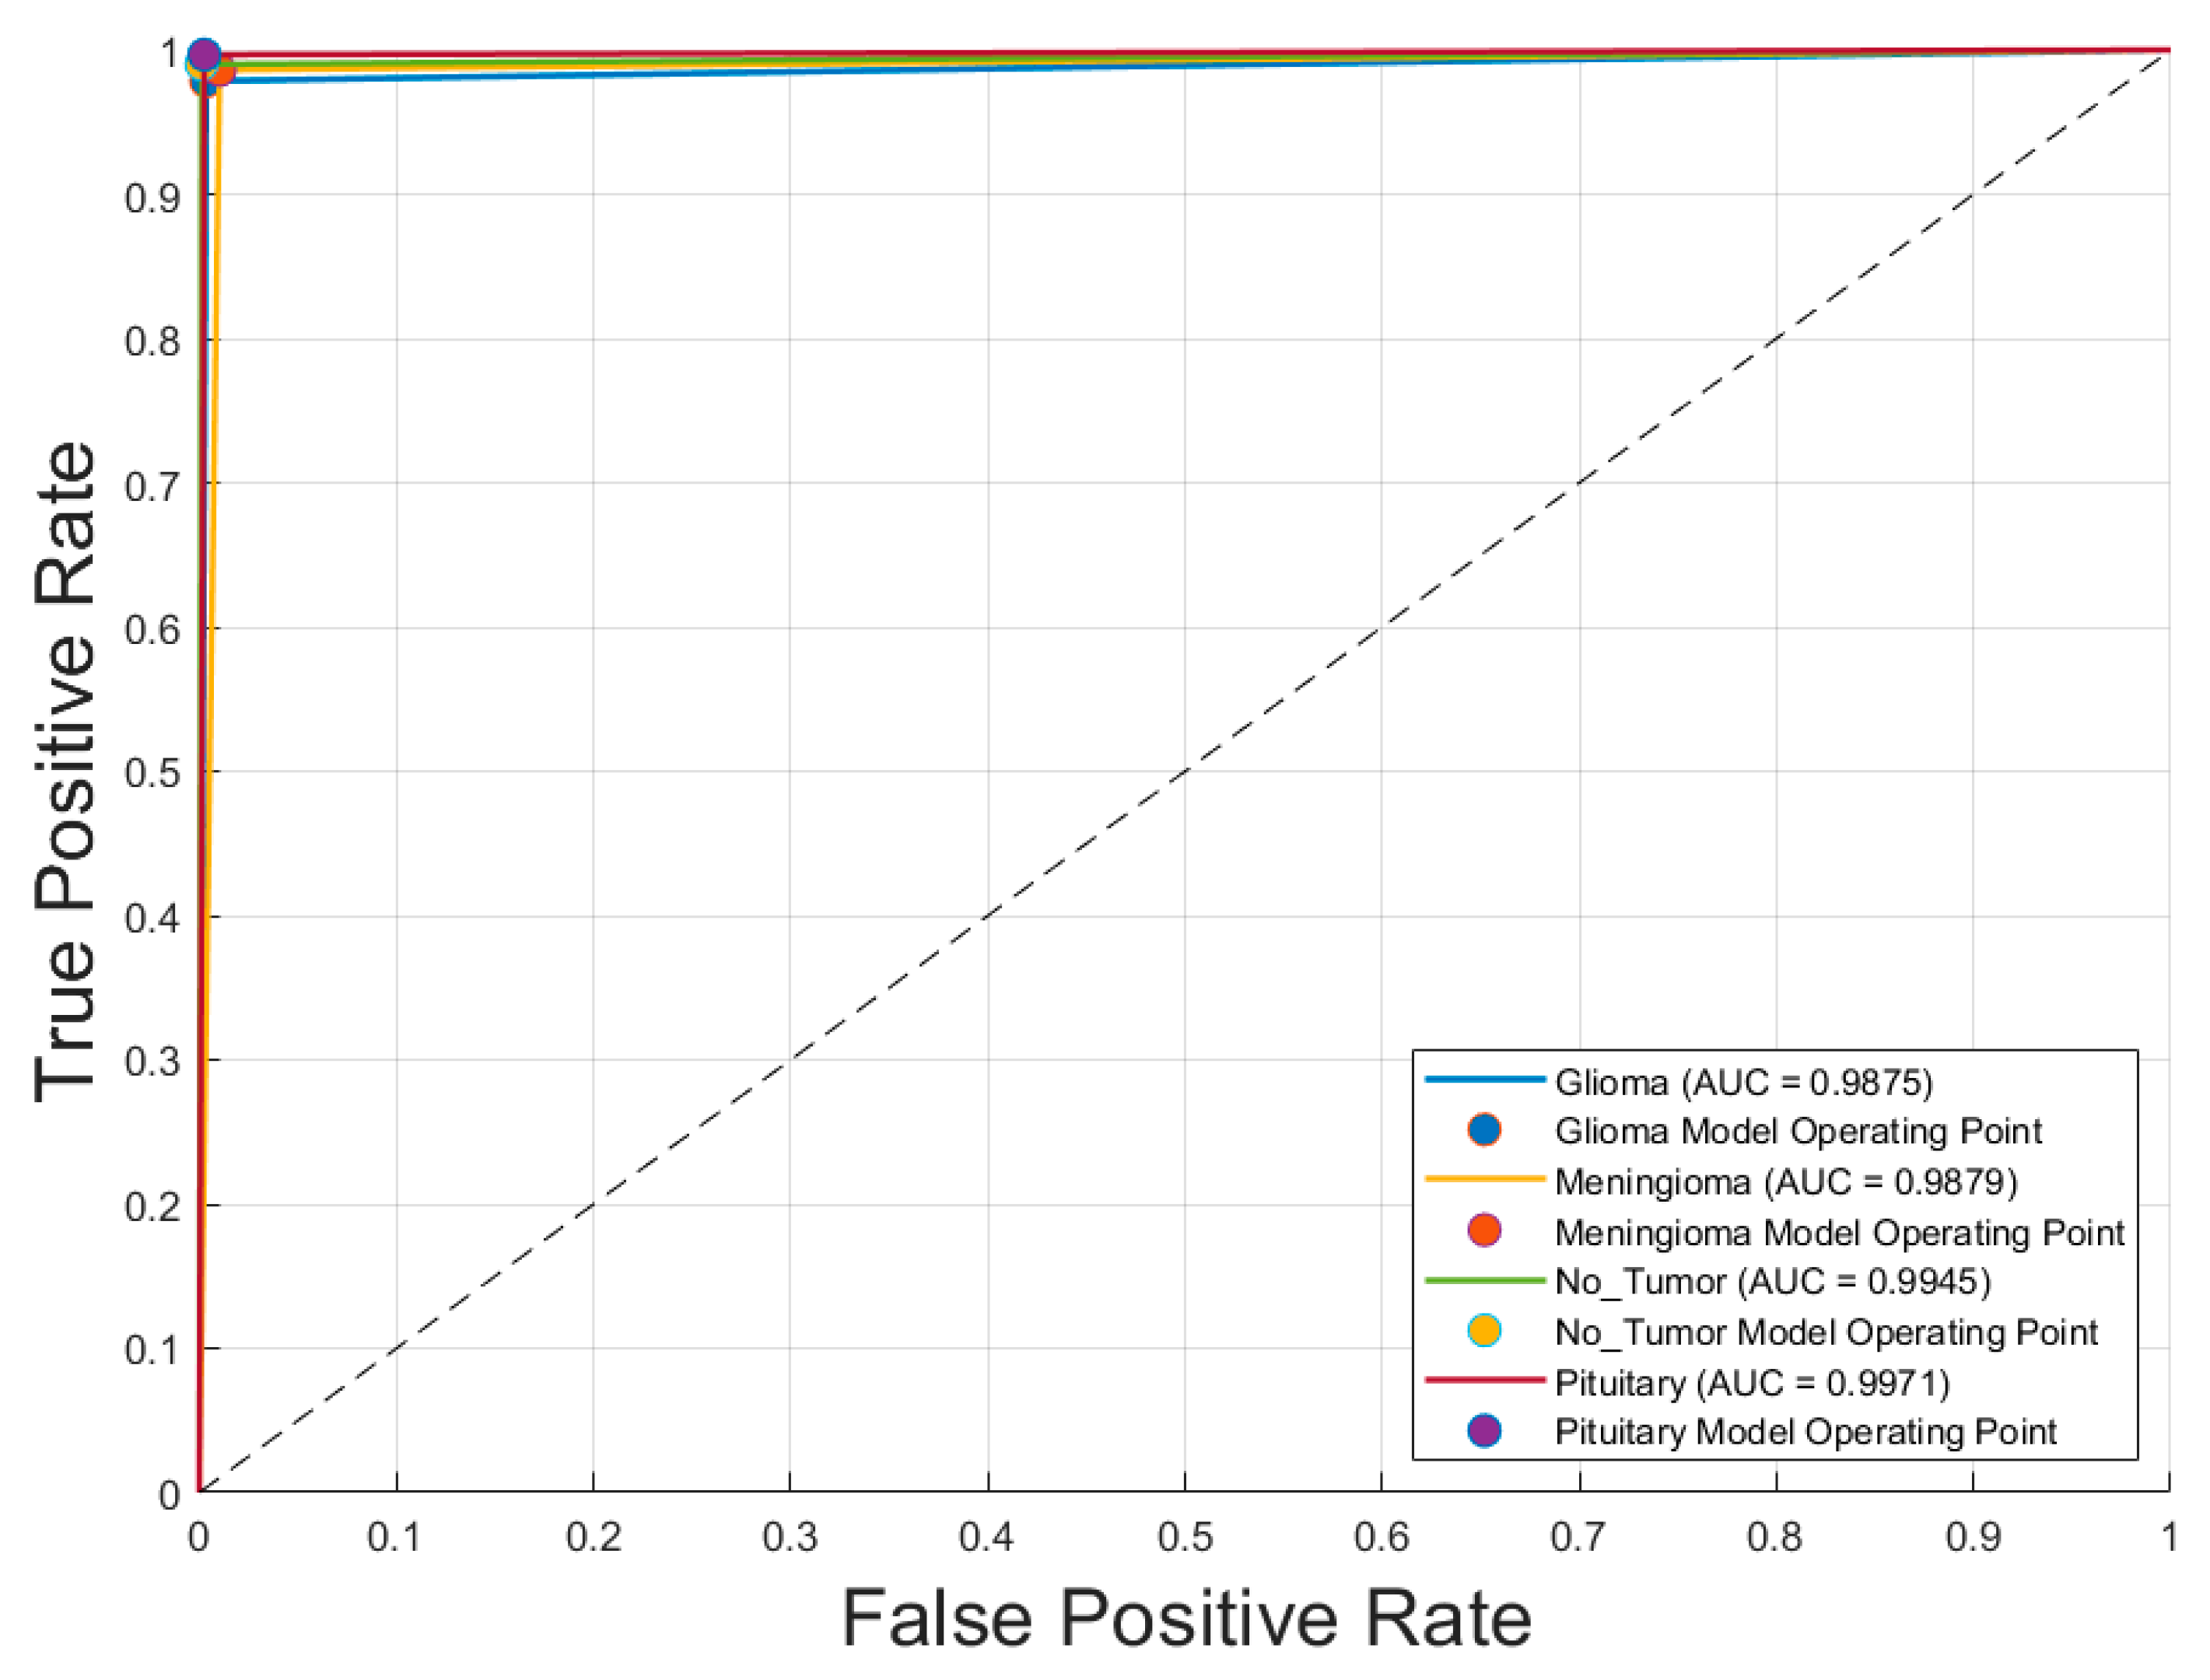
Figure 4.
Receiver operating characteristic (ROC) curves for each brain tumor class using the Voting Schema.
Figure 4.
Receiver operating characteristic (ROC) curves for each brain tumor class using the Voting Schema.
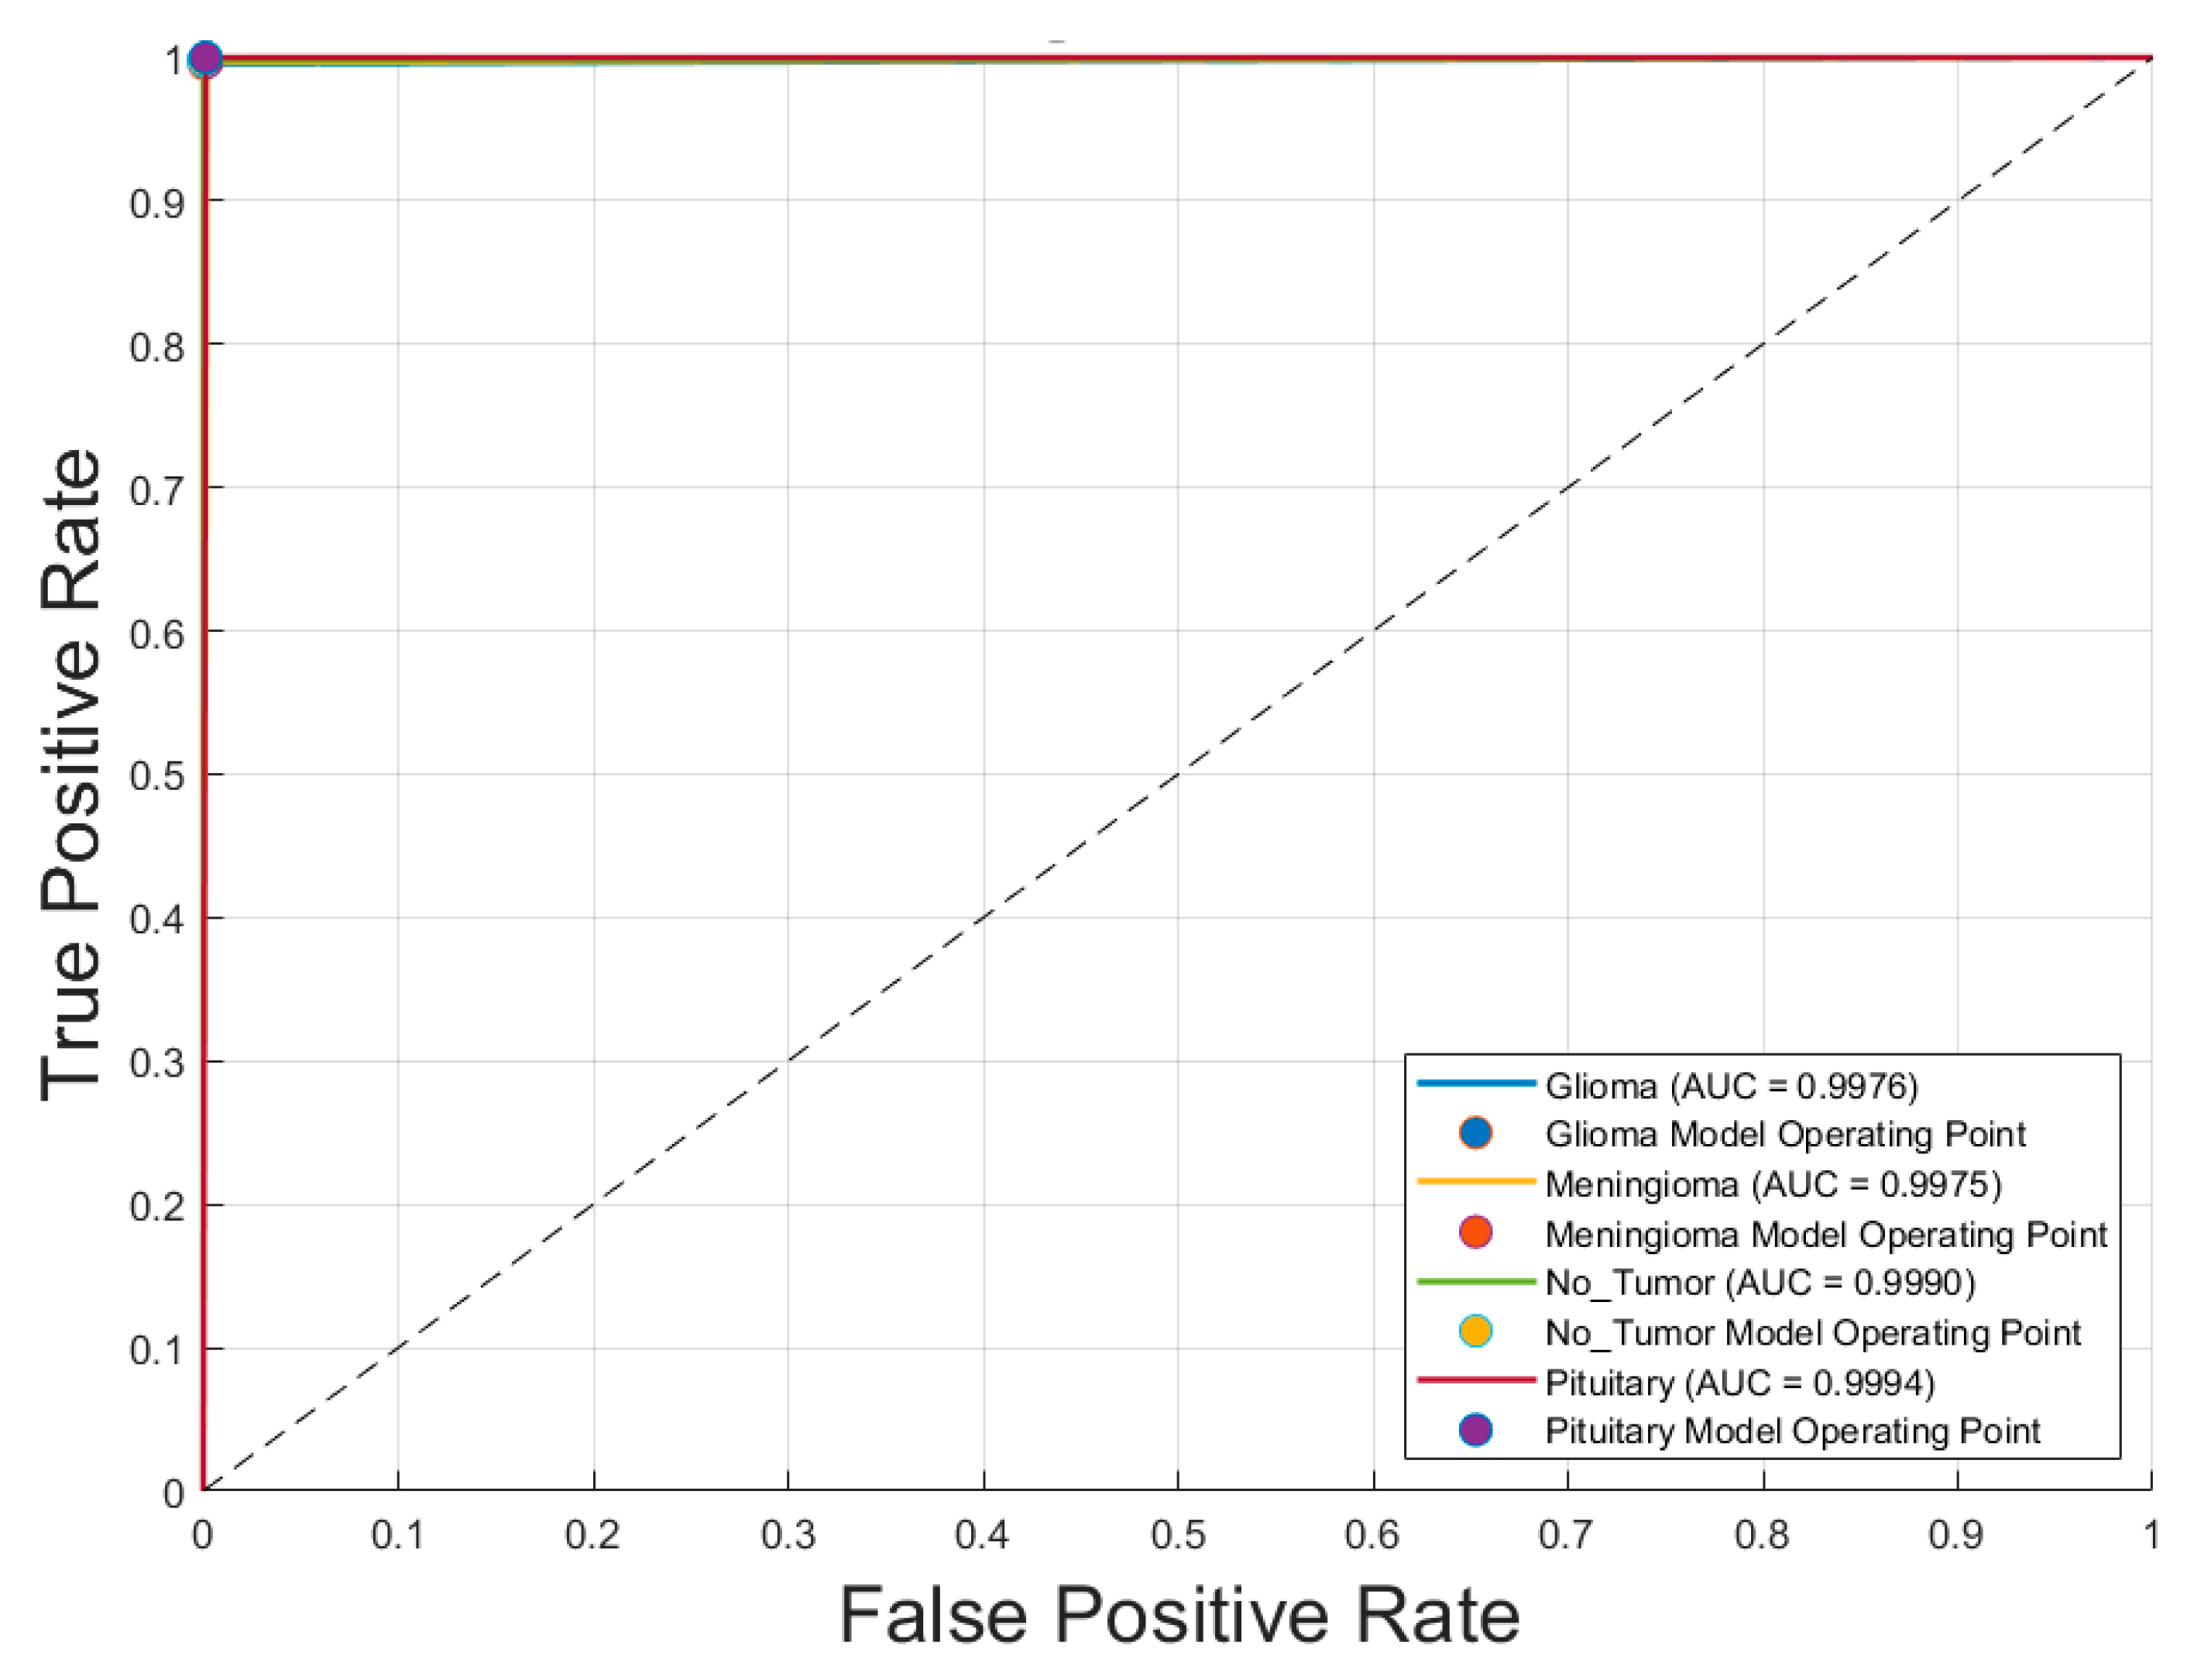

Table 1.
Overview of selected CNN architectures for MRI brain tumor classification.
| CNN | No. of Layers | Parameters (MB) | Default Input Size | Key Advantages |
|---|---|---|---|---|
| ResNet-18 [27] | 18 | 11.7 | 224 × 224 | Lightweight, fast training, good for small datasets |
| GoogLeNet [28] | 22 | 7.0 | 224 × 224 | Inception modules for multi-scale feature extraction |
| EfficientNet-b0 [29] | 290 | 5.3 | 224 × 224 | Parameter-efficient, high accuracy with fewer resources |
| MobileNet-v2 [30] | 154 | 3.5 | 224 × 224 | Optimized for speed and mobile deployment |
| Inception-v3 [31] | 315 | 23.9 | 299 × 299 | High accuracy with reduced computation |
| ResNet-50 [27] | 177 | 25.6 | 224 × 224 | Deeper network with residual connections for feature reuse |
| ResNet-101 [27] | 347 | 44.6 | 224 × 224 | Strong performance on complex tasks due to depth |
Table 2.
Classification performance of CNN models using SGDM and ADAM optimizers on the brain tumor testing dataset.
Table 2.
Classification performance of CNN models using SGDM and ADAM optimizers on the brain tumor testing dataset.
| CNN | Optimizer | TP1 | TP2 | TP3 | TP4 | Pre1 | Pre2 | Pre3 | Pre4 | Accuracy | Kappa |
|---|---|---|---|---|---|---|---|---|---|---|---|
| ResNet-18 | SGDM | 0.986 | 0.964 | 0.970 | 0.976 | 0.960 | 0.966 | 0.980 | 0.995 | 0.974 | 0.965 |
| ResNet-18 | ADAM | 0.983 | 0.983 | 0.982 | 0.988 | 0.980 | 0.981 | 0.980 | 0.995 | 0.984 | 0.978 |
| GoogLeNet | SGDM | 0.997 | 0.974 | 0.992 | 0.990 | 0.976 | 0.993 | 0.984 | 0.996 | 0.987 | 0.983 |
| GoogLeNet | ADAM | 0.953 | 0.974 | 0.972 | 0.986 | 0.980 | 0.971 | 0.912 | 0.995 | 0.971 | 0.960 |
| EfficientNet-b0 | SGDM | 0.900 | 0.898 | 0.933 | 0.917 | 0.897 | 0.868 | 0.918 | 0.960 | 0.910 | 0.877 |
| EfficientNet-b0 | ADAM | 0.959 | 0.951 | 0.984 | 0.967 | 0.949 | 0.940 | 0.970 | 0.996 | 0.963 | 0.949 |
| MobileNet-v2 | SGDM | 0.910 | 0.905 | 0.924 | 0.925 | 0.905 | 0.859 | 0.920 | 0.981 | 0.915 | 0.885 |
| MobileNet-v2 | ADAM | 0.965 | 0.967 | 0.963 | 0.954 | 0.950 | 0.935 | 0.978 | 0.993 | 0.962 | 0.949 |
| Inception-v3 | SGDM | 0.967 | 0.931 | 0.926 | 0.962 | 0.934 | 0.923 | 0.950 | 0.990 | 0.949 | 0.931 |
| Inception-v3 | ADAM | 0.991 | 0.975 | 0.994 | 0.993 | 0.978 | 0.986 | 0.990 | 0.997 | 0.987 | 0.983 |
| ResNet-50 | SGDM | 0.939 | 0.893 | 0.929 | 0.888 | 0.887 | 0.851 | 0.912 | 0.991 | 0.909 | 0.877 |
| ResNet-50 | ADAM | 0.987 | 0.969 | 0.974 | 0.983 | 0.977 | 0.968 | 0.986 | 0.988 | 0.979 | 0.971 |
| ResNet-101 | SGDM | 0.932 | 0.897 | 0.877 | 0.897 | 0.879 | 0.818 | 0.954 | 0.988 | 0.903 | 0.869 |
| ResNet-101 | ADAM | 0.983 | 0.966 | 0.974 | 0.985 | 0.959 | 0.969 | 0.990 | 0.998 | 0.977 | 0.969 |
| Voting | 0.996 | 0.997 | 0.998 | 1.000 | 0.999 | 0.996 | 1.000 | 0.997 | 0.998 | 0.997 |
Table 3.
Confusion matrix, class-wise true positive rate (TP), false positive rate (FP), and precision for the optimal CNN model (GoogLeNet with SGDM optimizer) on the entire dataset.
Table 3.
Confusion matrix, class-wise true positive rate (TP), false positive rate (FP), and precision for the optimal CNN model (GoogLeNet with SGDM optimizer) on the entire dataset.
| Class | Glioma | Meningioma | No Tumor | Pituitary | TP | FP |
|---|---|---|---|---|---|---|
| Glioma | 904 | 18 | 3 | 1 | 0.976 | 0.024 |
| Meningioma | 2 | 927 | 0 | 5 | 0.993 | 0.007 |
| No Tumor | 1 | 4 | 492 | 3 | 0.984 | 0.016 |
| Pituitary | 0 | 3 | 1 | 897 | 0.996 | 0.004 |
| Precision | 0.953 | 0.974 | 0.972 | 0.986 | Accuracy | 0.987 |
| FP | 0.047 | 0.026 | 0.028 | 0.014 | Kappa | 0.983 |
Table 4.
Confusion matrix, class-wise true positive rate (TP), false positive rate (FP), and precision for the optimal CNN model (Inception-v3 with ADAM optimizer) on the entire dataset.
Table 4.
Confusion matrix, class-wise true positive rate (TP), false positive rate (FP), and precision for the optimal CNN model (Inception-v3 with ADAM optimizer) on the entire dataset.
| CNN | Glioma | Meningioma | No Tumor | Pituitary | TP | FP |
|---|---|---|---|---|---|---|
| Glioma | 906 | 19 | 1 | 0 | 0.978 | 0.022 |
| Meningioma | 6 | 921 | 2 | 5 | 0.986 | 0.014 |
| No Tumor | 1 | 3 | 495 | 1 | 0.990 | 0.010 |
| Pituitary | 1 | 2 | 0 | 898 | 0.997 | 0.003 |
| Precision | 0.953 | 0.974 | 0.0972 | 0.986 | Accuracy | 0.987 |
| FP | 0.047 | 0.026 | 0.028 | 0.014 | Kappa | 0.983 |
Table 5.
Confusion matrix, class-wise true positive rate (TP), false positive rate (FP), and precision for the Voting Schema on the entire dataset.
Table 5.
Confusion matrix, class-wise true positive rate (TP), false positive rate (FP), and precision for the Voting Schema on the entire dataset.
| CNN | Glioma | Meningioma | No Tumor | Pituitary | TP | FP |
|---|---|---|---|---|---|---|
| Glioma | 922 | 4 | 0 | 0 | 0.996 | 0.004 |
| Meningioma | 0 | 931 | 0 | 3 | 0.997 | 0.003 |
| No Tumor | 1 | 0 | 499 | 0 | 0.998 | 0.002 |
| Pituitary | 0 | 0 | 0 | 901 | 1.000 | 0.000 |
| Precision | 0.953 | 0.974 | 0.0972 | 0.986 | Accuracy | 0.998 |
| FP | 0.047 | 0.026 | 0.028 | 0.014 | Kappa | 0.997 |
Table 6.
Comparison of CNN-Based brain tumor classification studies in MRI imaging.
| Authors | Year | Method | Task | Classes | Accuracy |
|---|---|---|---|---|---|
| Ait Amou et al. [1] | 2022 | CNN + Bayesian Optimization | Classification | 3 | 98.70% |
| Deepa et al. [2] | 2023 | Hybrid Optimization + DRN | Segmentation & Classification | 3 | 92.10% |
| AlTahhan et al. [3] | 2023 | Hybrid AlexNet-KNN | Classification | 4 | 98.60% |
| Gupta et al. [4] | 2024 | Custom CNN | Classification | 2 | 94.00% |
| Albalawi et al. [5] | 2024 | Multi-layer CNN | Classification | 4 | 99.00% |
| Nahiduzzaman et al. [6] | 2025 | PDSCNN + RRELM | Classification | 4 | 99.20% |
| Hassan & Ghadiri [7] | 2025 | EfficientNetV2 | Classification | 3 | 99.16% |
| Iqbal et al. [8] | 2024 | FusionNet (Statistical + CNN) | Classification | 2 | 97.53% |
| El Amoury et al. [9] | 2025 | PSO-Optimized CNN | Classification | 4 | 99.20% |
| Kusuma & Reddy [10] | 2025 | SegNet + Bi-LSTM | Segmentation & Classification | 4 | 98.00% |
| Huang et al. [11] | 2025 | ResNet50V2 + SE Blocks | Classification | 4 | 98.40% |
| Jarria & Wesley [12] | 2025 | Fruit Bee Optimized CNN | Classification | 3 | 92.60% |
| da Costa Nascimento et al. [13] | 2025 | YOLO + LLM | Detection & Classification | 2 | 98.00% |
| Chandraprabha et al. [14] | 2025 | ViT + CNN | Classification | 4 | 99.64% |
| Disci et al. [15] | 2025 | Transfer Learning (Xception, etc.) | Classification | 4 | 98.73% |
| Afzal et al. [16] | 2025 | ResNet18 + CART-ANOVA | Classification | 4 | 98.05% |
| Elhadidy et al. [17] | 2025 | Swin Transformer + EfficientNet | Classification | 4 | 98.72% |
| Ali et al. [18] | 2025 | Classic CNN + ResNet50 | Classification | 3 | 99.88% |
| Abirami et al. [21] | 2025 | AKO-Shepard CNN | Classification & Detection | 3 | 93.60% |
| Aurna et al. [23] | 2022 | Two-Stage Ensemble CNN | Classification | 4 | 99.13% |
| Alsubai et al. [24] | 2022 | CNN-LSTM | Classification | 3 | 99.10% |
| Al-Azzwi & Nazarov [25] | 2023 | Stacked Ensemble (VGG19, etc.) | Classification | 2 | 96.60% |
| Tandel et al. [26] | 2025 | Majority Voting + XAI | Classification | 4 | 98.47% |
| This Study | 2025 | Majority Voting Ensemble | Classification | 4 | 99.80% |
Disclaimer/Publisher’s Note: The statements, opinions and data contained in all publications are solely those of the individual author(s) and contributor(s) and not of MDPI and/or the editor(s). MDPI and/or the editor(s) disclaim responsibility for any injury to people or property resulting from any ideas, methods, instructions or products referred to in the content. |
© 2025 by the authors. Licensee MDPI, Basel, Switzerland. This article is an open access article distributed under the terms and conditions of the Creative Commons Attribution (CC BY) license (http://creativecommons.org/licenses/by/4.0/).
Copyright: This open access article is published under a Creative Commons CC BY 4.0 license, which permit the free download, distribution, and reuse, provided that the author and preprint are cited in any reuse.


