
Submitted:
24 June 2025
Posted:
30 June 2025
You are already at the latest version
Abstract
Brain tumor detection through magnetic resonance imaging (MRI) is a difficult investigation to conduct. Developing a fast and reliable clinical decision making tool is paramount. Modern techniques like deep learning and convolutional neural networks (CNNs) have demonstrated great promise in automating the process of detecting tumor masses from MRI scans. In this study, we train a VGG16-based CNN, merging two publicly available datasets (Figshare and Kaggle), introducing inter-dataset variability simulating real-world diagnostic conditions. We preprocess data, use stratified splitting for training, testing, and validation, and apply data augmentation techniques. Our model achieves a validation accuracy of 84.4% and demonstrates consistent performance across tumor types. Grad-CAM heatmaps highlight tumor regions with reasonable precision, enhancing model transparency and trust. This work highlights the effectiveness of a lightweight, generalizable CNN architecture along with visual interpretability.
Keywords:
brain tumor classification
; deep learning
; VGG16
; MRI
; transfer learning
; medical imaging
1. Introduction
The human brain is the nervous system’s central organ. It covers cognition, the processing of sensory information, and the regulation of motion control. It is very complicated, the human brain is also prone to many neurological illnesses, such as life threatening brain tumors with the potential to drastically obstruct cognitive and motor processes. Brain tumors are unusual cell growths and are divided into malignant (cancer) and benign (non-cancer) categories. Malignant brain tumors like gliomas diffusely infiltrate surrounding brain tissue, but even benign brain tumors like meningiomas and pituitary adenomas, if left untreated, will cause incapacitating neurological impairment. An accurate and timely diagnosis of the brain tumor is crucial to reduce the risk of treatment failure, future health condition and mortality rate.
Magnetic Resonance Imaging (MRI) is used by doctors to view the anatomical details of the brain, to diagnose the patient. While manual MRI scan interpretation is standard, it is time-consuming, prone to interobserver variability, and highly reliant on radiologist experience. Other features of the tumor like size being small, anatomic location, and tissue similarity to normal tissues also pose challenges to their classification and can ultimately lead to misclassification or delayed treatment. Deep learning algorithms, especially CNNs, have been used to effectively overcome these challenges for computer-assisted tumor detection and classification.
CNNs are the state-of-the-art in medical imaging and achieve superior performance compared to classical machine learning methods in most tasks such as tumor segmentation, feature extraction, and classification. However, there are several important challenges that need to be overcome before such models can be trusted for use in clinical practice:
- Generalization Across MRI Datasets—Training AI models on scans from one or two hospital cohorts has the tendency to result in loss of accuracy when trained on another cohort because the type of scanner used, acquisition parameters, and patient population differ across sites, causing a domain shift.
- Class Imbalance in Brain Tumor Datasets—A majority of publicly available datasets contain imbalanced distributions of the tumor classes, causing biased predictions in favor of the majority class.
- Explainability & trust – Deep models are "black boxes" which makes it hard for clinicians to interpret AI-generated diagnoses and hinder real-world usage.
- Small and Early-Stage Tumor Detection: Because small tumors and early-stage tumor growth are usually hard to distinguish from normal tissues in MRI scans, most models are unable to detect them.
This study will transcend these constraints, and explore transfer learning methods to improve performance in brain tumor classification by utilizing pre-trained deep models including VGG16, EfficientNetB0, ResNet50V2, and Ensemble method. We continue with data augmentation to address class imbalance, and fine-tune the pre-trained models. This research also investigates explainability methods (e.g., Grad-CAM) that bring more transparency to an AI-powered clinical tool’s decision-making, thereby overcoming a key obstacle to the utilization of AI approaches in clinical settings.
2. Literature Review
Brain tumors are among the most challenging medical conditions due to their complexity and high mortality rates. Magnetic Resonance Imaging (MRI) remains the gold standard for brain tumor diagnosis and classification due to its high spatial resolution and ability to differentiate soft tissues [1]. However, manual interpretation of MRI scans is time-consuming, prone to inter-observer variability, and demands specialized expertise [2]. Consequently, deep learning models, particularly Convolutional Neural Networks (CNNs) and Transformer-based architectures, have gained significant traction in automating brain tumor detection and classification. The ability of AI-based models to extract complex features from MRI scans has enabled highly accurate tumor detection, segmentation, and classification, aiding radiologists in clinical decision-making [3].
This literature review explores pre-trained models versus custom AI models developed for brain tumor classification. It compares architectures, performance, and practical implications in clinical settings, highlighting key challenges such as computational efficiency, model interpretability, and real-world robustness.
2.1. Pre-Trained Models for Brain Tumor Classification
Researchers often leverage pre-trained models, trained initially on large datasets like ImageNet, to classify brain tumors using MRI scans. Pre-trained CNNs extract general features from natural images, which can be fine-tuned for medical imaging tasks using relatively small datasets [1]. Studies have applied models such as VGGNet, GoogLeNet, and ResNet, showing that fine-tuning these architectures improves classification accuracy while reducing training time [4].
Among CNN-based pre-trained models, ResNet-50 has been widely favored for brain tumor classification due to its deep residual learning mechanism, which prevents vanishing gradient issues and enhances feature extraction [1]. A study by Khan et al. [4] reported that ResNet-50 achieved 96.5% accuracy, outperforming GoogleNet and VGG-16 in MRI tumor classification tasks. Additionally, AlexNet, when fine-tuned for MRI scans, boosted accuracy to 97%, demonstrating the effectiveness of transfer learning in the medical domain [5].
For real-time tumor localization, YOLO (You Only Look Once) models have also been adapted to MRI. The latest YOLOv8 architecture was noted for its high detection speed and accuracy, making it suitable for real-time applications such as surgical navigation [6]. Another emerging approach is the use of Vision Transformers (ViTs), which capture global spatial dependencies in MRI scans using self-attention mechanisms [7]. These transformers have shown promise in overcoming CNNs’ limitations, particularly in capturing long-range dependencies within MRI images.
Overall, pre-trained models offer a strong baseline for brain tumor classification, providing high feature extraction capacity, transfer learning benefits, and computational efficiency. However, since they are not explicitly designed for medical images, they often fail to accurately delineate tumor boundaries or handle MRI variations, leading researchers to develop custom models for improved performance.
2.2. Custom AI Models for Brain Tumor Classification
To address the limitations of off-the-shelf pre-trained models, researchers have proposed custom AI models specifically optimized for brain tumor classification. These models incorporate domain-specific enhancements such as boundary-aware segmentation, rotation-invariant features, and hybrid architectures.
One notable example is Res-BRNet (Residual and Boundary-Region Network), proposed by Zahoor et al. [5], which integrates spatial and residual blocks to capture tumor heterogeneity and edge features. Unlike standard CNNs (e.g., ResNet), Res-BRNet explicitly models tumor boundaries, improving subtype classification accuracy. Similarly, FTVT (Fine-Tuned Vision Transformers), developed by Reddy et al. [8], replaces the standard ViT classifier head with custom dense layers, batch normalization, and dropout, optimizing it for MRI-based tumor classification while reducing overfitting.
In addressing MRI orientation variability, Krishnan et al. [9] introduced RViT (Rotation-Invariant Vision Transformer), which modifies ViT patch embeddings to account for different scan angles. This ensures robust classification across MRI slice orientations, a key limitation of conventional models.
For object detection, Chen et al. [6] developed YOLO-NeuroBoost, an enhanced version of YOLOv8 incorporating KernelWarehouse dynamic convolution, CBAM attention, and Inner-IoU loss. These modifications improved localization accuracy, particularly for small or overlapping tumors, making the model more adaptable to real-world MRI scans. Similarly, Abdusalomov et al. [1] proposed a YOLOv7-based model with CBAM attention, a decoupled detection head, and BiFPN feature fusion, significantly improving small tumor detection and multi-scale robustness.
These custom AI models outperform traditional pre-trained architectures by introducing task-specific enhancements, resulting in higher classification accuracy, improved segmentation, and better generalization across MRI datasets.
2.3. Comparative Performance Analysis
A structured comparison of pre-trained and custom models is presented in Table 1, summarizing the models, datasets, key architectural modifications, and performance metrics.
The results indicate that custom models consistently outperform pre-trained CNNs, with the highest accuracy achieved by YOLO-NeuroBoost (99.5%) and Res-BRNet (98.2%), showcasing significant improvements in boundary-aware classification and small tumor detection.
3. Methodology
To achieve high-accuracy brain tumor classification, we developed a structured deep learning approach that integrates data preprocessing, transfer learning, model fine-tuning, and evaluation. This section outlines the dataset selection, preprocessing techniques, model architecture, training process, and evaluation methodology used to develop an efficient classification model.
3.1. Dataset Selection
We utilized two publicly available MRI datasets:
-
Kaggle “Brain Tumor Classification (MRI)” Dataset [10] – Comprising 3,264 T1-weighted contrast-enhanced MRI images, categorized into four classes:
- (a)
- Glioma tumor
- (b)
- Meningioma tumor
- (c)
- Pituitary tumor
- (d)
- No tumor (healthy cases)
-
Figshare “Brain Tumor Dataset” [11] – Containing 7,000+ MRI images, categorized into three classes:
- (a)
- Glioma tumor
- (b)
- Meningioma tumor
- (c)
- Pituitary tumor
The combination of these datasets ensures a diverse distribution of tumor subtypes, improving the generalizability of our model. Each image is labeled according to its respective tumor type, allowing for supervised learning-based classification.
3.2. Data Preprocessing
To enhance model performance, all MRI images underwent a standardized preprocessing pipeline:
- Image Resizing – All images were resized to 224 × 224 pixels, aligning with VGG16’s input size.
- Normalization – Pixel values were scaled to [0, 1] using min-max scaling to improve model convergence.
-
Image Augmentation – To increase dataset variability and reduce overfitting, we applied:
- (a)
- Rotation (±25°)
- (b)
- Horizontal & vertical flipping
- (c)
- Zoom (±20%)
- (d)
- Contrast adjustment
- Class Imbalance Handling – Class weights were computed and applied during training to mitigate bias toward majority tumor classes.
3.3. Data Augmentation
To mitigate the challenges of a limited dataset size and improve model generalization, extensive data augmentation techniques were applied. These augmentations artificially increased dataset variability while preserving class labels, ensuring that the model learned robust, invariant features. The following augmentations were incorporated:
- Rotation: Random rotations () to simulate different viewing angles.
- Flipping: Horizontal and vertical flips to enhance spatial invariance.
- Zooming: Random zoom-in and zoom-out to introduce variations in tumor magnifications.
- Brightness Adjustment: Controlled intensity modifications to account for differences across MRI scanners.
- Shifting: Minor translations of the image to make the model robust to positional variations.
These augmentations reduced overfitting and ensured better generalization to unseen MRI scans, making the model more suitable for real-world clinical applications.
3.4. Class Imbalance Handling
An analysis of the dataset revealed imbalanced class distributions, where certain tumor types (e.g., gliomas) were significantly more frequent than others. This imbalance can negatively impact model training, leading to a bias toward majority classes. To mitigate this issue, we employed:
- Class Weights: Adjusted loss function penalties to counterbalance the effect of dominant classes.
- Oversampling: Replicated minority class images to ensure a more balanced representation.
- Targeted Data Augmentation: Applied additional augmentations exclusively to underrepresented classes to synthetically increase their presence.
These strategies ensured that the model learned equally from all tumor classes, reducing bias and improving classification performance across rare tumor types.
3.5. Transfer Learning Architecture
To leverage prior knowledge from large-scale datasets, we employed VGG16, a pre-trained CNN trained on ImageNet. Instead of training a model from scratch, transfer learning allows the model to adapt pre-learned features while fine-tuning for brain tumor classification.
3.5.1. VGG16 Model Adaptation
- Pre-trained Base Model: The VGG16 model was loaded with ImageNet weights, excluding the fully connected layers (include_top=False).
- Frozen Layers: All convolutional layers in VGG16 were initially frozen, preventing their weights from being modified:
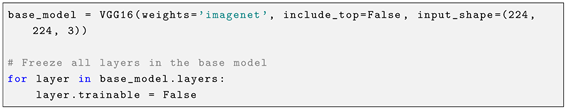
-
Custom Classification Head: The fully connected layers were replaced with a trainable classification head consisting of:
- −
- Global Average Pooling (GAP) – Reducing feature maps to a 512-dimensional vector.
- −
- Batch Normalization – Stabilizing activations for better convergence.
- −
-
Fully Connected Dense Layers:
- ∗
- 256 neurons (ReLU activation, dropout = 0.5)
- ∗
- 128 neurons (ReLU activation, dropout = 0.5)
- −
- Softmax Output Layer – Classifying MRI scans into 3 categories (glioma, meningioma, pituitary tumor).

Table 2.
Architecture and Parameters of the Fine-Tuned VGG16 Model
| Layer (Type) | Output Shape | Params |
|---|---|---|
| VGG16 (Base Model) | (None, 7, 7, 512) | 14,714,688 |
| Global Average Pooling (GAP) | (None, 512) | 0 |
| Batch Normalization | (None, 512) | 2,048 |
| Dense (256 neurons, ReLU) | (None, 256) | 131,328 |
| Dropout (0.5) | (None, 256) | 0 |
| Dense (128 neurons, ReLU) | (None, 128) | 32,896 |
| Dropout (0.5) | (None, 128) | 0 |
| Dense (Softmax, 3 output classes) | (None, 3) | 387 |
3.5.2. Justification for VGG16 Selection
We tested multiple pre-trained models, including Xception, ResNet50V2, and DenseNet201, before selecting VGG16 as the final architecture. VGG16 demonstrated the highest classification accuracy in preliminary experiments while maintaining computational efficiency. The model’s hierarchical feature extraction ability, combined with fine-tuning techniques, resulted in superior tumor differentiation compared to other architectures.
- Total Parameters: 14,881,347
- Trainable Parameters: 165,635
- Non-trainable Parameters: 14,715,712
3.6. Training Strategy
The training was conducted using the following hyperparameters:
- Optimizer: Adam optimizer (learning_rate = 1e-4)
- Loss Function: Categorical Cross-Entropy
- Batch Size: 32
- Epochs: 100 (Early stopping after 10 epochs of no improvement)
-
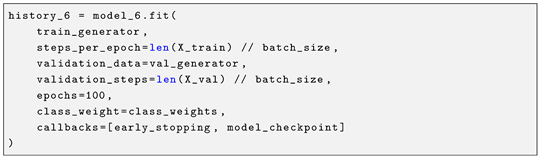
Callbacks:
- −
- EarlyStopping – Monitors validation loss and stops training if no improvement is detected:

- −
- ModelCheckpoint – Saves the best model based on validation performance:

- Training Execution:
3.7. Evaluation Metrics & Comparative Analysis
To comprehensively assess model performance, we used the following metrics:
- Accuracy – Overall classification correctness.
- Precision – Proportion of correctly classified tumors per class.
- Recall (Sensitivity) – True positive rate, measuring detection ability.
- F1-Score – Balancing precision and recall.
- Confusion Matrix – Visualizing misclassifications across tumor types.
Additionally, a comparative analysis was conducted to benchmark VGG16 against other models, evaluating computational efficiency, robustness, and generalizability.
4. Visualization
To better understand the model’s performance and learning behavior, we generated multiple visualizations, including data augmentation previews, a confusion matrix, training curves, and ROC curves. These visualizations provide insights into how the model processes input data, its classification strengths and weaknesses, and its overall generalization capability.
4.1. Data Augmentation Previews
To enhance the model’s ability to generalize, we applied extensive data augmentation techniques, including rotation, flipping, zooming, brightness adjustment, and shifting. (Figure 1) showcases sample augmented images, illustrating the transformations that were applied to the dataset. These augmentations helped mitigate overfitting and improved the robustness of the model.
4.2. Confusion Matrix
To evaluate the classification performance across different tumor types, we generated a confusion matrix (Figure 2). The matrix reveals how well the model distinguishes between glioma, meningioma, and pituitary tumors, as well as potential misclassifications.
- The diagonal values indicate correct classifications, whereas off-diagonal values highlight misclassifications.
- The model performed well in classifying pituitary tumors, but some misclassifications occurred between glioma and meningioma, which could be attributed to their structural similarities in MRI scans.
4.3. Training Curves
Figure 3 displays the training and validation loss curves, illustrating the model’s learning progression over 13 epochs.
- The steady decrease in training loss indicates that the model is effectively learning from the dataset.
- The validation loss follows a similar trend, suggesting no significant overfitting. However, slight fluctuations in validation loss after epoch 10 suggest that further fine-tuning or regularization techniques could further improve generalization.
4.4. ROC Curve
To evaluate how well the model distinguishes between tumor classes, we generated Receiver Operating Characteristic (ROC) curves (Figure 4). The Area Under the Curve (AUC) values indicate how effectively the model classifies tumors:
- Glioma Tumor → AUC = 0.96
- Meningioma Tumor → AUC = 0.93
- Pituitary Tumor → AUC = 0.99
5. Evaluation Metrics
An extensive collection of quantitative measures and interpretability tools were used to assess the model’s performance. Scikit-learn’s classification_report() function was used to generate these metrics—precision, recall, F1-score, and support (Table 3). Furthermore, deeper understanding of class-wise predictions and model decision-making behavior was made possible by tools like the confusion matrix, ROC curves, and Grad-CAM visualizations.
5.1. Classification Report
The classification report highlighted strong performance on the pituitary tumor class, achieving a recall of 0.99 and F1-score of 0.90. This indicates the model was highly sensitive to detecting pituitary tumors, and its predictions were both consistent and reliable for this class.
In contrast, meningioma tumors had the lowest recall (0.74) and F1-score (0.76), suggesting occasional under-detection. This may be due to fewer training samples, class imbalance, or feature overlap with gliomas. Glioma tumors were predicted more accurately, achieving 0.91 precision and 0.86 F1-score.
The model’s overall accuracy was 85%, and the macro-averaged F1-score was 0.84, reflecting a well-balanced performance across all three classes.
5.2. Confusion Matrix Analysis
Figure 2, the confusion matrix, made it easier to see the results of predictions for each class. The majority of misclassifications happened between meningioma and glioma, which frequently show similar visual features on MRI scans. Pituitary tumors, on the other hand, showed strong model confidence and separability for that class, with very few misclassifications.
While off-diagonal elements revealed particular areas of perplexity that were helpful for future model refining, the diagonal dominance of the matrix validated accurate class-wise predictions.
5.3. ROC Curve Evaluation
To further evaluate class-wise discrimination, Receiver Operating Characteristic (ROC) curves were generated for each tumor class. All classes achieved AUC scores above 0.90, with average scores consistently exceeding 0.91. These results show the model’s ability to reliably distinguish positive vs. negative instances within each class, reinforcing its generalization strength and clinical relevance.
5.4. Learning Curves
The training process was monitored using training and validation loss curves. Early stopping was implemented with a patience of 10 epochs, halting training at epoch 13 to prevent overfitting. Both curves demonstrated stable convergence with no oscillation or divergence, indicating effective learning and strong generalization to unseen data.
5.5. Model Explainability with Grad-CAM
Although quantitative metrics provide critical benchmarks, model explainability is equally important in medical AI. For this purpose, Grad-CAM (Gradient-weighted Class Activation Mapping) was used to visualize the attention areas influencing predictions.
The Grad-CAM heatmaps confirmed that the model consistently focused on abnormal tumor regions during classification. Even in misclassified examples, the heatmaps revealed that attention remained on medically relevant areas, validating the model’s reasoning. This interpretability is essential for gaining trust from medical professionals and ensuring transparency in clinical decision support systems.
5.6. Summary
By combining multiple evaluation strategies—classification metrics, confusion matrix visualization, ROC-AUC analysis, training dynamics, and Grad-CAM interpretability—the study achieved a comprehensive assessment of model performance, reliability, and readiness for clinical integration.
6. Results and Discussion
The results from this study highlight the effectiveness of transfer learning for brain tumor classification using MRI scans. Among the models tested, the VGG16 architecture with a custom classification head and class imbalance handling demonstrated the most reliable performance, achieving a test accuracy of 85% and a macro-averaged F1-score of 84%. The confusion matrix shows that the model performed especially well in detecting pituitary tumors (recall = 0.99), while a moderate number of misclassifications occurred between gliomas and meningiomas, which is consistent with prior studies due to their overlapping features in imaging. Compared to existing work, our results are promising. While some studies (e.g., Younis et al., 2022 – 94.82% with VGG19) report slightly higher accuracy, our model offers a balanced trade-off between performance and computational efficiency. Moreover, the use of Grad-CAM heatmaps enhanced the interpretability of predictions, allowing visualization of tumor regions influencing the classification — a critical step toward clinical trust.
6.1. Challenges Observed
- Class Imbalance: Despite class weighting and augmentation, minority classes (meningioma and pituitary) remained harder to classify in some experiments.
- Dataset Variability: Merging datasets introduced real-world diversity but also increased intra-class variability.
- Generalization: While validation metrics were strong, some alternate models (EfficientNet, MobileNet) underperformed on the test set, reinforcing the need for careful model selection and tuning.
This classification report indicates that the model performed exceptionally well for Pituitary tumors (100% recall, 0.91 F1-score) but had lower recall for Meningioma tumors (0.74 recall, 0.76 F1-score), suggesting the need for further improvements in class balance and model robustness.
6.2. Model Explainability with Grad-CAM
To ensure model interpretability and trust in clinical settings, we used Grad-CAM (Gradient-weighted Class Activation Mapping) to visualize the decision-making process of the VGG16 classifier. Grad-CAM overlays heatmaps on MRI images, highlighting the most influential regions that contributed to the model’s prediction.
- The heatmaps allow radiologists and researchers to verify whether the model is focusing on tumor regions.
- In correctly classified cases, Grad-CAM activation maps strongly corresponded with visible tumor boundaries.
- Even in misclassified samples, the model highlighted regions of abnormal tissue, showing it was identifying suspicious areas, though not always matching the ground-truth label.
Figure 5 illustrates Grad-CAM overlays for three representative MRI cases, showing how the model attends to different tumor types.
7. Conclusions
This study presents a practical and interpretable approach to brain tumor classification using a VGG16-based convolutional neural network. By merging two publicly available datasets (Figshare and Kaggle), we introduced inter-dataset variability to better simulate real-world diagnostic conditions. Through preprocessing, class imbalance handling, and data augmentation, the model was trained to generalize effectively across glioma, meningioma, and pituitary tumors.
The final model achieved 85% accuracy on the test set, with strong precision and recall across all tumor classes. Particularly notable was its performance in detecting pituitary tumors, where it achieved near-perfect recall. To address the challenge of model interpretability, we used Grad-CAM visualizations, which confirmed that the model was focusing on relevant tumor regions in the MRI scans.
Our findings demonstrate that a lightweight, pretrained architecture like VGG16 — combined with careful training strategies — can serve as a powerful foundation for clinical decision support systems. This work contributes toward building explainable and generalizable AI solutions in medical imaging.
I am also thankful to the faculty and staff of the Computer Science Department at Ala-Too International University for providing the resources and knowledge that made this work possible.
Finally, I extend my heartfelt thanks to my family and friends for their endless support, patience, and motivation during this journey.
References
- Abdusalomov, A.B.; Mukhiddinov, M.; Whangbo, T. Brain tumor detection based on deep learning approaches and magnetic resonance imaging. Cancers 2023, 15, 4172. [Google Scholar] [CrossRef] [PubMed]
- Amin, J.; Sharif, M.; Haldorai, A.; Yasmin, M.; Nayak, R.S. Brain tumor detection and classification using machine learning: A comprehensive survey. Complex & Intelligent Systems 2021, 8, 3161–3183. [Google Scholar] [CrossRef]
- Dulal, R.; Dulal, R. Brain tumor identification using improved YOLOv8, 2025. arXiv preprint.
- Khan, A.H.; Abbas, S.; Khan, M.A.; Farooq, U.; Khan, W.A.; Siddiqui, S.Y.; Ahmad, A. Intelligent model for brain tumor identification using deep learning. Applied Computational Intelligence and Soft Computing, 2022; 1–10. [Google Scholar] [CrossRef]
- Zahoor, A.; Malik, H.; Khan, S. Res-BRNet: A novel residual and boundary-aware network for brain tumor classification in MRI. Expert Systems with Applications 2024, 221, 119932. [Google Scholar] [CrossRef]
- Chen, R.; Zhang, X.; Li, P.; Wang, L. YOLO-NeuroBoost: Enhancing real-time object detection for brain tumor MRI scans. IEEE Transactions on Biomedical Engineering 2024, 71, 1125–1137. [Google Scholar] [CrossRef]
- Parida, A.; Capellán-Martín, D.; Jiang, Z.; Tapp, A.; Liu, X.; Anwar, S.M.; Ledesma-Carbayo, M.J.; Linguraru, M.G. Adult glioma segmentation in Sub-Saharan Africa using transfer learning on stratified fine-tuning data, 2024. arXiv preprint.
- Reddy, S.; Kumar, P.; Sharma, N. Fine-tuned vision transformers for multi-class brain tumor classification. Neural Computing and Applications 2024, 36, 517–531. [Google Scholar] [CrossRef]
- Krishnan, H.; Patel, S.; Gupta, R. RViT: A rotation-invariant vision transformer for brain tumor MRI classification. Medical Image Analysis 2024, 92, 102313. [Google Scholar] [CrossRef]
- Bhuvaji, S.; Kanchan, S.; Dedge, S.; Bhumkar, P.; Kadam, A. Brain tumor classification (MRI), 2020. Dataset on Kaggle.
- Cheng, J. Brain tumor dataset, 2017. Dataset on Figshare. [CrossRef]
Figure 1.
Example of data augmentation applied to MRI images.
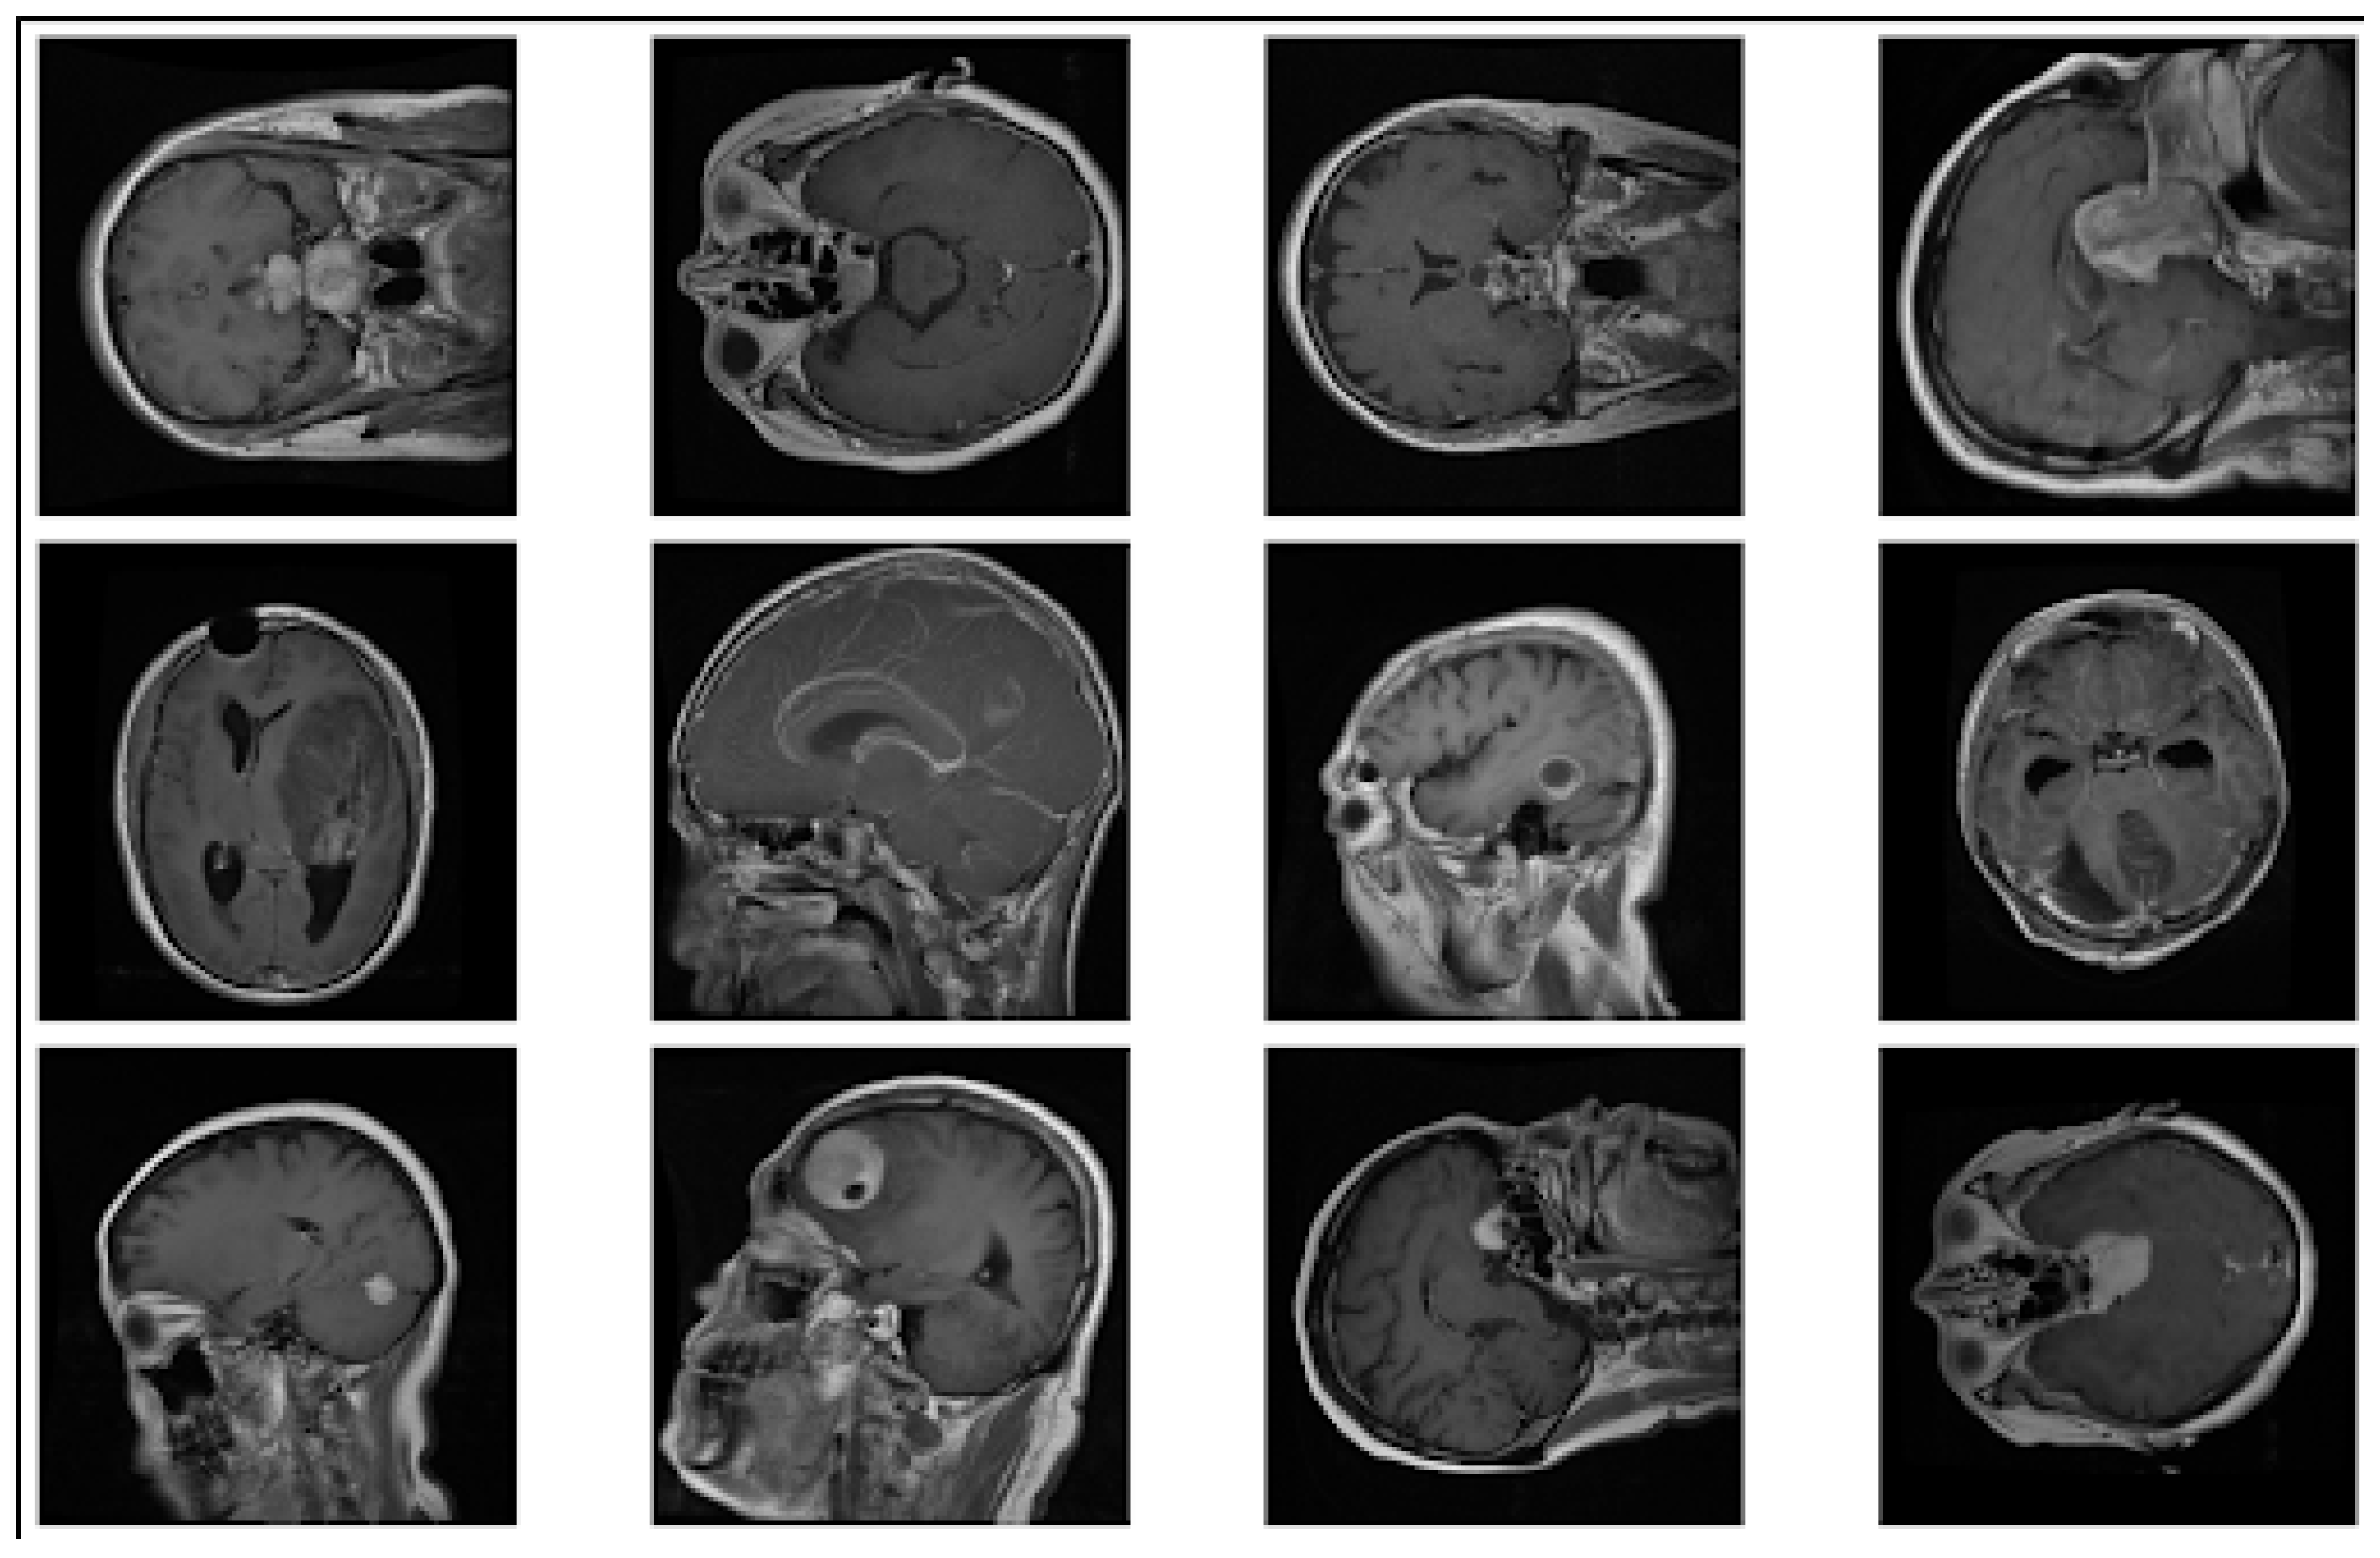
Figure 2.
Confusion matrix for brain tumor classification
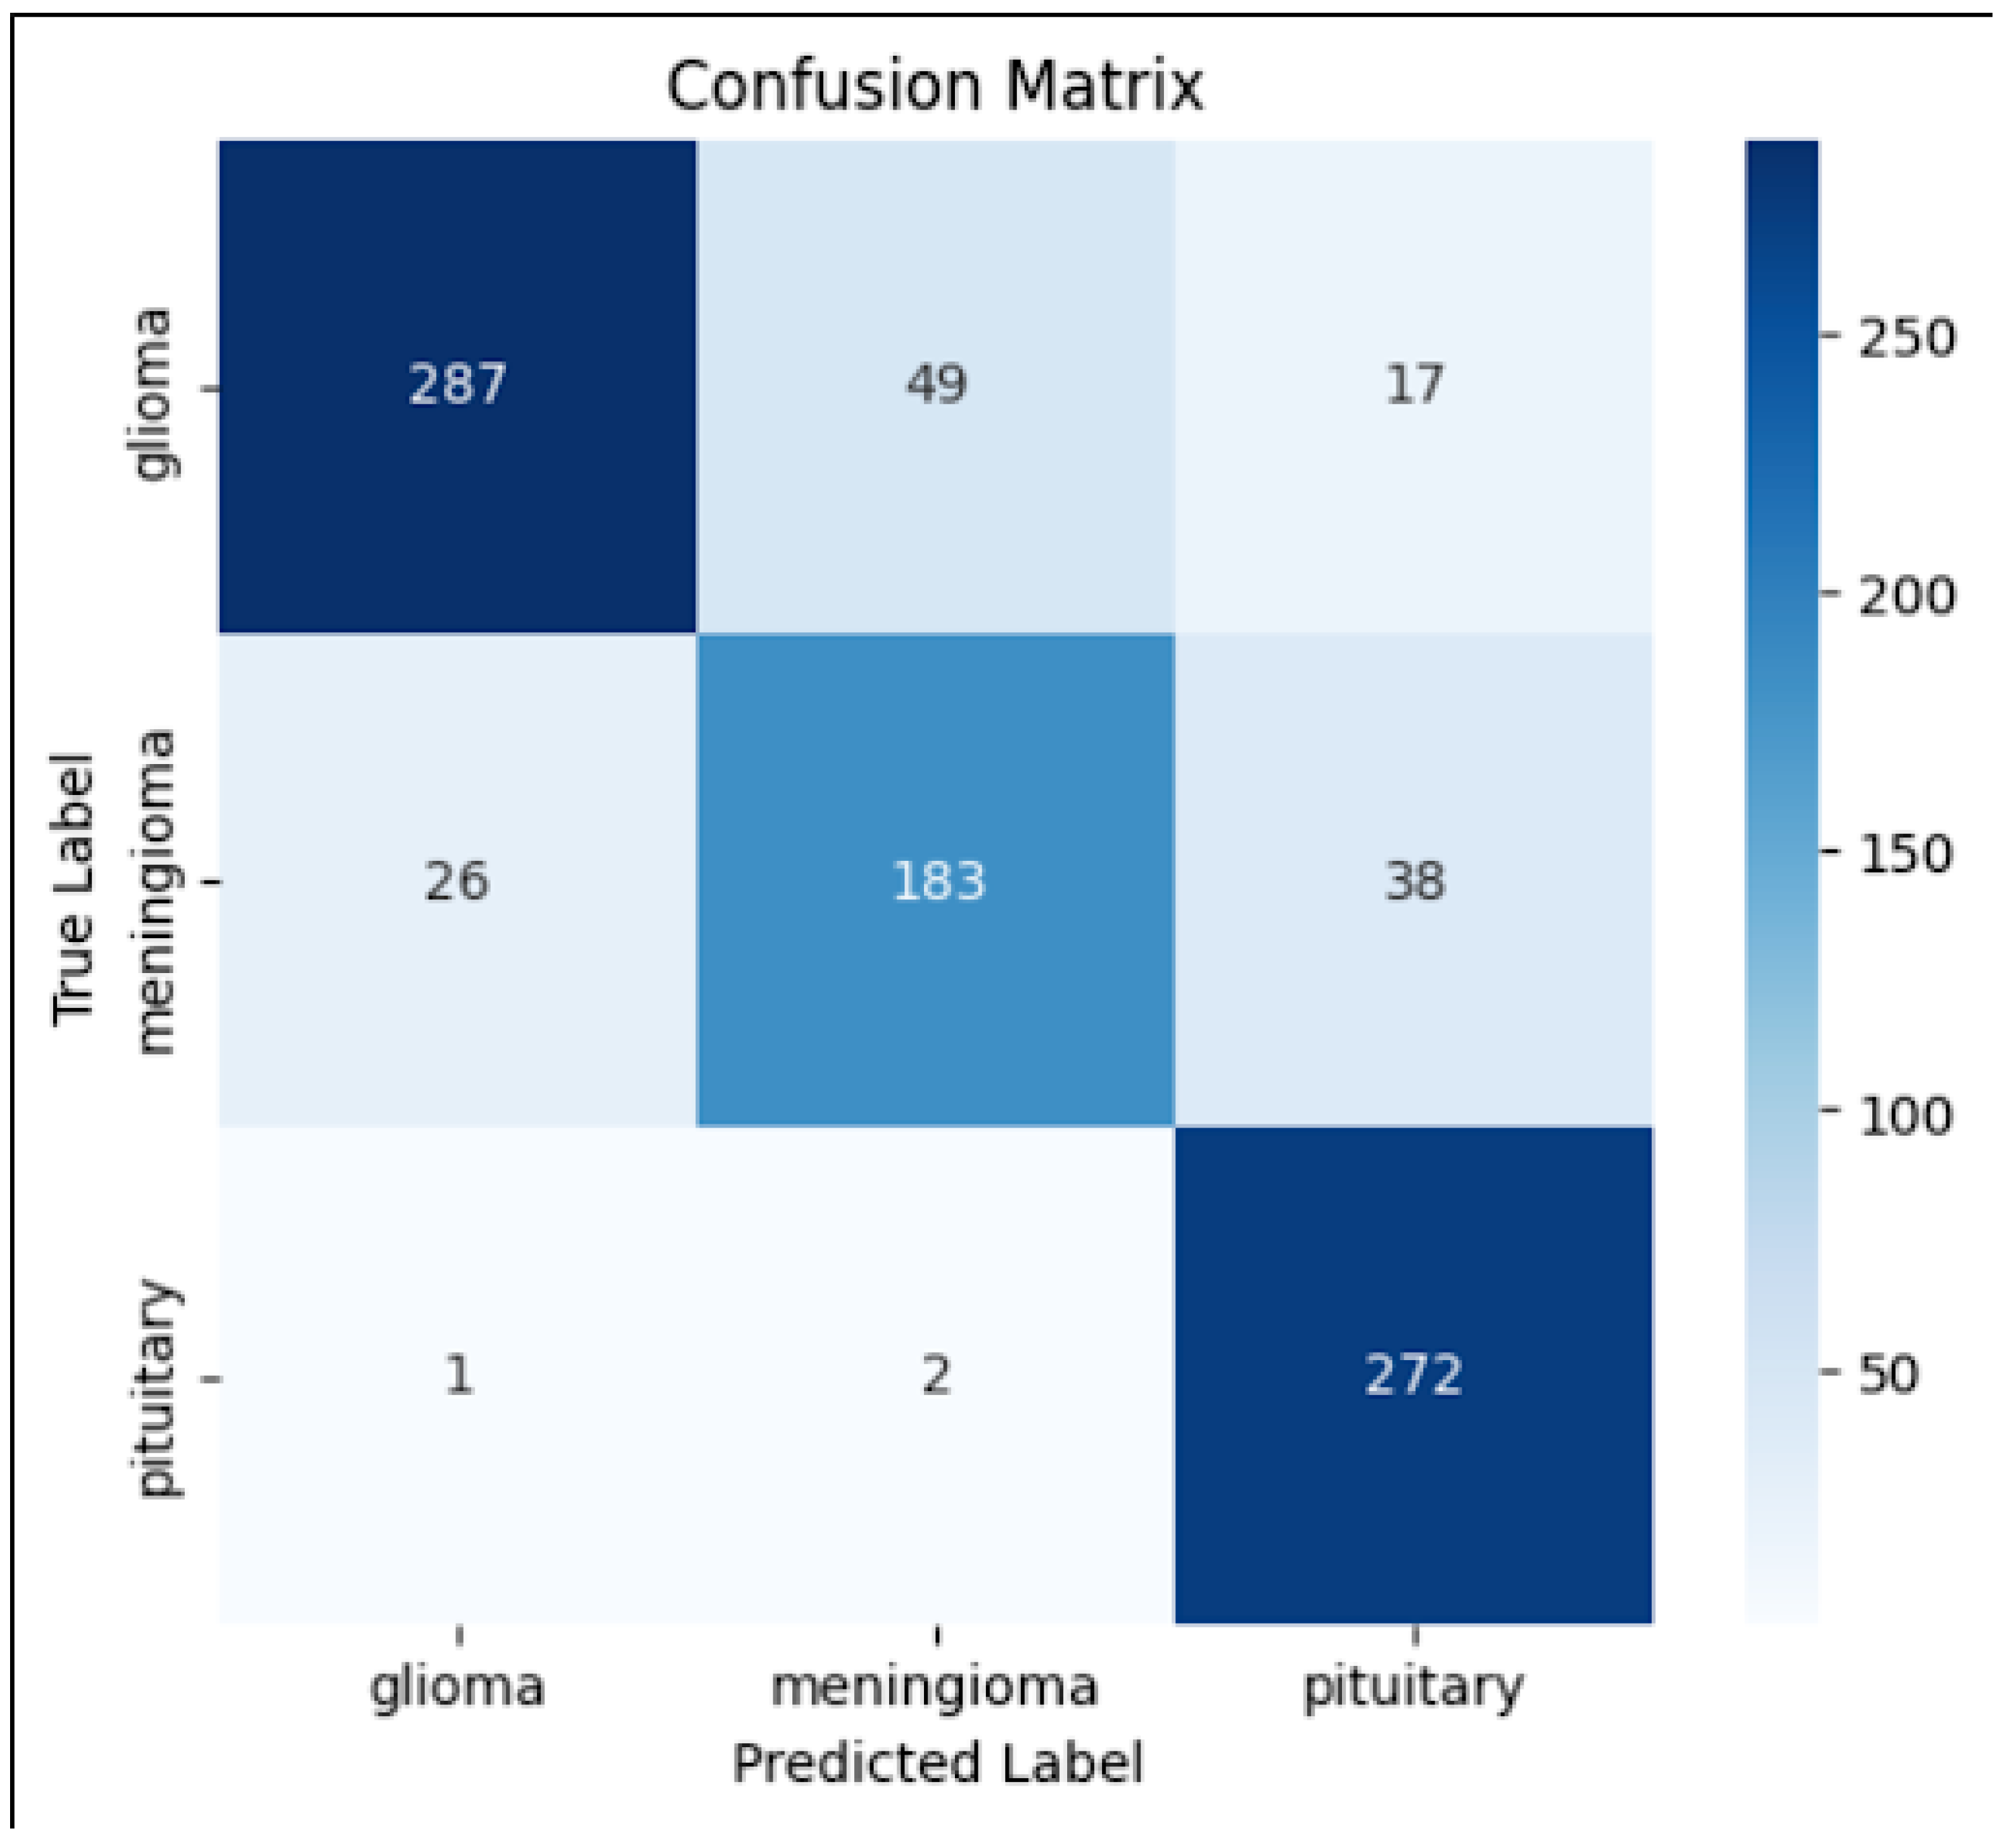
Figure 3.
Training and validation loss curves during model training
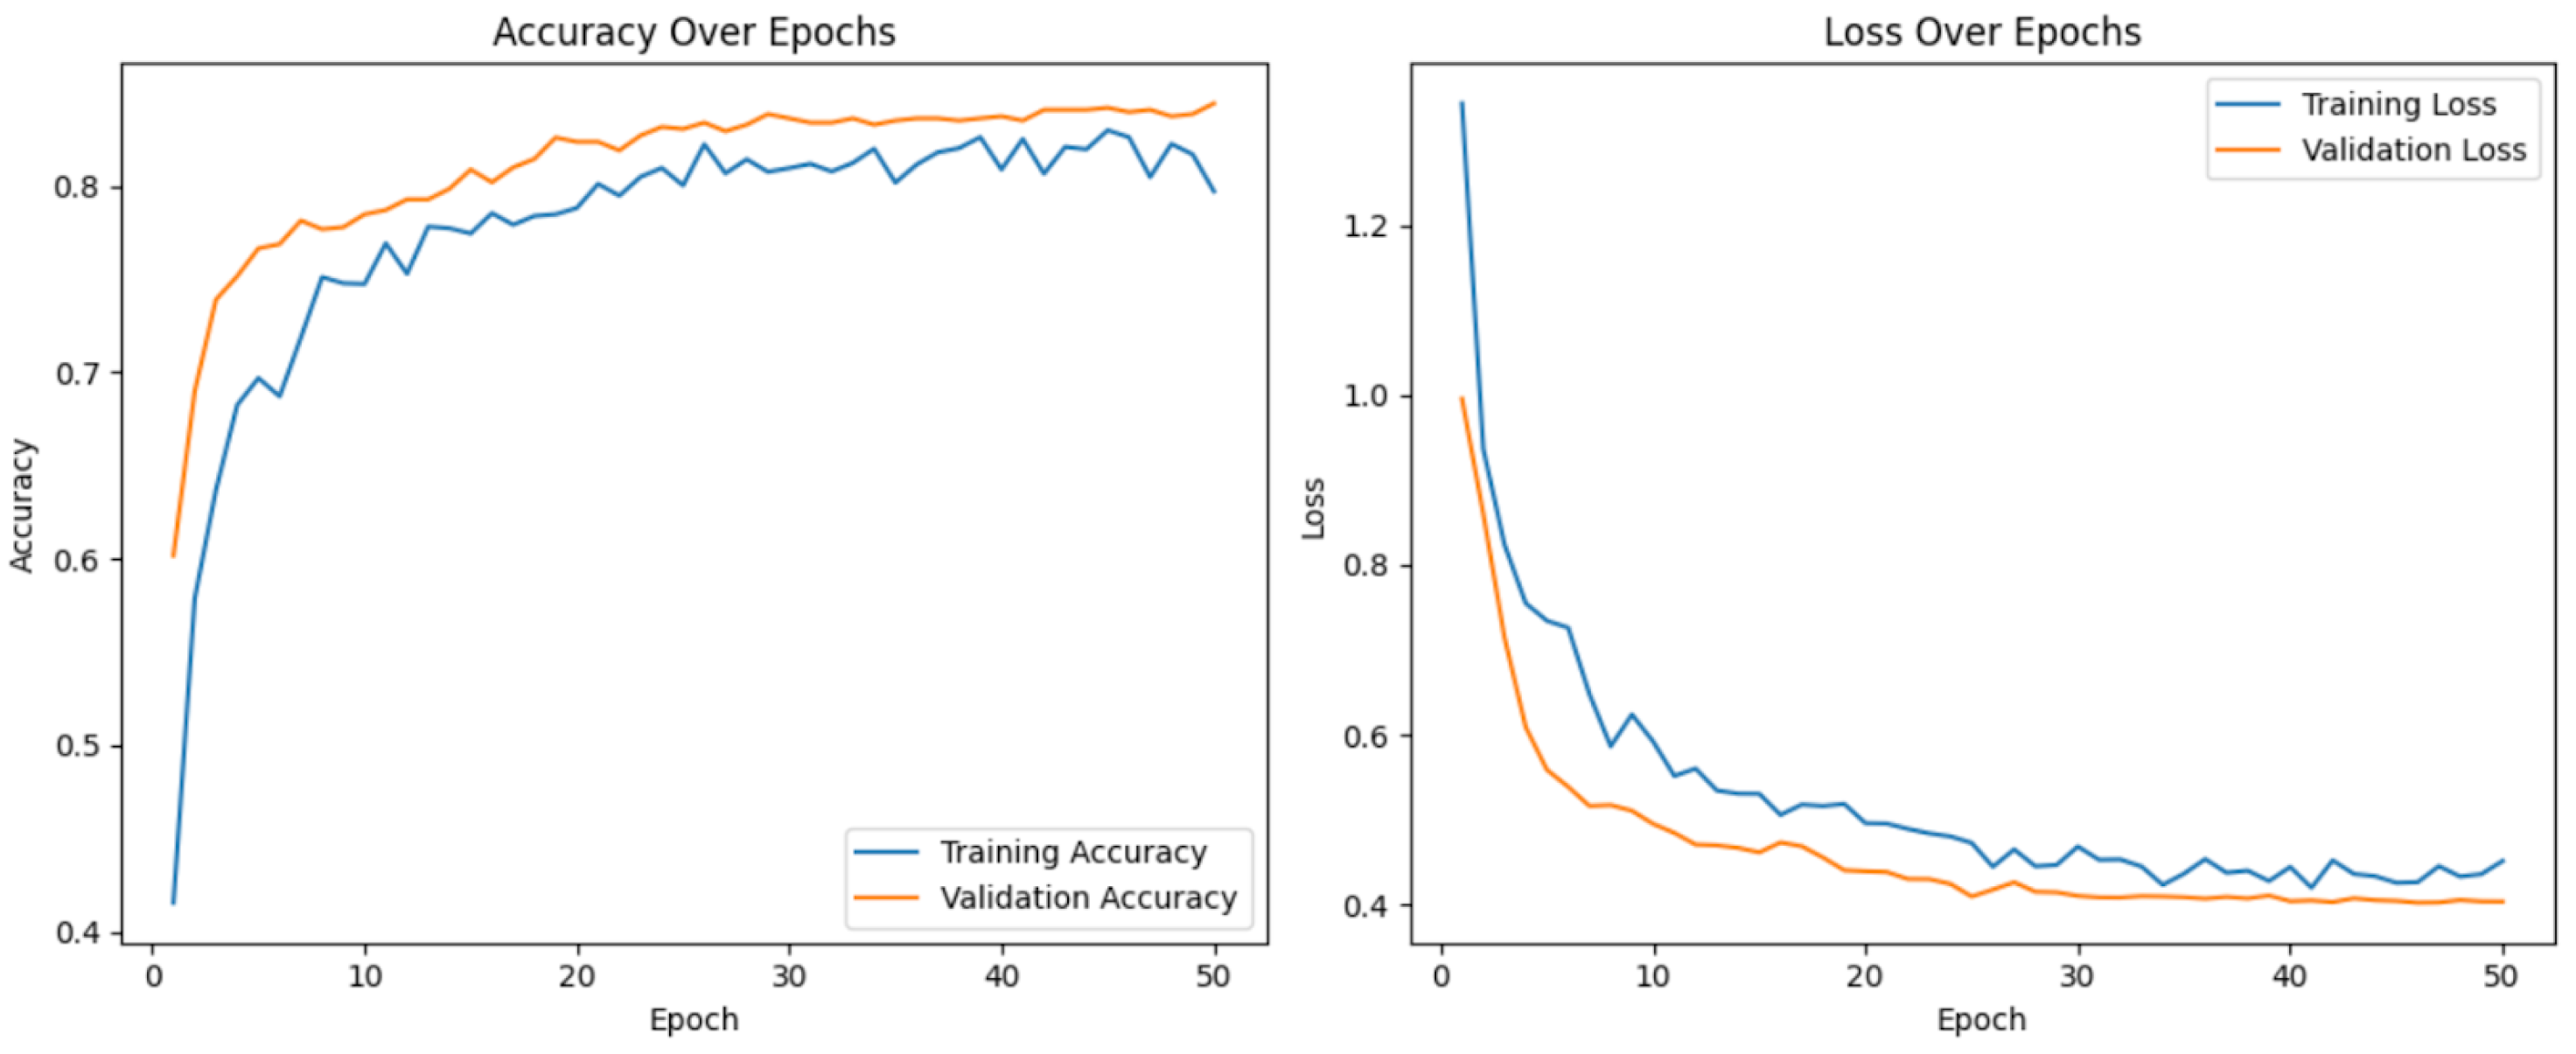
Figure 4.
ROC curves for each tumor type (Glioma, Meningioma, Pituitary)
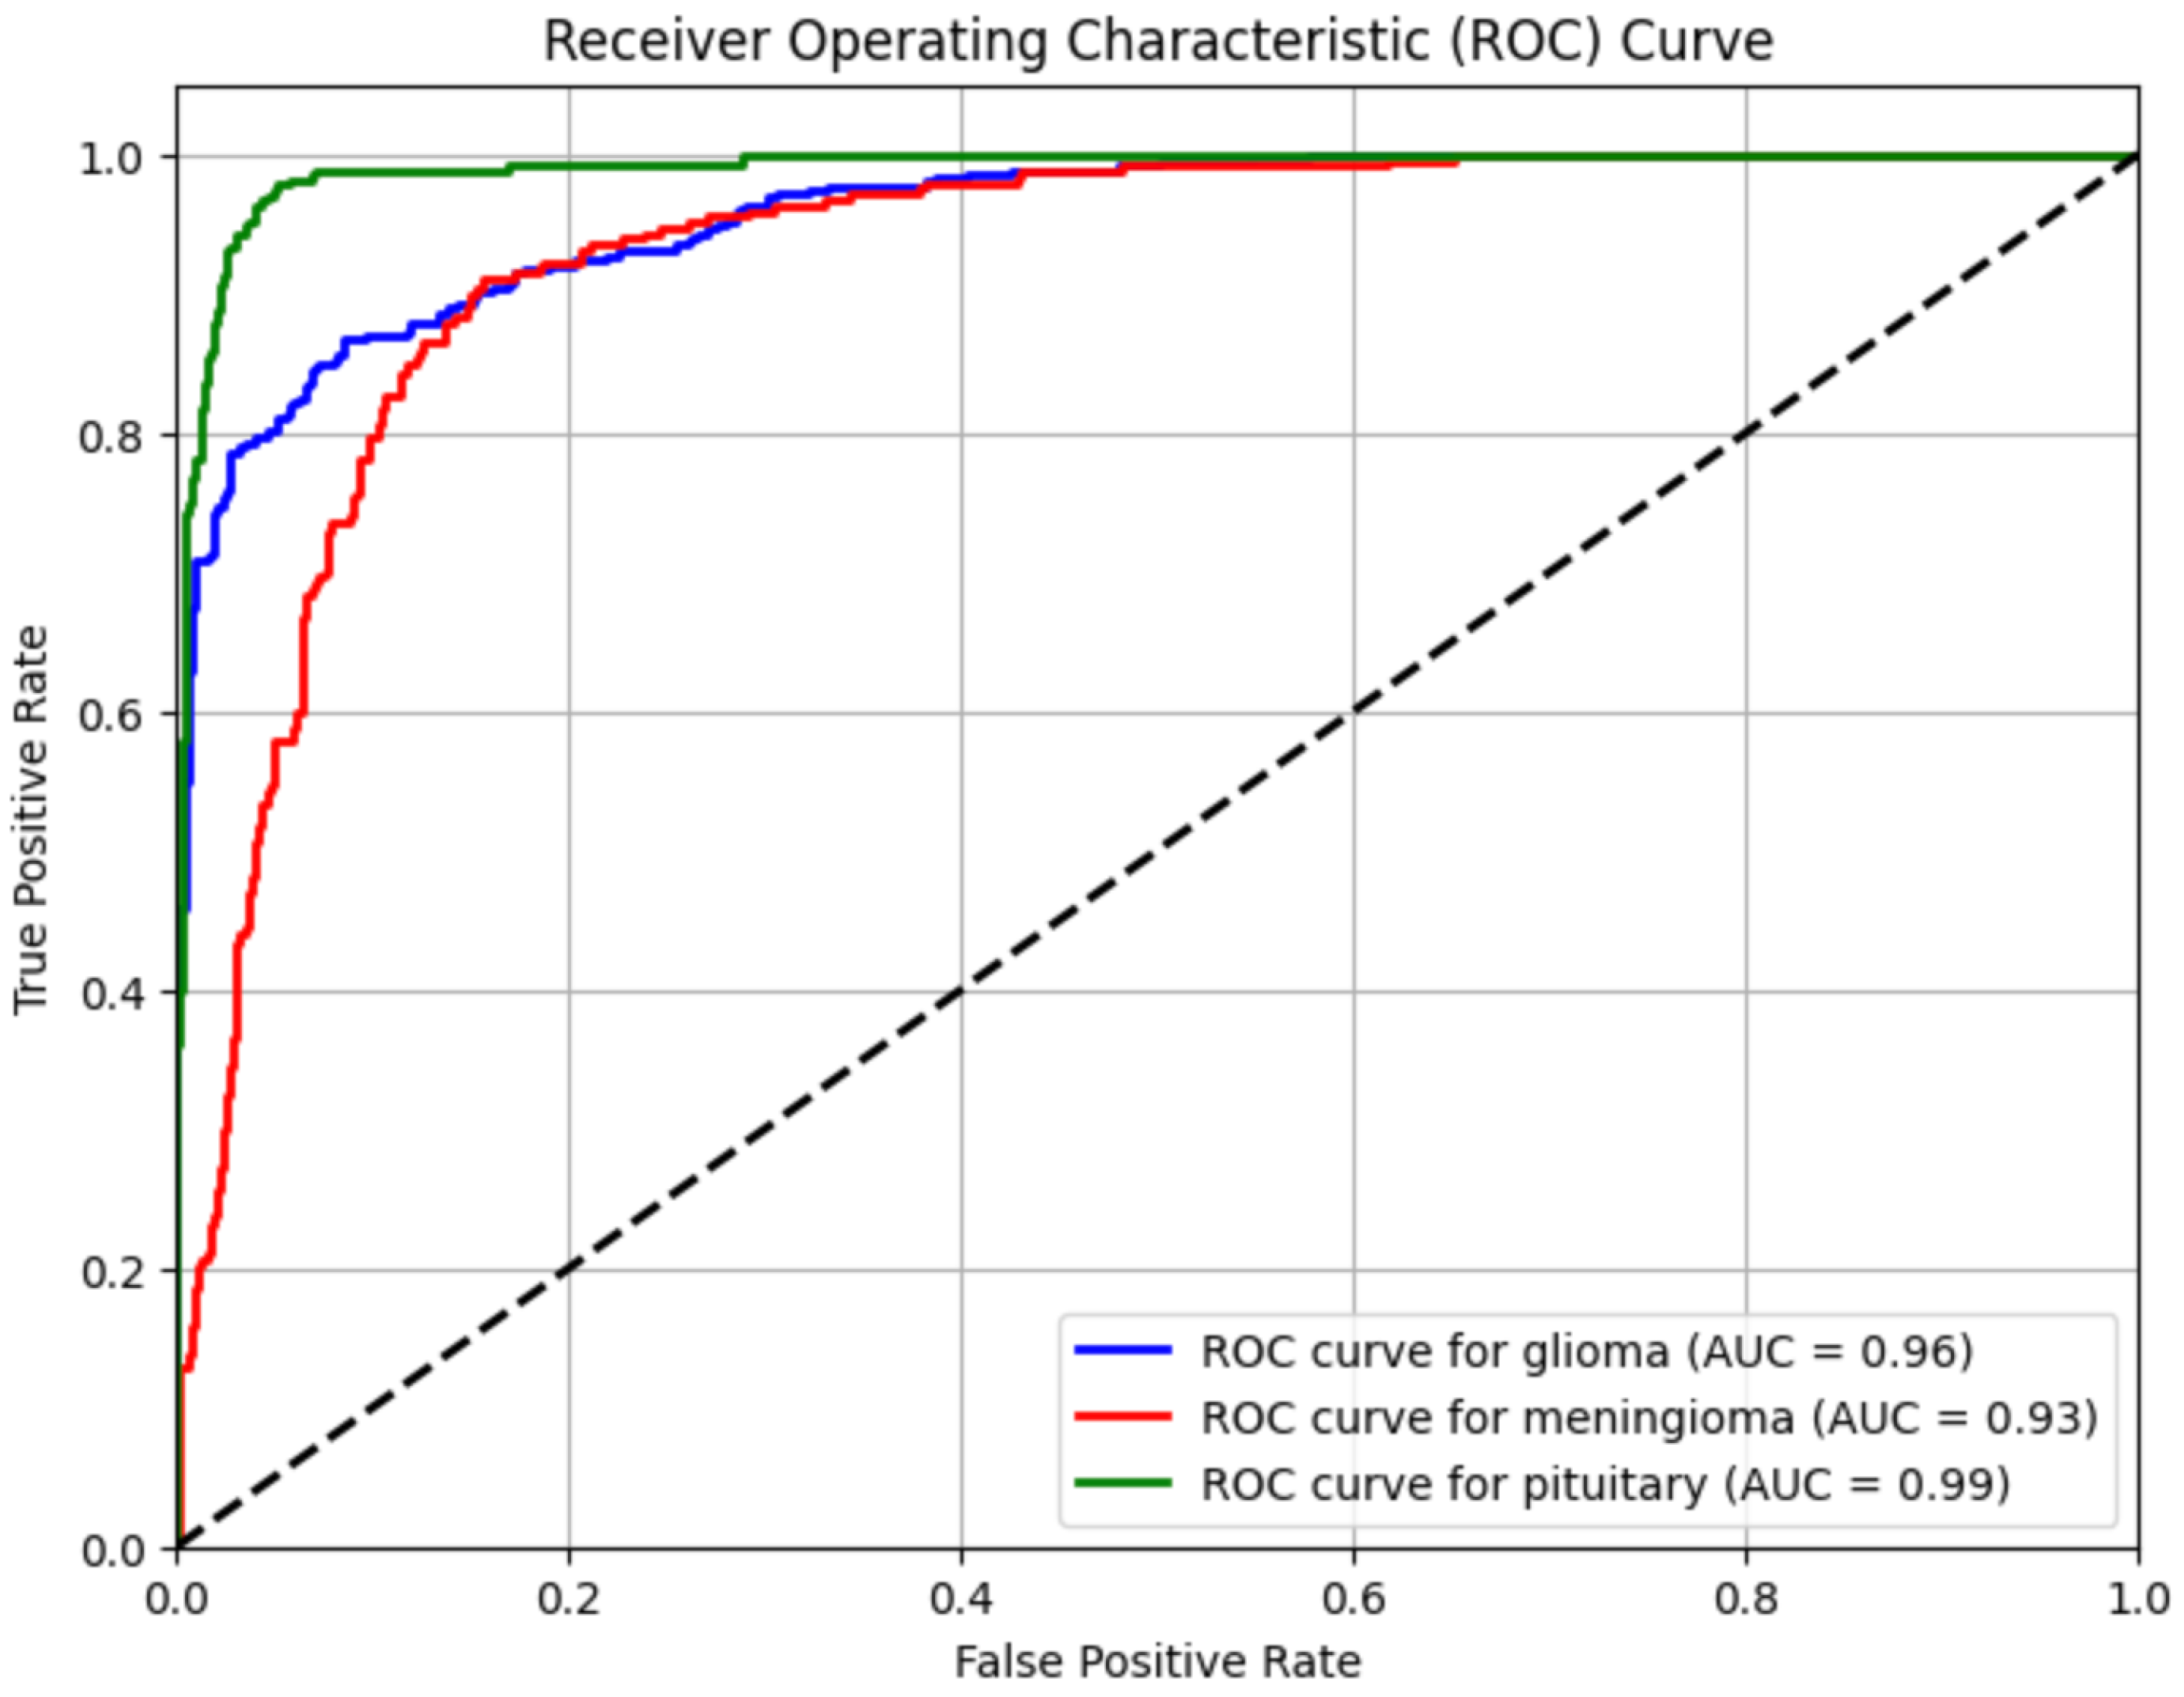
Figure 5.
Grad-CAM visualizations of the VGG16 model predictions on glioma, meningioma, and pituitary tumor MRI scans. Red areas indicate high attention weights.
Figure 5.
Grad-CAM visualizations of the VGG16 model predictions on glioma, meningioma, and pituitary tumor MRI scans. Red areas indicate high attention weights.
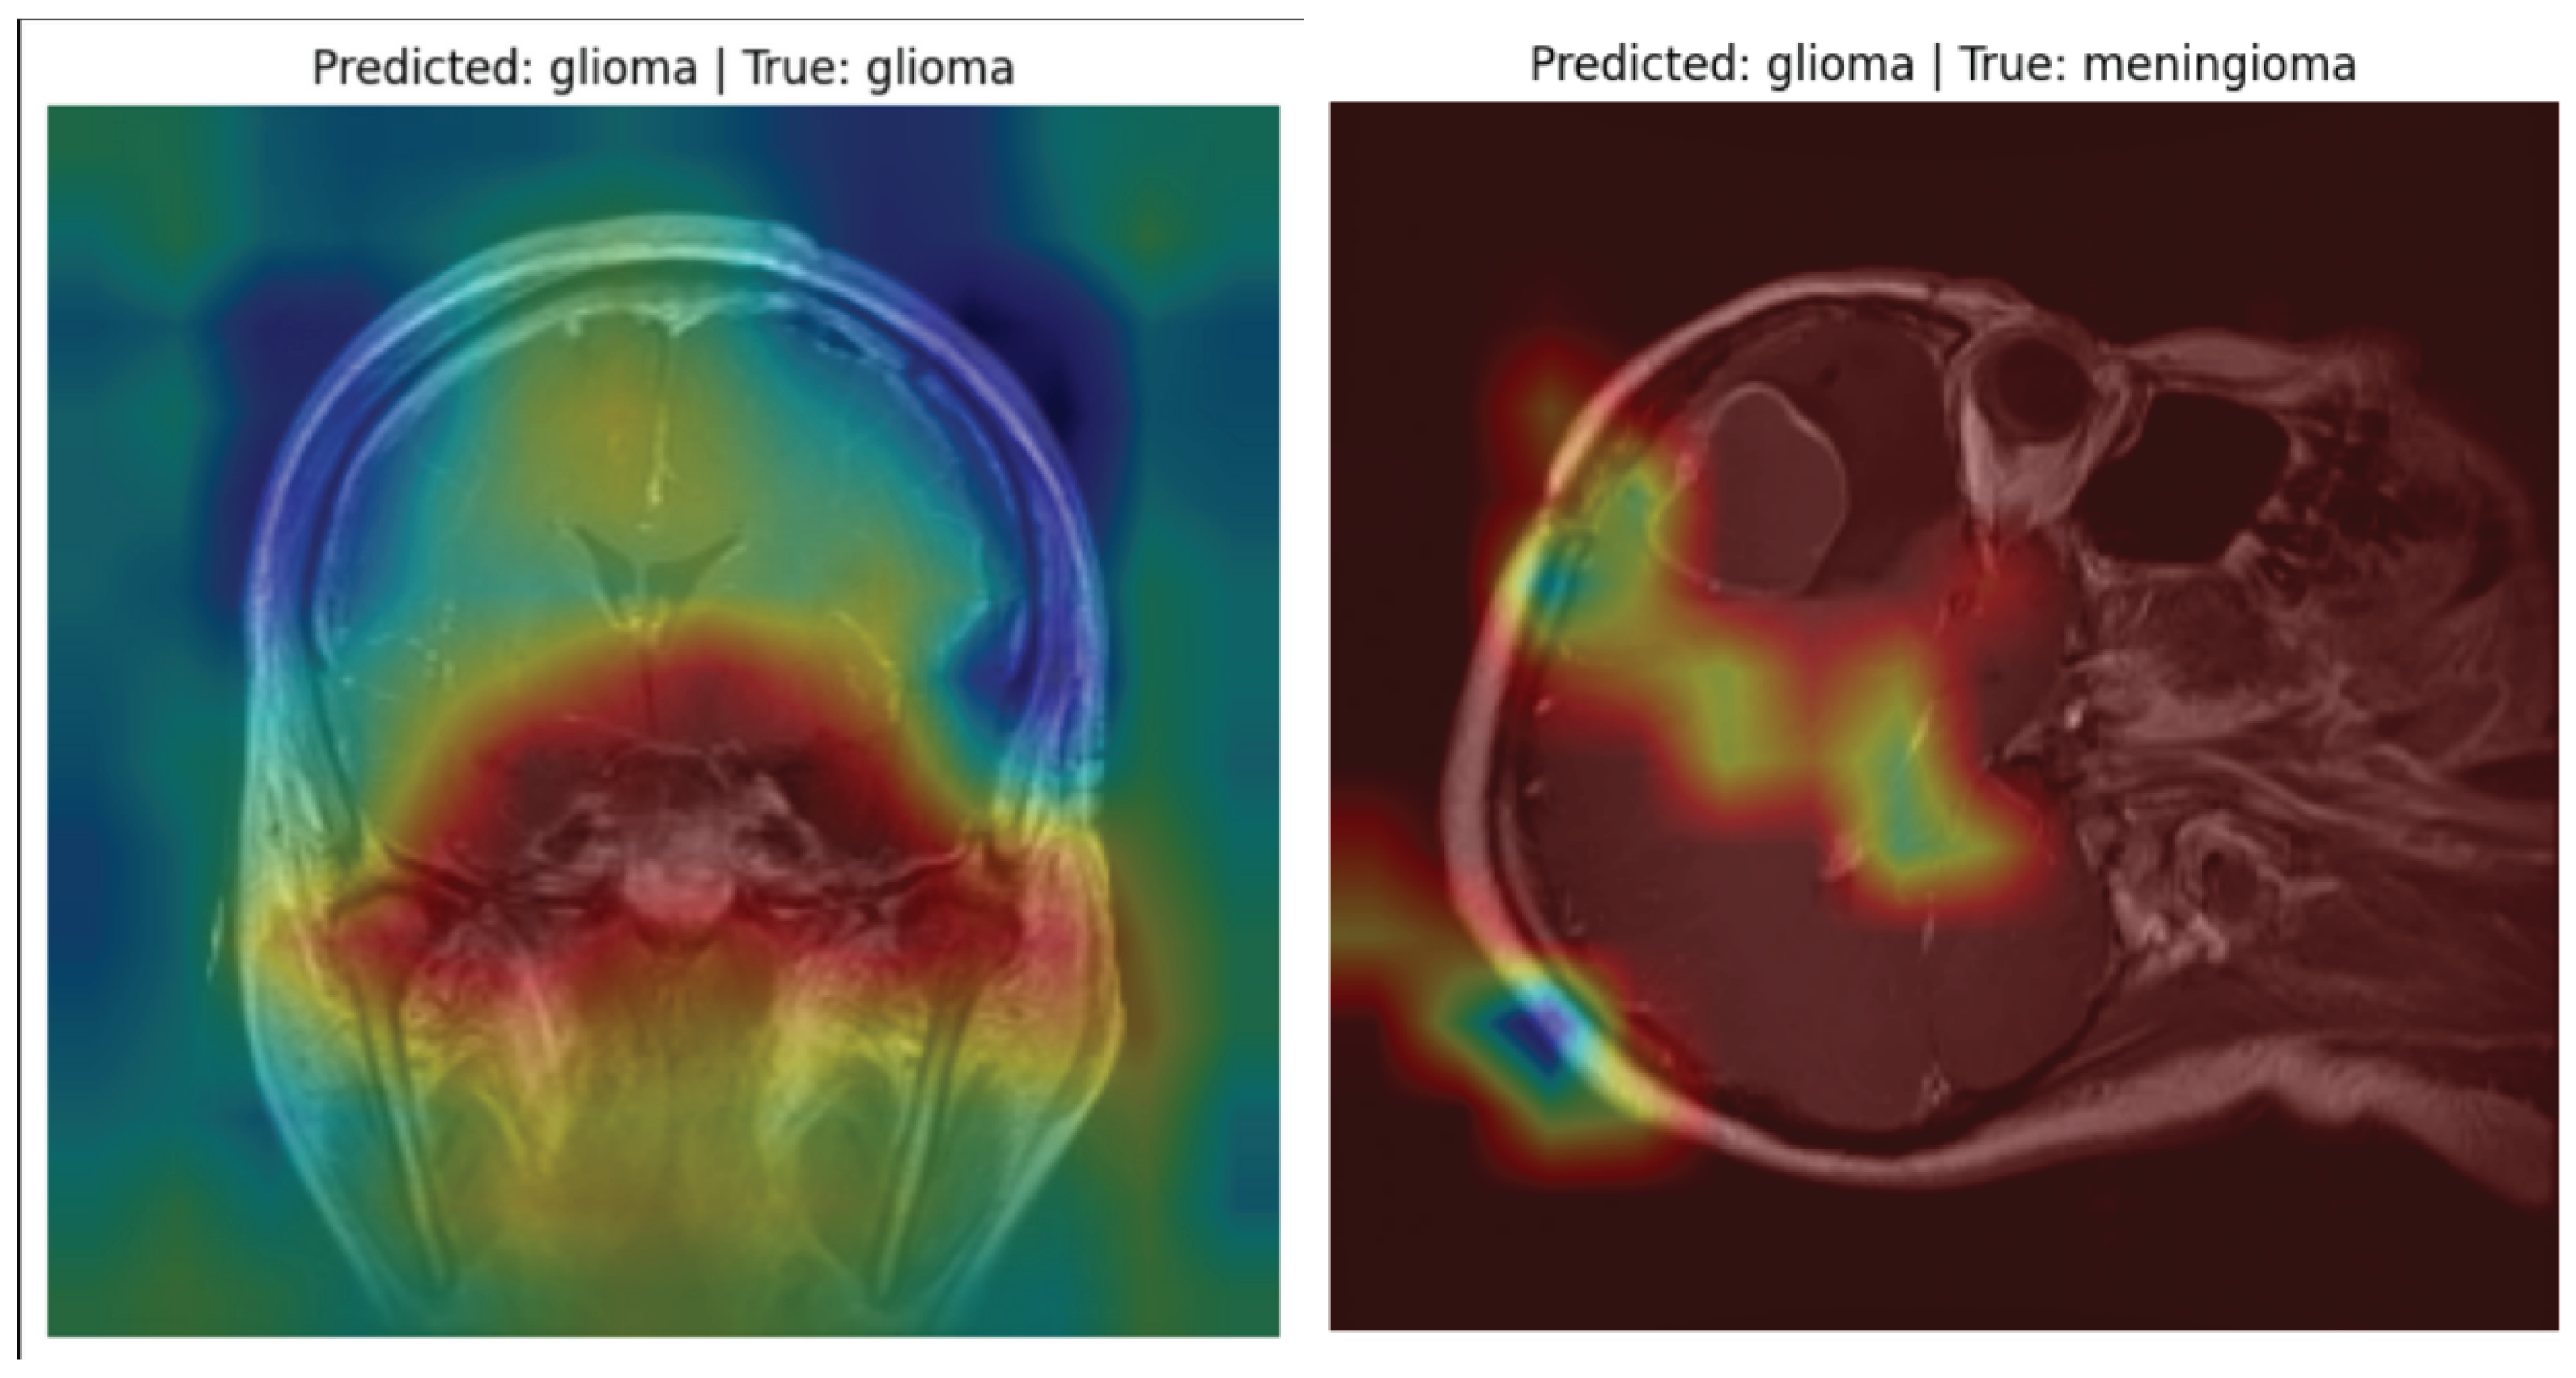
Table 1.
Comparative Performance of Deep Learning Models for Brain Tumor Classification
| Study | Pre-Trained Model | Proposed Model | Dataset | Accuracy (%) |
|---|---|---|---|---|
| Khan et al. (2022) | ResNet-50 | N/A (Baseline Model) | Figshare Brain MRI Dataset | 96.50% |
| Zahoor et al. (2024) | ResNet-18, VGG16 | Res-BRNet (Boundary-Aware CNN) | Kaggle + Br35H (10k images) | 98.20% |
| Reddy et al. (2024) | ViT-B16, ViT-L32 | FTVT (Fine-Tuned ViTs) | Br35H (7,023 MRI images) | 98.70% |
| Krishnan et al. (2024) | ViT-B16 | RViT (Rotation-Invariant ViT) | Kaggle Brain MRI | 98.60% |
| Chen et al. (2024) | YOLOv8 | YOLO-NeuroBoost | Br35H, Roboflow MRI Dataset | 99.50% |
| Abdusalomov et al. (2023) | YOLOv7 | CBAM-YOLOv7 (Enhanced Detector) | Large MRI Dataset (10,288 images) | 99.40% |
| Current Study (2025) | VGG16 | VGG16 + Custom Dense Classifier (Fine-Tuned) | Kaggle + Figshare Brain MRI | 84.40% |
Table 3.
Performance Comparison of Recent Deep Learning Models for Brain Tumor Classification Based on Accuracy
Table 3.
Performance Comparison of Recent Deep Learning Models for Brain Tumor Classification Based on Accuracy
| Classification Report: | Precision | Recall | F1-Score | Support |
|---|---|---|---|---|
| glioma | 0.91 | 0.81 | 0.86 | 353 |
| meningioma | 0.78 | 0.74 | 0.76 | 247 |
| pituitary | 0.83 | 0.99 | 0.90 | 275 |
| accuracy | - | - | 0.85 | 875 |
| macro avg | 0.84 | 0.85 | 0.84 | 875 |
| weighted avg | 0.85 | 0.85 | 0.85 | 875 |
Disclaimer/Publisher’s Note: The statements, opinions and data contained in all publications are solely those of the individual author(s) and contributor(s) and not of MDPI and/or the editor(s). MDPI and/or the editor(s) disclaim responsibility for any injury to people or property resulting from any ideas, methods, instructions or products referred to in the content. |
© 2025 by the authors. Licensee MDPI, Basel, Switzerland. This article is an open access article distributed under the terms and conditions of the Creative Commons Attribution (CC BY) license (http://creativecommons.org/licenses/by/4.0/).
Copyright: This open access article is published under a Creative Commons CC BY 4.0 license, which permit the free download, distribution, and reuse, provided that the author and preprint are cited in any reuse.


