
Submitted:
25 May 2024
Posted:
27 May 2024
You are already at the latest version
Abstract
Driven by the importance of early detection for improving patient outcomes, this study investigates the effectiveness of various machine learning algorithms in predicting lung cancer based on clinical data. Lung cancer remains a significant global health concern, and this research seeks to contribute to advancements in early diagnosis through the application of machine learning techniques. The dataset consists of 385 training and 97 test samples, with a k-fold cross-validation approach (k=5) utilized to mitigate overfitting. Additionally, the ADASYN oversampling technique is employed to address class imbalance. Our analysis includes traditional algorithms such as Logistic Regression and Decision Trees, as well as ensemble methods like XGBoost, LGBM, and AdaBoost. Furthermore, we explore the effectiveness of deep learning models, particularly Deep Neural Networks (DNN). Results demonstrate promising accuracy rates across all models, with some outperforming others in terms of precision, recall, and F1-score. Our findings reveal that LGBM achieves the highest accuracy among all models, with an accuracy rate of 96.91%. It also exhibits superior performance in terms of precision, recall, and F1-score, particularly in classifying both positive and negative instances of lung cancer.
Keywords:
XGBoost
; LGBM
; AdaBoost
; KNN
; ML
; Lung cancer
; DNN
Introduction
Lung cancer stands as a highly lethal disease, posing a significant global health burden. It currently ranks among the top ten causes of death worldwide, contributing to roughly 1.5% of all fatalities [1,2]. Originating in the lungs, this cancer can spread (metastasize) to other organs, most commonly the brain. Broadly categorized into two main types – non-small cell and small cell – lung cancer often presents with symptoms like persistent cough, chest pain, weight loss, and shortness of breath. Smoking, both direct and secondhand exposure, remains the primary culprit in lung cancer development. Treatment options typically involve surgery, chemotherapy, radiation therapy, and immunotherapy. However, a major challenge lies in diagnosing lung cancer at early stages, often leading to identification only when the disease is advanced [3,4]. This underscores the critical need for early prediction to effectively manage the disease and improve survival rates. Fortunately, proper diagnosis and medical intervention can offer promising outcomes for lung cancer patients.
Survival rates for lung cancer are highly individualized, influenced by factors like age, sex, race, and overall health status. In today's medical landscape, machine learning plays a pivotal role in detecting and predicting diseases at early stages, ensuring safer lives. With its ability to streamline the diagnosis process, machine learning is revolutionizing healthcare. Its widespread adoption across countries underscores its significance in exploring more effective disease detection methods. Machine learning (ML) facilitates easier data analysis and processing of real attributes or information, aiding in identifying the root causes of diseases. It empowers medical experts to predict disease severity and outcomes. ML also plays a crucial role in controlling disease outbreaks through early prediction, enabling timely intervention. However, there is a need to refine machine learning applications to enhance standardization and reliability. Further improvements in machine learning algorithms would empower physicians and healthcare practitioners, facilitating accurate clinical decision-making with increased efficiency and accuracy.
Machine learning empowers systems to find solutions using their own learning strategies. ML is typically classified into three categories: unsupervised learning, supervised learning, and reinforcement learning. Supervised learning encompasses two processes: classification and regression. In classification, input data is processed and categorized into specific groups. The proposed work was conducted using the Weka tool. Algorithms such as k-Nearest Neighbor (KNN), Naive Gaussian, Support Vector Machine (SVM), and Neural Networks (NNs) were employed in a comparative analysis, yielding derived results.
Our study aims to address the challenges of clinical and in-situ patient monitoring, which can be difficult to control, time-consuming, and costly. We seek to provide patients with a painless and reliable environment for treatment while identifying the root causes of lung cancer. Machine learning (ML) plays a crucial role in overcoming these challenges by offering cost-effective and time-efficient solutions. By leveraging standardized and precise reports from reputable institutions, ML helps in accurately identifying and addressing the complexities of lung cancer.
In our research, we collected datasets from sources such as the World Health Organization (WHO) and the Kaggle platform to ensure reliability, repeatability, precision, and accuracy in identifying the root causes of lung cancer. Our study employs both conventional and modern ML models to compare and offer insights for patients, researchers, and experts. We utilized algorithms such as XGBoost, LGBM, AdaBoost, Logistic Regression, Decision Trees, Random Forest, CatBoost, and KNN, alongside novel Deep Neural Network (DNN) models.
Additionally, we pride ourselves on addressing commonly neglected hyperparameters in ML models, such as min child weights and learning rates. Through detailed plots and valuable data analysis, we demonstrate how these parameters impact accuracy errors and provide insights into efficiently reducing overfitting issues. Our research aims to contribute to the advancement of ML techniques in the diagnosis and management of lung cancer, ultimately improving patient outcomes and decision-making processes.
Related Works
Previous studies have extensively explored survival prediction in cancer patients using the SEER database, employing a wide array of statistical methodologies and classification techniques [4,5]. For instance, a seminal study by Zubi et al. [6] employed agglomerative clustering principles to delineate patient cohorts and predict outcomes using the ACCD algorithm, showcasing superior predictive efficacy compared to conventional TNM staging systems [7].
In another significant research effort, predictive models for breast cancer survivability were developed, with Decision Trees emerging as the most robust predictor, achieving a remarkable accuracy rate of 93.6% [8]. Similarly, investigations into prostate cancer survivability identified support vector machines (SVM) as the most accurate predictor [8,9].
Furthermore, the realm of lung cancer prognosis has received considerable scholarly attention, with various machine learning paradigms being leveraged for survival prediction. These include ensemble clustering methodologies, SVM, logistic regression, and unsupervised learning frameworks [10]. Additionally, classification techniques such as C4.5 and Naïve-Bayes classifiers have demonstrated exceptional precision in forecasting patient outcomes [7,11]. Moreover, ensemble voting strategies, particularly leveraging Decision Tree-based classifiers, have shown noteworthy efficacy in predicting lung cancer survivability [4].
In parallel, a plethora of studies has explored classification tasks on numerical and categorical datasets. For instance, Hosseinzadeh et al. [1] proposed an SVM model for predicting lung cancer tumors with an 88% accuracy compared to other classifier techniques. Another researchers [2,12] introduced a novel algorithm for feature extraction from image data, coupled with machine learning classifiers to enhance accuracy. Similarly, Hussein et al. [13] employed supervised learning using 3D CNNs for lung nodule classification, achieving 91% accuracy.
Collectively, these endeavors underscore the diverse methodologies employed in dissecting cancer patient data within the SEER database, contributing valuable insights into survival prognostication across various cancer types. These findings reaffirm the pivotal role of machine learning in augmenting clinical decision-making and patient care [3].
Methodology
In this study, we leverage machine learning (ML) techniques for the prediction of lung cancer types. Given the challenges associated with collecting data, particularly in clinical settings where the process is arduous and costly, and considering the importance of time and cost efficiency in various industries, we meticulously gathered publicly available data from reputable sources such as the World Health Organization (WHO) and Kaggle. This comprehensive approach ensured the assembly of a logical and meaningful dataset conducive to accurate and reliable predictions.
Featurization
In our featurization section, we meticulously examine a range of factors potentially associated with the development of lung cancer. These factors include gender (GENDER), age (AGE), smoking habits (SMOKING), presence of yellow fingers (YELLOW FINGERS), anxiety levels (ANXIETY), peer pressure (PEER PRESSURE), chronic diseases (CHRONIC DISEASE), fatigue (FATIGUE), allergies (ALLERGY), wheezing (WHEEZING), alcohol consumption (ALCOHOL CONSUMING), coughing (COUGHING), shortness of breath (SHORTNESS OF BREATH), swallowing difficulty (SWALLOWING DIFFICULTY), and chest pain (CHEST PAIN).
Gender is a critical factor, with observations from Figure 1a–d indicating a higher incidence of lung cancer among men, especially in middle to old age, particularly those who are smokers with yellow fingers, compared to women. Further analysis, depicted in Figure 2a–d, highlights that men diagnosed with lung cancer tend to experience elevated levels of anxiety, peer pressure, wheezing, and alcohol consumption compared to women exhibiting similar symptoms. Similarly, symptoms such as coughing, shortness of breath, swallowing difficulty, and chest pain (Figure 3a–d) are more commonly reported among men with lung cancer compared to women.
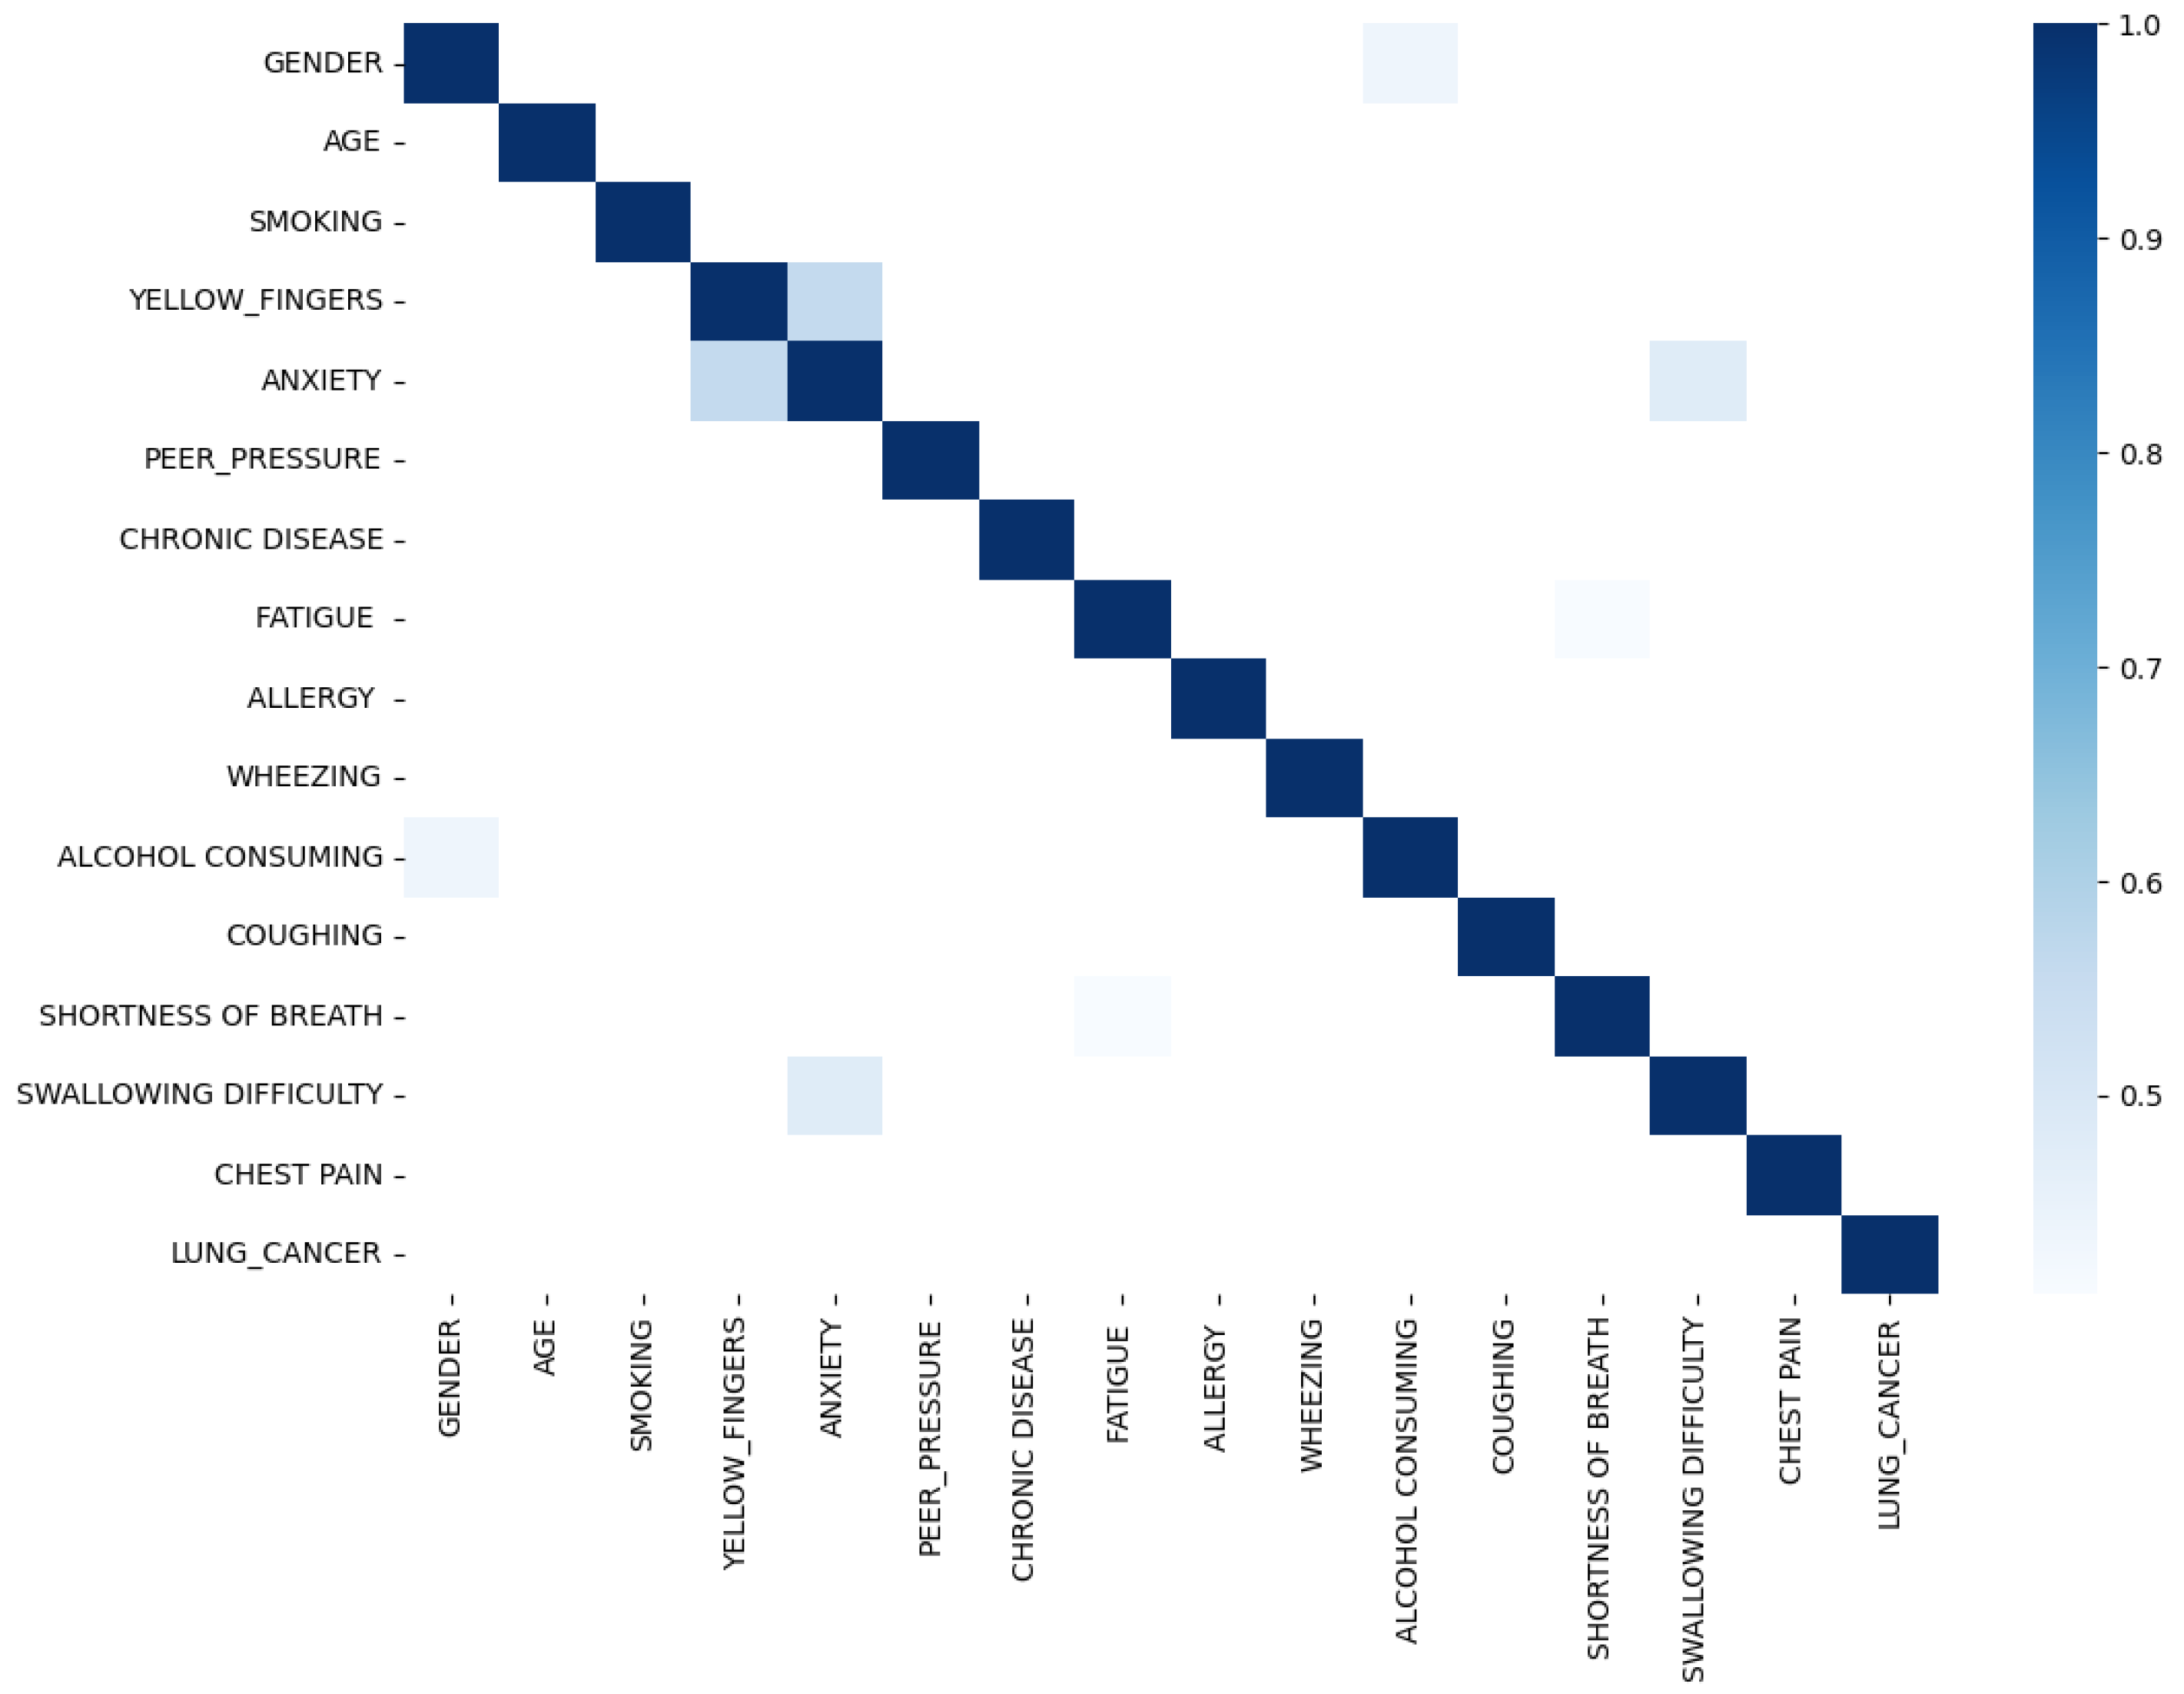
Upon scrutinizing the correlation plot of features in lung cancer datasets (Figure 4), we observe that chronic diseases, fatigue, and allergies exhibit a stronger correlation with lung cancer in women compared to men. To deepen our understanding, we identify features with correlations exceeding 0.4 for combination to enhance predictive performance. As demonstrated in Figure 5, features such as anxiety-swallowing difficulty, anxiety-yellow fingers, and gender-alcohol consumption display correlations above 0.4. Incorporating these combinations as additional columns significantly boosts the predictive capability of our model.
Figure 1.
Features (Gender, Age, Smoking and Yellow Finger) Distribution in hue of Lung Cancer.
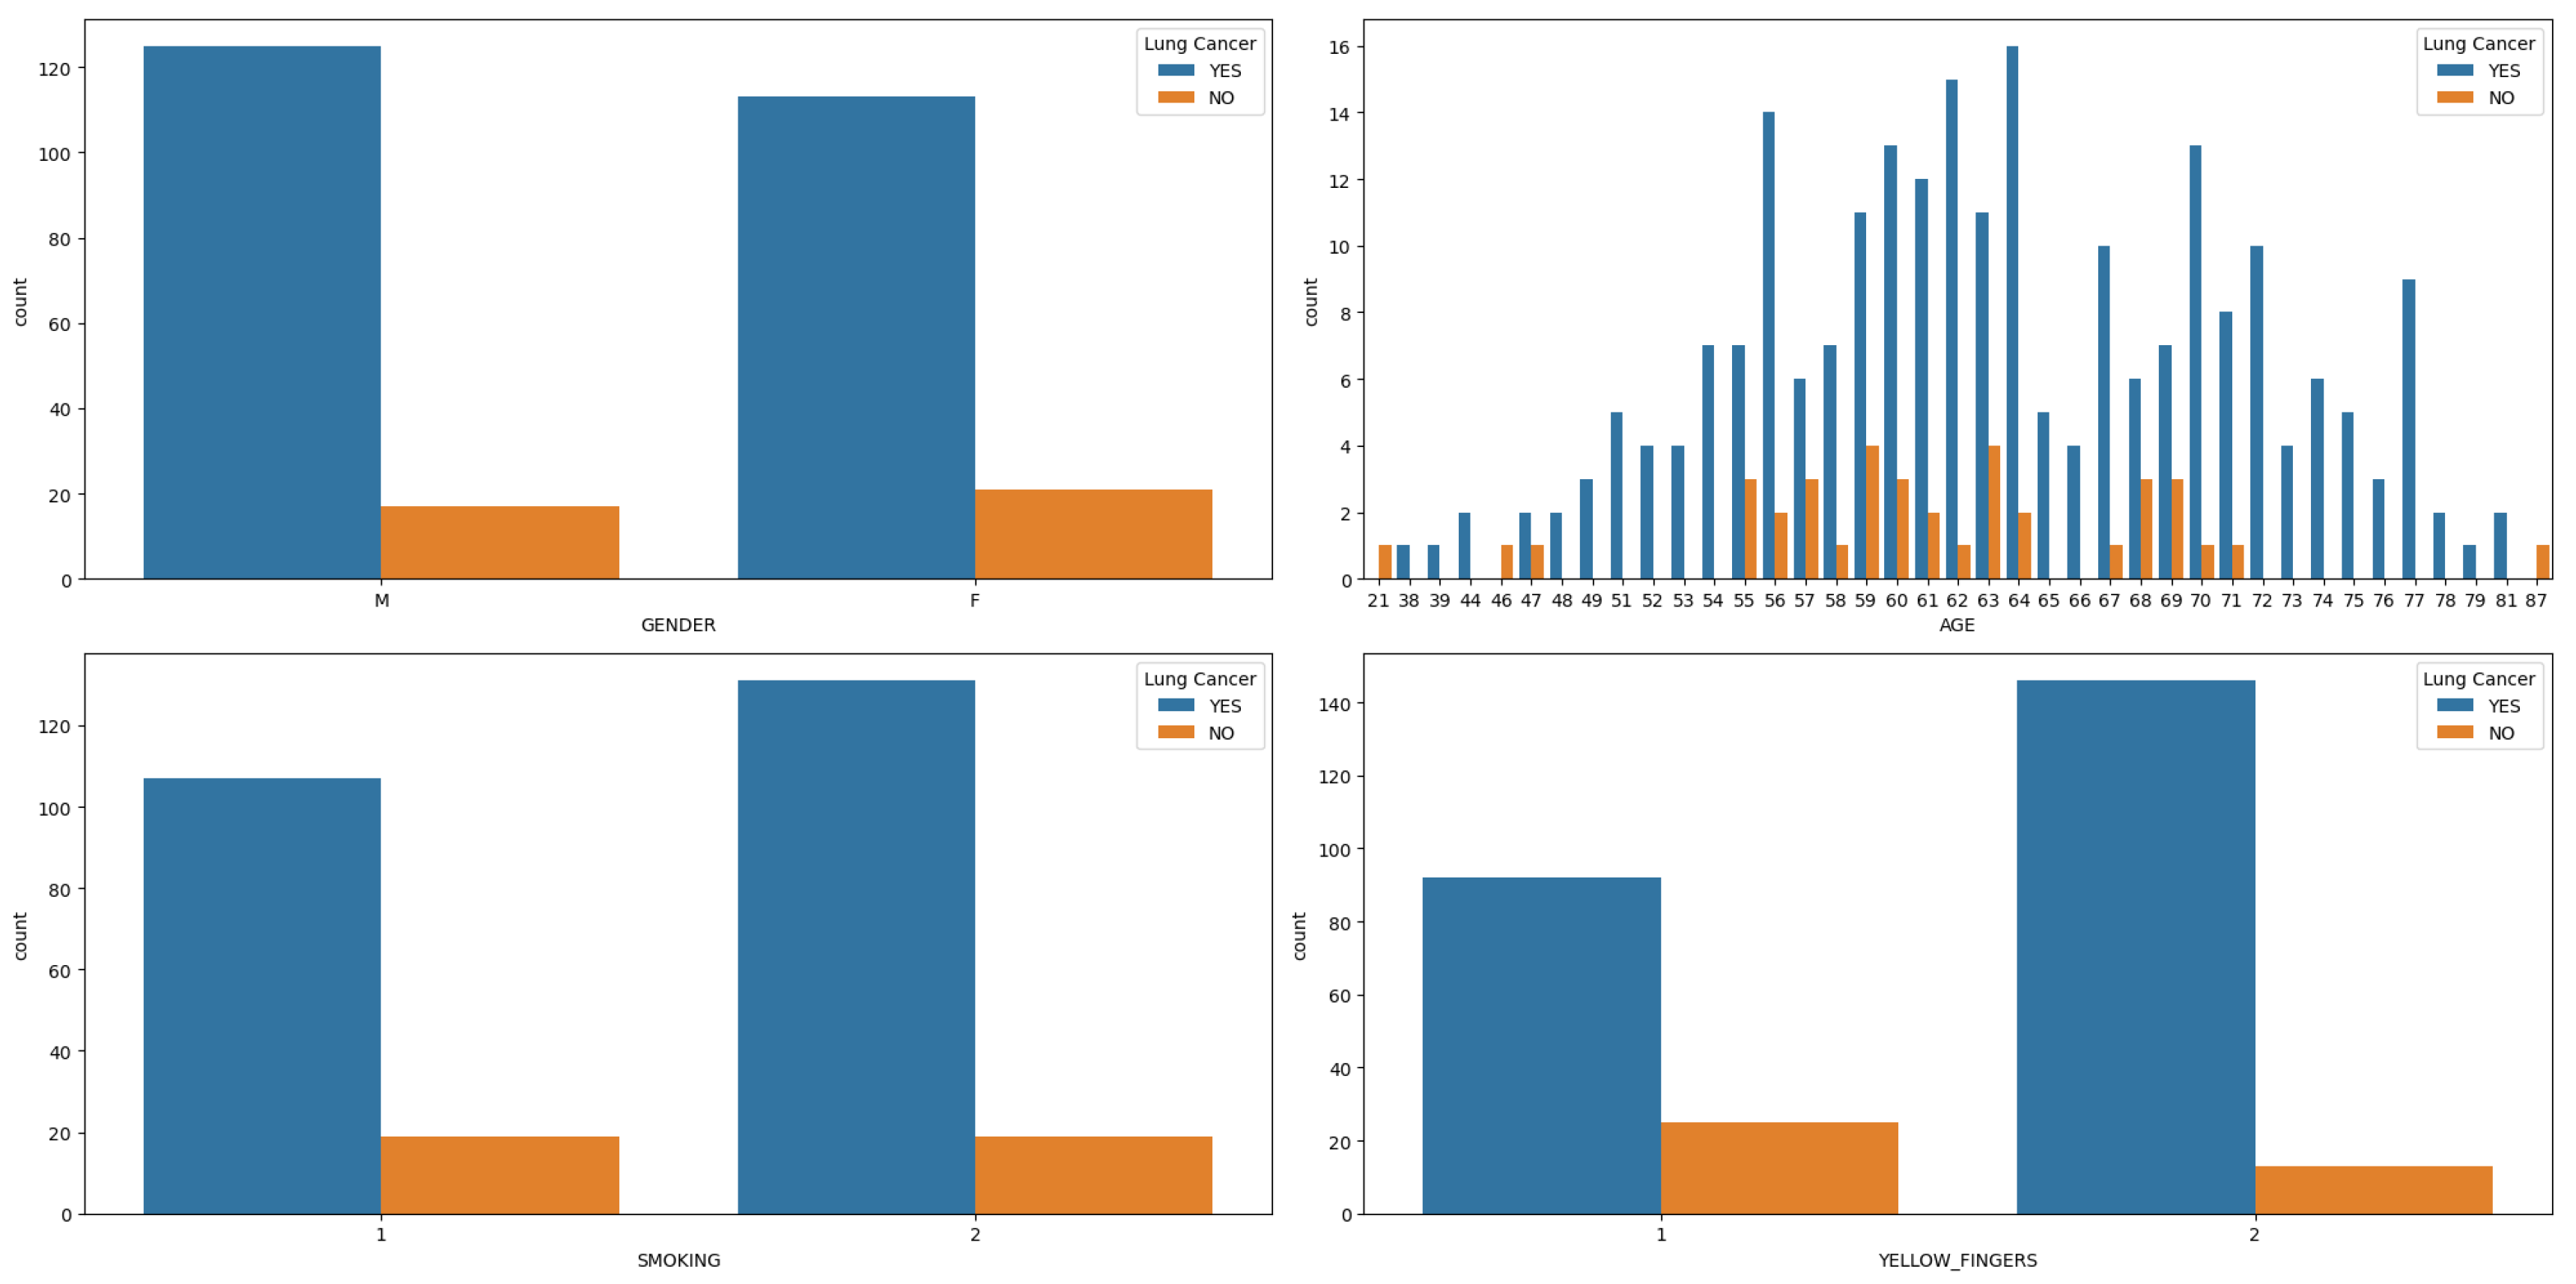
Figure 2.
Features (Anxiety, Per-pressure, Wheezing and alcohol Consuming) Distribution in hue of Lung Cancer.
Figure 2.
Features (Anxiety, Per-pressure, Wheezing and alcohol Consuming) Distribution in hue of Lung Cancer.
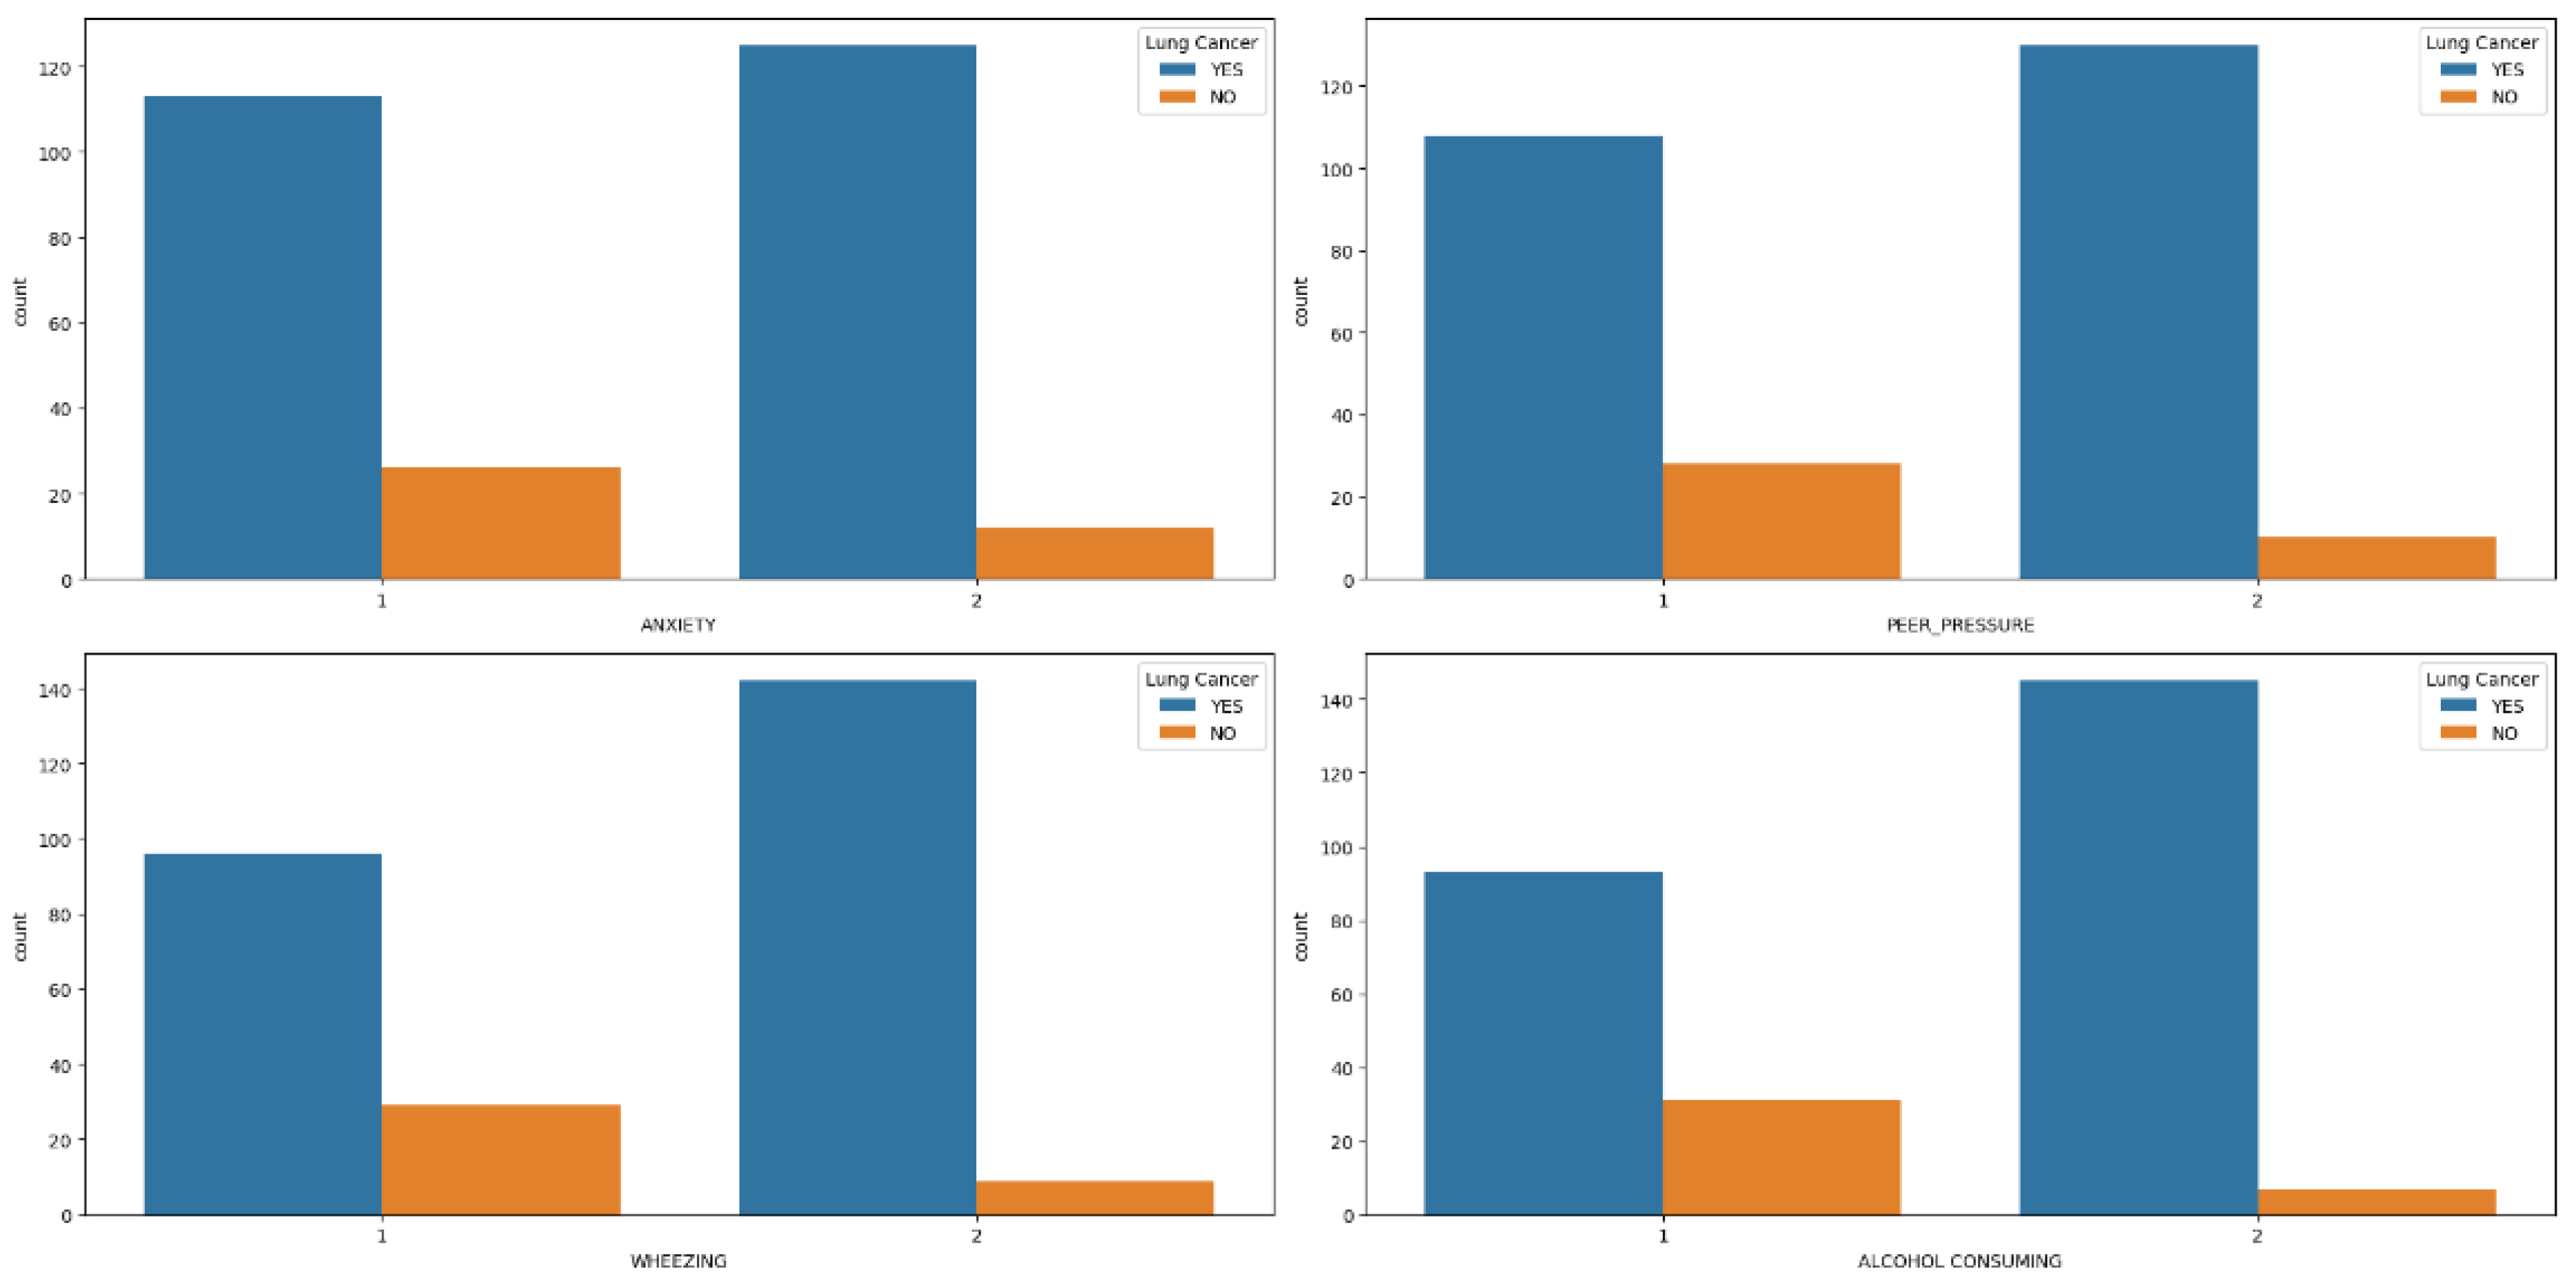
Figure 3.
Features (Coughing, Shortness of Breath, Swallowing Difficulty and Chest Pain) Distribution in hue of Lung Cancer.
Figure 3.
Features (Coughing, Shortness of Breath, Swallowing Difficulty and Chest Pain) Distribution in hue of Lung Cancer.
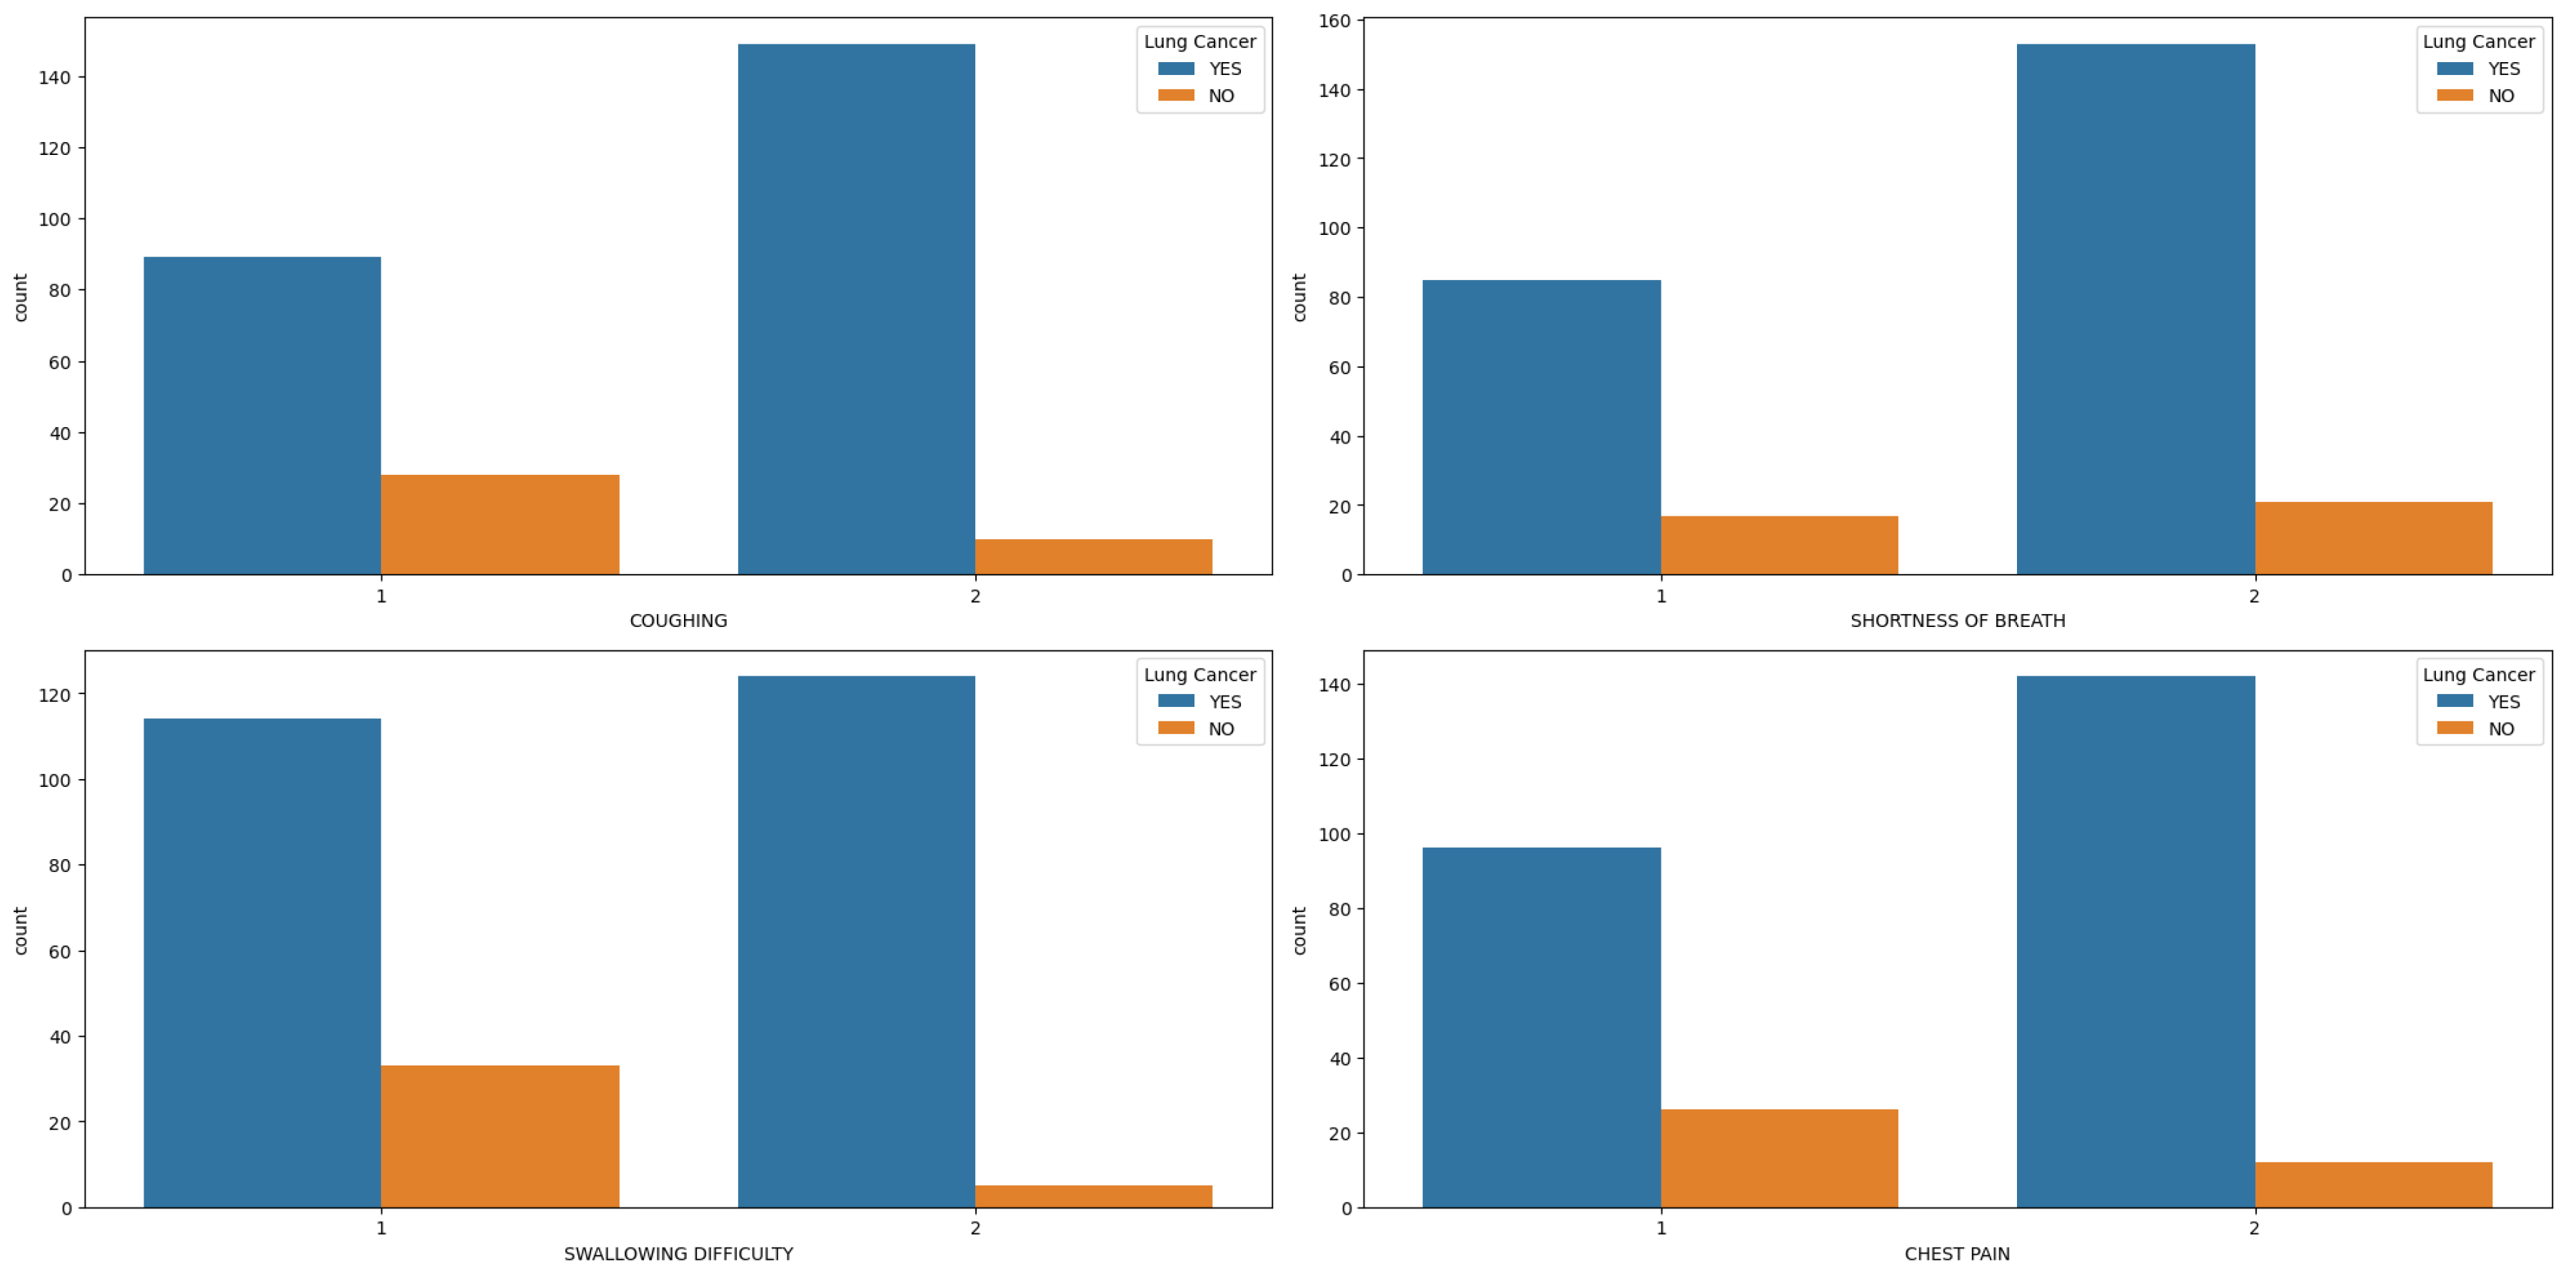
Figure 4.
Lung Cancer Dataset Correlation.
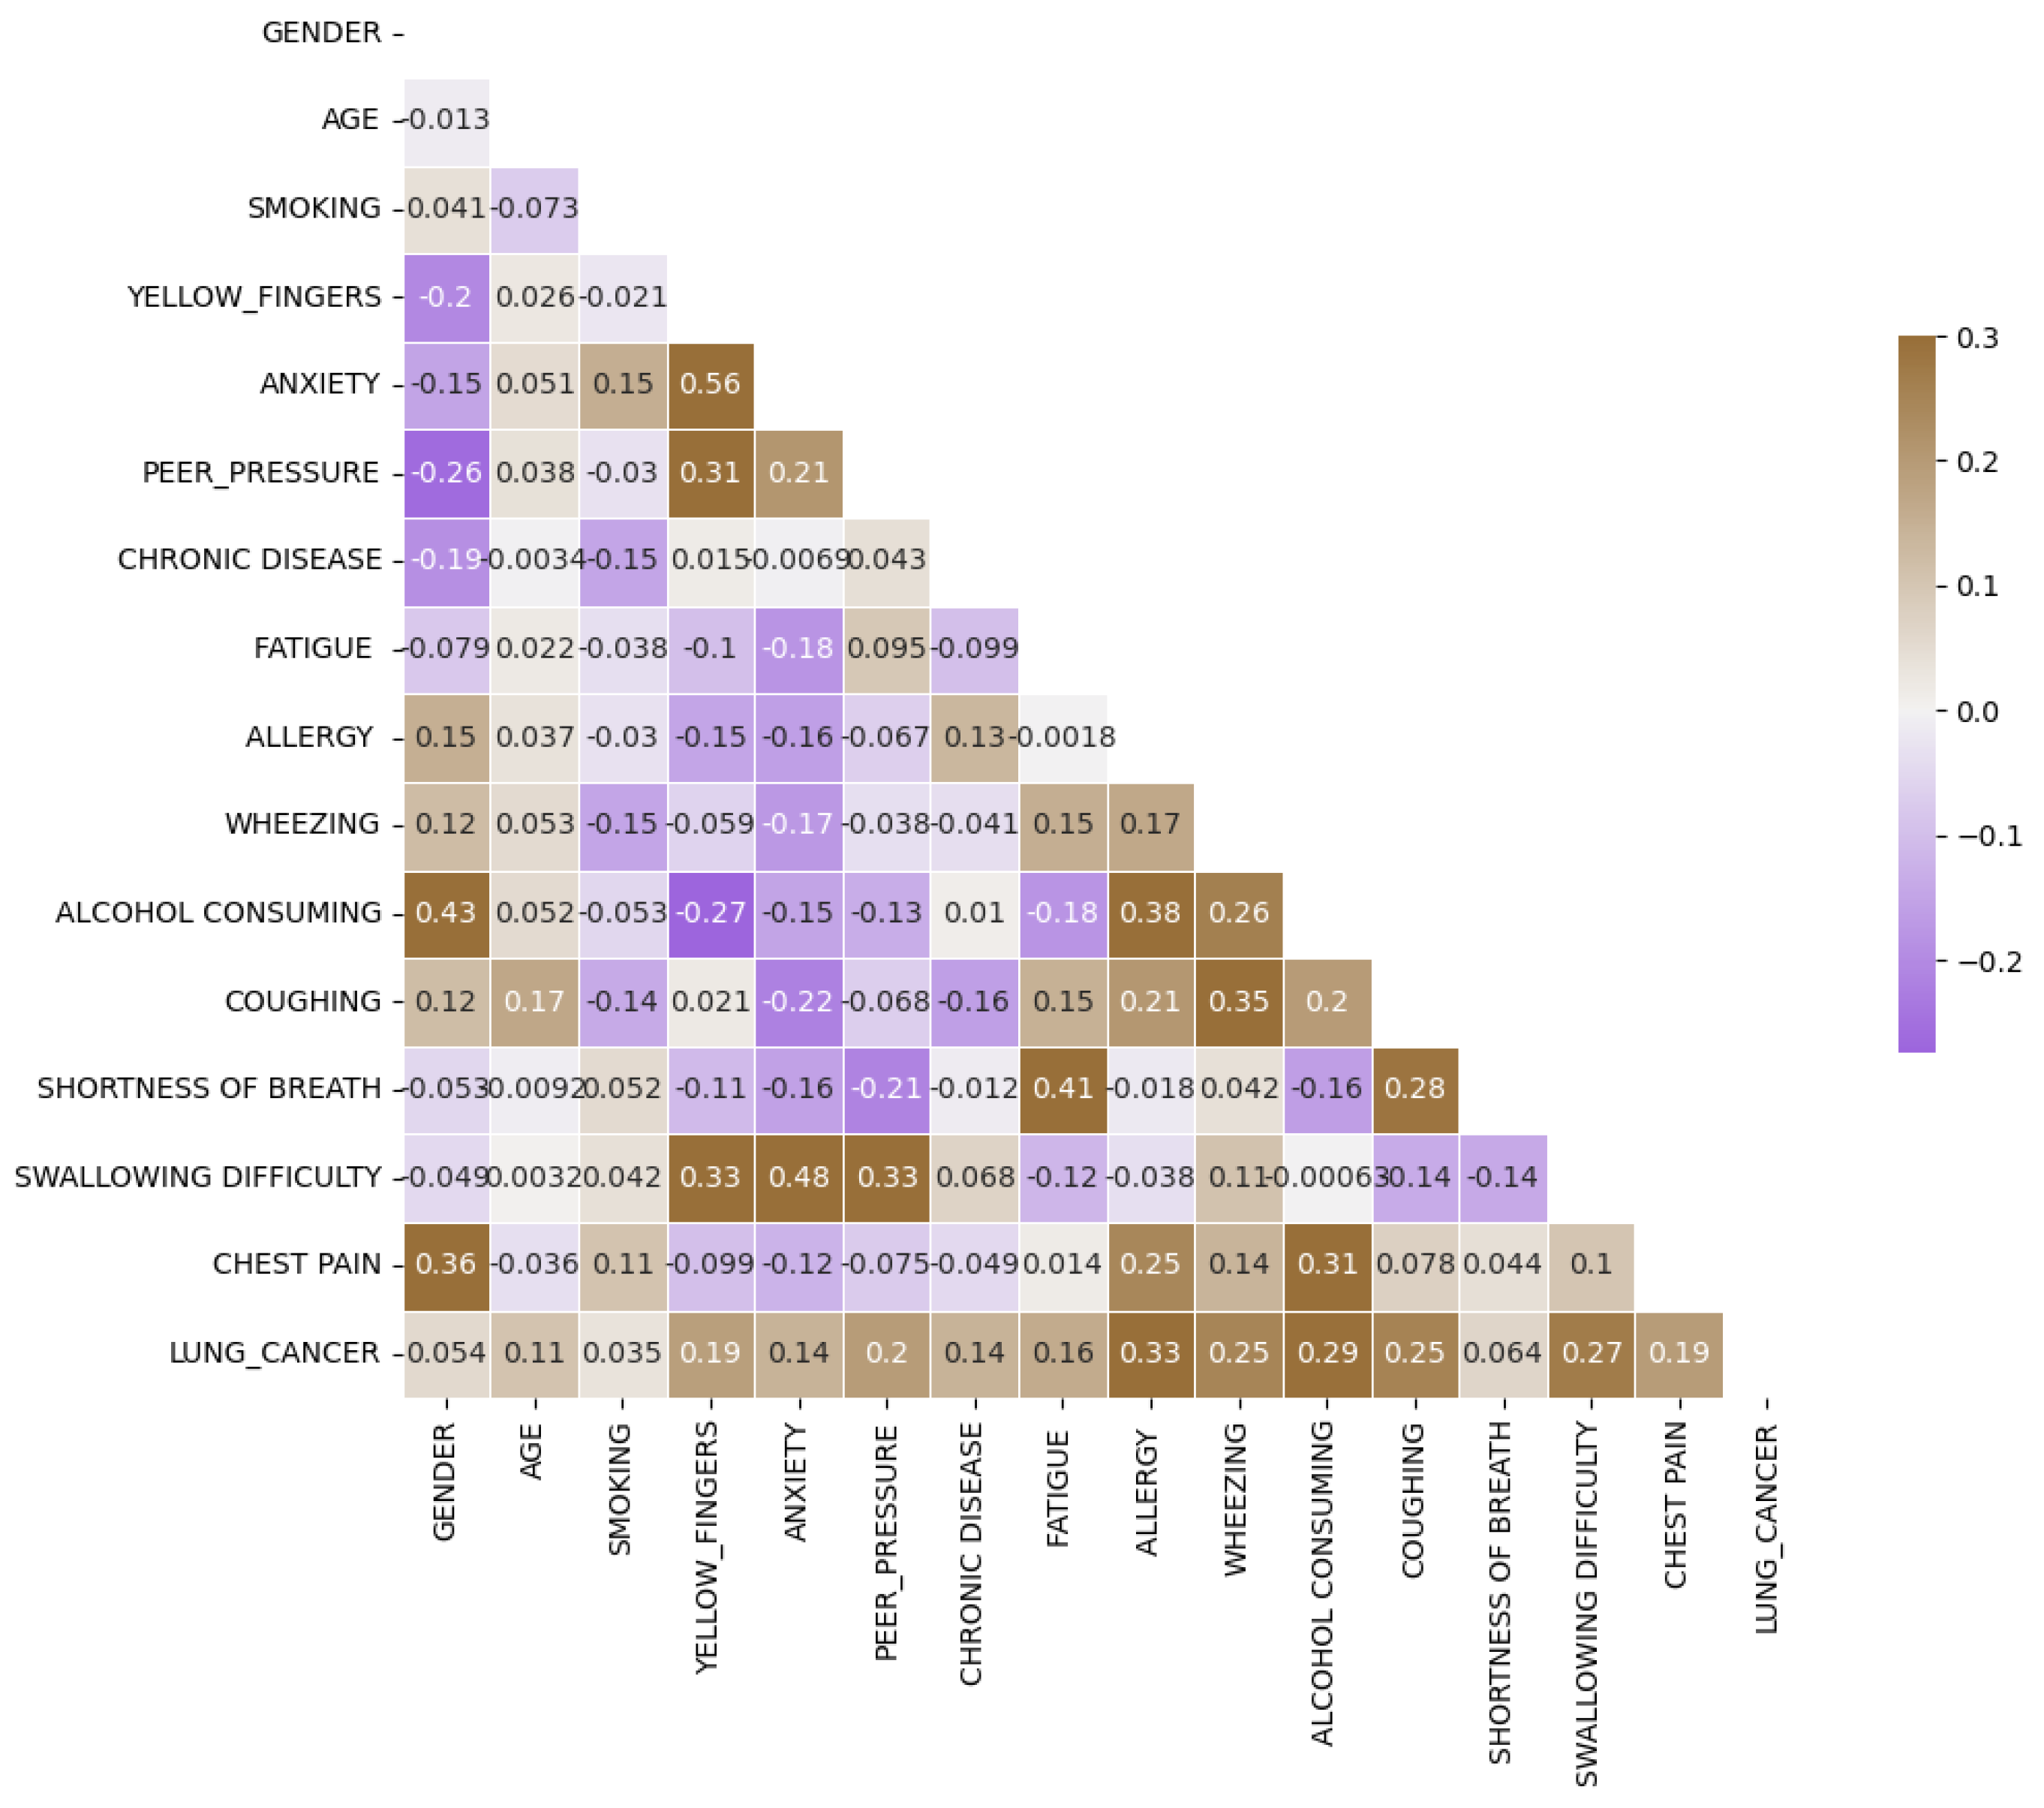
Figure 5.
Lung Cancer Correlation Bigger than 0.4.
Data Splitting
During the data splitting phase, our dataset is divided into two portions: 385 samples are allocated for training, while 97 samples are set aside for testing purposes, as shown in Figure 6.
To tackle potential class imbalance issues within the training set, we employ the Adaptive Synthetic Sampling (ADASYN) technique. ADASYN is an oversampling method tailored for imbalanced datasets. Unlike traditional oversampling methods that merely duplicate minority class instances, ADASYN focuses on areas of low class density and generates synthetic samples for the minority class. By doing so, it aims to rebalance the dataset while minimizing the risk of overfitting. ADASYN achieves this by identifying minority class samples that are challenging to classify accurately and generating synthetic counterparts along the line segments connecting these samples to their nearest neighbors. This process effectively augments the representation of the minority class, enhancing the model's ability to learn from the data. After applying ADASYN, the training dataset is restructured to ensure a more equitable distribution of both classes, thus facilitating improved model training.
To mitigate the risk of overfitting and ensure the model generalizes well to unseen data, we employ k-fold cross-validation with k set to 5. In this technique, the dataset is divided into k equal folds. The model is then trained and evaluated k times, where each iteration utilizes a different fold for validation and the remaining folds for training. This approach provides a more robust assessment of the model's performance by evaluating it on various subsets of the data. Consequently, k-fold cross-validation helps prevent the model from overfitting to any specific subset and provides a more reliable estimate of how well it will perform on new data.
ML Models
In our study, we employed a diverse range of machine learning (ML) models to tackle the classification task at hand. Each model offers unique characteristics and approaches to classification, contributing to the overall effectiveness of our analysis.
Deep Neural Networks (DNN)
Deep Neural Networks (DNNs) represent a powerful category of artificial neural networks distinguished by their multi-layered architecture. Unlike simpler models, DNNs possess multiple hidden layers stacked between the input and output layers. This deep architecture empowers them to excel at capturing intricate patterns and relationships hidden within data. This makes them particularly well-suited for tasks involving high-dimensional input data, such as images, audio, and text. Through this deep learning approach, DNNs can automatically learn hierarchical representations of features. This allows them to effectively discriminate between different classes within the dataset, ultimately leading to improved classification performance.
Voting Classifier
The Voting Classifier combines the predictions from multiple individual classifiers to make a final prediction. It aggregates the decisions of each classifier and selects the class with the most votes as the predicted class. This ensemble approach often leads to improved performance compared to individual classifiers by leveraging the diverse perspectives of multiple models.
Bagging (Bootstrap Aggregating)
Bagging, an ensemble learning technique, tackles overfitting and reduces variance by introducing an element of randomness during training. This method involves training multiple copies of the same base classifier, each on a different subset (with replacement) of the original training data. The final prediction is then made by aggregating (often averaging) the predictions from all individual classifiers. This process promotes model diversity, leading to a more robust model that generalizes better to unseen data.
Support Vector Machine (SVM) with Radial Basis Function (RBF) Kernel (SVC_rbf)
SVMs are powerful supervised learning models used for classification tasks. The RBF kernel is a popular choice for SVM classification due to its ability to capture complex nonlinear relationships between features. SVMs aim to find the hyperplane that best separates the classes in the feature space, maximizing the margin between different classes while minimizing classification errors.
Support Vector Machine (SVM) with Linear Kernel (SVC_linear)
The linear kernel is another variant of SVM that assumes the input data is linearly separable. It works by finding the optimal linear boundary (hyperplane) that separates the classes in the feature space. Despite its simplicity, linear SVMs can perform well on many classification tasks, especially when the data is linearly separable or when the feature space is high-dimensional.
Support Vector Machine (SVM) with Polynomial Kernel (SVC_polynomial)
The polynomial kernel is used in SVMs to handle nonlinear relationships between features by mapping the input data into a higher-dimensional space. This allows SVMs to capture more complex decision boundaries compared to linear SVMs. However, selecting an appropriate degree for the polynomial kernel is crucial to prevent overfitting.
Support Vector Machine (SVM) with Sigmoid Kernel (SVC_sigmoid)
The sigmoid kernel is another option for SVM classification, particularly suitable for binary classification tasks. It operates similarly to logistic regression and can model nonlinear decision boundaries. However, SVMs with sigmoid kernels may be more sensitive to hyperparameter settings and prone to overfitting, requiring careful tuning for optimal performance.
Results and Discussion
In this section, we embark on an in-depth exploration of the performance exhibited by various machine learning (ML) models concerning their hyperparameters, notably the minimum child weight and learning rate. These parameters play a pivotal role in addressing overfitting and underfitting challenges inherent in ML models. Through a meticulous comparative analysis across multiple ML algorithms, we aim to elucidate their behavior under diverse hyperparameter settings.
Commencing our analysis with XGBoost, as depicted in Figure 7, we observed a noteworthy reduction in overfitting tendencies upon monitoring the training and validation plots while modulating the minimum child weight and learning rate. Through strategic convergence of these plots, we achieved a commendable accuracy, precision, recall, and F-1 score metrics, culminating in an impressive performance level of 94.84%. Particularly noteworthy is the discernible improvement observed in the confusion matrix plot on unseen datasets, where we attained a prediction accuracy of 96% for patients diagnosed with lung cancer and 94% for non-cancer cases, as illustrated in Figure 15.
These findings underscore the effectiveness of parameter optimization in enhancing the predictive capabilities of ML models, thereby facilitating more accurate and reliable classification outcomes. Moreover, they highlight the potential of XGBoost as a robust tool for lung cancer diagnosis, capable of delivering clinically relevant insights with high precision and reliability.
Figure 7.
Training and Validation plots under consideration of Min child Weight and Learning Rate in XGBoost.
Figure 7.
Training and Validation plots under consideration of Min child Weight and Learning Rate in XGBoost.
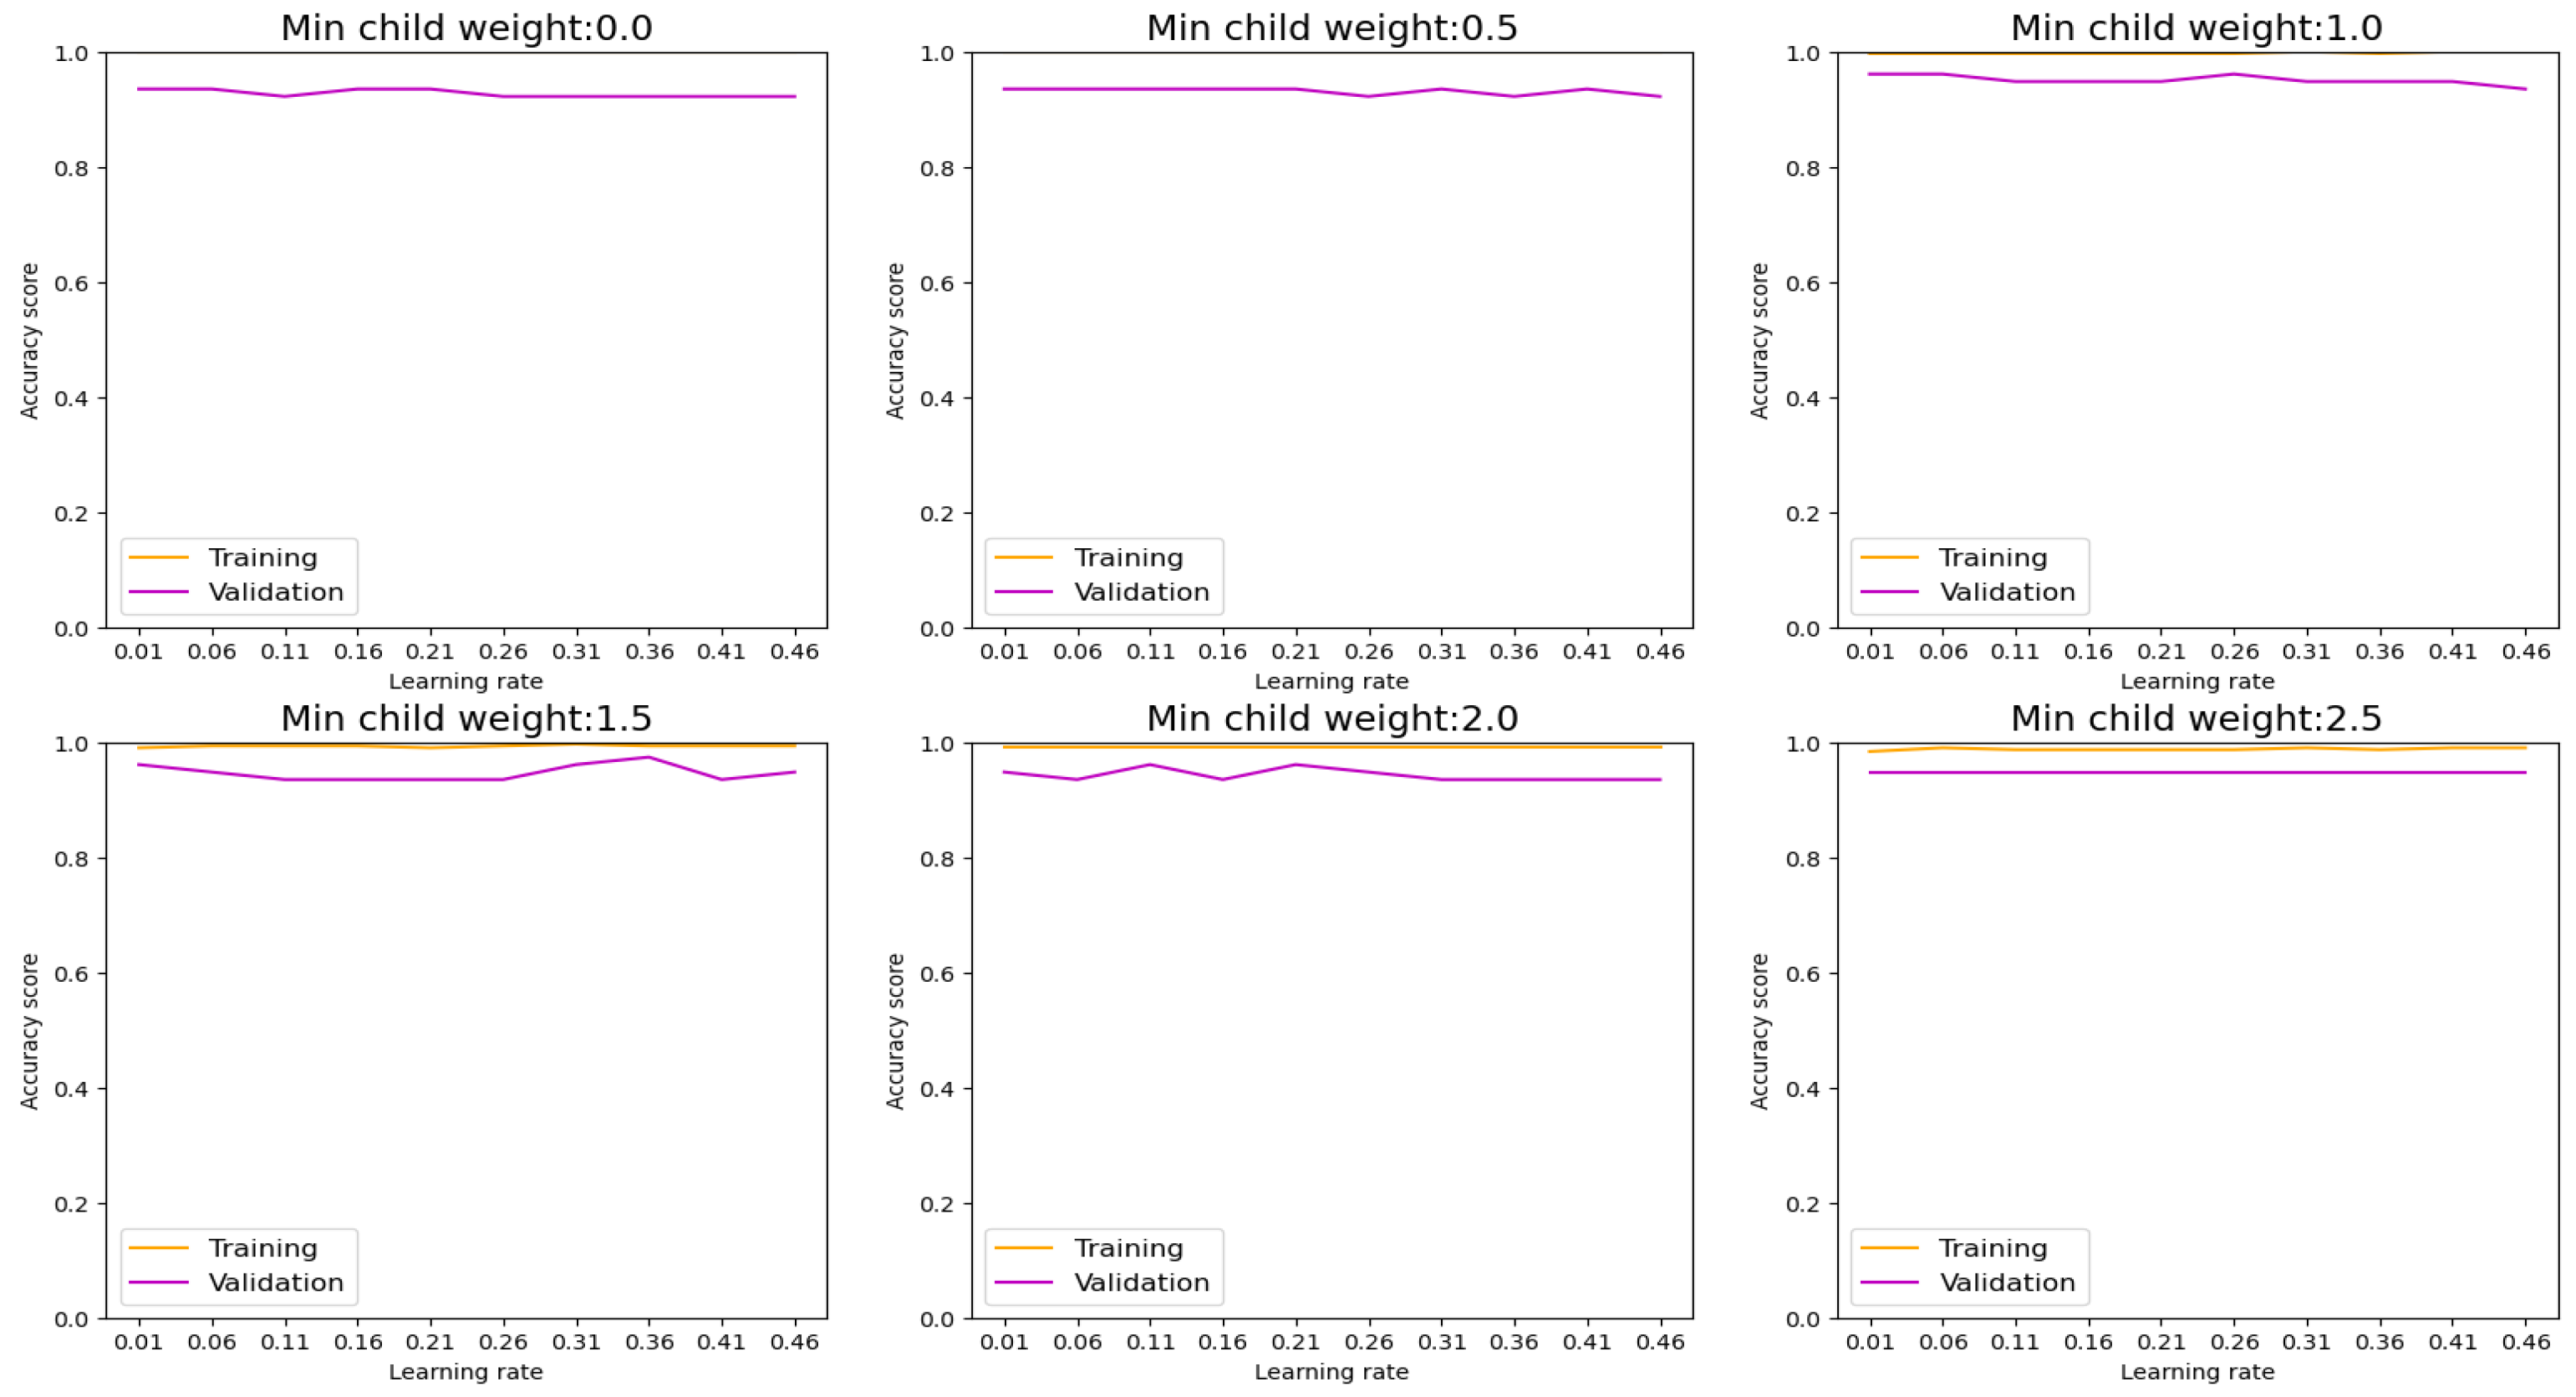
Figure 8.
Training and Validation plots under consideration of Min child Weight and Learning Rate in LGBM.
Figure 8.
Training and Validation plots under consideration of Min child Weight and Learning Rate in LGBM.
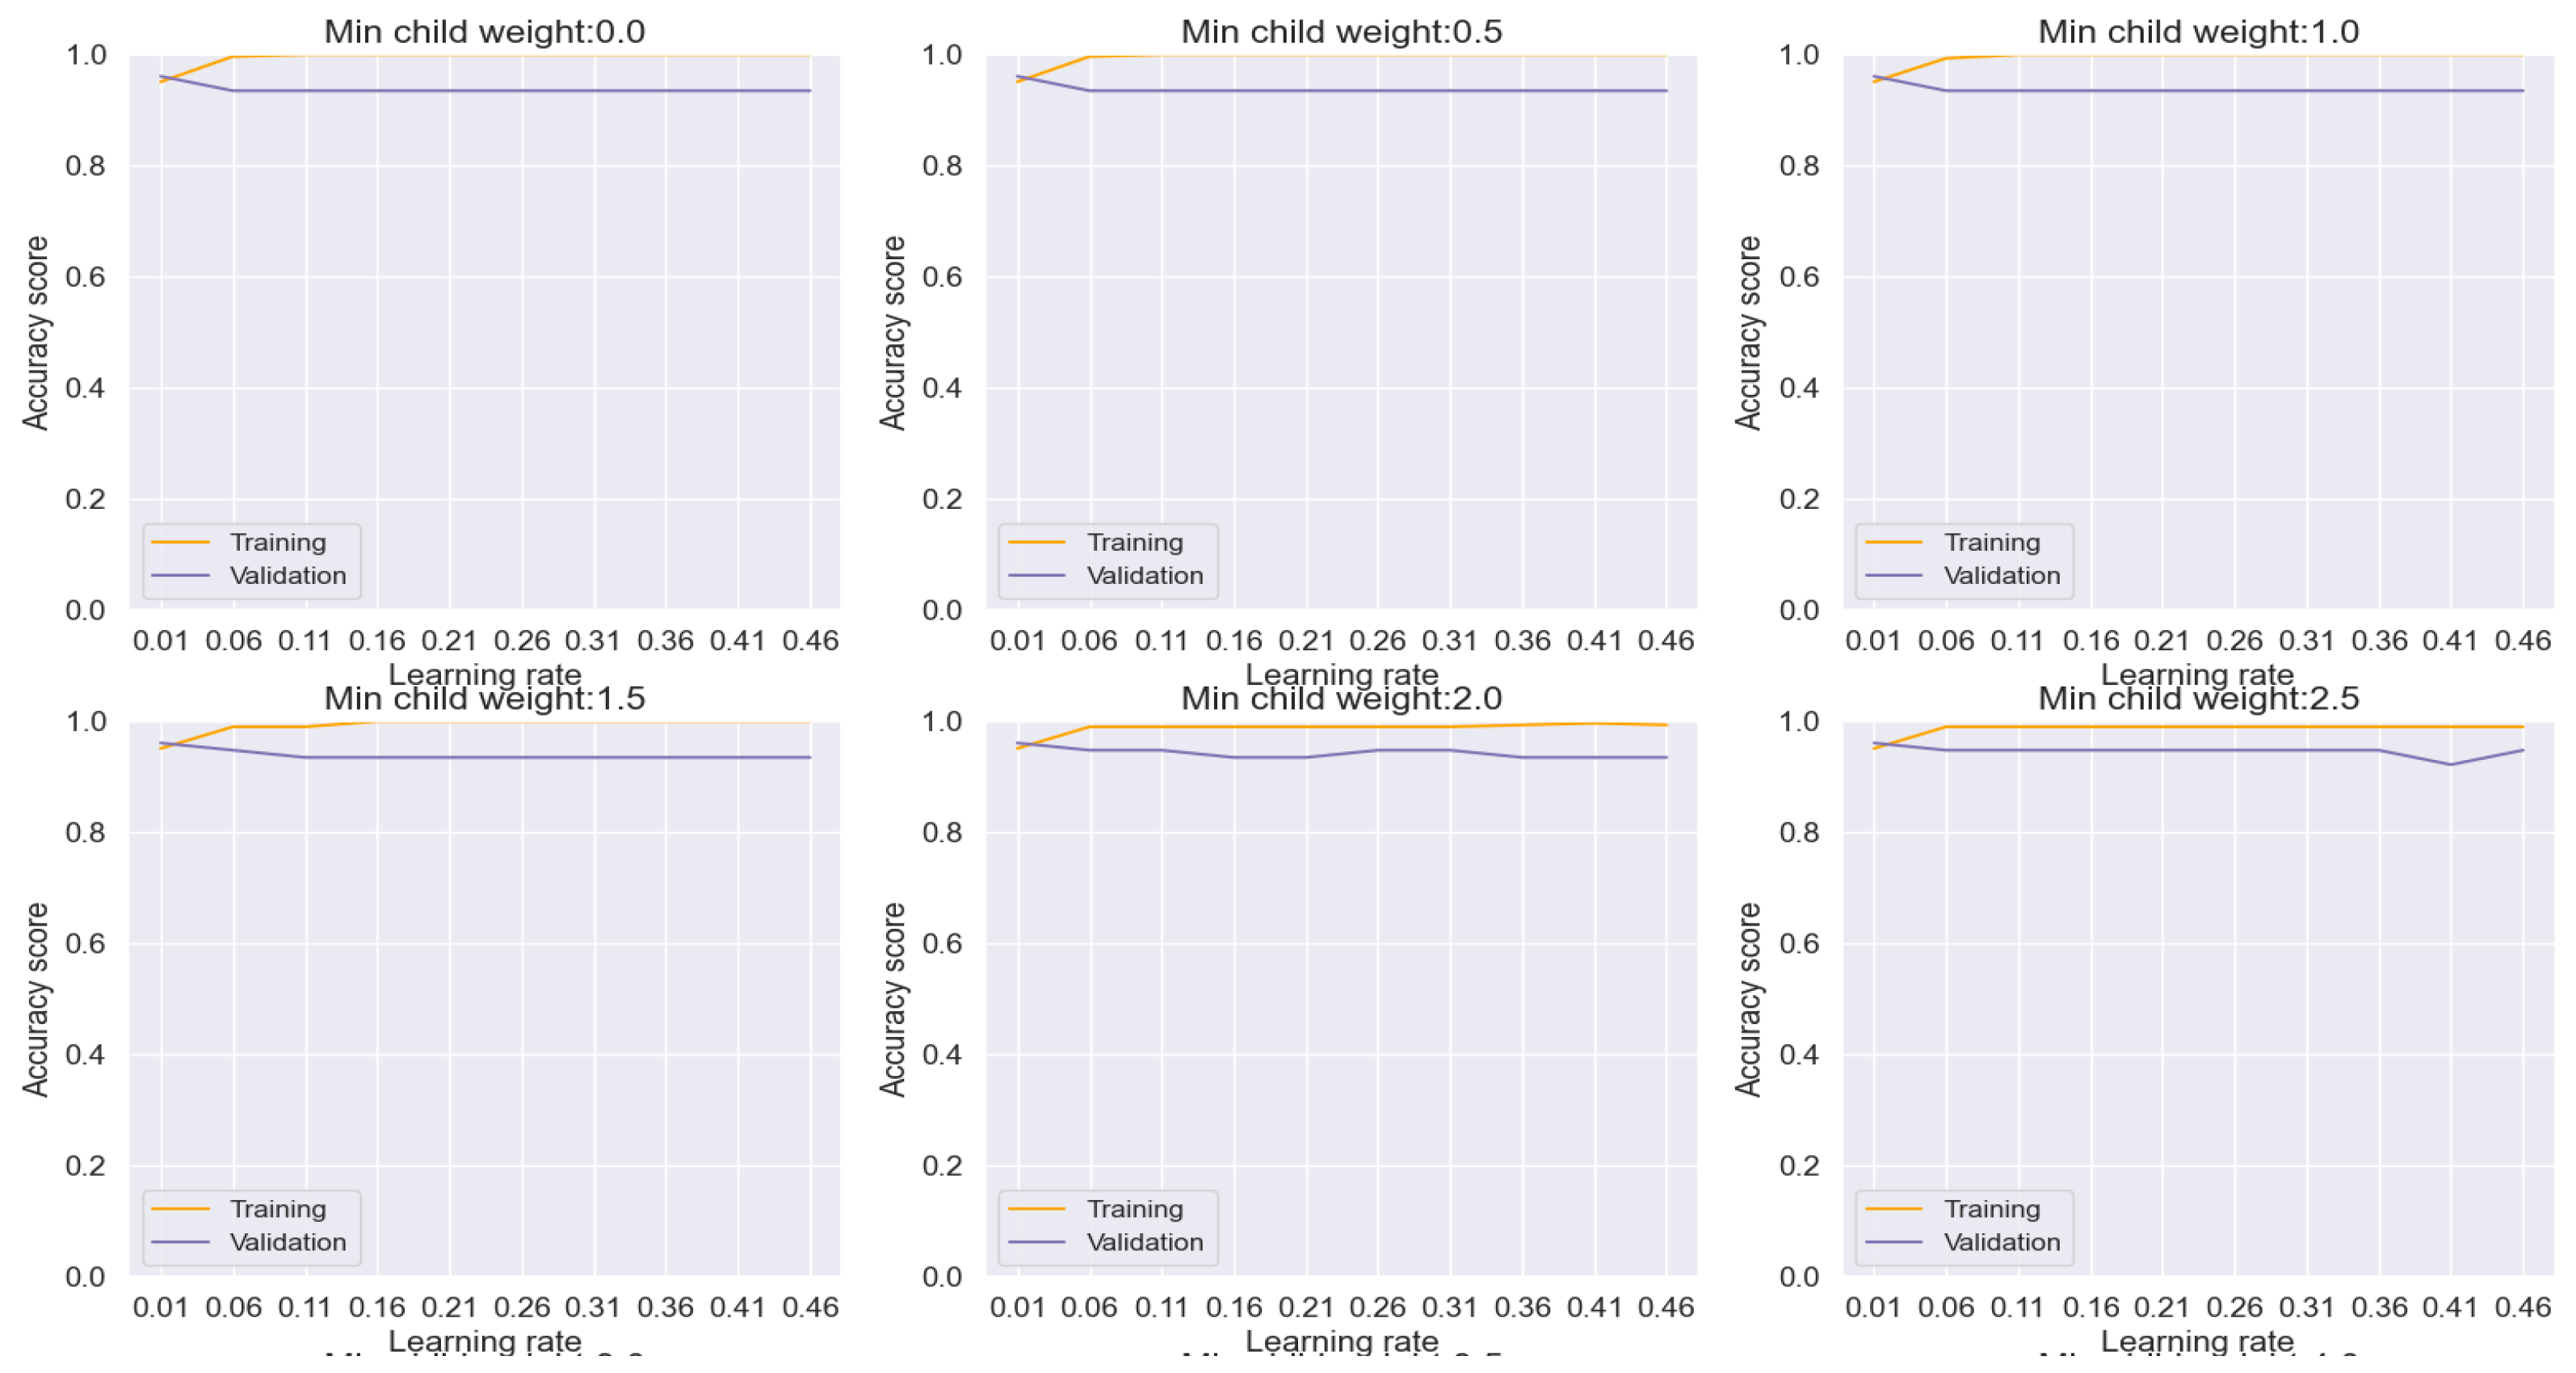
AdaBoost emerges as a potent solution for mitigating overfitting concerns, as evidenced by our analysis depicted in Figure 9. Through meticulous adjustment of hyperparameters, we effectively curtailed overfitting tendencies, thereby achieving commendable accuracy, precision, recall, and F-1 score metrics, culminating in an impressive overall performance rate of 95.87%. Notably, the ensuing evaluation via the confusion matrix plot revealed an outstanding prediction accuracy of 96% for both lung cancer and non-cancer cases, as delineated in Figure 15.
Similarly, our exploration of Logistic Regression, depicted in Figure 10, yielded results akin to the AdaBoost model. Although exhibiting slightly lower performance metrics, Logistic Regression still showcased notable accuracy, precision, recall, and F-1 score rates, reaching an overall performance level of 89.69%, as illustrated in Figure 15.
AdaBoost and Logistic Regression emerge as strong contenders for lung cancer classification. Through meticulous hyperparameter tuning and effective overfitting mitigation strategies, these models demonstrate promising capabilities for accurate and reliable diagnosis. Furthermore, the consistency observed in their performance, as evidenced by the informative confusion matrix plots, strengthens their case as valuable tools for clinical decision-making.
Figure 9.
Training and Validation plots under consideration of Min child Weight and Learning Rate in AdaBoost.
Figure 9.
Training and Validation plots under consideration of Min child Weight and Learning Rate in AdaBoost.
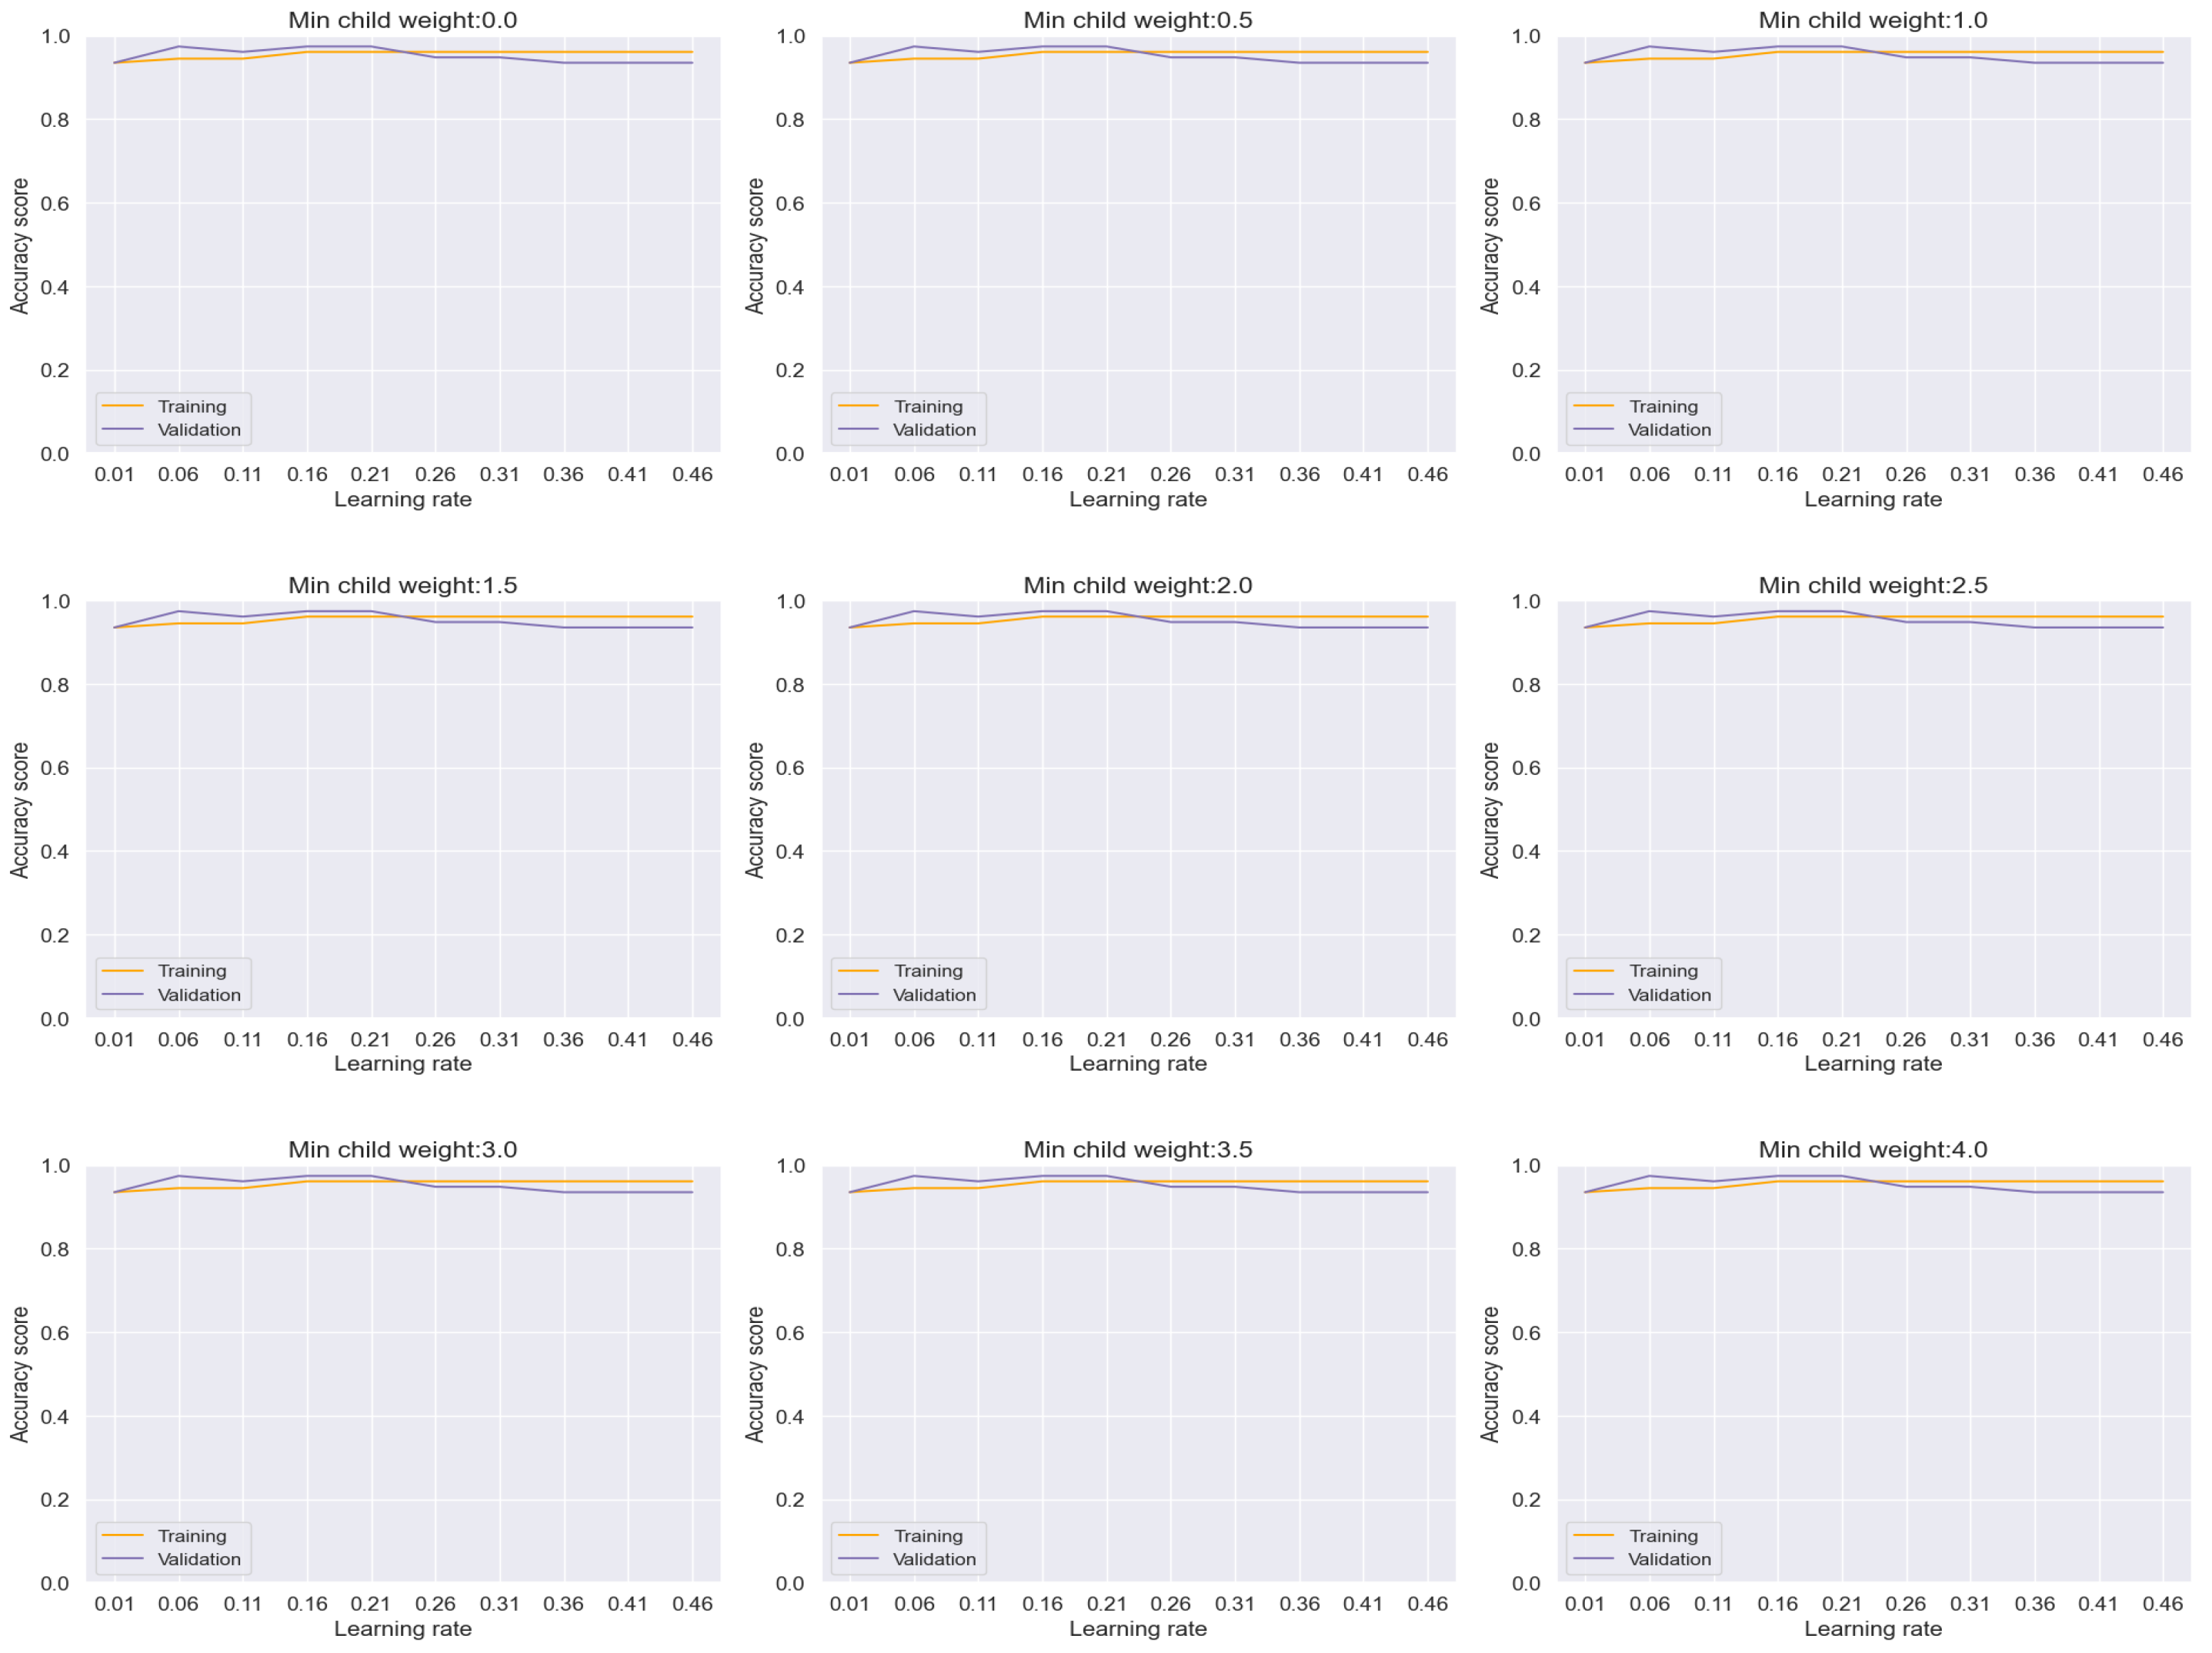
Figure 10.
Training and Validation plots under consideration of Min child Weight and Learning Rate in Logistic Regression.
Figure 10.
Training and Validation plots under consideration of Min child Weight and Learning Rate in Logistic Regression.
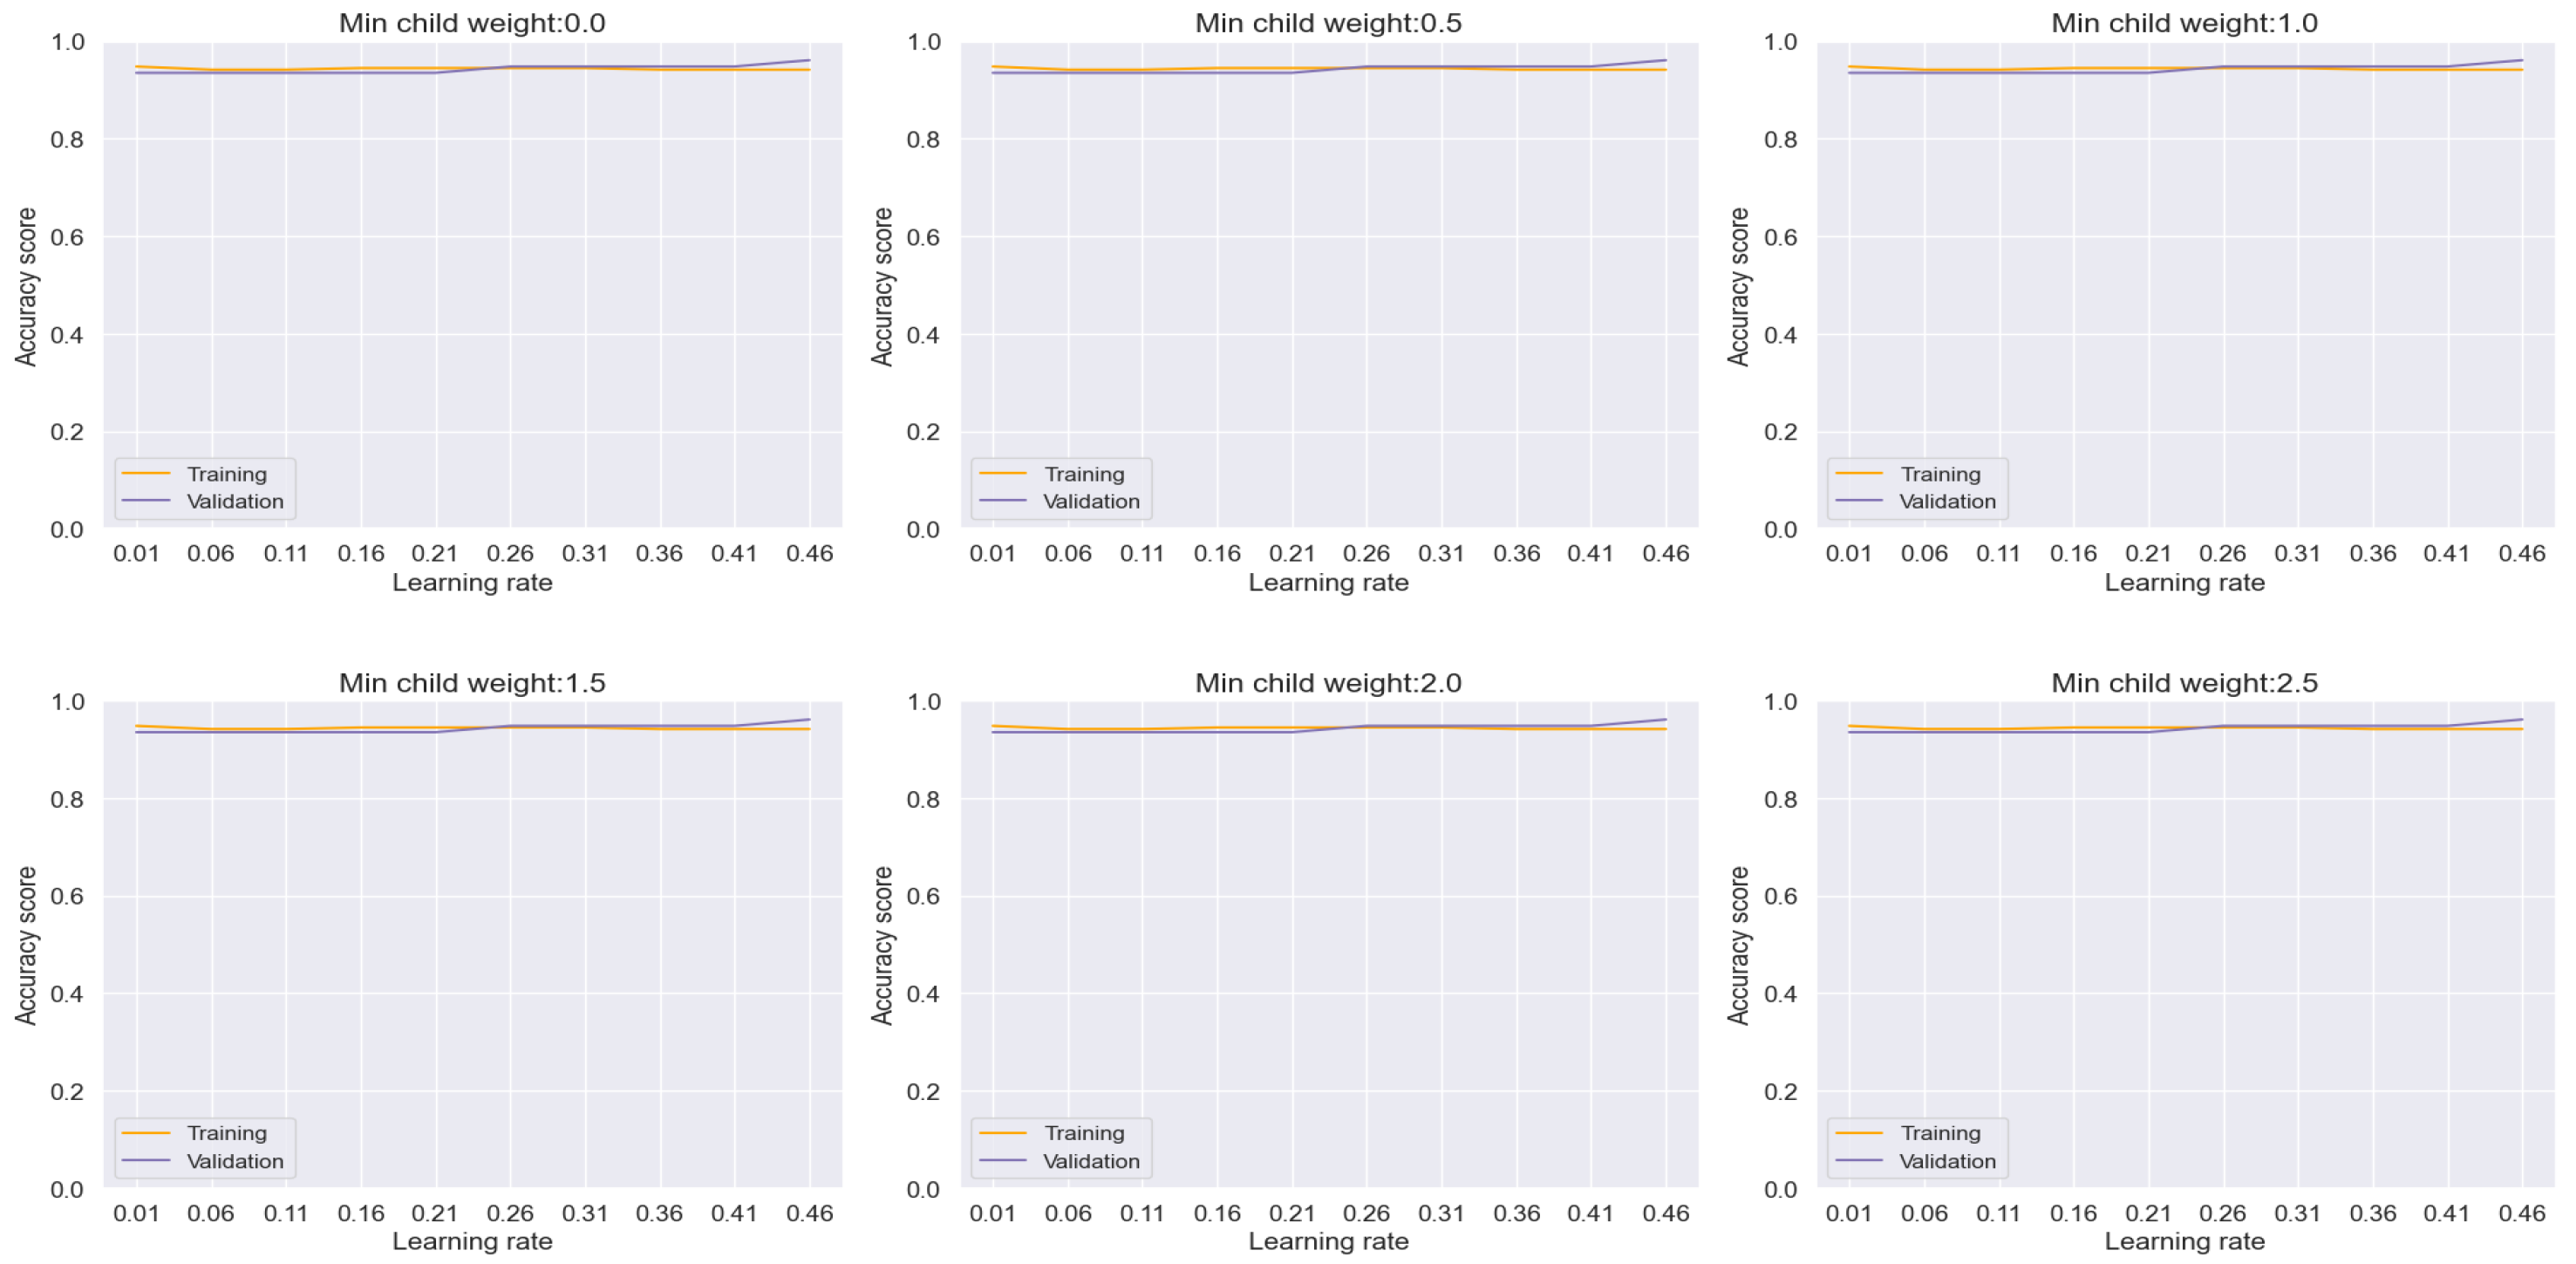
Further analysis encompassed the evaluation of additional machine learning models, including Decision Tree (Figure 11), Random Forest (Figure 12), CatBoost (Figure 13), and k-NN (Figure 14), each offering unique insights into their performance characteristics with regard to overfitting.
The Decision Tree model, as depicted in Figure 11, exhibited a stable performance, achieving an accuracy rate of approximately 92%. Notably, the absence of discernible overfitting signs between the training and validation sets, as evidenced by the smooth progression per epoch across the range of minimum child weight and learning rate, underscores its reliability in classification tasks.
Similarly, the Random Forest model, illustrated in Figure 12, showcased remarkable performance with an accuracy rate of approximately 97%. Importantly, the absence of any discernible overfitting between the training and validation sets across the range of minimum child weight and learning rate reaffirms its robustness and efficacy in achieving highly accurate classifications.
Figure 11.
Training and Validation plots under consideration of Min child Weight and Learning Rate in Decision Tree.
Figure 11.
Training and Validation plots under consideration of Min child Weight and Learning Rate in Decision Tree.
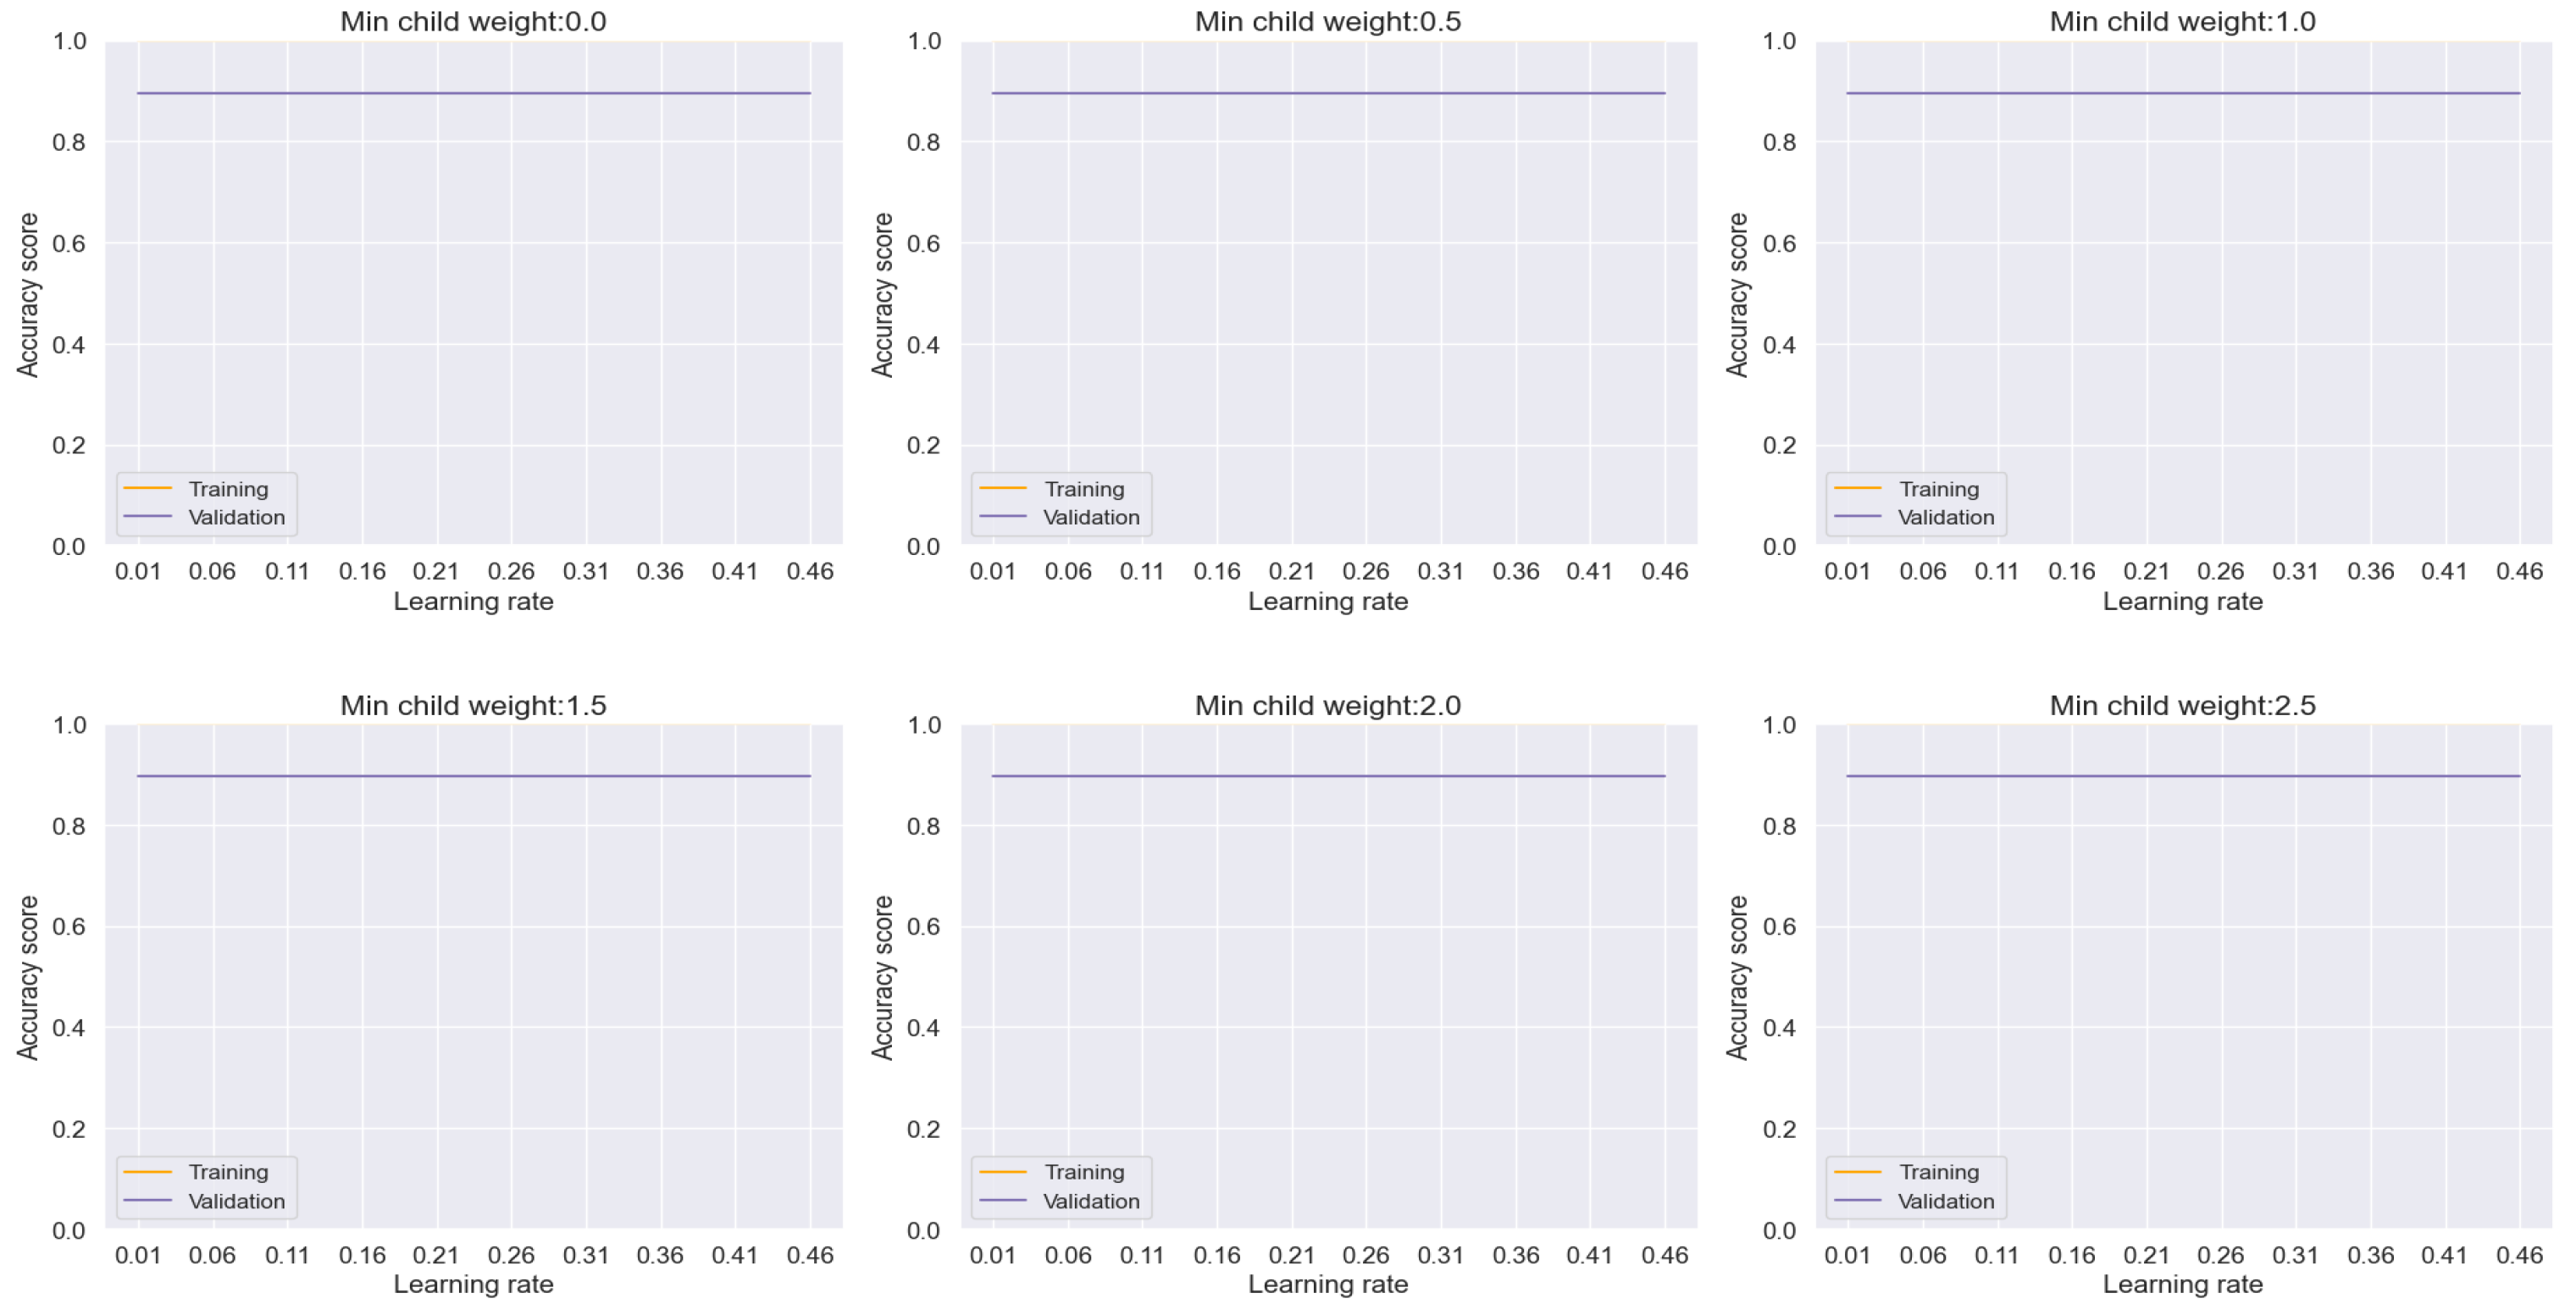
Figure 12.
Training and Validation plots under consideration of Min child Weight and Learning Rate in Random forest.
Figure 12.
Training and Validation plots under consideration of Min child Weight and Learning Rate in Random forest.

In the case of the CatBoost model, depicted in Figure 13, an accuracy rate of approximately 96% was attained, albeit with a slight gap observed between the training and validation sets per epoch, indicating minor overfitting tendencies. Despite this, the model demonstrates impressive performance and offers valuable insights into its adaptability to different hyperparameter settings.
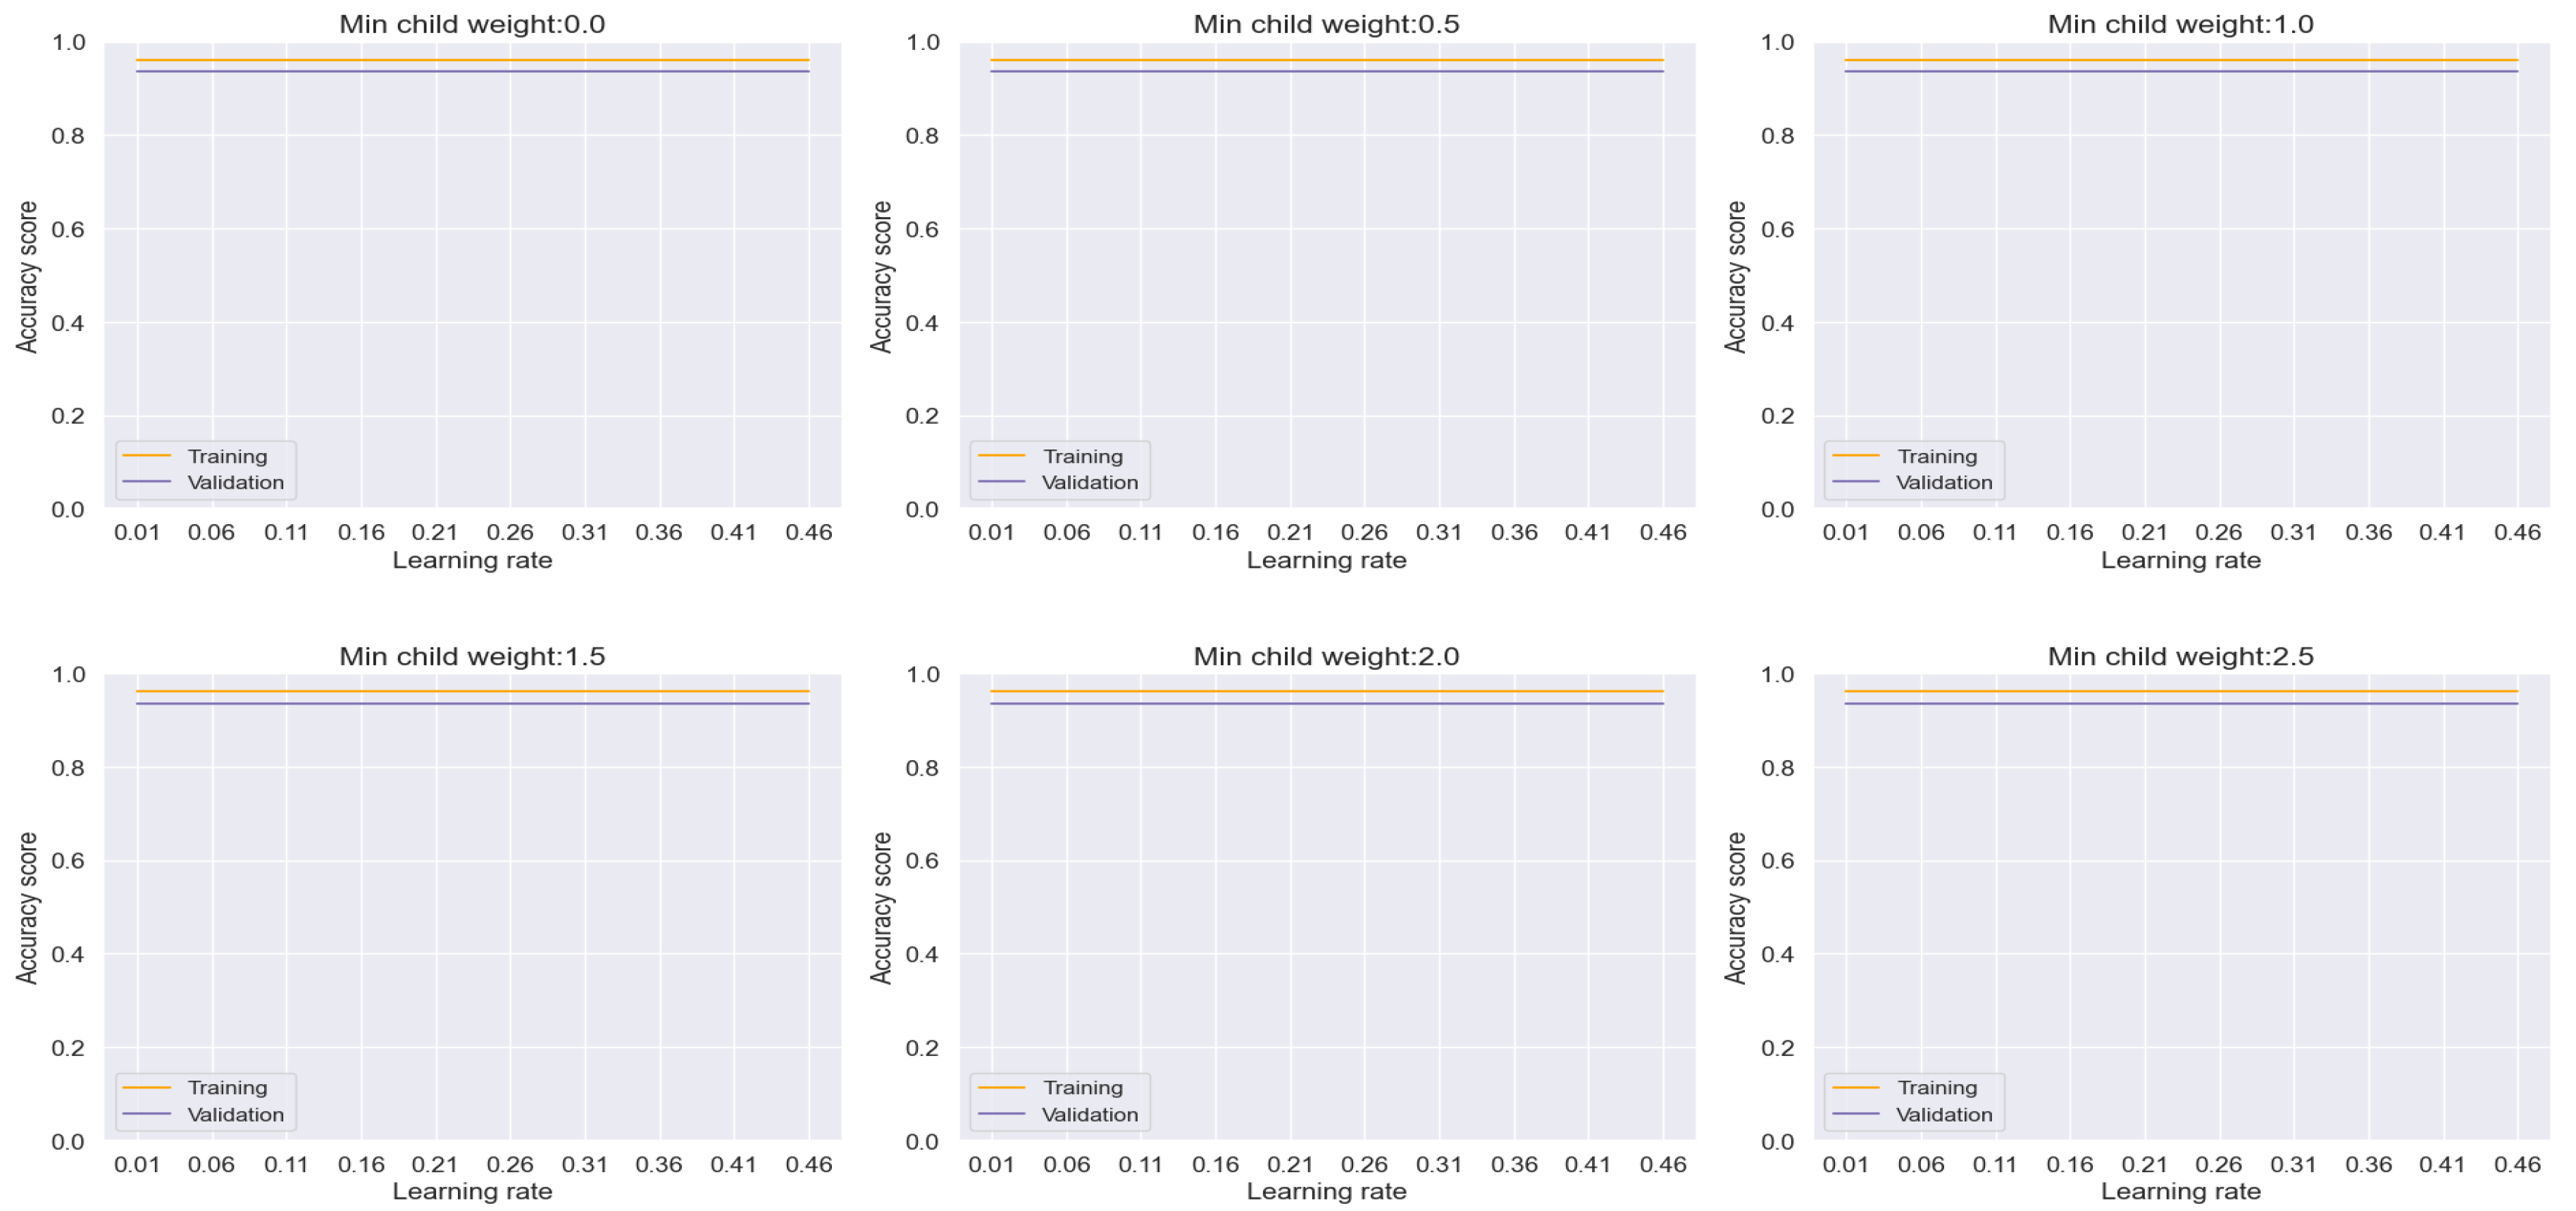
Lastly, the k-NN model, as shown in Figure 14, achieved an accuracy rate of 92% with a discernible but logical gap observed between the training and validation sets per epoch. This indicates a moderate level of overfitting, albeit within acceptable bounds.
Overall, the comprehensive analysis across these diverse machine learning models underscores their robustness and adaptability in handling variations in hyperparameters. The minimal fluctuations observed in overfitting across the range of learning rates and minimum child weights affirm the effectiveness of these models in achieving stable and reliable performance for lung cancer classification tasks.
Figure 13.
Training and Validation plots under consideration of Min child Weight and Learning Rate in CatBoost.
Figure 13.
Training and Validation plots under consideration of Min child Weight and Learning Rate in CatBoost.
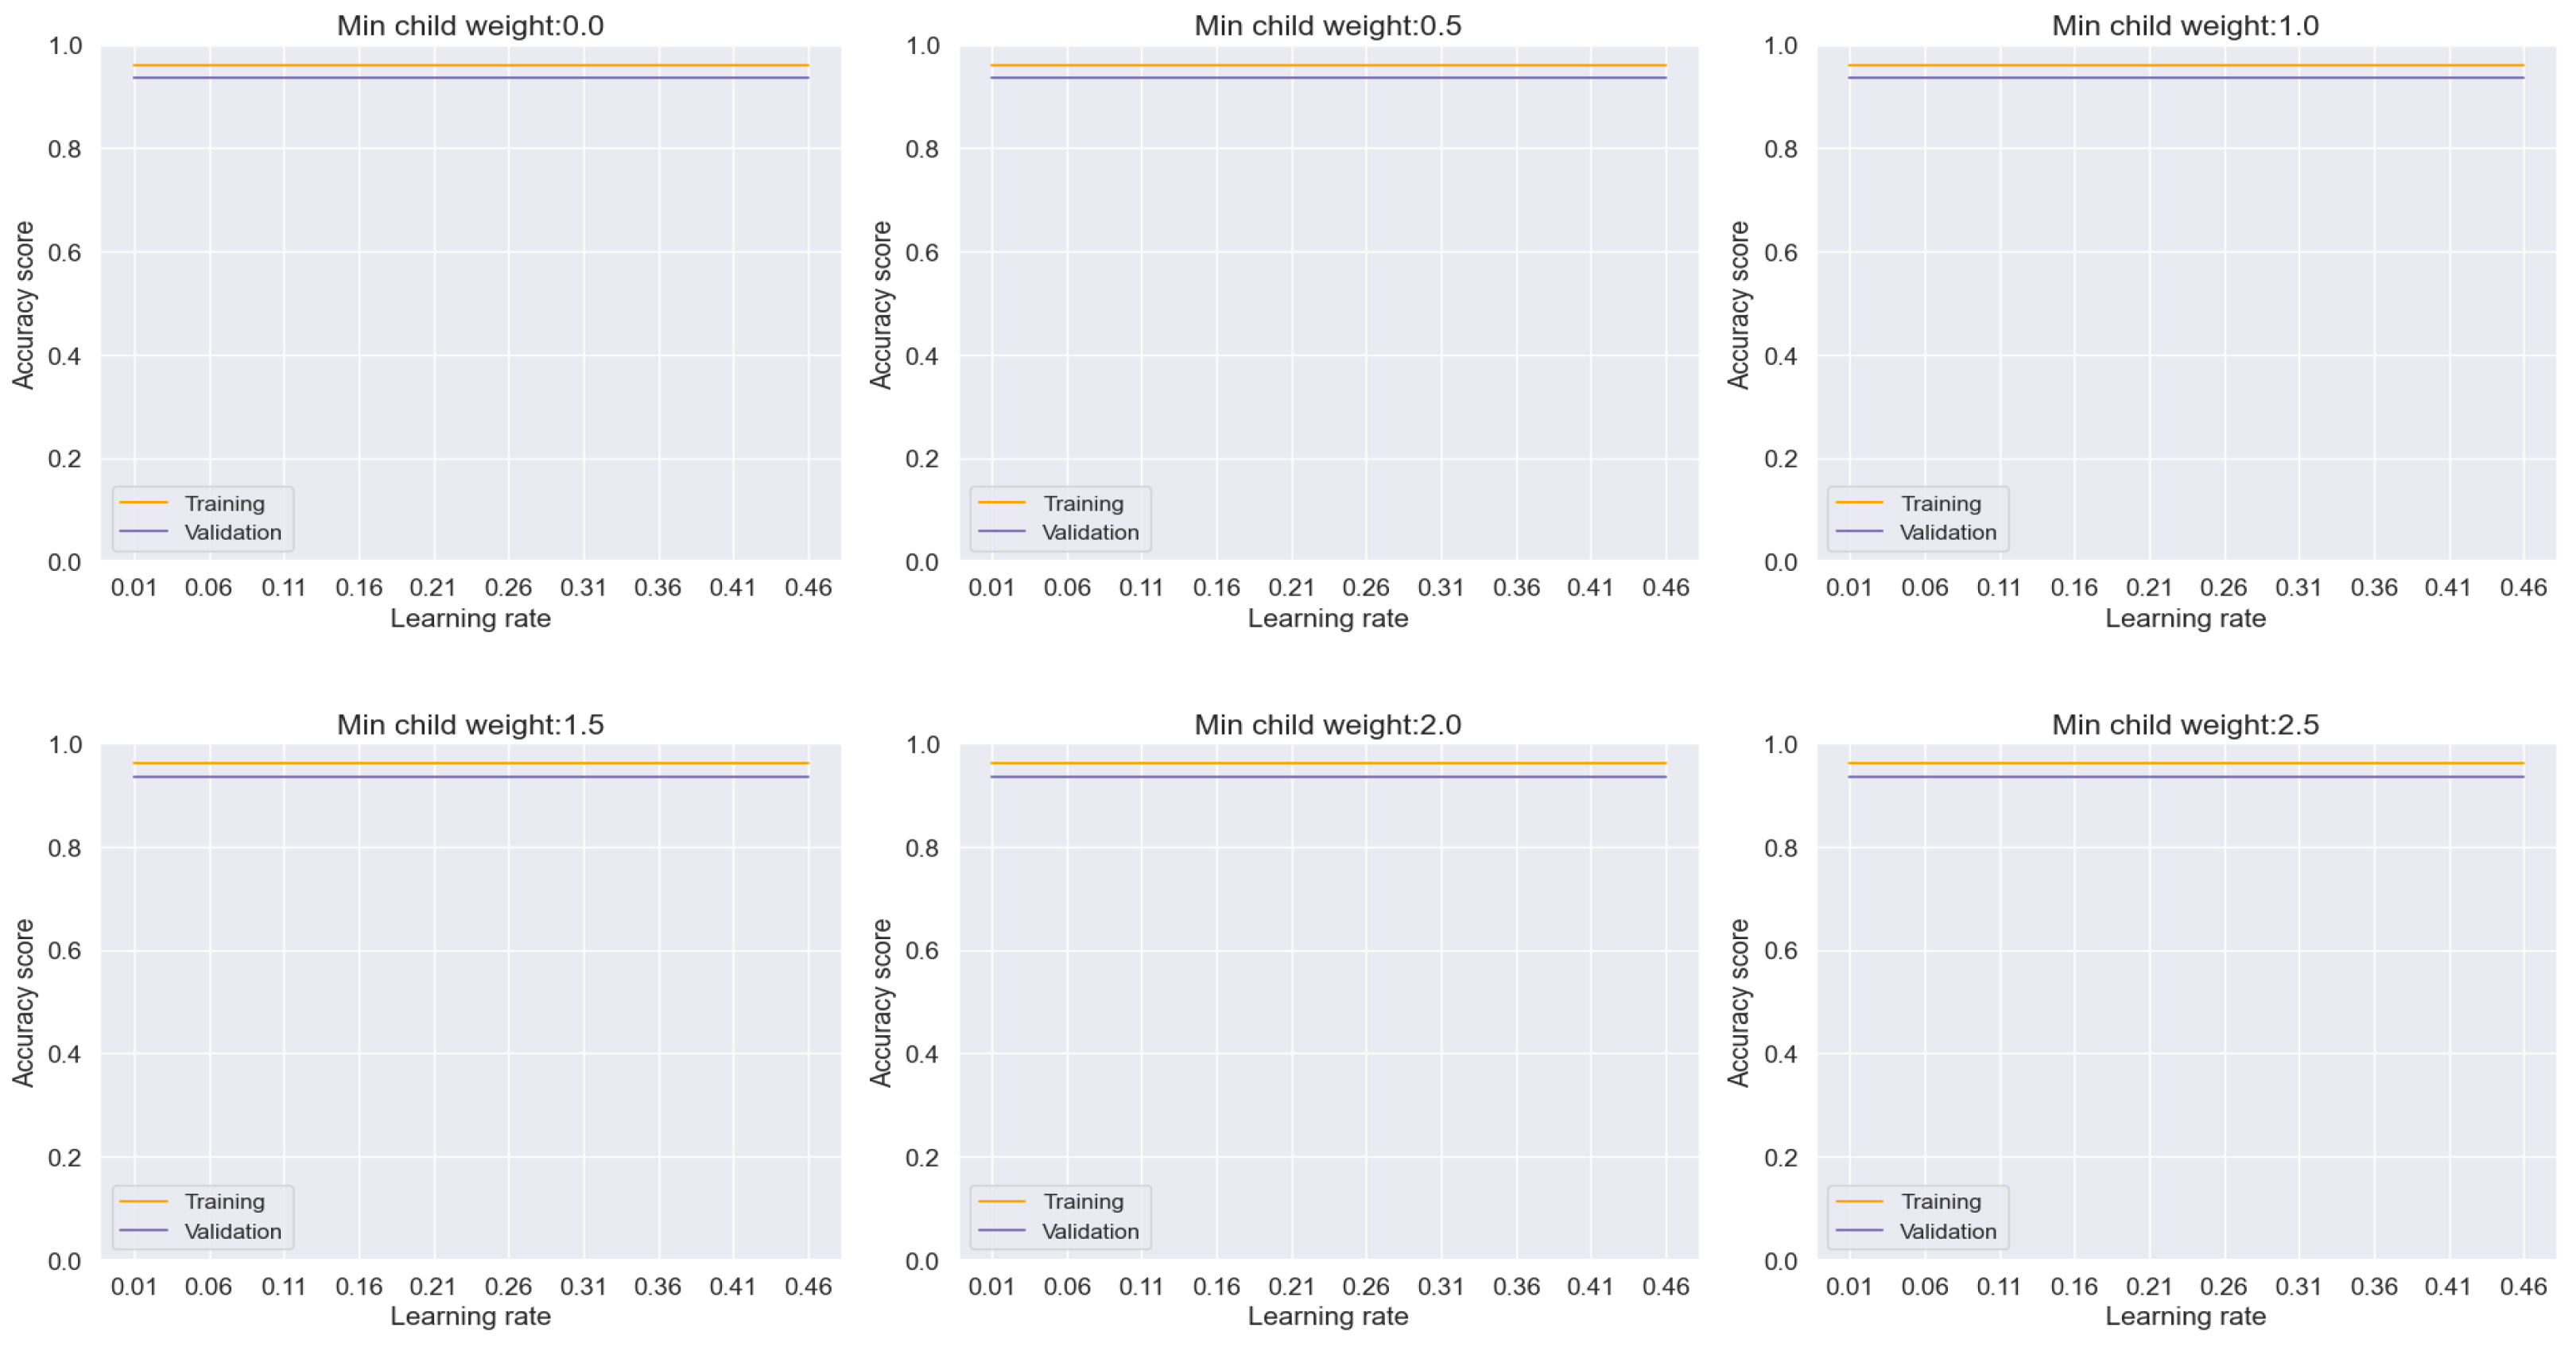
Figure 14.
Training and Validation plots under consideration of Min child Weight and Learning Rate in k-NN.
Figure 14.
Training and Validation plots under consideration of Min child Weight and Learning Rate in k-NN.
In the test analysis of datasets, as depicted in the confusion matrices presented in Figure 14 and Figure 15, the performance of various machine learning models in predicting actual datasets is elucidated through the observed errors. Specifically, for XGBoost, 5 errors were noted, while LGBM and AdaBoost exhibited 3 errors each. Logistic Regression, on the other hand, registered 10 errors, followed by Decision Tree with 8 errors, and Random Forest with 3 errors. CatBoost and KNN models demonstrated 4 and 8 errors, respectively. Notably, the DNN model showcased the lowest error count, with only 3 errors observed in prediction.
Figure 15.
Confusion Matrix of XGBoost, LGBM, AdaBoost, Logistic Regression, Decision Tree and Random Forest.
Figure 15.
Confusion Matrix of XGBoost, LGBM, AdaBoost, Logistic Regression, Decision Tree and Random Forest.
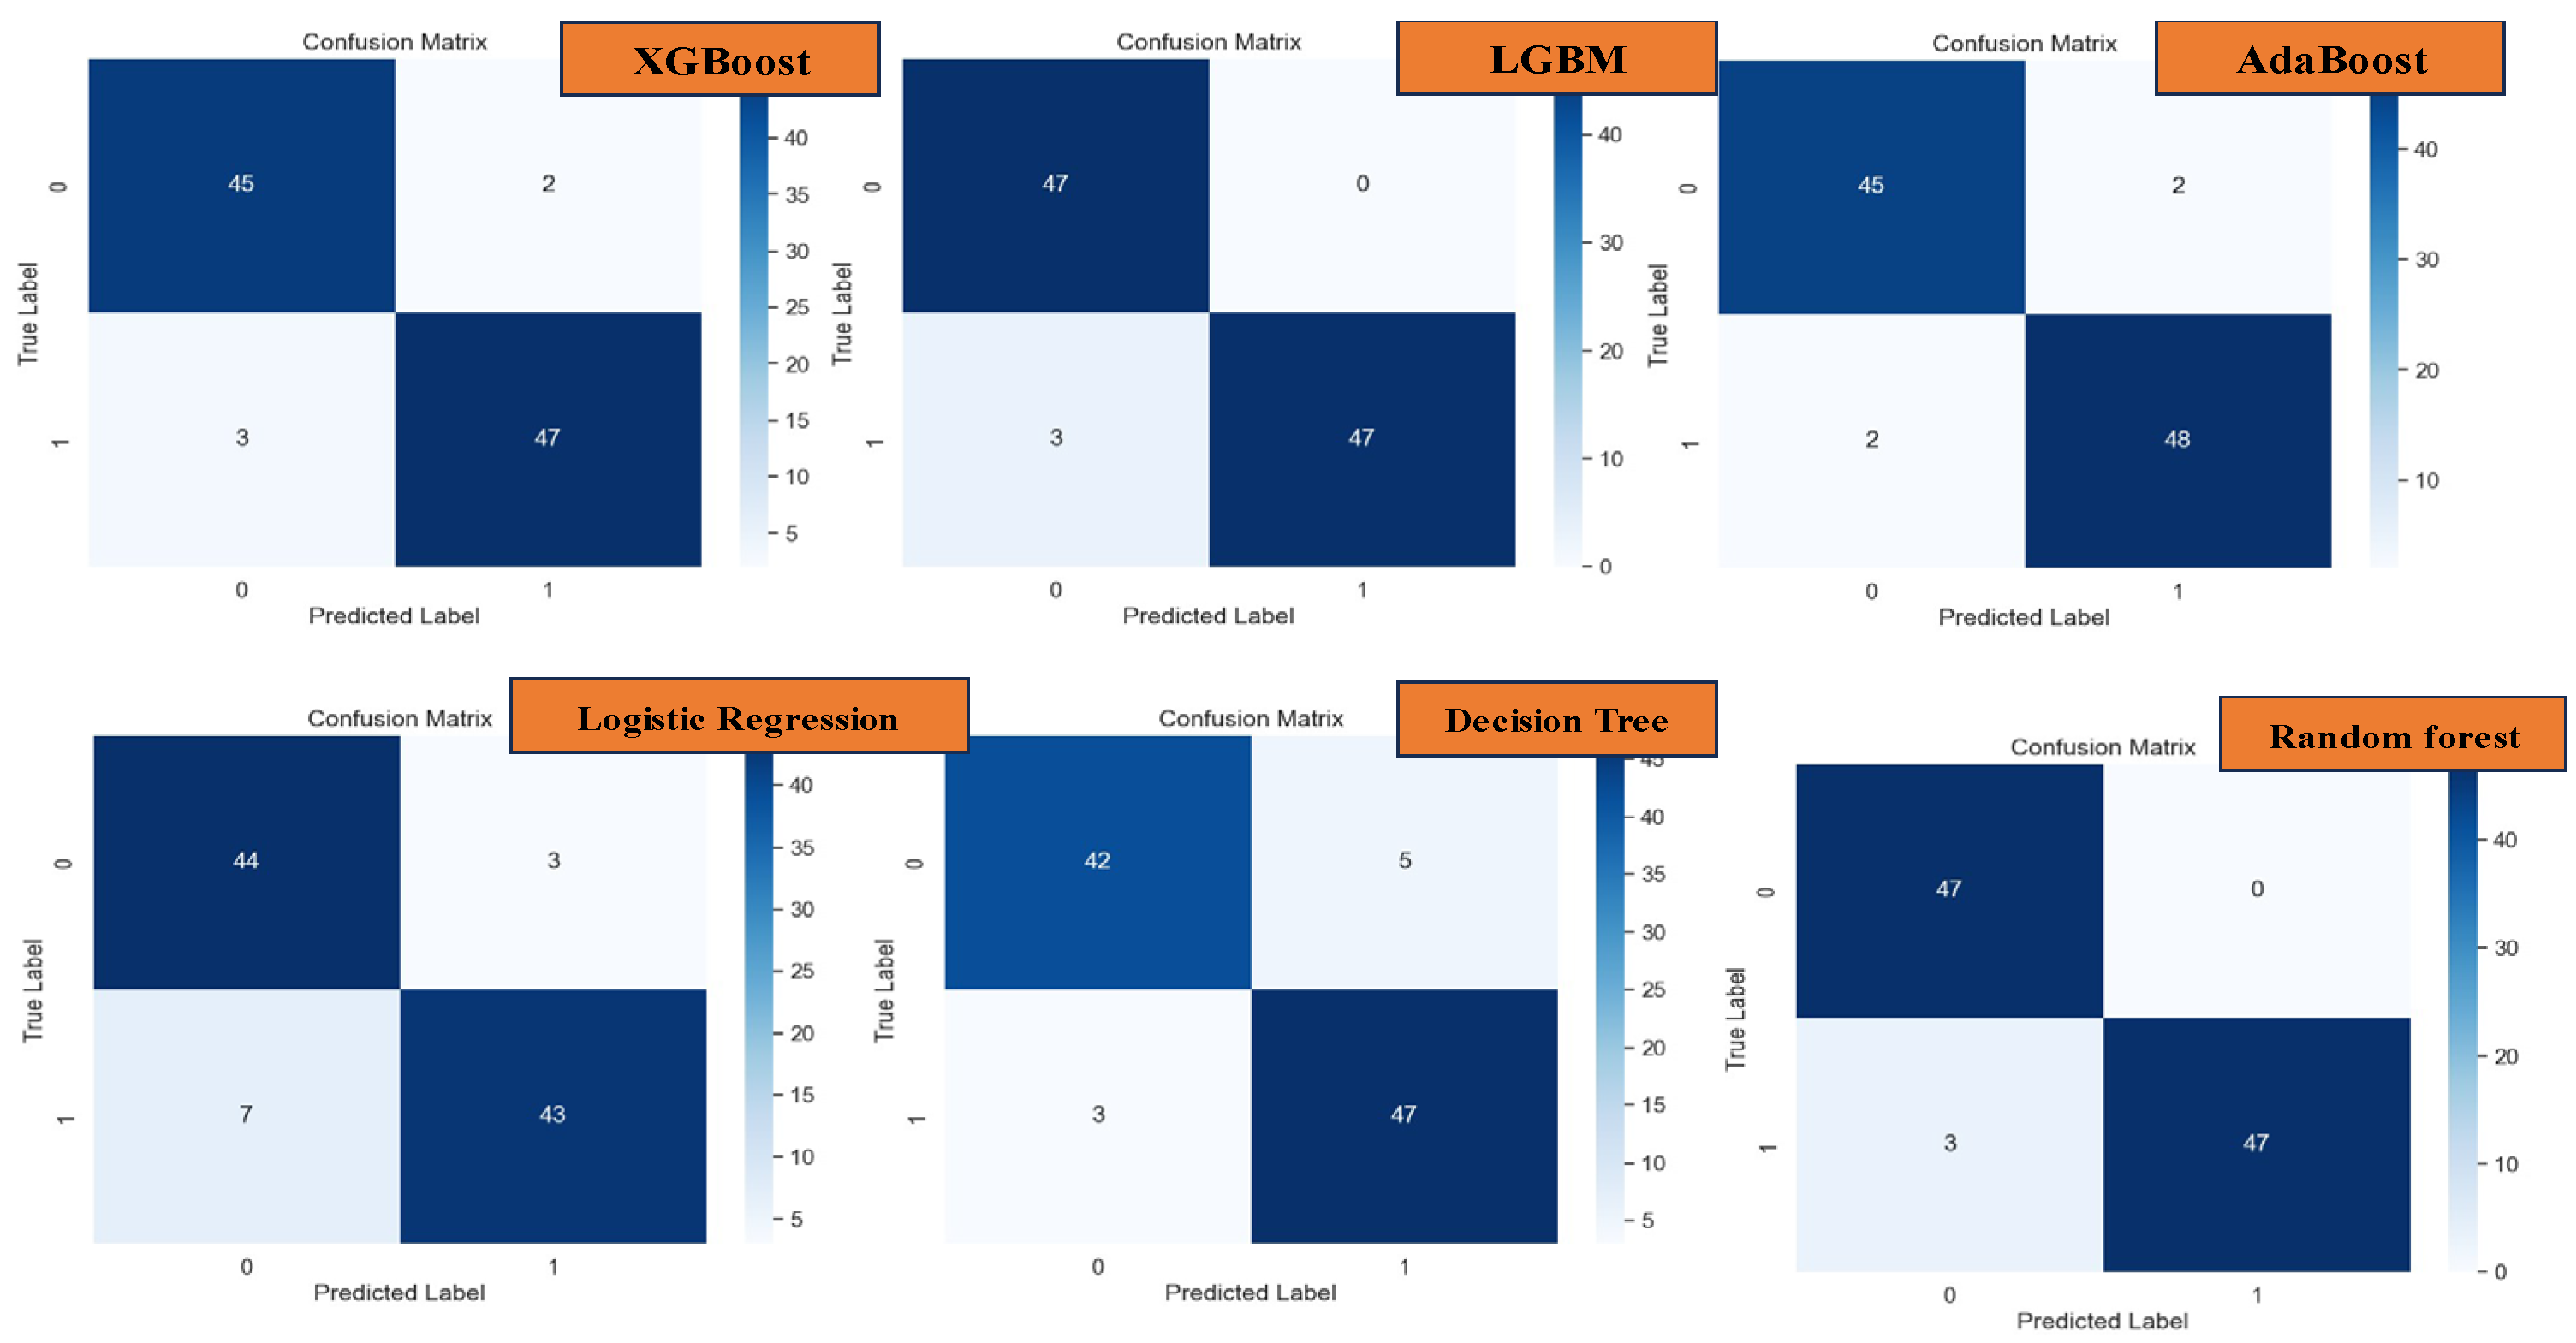
Figure 16.
Confusion Matrix of CatBoost, k-NN, and DNN.
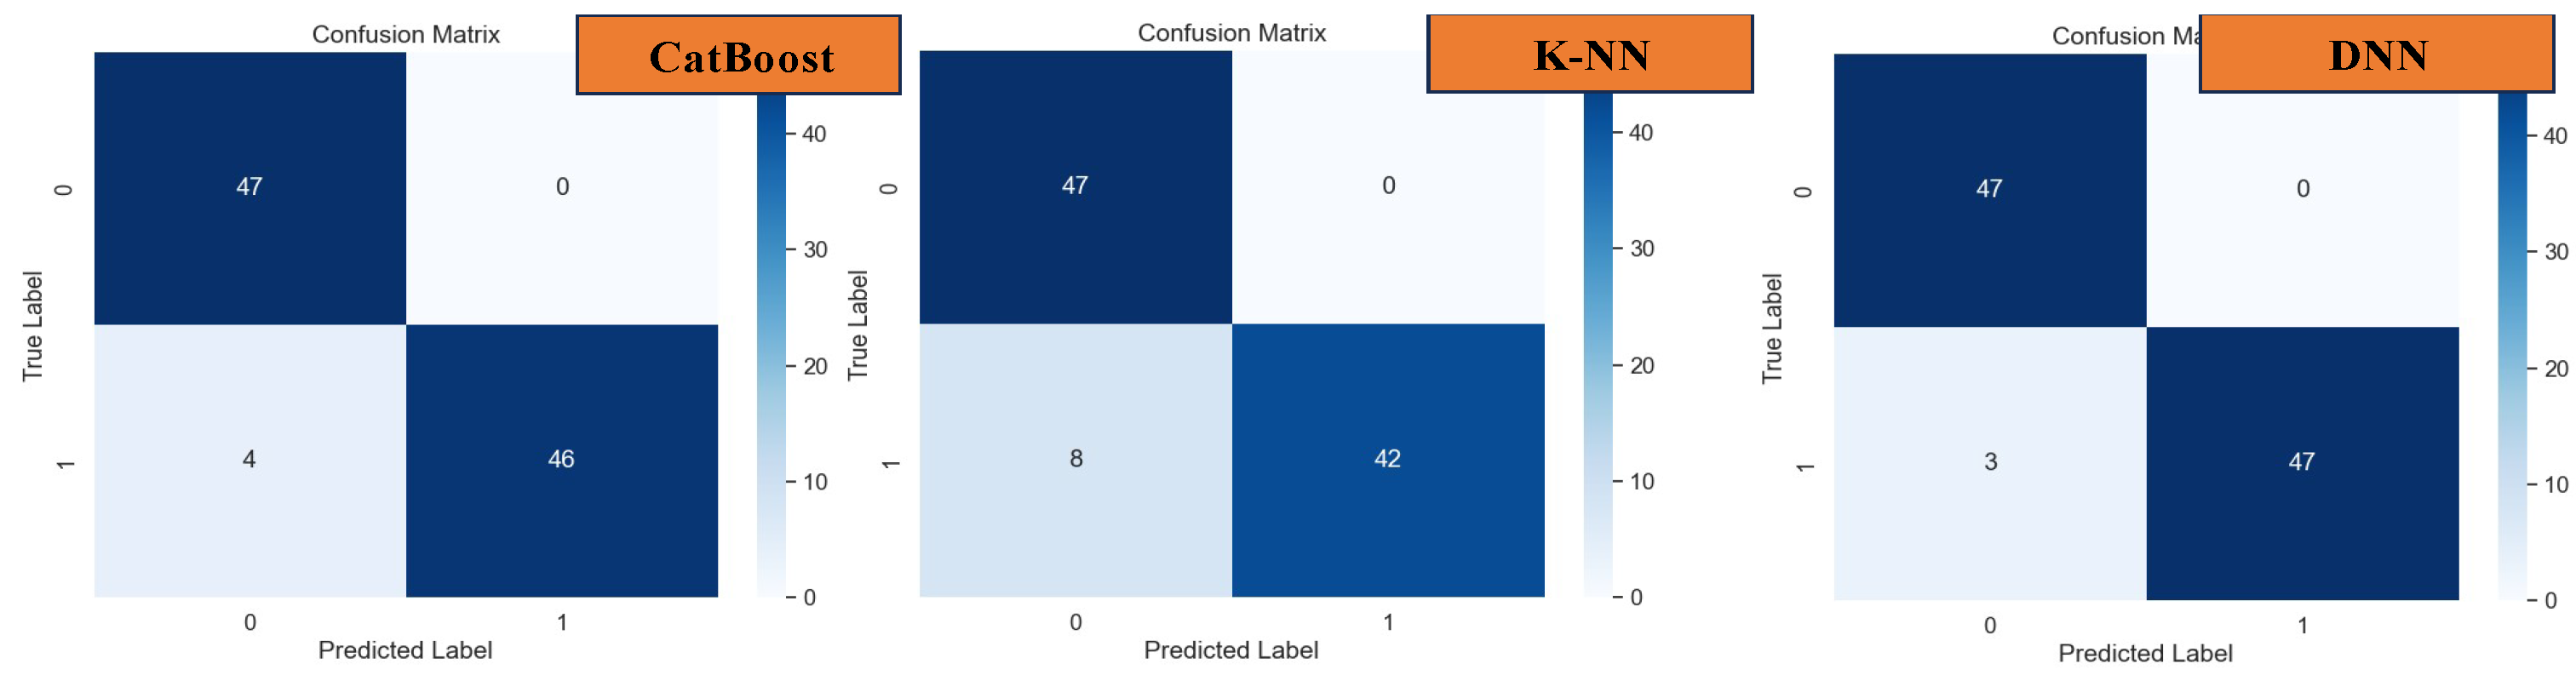
Indeed, the Deep Neural Network (DNN) model exhibited remarkable performance, surpassing all other models with an outstanding accuracy, precision, recall, and F-1 score of 96.91%, as evidenced in Figure 16. This exemplary performance underscores the efficacy of DNN, particularly in scenarios where the correlation between datasets and features is intricate and challenging to discern.
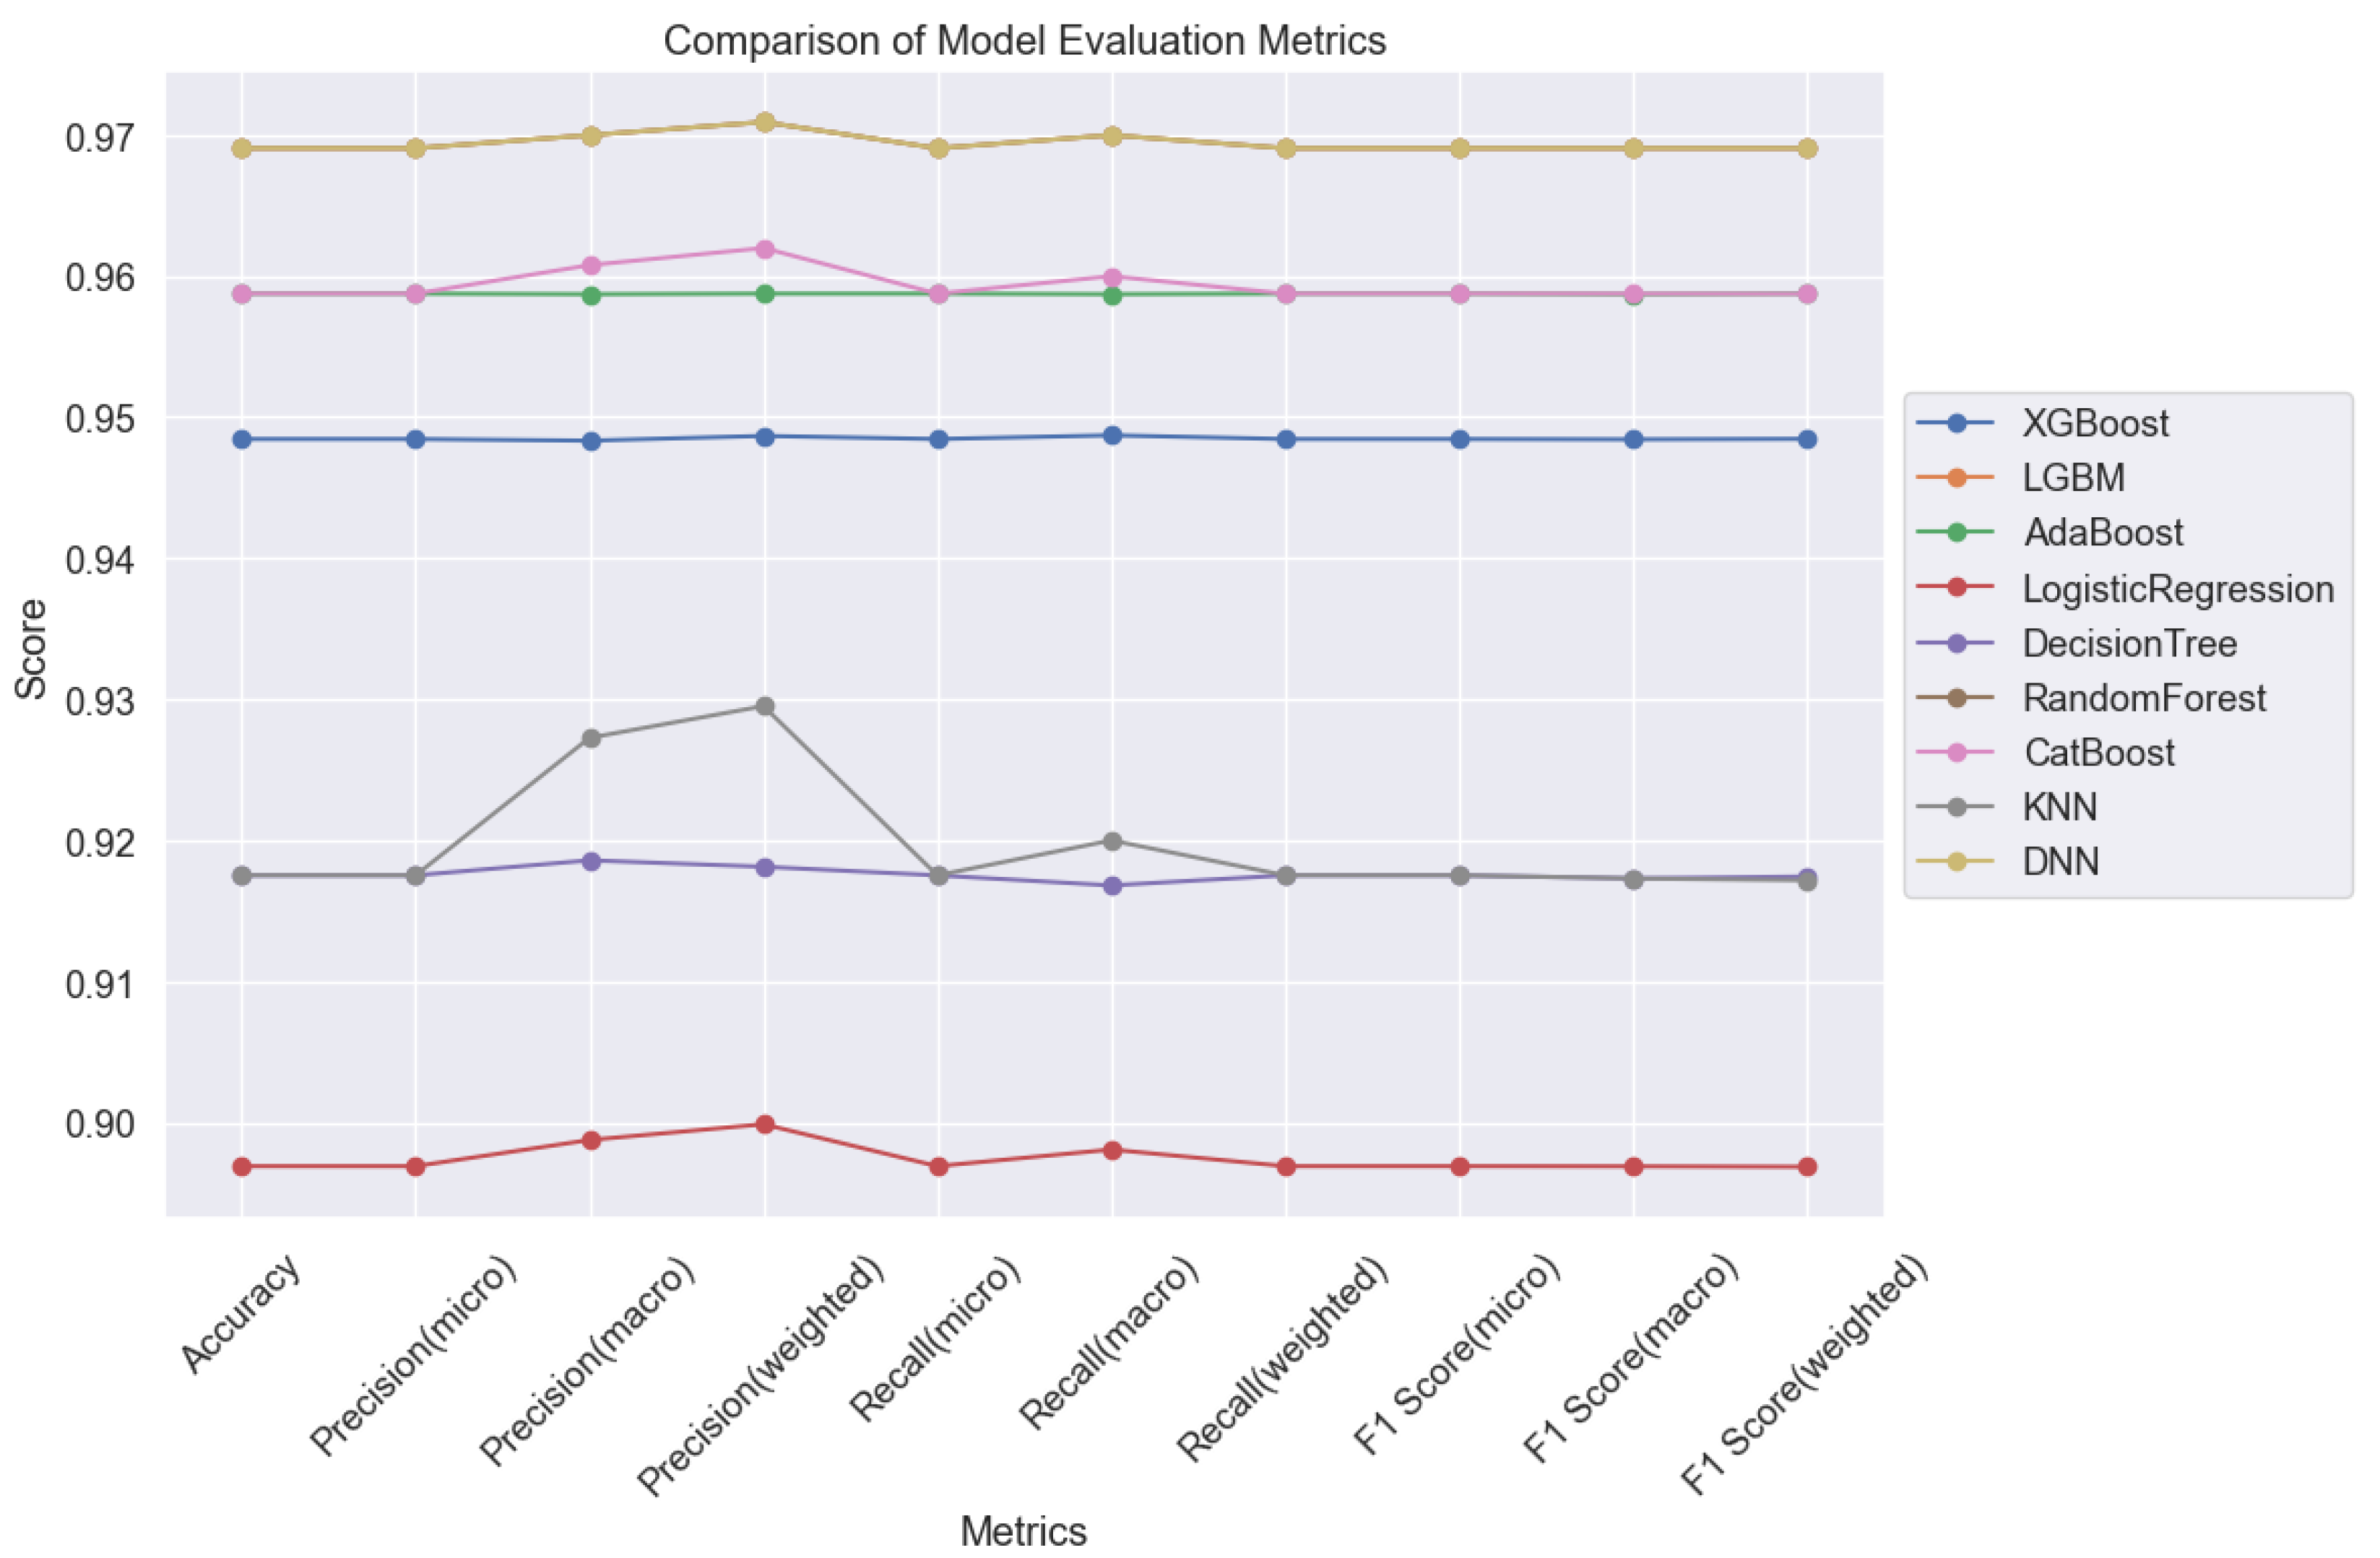
In summary, our analysis delineates DNN as the top-performing model for lung cancer classification tasks. Following closely behind are CatBoost and AdaBoost, which also demonstrated impressive performance metrics. These findings underscore the efficacy of these models in addressing overfitting and achieving high prediction accuracy in lung cancer classification tasks, as illustrated in Figure 17. Such insights are invaluable for guiding the selection of appropriate models for clinical applications, ultimately facilitating more accurate and reliable diagnoses for improved patient outcomes.
These findings shed light on the performance of different machine learning models in the prediction of lung cancer classifications. The comparative analysis of error rates underscores the varying degrees of accuracy and reliability exhibited by each model. Such insights are invaluable for clinicians and researchers alike, aiding in the selection of appropriate models for real-world applications and informing decision-making processes in clinical settings.
Conclusions
In conclusion, our study underscores the remarkable effectiveness of machine learning (ML) techniques in accurately predicting lung cancer types. We have meticulously analyzed various ML models and found that Light Gradient Boosting Machine (LGBM) emerges as the standout performer, achieving an exceptional accuracy rate of 96.91%. Importantly, LGBM's superiority extends across precision, recall, and F1-score metrics, demonstrating its capability to accurately classify both positive and negative instances of lung cancer.
While Logistic Regression and Decision Trees also demonstrate commendable performance, their slightly lower accuracy rates compared to LGBM are noteworthy. However, our results highlight the promising potential of Deep Neural Networks (DNNs), which achieved comparable accuracy with LGBM at 96.91%. It's crucial to acknowledge that DNNs, while powerful, require longer training times and greater computational resources compared to traditional algorithms.
Overall, our findings underscore the significant promise of ML approaches in revolutionizing the accurate prediction of lung cancer types. Ensemble methods like LGBM, along with deep learning techniques such as DNNs, emerge as promising avenues for further research and clinical application in lung cancer diagnosis and treatment. These insights contribute to advancing the field of oncology, offering robust predictive models that can aid in early detection, prognosis, and personalized treatment planning for lung cancer patients.
Moreover, our study sheds light on the nuanced strengths and considerations associated with each ML model. While simpler models like Logistic Regression and Decision Trees offer interpretability, they may sacrifice a fraction of accuracy compared to more complex models like LGBM and DNNs. Thus, careful consideration of trade-offs between model complexity, computational requirements, and predictive performance is essential in selecting the most suitable ML approach for specific applications.
Furthermore, our analysis underscores the potential for ensemble methods to enhance predictive performance by leveraging the strengths of multiple base models. Future research could explore integrating ensemble methods with deep learning architectures to capitalize on their complementary advantages and further improve predictive accuracy.
In summary, our study provides valuable insights into the application of ML techniques in lung cancer classification, offering clinicians and researchers robust tools to aid in diagnosis and treatment planning. By leveraging the power of ML, we can continue to refine predictive models, ultimately improving patient outcomes and advancing cancer care.
References
- Hosseinzadeh, F.; Kayvanjoo, A.H.; Ebrahimi, M. Prediction of lung tumor types based on protein attributes by machine learning algorithms. Springerplus 2013, 2. [Google Scholar] [CrossRef] [PubMed]
- Thun, M.J.; Hannan, L.M.; Adams-Campbell, L.L.; Boffetta, P.; Buring, J.E.; Feskanich, D.; Flanders, W.D.; Sun, H.J.; Katanoda, K.; Kolonel, L.N.; Lee, I.M.; Marugame, T.; Palmer, J.R.; Riboli, E.; Sobue, T.; Avila-Tang, E.; Wilkens, L.R.; Samet, J.M. Lung Cancer Occurrence in Never-Smokers: An Analysis of 13 Cohorts and 22 Cancer Registry Studies. PLoS Med 2008, 5, e185. [Google Scholar] [CrossRef] [PubMed]
- Hayat, M.J.; Howlader, N.; Reichman, M.E.; Edwards, B.K. Cancer Statistics, Trends, and Multiple Primary Cancer Analyses from the Surveillance, Epidemiology, and End Results (SEER) Program. Oncologist 2007, 12, 20–37. [Google Scholar] [CrossRef] [PubMed]
- Bhaskarla, A.; Tang, P.C.; Mashtare, T.; Nwogu, C.E.; Demmy, T.L.; Adjei, A.A.; Reid, M.E.; Yendamuri, S. Analysis of Second Primary Lung Cancers in the SEER Database. Journal of Surgical Research 2010, 162, 1–6. [Google Scholar] [CrossRef] [PubMed]
- Bian, J.; Modave, F. The rapid growth of intelligent systems in health and health care. 2020, 26, 5–7. [Google Scholar] [CrossRef] [PubMed]
- Zubi, Z.S.; Saad, R.A.; Zubi, Z.S.; Saad, R.A. Improves Treatment Programs of Lung Cancer Using Data Mining Techniques. Journal of Software Engineering and Applications 2014, 7, 69–77. [Google Scholar] [CrossRef]
- Clément-Duchêne, C.; Carnin, C.; Guillemin, F.; Martinet, Y. How Accurate Are Physicians in the Prediction of Patient Survival in Advanced Lung Cancer? Oncologist 2010, 15, 782–789. [Google Scholar] [CrossRef] [PubMed]
- Patra, R. Prediction of lung cancer using machine learning classifier. In Computing Science, Communication and Security. COMS2 2020. Communications in Computer and Information Science. pp. 132–142. [CrossRef]
- Wu, X.; Chen, V.W.; Martin, J.; Roffers, S.; Groves, F.D.; Correa, C.N.; Hamilton-Byrd, E.; Jemal, A. Subsite-Specific Colorectal Cancer Incidence Rates and Stage Distributions among Asians and Pacific Islanders in the United States, 1995 to 1999. Cancer Epidemiology, Biomarkers & Prevention 2004, 13, 1215–1222. [Google Scholar] [CrossRef]
- Lynch, C.M.; Abdollahi, B.; Fuqua, J.D.; de Carlo, A.R.; Bartholomai, J.A.; Balgemann, R.N.; van Berkel, V.H.; Frieboes, H.B. Prediction of lung cancer patient survival via supervised machine learning classification techniques. Int J Med Inform 2017, 108, 1–8. [Google Scholar] [CrossRef] [PubMed]
- Muers, M.F.; Shevlin, P.; Brown, J. Prognosis in lung cancer: physicians’ opinions compared with outcome and a predictive model. Thorax 1996, 51, 894–902. [Google Scholar] [CrossRef] [PubMed]
- Wu, X.; Chen, V.W.; Martin, J.; Roffers, S.; Groves, F.D.; Correa, C.N.; Hamilton-Byrd, E.; Jemal, A. Subsite-Specific Colorectal Cancer Incidence Rates and Stage Distributions among Asians and Pacific Islanders in the United States, 1995 to 1999. Cancer Epidemiology, Biomarkers & Prevention 2004, 13, 1215–1222. [Google Scholar] [CrossRef]
- Hussein, S.; Kandel, P.; Bolan, C.W.; Wallace, M.B.; Bagci, U. Lung and Pancreatic Tumor Characterization in the Deep Learning Era: Novel Supervised and Unsupervised Learning Approaches. IEEE Trans Med Imaging 2019, 38, 1777–1787. [Google Scholar] [CrossRef] [PubMed]
Figure 6.
Split Dataset into Training and Test for both Inputs and Output.
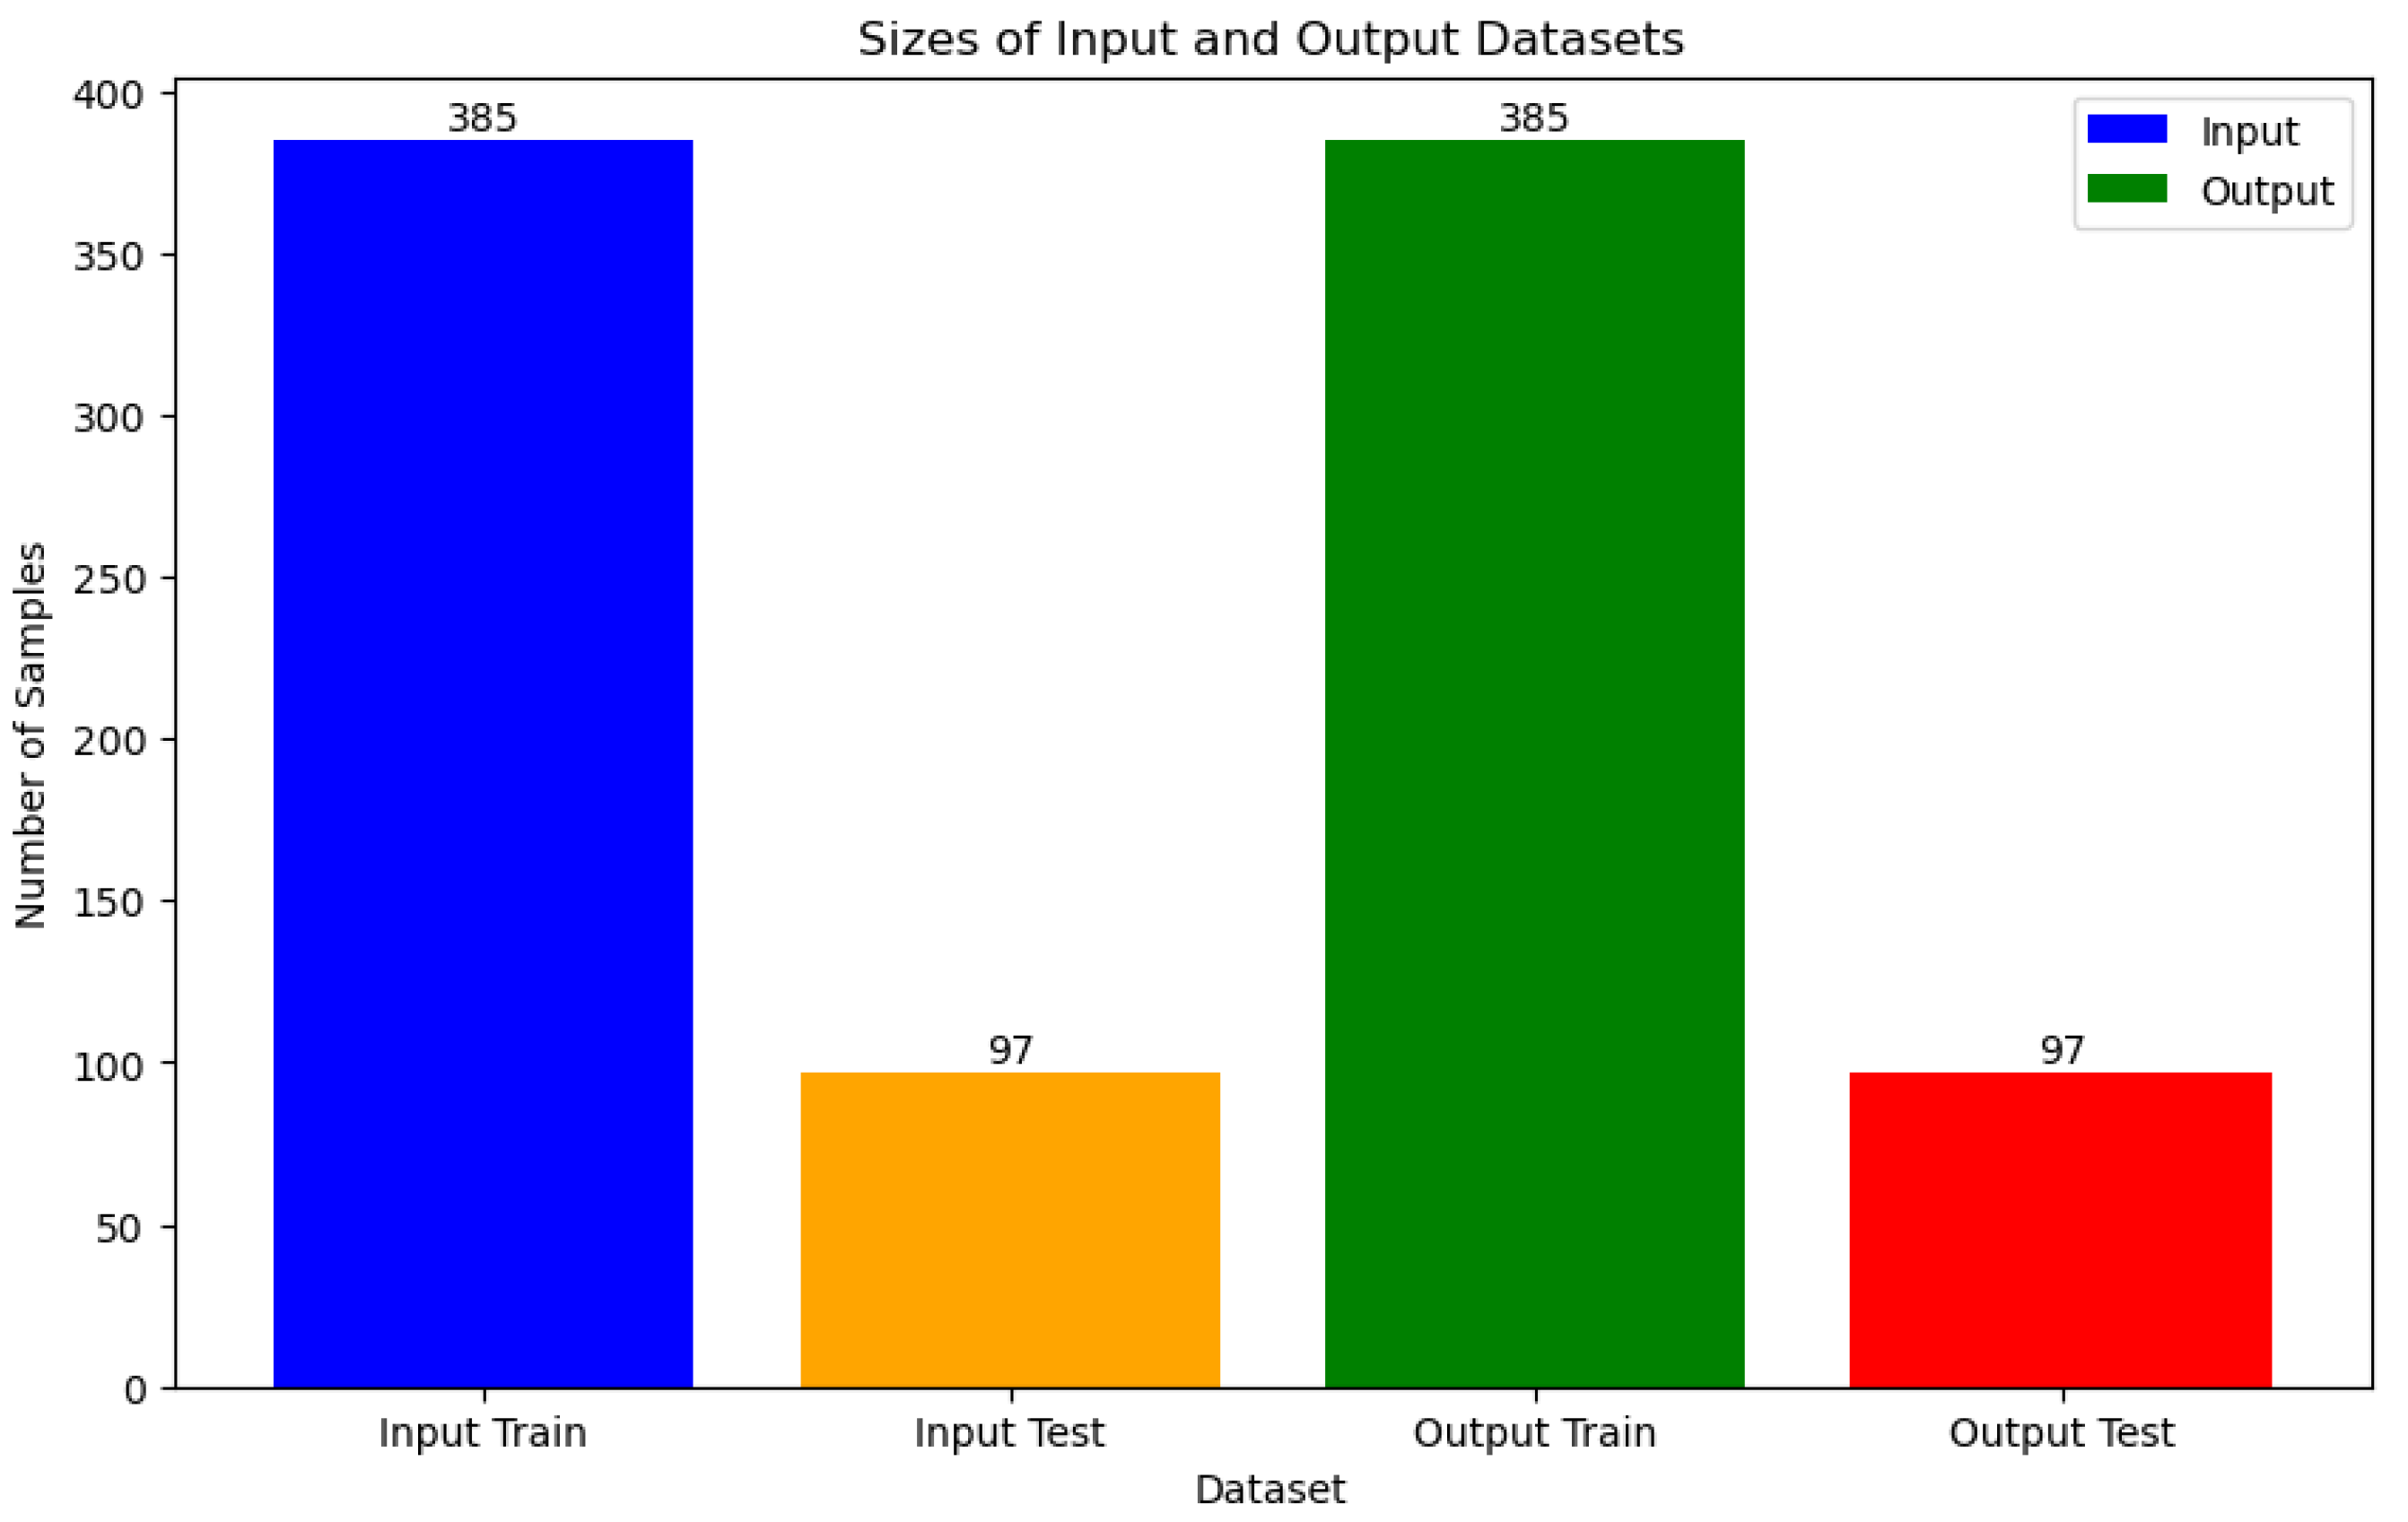
Figure 17.
Comparison of 9 ML Models for Lung Cancer Prediction.
Disclaimer/Publisher’s Note: The statements, opinions and data contained in all publications are solely those of the individual author(s) and contributor(s) and not of MDPI and/or the editor(s). MDPI and/or the editor(s) disclaim responsibility for any injury to people or property resulting from any ideas, methods, instructions or products referred to in the content. |
© 2024 by the authors. Licensee MDPI, Basel, Switzerland. This article is an open access article distributed under the terms and conditions of the Creative Commons Attribution (CC BY) license (http://creativecommons.org/licenses/by/4.0/).
Copyright: This open access article is published under a Creative Commons CC BY 4.0 license, which permit the free download, distribution, and reuse, provided that the author and preprint are cited in any reuse.


