
Submitted:
04 March 2025
Posted:
05 March 2025
You are already at the latest version
Abstract
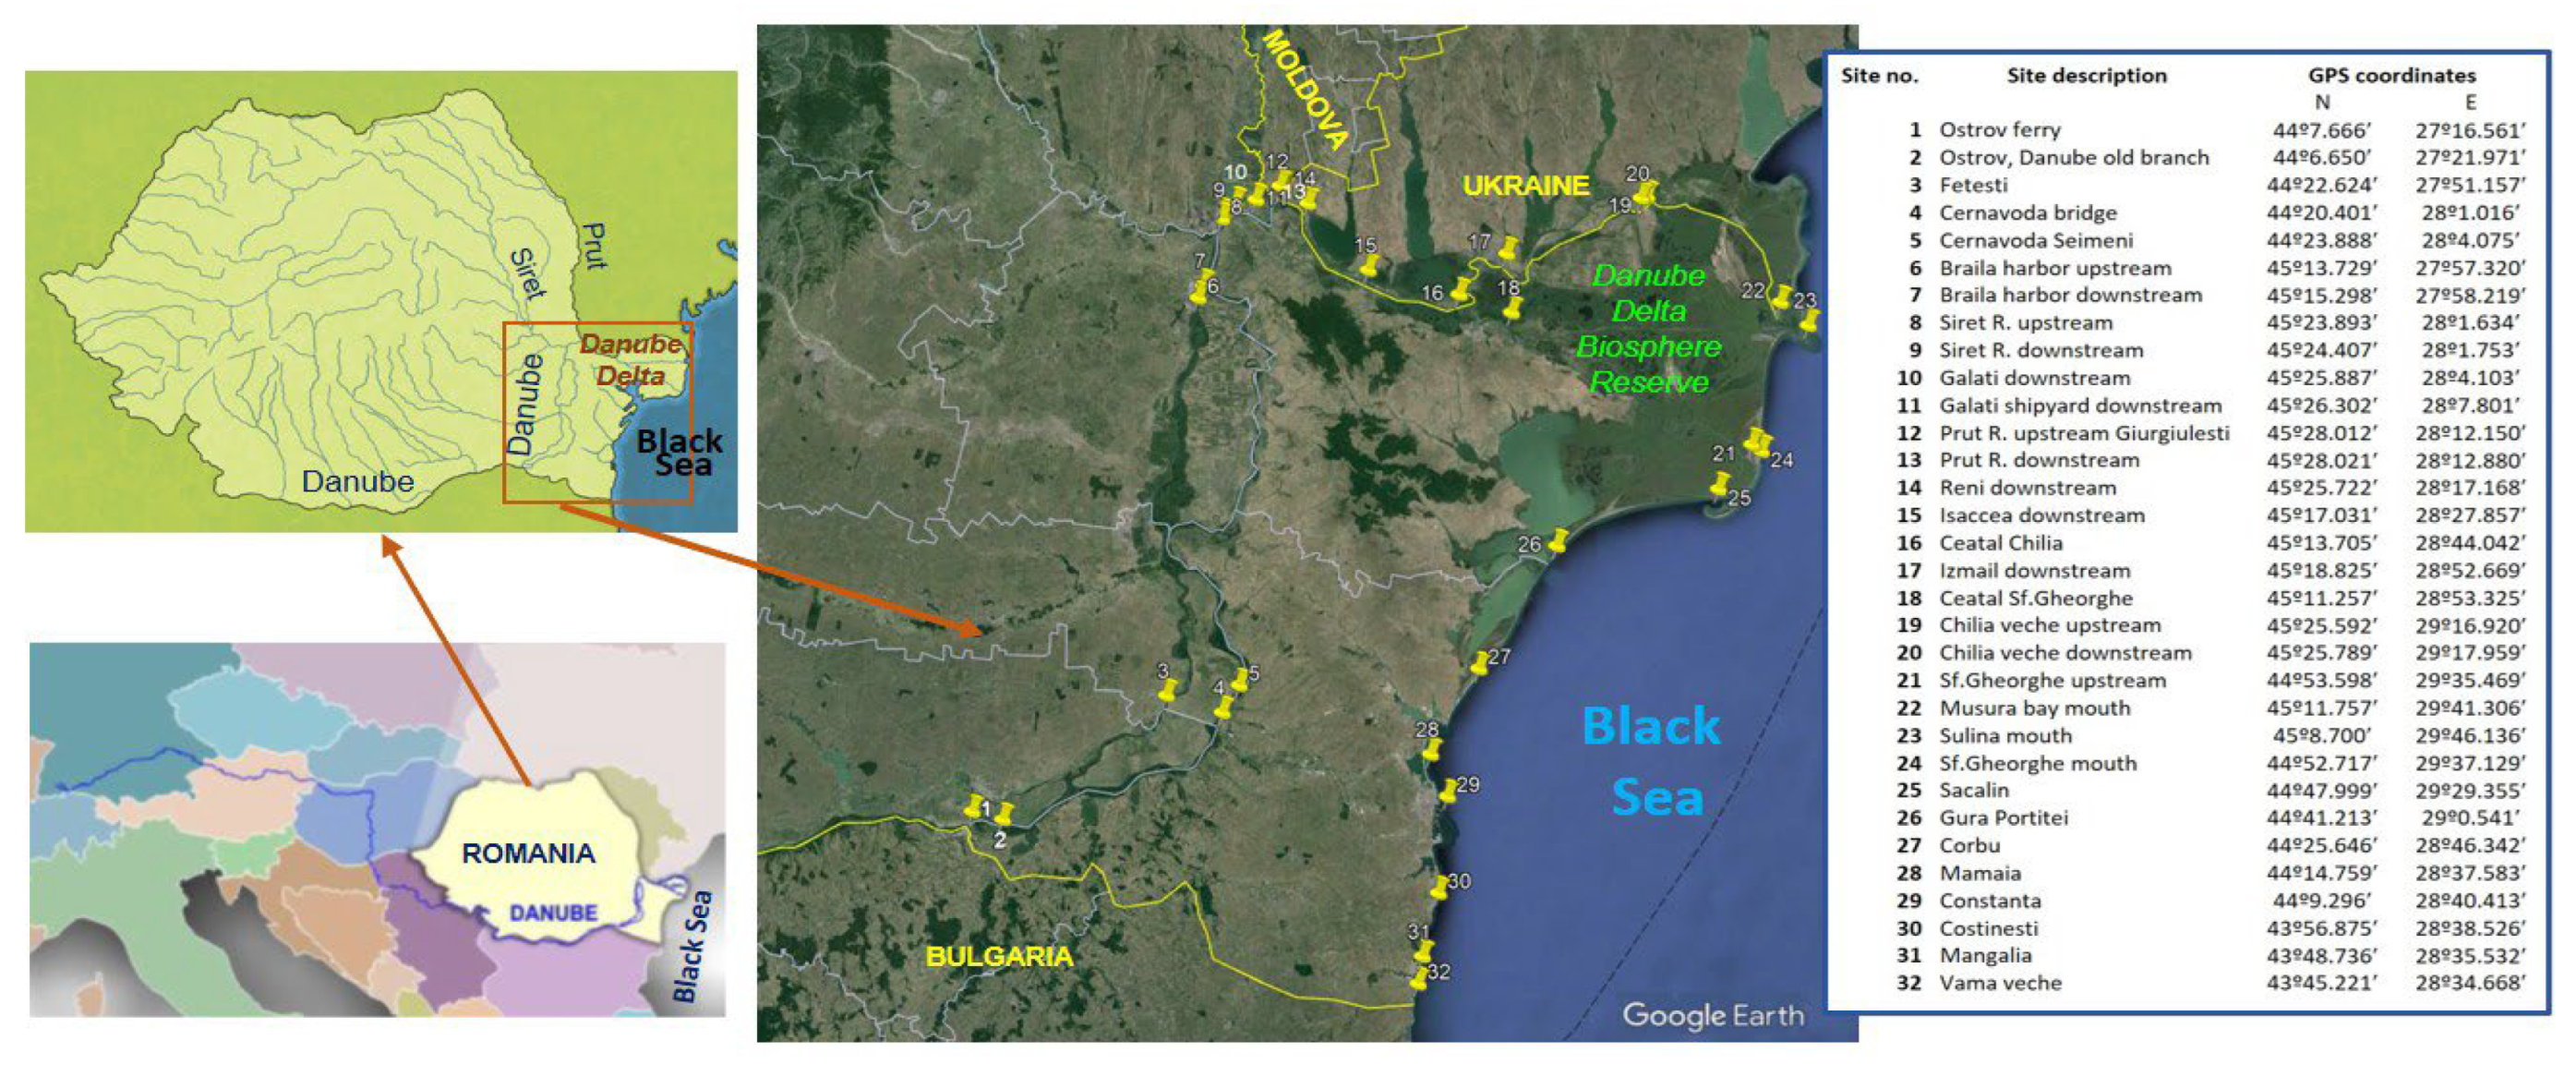
The assessment of surface water quality of Danube river and Black Sea was performed taking into account the amounts of 9 heavy metals (As, Cd, Cr, Cu, Hg, Mn, Ni, Pb, Zn), nutrients (6 N and P compounds, chlorophyll a), emerging contaminants (pharmaceutics and endocrine disruptors) and heterotrophic bacteria and total coliforms (fecal indicator bacteria) in thirty-two locations from the lower Danube sector (starting with km 375 up to the river mouths), the Danube Delta Biosphere Reserve (three Danube branches – Chilia, Sulina and Sf. Gheorghe) and the Romanian coastal area of the Black Sea. The results for heavy metals, nutrients and bacteria were compared with norms set up in the national legislation for good ecological status for surface water. The concentrations of pharmaceutics and endocrine disruptors from various classes (19 quantified compounds, out of 30 investigated chemicals) were compared with values reported for Danube River water in other studies performed in various river sectors. Correlations between contaminant levels and physicochemical parameters of water samples were studied. This is the first study carried out in the connected system Danube River–Danube Delta–Black Sea for a large palette of toxicants classes and microbial pollutants.
Keywords:
1. Introduction
2. Material and Methods
2.1. Water Sampling and Analysis of Physicochemical Parameters
2.2. Metal Analysis by ICP-MS and CVAAS
2.3. Analysis of CECs
2.3.1. Chemicals and Reagents
2.3.2. Extraction
2.3.3. Instrumentation

| Compound | Class | Formula | Exact mass | [M+H]+ | [M-H]- | RT (min) |
MS-MS fragments | Recovery (%) | LOD ng/L | LOQ ng/L |
|---|---|---|---|---|---|---|---|---|---|---|
| Sulfamethoxazole | Sulfonamides | C10H11N3O3S | 253.052113 | 254.059389 | 252.04484 | 5.20 | 108.4450; 156.0115; 92.0496 | 90.5 | 1 | 3 |
| Trimethoprim | Diaminopyrimidinen | C14H18N4O3 | 290.137890 | 291.145166 | 289.13061 | 4.85 | 230.1162; 123.0665; 245.1032 | 100.2 | 1.5 | 3.7 |
| Cyprofloxacin | Quinolones | C17H18FN3O3 | 331.133219 | 332.14047 | 330.12597 | 5.12 | 245.1086; 288.1508; 207.0653 | 95 | 1.9 | 5.7 |
| Norfloxacine | Quinolones | C16H18FN3O3 | 319.133219 | 320.14047 | 318.12597 | 4.12 | 302.1302; 276.1511; 233.1086 | 95.4 | 2.8 | 6.9 |
| Flumequine | Fluoroquinolines | C14H12FNO3 | 261.080121 | 262.087372 | 260.07287 | 6.25 | 244.0768; 220.0407; 202.0287 | 91 | 3.2 | 9.7 |
| Oxytetracycline | Tetracycline | C22H24N2O9 | 460.148179 | 461.155431 | 459.14093 | 5.30 | 184.0520; 128.0621; 115.0544 | 50.2 | 8 | 24.3 |
| Doxycycline | Tetracyclines | C22H24N2O8 | 444.153265 | 445.160516 | 443.14601 | 6.35 | 168.0571; 152.0621; 139.0542 | 97 | 8.8 | 26.6 |
| Amoxicillin | Antibiotic | C16H19N3O5S | 365.104542 | 366.111793 | 364.09729 | 7.35 | 160.0433; 114.0378 | 62.5 | 6.7 | 20.1 |
| Cefuroxime | Penicillines | C16H16N4O8S | 424.068885 | 425.076136 | 423.06163* | 8.12 | 318.1451; 284.2901; 207.0990 | 87 | 3.2 | 9 |
| Dicloxacillin | Penicillines | C19H17Cl2N3O5S | 469.026597 | 470.033849 | 468.01935 | 6.48 | 156.9607; 108.9841 | 96 | 2.4 | 6.8 |
| Clindamycin | Lincosamides | C18H33ClN2O5S | 424.179871 | 425.187122 | 423.17262 | 10.25 | 407.1762; 377.1842; 126.1278 | 95 | 5.2 | 15 |
| Carbamazepine | Antiepileptic | C15H12N2O | 236.094963 | 237.102214 | 235.08771 | 7.45 | 194.0968; 192.0809; 179.0725 | 108 | 2 | 6.2 |
| Clofibric acid | Lipid regulator | C10H11ClO3 | 214.039672 | 215.046923 | 213.03242 | 8.20 | 126.9957; 85.0295; 169.0661 | 67.5 | 1.9 | 5.7 |
| Pravastatin | Lipid-lowering | C23H36O7 | 424.246102 | 425.253354 | 423.23885 | 11.65 | 321.1703; 303.1601; 101.0607 | 98 | 1.2 | 3.7 |
| Erythromycin | Macrolide | C37H65NO12 | 715.450674 | 716.457926 | 714.44342 | 8.12 | 576.3721; 558.3648; 421.3601 | 37.2 | 8.5 | 25.1 |
| Piroxicam | NSAIDs | C15H13N3O4S | 331.062677 | 332.069929 | 330.05543 | 7.45 | 95,0605;121.0398; 164.0820 | 92 | 3.9 | 12 |
| Ketoprofen | NSAIDs | C16H14O3 | 254.094294 | 255.101545 | 253.08704 | 8.32 | 138,9949; 129.0102; 174.0915 | 99.5 | 4.4 | 12.5 |
| Indomethacin | NSAIDs | C19H16ClNO4 | 357.076785 | 358.084037 | 356.06953 | 9.80 | 138.9949; 129,0102; 174.0915 | 78 | 6.4 | 19.4 |
| Carprofen | NSAIDs | C15H12ClNO2 | 273.055656 | 274.062907 | 272.04840 | 9.65 | 230.0538; 228.0567; 193.0890 | 48.8 | 9.8 | 29.6 |
| Diclofenac | NSAIDs | C14H11Cl2NO2 | 295.016684 | 296.023935 | 294.00943 | 9.70 | 215.0497; 250.0188; 180.0811 | 105.1 | 3.8 | 11.9 |
| Meclofenamic acid | NSAIDs | C14H11Cl2NO2 | 295.016684 | 296.023935 | 294.00943 | 10.25 | 278.0133; 243.0445 | 68.8 | 11.7 | 35.5 |
| Naproxen | NSAIDs | C14H14O3 | 230.094294 | 231.101545 | 229.08704 | 8.60 | 185.0963; 153.0704; 170.0726 | 60.9 | 3.7 | 11.5 |
| Enilconazole | Azole antifungal | C14H14Cl2N2O | 296.048318 | 297.055569 | 295.04107 | 7.95 | 255.0099; 158.9765; 109.0762 | 100.5 | 1 | 3 |
| Ketoconazole | Azole antifungal | C26H28Cl2N4O4 | 530.148760 | 531.156011 | 529.14151 | 8.45 | 489.1459; 255.0091; 82.0526 | 87 | 0.5 | 1 |
| Fluconazole | Azole antifungal | C13H12F2N6O | 306.104065 | 307.111316 | 305.09681 | 5.65 | 238.0791; 220.0685; 169.0459 | 106.3 | 1.6 | 5 |
| Clotrimazole | Azole antifungal | C22H17ClN2 | 344.108026 | 345.115277 | 343.10077 | 9.61 | 278.0835; 165.0689 | 100.2 | 4.4 | 12.3 |
| Miconazole | Azole antifungal | C18H14Cl4N2O | 413.986023 | 414.993275 | 412.97877 | 10.45 | 281.9769; 156.9766; 69.0449 | 76.4 | 0.5 | 1.7 |
| Drospirenone | Synthetic progestin | C24H30O3 | 366.219494 | 367.226745 | 365.21224 | 10.56 | 349.2163; 257.1532; 171.1154 | 87.0 | 0.7 | 2.0 |
| 17-α Ethinylestradiol | Synthetic estrogen | C20H24O2 | 296.177629 | 297.184881 | 295.17038 | 12.04 | 279.1744; 214.1308; 159.1169 | 69.0 | 0.5 | 1.0 |
| Bisphenol A | Endocrine disruptor | C15H16O2 | 228.115029 | 229.122281 | 227.10778 | 8.74 | 219.0901; 147.1170; 95.0857 | 100.4 | 0.8 | 2.1 |
3. Results and Discussion
3.1. Physicochemical Parameters
3.2. Metals
| No. | Sampling sites | As µg/L |
Cd µg/L |
Cr µg/L |
Cu µg/L |
Mn µg/L |
Ni µg/L |
Pb µg/L |
Zn µg/L |
Hg µg/L |
|---|---|---|---|---|---|---|---|---|---|---|
| 1 | Ostrov ferry | 5.774 | 0.959 | 31.124 | 14.886 | 320.270 | 31.159 | 15.492 | 43.918 | 0.019 |
| 2 | Ostrov, Danube old branch | 4.945 | 0.508 | 26.028 | 19.813 | 283.729 | 37.685 | 9.998 | 59.449 | 0.018 |
| 3 | Fetesti | 4.631 | 0.892 | 34.503 | 12.671 | 269.909 | 40.110 | 12.349 | 65.772 | 0.030 |
| 4 | Cernavoda bridge | 5.223 | 0.783 | 39.624 | 15.152 | 295.975 | 44.224 | 11.838 | 45.107 | 0.017 |
| 5 | Cernavoda Seimeni | 4.036 | 1.320 | 49.526 | 23.042 | 243.699 | 28.414 | 9.361 | 65.772 | 0.044 |
| 6 | Braila harbor upstream | 5.027 | 1.120 | 55.561 | 21.721 | 287.366 | 30.215 | 10.247 | 59.449 | 0.050 |
| 7 | Braila harbor downstream | 5.485 | 0.996 | 48.604 | 28.590 | 307.536 | 31.205 | 8.652 | 44.741 | 0.038 |
| 8 | Siret R. upstream | 5.195 | 1.201 | 43.098 | 27.362 | 294.750 | 29.307 | 9.332 | 56.616 | 0.028 |
| 9 | Siret R. downstream | 4.962 | 1.069 | 61.239 | 17.933 | 284.490 | 30.402 | 10.128 | 49.818 | 0.026 |
| 10 | Galati downstream | 5.440 | 0.887 | 55.561 | 19.721 | 305.552 | 27.221 | 9.235 | 46.852 | 0.033 |
| 11 | Galati shipyard downstream | 4.852 | 1.201 | 51.641 | 19.596 | 279.658 | 31.256 | 11.123 | 45.878 | 0.029 |
| 12 | Prut R. upstream Giurgiulesti | 4.319 | 0.820 | 46.918 | 27.362 | 256.183 | 37.968 | 8.278 | 73.245 | 0.019 |
| 13 | Prut R. downstream | 4.684 | 1.320 | 54.332 | 17.933 | 272.244 | 27.816 | 9.361 | 44.944 | 0.045 |
| 14 | Reni downstream | 5.732 | 1.120 | 52.422 | 19.721 | 318.427 | 47.674 | 10.247 | 55.241 | 0.033 |
| 15 | Isaccea downstream | 5.884 | 0.996 | 48.218 | 17.933 | 325.120 | 32.568 | 8.652 | 64.351 | 0.045 |
| 16 | Ceatal Chilia | 5.032 | 0.650 | 51.638 | 19.721 | 287.585 | 27.221 | 11.328 | 46.736 | 0.054 |
| 17 | Izmail downstream | 4.927 | 0.720 | 39.282 | 23.832 | 282.946 | 29.563 | 9.528 | 58.245 | 0.039 |
| 18 | Ceatal Sf.Gheorghe | 2.946 | 0.746 | 41.850 | 22.366 | 195.675 | 19.700 | 10.076 | 61.784 | 0.049 |
| 19 | Chilia veche upstream | 4.962 | 0.676 | 31.221 | 24.555 | 284.476 | 24.872 | 9.874 | 46.864 | 0.058 |
| 20 | Chilia veche downstream | 5.169 | 0.664 | 40.063 | 24.202 | 293.604 | 26.918 | 9.682 | 44.221 | 0.048 |
| 21 | Sf.Gheorghe upstream | 4.773 | 0.804 | 29.016 | 13.049 | 276.161 | 29.638 | 7.067 | 53.142 | 0.044 |
| 22 | Musura bay mouth | 4.582 | 0.744 | 38.724 | 10.154 | 267.744 | 26.654 | 9.456 | 46.214 | 0.038 |
| 23 | Sulina mouth | 4.532 | 0.655 | 27.002 | 18.202 | 265.557 | 29.994 | 8.050 | 55.874 | 0.056 |
| 24 | Sf.Gheorghe mouth | 4.714 | 0.804 | 32.082 | 12.601 | 273.552 | 27.208 | 6.016 | 49.245 | 0.055 |
| 25 | Sacalin | 5.577 | 0.587 | 21.610 | 19.813 | 311.584 | 23.434 | 8.450 | 46.684 | 0.080 |
| 26 | Gura Portitei | 5.830 | 0.872 | 31.074 | 25.878 | 322.736 | 12.325 | 8.698 | 74.333 | 0.054 |
| 27 | Corbu | 3.524 | 0.710 | 32.240 | 14.228 | 221.119 | 15.132 | 9.963 | 65.230 | 0.010 |
| 28 | Mamaia | 4.629 | 0.685 | 32.583 | 17.245 | 269.822 | 23.136 | 5.968 | 46.783 | 0.010 |
| 29 | Constanta | 6.461 | 0.698 | 45.044 | 21.350 | 350.549 | 16.635 | 5.214 | 71.245 | 0.010 |
| 30 | Costinesti | 6.303 | 0.825 | 28.425 | 16.520 | 343.587 | 19.887 | 6.335 | 53.412 | 0.010 |
| 31 | Mangalia | 5.987 | 0.717 | 35.870 | 19.840 | 281.630 | 17.635 | 5.828 | 47.200 | 0.010 |
| 32 | Vama veche | 6.049 | 0.857 | 40.898 | 21.250 | 284.388 | 12.565 | 6.120 | 55.412 | 0.010 |
| Ecological status according to Romanian Order no. 161/2006 [47] | ||||||||||
| Highest ecological status | 10 | 0.5 | 25 | 20 | 50 | 10 | 5 | 100 | 0.1 | |
| Good ecological status | 20 | 1 | 50 | 30 | 100 | 25 | 10 | 200 | 0.3 | |
| Moderate ecological status | 50 | 2 | 100 | 50 | 300 | 50 | 25 | 500 | 1.0 | |
| Poor ecological status | 100 | 5 | 250 | 100 | 1000 | 100 | 50 | 1000 | 2 | |
| Bad ecological status | >100 | >5 | >250 | >100 | >1000 | >100 | >50 | >1000 | >2 | |
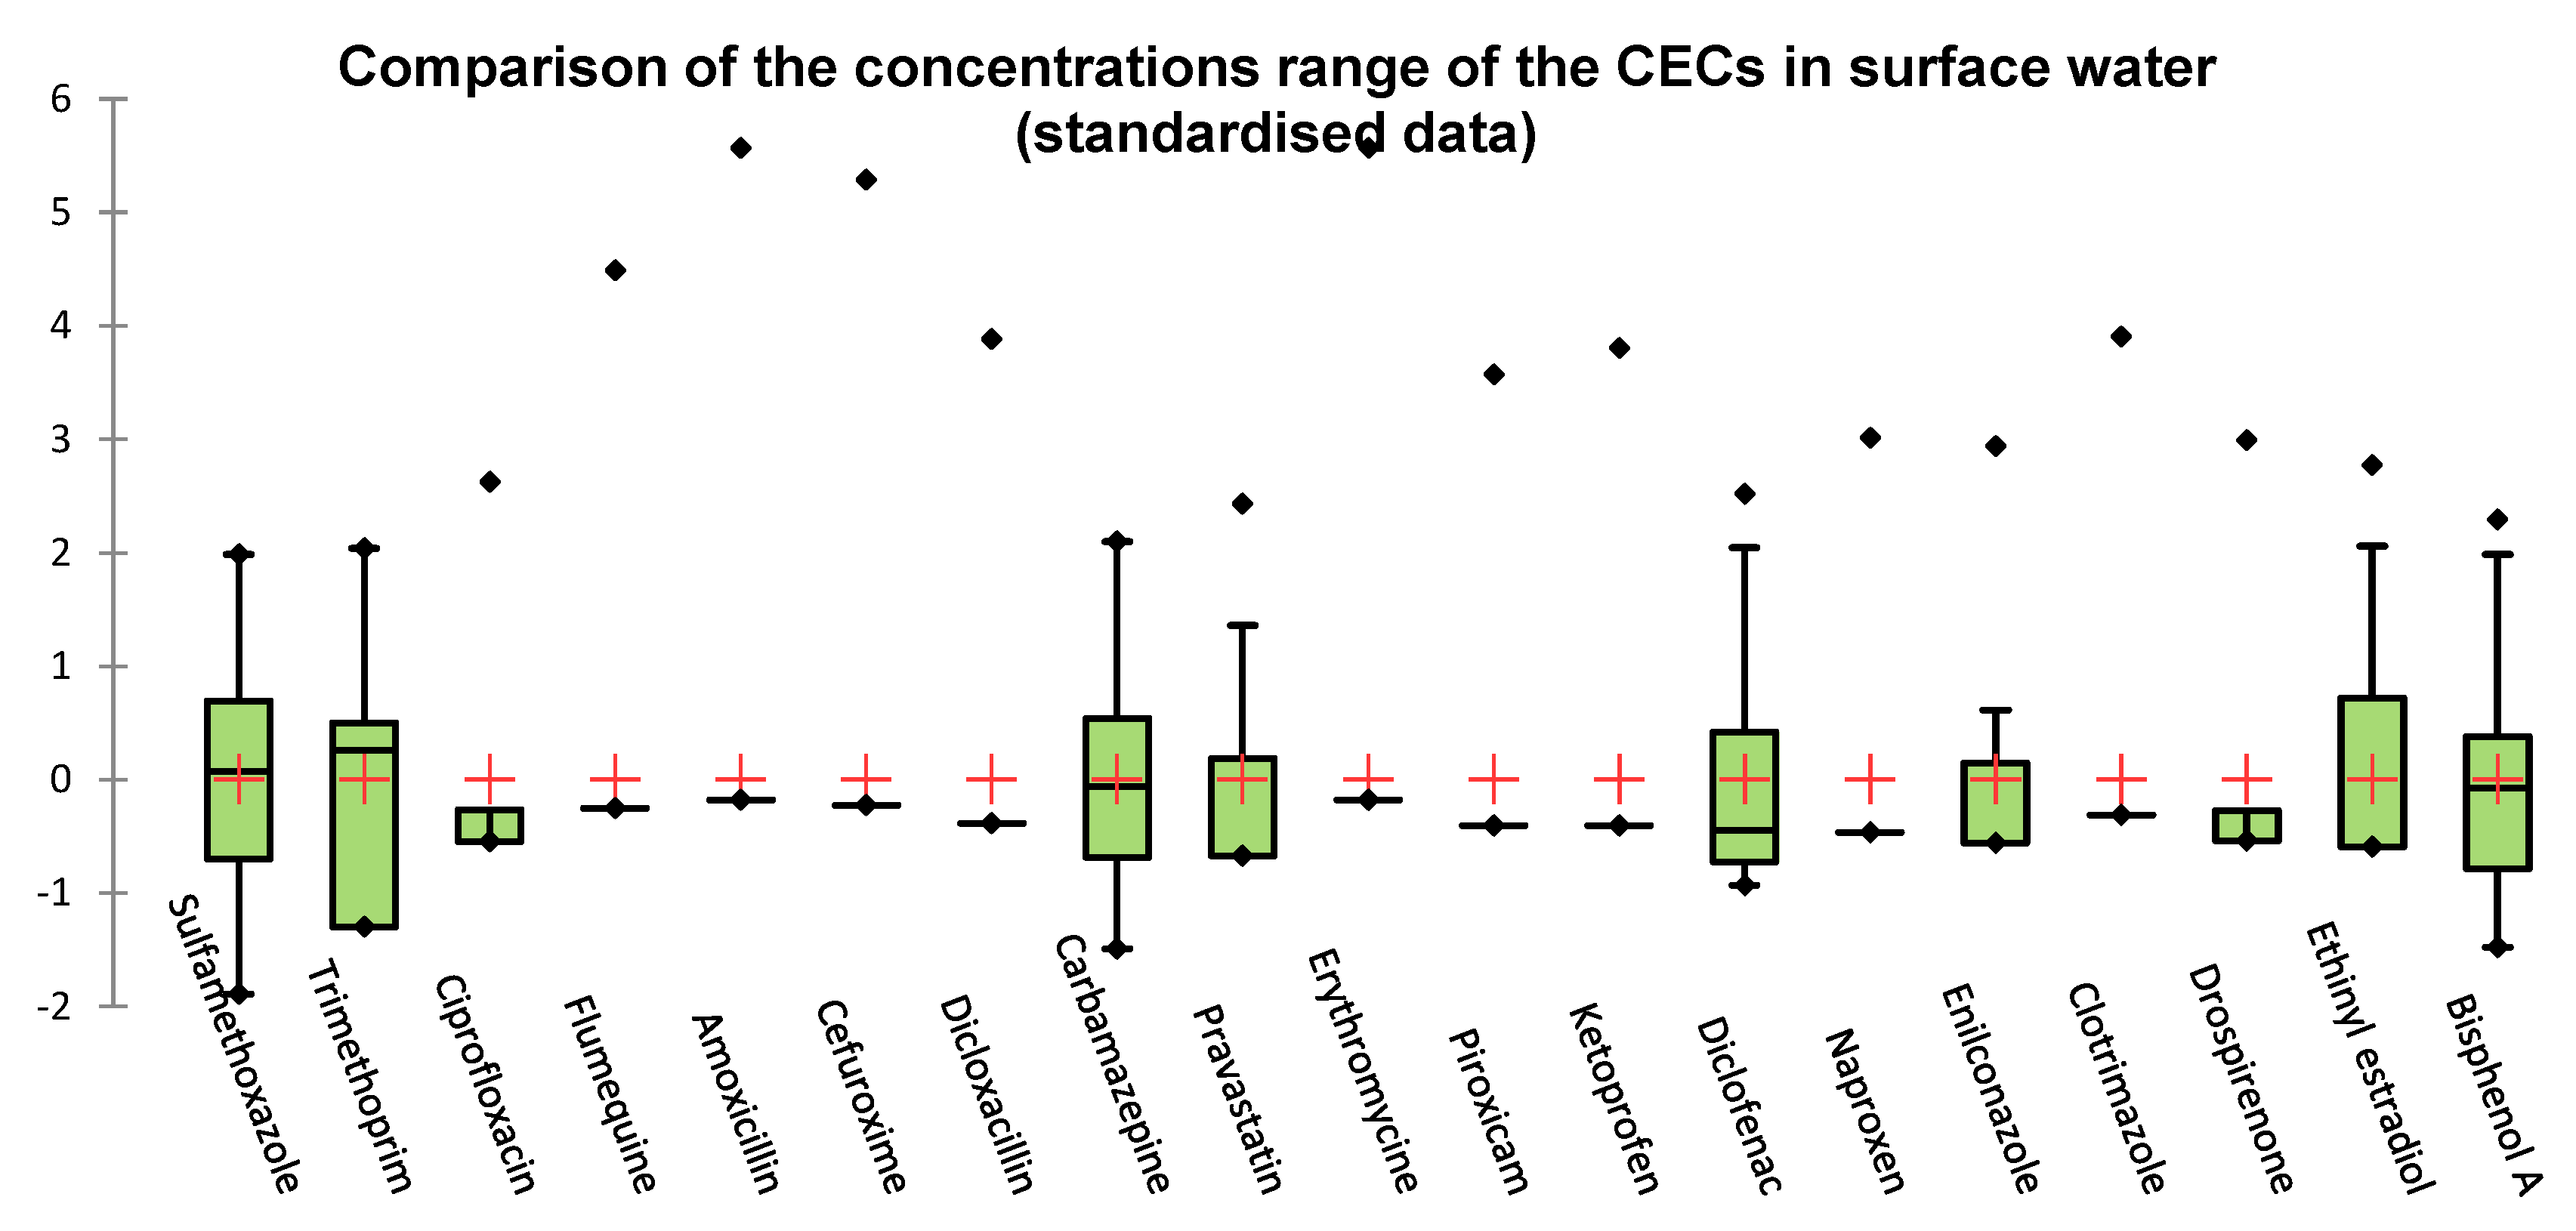
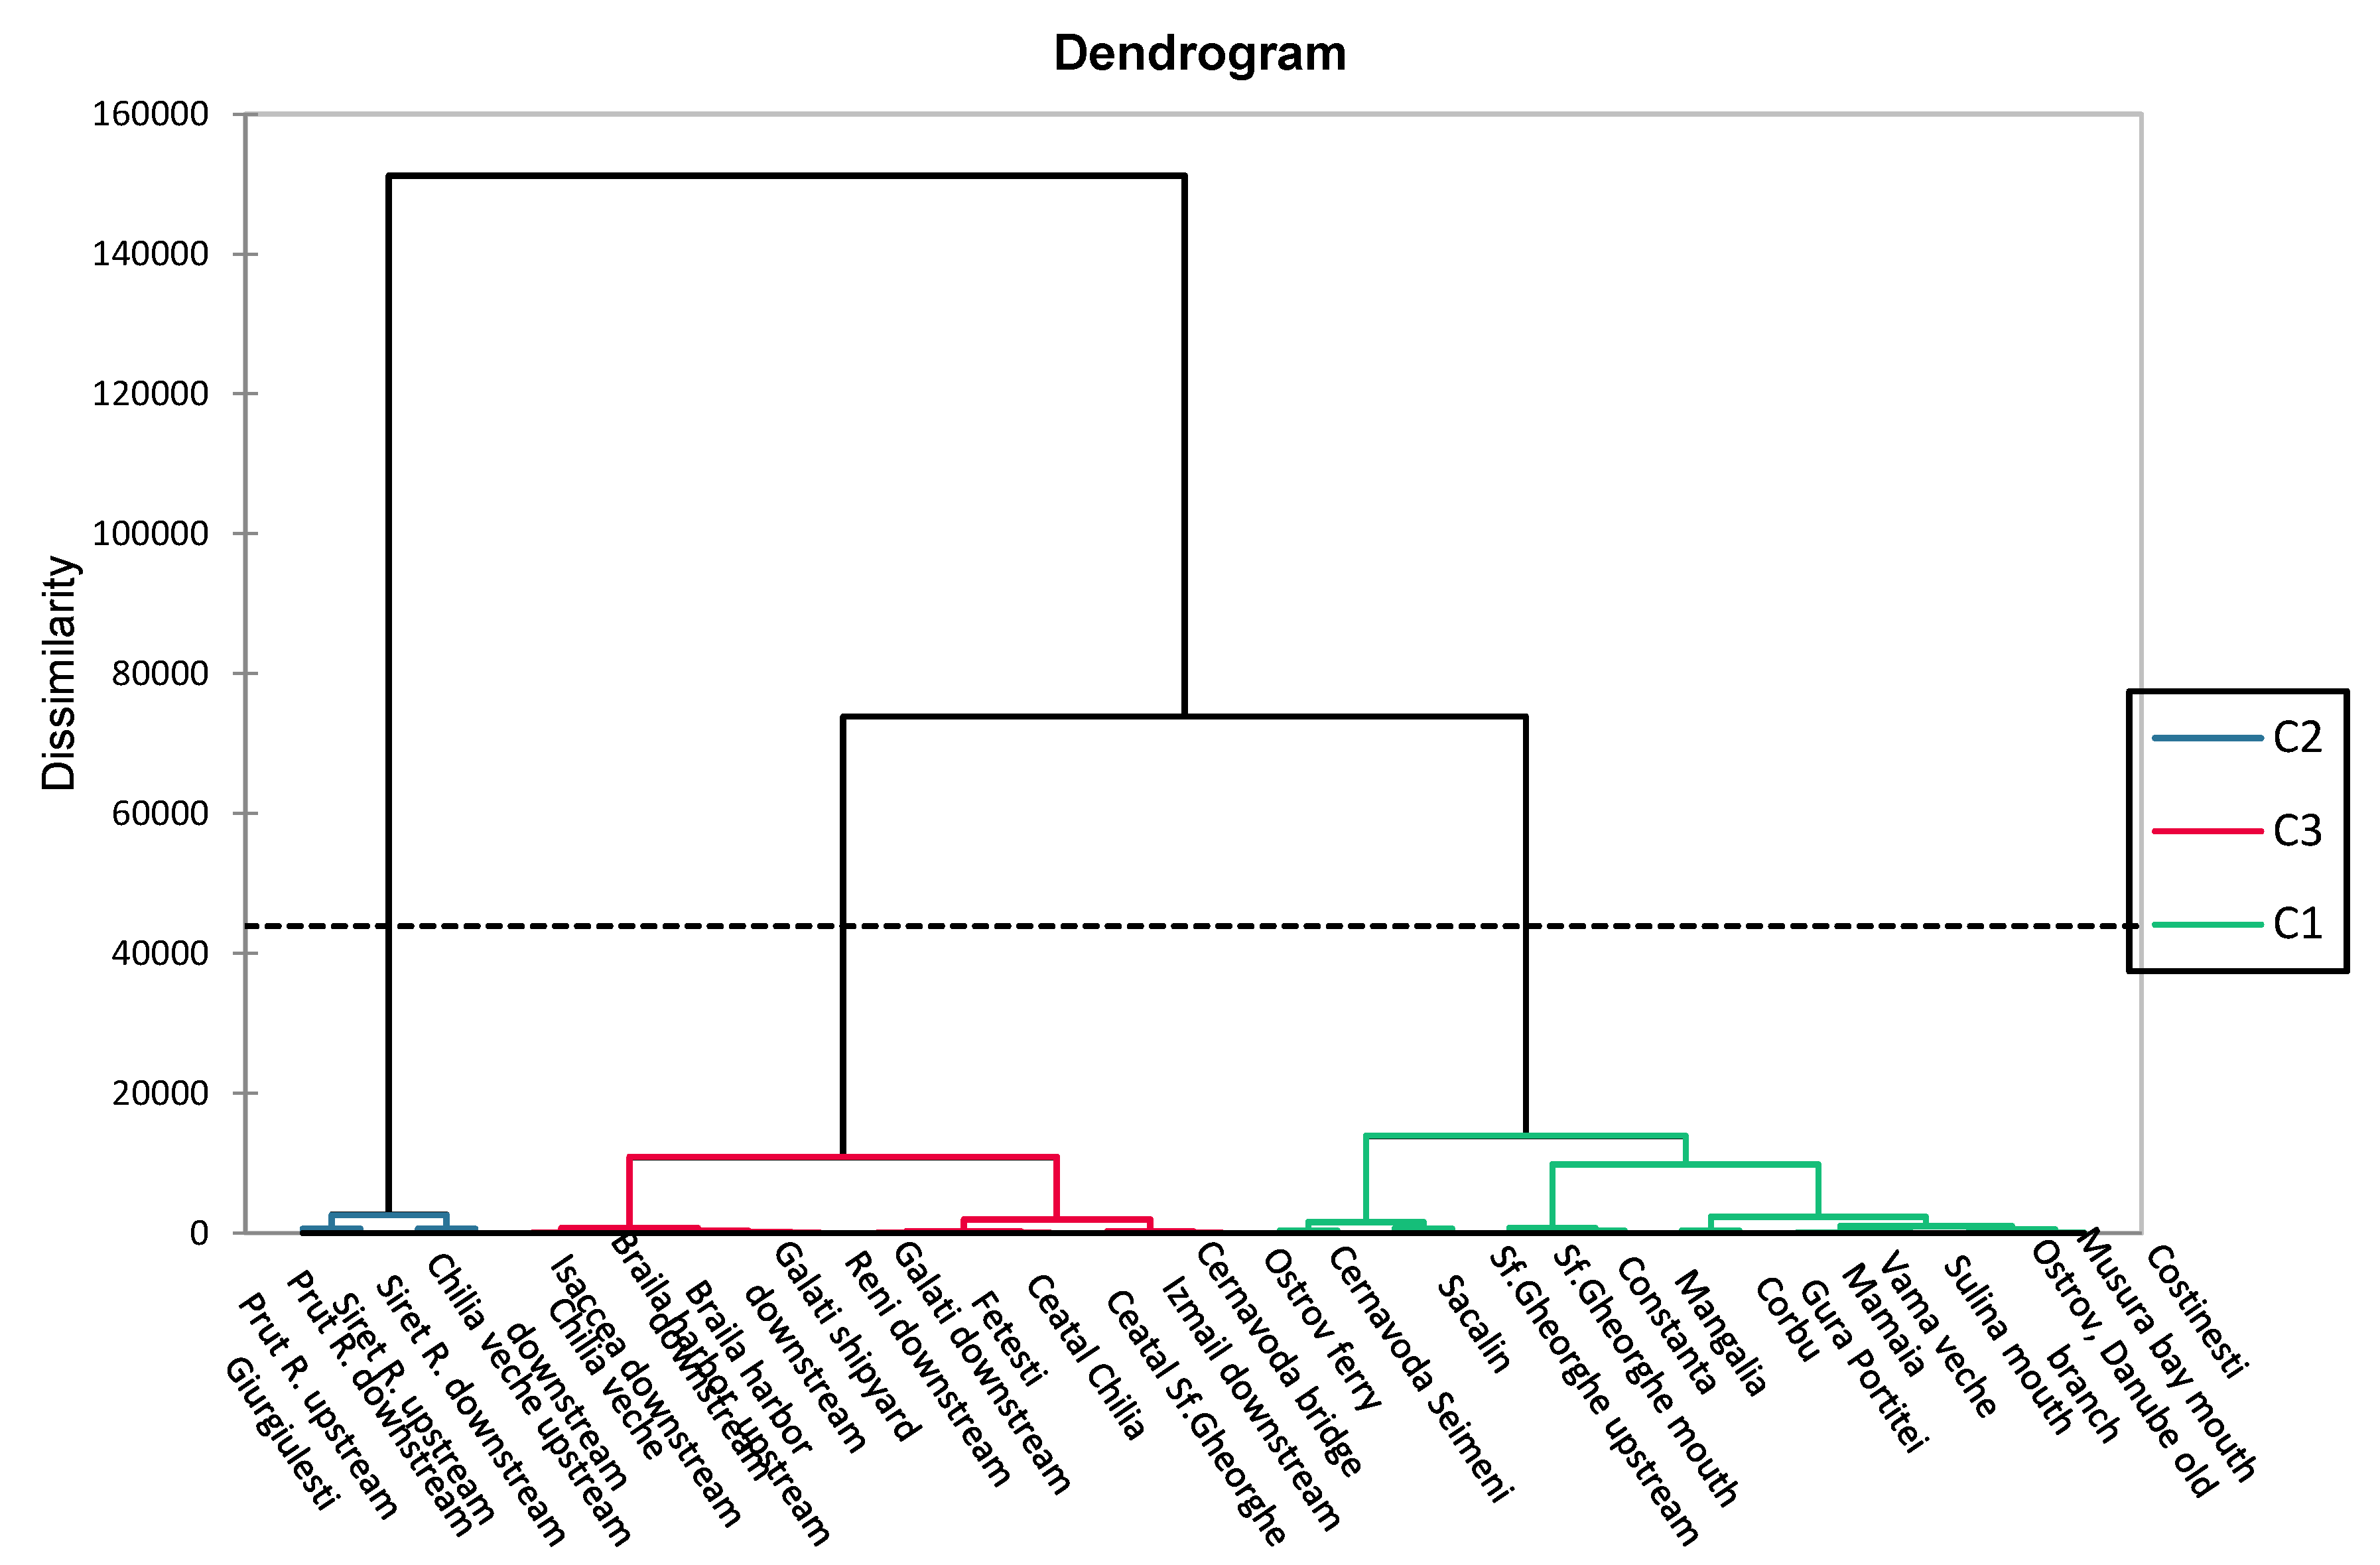
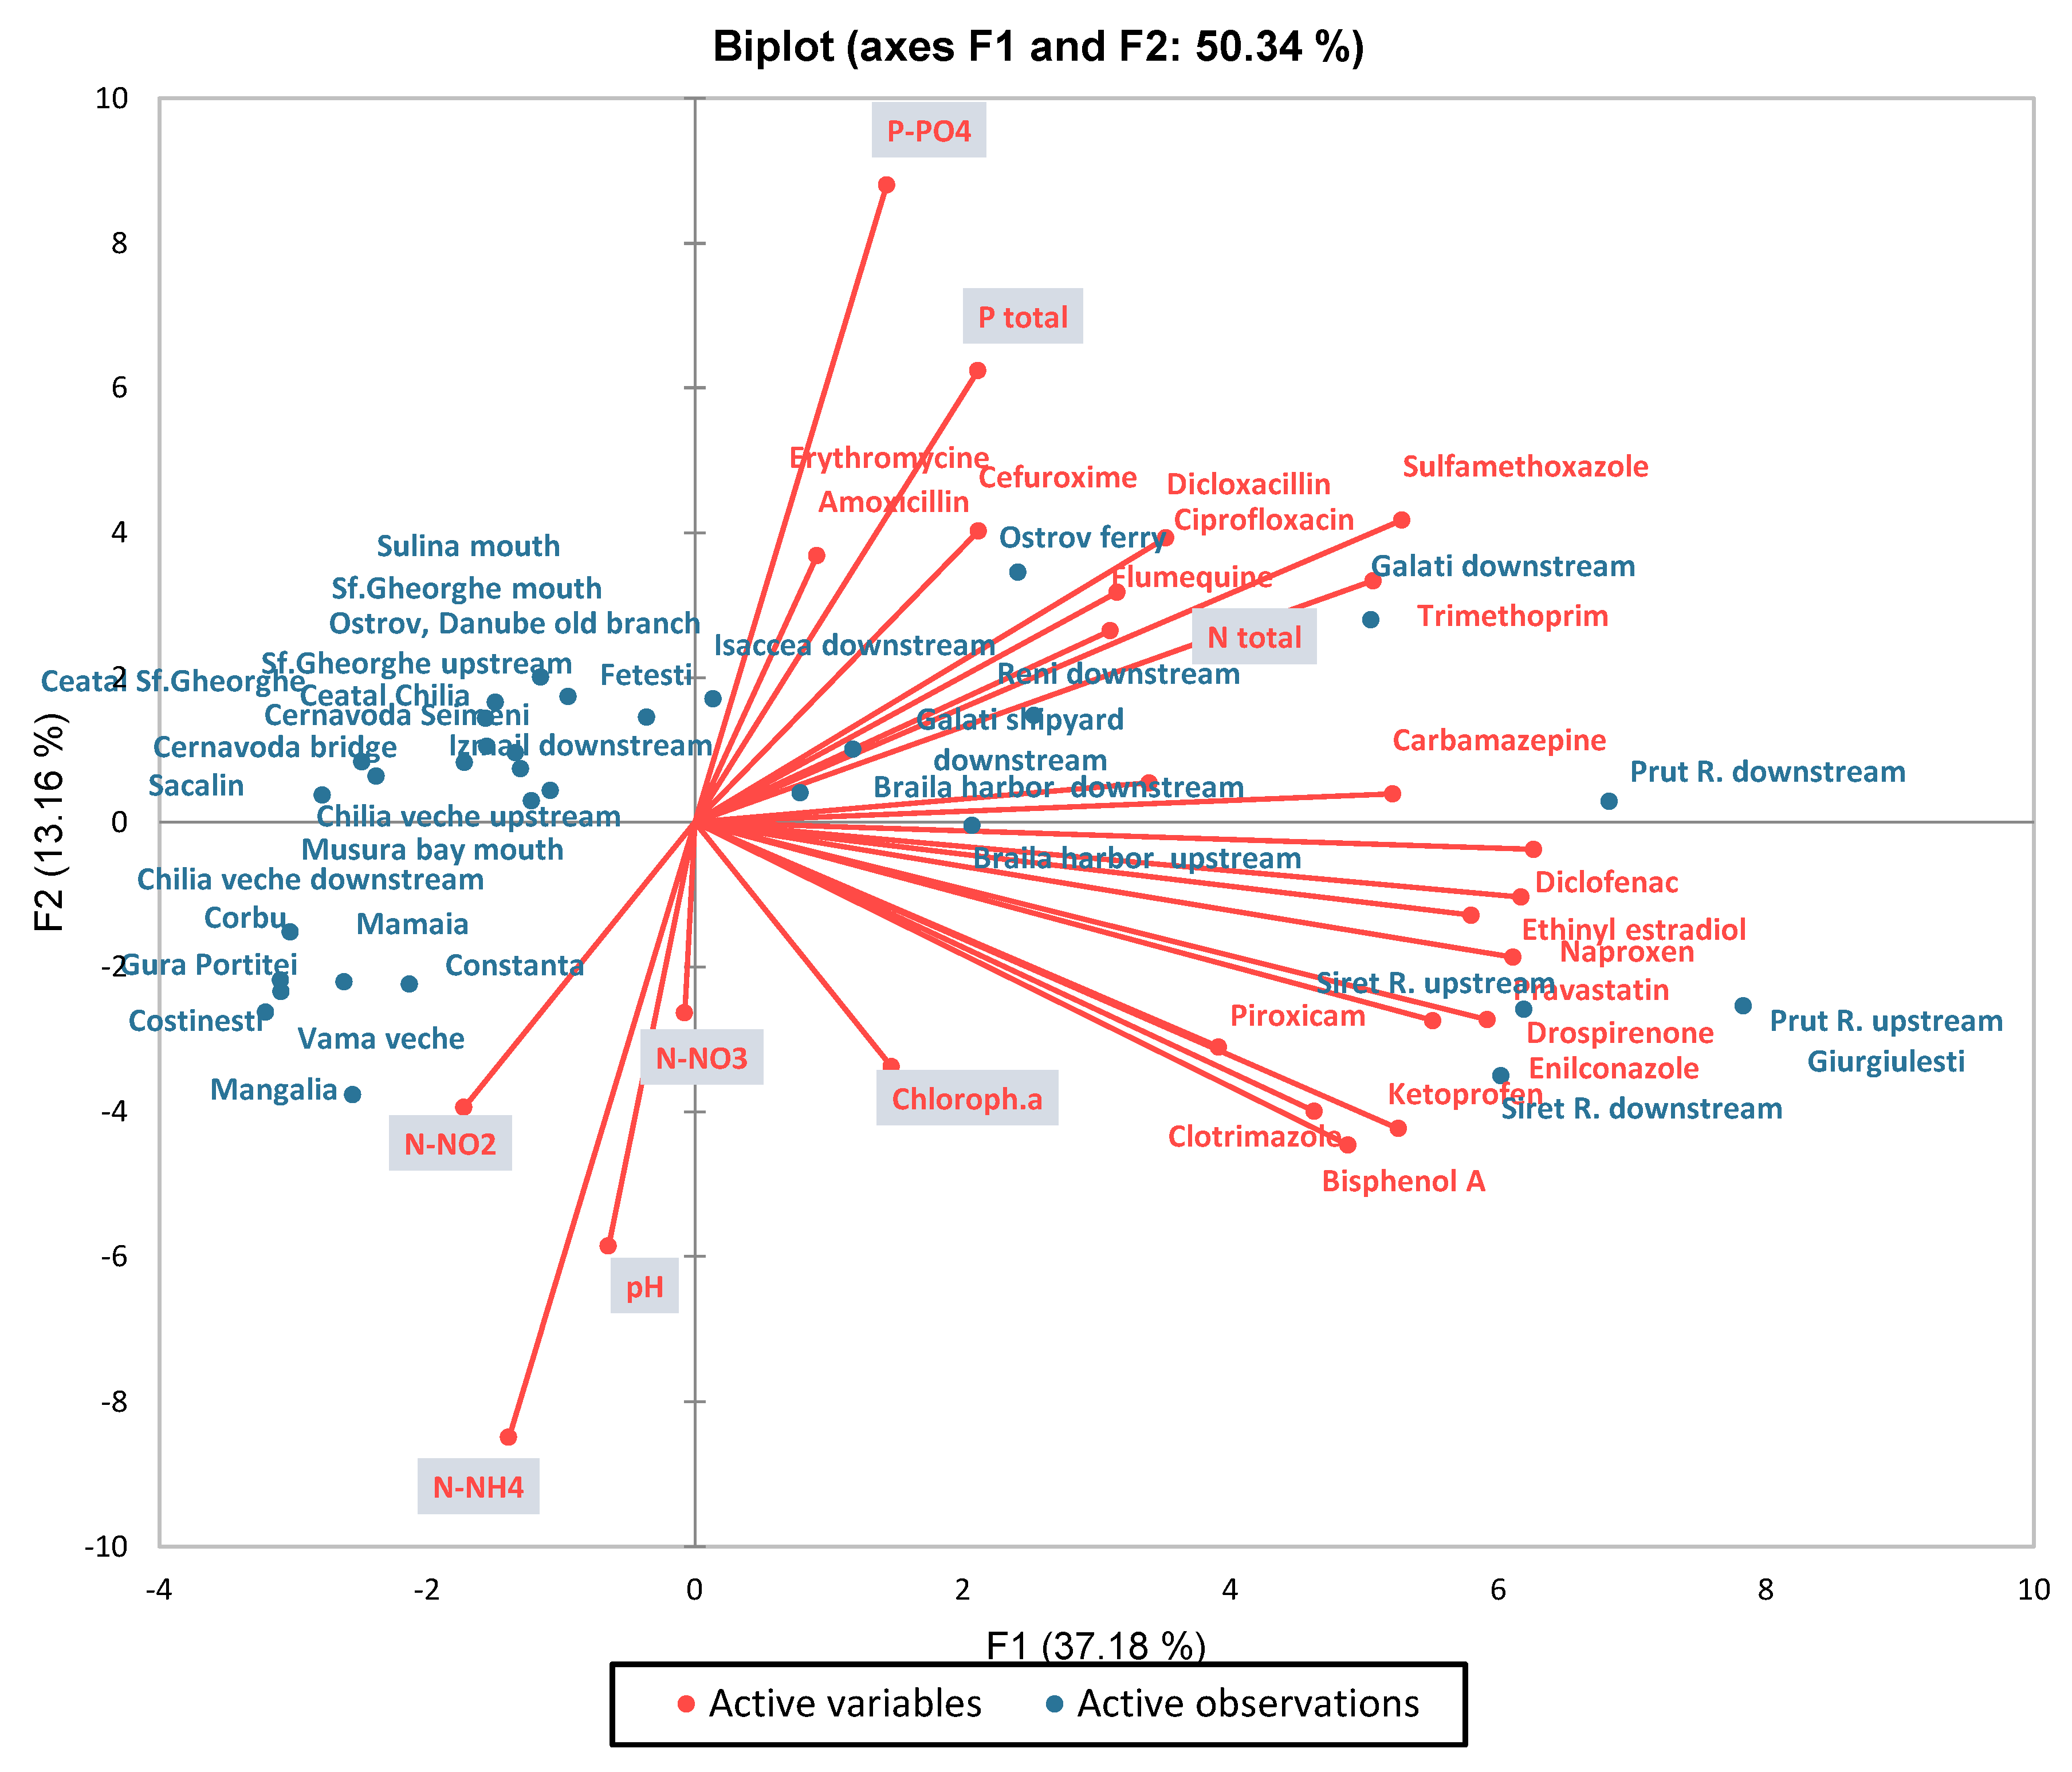
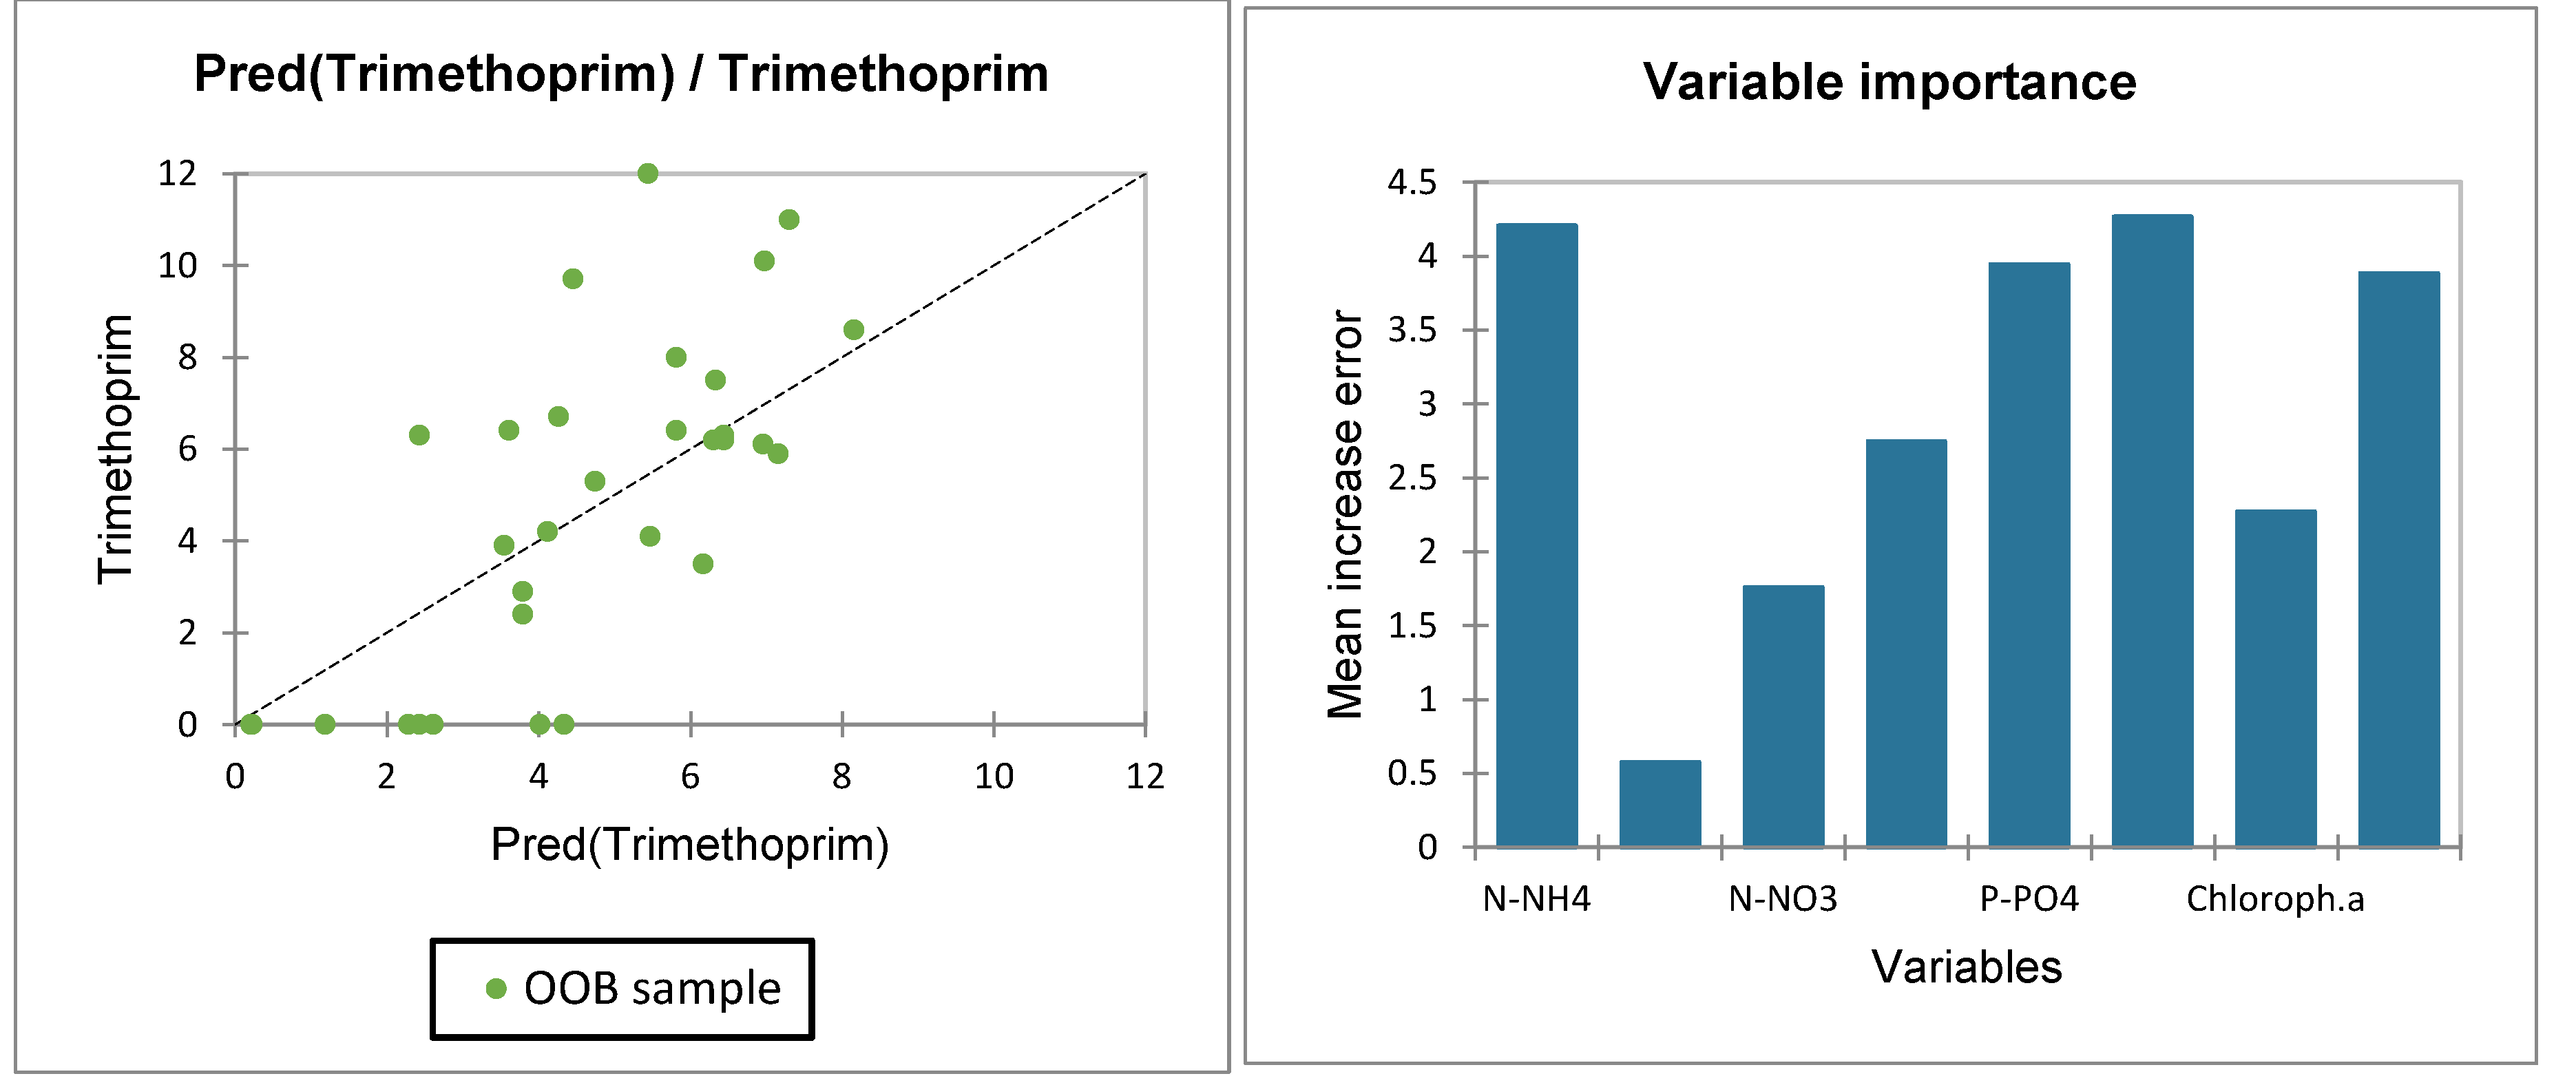
3.3. CECs
3.4. Microbiological Contaminants
4. Conclusions
Supplementary Materials
Author Contributions
Funding
Data Availability Statement
Acknowledgments
Conflicts of Interest
Appendix A
| Site no. | SMX | TMP | CIP | FLU | AMX | CFX | DCX | CBZ | PRV | ERY | PIR | KET | DCF | NAP | IMZ | CLO | DRO | EE2 | BPA |
|---|---|---|---|---|---|---|---|---|---|---|---|---|---|---|---|---|---|---|---|
| 1 | 28.9 | 6.4 | ND | ND | 3.8 | 1.6 | 3.5 | 15.4 | 6.4 | 4.3 | ND | ND | 28 | 6.2 | 8.3 | ND | ND | 1.6 | 238 |
| 2 | 18.6 | ND | ND | ND | ND | ND | ND | 11 | ND | ND | ND | ND | 18.7 | ND | 6.2 | ND | ND | ND | 186 |
| 3 | 24 | 8 | ND | ND | ND | ND | ND | 14.9 | 7 | ND | ND | ND | 41.3 | ND | ND | ND | ND | ND | 182 |
| 4 | 15.4 | 2.4 | ND | ND | ND | ND | ND | 8.4 | ND | ND | ND | ND | 16 | ND | ND | ND | ND | ND | 164 |
| 5 | 21 | 6.2 | ND | ND | ND | ND | ND | 10 | ND | ND | ND | ND | 13.2 | ND | ND | ND | ND | ND | 157 |
| 6 | 26 | 8.6 | ND | ND | ND | ND | ND | 16.6 | 18 | ND | 14.6 | ND | 69 | ND | ND | ND | 1.8 | 1.8 | 186 |
| 7 | 18.4 | 4.1 | ND | ND | ND | ND | ND | 35 | 6.4 | ND | ND | ND | 87 | ND | ND | ND | 2.3 | ND | 173 |
| 8 | 32 | 6.7 | ND | ND | ND | ND | ND | 30.4 | 21.4 | ND | 32 | 26 | 112 | 6.1 | 27.6 | ND | 1.8 | 2.15 | 297 |
| 9 | 28 | 10.1 | ND | ND | ND | ND | ND | 37 | 20.7 | ND | 28.6 | 20.8 | 80 | 4.9 | 24.6 | 6.4 | 2.05 | 2.1 | 310 |
| 10 | 35 | 11 | 5.2 | 6.4 | ND | 4.9 | 7 | 26 | 6.8 | ND | 8.9 | 7.5 | 87 | 5.2 | 6.8 | ND | 1.04 | 2.4 | 138 |
| 11 | 21 | 6.4 | ND | ND | ND | ND | ND | 12.2 | 4.3 | ND | 16 | ND | 46 | ND | 10.5 | ND | 1.75 | 1.3 | 142 |
| 12 | 24 | 12 | 4.1 | ND | ND | ND | ND | 38 | 24.8 | ND | ND | 12.6 | 132 | 8.6 | 31.4 | 8.2 | 3.4 | 3.05 | 342 |
| 13 | 25 | 7.5 | 3.4 | 4.6 | ND | ND | 9.4 | 27.8 | 24 | ND | ND | 8.2 | 114 | 6.2 | 24.6 | 5 | 2.6 | 1.62 | 317 |
| 14 | 36 | 6.2 | 5 | ND | ND | ND | 3.6 | 18.9 | 16.2 | ND | 5.6 | 5.6 | 95 | ND | 10.2 | ND | ND | 1.15 | 156 |
| 15 | 22 | 5.9 | ND | ND | ND | ND | 4 | 20 | 9 | ND | ND | ND | 32 | ND | ND | ND | ND | ND | 141 |
| 16 | 14 | 6.3 | ND | ND | ND | ND | ND | 16.3 | 4.2 | ND | ND | ND | 12.9 | ND | ND | ND | ND | ND | 92 |
| 17 | 18 | 6.1 | ND | ND | ND | ND | ND | 12 | ND | ND | ND | ND | 9.4 | ND | ND | ND | ND | ND | 85 |
| 18 | 11.8 | 2.9 | 3.4 | ND | ND | ND | ND | 17 | 3.1 | ND | ND | ND | 24.8 | ND | ND | ND | ND | ND | 63 |
| 19 | 7.4 | 4.2 | ND | ND | ND | ND | ND | 6.2 | ND | ND | ND | ND | 4.6 | ND | ND | ND | ND | ND | 49 |
| 20 | 12.5 | 3.5 | ND | ND | ND | ND | ND | 8 | ND | ND | ND | ND | 5.5 | ND | ND | ND | ND | ND | 54 |
| 21 | 14 | 3.9 | 3.1 | ND | ND | ND | ND | 18 | ND | ND | ND | ND | 25.3 | ND | ND | ND | ND | ND | 48 |
| 22 | 24 | 9.7 | ND | ND | ND | ND | ND | 10.2 | ND | ND | ND | ND | 12.8 | ND | 4.8 | ND | ND | ND | 183 |
| 23 | 21 | 6.3 | 1.8 | ND | ND | ND | ND | 26.7 | ND | ND | ND | ND | 18.4 | ND | 6.2 | ND | ND | ND | 51 |
| 24 | 15.7 | 5.3 | 2.6 | ND | ND | ND | ND | 19.5 | ND | ND | ND | ND | 21.7 | ND | ND | ND | ND | ND | 34.5 |
| 25 | 3.2 | ND | ND | ND | ND | ND | ND | 5.6 | ND | ND | ND | ND | ND | ND | ND | ND | ND | ND | 87 |
| 26 | 4 | ND | ND | ND | ND | ND | ND | ND | ND | ND | ND | ND | ND | ND | ND | ND | ND | ND | 114 |
| 27 | ND | ND | ND | ND | ND | ND | ND | ND | ND | ND | ND | ND | ND | ND | ND | ND | ND | ND | 124 |
| 28 | 6.5 | ND | ND | ND | ND | ND | ND | 8.6 | ND | ND | ND | ND | 5.7 | ND | ND | ND | ND | ND | 218 |
| 29 | 7.9 | ND | ND | ND | ND | ND | ND | 26.7 | ND | ND | ND | ND | 14.8 | ND | ND | ND | ND | ND | 237 |
| 30 | 5.2 | ND | ND | ND | ND | ND | ND | ND | ND | ND | ND | ND | 6.2 | ND | ND | ND | ND | ND | 107 |
| 31 | 11.4 | ND | ND | ND | ND | ND | ND | 8.9 | ND | ND | ND | ND | 8.4 | ND | ND | ND | ND | ND | 164 |
| 32 | 10 | ND | ND | ND | ND | ND | ND | ND | ND | ND | ND | ND | ND | ND | ND | ND | ND | ND | 127 |
References
- Sommerwerk Nike, Jürg Bloesch, Christian Baumgartner, Thomas Bittl, Dubravka Čerba, Béla Csányi, Grigore Davideanu, Martin Dokulil, Georg Frank, Iulia Grecu, Thomas Hein, Vladimír Kováč, Iulian Nichersu, Tibor Mikuska, Karin Pall, Momir Paunović, Carmen Postolache, Maja Raković, Cristina Sandu, Martin Schneider-Jacoby, Katharina Stefke, Klement Tockner, Ion Toderaş, Laurenţia Ungureanu. Chapter 3 - The Danube River Basin, In: Rivers of Europe (Second Edition), Editor(s): Klement Tockner, Christiane Zarfl, Christopher T. Robinson, Elsevier, 2022, pp. 81–180, ISBN 9780081026120. [CrossRef]
- Bănăduc, D.; Rey, S.; Trichkova, T.; Lenhardt, M.; Curtean-Bănăduc, A. The Lower Danube River—Danube Delta—North West Black Sea: A pivotal area of major interest for the past, present and future of its fish fauna—A short review. Sci. Total Environ. 2016, 545, 137–151. [Google Scholar] [CrossRef] [PubMed]
- Chiţescu, C.L.; Ene, A.; Geana, E.-I.; Vasile, A.M.; Ciucure, C.T. Emerging and Persistent Pollutants in the Aquatic Ecosystems of the Lower Danube Basin and North West Black Sea Region—A Review. Appl. Sci. 2021, 11, 9721. [Google Scholar] [CrossRef]
- Syeed, M. M., Hossain, M. S., Karim, M. R., Uddin, M. F., Hasan, M.,; Khan, R. H. Surface water quality profiling using the water quality index, pollution index and statistical methods: A critical review. Environmental and Sustainability Indicators 2023, 18, 100247. [Google Scholar] [CrossRef]
- Madhav, S., Ahamad, A., Singh, A. K., Kushawaha, J., Chauhan, J. S., Sharma, S., & Singh, P. 2020. Water Pollutants: Sources and Impact on the Environment and Human Health. In Sensors in Water Pollutants Monitoring: Role of Material (Pooja, D., Kumar, P., Singh, P., Patil, S. (Eds.)). Springer, Singapore, 2020, pp 43–62. [CrossRef]
- Podlasek, A.; Koda, E.; Kwas, A.; et al. Anthropogenic and Natural Impacts on Surface Water Quality: The Consequences and Challenges at the Nexus of Waste Management Facilities, Industrial Zones, and Protected Areas. Water Resour. Manage. 2024. [Google Scholar] [CrossRef]
- Bashir, I. , Lone, F.A., Bhat, R.A., Mir, S.A., Dar, Z.A., Dar, S.A., 2020. Concerns and Threats of Contamination on Aquatic Ecosystems. Bioremediation and Biotechnology 2020, 27, 1–26. [Google Scholar] [CrossRef]
- Enachi, E. , Bahrim, G.E., Ene, A. Pharmaceutical compounds and endocrine disruptors in aquatic environments: Ecotoxicological effects and analysis methodology. Annals of the Dunarea de Jos University of Galati. Fasc. II, Mathematics, Physics, Theoretical Mechanics 2019, 42, 172–182. [Google Scholar]
- Ghani, S. A. , Hamdona, S., Shakweer, L., El Saharty, A. Spatial distribution and pollution assessment of heavy metals in surface and bottom water along the eastern part of the Egyptian Mediterranean coast: Mar. Pollut. Bull., 2023, 197, 115713.
- Ene A., Moraru D.I., Pintilie V., Iticescu C., Georgescu P.L. Metals and natural radioactivity investigation of Danube River water in the lower sector. Romanian Journal of Physics 2024, 69, 702. [Google Scholar] [CrossRef]
- Seif, R.A.; Ene, A.; Zakaly, H.M.H.; Sallam, A.M.; Taalab, S.A.; Fnais, M.S.; Saadawi, D.A.; Amer, S.A.; Awad, H.A. Distribution of Heavy Metals along the Mediterranean Shoreline from Baltim to El-Burullus (Egypt): Consequences for Possible Contamination. Minerals 2024, 14, 931. [Google Scholar] [CrossRef]
- Teodorof, L.; Ene, A.; Burada, A.; Despina, C.; Seceleanu-Odor, D.; Trifanov, C.; Ibram, O.; Bratfanof, E.; Tudor, M.-I.; Tudor, M.; Cernisencu, I.; Georgescu, L. P.; Iticescu, C. Integrated Assessment of Surface Water Quality in Danube River Chilia Branch. Appl. Sci. 2021, 11, 9172. [Google Scholar] [CrossRef]
- Pall, E.; Niculae, M.; Kiss, T. , Șandru, C.D.; Spînu, M. Human impact on the microbiological water quality of the rivers. Journal of Medical Microbiology 2013, 62, 1635–1640. [Google Scholar] [CrossRef]
- Allen, M.J.; Edberg, S.C.; Reasoner, D.J. Heterotrophic plate count bacteria—what is their significance in drinking water? International Journal of Food Microbiology 2004, 92(3), 265–274. [Google Scholar] [CrossRef]
- EU. Directive 2013/39/EC of the European Parliament and of the Council of 12 August 2013 amending Directives 2000/60/EC and 2008/105/EC as regards priority substances in the field of water policy. Off. J. Eur. Union. 2013, L226, 1–17. [Google Scholar]
- European Commission: Commission Implementing Decision (EU) 2022/1307 of 22 July 2022 establishing a watch list of substances for Union-wide monitoring in the field of water policy pursuant to Directive 2008/105/EC of the European Parliament and of the Council. Off. J. Eur. Union 2022, L197, 117–121.
- European Commission: Commission Implementing Decision (EU) 2015/495 of 20 March 2015 establishing a watch list of substances for Union-wide monitoring in the field of water policy pursuant to Directive 2008/105/EC of the European Parliament and of the Council (notified under document C(2015) 1756). Off. J. Eur Union 2015, L78, 40–42. Available online: http://data.europa.eu/eli/dec_impl/2015/495/oj (accessed on 6 November 2024).
- European Commission: Commission Implementing Decision (EU) 2018/840 of 5 June 2018 establishing a watch list of substances for Union-wide monitoring in the field of water policy pursuant to Directive 2008/105/EC of the European Parliament and of the Council and repealing Commission Implementing Decision (EU) 2015/495 (notified under document C(2018) 3362). Off. J. Eur Union 2018, L141, 9–12. Available online: http://data.europa.eu/eli/dec_impl/2018/840/oj (accessed on 6 November 2024).
- European Commission: Commission Implementing Decision (EU) 2019/1942 of 22 November 2019 not approving carbendazim as an existing active substance for use in biocidal products of product-type 9. 2019.
- European Commission: Commission Implementing Decision (EU) 2021/348 of 25 February 2021 approving carbendazim as an existing active substance for use in biocidal products of product-types 7 and 10. 2021.
- Kern, K. New standards for the chemical quality of water in Europe under the new Directive 2013/39/EU. Journal for European Environmental & Planning Law 2014, 11, 31–48. [Google Scholar]
- Gomez Cortes, L., Marinov, D., Sanseverino, I., Navarro Cuenca, A., Niegowska, M., Porcel Rodriguez, E., ... & Lettieri, T. Selection of substances for the 4th Watch List under the Water Framework Directive. Publications Office of the European Union: Luxembourg, 2022, ISBN 978-92-76-55020-4. https://www.waternewseurope.com/wp-content/uploads/2022/08/JRC-Technical-Report.pdf.
- Chitescu, C. L., Kaklamanos, G., Nicolau, A. I., & Stolker, A. A. M. L. High sensitive multiresidue analysis of pharmaceuticals and antifungals in surface water using U-HPLC-Q-Exactive Orbitrap HRMS. Application to the Danube river basin on the Romanian territory. Sci. Total Environ. 2015, 532, 501–511. [CrossRef]
- Wilkinson, J.L.; Boxall, A.B.A.; Kolpin, D.W.; Leung, K.M.Y.; Lai, R.W.S.; Galbán-Malagón, C.; Adell, A.D.; Mondon, J.; Metian, M.; Marchant, R.A.; et al. Pharmaceutical pollution of the world’s rivers. Proc. Natl. Acad. Sci. 2022, 119, e2113947119. [Google Scholar] [CrossRef]
- József, T.; Kiss, S.R.; Muzslay, F.; Máté, O.; Stromájer, G.P.; Stromájer-Rácz, T. Detection and Quantification of Pharmaceutical Residues in the Pest County Section of the River Danube. Water 2023, 15, 1755. [Google Scholar] [CrossRef]
- Gurgenidze, D.; Romanovski, V. The Pharmaceutical Pollution of Water Resources Using the Example of the Kura River (Tbilisi, Georgia). Water 2023, 15, 2574. [Google Scholar] [CrossRef]
- Jendrzejewska, N.; Karwowska, E. Ciprofloxacin and Imipenem Resistance in Bathing Waters—Preliminary Studies of Great Rudnickie Lake. Appl. Sci. 2024, 14, 6238. [Google Scholar] [CrossRef]
- International Commission for the Protection of Danube River (ICPDR), Joint Danube Survey 1 (JDS1) Report 2002. https://www.icpdr.org/tasks-topics/topics/water-quality/joint-danube-survey/joint-danube-survey-1.
- International Commission for the Protection of Danube River (ICPDR), Joint Danube Survey 2 (JDS2) Report 2008. https://www.danubesurvey.org/jds2/files/ICPDR_Technical_Report_for_web_low_corrected.pdf.
- International Commission for the Protection of Danube River (ICPDR), Joint Danube Survey 3 (JDS3) Report 2015. https://www.danubesurvey.org/jds3/.
- International Commission for the Protection of Danube River (ICPDR), Joint Danube Survey 4 (JDS4) Report, 2021. https://www.danubesurvey.org/jds4/files/nodes/documents/jds4_scientific_report_20mb.pdf.
- Ene, A.; Denga, Y.; Bogdevich, O.; Zubcov, E. (Eds.) Atlas of Maps; Tehno Press: Iasi, Romania, 2015; Available online: https://www.researchgate.net/publication/305317824_Atlas_of_Maps (accessed on 10 May 2024)ISBN 978-606-687-235-5.
- Ene, A., Zubcov, E., Spanos, T., Bogdevich, O., Teodorof, L. MONITOX international network for monitoring of environmental toxicants and risk assessment in the Black Sea Basin: research and interdisciplinary cooperation dimensions. In: 10th International Conference “Sustainable Use and Protection of Animal World in the Context of Climate Change”, 16–17 September 2021, Chisinau, Moldova, pp. 11–17. [CrossRef]
- Jitar, O. , Teodosiu, C., Nicoara, M., Plavan, G. Study of heavy metal pollution and bioaccumulation in the Black Sea living environment. Environ. Eng. Manag. J. 2013, 12, 271–276. [Google Scholar]
- Enachi, Elena, Ene, Antoaneta, Chiţescu, Lidia, Carmen. Emerging contaminants in the environment – ecotoxicological effects. In Ecotoxicological methodological guide for environmental monitoring: problematics, laboratory techniques and health risk investigation, Tipografia Centrală, Chișinău, Moldova, 2021, pp. 73–96. ISBN 978-9975-157-99-5. https://www.researchgate.net/publication/389499779_Emerging_contaminants_in_the_environment_-_ecotoxicological_effects.
- Chiţescu, Lidia, Carmen; Ene, Antoaneta. Chapter 7. High Resolution Mass Spectrometry-based methods for pharmaceuticals monitoring in water, soil and sediment. In High-performance analytical techniques for the monitoring of toxicants in environment. Methodological guide / Tehnici analitice de înaltă performanță pentru monitorizarea substanțelor toxice din mediu. Ghid metodologic (Editor: Antoaneta Ene), Editura Casa Cartii de Stiinta, Cluj Napoca, 2021, ISBN: 978-606-17-1848-1, pp 65–84. https://blacksea-cbc.net/images/e-library/BSB27_MONITOX_-__Methodological_guide_on_high-performance_analytical_techniques_for_the_monitoring_of_toxic_chemicals_in_environment_EN_RO.pdf.
- Teodorof, L., Despina, C., Burada, A. Seceleanu-Odor, D., Anuti I. Metode de monitorizare a indicatorilor fizico~chimici în ecosistemele acvatice ale Deltei Dunării. In Ghid metodologic de monitorizare a factorilor hidromofologici, chimici si biologici pentru apele de suprafata din rezervatia Biosferei Delta Dunarii (Editor: Iuliana Mihaela Tudor). Publisher: Centrul de Informare Tehnologică Delta Dunării, Tulcea, Romania, 2015. ISBN: 978-606-93721-8-0.
- ISO/IEC 17025 General requirements for the competence of testing and calibration laboratories, https://www.iso.org/standard/66912.html.
- Bings, N.H. , Orlandini von Niessen, J.O., Schaper, J.N. 2014. Liquid sample introduction in inductively coupled plasma atomic emission and mass spectrometry — Critical review. Spectrochim. Acta B: At. Spectrosc. 2014, 100, 14–37. [Google Scholar] [CrossRef]
- Teodorof, L. , Nastase, C., Anuti, I., Stroe, M. The application of flow injection technology to automating cold vapor mercury analyses in aquatic ecosystems. Adv. Electr. Comput. Eng. 2009, 9, 67–69. [Google Scholar] [CrossRef]
- Abebe, Y, Alamirew, T. , Whitehead P., Charles, K., Alemayehu, E. Spatio-temporal variability and potential health risks assessment of heavy metals in the surface water of Awash basin, Ethiopia. Heliyon 2023, 9, e15832. [Google Scholar] [CrossRef]
- XLSTAT software (version Basic+, 2023.3.0.1415). https://www.xlstat.com/en/solutions/basic-plus.
- Lipps, W.C.; Braun-Howland, E.B.; Baxter, T.E (eds)., 2023. Standard Methods for the Examination of Water and Wastewater. 24th Edition., American Public Health Association (APHA), American Water Works Association (AWWA), Water Environment Federation (WEF), Washington DC: APHA Press, ISBN: 0875532993 / 9780875532998.
- *** ISO 4831:2006 (E), Microbiology of food and animal feeding stuffs — Horizontal method for the detection and enumeration of coliforms — Most probable number technique.
- Reyjol, Y. , Argillier, C., Bonne, W., Borja, A., Buijse, A. D., Cardoso, A. C., van de Bund, W. Assessing the ecological status in the context of the European Water Framework Directive: where do we go now? Sci. Total Environ. 2014, 497, 332–344. [Google Scholar] [CrossRef]
- WATER FRAMEWORK DIRECTIVE - establishing a framework for Community action in the field of water policy (2000/60/EC) Official Journal L 327.
- *** Order 161/2006, regarding the classification of surface water quality to determine the ecological status of water bodies, Table no. 6, Elements and biological quality standards, chemical and physico-chemical for setting ecological status of surface waters, Annex C, Elements and chemical, physico-chemical quality standards in water. (published in June 13, 2006), Bucharest [In Romanian]. https://legislatie.just.ro/Public/DetaliiDocument/74255.
- Iticescu, C. , Murariu, G., Georgescu, L. P., Burada, A., & Topa, C. M. Seasonal variation of the physico-chemical parameters and Water Quality Index (WQI) of Danube water in the transborder Lower Danube area. Rev. Chim. 2016, 67, 1843–1849. [Google Scholar]
- Wiesner, C., Schotzko, N., Černý, J., Guti, G., Davideanu, G., Jepsen, N. Technical report with results from the fish sampling and analyses from the Joint Danube Survey 2007. International Commission for the Protection of the Danube River, Vienna, 2008. 73 pp.
- NORMAN. Europe-wide Prioritisation of 966 NORMAN Substances as of 25 July 2016–Combined freshwater/marine water with Data from 2009–2016. 2017. Available online: https://www.norman-network.com/nds/prioritisation/ (accessed on 10 March 2023).
- Ternes, T. A. , Joss, A., & Siegrist, H. Peer reviewed: scrutinizing pharmaceuticals and personal care products in wastewater treatment. Environmental science & technology 2004, 38, 392A–399A. [Google Scholar]
- Luo, Y. , Guo, W., Ngo, H. H., Nghiem, L. D., Hai, F. I., Zhang, J.,... & Wang, X. C. (2014). A review on the occurrence of micropollutants in the aquatic environment and their fate and removal during wastewater treatment. Sci. Total Environ. 2014, 473, 619–641. [Google Scholar]
- Loos, R.; Tavazzi, S.; Mariani, G.; Suurkuusk, G.; Paracchini, B.; Umlauf, G. Analysis of Emerging Organic Contaminants in Water, Fish and Suspended Particulate Matter (SPM) in the Joint Danube Survey Using Solid-Phase Extraction Followed by UHPLC-MS-MS and GC–MS Analysis. Sci. Total Environ. 2017, 607–608, 1201–1212. [Google Scholar] [CrossRef]
- Ferencik, M. , Blahova, J., Schovankova, J., Siroka, Z., Svobodova, Z., Kodes, V.,... & Lakdawala, P. Residues of selected anticonvulsive drugs in surface waters of the elbe river basin (czech republic). Water 2022, 14, 4122. [Google Scholar]
- Cunningham, V. L. , Perino, C., Vincent, J. D., Hartmann, A., & Bechter, R. Human health risk assessment of carbamazepine in surface waters of North America and Europe. Regulatory Toxicology and Pharmacology 2010, 56, 343–351. [Google Scholar]
- Patrolecco, L. , Rauseo, J., Ademollo, N., Grenni, P., Cardoni, M., Levantesi, C.,... & Caracciolo, A. B. Persistence of the antibiotic sulfamethoxazole in river water alone or in the co-presence of ciprofloxacin. Sci. Total Environ. 2018, 640, 1438–1446. [Google Scholar] [PubMed]
- Gil-Solsona, R. , Castaño-Ortiz, J. M., Muñoz-Mas, R., Insa, S., Farré, M., Ospina-Alvarez, N.,... & Rodríguez-Mozaz, S. A holistic assessment of the sources, prevalence, and distribution of bisphenol A and analogues in water, sediments, biota and plastic litter of the Ebro Delta (Spain). Environmental Pollution 2022, 314, 120310. [Google Scholar]
- Staples, C. , van der Hoeven, N., Clark, K., Mihaich, E., Woelz, J., & Hentges, S. Distributions of concentrations of bisphenol A in North American and European surface waters and sediments determined from 19 years of monitoring data. Chemosphere 2018, 201, 448–458. [Google Scholar]
- ICPDR, The Joint Danube Survey 2001, Chapter 4.7 MICROBIOLOGY, pp. 168-150, https://www.icpdr.org/sites/default/files/JDS%2010%20Chapt%204e.pdf.
- Tang, Z. , Liu, Z. H., Wang, H., Dang, Z., & Liu, Y. A review of 17α-ethynylestradiol (EE2) in surface water across 32 countries: Sources, concentrations, and potential estrogenic effects. Journal of environmental management 2021, 292, 112804. [Google Scholar]
- Amanidaz, N.; Zafarzadeh, A.; Mahvi, A.H. The Interaction between Heterotrophic Bacteria and Coliform, Feacal Coliform, Feacal Streptococci Bacteria in the Water Supply Networks. Iran J. Public Health 2015, 44(12):1685–1692.
- LeChevallier, M.W.; Prosser, T.; Stevens, M. Opportunistic Pathogens in Drinking Water Distribution Systems-A Review. Microorganisms 2024, 12, 916. [Google Scholar] [CrossRef]
- Banciu, A.R.; Ionica, D.L.; Vaideanu, M.A.; Radulescu, D.M.; Nita-Lazar, M.; Covaliu, C.I. The Occurrence of Potentially Pathogenic and Antibiotic Resistant Gram-Negative Bacteria Isolated from the Danube Delta Ecosystem. Sustainability 2021, 13, 3955. [Google Scholar] [CrossRef]
- Kademane, C.; Rajesh, M.; Rajesh K., M.; Vandana, K. Studies on heterotrophic bacteria and total coliforms in relation with environmental parameters of water in Gurupur estuary, off Mangaluru, Karnataka, India, Pollution Research 2018, 37(4), 989-995.
| No. | Sampling sites | N-NH4 mg N/L |
N-NO2 mg N/L |
N-NO3 mg N/L |
N total mg N/L |
P-PO4 mg P/L |
P total mg P/L |
Chloroph. a µg/L |
pH pH unit |
|---|---|---|---|---|---|---|---|---|---|
| 1 | Ostrov ferry | 0.085 | 0.013 | 1.130 | 2.640 | 0.043 | 0.116 | 4.89 | 8.83 |
| 2 | Ostrov, Danube old branch | 0.051 | 0.012 | 1.333 | 1.940 | 0.053 | 0.091 | 2.93 | 7.81 |
| 3 | Fetesti | 0.195 | 0.016 | 0.944 | 1.568 | 0.038 | 0.103 | 5.87 | 7.77 |
| 4 | Cernavoda bridge | 0.068 | 0.011 | 1.370 | 2.788 | 0.034 | 0.102 | 9.91 | 8.87 |
| 5 | Cernavoda Seimeni | 0.125 | 0.015 | 1.148 | 1.496 | 0.038 | 0.095 | 5.74 | 8.78 |
| 6 | Braila harbor upstream | 0.100 | 0.019 | 0.870 | 2.936 | 0.027 | 0.096 | 6.72 | 8.73 |
| 7 | Braila harbor downstream | 0.065 | 0.016 | 1.000 | 2.396 | 0.038 | 0.079 | 5.73 | 8.81 |
| 8 | Siret R. upstream | 0.253 | 0.048 | 1.481 | 3.172 | 0.033 | 0.172 | 4.4 | 8.66 |
| 9 | Siret R. downstream | 0.193 | 0.047 | 1.611 | 1.580 | 0.022 | 0.107 | 7.34 | 8.6 |
| 10 | Galati downstream | 0.085 | 0.017 | 0.963 | 1.388 | 0.026 | 0.089 | 5.56 | 8.82 |
| 11 | Galati shipyard downstream | 0.069 | 0.016 | 1.278 | 2.188 | 0.033 | 0.266 | 4.35 | 8.71 |
| 12 | Prut R. upstream Giurgiulesti | 0.075 | 0.023 | 0.778 | 2.152 | 0.012 | 0.061 | 7.72 | 8.66 |
| 13 | Prut R. downstream | 0.080 | 0.019 | 1.019 | 2.432 | 0.033 | 0.140 | 6.29 | 8.78 |
| 14 | Reni downstream | 0.080 | 0.019 | 1.056 | 2.564 | 0.031 | 0.117 | 2.83 | 8.68 |
| 15 | Isaccea downstream | 0.106 | 0.021 | 1.037 | 2.656 | 0.033 | 0.205 | 5.66 | 8.59 |
| 16 | Ceatal Chilia | 0.086 | 0.027 | 1.111 | 1.964 | 0.029 | 0.128 | 2.41 | 8.63 |
| 17 | Izmail downstream | 0.083 | 0.035 | 0.998 | 1.564 | 0.021 | 0.118 | 3.20 | 8.44 |
| 18 | Ceatal Sf.Gheorghe | 0.054 | 0.044 | 1.052 | 1.423 | 0.032 | 0.098 | 3.40 | 8.52 |
| 19 | Chilia veche upstream | 0.071 | 0.050 | 1.031 | 1.228 | 0.035 | 0.121 | 3.65 | 8.48 |
| 20 | Chilia veche downstream | 0.086 | 0.050 | 1.058 | 1.325 | 0.034 | 0.088 | 3.69 | 8.48 |
| 21 | Sf.Gheorghe upstream | 0.068 | 0.047 | 1.020 | 1.264 | 0.038 | 0.184 | 2.96 | 8.63 |
| 22 | Musura bay mouth | 0.044 | 0.039 | 0.881 | 1.464 | 0.024 | 0.064 | 1.98 | 8.9 |
| 23 | Sulina mouth | 0.049 | 0.048 | 0.996 | 1.172 | 0.035 | 0.164 | 3.36 | 8.42 |
| 24 | Sf.Gheorghe mouth | 0.054 | 0.042 | 0.963 | 1.044 | 0.030 | 0.139 | 3.04 | 8.56 |
| 25 | Sacalin | 0.066 | 0.041 | 0.999 | 1.300 | 0.029 | 0.113 | 4.07 | 8.48 |
| 26 | Gura Portitei | 0.28 | 0.035 | 1.870 | 2.185 | 0.006 | 0.024 | 1.36 | 8.99 |
| 27 | Corbu | 0.209 | 0.029 | 1.871 | 2.109 | 0.006 | 0.022 | 2.28 | 9.01 |
| 28 | Mamaia | 0.198 | 0.029 | 0.950 | 1.177 | 0.005 | 0.019 | 4.40 | 9.24 |
| 29 | Constanta | 0.335 | 0.024 | 0.873 | 1.232 | 0.006 | 0.023 | 0.78 | 9.05 |
| 30 | Costinesti | 0.26 | 0.06 | 1.250 | 1.570 | 0.005 | 0.020 | 6.64 | 8.98 |
| 31 | Mangalia | 0.45 | 0.044 | 0.716 | 1.210 | 0.005 | 0.018 | 17.34 | 9.23 |
| 32 | Vama veche | 0.29 | 0.022 | 0.787 | 1.099 | 0.011 | 0.045 | 2.11 | 9.09 |
| Ecological status according to Romanian Order no. 161/2006 [47] | |||||||||
| Highest ecological status | 0.400 | 0.010 | 1.000 | 1.500 | 0.100 | 0.150 | 25 | 6.5-8.5 | |
| Good ecological status | 0.800 | 0.030 | 3.000 | 7.000 | 0.200 | 0.400 | 50 | ||
| Moderate ecological status | 1.200 | 0.060 | 5.600 | 12.000 | 0.400 | 0.750 | 100 | ||
| Poor ecological status | 3.200 | 0.300 | 11.200 | 16.000 | 0.900 | 1.200 | 250 | ||
| Bad ecological status | >3.200 | >0.300 | >11.200 | >16.000 | >0.900 | >1.200 | >250 | ||
| Compound | Abbreviation | Min. value ng/L | Max. value ng/L | Average ng/L | Lower PNEC* ng/L fresh/marine water |
No. of positive results |
|---|---|---|---|---|---|---|
| Sulfamethoxazole | SMX | 3.2 | 36 | 18.13 | 100 / 60 | 31 |
| Trimethoprim | TMP | 2.4 | 12 | 6.35 | 100 | 25 |
| Ciprofloxacin | CIP | 1.8 | 5.2 | 3.58 | 89 / 8.9 | 8 |
| Flumequine | FLU | 4.6 | 6.4 | 5.5 | 1500 / 150 | 2 |
| Amoxicillin | AMX | 3.8 | - | - | 78 / 7.8 | 1 |
| Cefuroxime | CFX | 1.6 | 4.9 | 3.25 | 1290 / 130 | 2 |
| Dicloxacillin | DCX | 3.5 | 9.6 | 5.5 | 5.1 / 0.51 | 5 |
| Carbamazepine | CBZ | 5.6 | 38 | 18.05 | 50 | 28 |
| Pravastatin | PRV | 3.1 | 24.8 | 12.31 | 4570 / 460 | 15 |
| Erythromycin | ERY | 4.3 | - | - | 300 / 30 | 1 |
| Piroxicam | PIR | 5.6 | 28.6 | 17.62 | 490 / 49 | 6 |
| Ketoprofen | KET | 5.6 | 26 | 13.45 | 2100 / 210 | 6 |
| Diclofenac | DCF | 4.6 | 132 | 40.75 | 50 / 5 | 28 |
| Naproxen | NAP | 4.9 | 8.6 | 6.2 | 1700 / 170 | 6 |
| Enilconazole (Imazalil) | IMZ | 4.8 | 31.4 | 14.64 | 870 / 87 | 11 |
| Clotrimazole | CLO | 5 | 8.2 | 6.53 | 30 / 3 | 3 |
| Drospirenone | DRO | 1.04 | 3.4 | 2.09 | 120 / 12 | 8 |
| 17α-Ethinylestradiol | EE2 | 1.15 | 3.05 | 1.91 | 0.035 / 0.0035 | 9 |
| Bisphenol A | BPA | 34.5 | 342 | 155.2 | 240 / 1600 | 32 |
| No. | Sampling sites | Heterotrophic bacteria, CFU/mL | Total coliforms, MPN/100 mL |
|---|---|---|---|
| 1 | Ostrov ferry | 1,760 | 70,000 |
| 2 | Ostrov, Danube old branch | 12,000 | 5,000 |
| 3 | Fetesti | 2,700 | 7,000 |
| 4 | Cernavoda bridge | 2,240 | 6,000 |
| 5 | Cernavoda Seimeni | 2,300 | 25,000 |
| 6 | Braila harbor upstream | 390 | 1,300 |
| 7 | Braila harbor downstream | 110 | 7,000 |
| 8 | Siret R. upstream | 2,150 | 60,000 |
| 9 | Siret R. downstream | 5,700 | 70,000 |
| 10 | Galati downstream | 1,900 | 2,500 |
| 11 | Galati shipyard downstream | 250 | 11,000 |
| 12 | Prut R. upstream Giurgiulesti | 1,210 | 250 |
| 13 | Prut R. downstream | 270 | 2,500 |
| 14 | Reni downstream | 575 | 7,000 |
| 15 | Isaccea downstream | 2,050 | 2,500 |
| 16 | Ceatal Chilia | 435 | 2,000 |
| 17 | Izmail downstream | 525 | 10 |
| 18 | Ceatal Sf. Gheorghe | 531 | 1,300 |
| 19 | Chilia veche upstream | 2,750 | 7,000 |
| 20 | Chilia veche downstream | 340 | 600 |
| 21 | Sf.Gheorghe upstream | 715 | 2,000 |
| 22 | Musura bay mouth | 1,700 | 250 |
| 23 | Sulina mouth | 125 | 250 |
| 24 | Sf.Gheorghe mouth | 950 | 2,500 |
| 25 | Sacalin | 2,400 | 6,000 |
| 26 | Gura Portitei | 400 | 600 |
| 27 | Corbu | 65 | 130 |
| 28 | Mamaia | 72 | 120 |
| 29 | Constanta | 70 | 200 |
| 30 | Costinesti | 53 | 300 |
| 31 | Mangalia | 42 | 120 |
| 32 | Vama veche | 35 | 250 |
| Microbiological pollution quality classes for bathing waters [60] | Indicator of organic pollution | Indicator of fecal pollution | |
| Class I - Low | <500 | <500 | |
| Class II - Moderate | 500-10,000 | 500-10,000 | |
| Class III - Critical | 10,000 – 100,000 | 10,000 – 100,000 | |
| Class IV- Strong | 100,000 – 750,000 | 100,000 – 1,000,000 | |
| Class V - Excessive | >750,000 | >1,000,000 | |
Disclaimer/Publisher’s Note: The statements, opinions and data contained in all publications are solely those of the individual author(s) and contributor(s) and not of MDPI and/or the editor(s). MDPI and/or the editor(s) disclaim responsibility for any injury to people or property resulting from any ideas, methods, instructions or products referred to in the content. |
© 2025 by the authors. Licensee MDPI, Basel, Switzerland. This article is an open access article distributed under the terms and conditions of the Creative Commons Attribution (CC BY) license (http://creativecommons.org/licenses/by/4.0/).


