1. Introduction
Groundwater habitats play important roles in human consumption . Numerous studies were focused on groundwater quality [
1,
2,
3,
4] given the important role played by this subterranean aquatic source in human consumption, irrigation, agriculture, and industrial activities [
1,
5]. European Union legislation on groundwater protection aims to achieve adequate chemical quality and optimal quantitative balance [
6]. The World Health Organization (hereafter WHO) has different standards for assessing groundwater quality, given the types of physic-chemical parameters of interest. [
7].
Groundwater quality is affected by numerous factors, either natural or human induced. Various human activities, such as agriculture, domestic activities, and industrial operations can impact the physical, chemical, and biological characteristics of groundwater ecosystems [
5,
7]. Groundwater is a resource for domestic and public use worldwide. Under certain pH and redox conditions, natural pollutants in the groundwater comprise dissolved minerals above certain thresholds. Moreover, the heavy use of fertilizers to boost agricultural productivity can increase groundwater contamination [
8]. Groundwater habitats contain salts and the presence of soluble salts in high concentrations normally reflects the geology of the aquifer. Groundwater in igneous rocks dissolves minimal amounts of mineral because of their relative insolubility [
5]. One routine parameter measured in groundwater quality surveys is the Total Dissolved Solids (hereafter TDS). This parameter is influenced by both natural and human activities, such as mining, pollution, agriculture, and improper wastewater treatments [
9,
10]. TDS includes the sum of mineral salts and organic molecules, which are essential for organisms in moderate amounts, but become harmful , such as the case of heavy metals and organic pollutants, at high concentrations [
11]. TDS analysis is very important if to understand the impact on human health, industrial applications, irrigation and agriculture, as well as at ecosystem levels [
12]. Other parameters, such as pH, salinity, conductivity, dissolved oxygen, saturated oxygen, and redox potential are also routinely measured in groundwater quality assessments.
Successful and sustainable programs focused on ensuring groundwater quality for human consumption rely on the active engagement and direct participation of local stakeholders [
13,
14]. Their involvement should span all stages of implementation, from conducting initial assessments and selecting suitable locations for wells and water intakes to establish protected zones. In WHO guidelines, it is mentioned the fact that local communities play a key role in monitoring and overseeing water supplies, identifying and reporting issues, performing maintenance, and implementing corrective measures. Additionally, promoting complementary initiatives, such as hygiene and sanitation practices, is essential for the long-term effectiveness of these programs [
11].
Millions of people in Romania use groundwater from wells for drinking, agriculture or household needs. These water sources are often polluted with nitrites, pesticides, or bacteria. These contaminants are caused by improper management of waste or agricultural waste deposits [
15]. In Romania, national drinking water legislation was adopted according to the European Union directives. This regulation stipulates that public fountains should be monitored once every four months by local authorities. Unfortunately, in most villages, there is no budget for such actions [
9,
13].
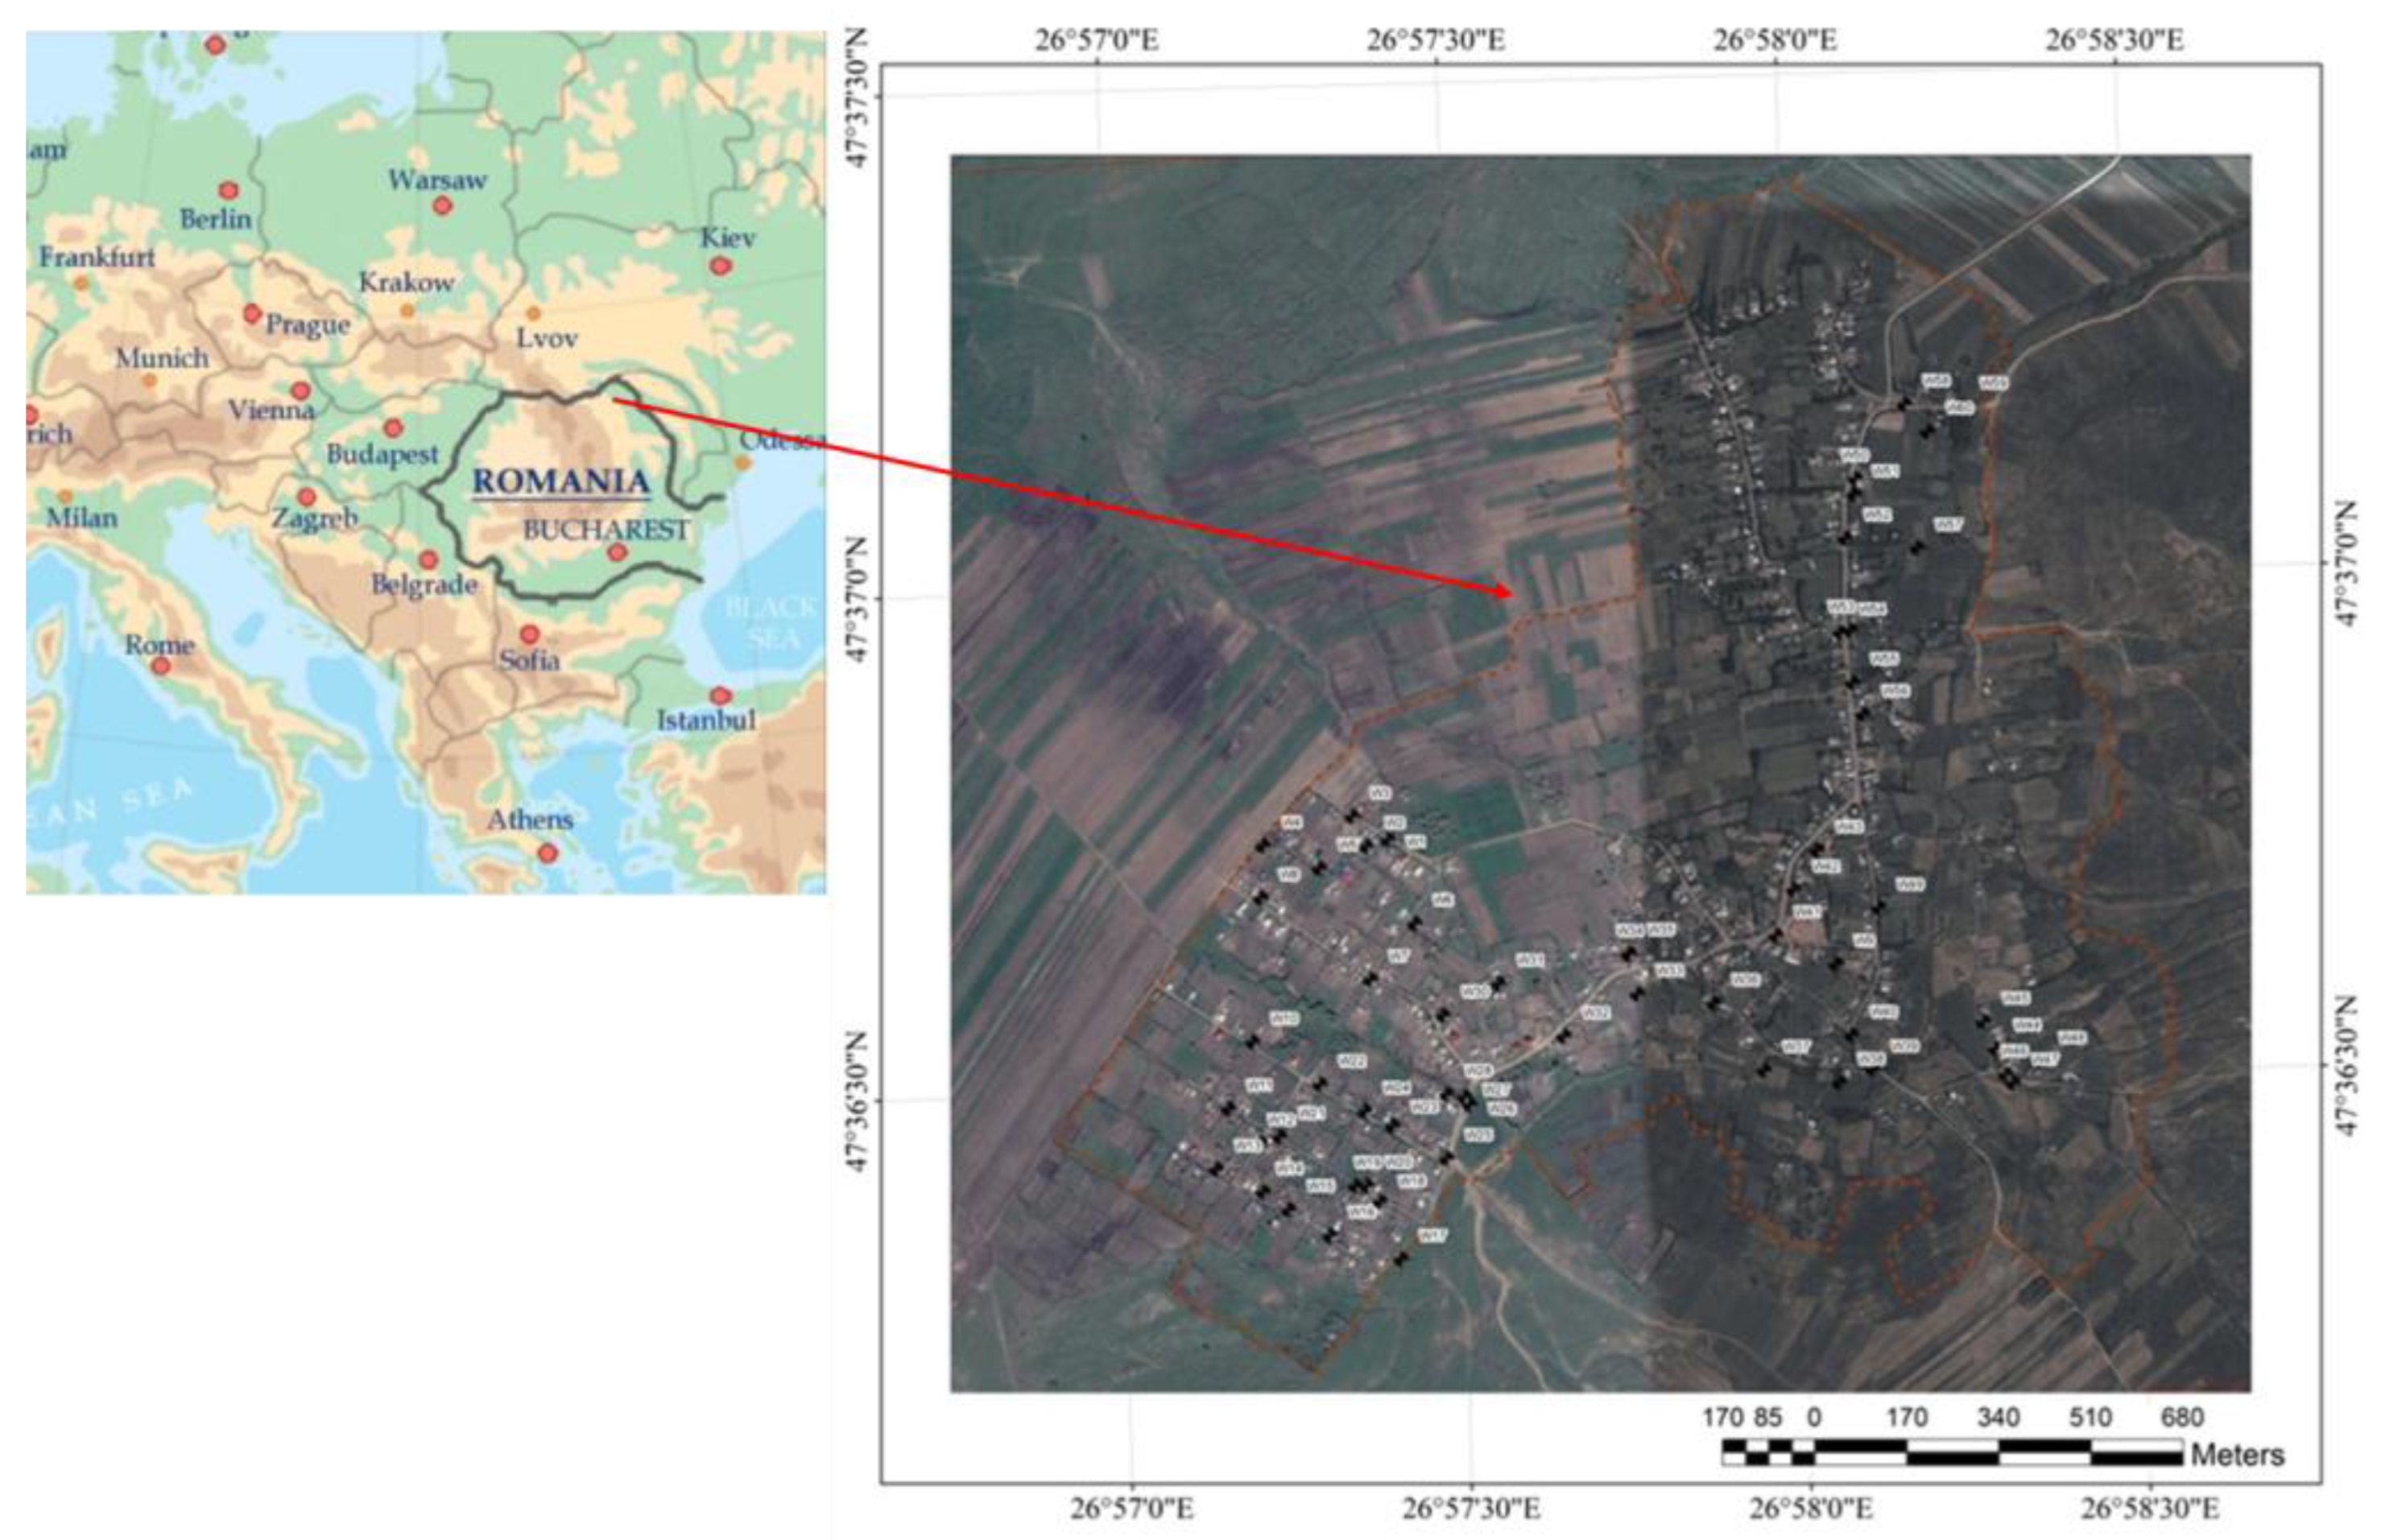
The current survey aimed to assess the groundwater quality of the primary source of drinking water in a village situated in northeastern Romania. Therefore several physicochemical parameters were analysed as follows: TDS, pH, salinity, conductivity, dissolved oxygen, saturated oxygen, and oxidation-reduction reaction from 80 wells, comprising the primary source of drinking water for the local population. Measurements of the same parameters were made for current water in the Municipality of Iasi and Botosani and for various bottled sparkling and still water brands.
Total dissolved solids are naturally present in water, but also due to anthropogenic activities such as mining, pollution, agriculture, and wastewater treatment [
9]. They represent the total amount of mineral salts and organic molecules, which in moderate concentrations are required for organisms, but in high concentrations become contaminants, such as heavy metals and organic pollutants. The United States (US) legislation provides periodic measurement and monitoring of this parameter in water for inorganic salts, organic matter and other substances dissolved. The concentration and composition of TDS in natural waters varies depending on the geological substrate, atmospheric precipitation and water balance (evaporation-precipitation). The worldwide average of river salinity is approximately 120 mg L
-1 and most anions present in natural waters are bicarbonates [
9]. The next most common anion is sulphate, with an average concentration of about 20 mg L
-1. The most common cations are calcium (21 mg L
-1), sodium, and silicon (9 mg L
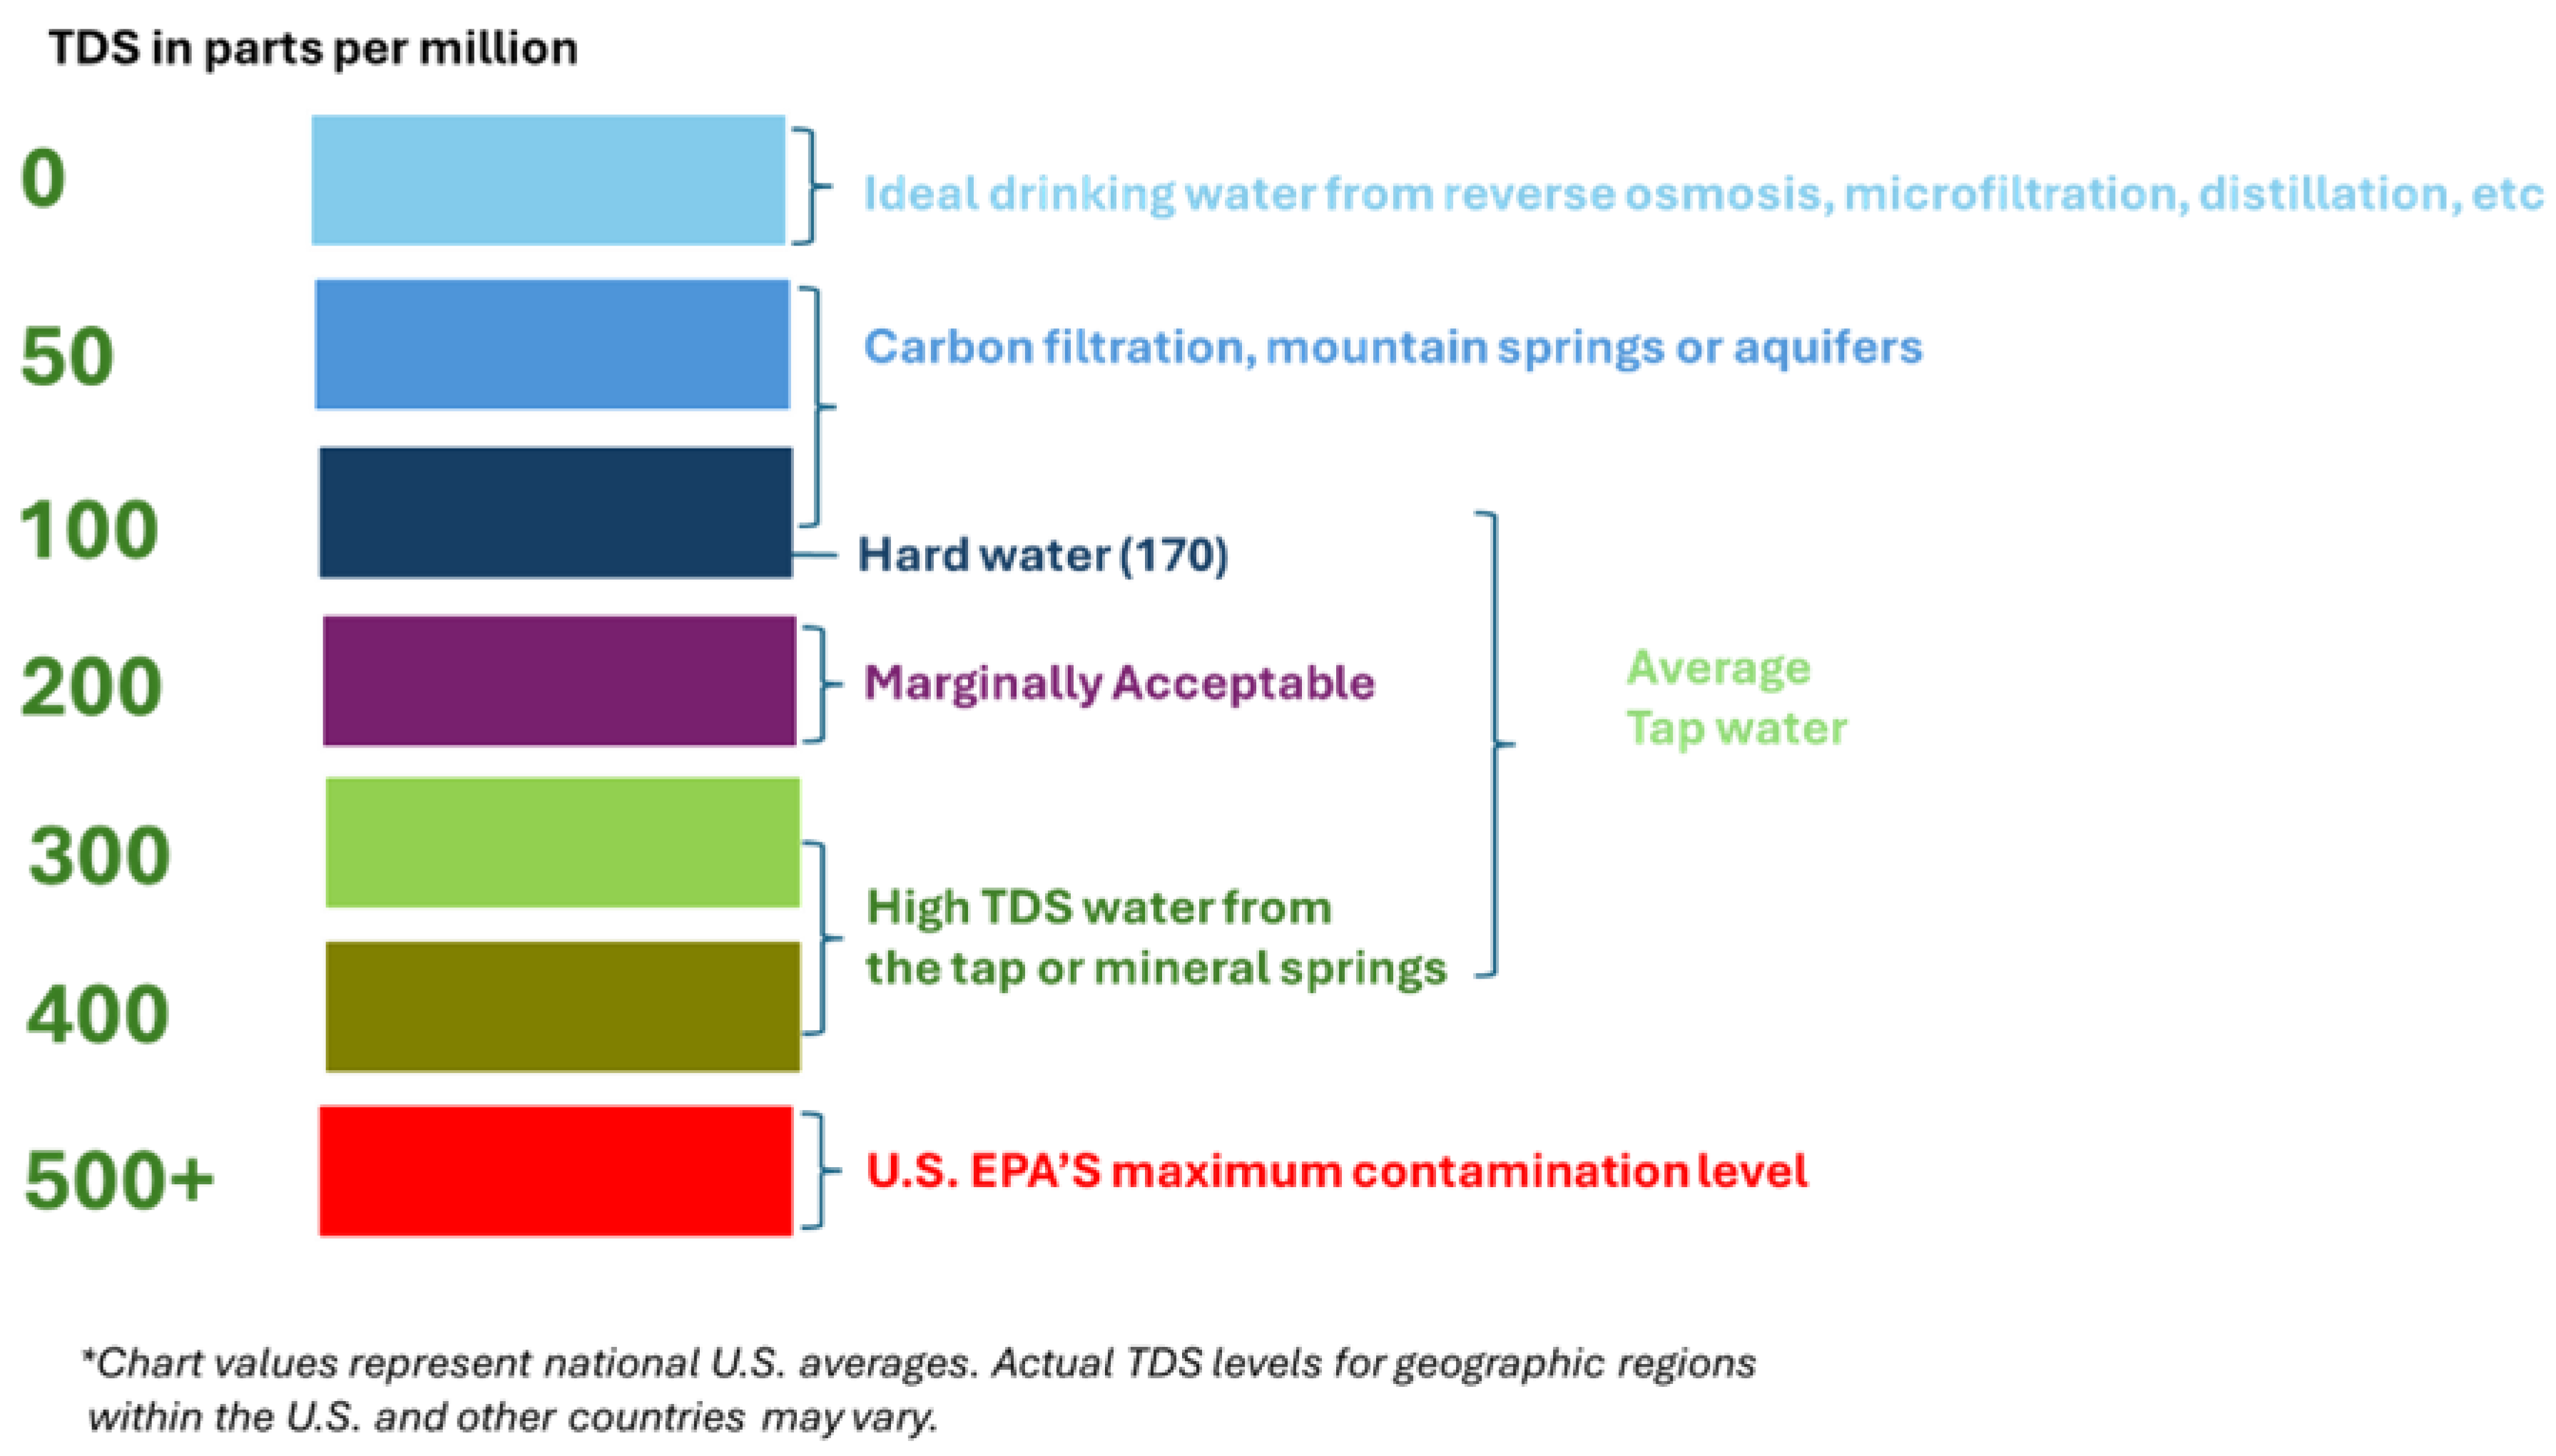
-1). Waters with a TDS concentration of more than 1000 mg L
-1 (equivalent to 1000 ppm) are considered “unpleasant” or unhealthy.
Changes in TDS concentrations in natural waters are usually due to industrial effluents, changes in water balance (by rainfall or heavy use of water or prolonged drought), and surface water salinization. The total amount of dissolved solids in the water produces toxicity by increasing salinity, changes in the ionic composition of the water, or the increase in concentration of specific toxic ions. Increased salinity in water negatively impacts aquatic biodiversity by excluding less tolerant species or producing chronic effects in various biological stages of tolerant species [
9]. It was reported that, for TDS values between 270 mg L
-1 to 1170 mg L
-1 of the macrophytes
Ceratophyllum demersum and Typha
sp. disappear [
9]. Changes in the ionic composition of water may exclude certain species in favour of others. For example, Derry et al., 2003 showed that the rotifer
Brachionus plicatilis and the copepod Cletocamptus
sp. dominate Cl- dominated habitats, in comparison to the species
Leptodiaptomus sicillis and
Diaptomus nevadensis that dominate in more sulfourous and carbonate waters [
16]. The diversity of aquatic organisms decreases when osmotic tolerance is exceeded due increasing salinity. Concentrations of specific ions that are too high can become toxic in certain stages of body development. For example, Stekoll et al., 2009 identified that Ca
2+ is the primary inhibitor of hatching salmonids when it significantly increases in concentration during fertilization [
17]. Erickson et al., 1996 demonstrated that copper toxicity increased in water once with the addition of potassium chloride, whereas calcium and sodium chloride adversely affected copper toxicity in water [
18]. Stoss et al., 1977 showed that fish sperm activity in water was inhibited when small amounts of potassium chloride (19.2 mg L
-1) or potassium carbonate (106.2 mg L
-1) were added [
19].
3. Results and Discussions
For a proper assessment of groundwater quality it is essential to measure the relevant physicochemical parameters, such as temperature, total hardness (TH), pH, chlorides, dissolved oxygen, total alkalinity, and total dissolved solids (TDS), respectively [
21]. The concentration and composition of physicochemical parameters in natural waters vary due local geology, atmospheric precipitation, and water balance (i.e. evaporation-precipitation). In addition, the soil porosity also influences groundwater chemistry, and the contamination level depends on that too. Previous studies reported that porous soils improve water quality compared with non-porous soils, and. the particle size and thickness of soil layers should also be considered [
1].
The measurements of physicochemical parameters of the groundwater from wells were further geographically extrapolated to map the degree of contamination, as well as the amplitude variation in the surveyed region.
- (a)
Dissolved oxygen and oxygen saturation
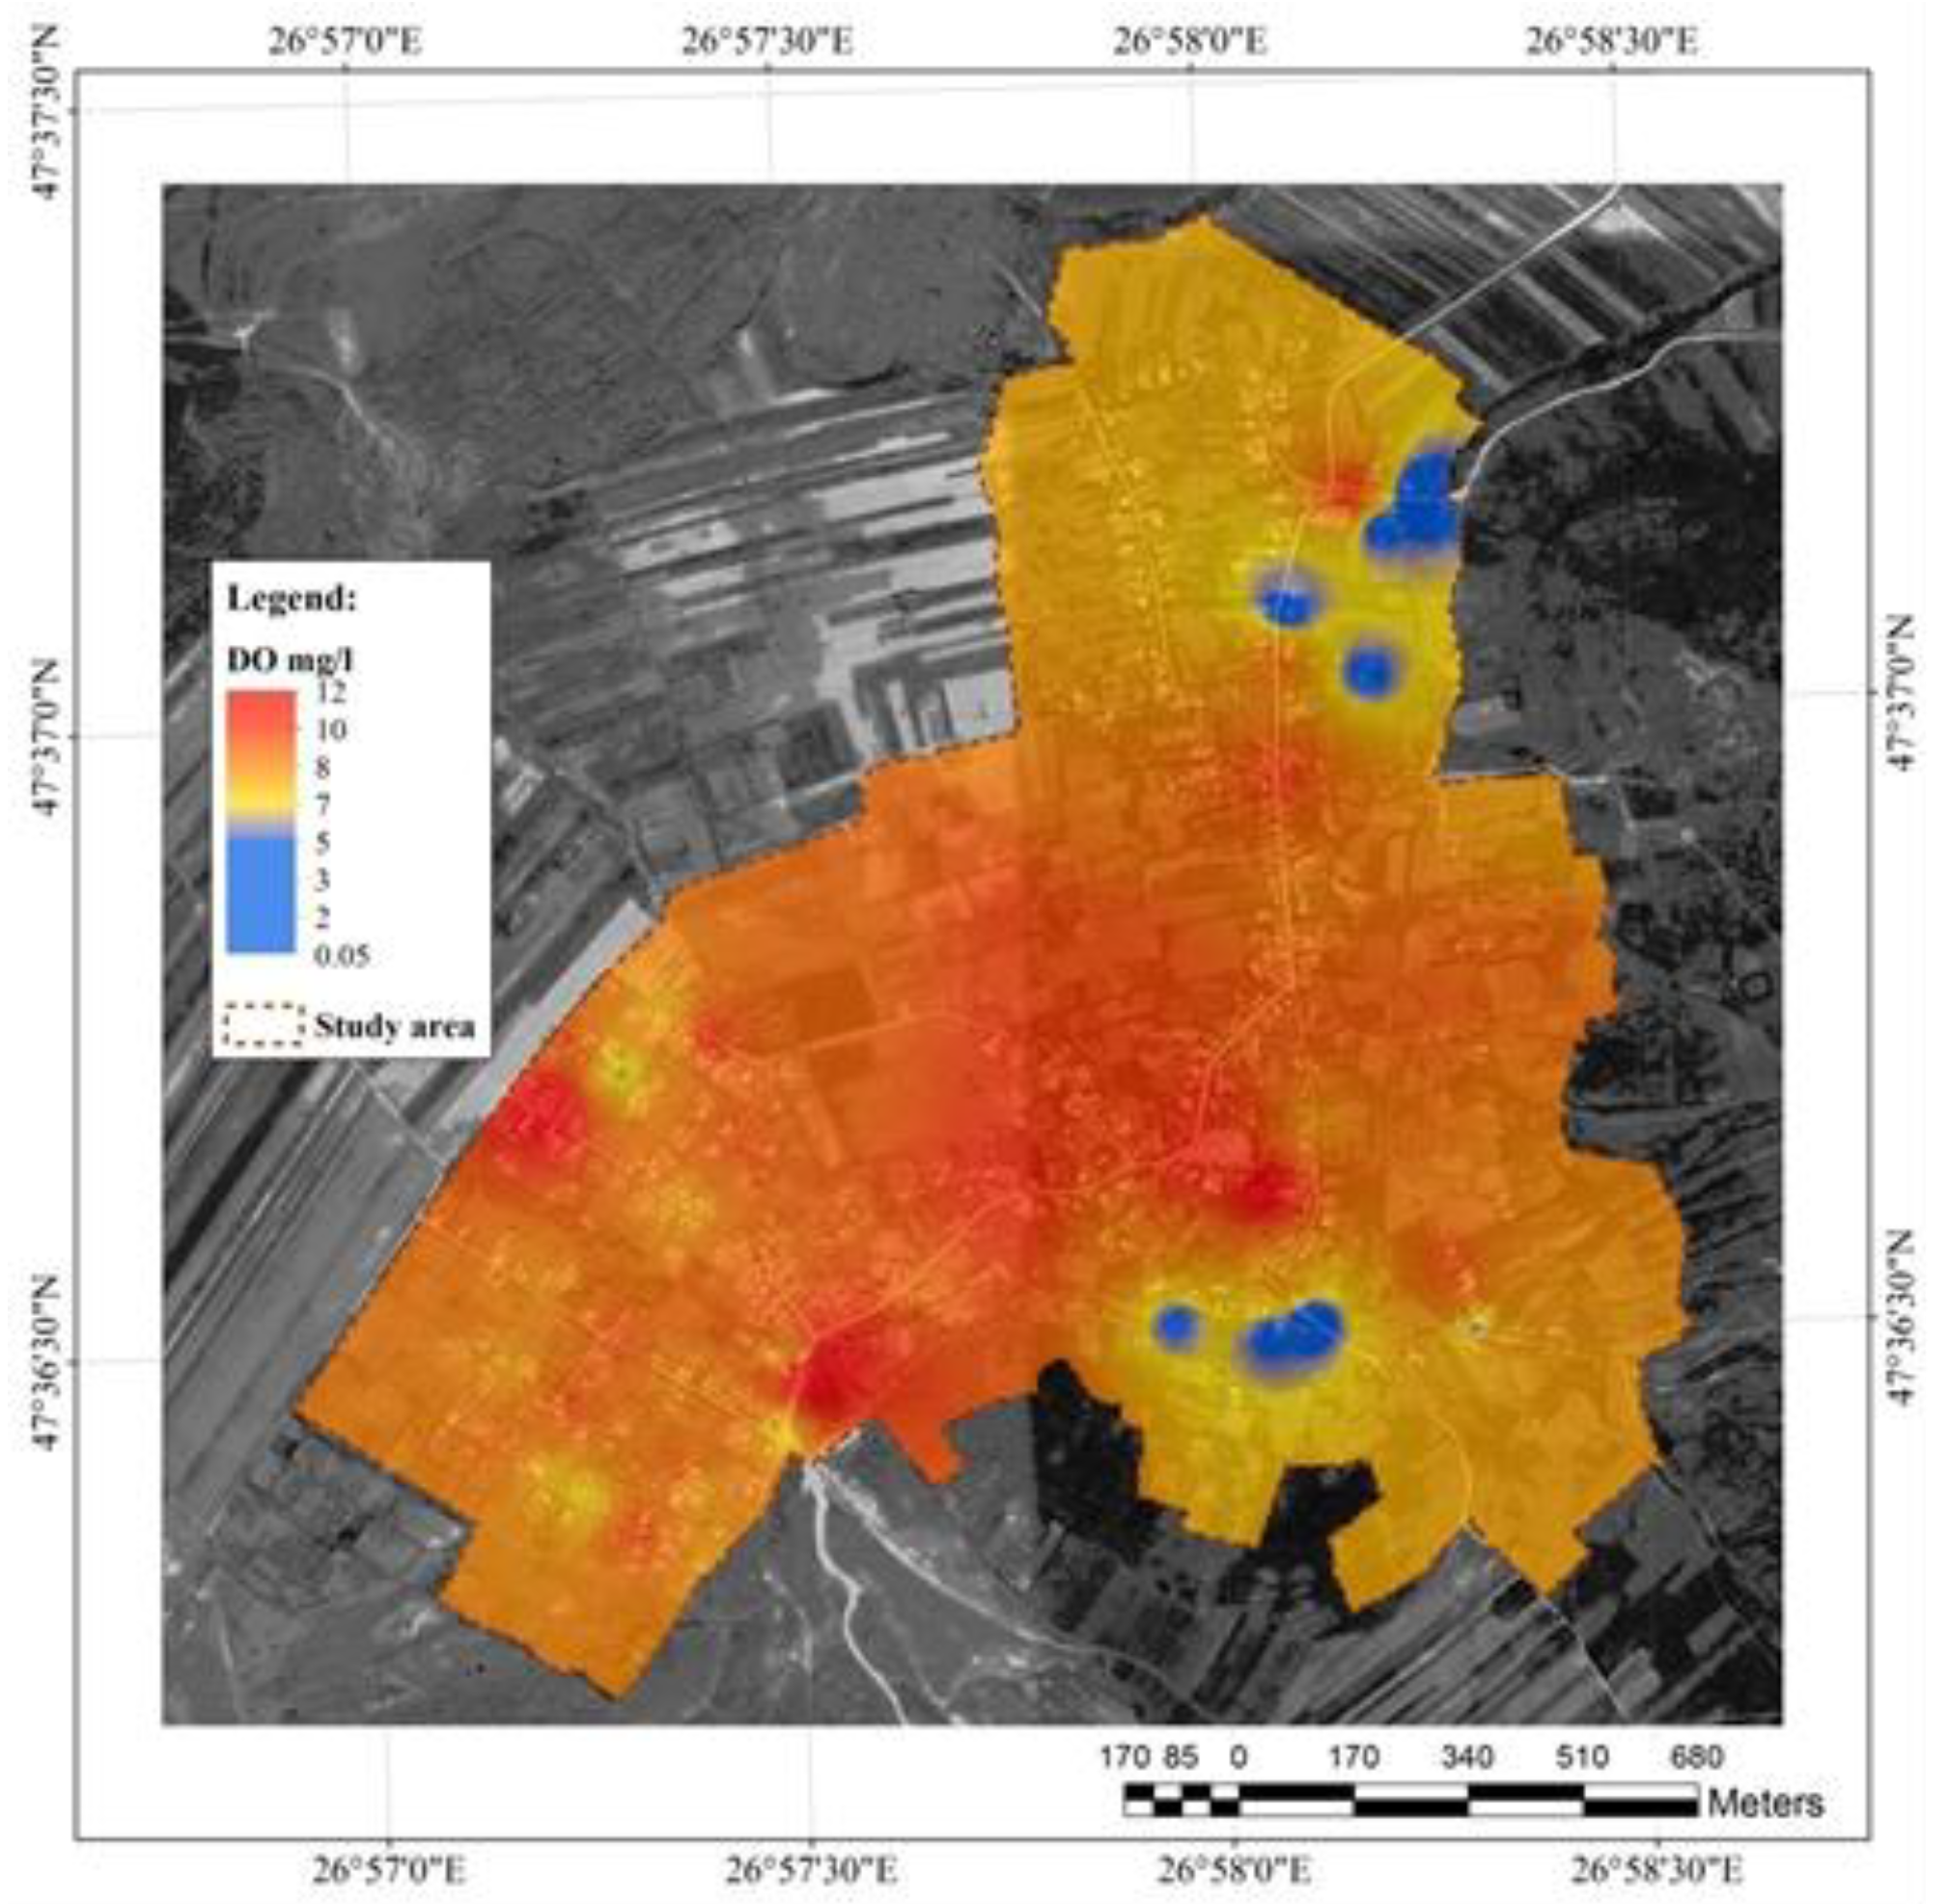
The first parameter analysed in the well water was the dissolved oxygen (
Figure 3). In the study area, it varied between 0.05 and 12 mg L-1. Low oxygen levels usually reflect the local microbial degradation activity of organic substances in water. The lowest levels were observed in the plain area (blue). Substances infiltration into the hill area and their accumulation in the lowland area could explain this.
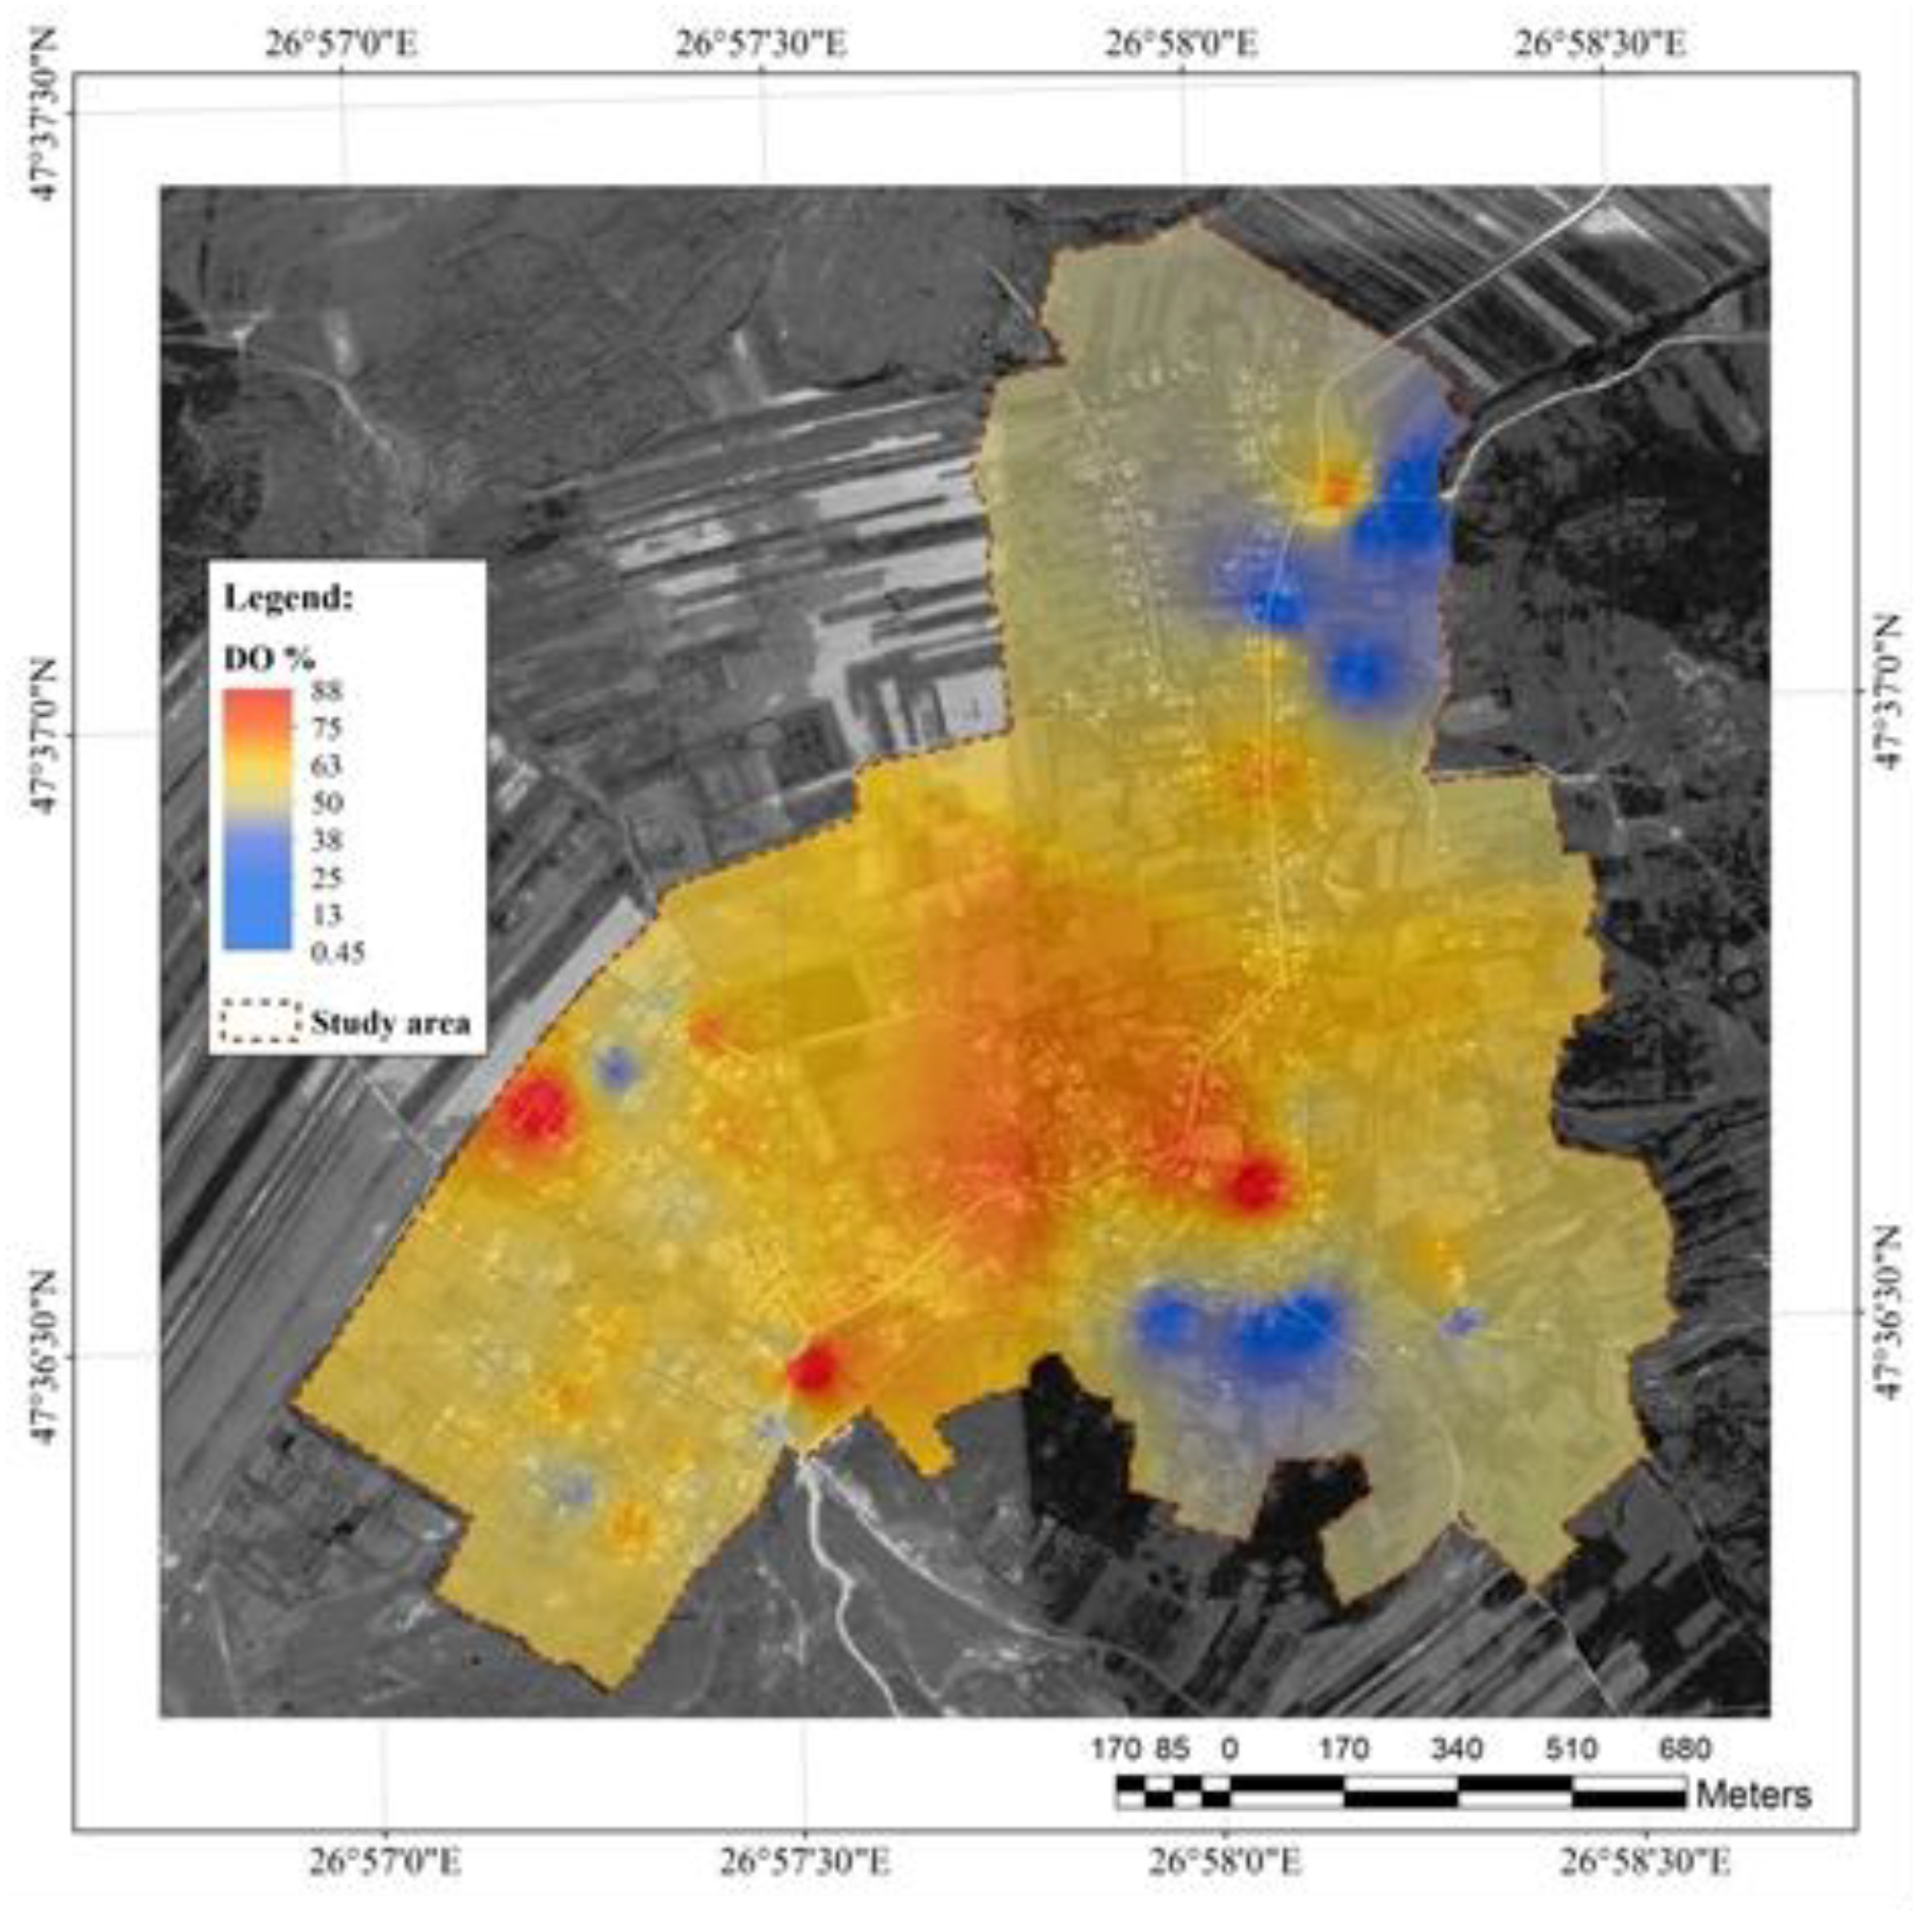
Oxygen saturation in water (
Figure 4) varied between 0.45 – 88%. The lowest values were observed in the same wells in which a low level of dissolved oxygen was recorded. Lowland area remained the most affected and strongly overlapped with the households where livestock is reared intensively . All the analysed wells were covered with a lid, with variable watervolume and depth.
According to the Environmental Protection Division of the British Columbia Environmental Ministry [
22], high levels of oxygen in groundwater recommends it for human consumption, but its beneficial effect in counterbalanced by the precipitation of metal oxides.
Dissolved oxygen prevents chemical reactions of lead, iron, and manganese released from sediments into the groundwater and facilitates the biochemical reduction of ammonium to nitrates, hence increasing the self-purification capacity. The norms for dissolved oxygen concentration in drinking water for British Columbia are minimum of 5 mg L-1 for drinking water (Alberta Environment, 1977), >8.0->9.5 (State of Washington, 1982), and a minimum of 4 mg L-1 (Alaska, 1979).
In the current survey, the blue areas indicate potential hazard for the local population who consume water from these wells.
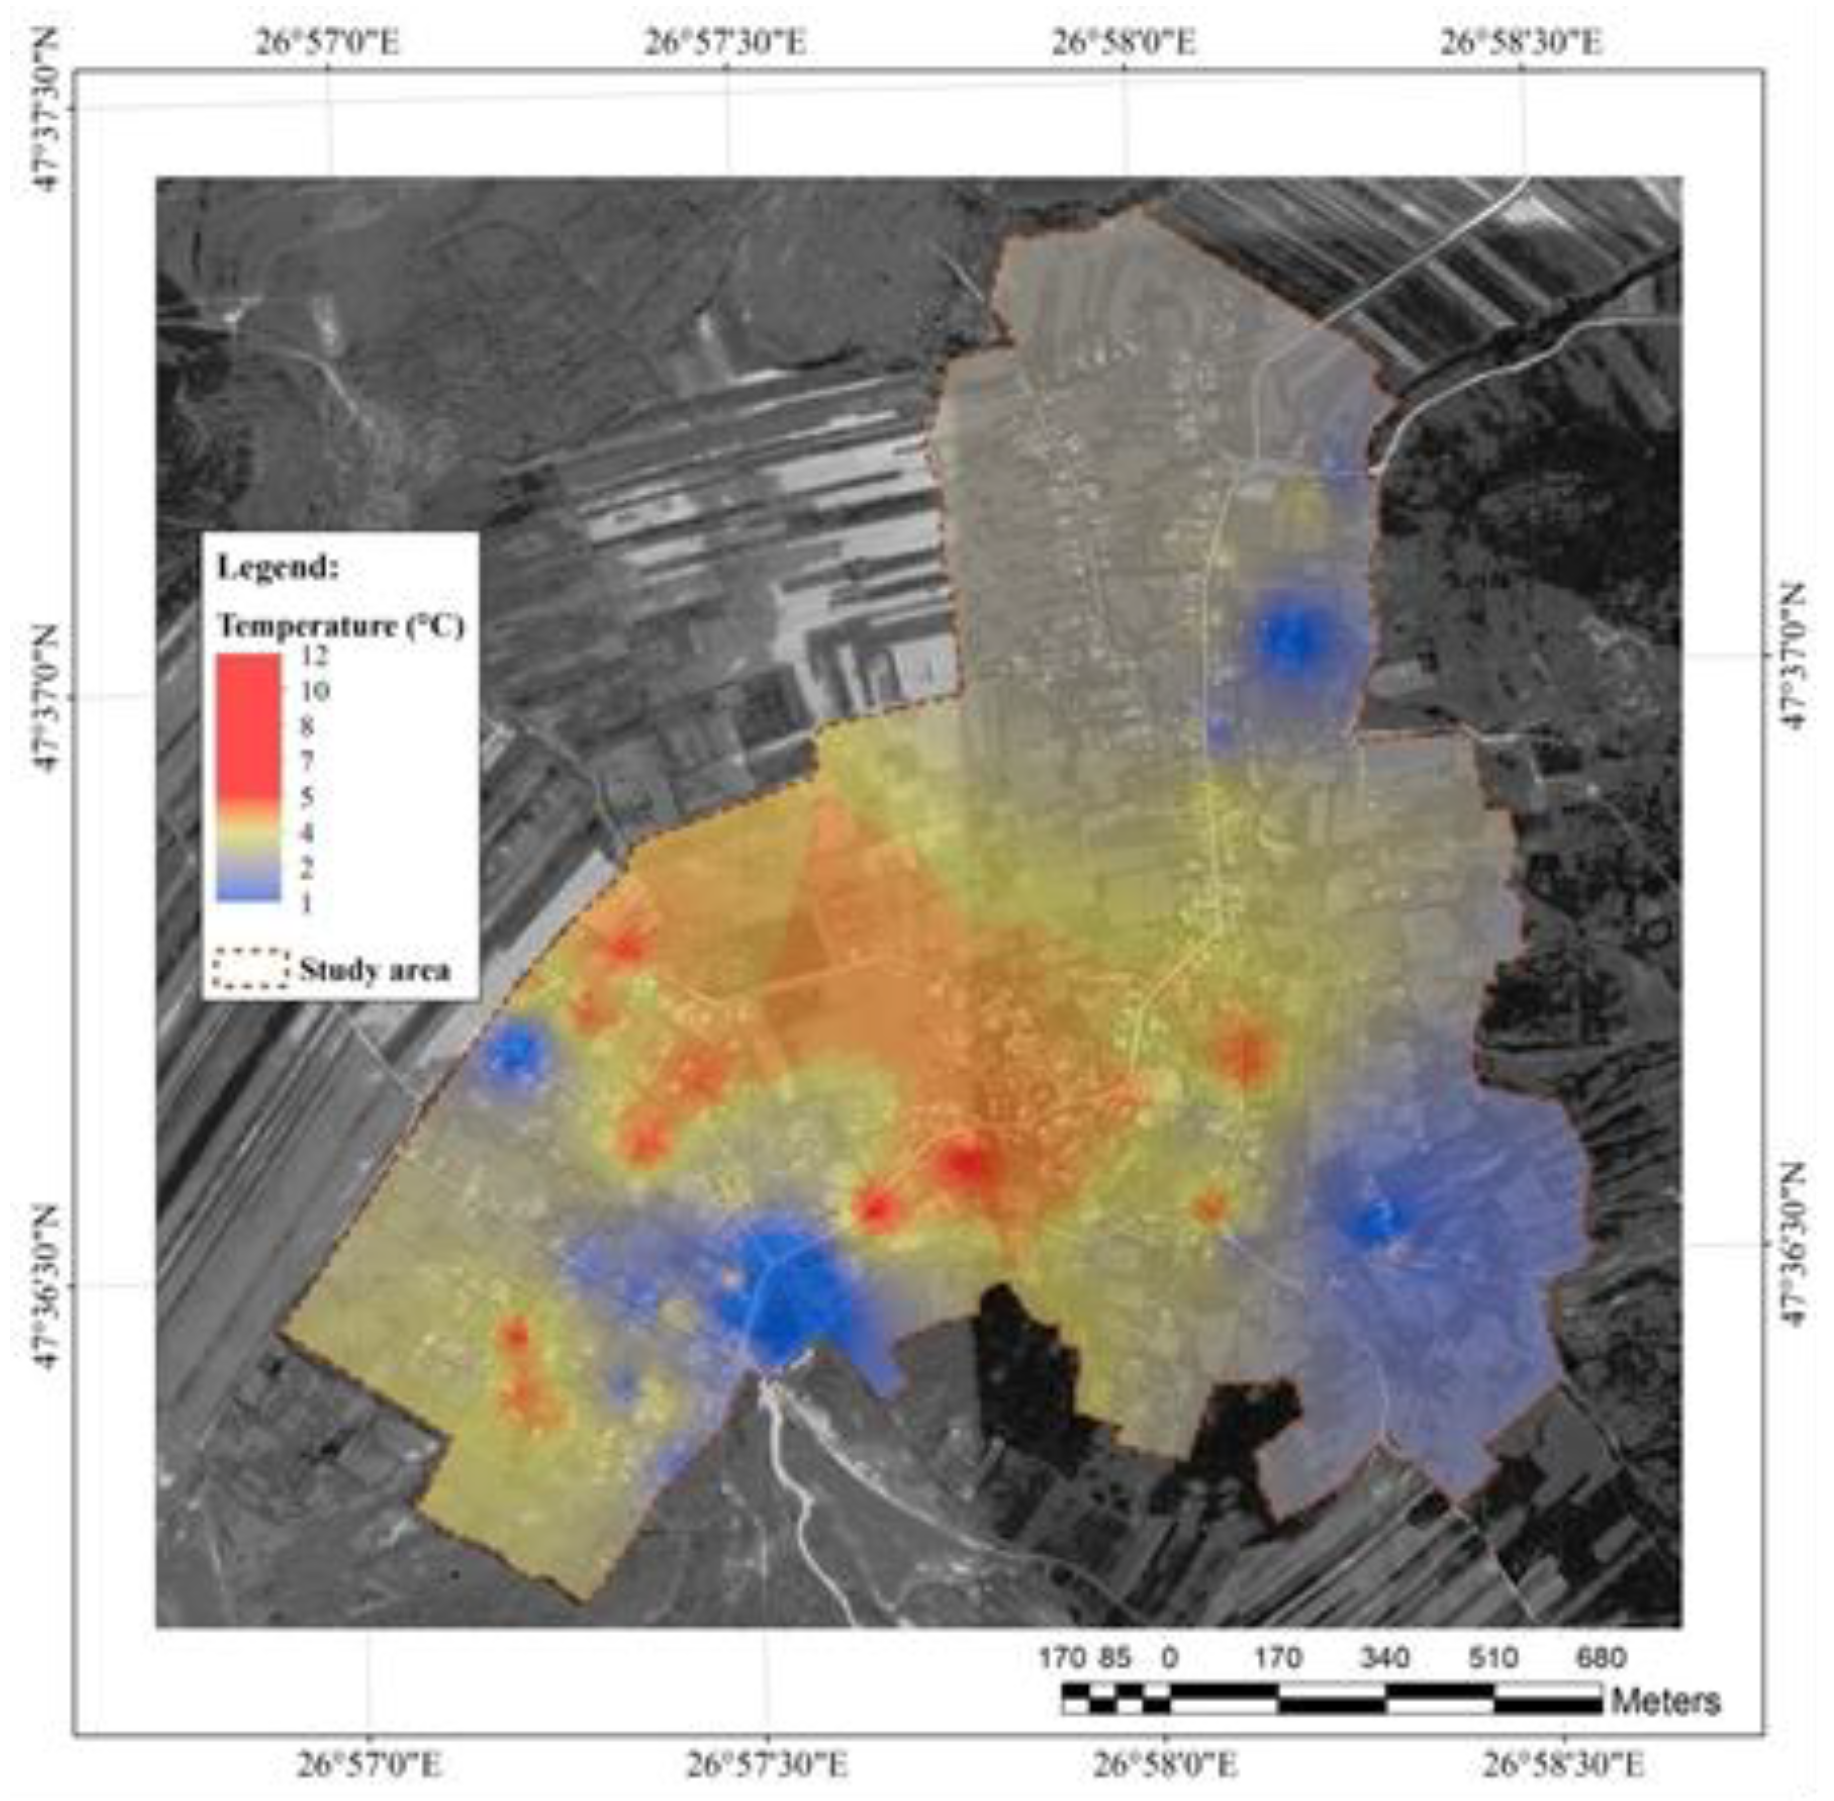
The dissolved oxygen levels in groundwater is reversely correlated to temperature (
Figure 5). Water temperature ranged from +1 +12⁰C. It varies significantly over 24 hours in surface waters, but in wells the temperature is relatively constant (
http://water.epa.gov/type/rsl/monitoring/vms52.cfm).
According to USEPA (the US Environmental Protection Agency), the dissolved oxygen levels vary in water with temperature as follows: 0⁰C-14,6 mg L-1; 1⁰C-14,19 mg L-1; 2⁰C-13,81 mg L-1; 3⁰C-13,44 mg L-1; 4⁰C-13,09 mg L-1; 5⁰C-12,75 mg L-1; 6⁰C-12,43 mg L-1; 7⁰C-12,12 mg L-1; 8⁰C-11,83 mg L-1; 9⁰C-11,55 mg L-1; 10⁰C-11,27 mg L-1; 11⁰C-11,01 mg L-1; 12⁰C-10,76 mg L-1; 13⁰C-10,52 mg L-1; 14⁰C-10,29 mg L-1; 15⁰C-10,07 mg L-1; 20⁰C-9,07 mg L-1; 22⁰C-8,72 mg L-1; 24⁰C-8,4 mg L-1; 26⁰C-8,09 mg L-1; 28⁰C-7,81 mg L-1.
- (b)
Oxidation-reduction potential and temperature
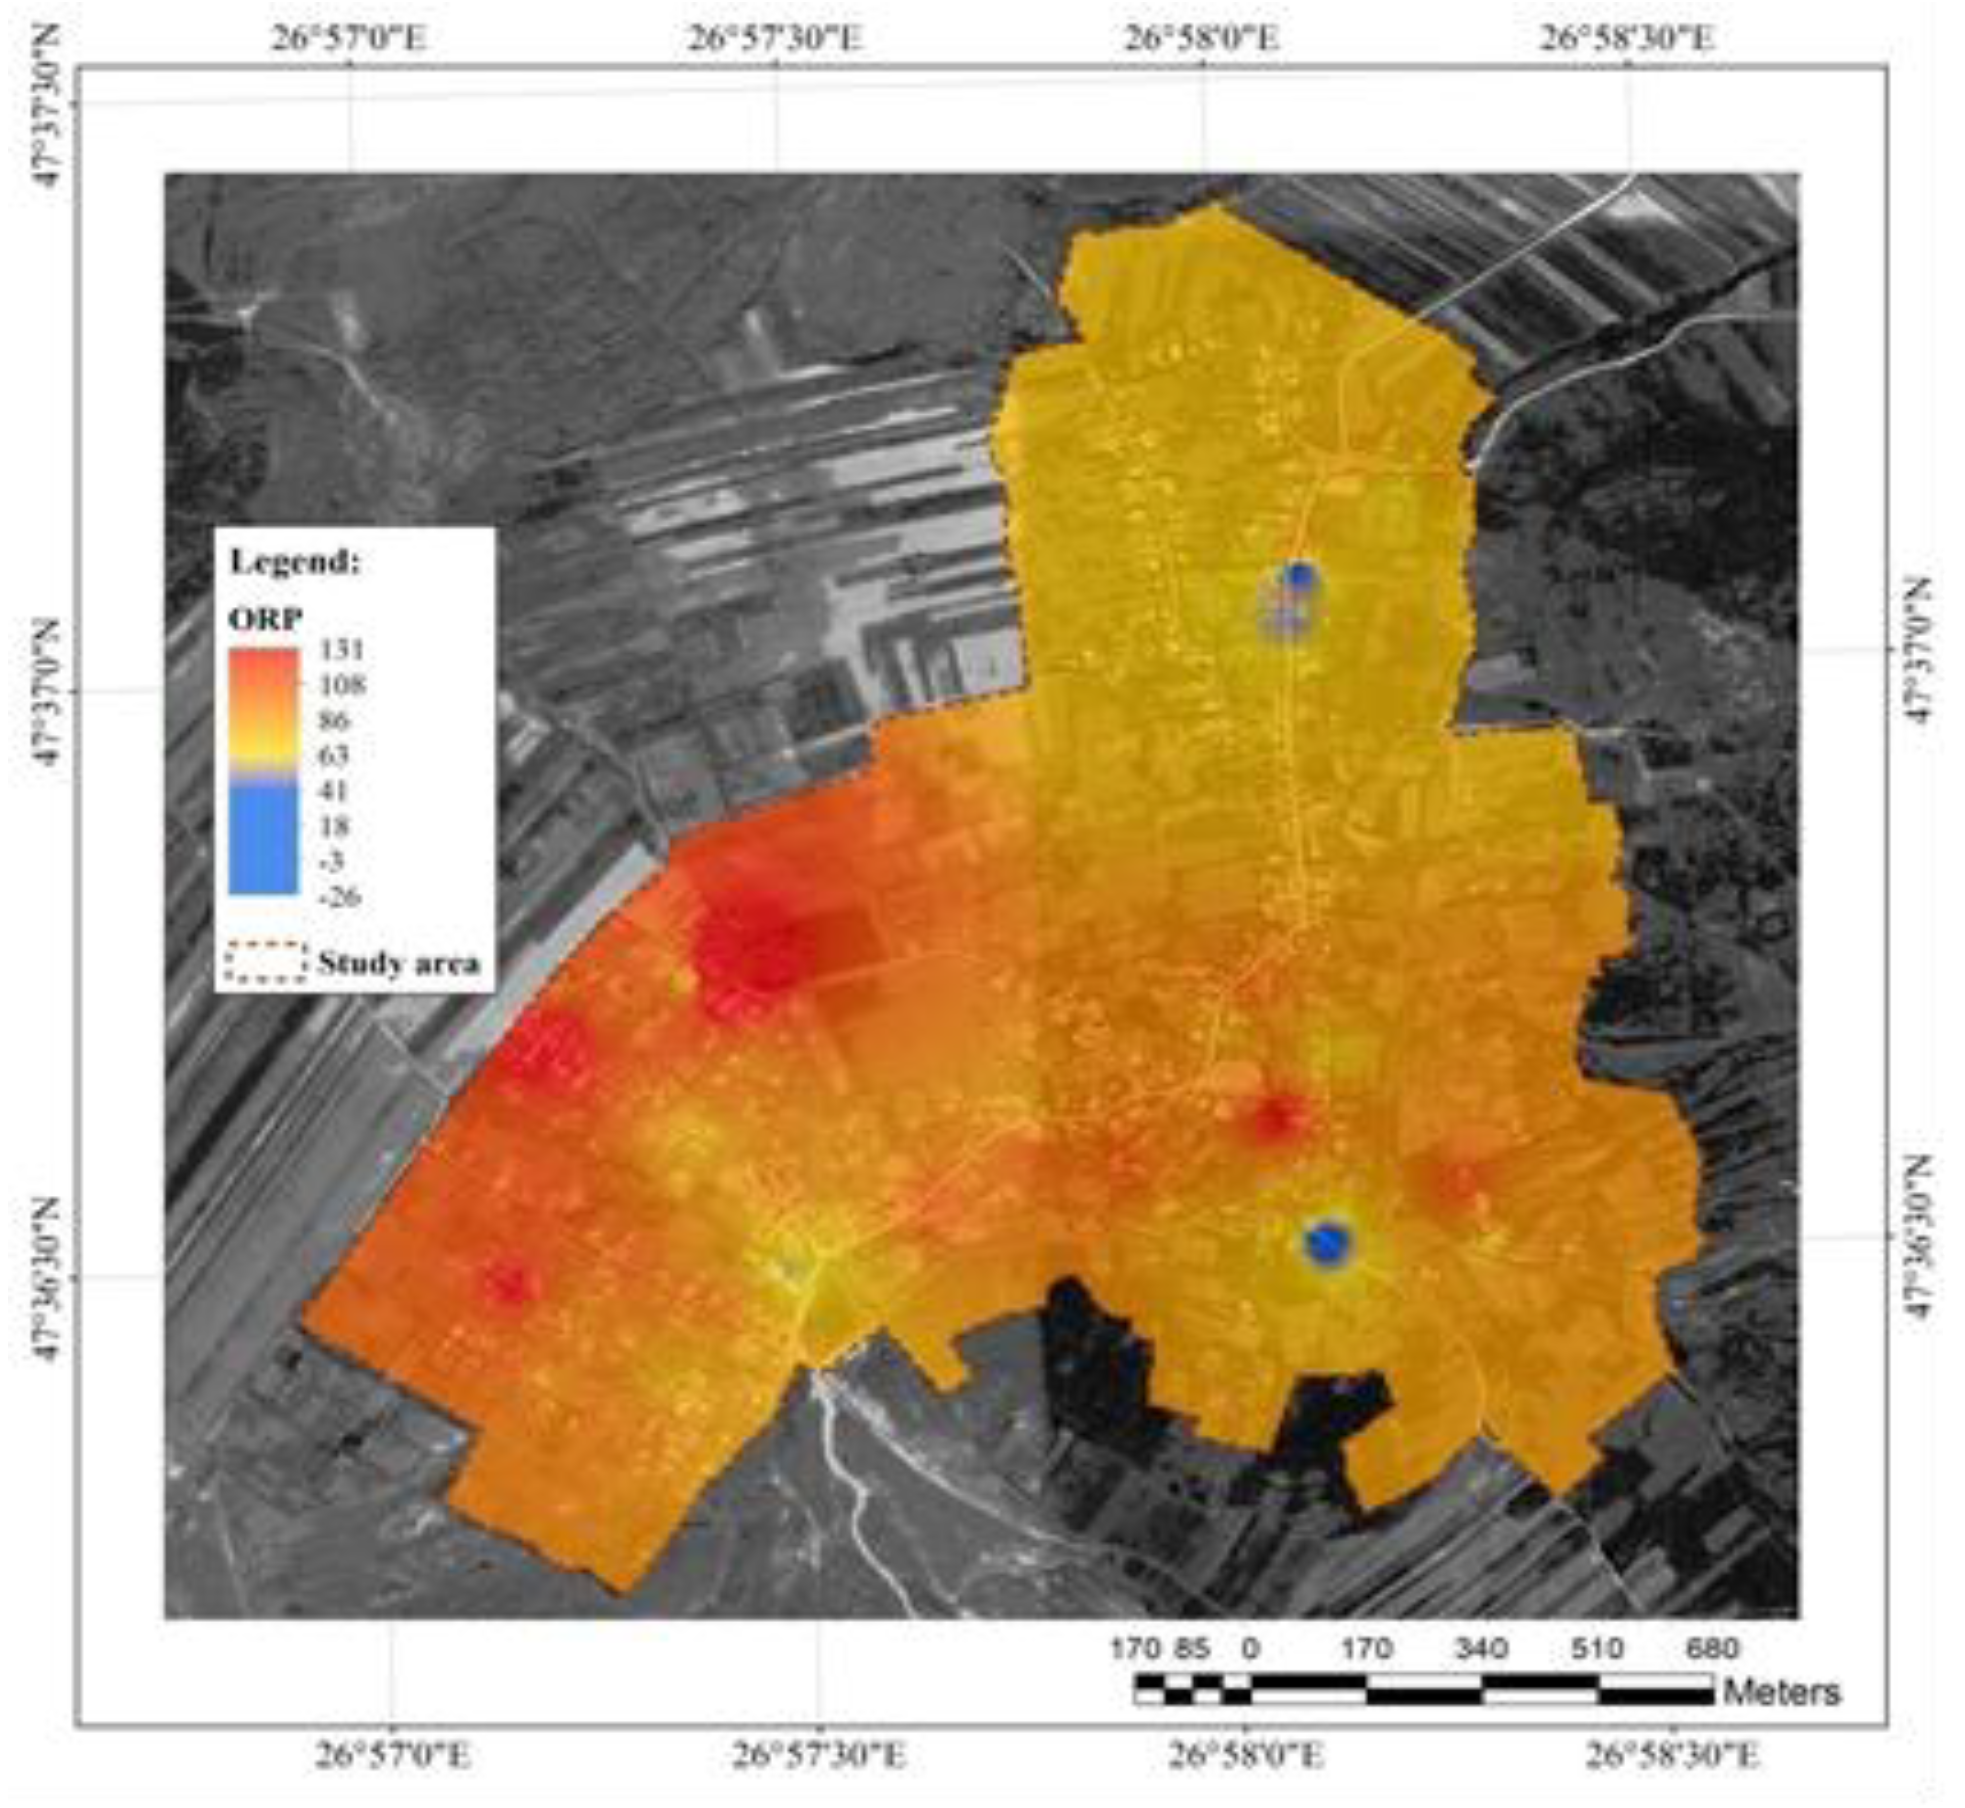
Regarding water ORP (
Figure 6), there were observed two areas where the groundwater had reduction character, marked in blue (-3 și -26); otherwise, the character was strongly oxidant, reaching maximum value of +131. The explanation is in the oxidation of organic substances and the formation of inorganic oxides. ORP analysis can assess the ability of water to disinfect and eliminate harmful microorganisms. This is important when ensuring that water treatment processes, such as chlorination or ozonation, are effective in maintaining safe drinking water standards [
23].
Drinking water should have an ORP between 200 and 400 mV to indicate safety and the absence of biologically active contaminants. Water with negative (e.g. 100 to -300 mV) is considered beneficial for health RP - antioxidant effects.
- (c)
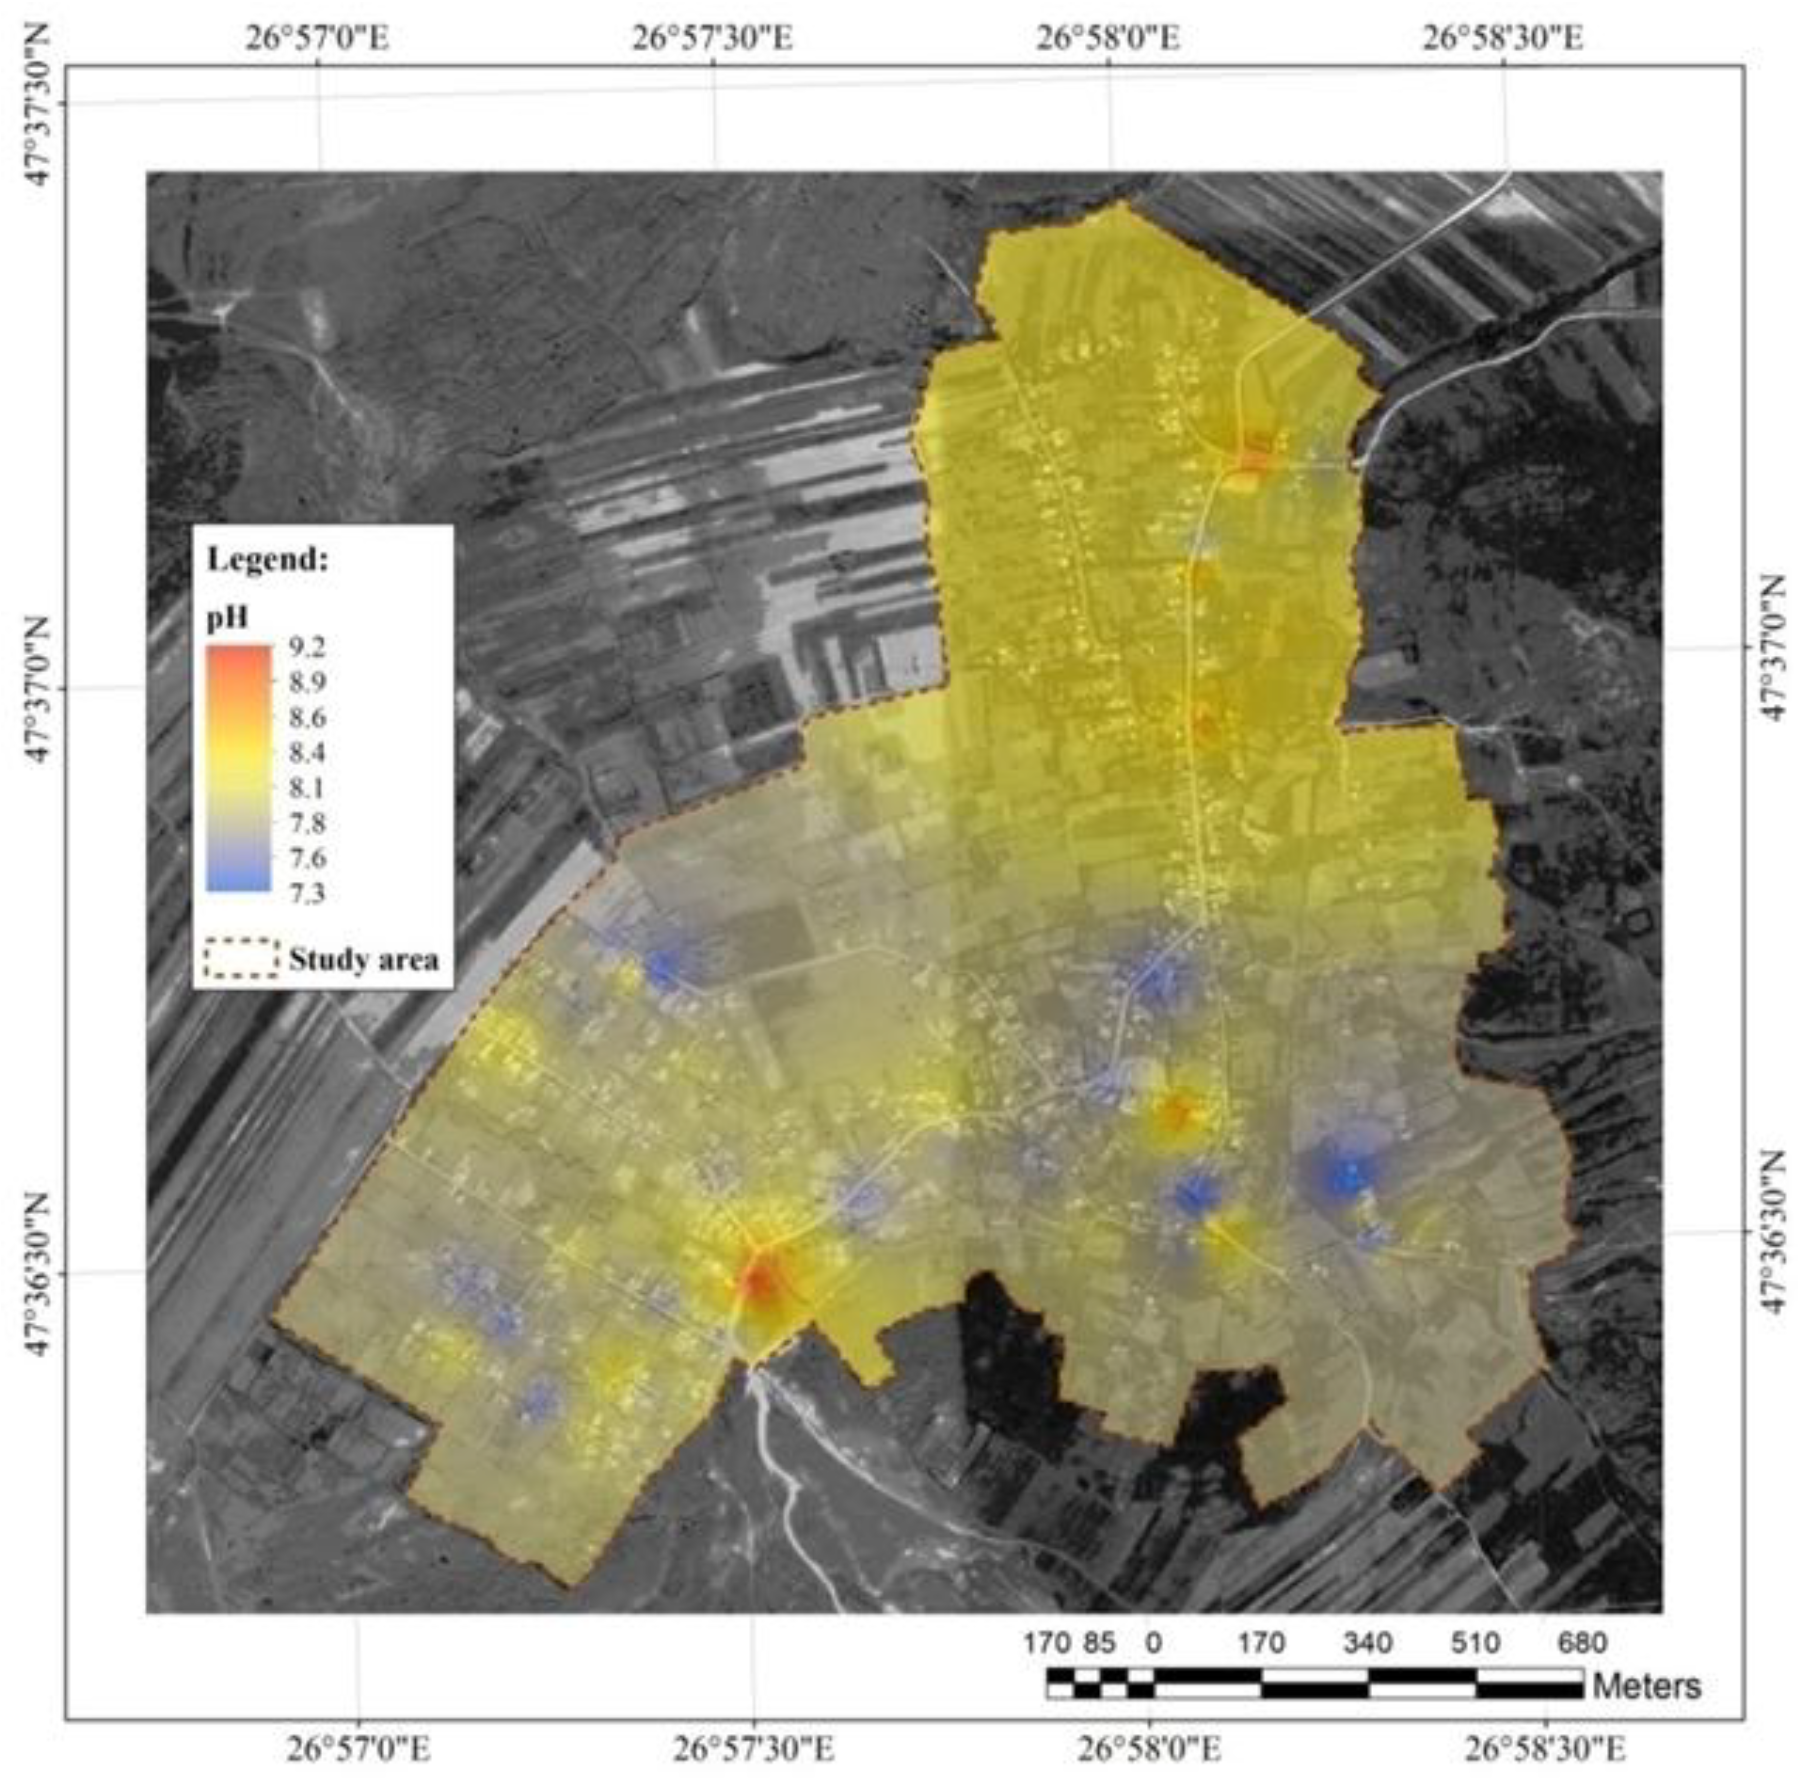
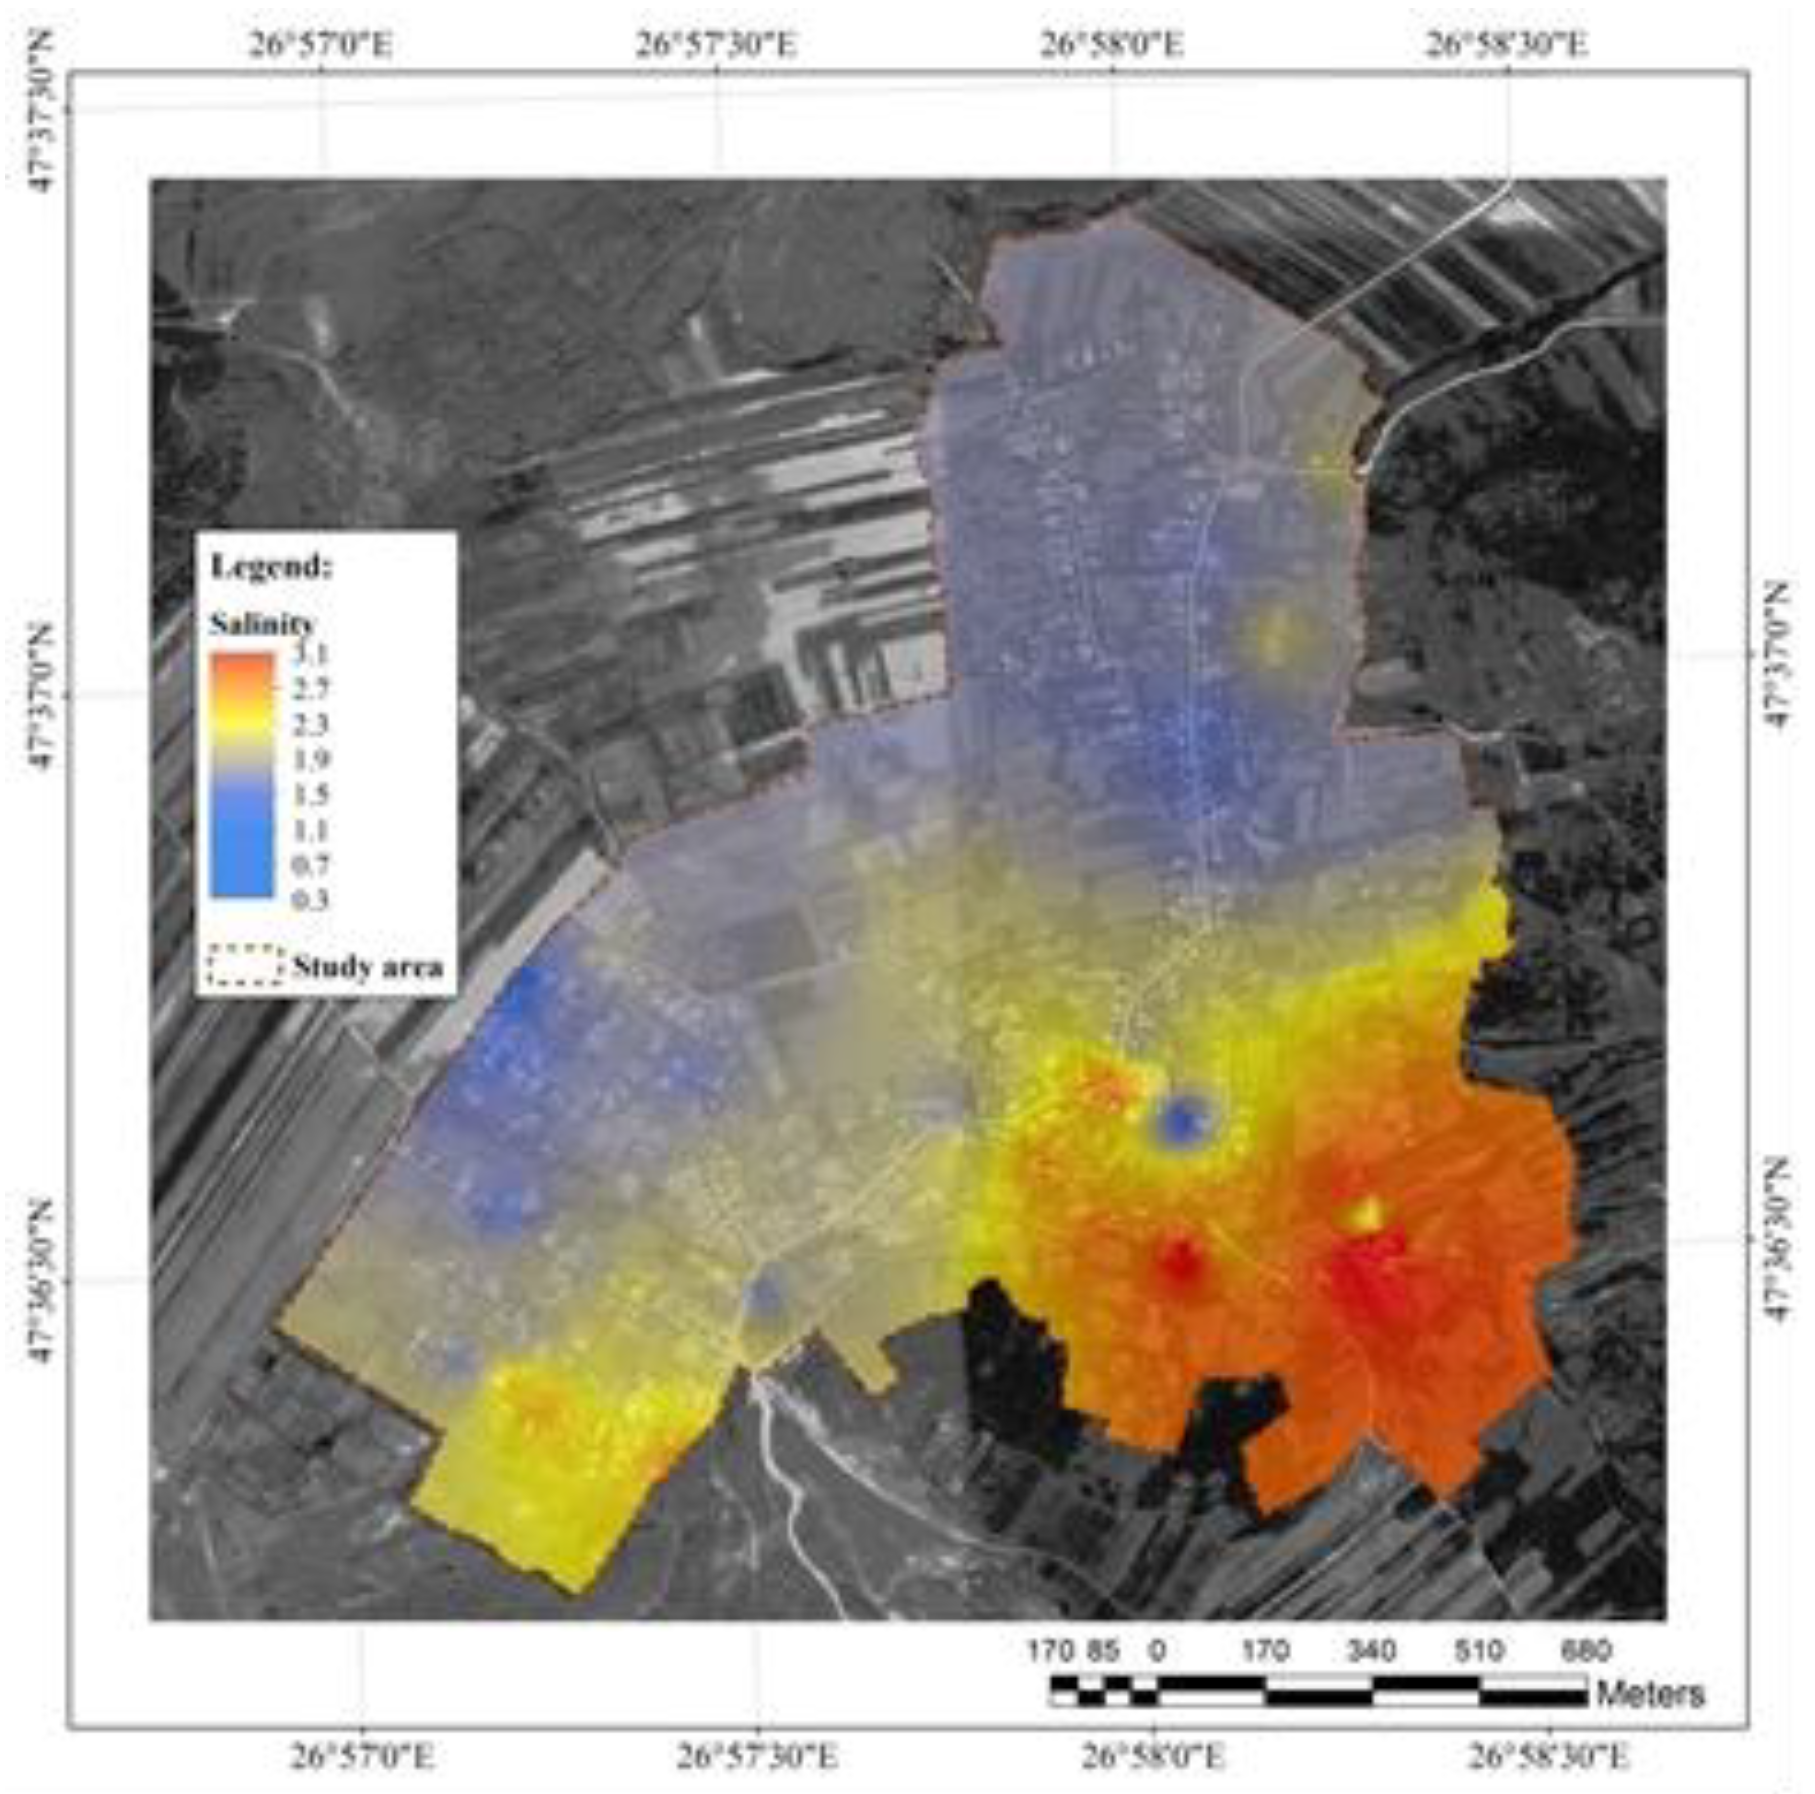
Salinity and pH
Salinity is strongly related to conductivity and TDS. Salinity may include hundreds of different ions which are present in the most significant amounts: chlorine, sodium, nitrates, calcium, magnesium, bicarbonates, and sulfates. Bromine, boron, and iron ions are rarely encountered. In the study area, the salinity reached high values, ranging from 0.3 to 3.1, with the lowest recorded in the hill area and the highest in the flat terrain (
Figure 8).
- (d)
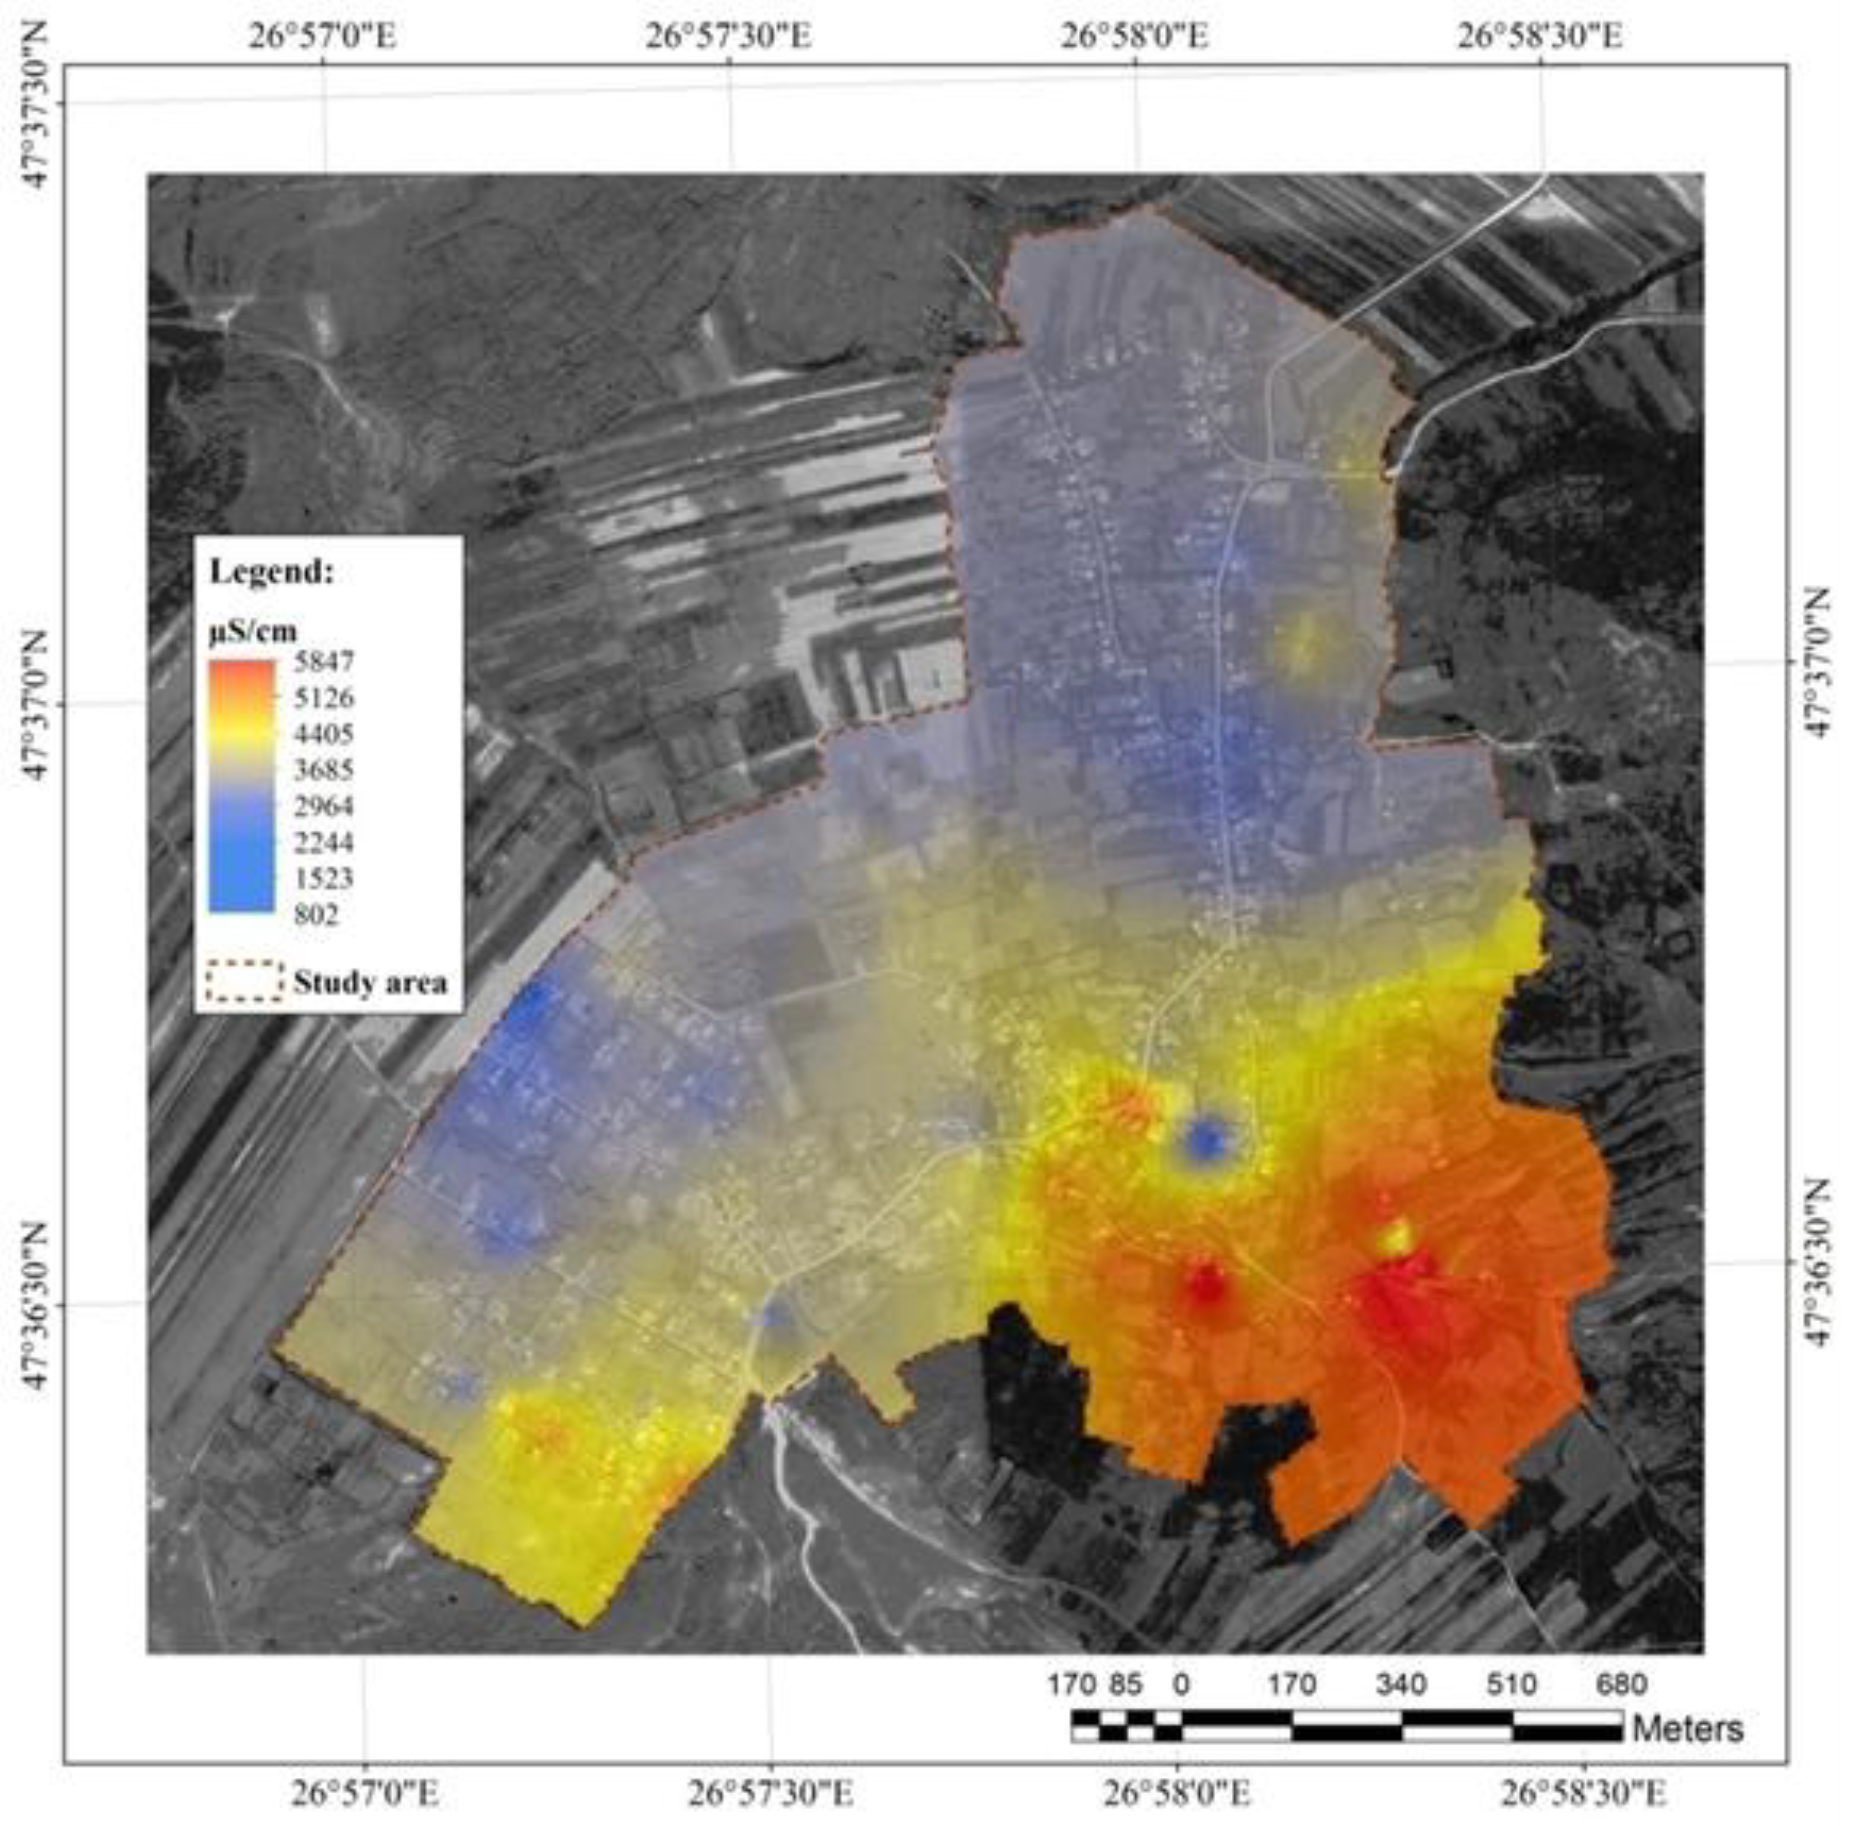
TDS and conductivity
Changes in TDS concentrations in groundwater habitats are usually due industrial effluents, changes in water balance (i.e. rainfalls, overexploitation or prolonged drought), as well as surface water salinization. The total amount of dissolved solids in groundwater increases the toxicity due increasing salinity, changes in ionic composition of water, as well as of the concentration of specific toxic ions. Increasing salinity in groundwater has a negative impact on aquatic biodiversity by excluding less tolerant species or the deleterious impact on various development stages of tolerant species [
9].
Figure 9.
Water conductivity in the resource in the study area.
Figure 9.
Water conductivity in the resource in the study area.
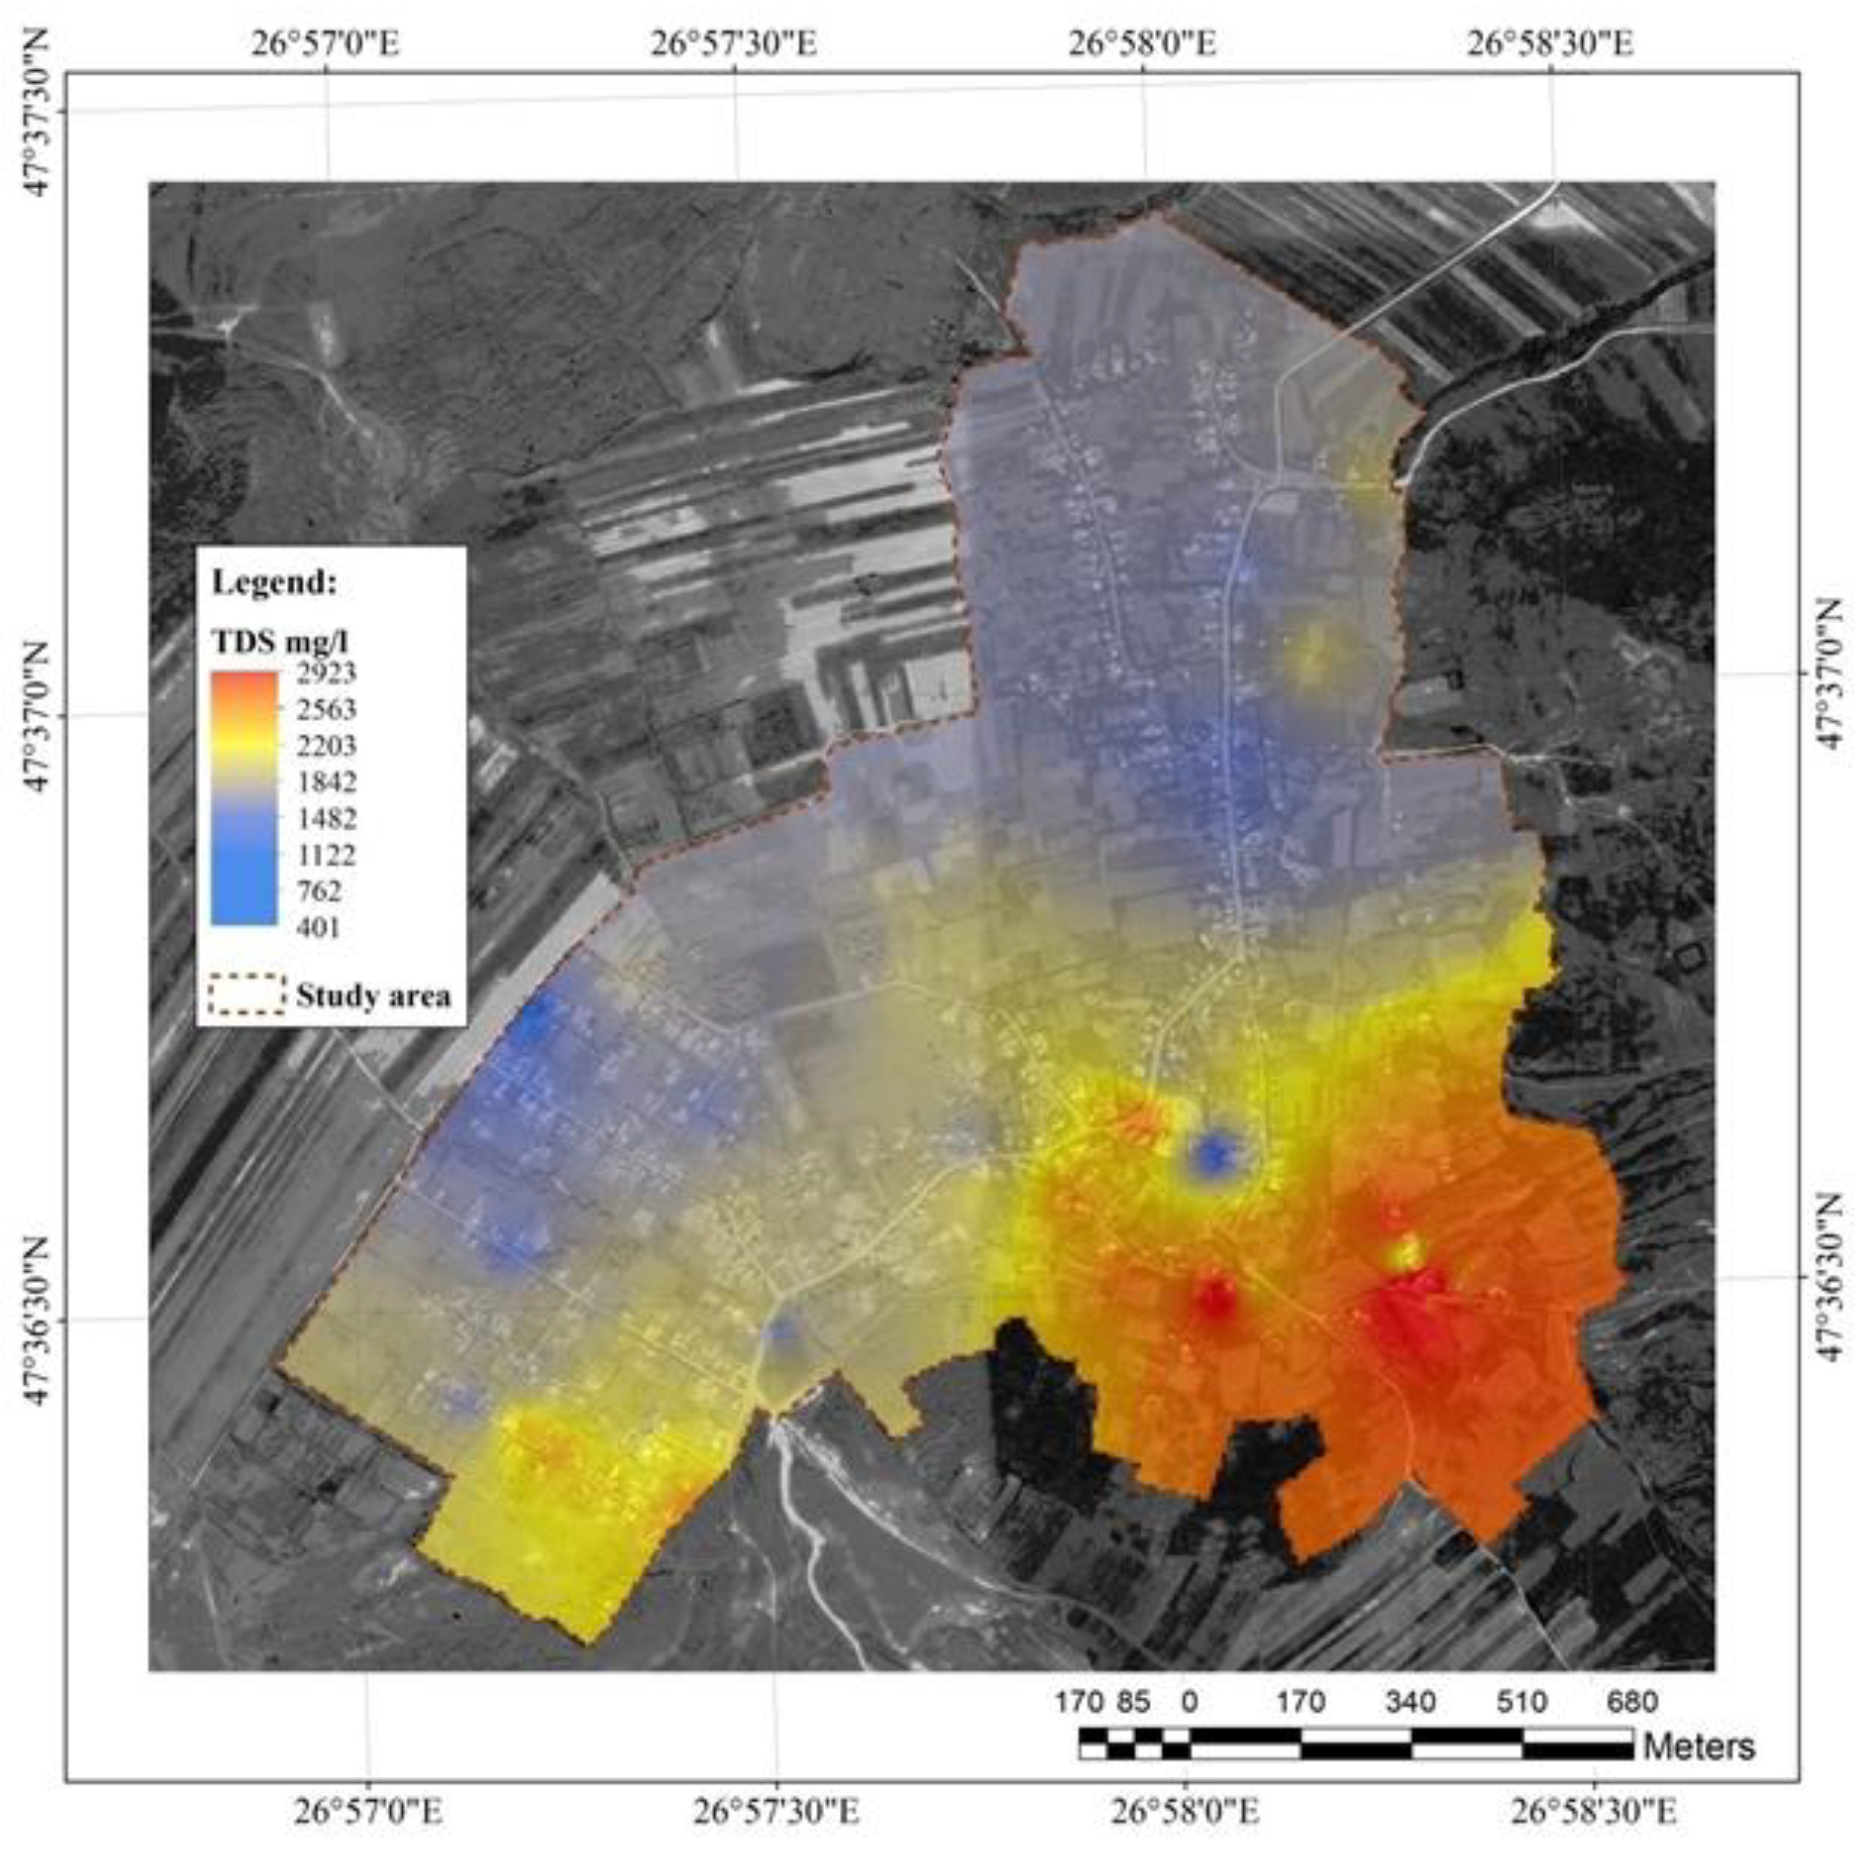
Figure 10.
Total dissolved solids in the water resource in the study area.
Figure 10.
Total dissolved solids in the water resource in the study area.
Another environmental issue that arises in the current context is the lack of involvement of local authorities in Botosani County in monitoring water quality and population health surveys. This area is perfect for studying the effects of high salinity and TDS of water on human health, given that the local population is stable and consumes just well water.
In 2012, as part of the European project “Preventing the Blue Death”, 117 water samples from wells were collected and analysed (
Table 2). 68 samples were assessed as inadequate, indicating potential water quality issues. In addition, 457 microbiological measurements were done, out of which 167 were classified as insufficient, highlighting the need for supplementary measures to improve the safety standards of drinking water.
The microbiological measurements were done out according to international standards and were focused on essential parameters, such as the total number of colonies at 37°C (according to SREN ISO 6222/2004), coliform bacteria (according to SREN ISO 9308-1/2009), Escherichia coli (according to SREN ISO 9308-1/2009) and enterococci (according to SREN ISO 7899-2/2009). These analyses aimed to assess the microbiological risks and to ensure the safety standards compliance of drinking water supplies.
In addition to microbiological measurements, chemical analyses were also performed to assess the water quality (
Table 3). These analyses comprised the measurements of ammonium (according to SR ISO 7150-1/2001), nitrite (according to SREN 26777 C 91/2006), nitrate (according to SR ISO 7890-3/2000), oxidizability (according to SREN ISO 8467/2001), pH (according to SR ISO 10533/2009), hardness (according to SR ISO 6059/2008) and turbidity (according to SR EN ISO 7027/1999). These parameters provide a comprehensive diagnostic of the physicochemical characteristics of groundwater and ensure their compliance to quality standards.
Also, in May 2012, two water samples were collected from the Lunca area, Botosani County, within the same project. The samples were part of a more significant effort to monitor and improve the quality of drinking water in the region, contributing to the identification of solutions to prevent risks to public health.
Between 2012 and 2014, water analyses were done in Baznoasa, Zlatunoaia and Lunca in Botosani County. The results of these analyses highlighted both positive aspects and significant problems regarding drinking water quality.
In 2012, supplementary samples were analysed from the wells in Baznoasa and Cultural Centre in Lunca. In the samples from Baznoasa well, the microbiological parameters indicated the presence of significant contamination of coliform bacteria (20 cfu/100 mL), Escherichia coli (18 cfu/100 mL), and enterococci (950 cfu/100 mL) exceeded the permissible values, which are 0 cfu/100 mL for all three indicators. Also, the nitrate concentrations (i.e. 98.6 mg L-1) exceeded the maximum allowed limit of 50 mg L-1. In contrast, other parameters, such as the colony count at 37°C (i.e. 20 cfu/mL), ammonium (i.e. beyond detection limits mg L-1), nitrite (i.e. 0.036 mg L-1), oxidizability (i.e. 1.27 mg L-1) and pH (i.e.7.18), were within the permissible limits.
At the well from Lunca, the situation was similar: coliform bacteria (i.e.500 cfu/100 mL), Escherichia coli (i.e. 250 cfu/100 mL) and enterococci (i.e. 700 cfu/100 mL) exceeded the maximum allowed values. Nitrates (58.6 mg L-1) were also above 50 mg L-1 limit. However, other parameters, such as the colony count at 37°C (i.e. 65 cfu m L-1), ammonium (below detection limit), nitrite (i.e. 0.044 mg L-1), oxidizability (i.e. 3.16 mg L-1) and pH (i.e. 7.38) complied with the standards.
In 2013, analyses of samples from the well of the Zlatunoaia Junior High School showed the presence of coliform bacteria (i.e. 1.7 × 10 cfu/100 mL), Escherichia coli (i.e.2.5 × 10 cfu/100 mL) and enterococci (i.e. 9 cfu/100 mL), all exceeding maximum allowed values. The nitrate concentration (i.e. 179 mg L-1) was almost four times higher than the maximum limit of 50 mg L-1. However, the hardness (i.e. 51 °dH) and turbidity (i.e. 1.67 NTU) were within the permissible limits. At the well of the Primary School in Baznoasa, the microbiological parameters (i.e. coliform bacteria, Escherichia coli, and enterococci) were compliant, but nitrates (i.e. 284 mg L-1) exceeded the permissible limit again. Hardness (i.e. 77 °dH) and turbidity (i.e. 1.63 NTU) were also within normal limits.
In 2014, the analyses carried out at the drilled well in Lunca showed significant improvements of water quality. All microbiological indicators (i.e. coliform bacteria, Escherichia coli, and enterococci) were compliant, and chemical parameters, such as ammonium (i.e. 0.3 mg L-1), nitrites (i.e. 0.08 mg L-1), nitrates (i.e. 0.74 mg L-1) and turbidity (i.e. 2.53 NTU), were within the permissible limits.
Thus, according to the results of the analyses from the Botosani Public Health Directorate carried out between 2012 and 2014, the contamination with nitrites and microbiological organisms detrimental for human health was found in the groundwater from several wells situated in the illage of Stroiesti. These analyses are insufficient for a proper monitoring of the area where the local population depends on the water resources from wells. The low values recorded bt Botosani Public Health Directorate confirmed our in-situ measurements.
The current survey was completed with comparisons of the values obtained in local wells to those from various brands and types of water sold in stores. Thus, 14 types of water sold were analysed.
Table 5 presents the chemical composition provided by the manufacturers. No manufacturer offered complete information about all the analysed parameters and for some elements present in water.
The mineral composition of bottled waters plays a crucial role in assessing their suitability for human consumption and potential health hazards. The table highlights key parameters, such as sodium, magnesium, calcium, potassium, bicarbonates, dry residue at 180°C, sulphates, carbon dioxide, and chloride for various still and sparkling mineral water brands.
Sodium levels vary significantly across the analysed brands. Waters such as Aqua Carpatica still (i.e. 0.78 mg L-1), Wonder still (i.e.0.74 mg L-1), and Carpatica still (i.e.0.82 mg L-1) had very low sodium concentrations, making them suitable for individuals adhering to low-sodium diets, such as those with hypertension or cardiovascular diseases. On the other hand, sparkling waters like Valea Izvoarelor sparkling (i.e. 93 mg L-1) and Perla Covasnei sparkling (i.e. 85.82 mg L-1) contained higher sodium levels, which could be contraindicated for individuals with sodium-sensitive conditions.
Magnesium, an essential mineral for muscle and nerve function, was found in varying amounts. Brands such as Aqua Carpatica sparkling (i.e. 78.1 mg L-1) and Bucovina sparkling (i.e. 76.73 mg L-1) were rich in magnesium and may provide additional health benefits, particularly for individuals with magnesium deficiencies. Conversely, waters like Wonder Still (i.e. 3.45 mg L-1) and Bucovina Still (i.e. 2.63 mg L-1) exhibited low magnesium concentrations, making them less significant as a magnesium source.
Calcium levels, which are important for bone health, were notably high in some sparkling waters, such as Aqua Carpatica sparkling (i.e. 286 mg L-1) and Bucovina sparkling (i.e. 264.5 mg L-1), as well as in still water brands like Kaufland still (i.e. 197 mg L-1). These waters may contribute significantly to dietary calcium intake. In contrast, waters such as Bucovina still (i.e. 9.56 mg L-1), Wonder still (i.e. 17.2 mg L-1) and Perla Covasnei sparkling (i.e. 35.66 mg L-1) have considerably lower calcium levels.
The bicarbonate content is a key indicator of the buffering capacity and ability to neutralize stomach acidity. High bicarbonate levels are observed in Aqua Carpatica sparkling (i.e. 1281 mg L-1) and Bucovina sparkling (i.e. 1189 mg L-1), which may benefit digestion and metabolic health. The pH values range from 5.0 (acidic, Valea Izvoarelor sparkling) to 7.7 (slightly alkaline, Aqua Carpatica still), indicating varying acidity across brands. Still waters tend to have more neutral pH values, while sparkling waters are more acidic due to dissolved CO₂.
The dry residue at 180°C reflects the total mineralization of the water. High values are recorded for Kaufland still (i.e. 924 mg L-1) and Aqua Carpatica sparkling (i.e. 1281 mg L-1), indicating significant mineral content. Sulphates, known for their role in digestion and detoxification, are present in moderate amounts in some brands, such as Aqua Carpatica Still (i.e. 21.23 mg L-1), but are negligible in others.
Waters like Perla Harghitei still and Borsec still combine moderate mineralization with balanced calcium and magnesium levels, making them suitable for daily consumption. On the other hand, sparkling waters with high sodium, magnesium, and bicarbonate levels, such as Bucovina sparkling and Aqua Carpatica sparkling, may be beneficial for specific therapeutic purposes but less suitable for individuals with dietary restrictions.
In conclusion, the mineral content of bottled waters varied, catering to different health needs and preferences. When selecting bottled water, consumers should consider their health requirements, particularly regarding sodium, calcium, and magnesium intake, as well as the water’s pH and mineralization levels.
Dissolved oxygen is an indicator of water quality. The highest values were found in Water Network Botosani (i.e. 8.64 mg L-1) and Water Network Iasi (i.e. 8.01 mg L-1), indicating good oxygenation. Conversely, lower values, such as those observed in Valea Izvoarelor Natural sparkling mineral water (i.e. 2.03 mg L-1) and Perla Harghitei Natural sparkling mineral water (i.e. 1.14 mg L-1), suggest lower quality, potentially unsuitable for consumption.
pH falls within the optimal range of 6.5–8.5 for most still waters, such as Water Network Botosani (8.1), Aqua Carpatica Still natural mineral water (7.91), and Carpatica Still natural mineral water (7.95). Carbonated waters, such as Aqua Carpatica Natural sparkling mineral water (5.7) and Valea Izvoarelor Natural sparkling mineral water (5.26), show lower pH levels due to their CO₂ content, characteristic of this type of water.
The conductivity, which reflects the concentration of dissolved salts, varies significantly across samples. Aqua Carpatica Natural sparkling mineral water (i.e. 1603 µS cm-1) and Kaufland Still natural mineral water (i.e. 1257 µS cm-1) exhibit high values, indicating significant mineral content. In contrast, Bucovina Still natural mineral water (i.e. 100 µS cm-1) indicated low-salt water, suitable for frequent consumption.
TDS exceeded the allowed upper limit of 500 mg L-1 in Aqua Carpatica Natural sparkling mineral water (i.e. 802 mg L-1) and Kaufland Still natural mineral water (i.e. 628 mg L-1), potentially affecting taste and suitability for regular consumption. Waters with lower TDS, such as Water Network Botosani (i.e. 197 mg L-1) and Aqua Carpatica Still natural mineral water (i.e. 155 mg L-1), are more appropriate for drinking.
Salinity rangeed from 0.05 to 0.91, with low values, such as those from Bucovina Still natural mineral water (0.05) and Wonder Still natural mineral water (0.06), making them suitable for frequent consumption. Waters with higher salinity, such as Aqua Carpatica Natural sparkling mineral water (0.81), may negatively affect taste and usability.
Oxidation-reduction potential, an indicator of chemical stability, varies significantly, with higher values in Water Network Iasi (193.2 mV) and Valea Izvoarelor Natural sparkling mineral water (138.8 mV), potentially indicating chemical instability that could affect perceived water quality.
Dissolved oxygen percentage (DO%) was high in Water Network Botosani (76.1%) and Water Network Iasi (73.2%), suggesting superior quality. On the other hand, lower values, such as those in Valea Izvoarelor Natural sparkling mineral water (4.4%) and Bucovina Natural sparkling mineral water (8.4%), reflected insufficient oxygenation, which may affect water characteristics.
In conclusion, the still waters such as Water Network Botosani, Water Network Iasi, and Aqua Carpatica Still natural mineral water stood out with optimal parameters, making them most suitable for regular consumption. Conversely, the carbonated waters, particularly Aqua Carpatica Natural sparkling mineral water and Kaufland Still natural mineral water, displayed high TDS and salinity levels, making them less suitable for frequent consumption without additional treatment.