1. Introduction
Noise is a sound wave that is aperiodic in nature, has a random and indeterminate pitch, and interferes with the quality or detection of other signals (Al-Radhi, Csapó, & Németh, 2019). Nonetheless, noise is an undesirable sound that is considered an environmental hazard that harms animal and human health when exposed to extremely high levels on a recurring basis. The term ’noise’ is derived from the Latin word ’nausea’, which means ’unwanted sound or sound that is loud, unpleasant, or unexpected’. According to (Uddin, 2018), noise assessment and monitoring usually underestimate the magnitude of its detrimental potential until humans are affected by its consequences. According to the World Health Organization (WHO), noise pollution puts 1.1 billion people (aged 12 to 35) at risk of hearing loss (WHO, 2021).
Noise pollution is one of the most urgent and evident environmental problems associated with increasing urbanization, industrialization, and population increase. Because of its intangible consequences and associated health problems, people are less worried about and disregard the threat posed by noise pollution. Noise pollution is believed to be significantly impacted by the growth of urban sprawl, transportation, economic activity, and development (Wokekoro, 2020; Shalini & Kumar, 2018). The issue of noise pollution is not limited to industrialized nations; it also exists in developing nations like Bangladesh, which is fast becoming more urbanized. Leading regional and international economic hubs, enhanced and extended port infrastructure, and new trade routes can all be found at Chattogram, the second-largest city and port in Bangladesh. According to press reports, city people often lament the higher volume of noise they are subjected to, especially in quiet and residential locations like parks, recreation centers, schools, hospitals, and so forth, as compared to the 1980s and 1990s (Islam, Nahar, Islam, Islam, & Hossen, 2015).
The Bangladesh Bureau of Statistics (BBS, 2015), estimates that 165,158,616 people made up Bangladesh’s total adjusted population in 2022. Chittagong, Bangladesh’s port city, is the country’s second-biggest metropolis after Dhaka. People from Bangladesh’s rural areas travel to this metropolis in quest of employment and other amenities as a result of the establishment of numerous heavy industries. Currently, there are about 5,253,000 people living in the port city, and the Chattogram metropolitan area (CMA) has a population growth rate of 2.34% year, which is marginally higher than the 1.38% annual rate for the entire country. This metropolitan city occupies an area of approximately 1552 square kilometers (BBS, 2015).
A higher birth rate than in rural areas, economic growth, and migration from rural to urban areas are possible contributing causes to the Chattogram Metropolitan Area’s (CMA’s) greater urban growth rate (Rashin & Ahmed, 2013). People from all across the nation are coming to the Chattogram Metropolitan Area (CMA) in quest of greater possibilities as a result of this economic expansion. It follows that Chittagong’s high population, numerous heavy industry, and heavy traffic are all easily understood. Chittagong’s traffic volume, industrial expansion, and infrastructure advancement are all growing quickly (Tania & Odagiu, 2007). As a result, there is an increasing need to limit noise pollution. Traffic noise pollution is particularly bad in the morning and evening rush hours. According to (Sultana, 2020), the problem is particularly acute at the intersections of CDA Avenue, Agrabad, Bahaddarhat, Mehedibagh, Saltgola, A K Khan, Kalurghat, Nasirabad, Jubilee Road, Chawkbazar, Tiger Pass, GEC circle, Jamal Khan, Muradpur, and Oxygen. The outcome of noise pollution Millions of individuals in Bangladesh suffer from a wide range of health issues, from heart attacks to deafness. Many residential areas, residential apartments, commercial/residential flats, schools, hospitals, and parks are being constructed on main roads in Chittagong due to inadequate urban planning, but no workable steps are being done to lessen noise pollution. As a result, unbearable noise pollution has a negative influence on a large number of city dwellers and has long-term effects (Mason, 2016).
The city of Chattogram has continued to grow as a result of rising urbanization, quick industrial advancement, extensive development activities, port facilities, suitability for trade and commerce, expansion of the economy, travel and tourism etc., which has led to a decline in environmental quality, particularly noise pollution. Finding the research gaps, this study aims to compare the exposure level of noise in selected industrial and residential areas of Chattogram Metropolitan Area (CMA). This study also aims to depict the spatial variations of the noise level in the study area by using geo-spatial techniques and to determine the effects of noise pollution on human health in the study area.
2. Methodology
2.1. Study Area
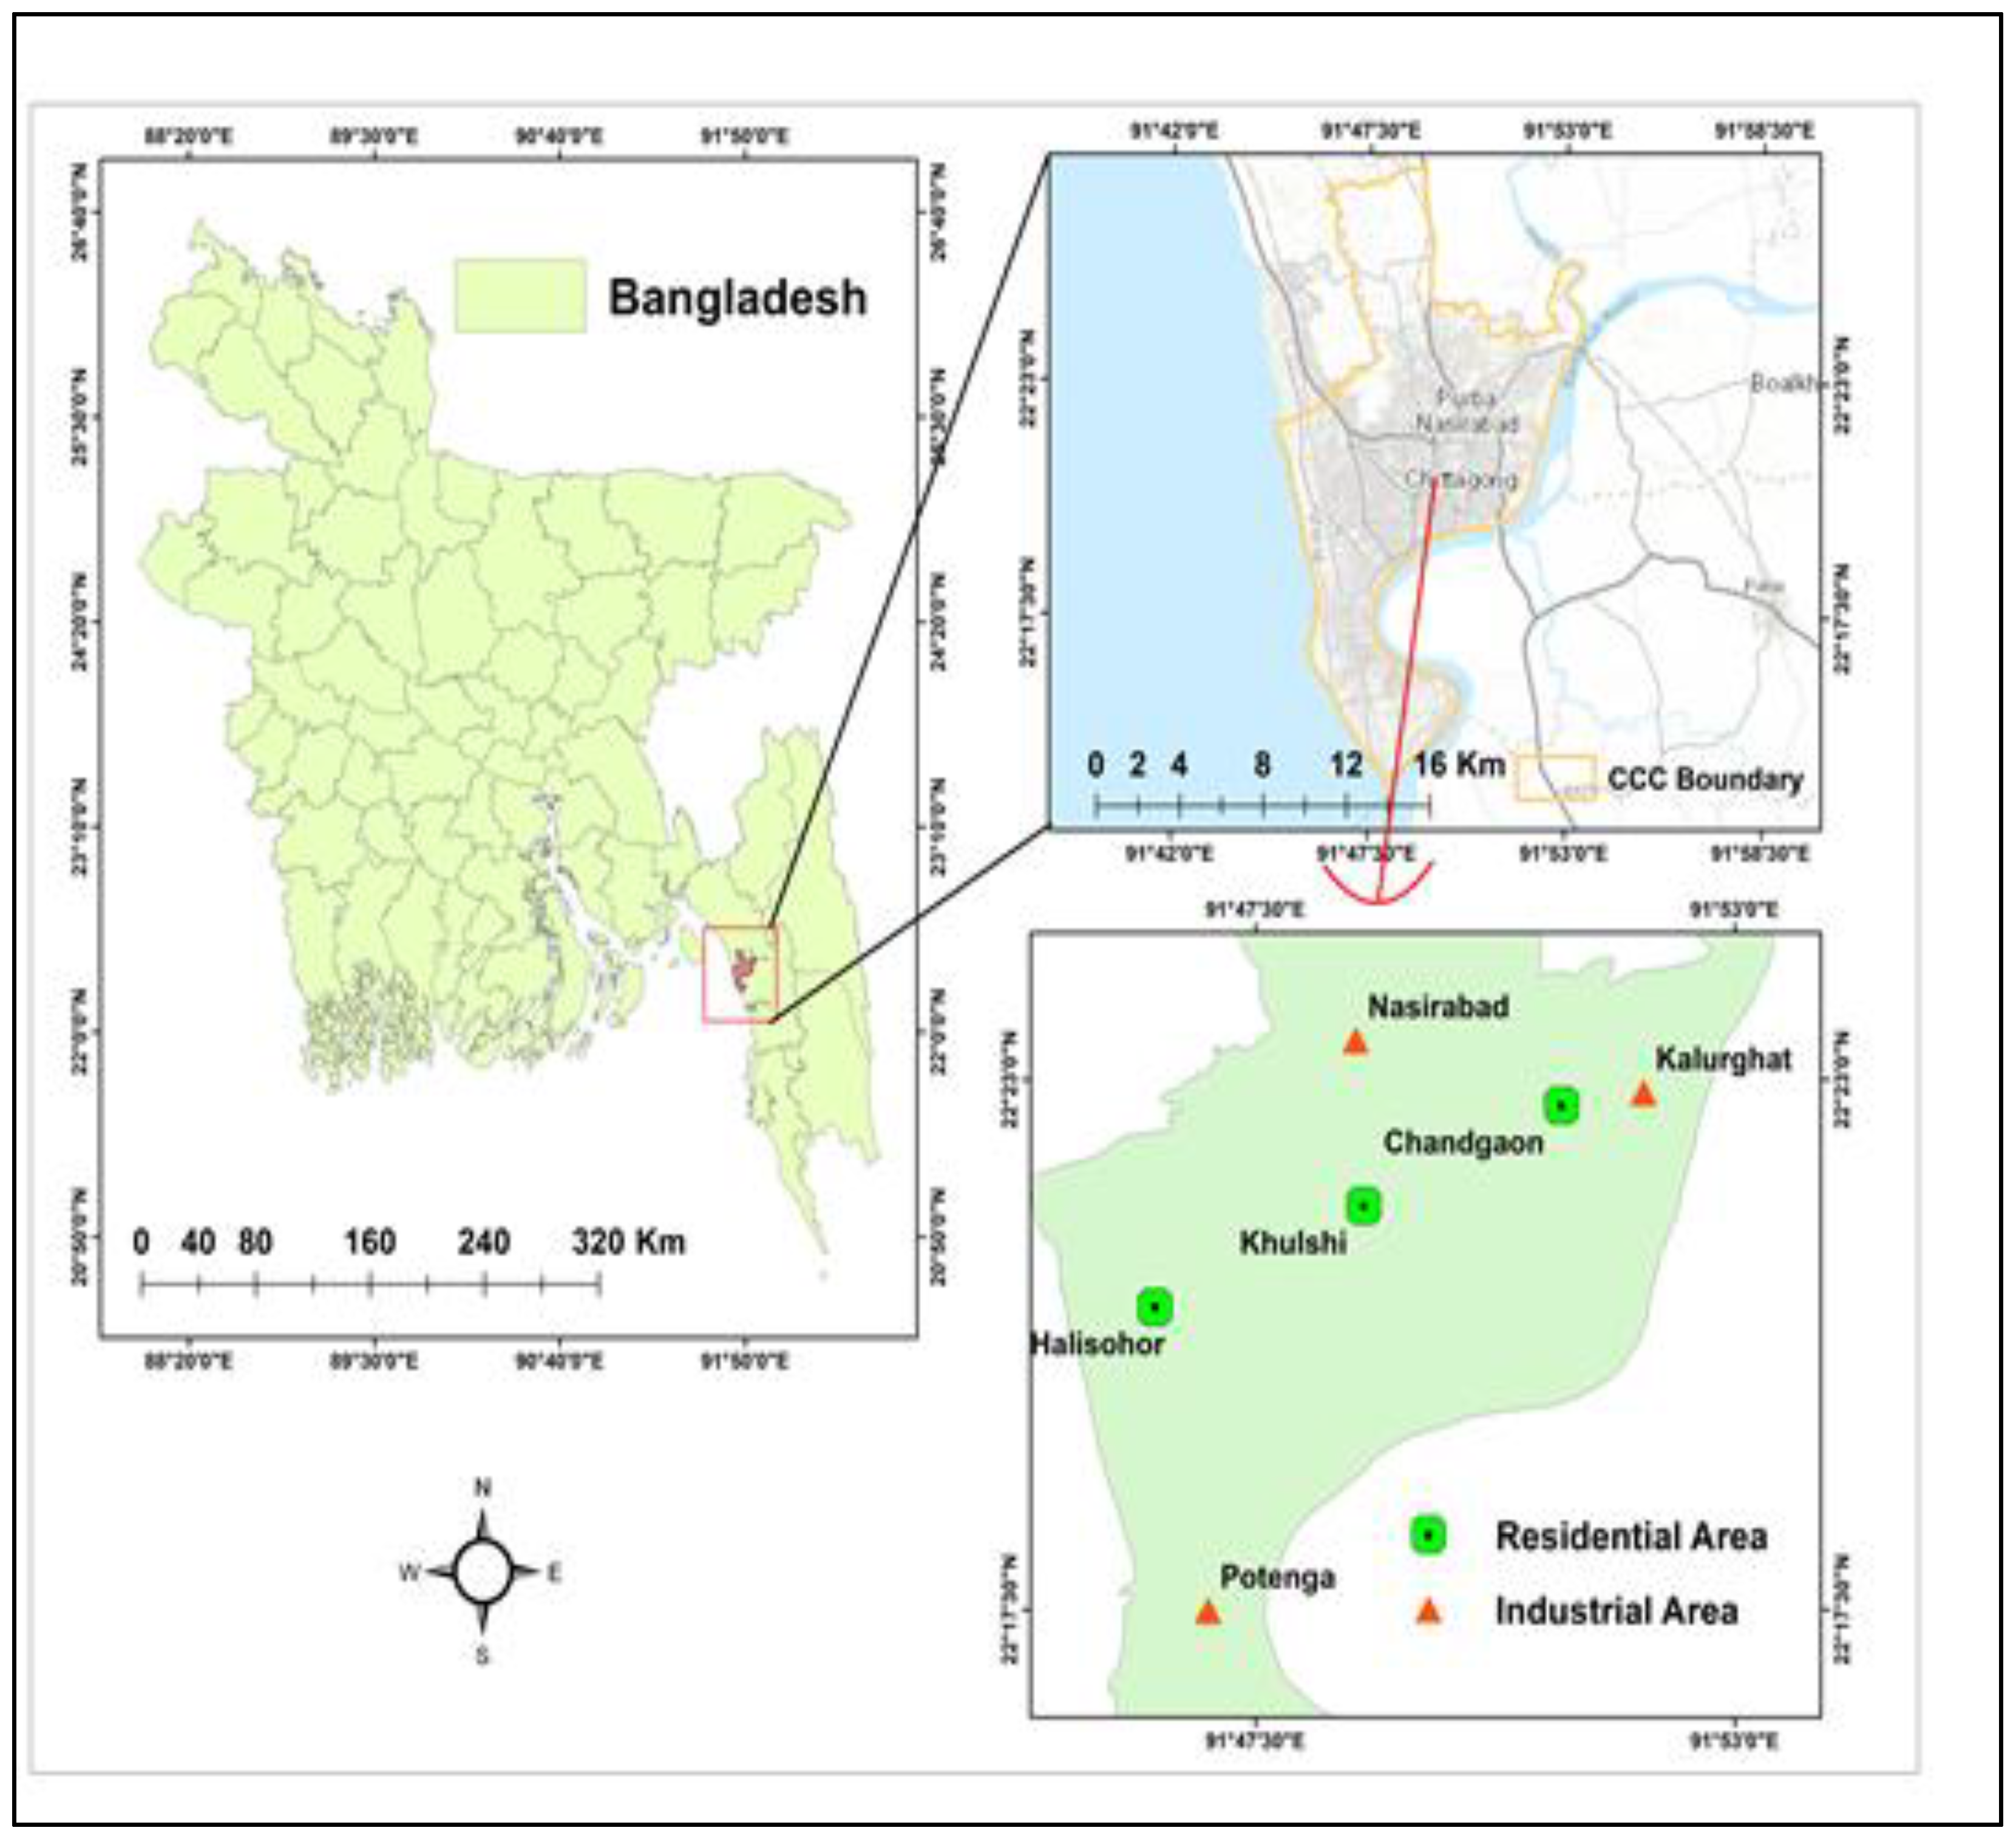
The Chattogram metropolitan area (CMA) (
Figure 1) is located in the southeastern part of the country. It is situated between the Karnaphuli River and the Bay of Bengal, and is bordered by the Chattogram Hill Tracts (CHT) to the east and north. The geographical location of the CMA is 22°20′06″ North latitude and 91°49′57″ East longitude. For conducting the research on the basis of aim and objectives, two categories of area are selected and which are Industrial area and residential area. Chattogram is a hub of countries industrial site. Among them three most important areas are chosen they are Kalurghat heavy industrial area, Nasirabad industrial area and Patenga industrial area. Chandgaon, Khulshi and Halisohor area are selected as residential area. Both noise level data and questionnaire survey is conducted in each study area.
2.2. Data Collection and Analysis
2.2.1. Primary Data Collection
Primary data is collected by questionnaire survey, visual observation, expert opinion and noise data are collected through Noise Level Meters (NLM, CEM DT-8850), GPS (Garmin etrex 10) devices also used for collecting spatial data.
2.2.2. Secondary data collection
Secondary data is collected from various sources, such as published research studies, government reports, company records, or other sources of pre-existing data. For this research work substantial amount of information was needed to show the all relevant works that had been done and to identify the research gaps as well. For this reason, data were gathered from different national and international organizations including NGOs, universities, research organizations and so on. Likewise, books, research articles, journals, unpublished research paper were also reviewed to include relevant information.
2.3. Sampling Design
Simple random sampling method was used for the investigation. Questionnaire surveys and noise level data were collected from six selected industrial and residential areas of Chittagong city. Respondents for the questionnaire survey were chosen at random survey as Owner/ manager of industry, Manager and member of residential community, Driver, Helper, Traffic police, Health expert, Govt. official, Mass people etc.
2.4. Data Analysis and Presentation
The data that were collected through questionnaire survey and the result of noise reading analysis had been checked thoroughly before processing in computer. SPSS 25.0 has been used for the frequency analysis, calculate percentage and correlation analysis. Along with SPSS, Adobe Illustrator and Microsoft Excel 2016 has also been used to demonstrate the analyzed data through charts, graphs and diagrams. Collected noise data put in ArcGIS 10.8 with corresponding coordinate and create a point feature using geo-statistical tools or interpolation techniques by conducting spatial analysis to interpolate noise level.
2.5. Methodological Overview
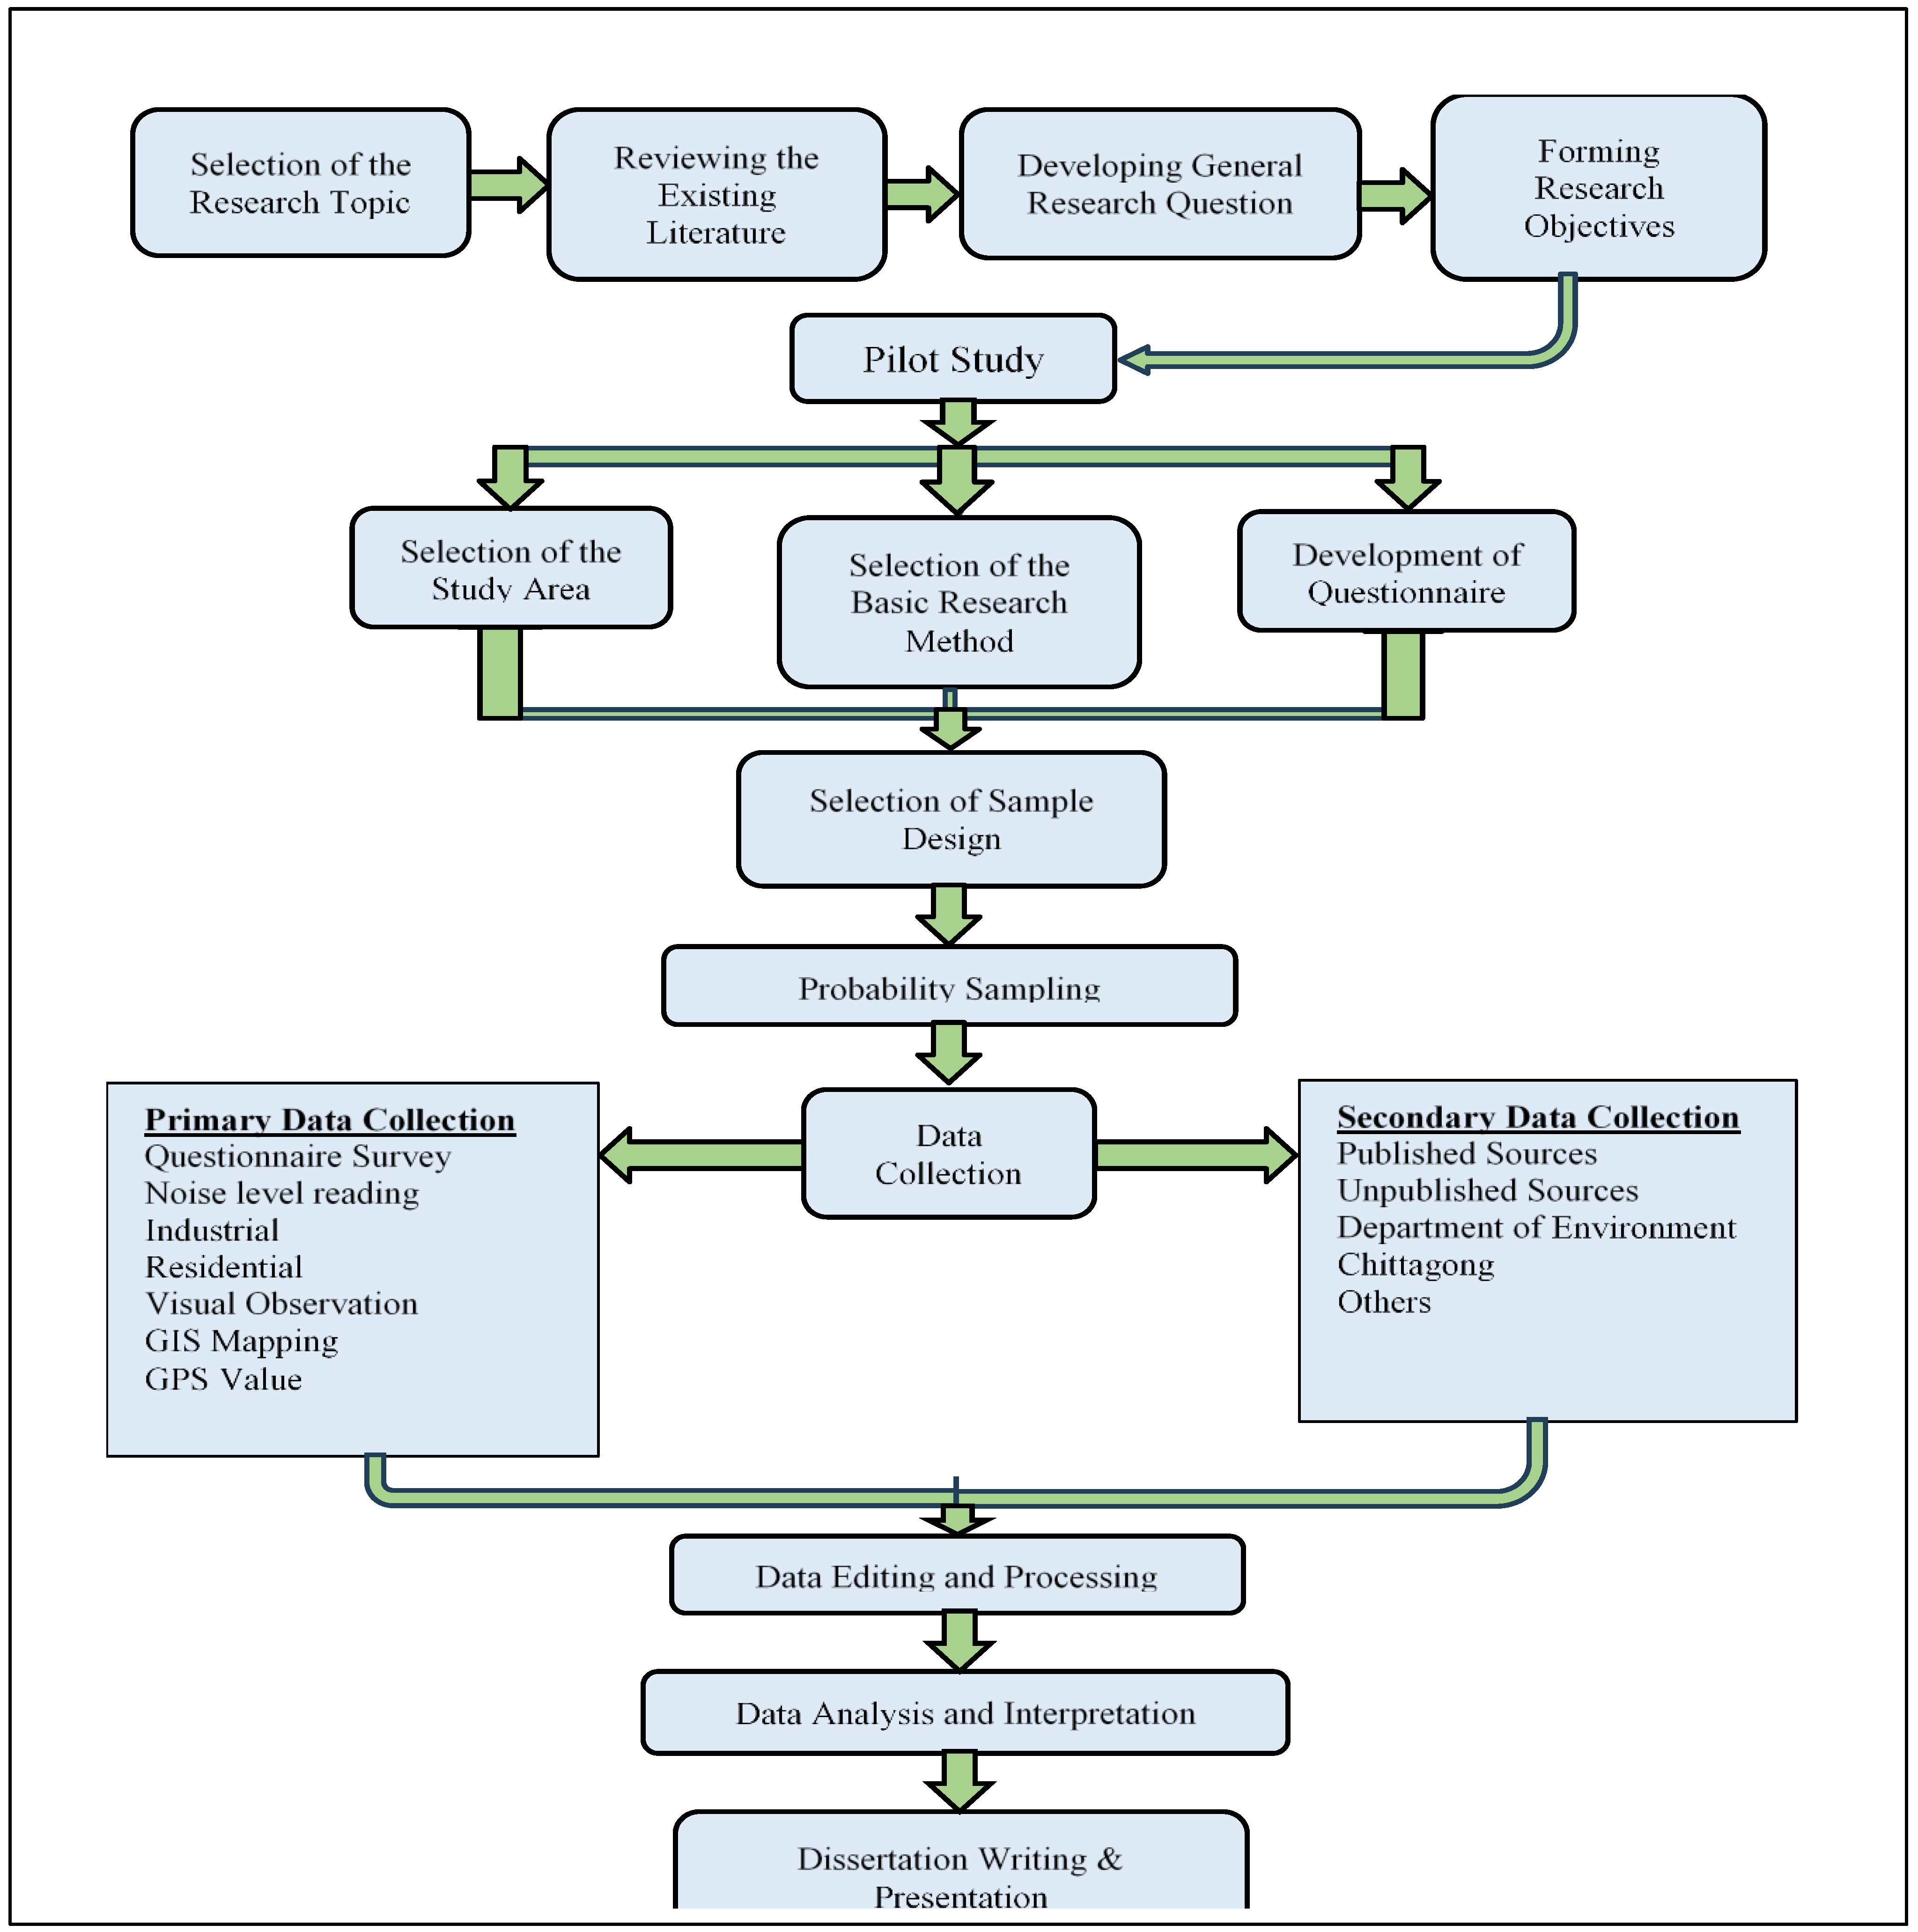
The
Figure 2 contains the overview of the methodology of the present research from the very beginning to the last. It shows that the both primary and secondary data sources were used to conduct the whole research.
3. Result and Discussions
3.1. Residential Noise Level at Working Day
The maps (
Figure 3,
Figure 4,
Figure 5 and
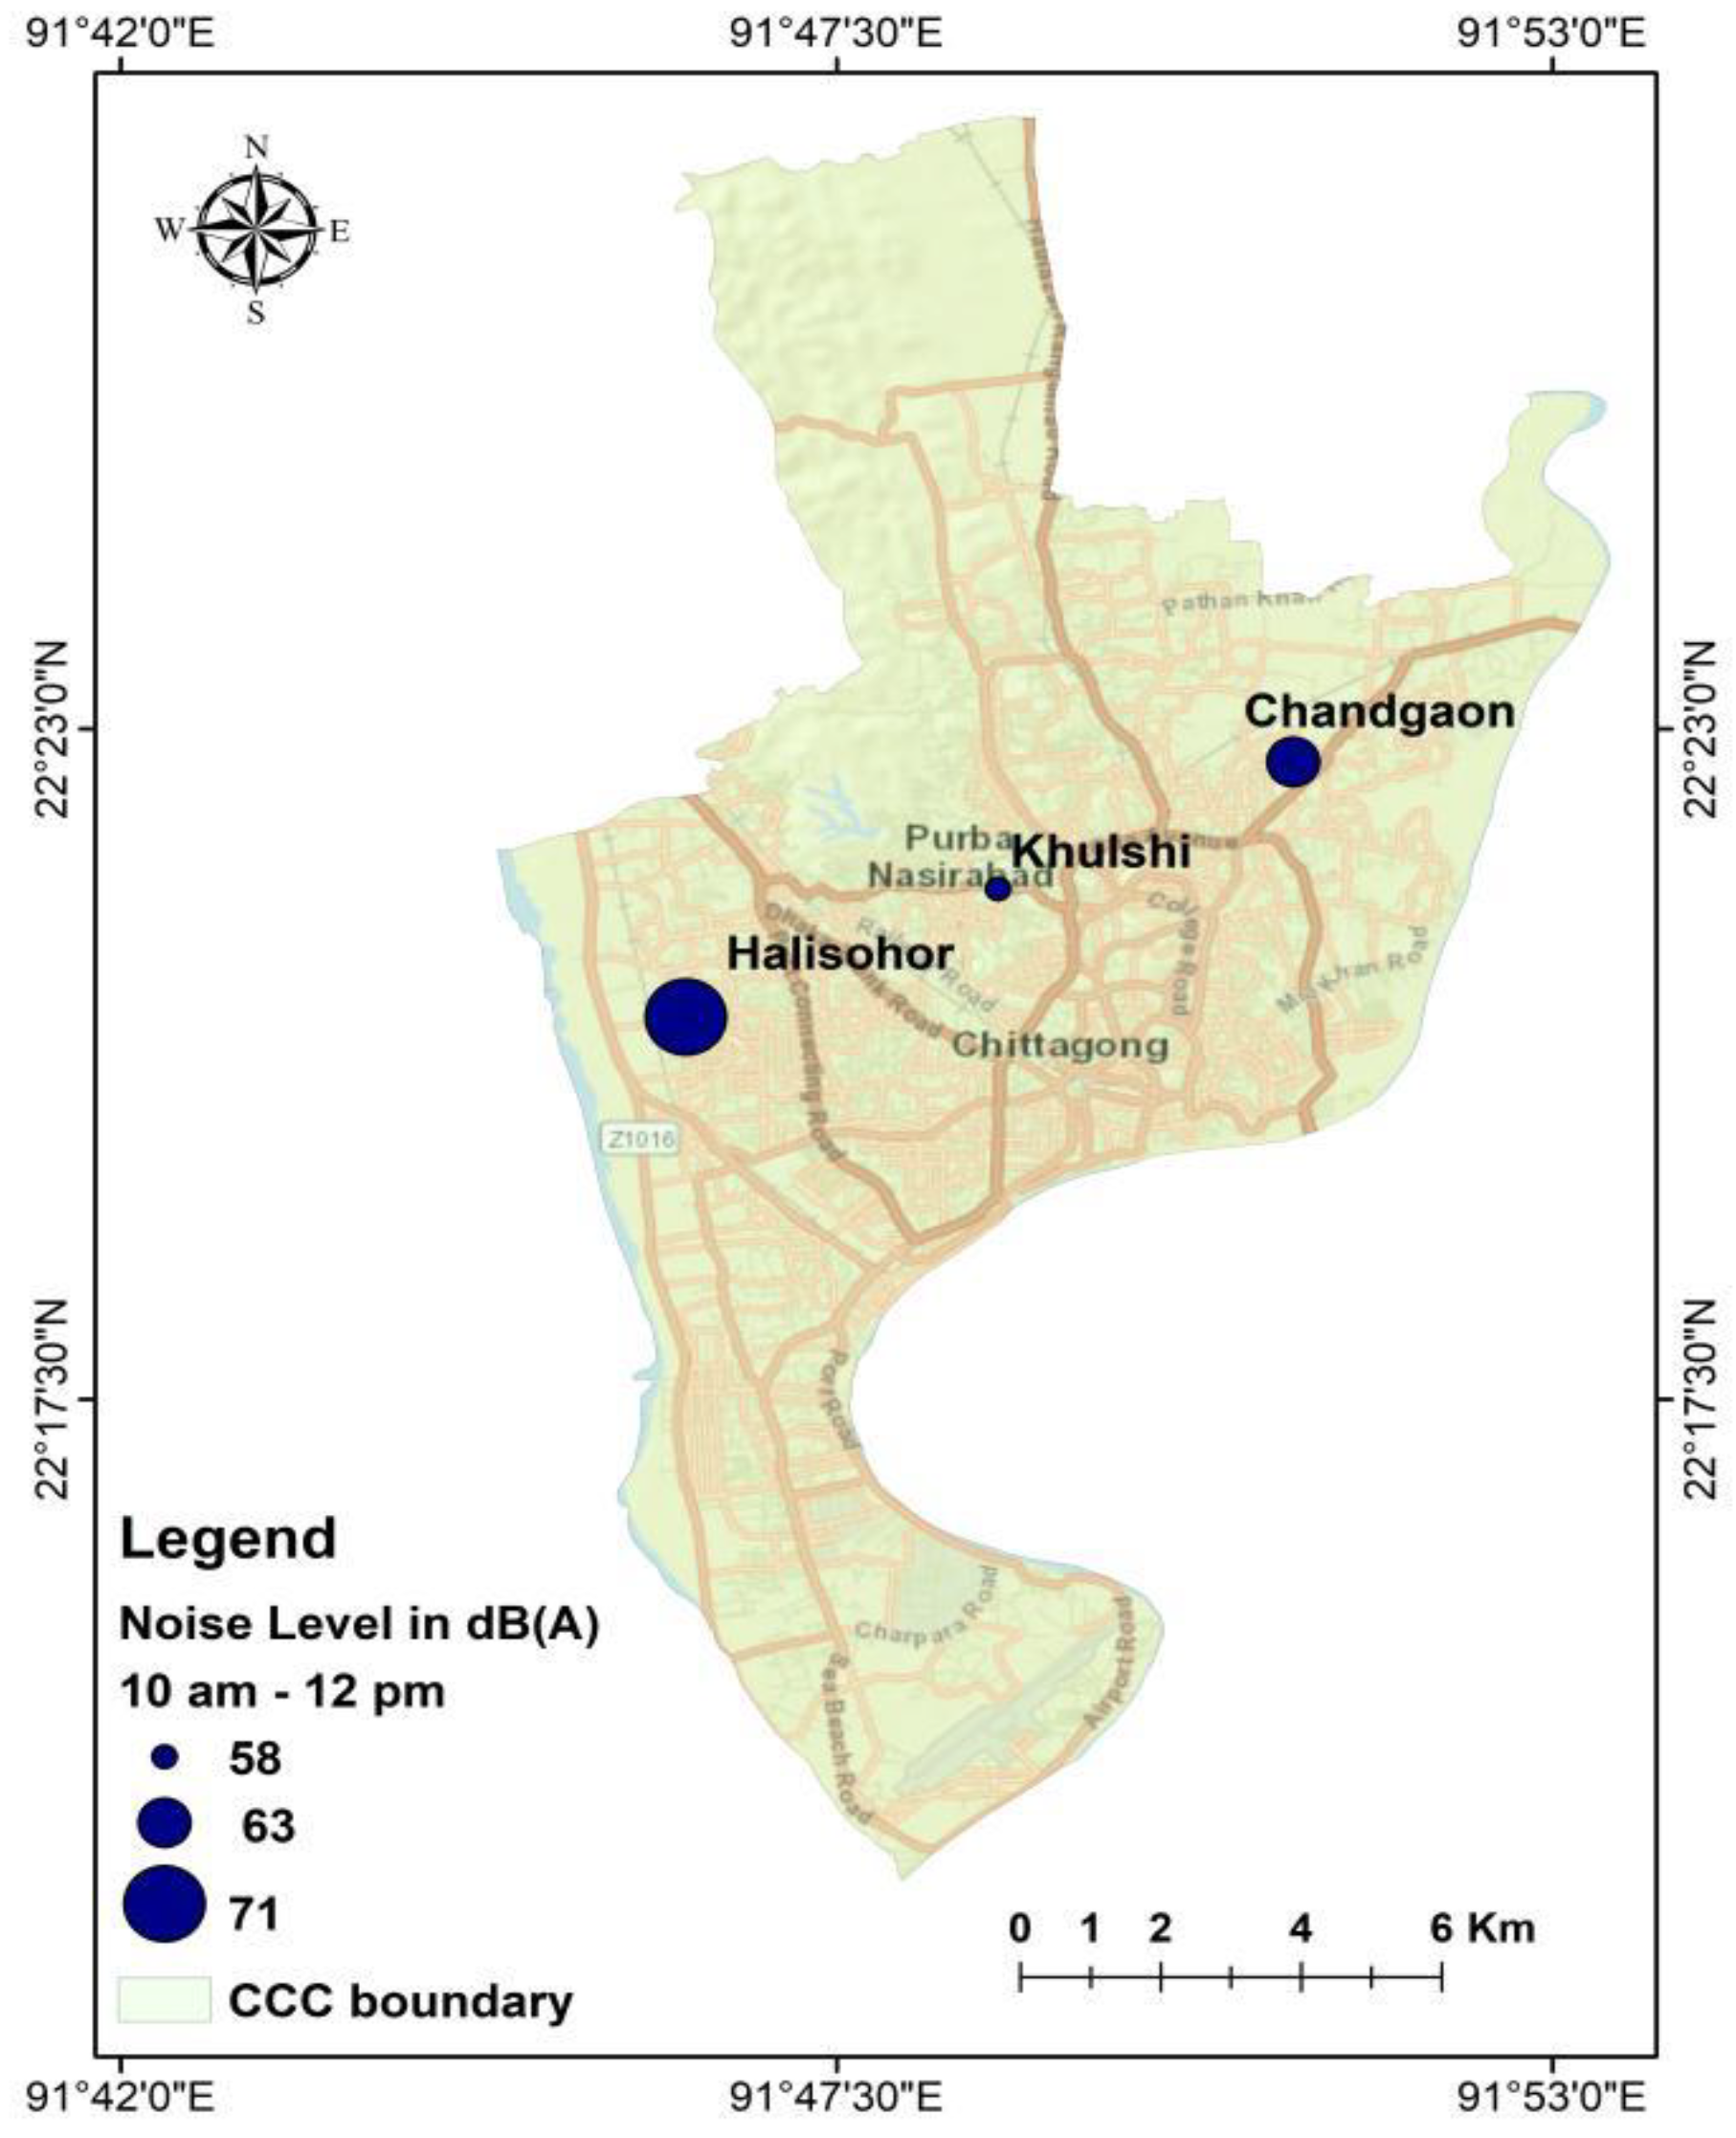
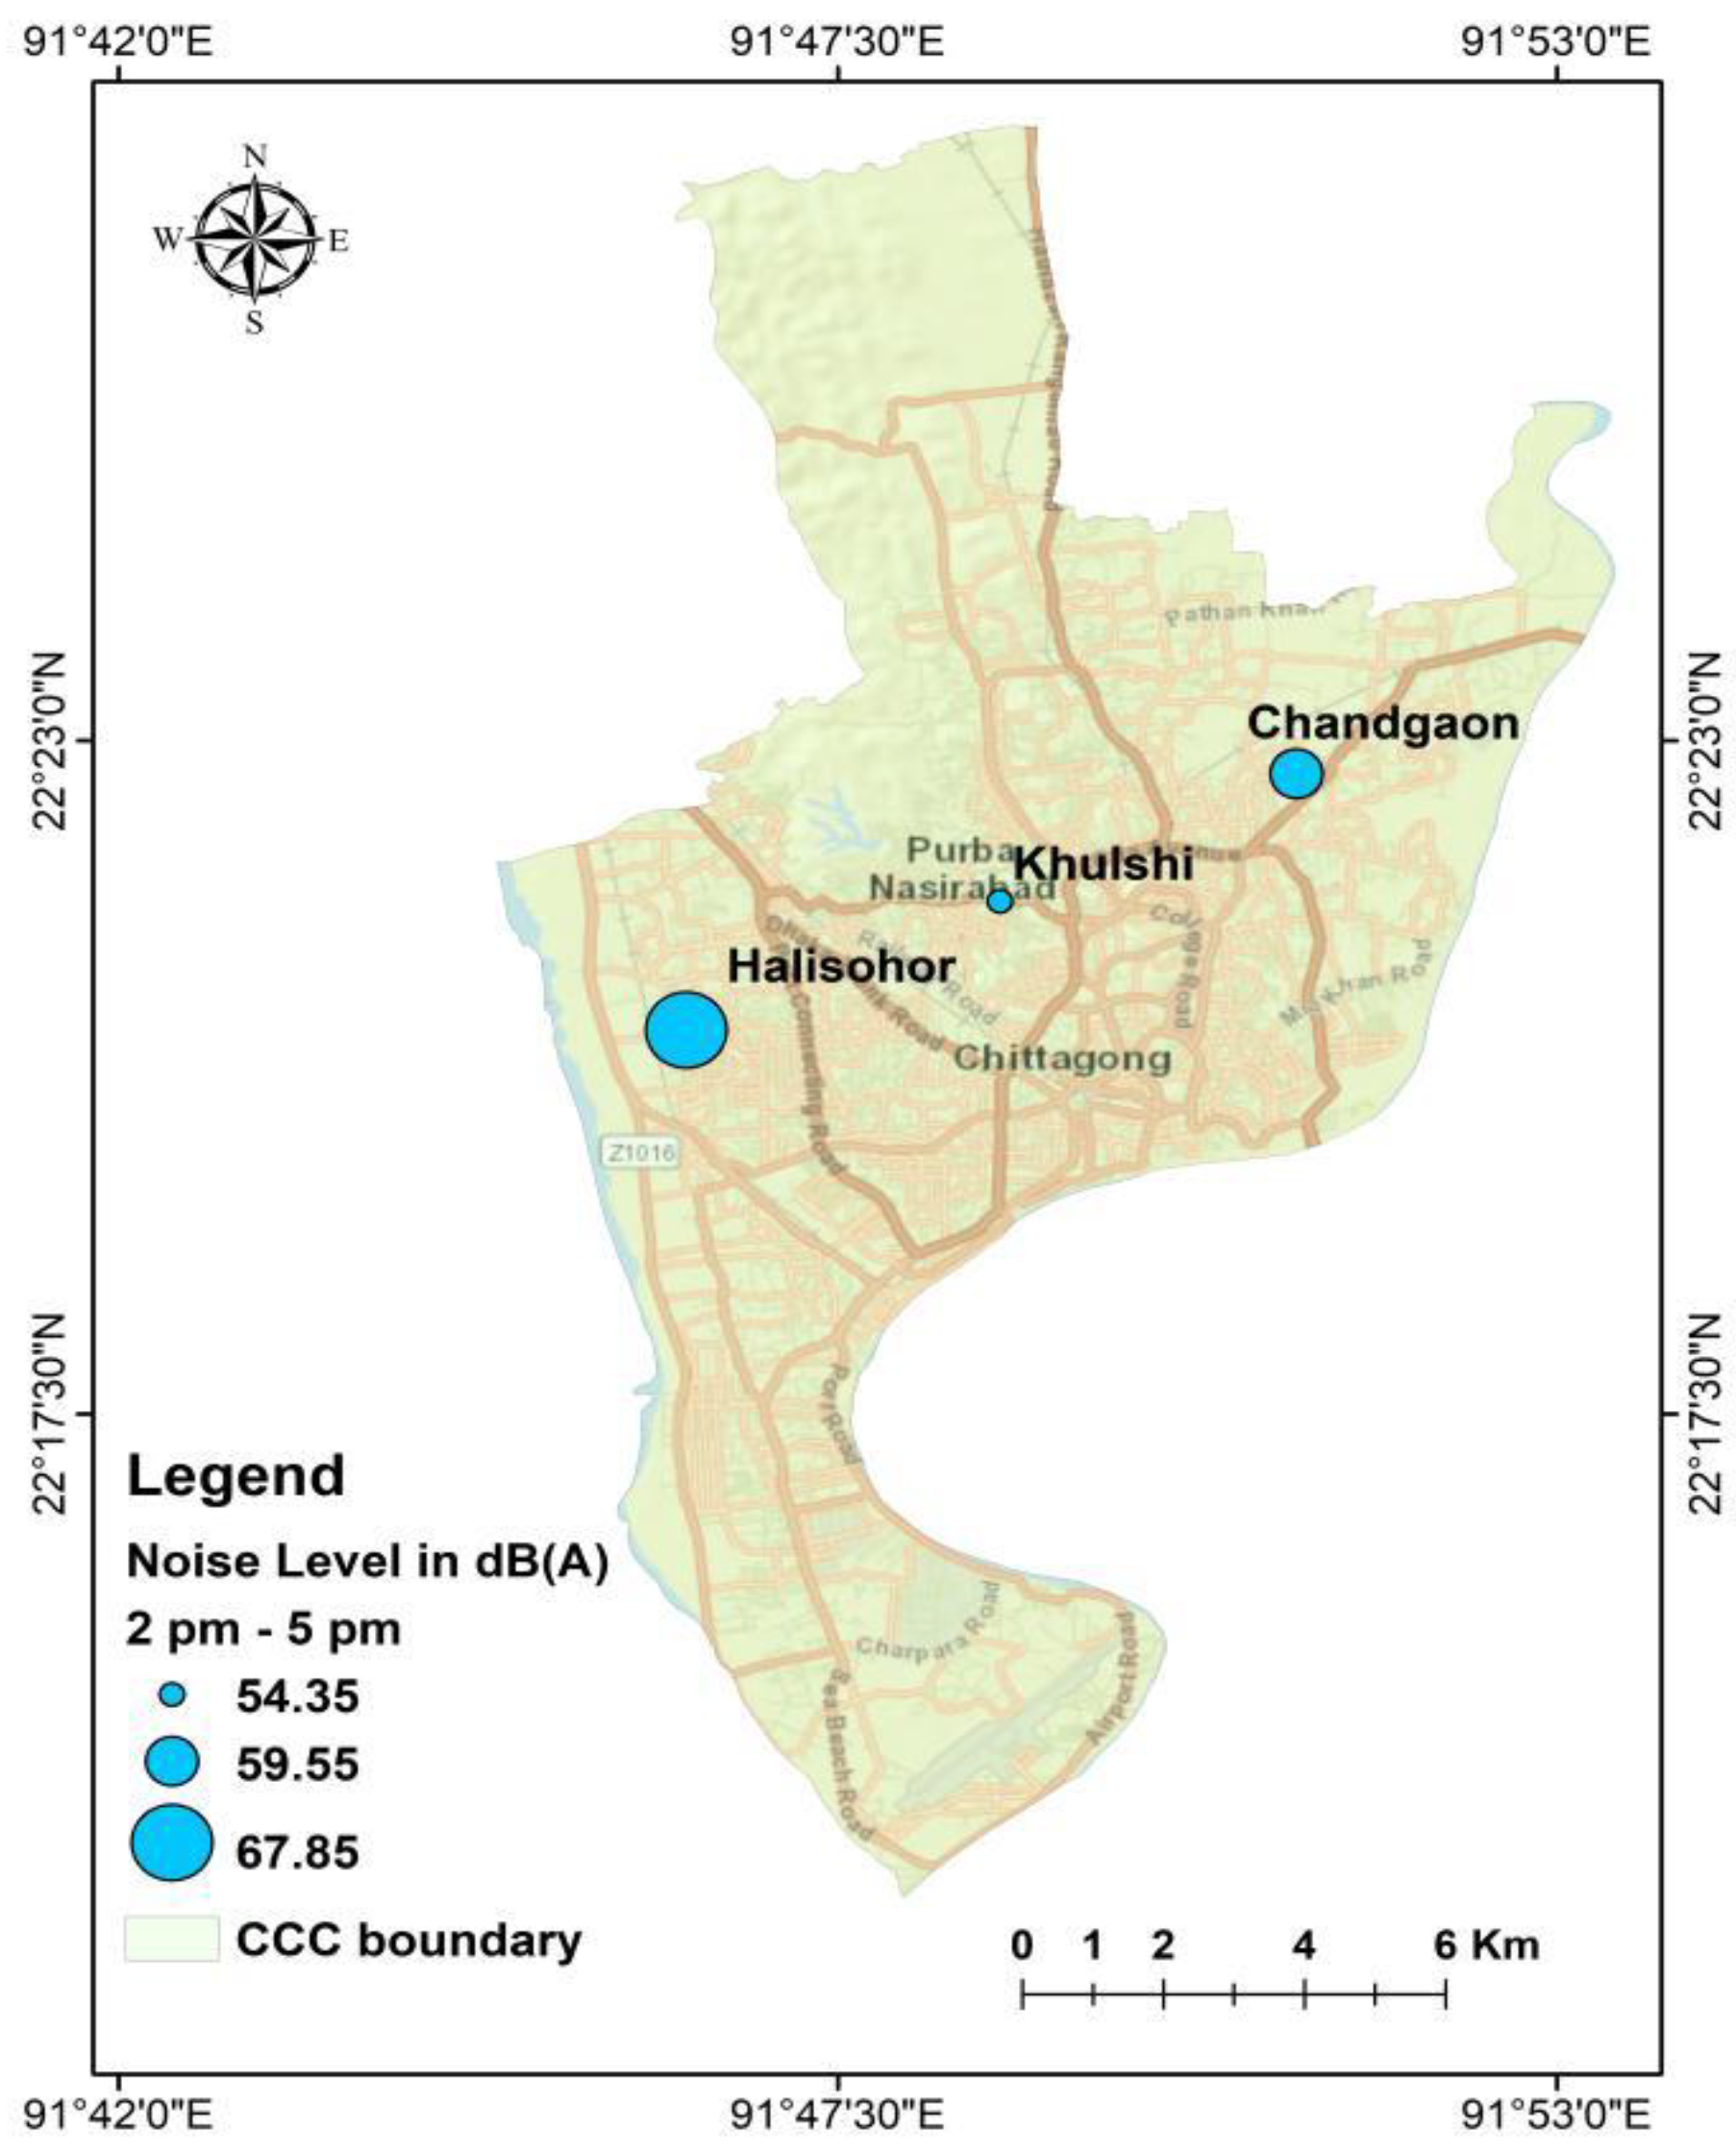
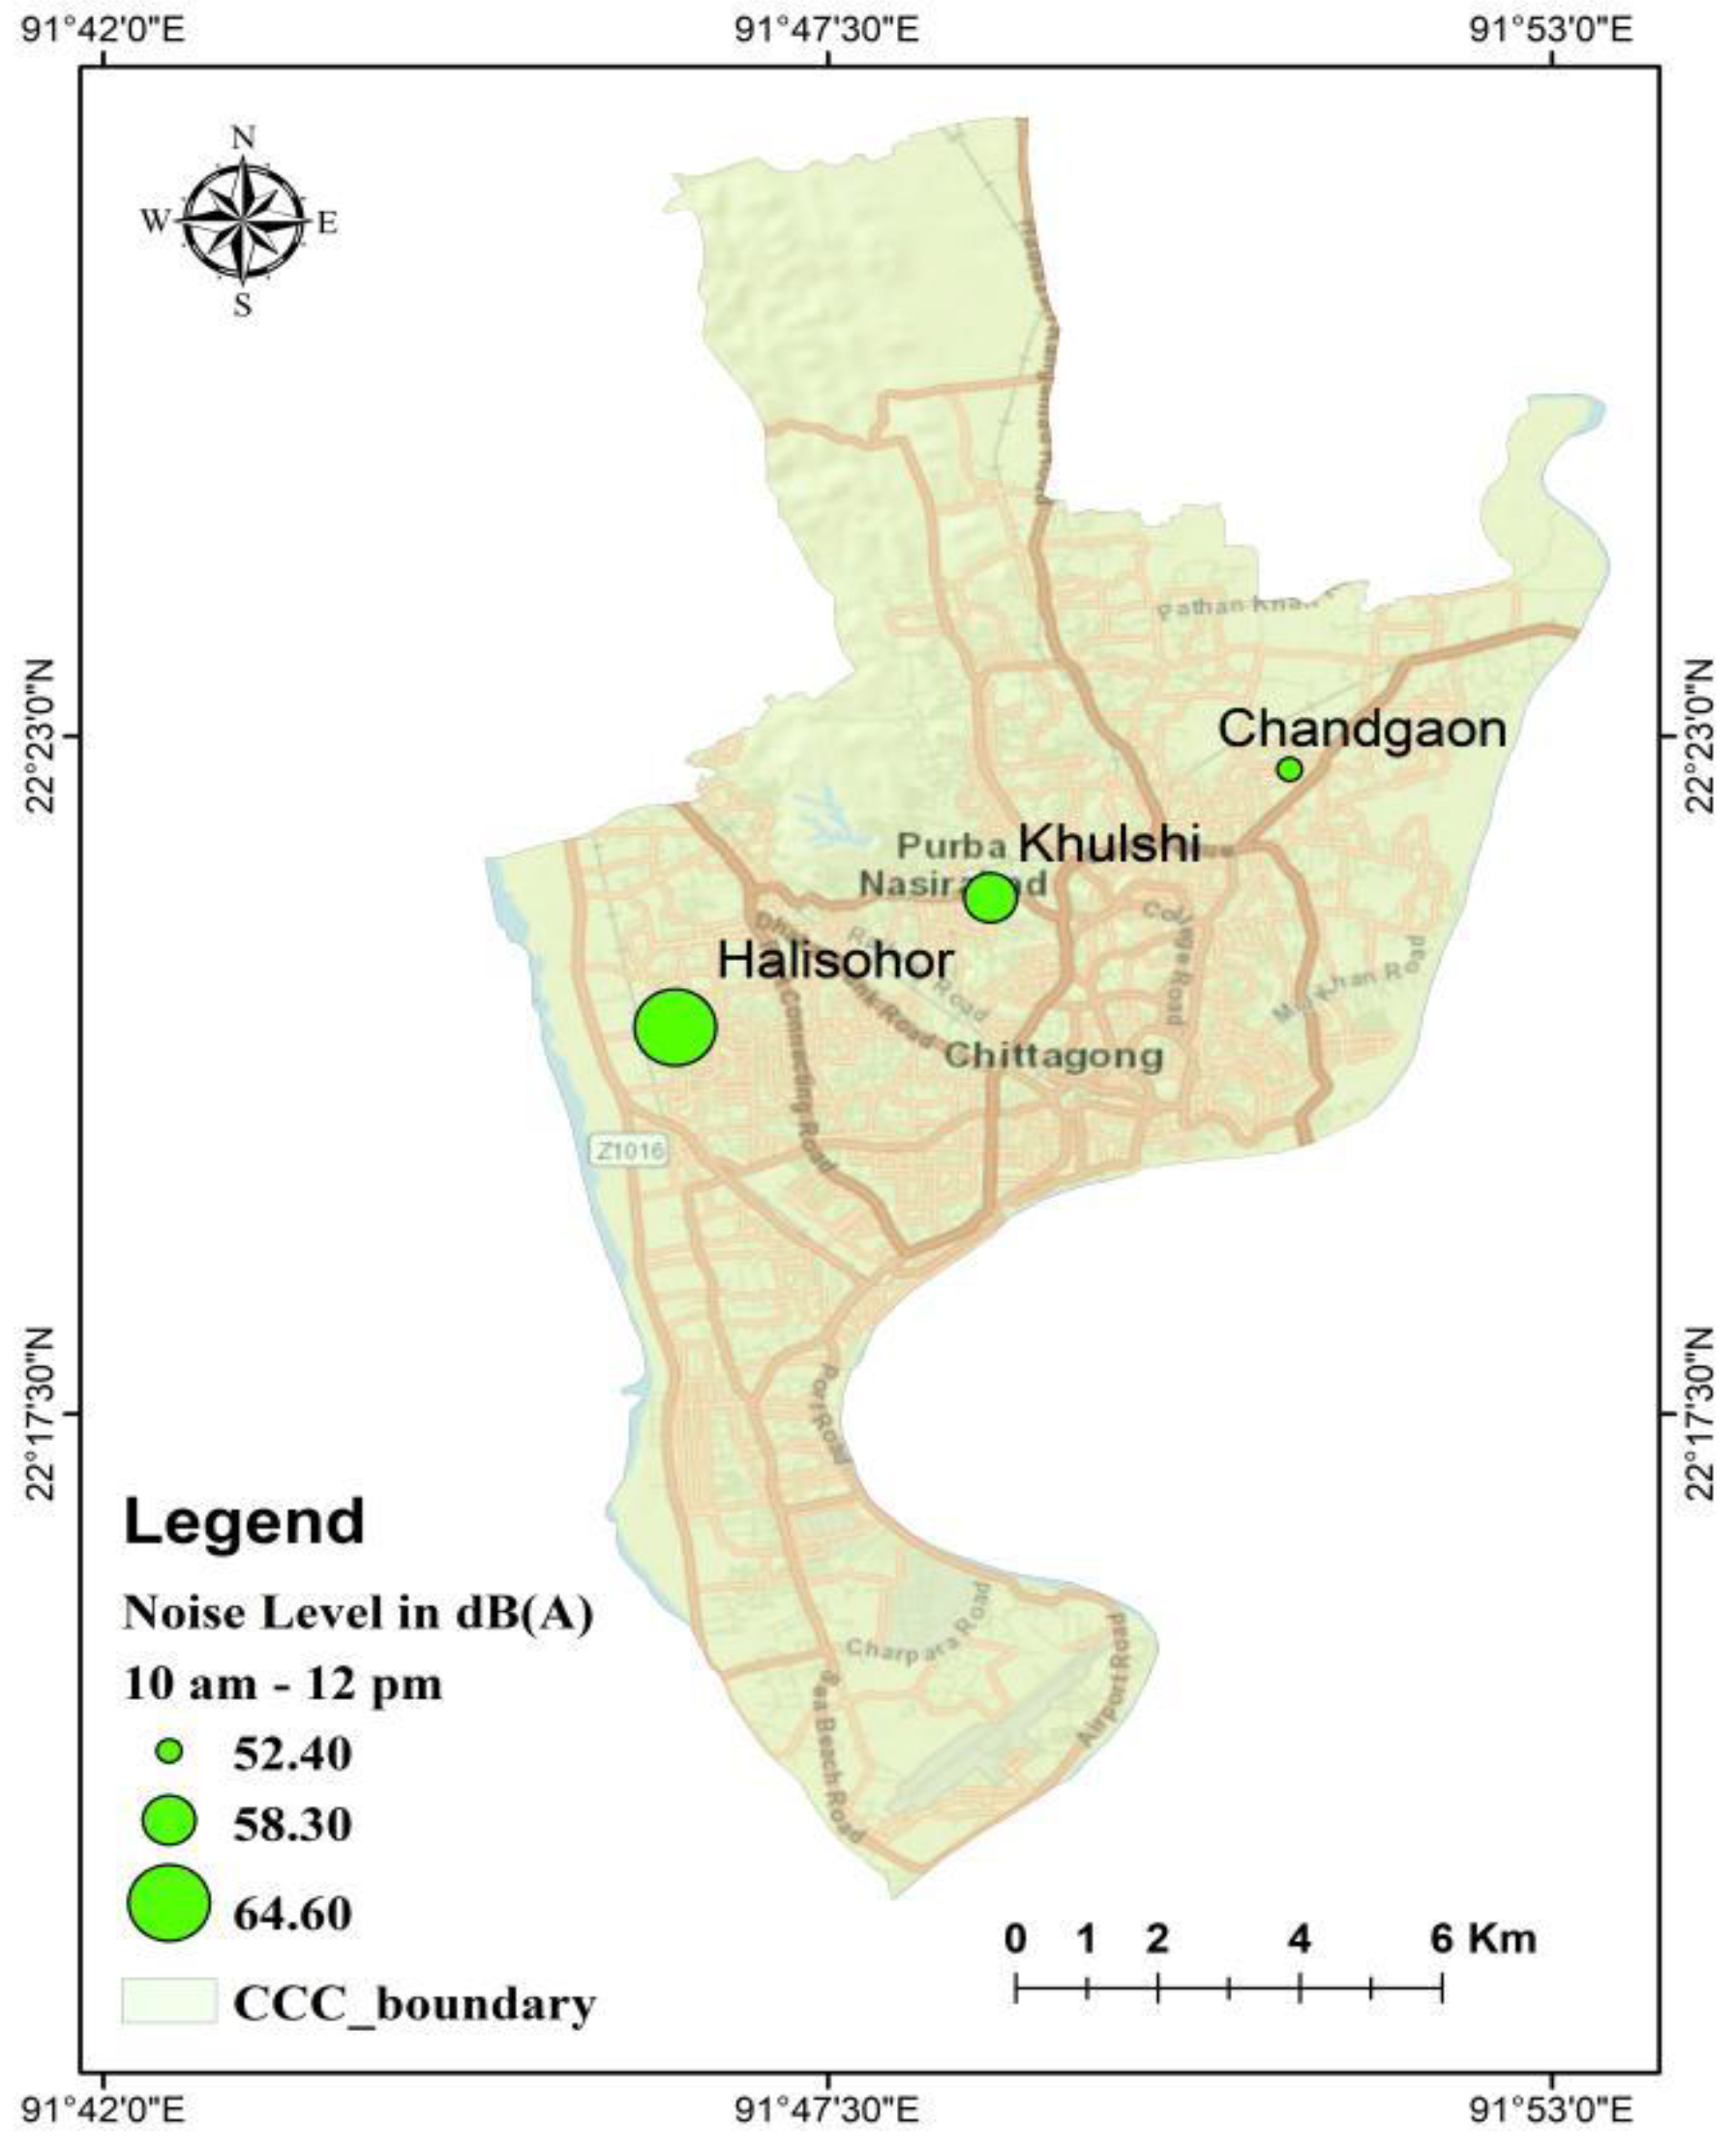
Figure 6) depict residential noise readings in decibels dB(A) in the morning (10 am to 12 pm) and midday (2 pm to 5 pm) during working days in the study area. A sound level meter is used to measure noise levels in the industrial areas of Khulshi, Chandgaon and Halisohor. According to the map, the peak noise level is 71.00 dB(A) between 10 a.m. and 12 p.m. at the Halisohor residential area. 63.00 dB(A) and 58.00 dB(A) are measured between 10 am and 12 pm from Chandgaon and Khulshi. Again, highest noise reading is measured from Halisohor at 2 pm- 5 pm is 67.85 dB(A). 59.55 dB(A) and 54.35 dB(A) noise measured from Chandgaon and Khulshi area respectively at the same time.
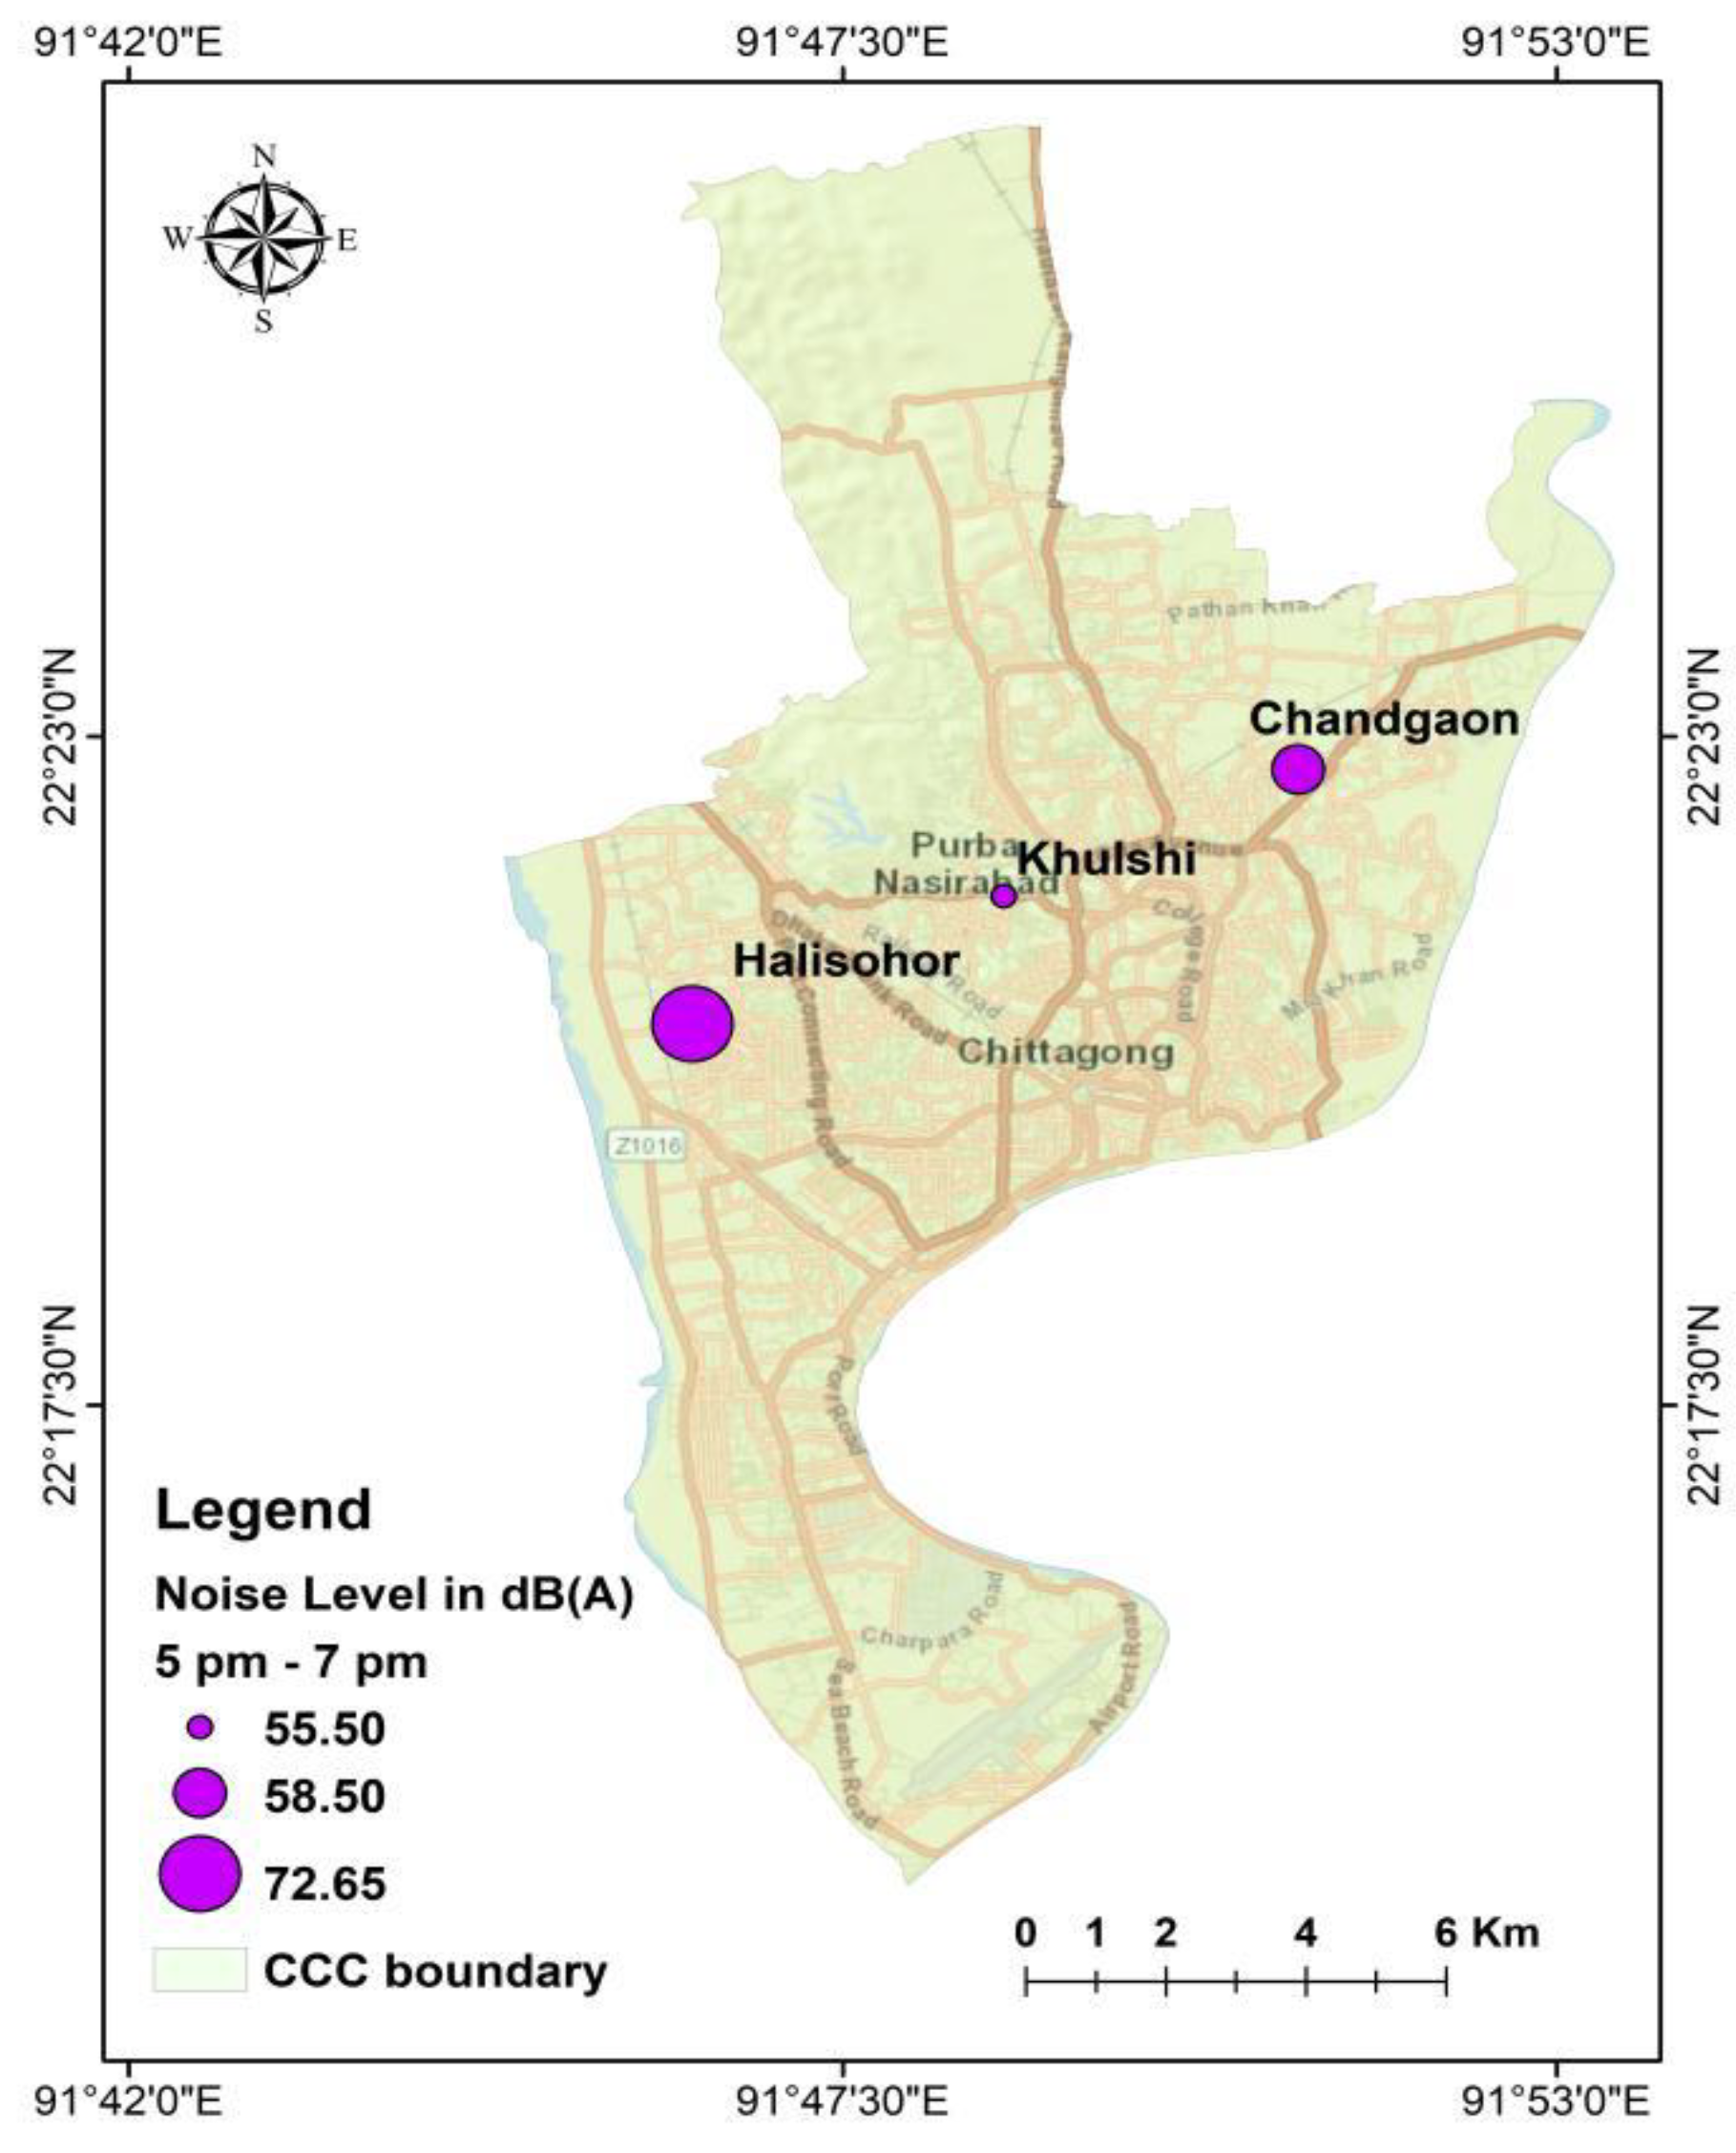
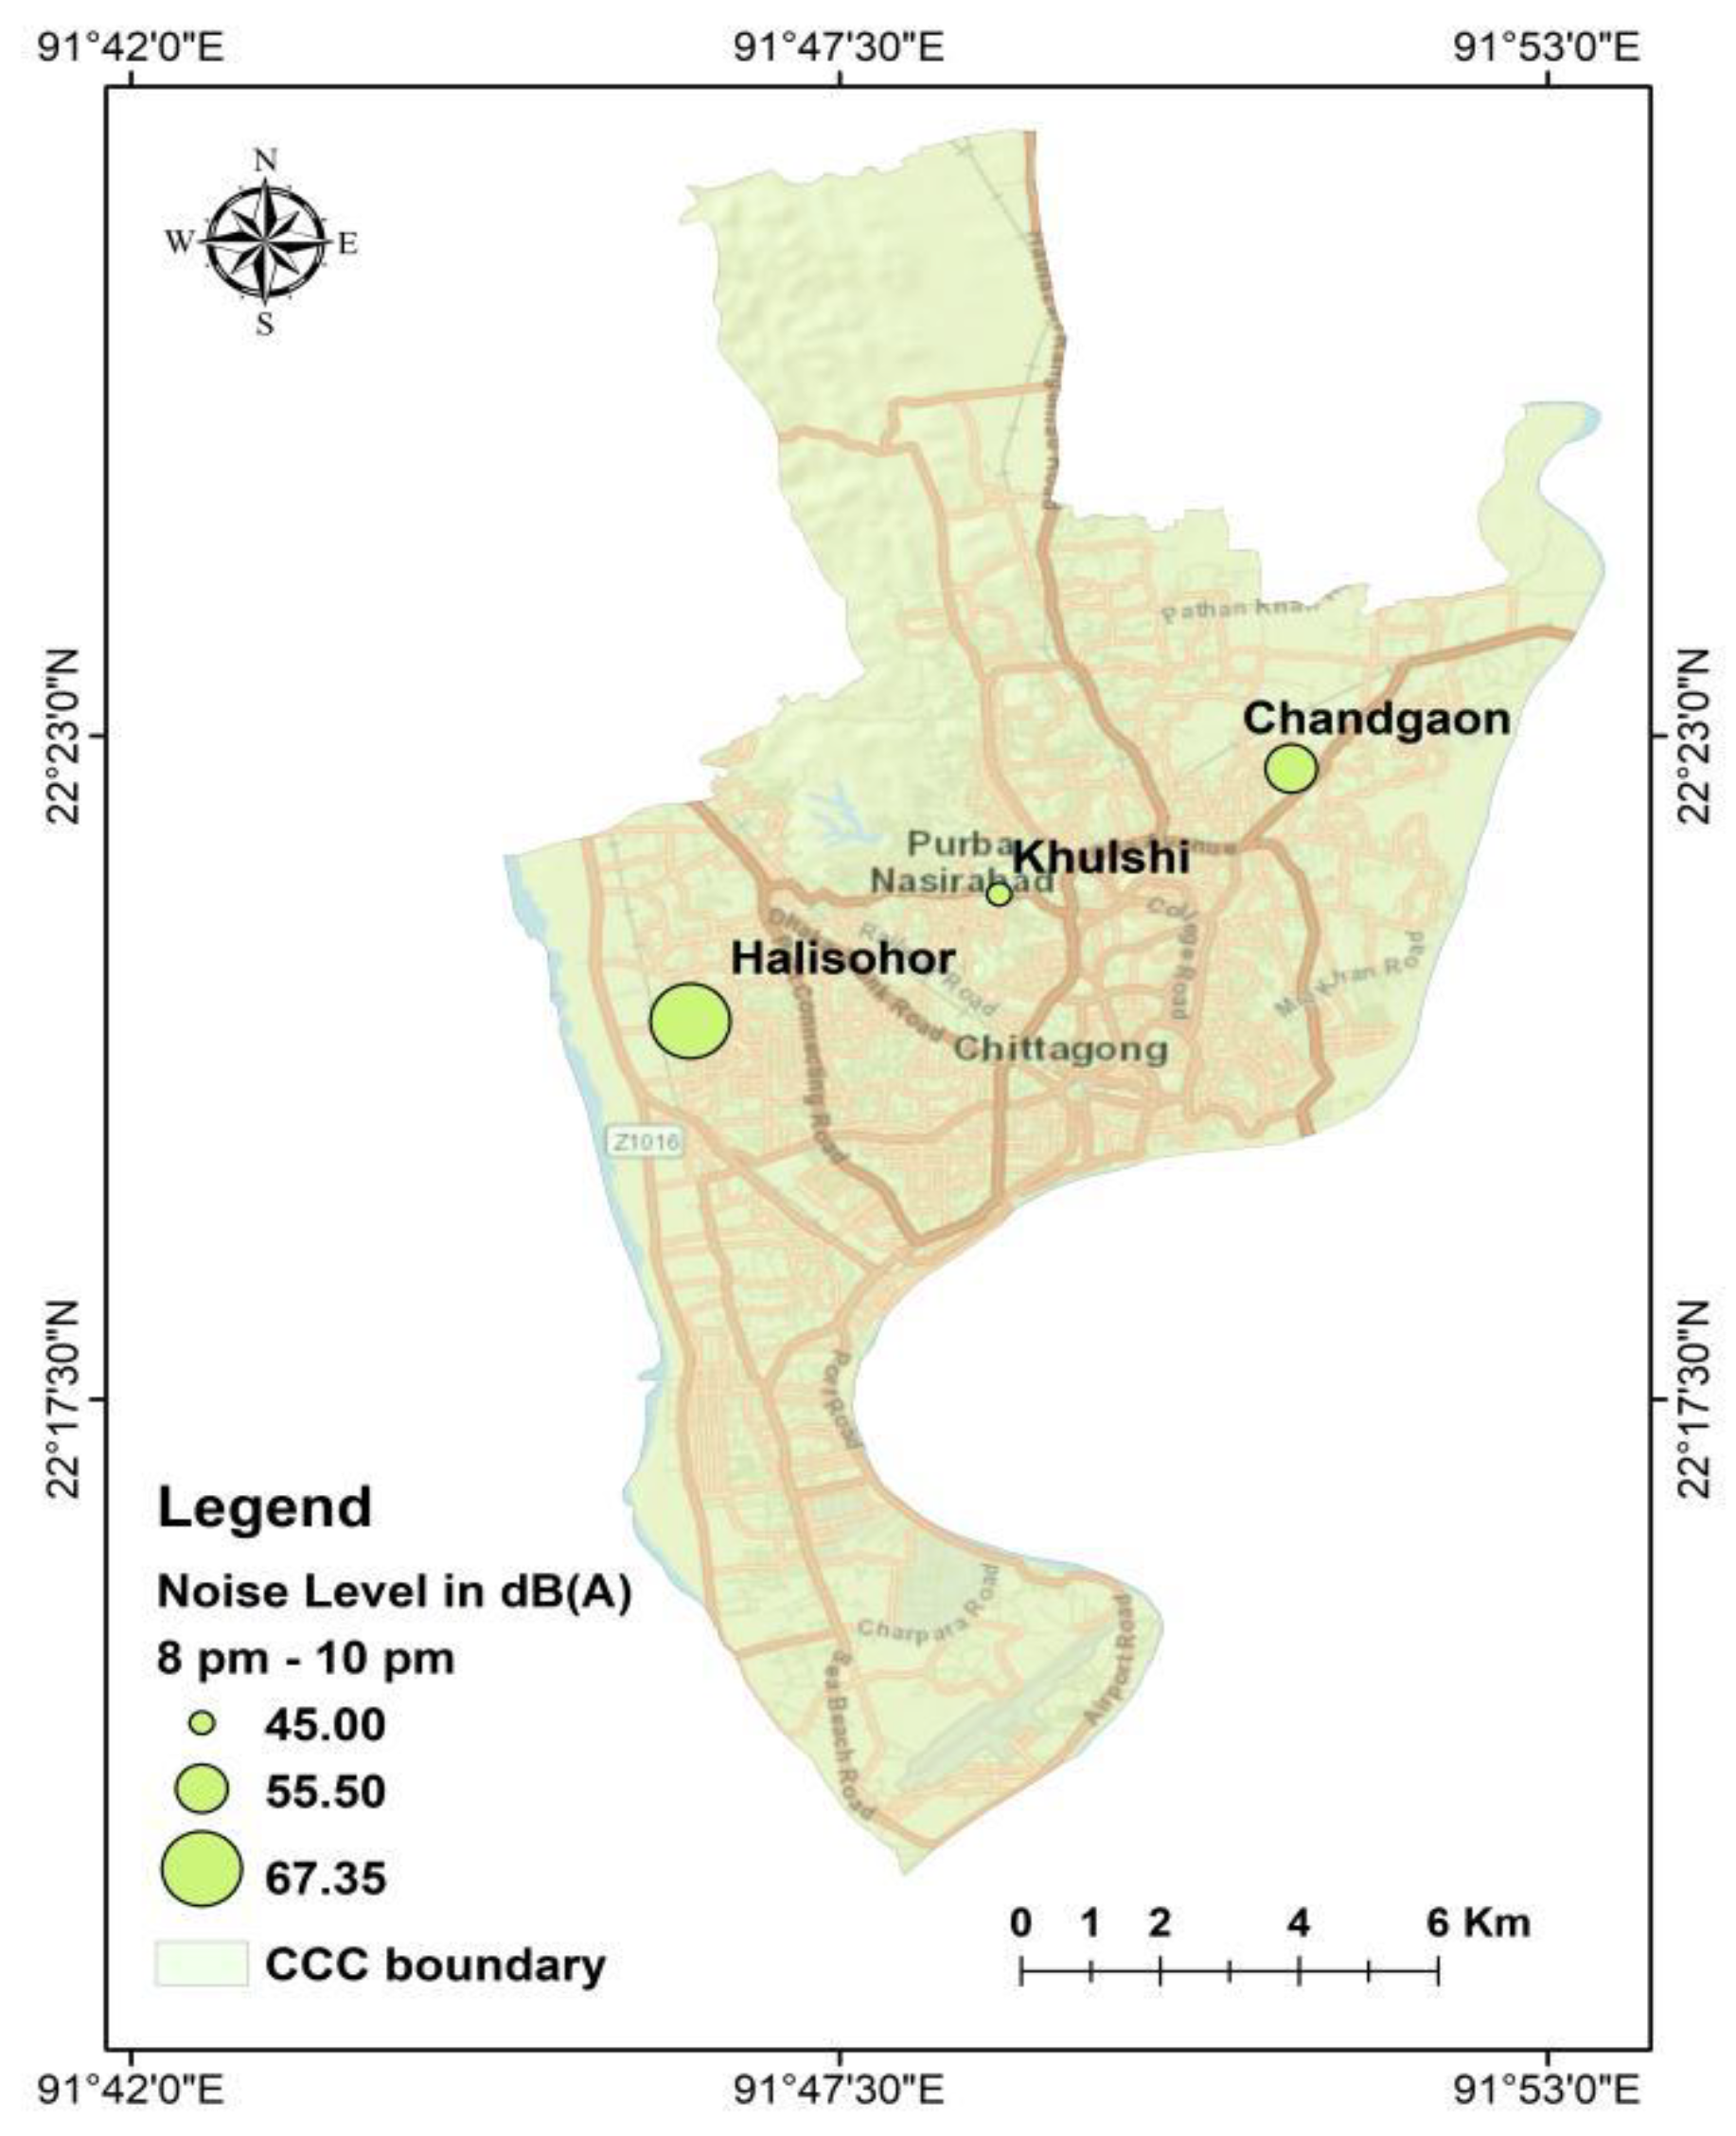
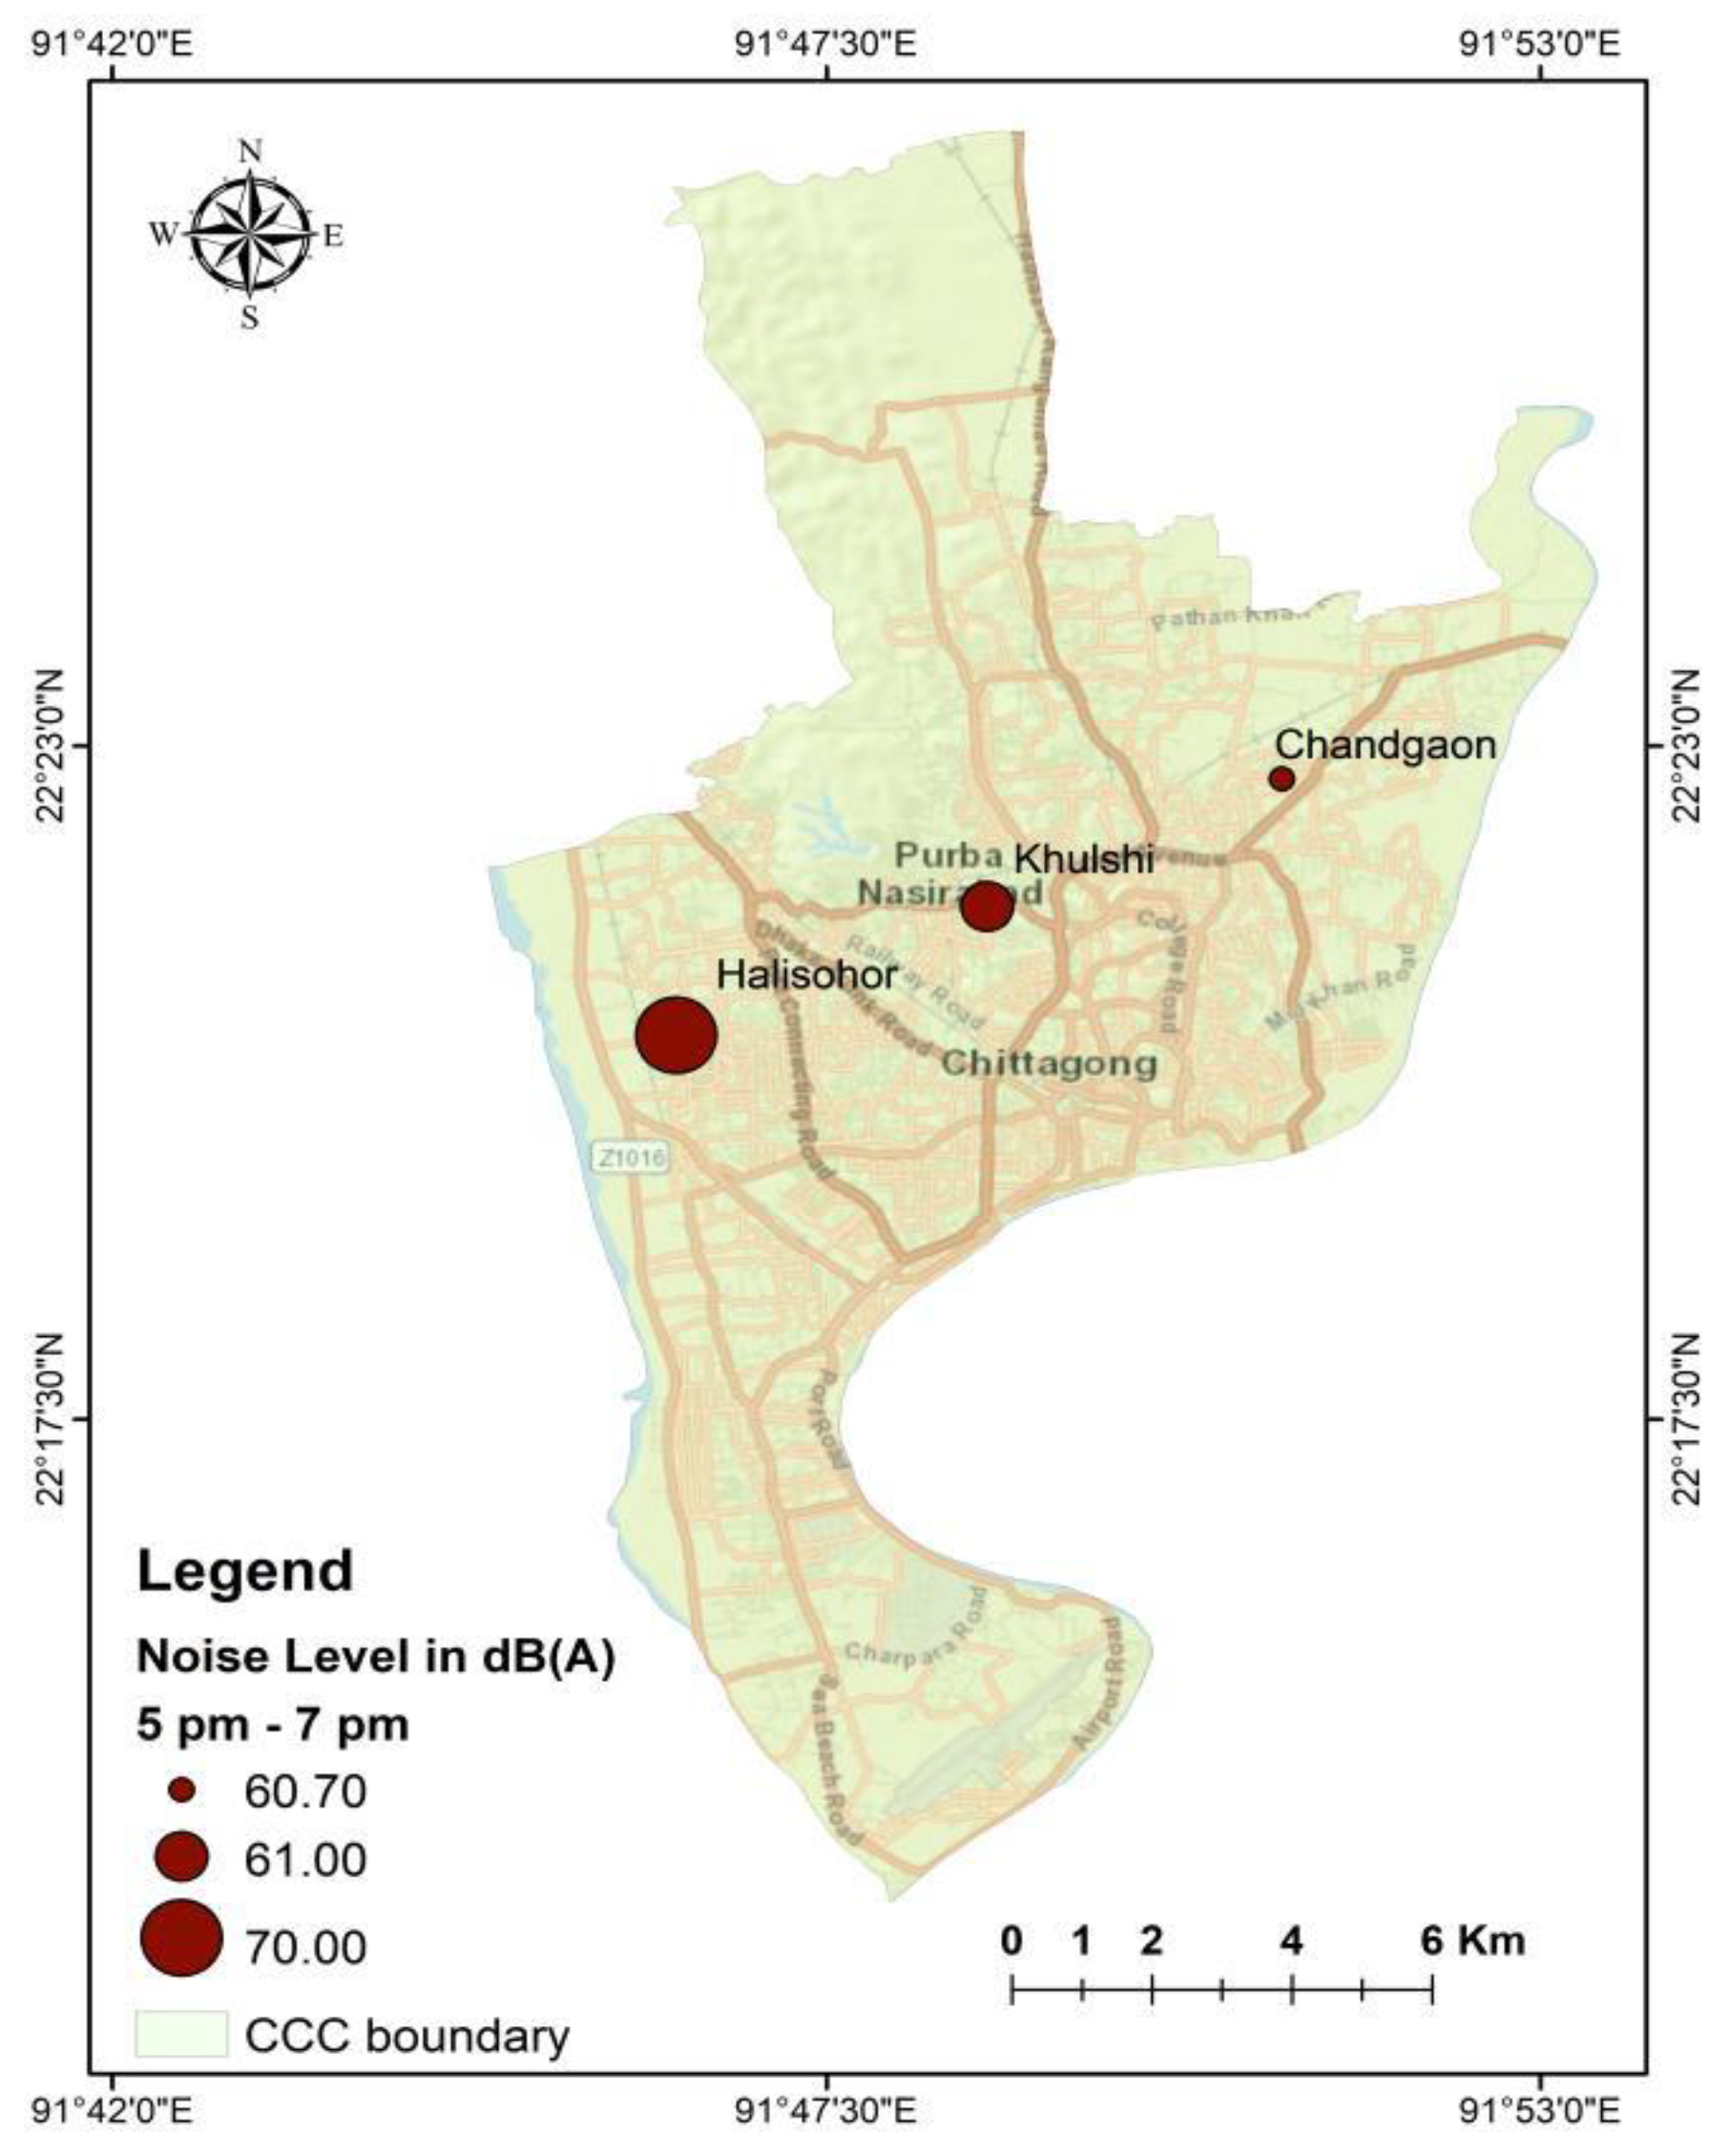
The maps illustrate residential noise readings in decibels dB(A) during working days in the study area in the evening (5 pm to 7 pm) and at night (8 pm to 10 pm). According to the map, the highest noise value at the Halisohor residential area is 72.65 dB(A) at 5 pm-7 pm. Between 5 and 7 pm, 58.50 dB(A) and 55.50 dB(A) are measured from Chandgaon and Khulshi. Again, the highest noise reading reported from Halisohor between 8 and 10 p.m. is 67.35 dB(A). Noise levels measured at Chandgaon and Khulshi were 55.50 dB(A) and 45.00 dB(A) respectively at the same time.
3.2. Residential Noise Level at Holiday
The maps (
Figure 7,
Figure 8,
Figure 9 and
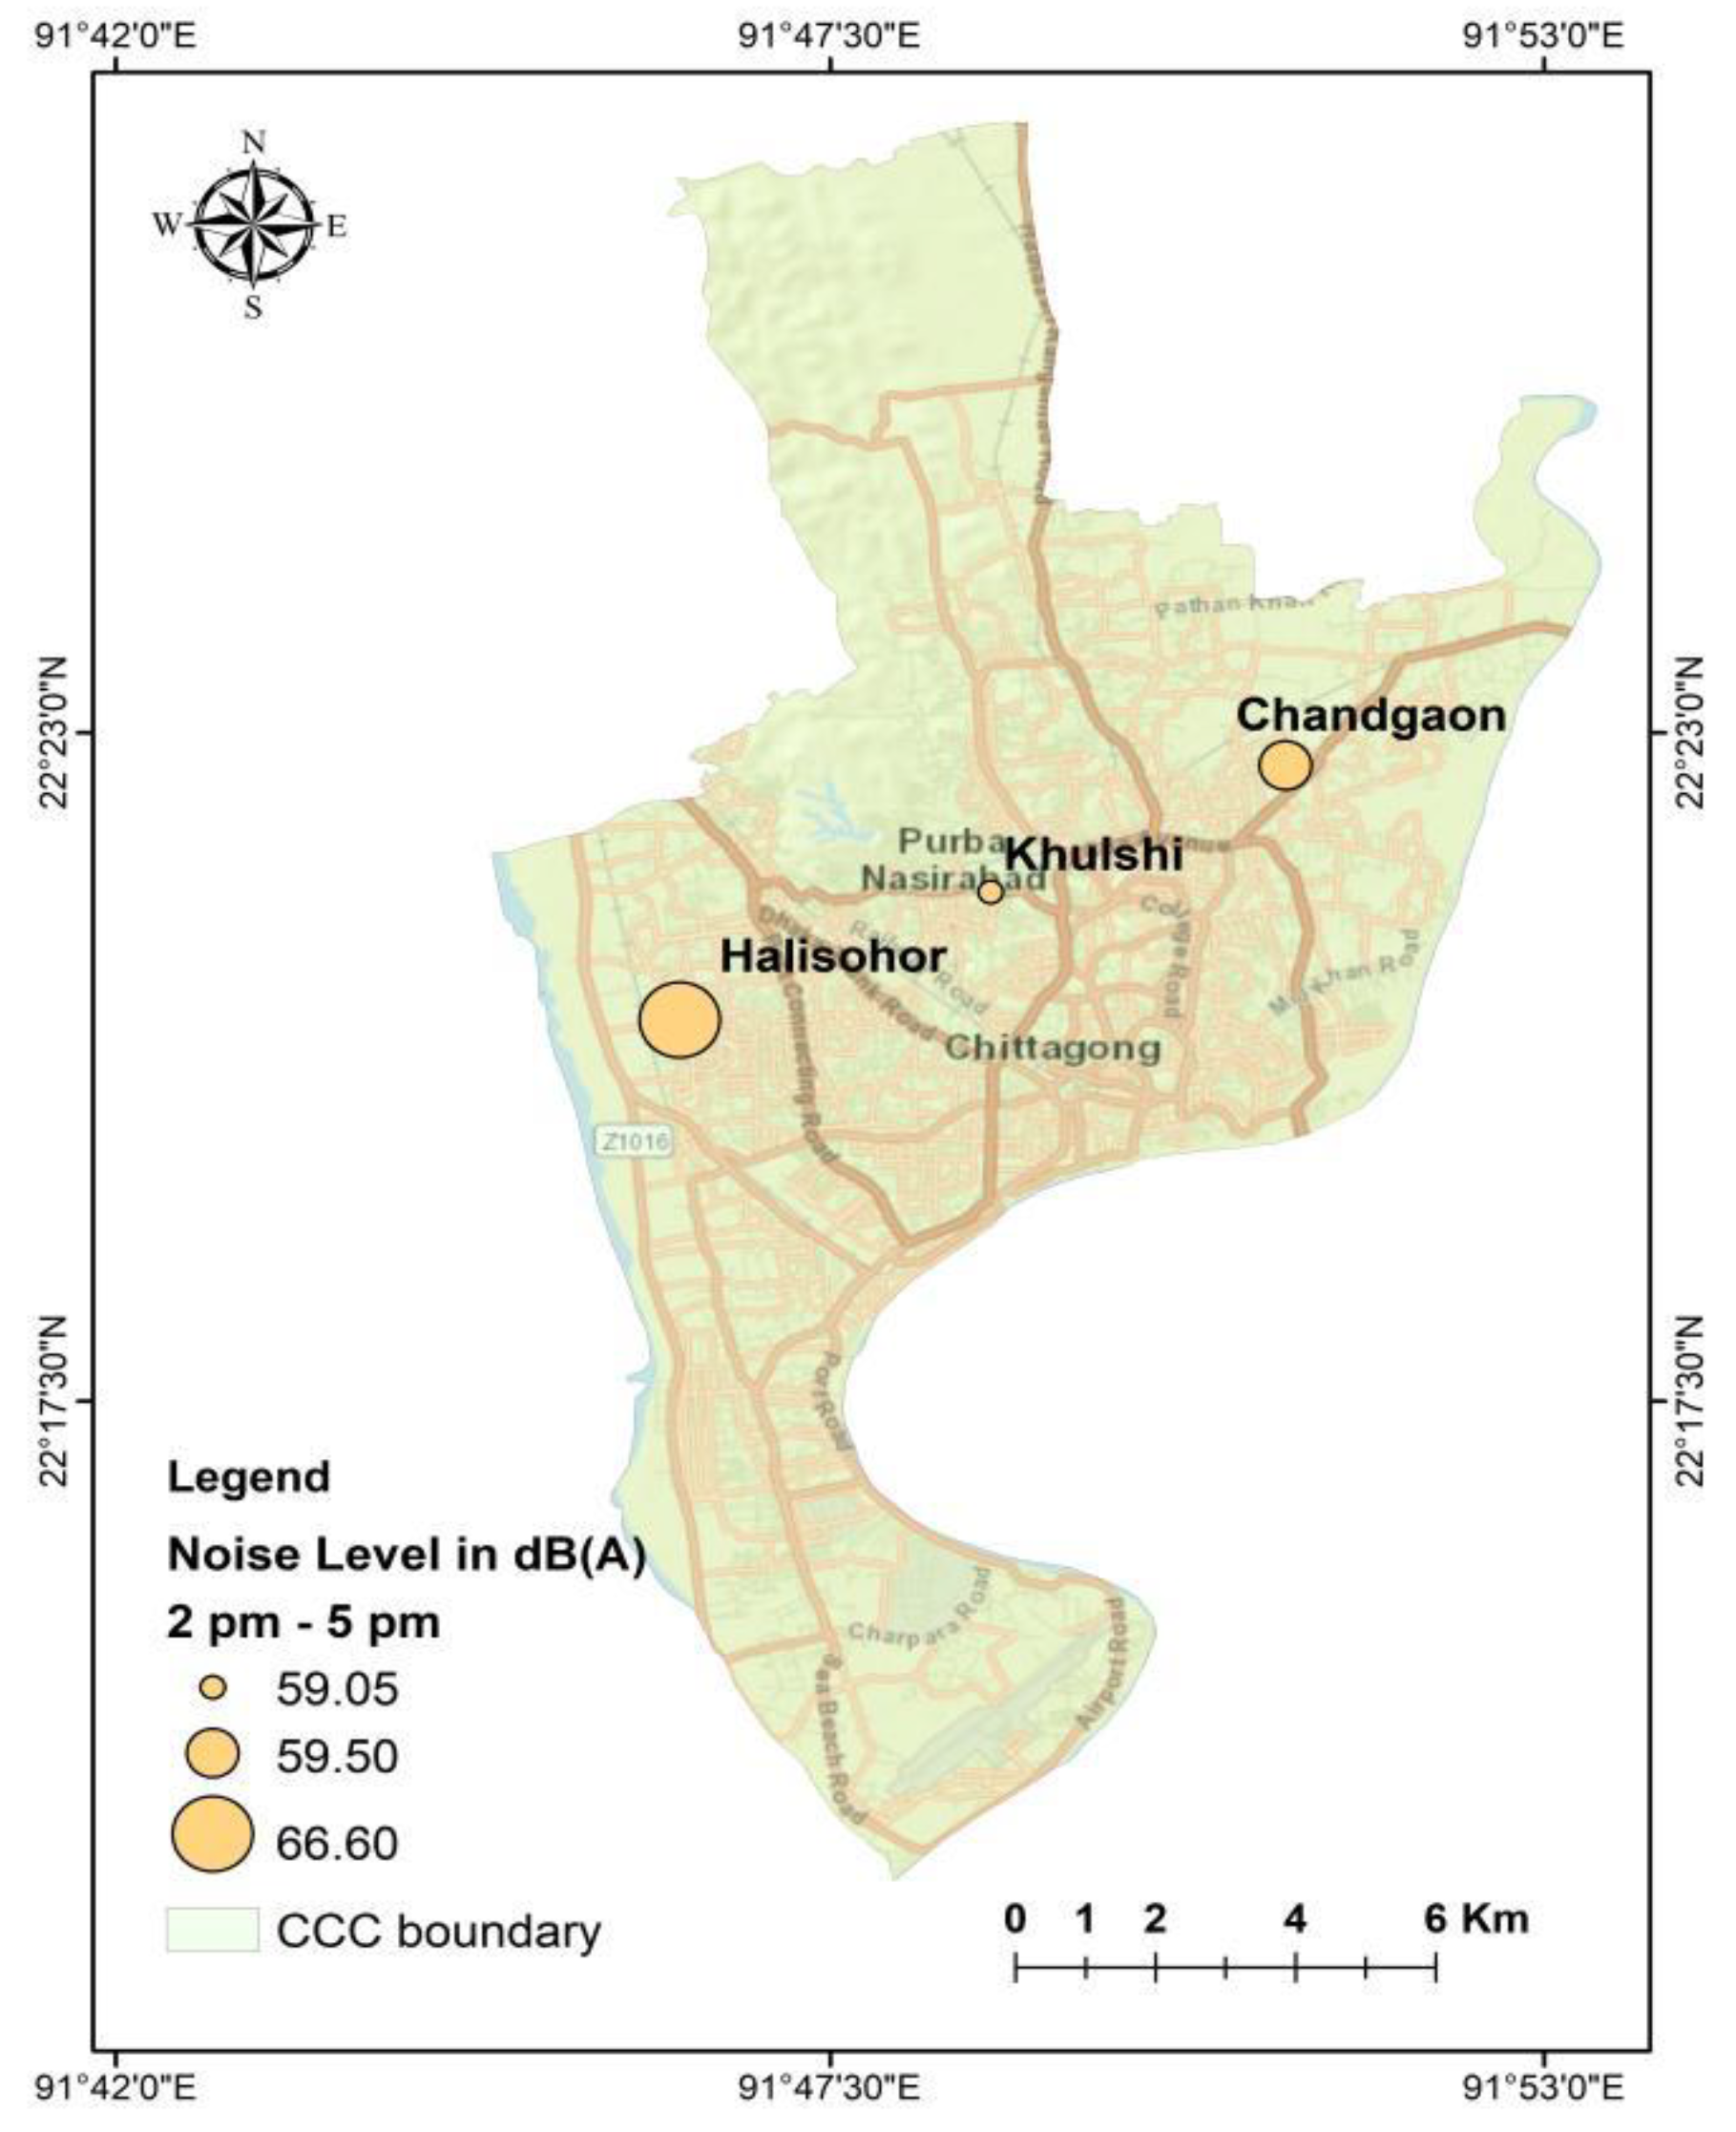
Figure 10) illustrates residential noise readings in decibels dB(A) during holidays in the study area in the morning (10 am to 12 pm) and at midday (2 pm to 5 pm). According to the map, the highest noise value at the Halisohor residential area is 66.60 dB(A) in 2 pm-5 pm. Between 2 pm and 5 pm, 59.50 dB(A) and 59.05 dB(A) are measured from Chandgaon and Khulshi. Again, Highest noise reading is measured from Halisohor at 10 am-12 pm is 64.60 dB(A). 58.30 dB(A) and 52.40 dB(A) noise measured from Khulshi and Chandgaon respectively.
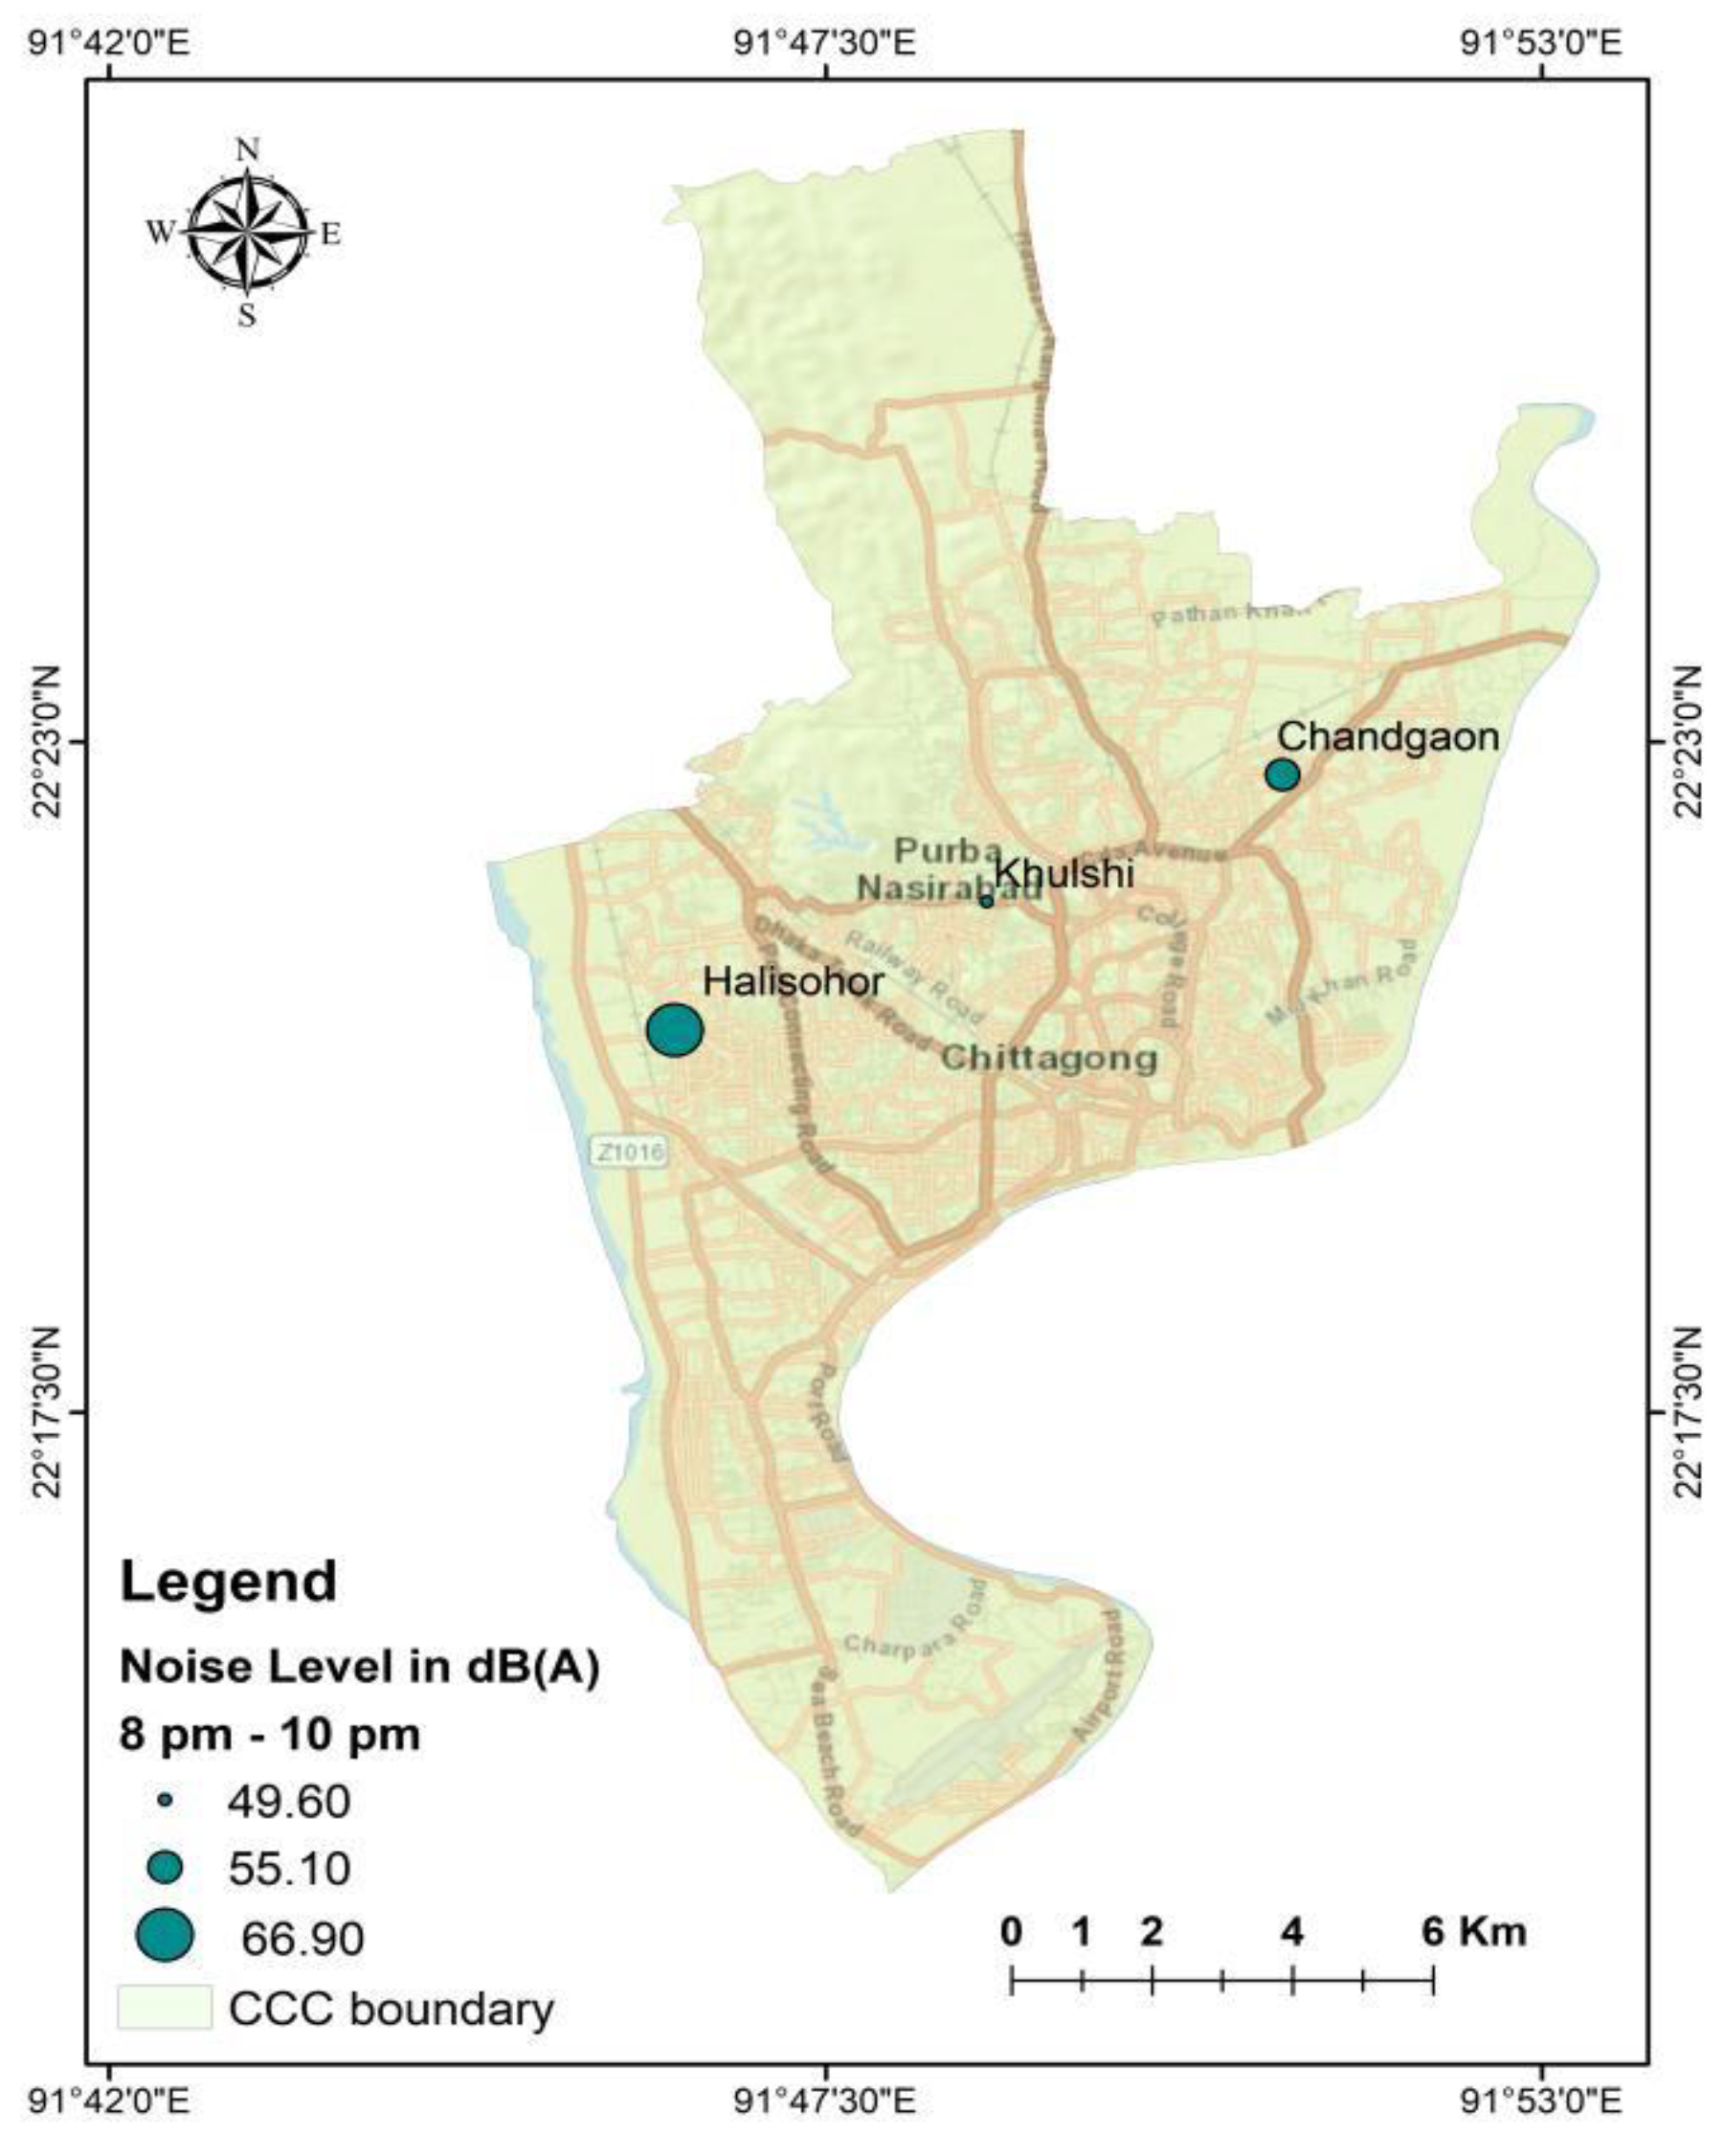
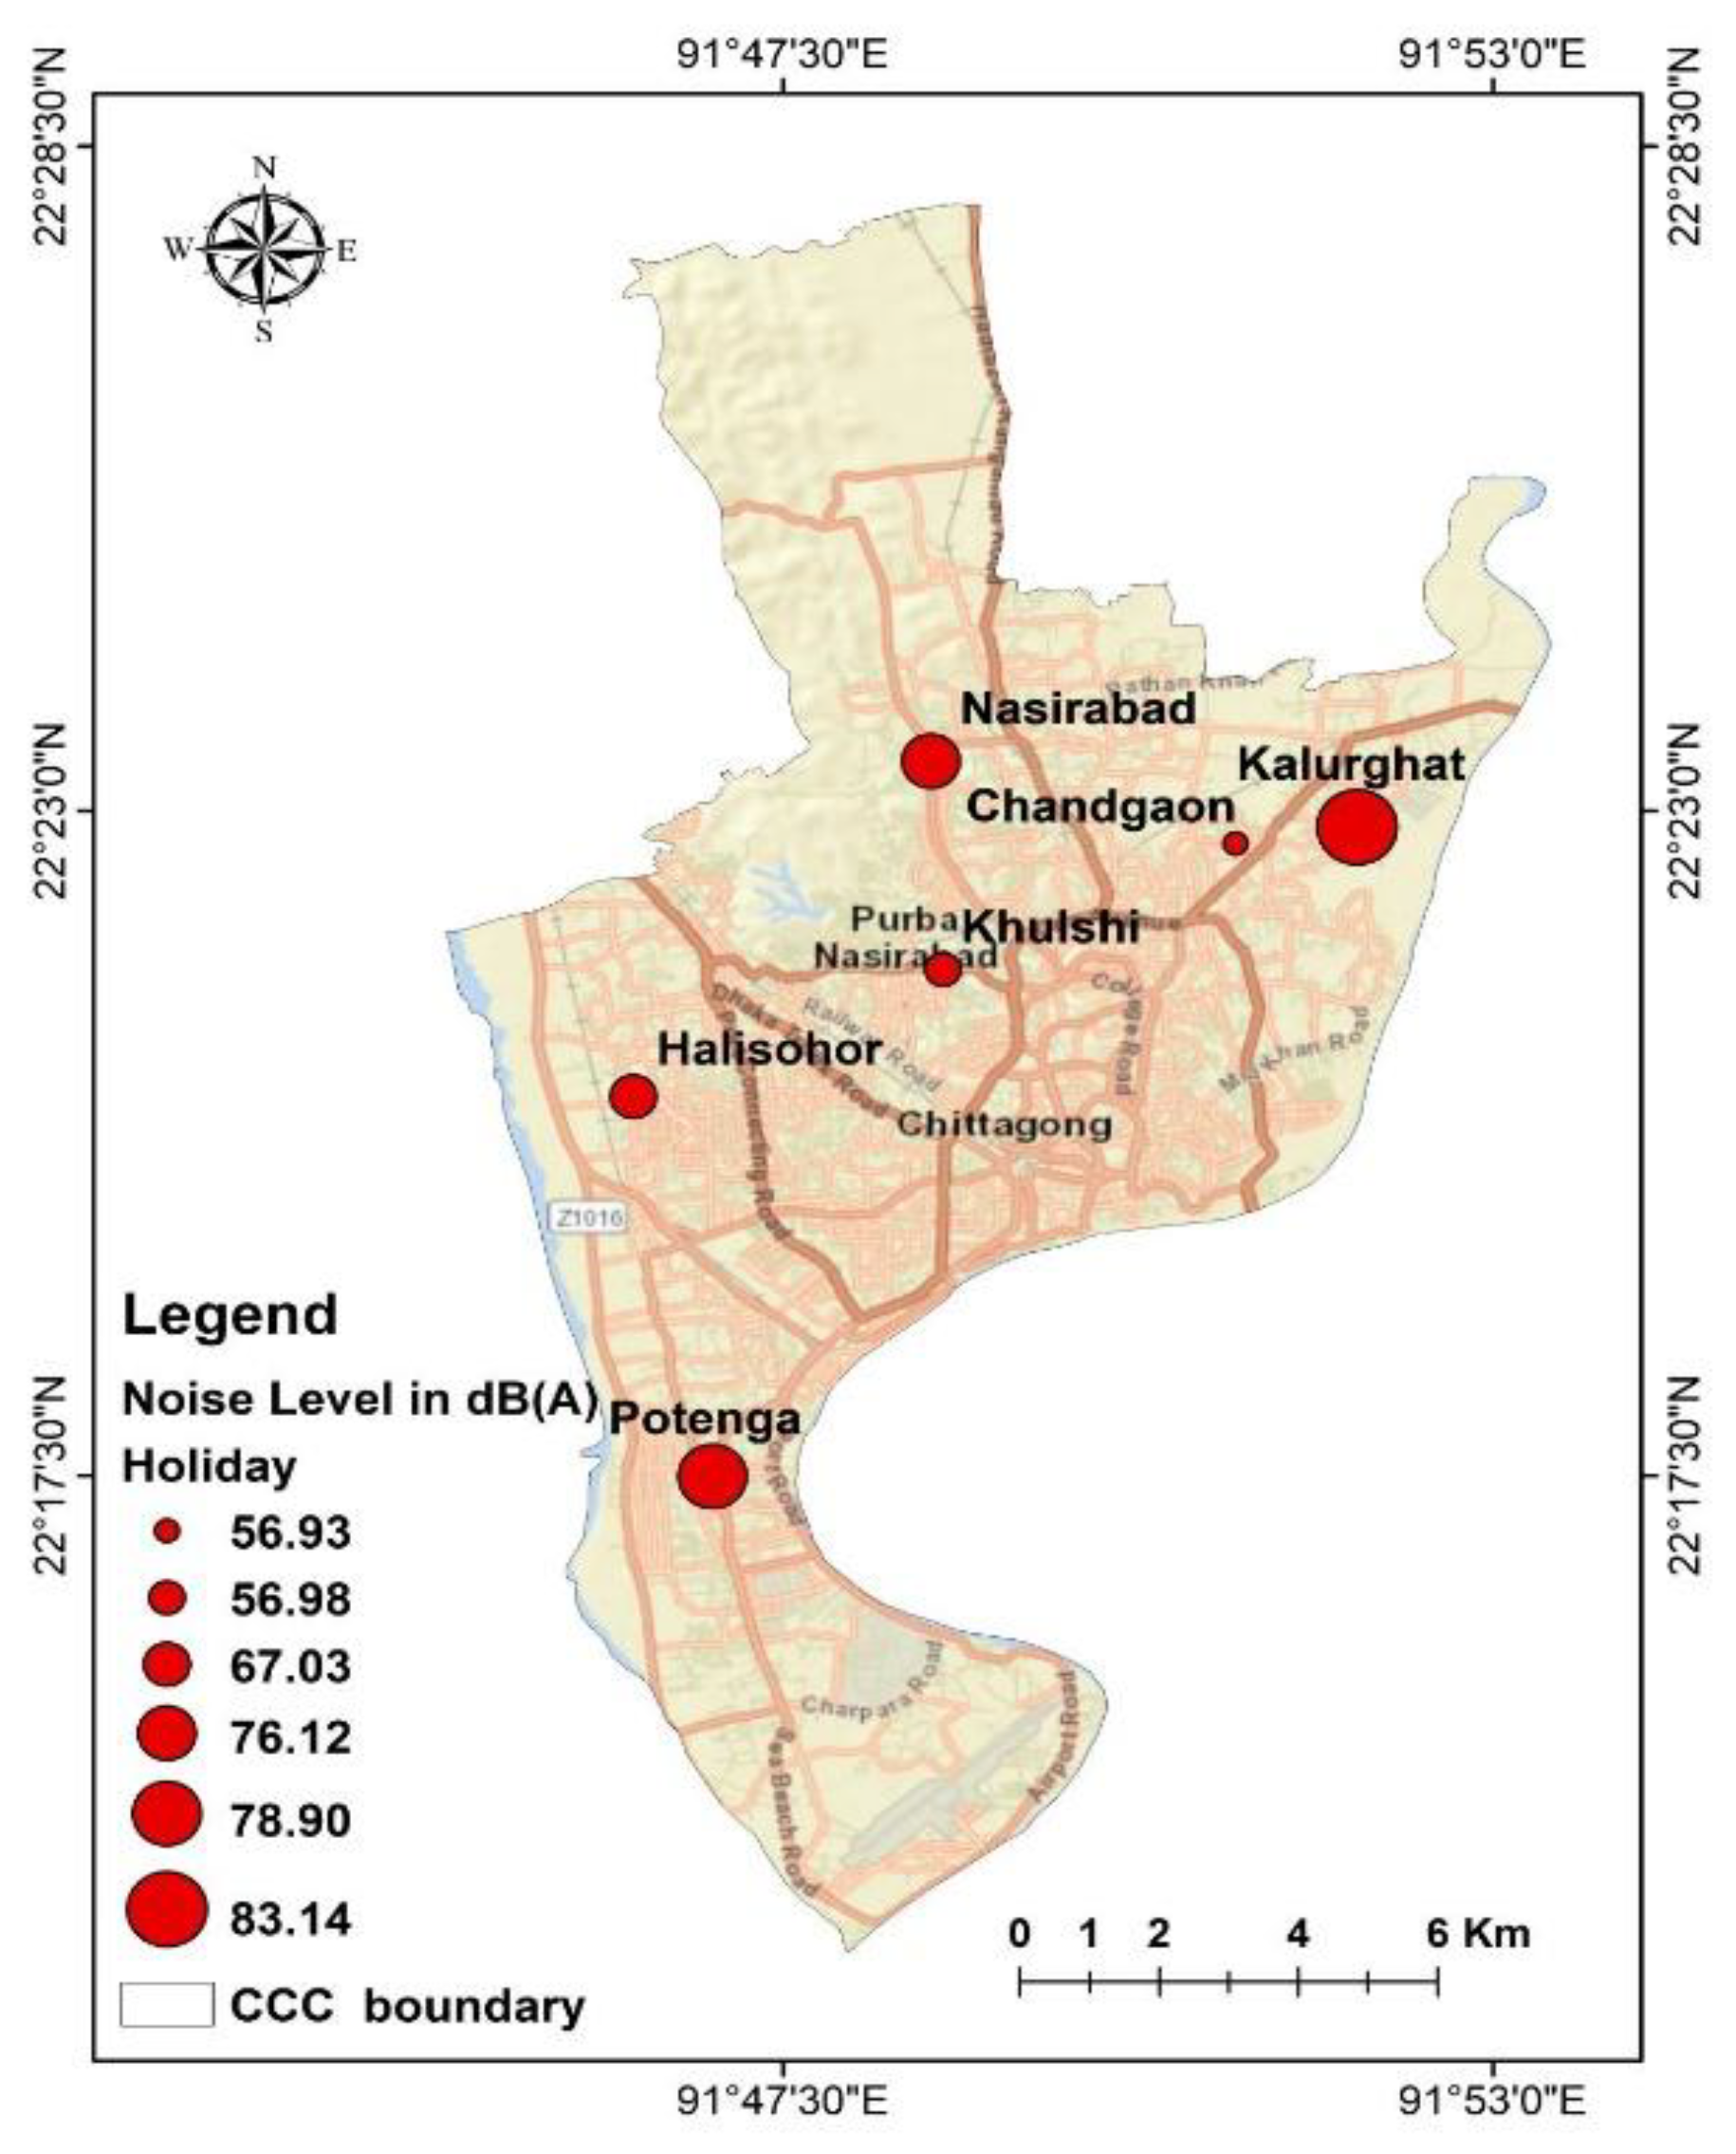
The maps also represent residential noise readings in decibels dB(A) in the evening (5 pm to 7 pm) and night time (8 pm to 10 pm) during holidays in the study area. From the data, the highest noise level is 70.00 dB(A) in 5 pm-7 pm at Halisohor residential area. 61.00 dB(A) and 60.70 dB(A) are measured between 5 pm and 7 pm at Khulshi and Chandgaon. On the other hand, Highest noise reading is measured from Halisohort at 8 pm- 10 pm is 66.90 dB(A). 55.10 dB(A) and 49.80 dB(A) noise measured from Chandgaon and Khulshi respectively. The noise level in Khulshi and Chandgaon is quite near to and lower than in Halisohor. Despite the fact that Halisohor is a residential area, researchers have observed that its structure is not well developed. Perhaps this is why the noise level in Halisohor is always higher than in the other two residential zones.
3.3. Industrial Noise Level at Working Day
The maps (
Figure 11,
Figure 12,
Figure 13 and
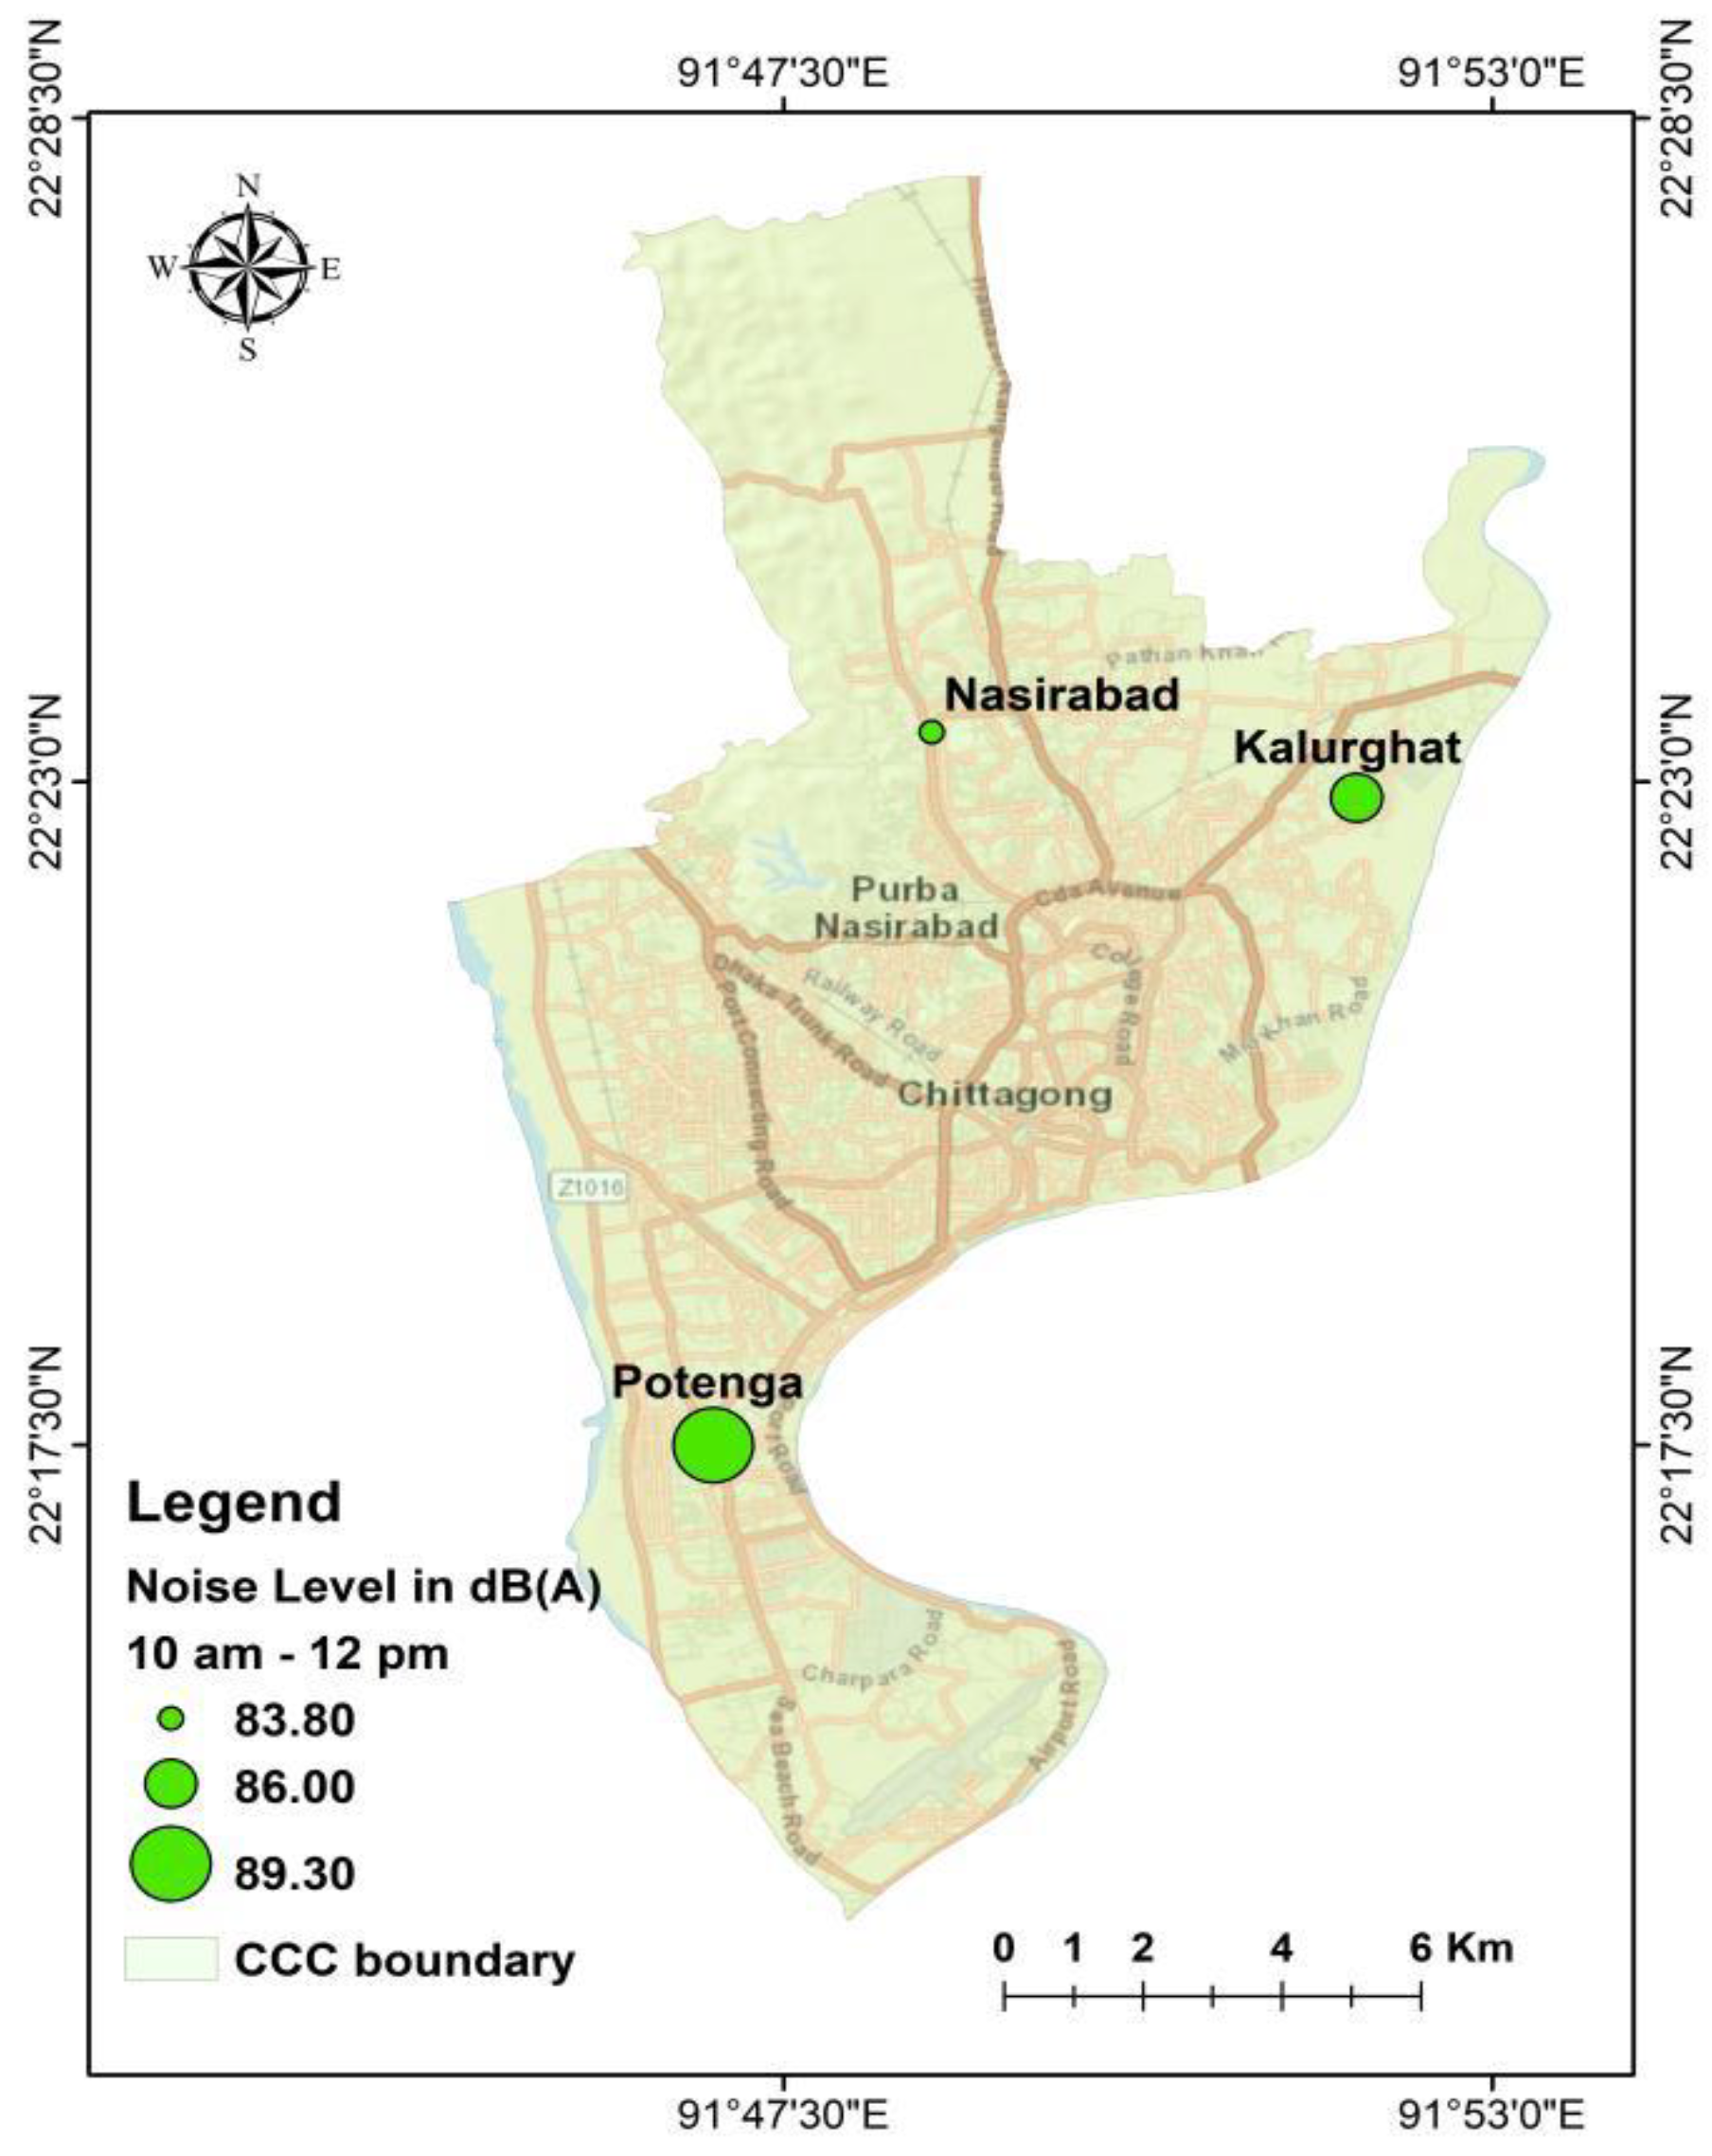
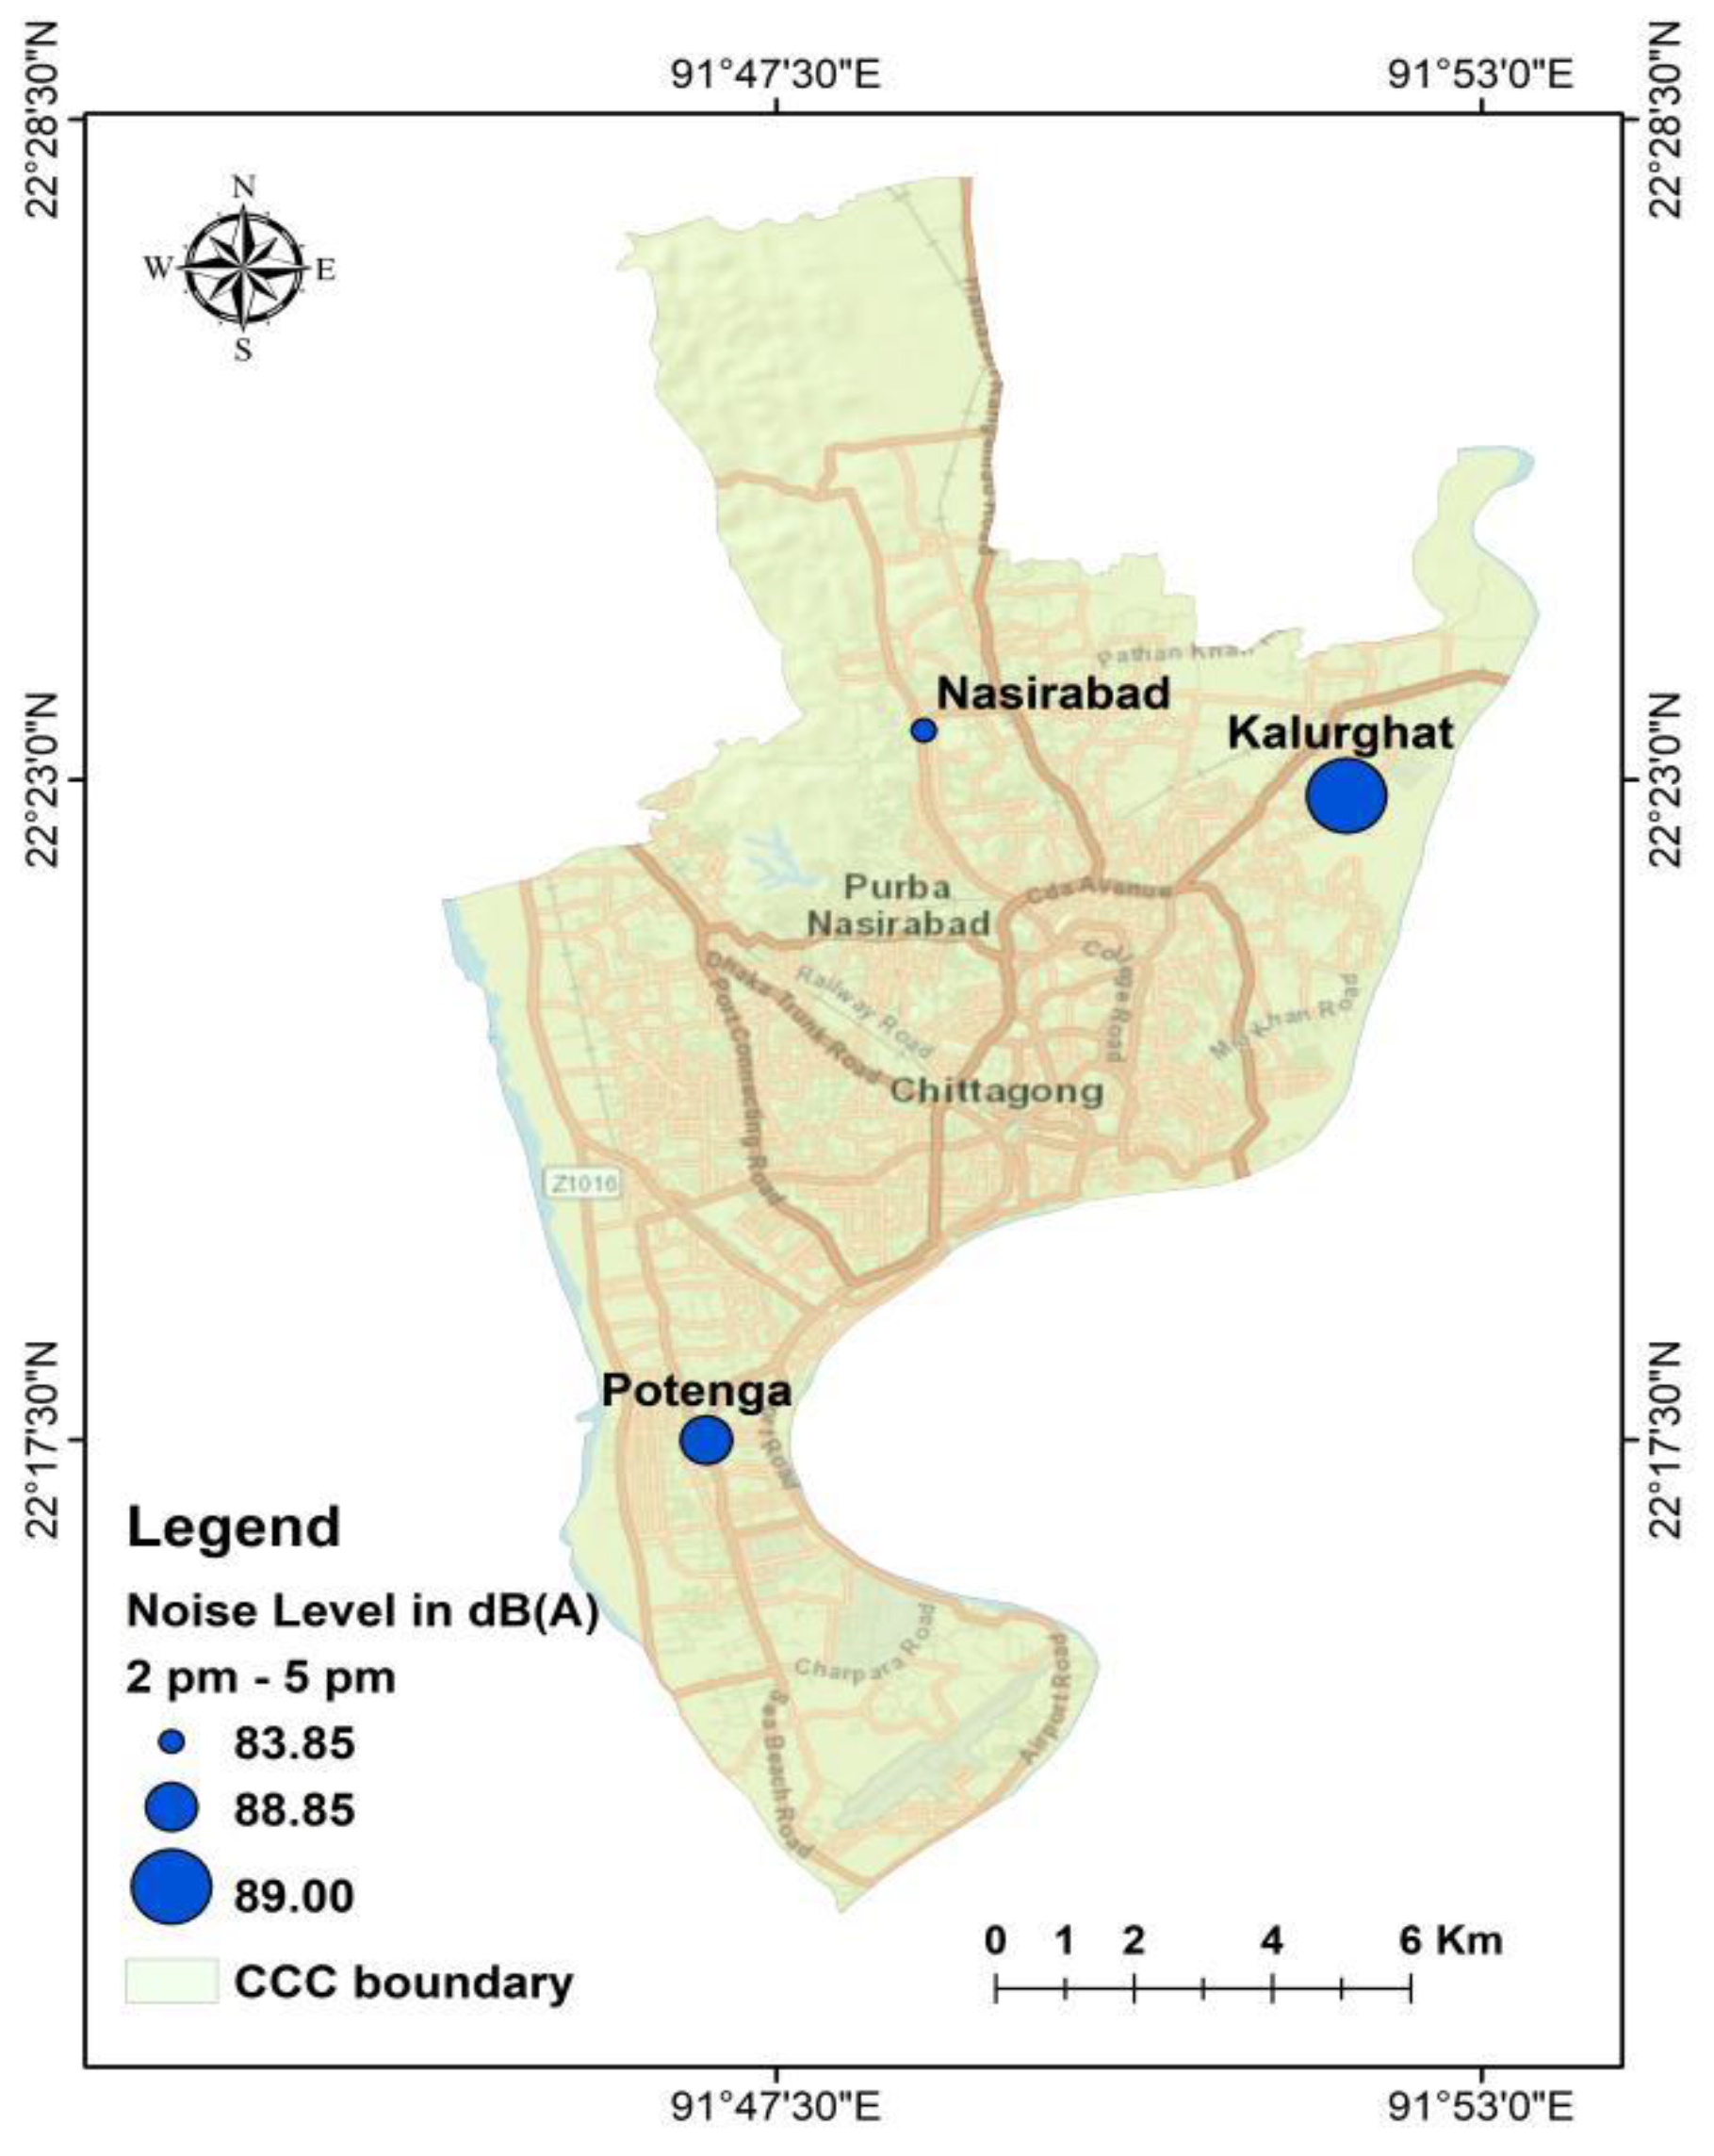
Figure 14) denote industrial noise readings in decibels dB(A) in the morning (10 a.m. to 12 p.m.) and midday (2 p.m. to 5 p.m.) during working days in the study area. A sound level meter is used to measure noise levels in the industrial areas of Kalurghat, Nasiranad, and Patenga. According to the map, the peak noise level is 89.30 dB(A) between 10 a.m. and 12 p.m. at the Patenga industrial sector. 86.00 dB(A) and 83.80 dB(A) are measured between 10 am and 12 pm from Kalurghat and Nasirabad. On the other hand, Highest noise reading is measured from Kalurghat at 2 pm- 5 pm is 89.00 dB(A). 88.85 dB(A) and 83.85 dB(A) noise measured from Patenga and Nasirabad respectively.It is evident that the noise levels in Kalurghat and Patenga are nearly identical, and both of these locations are concentrated with heavy industries. The noise level in Nasirabad is significantly lower than in the other two areas, however the serious issue is that it exceeds the WHO (65 dB) and Bangladesh (75 dB) standards.
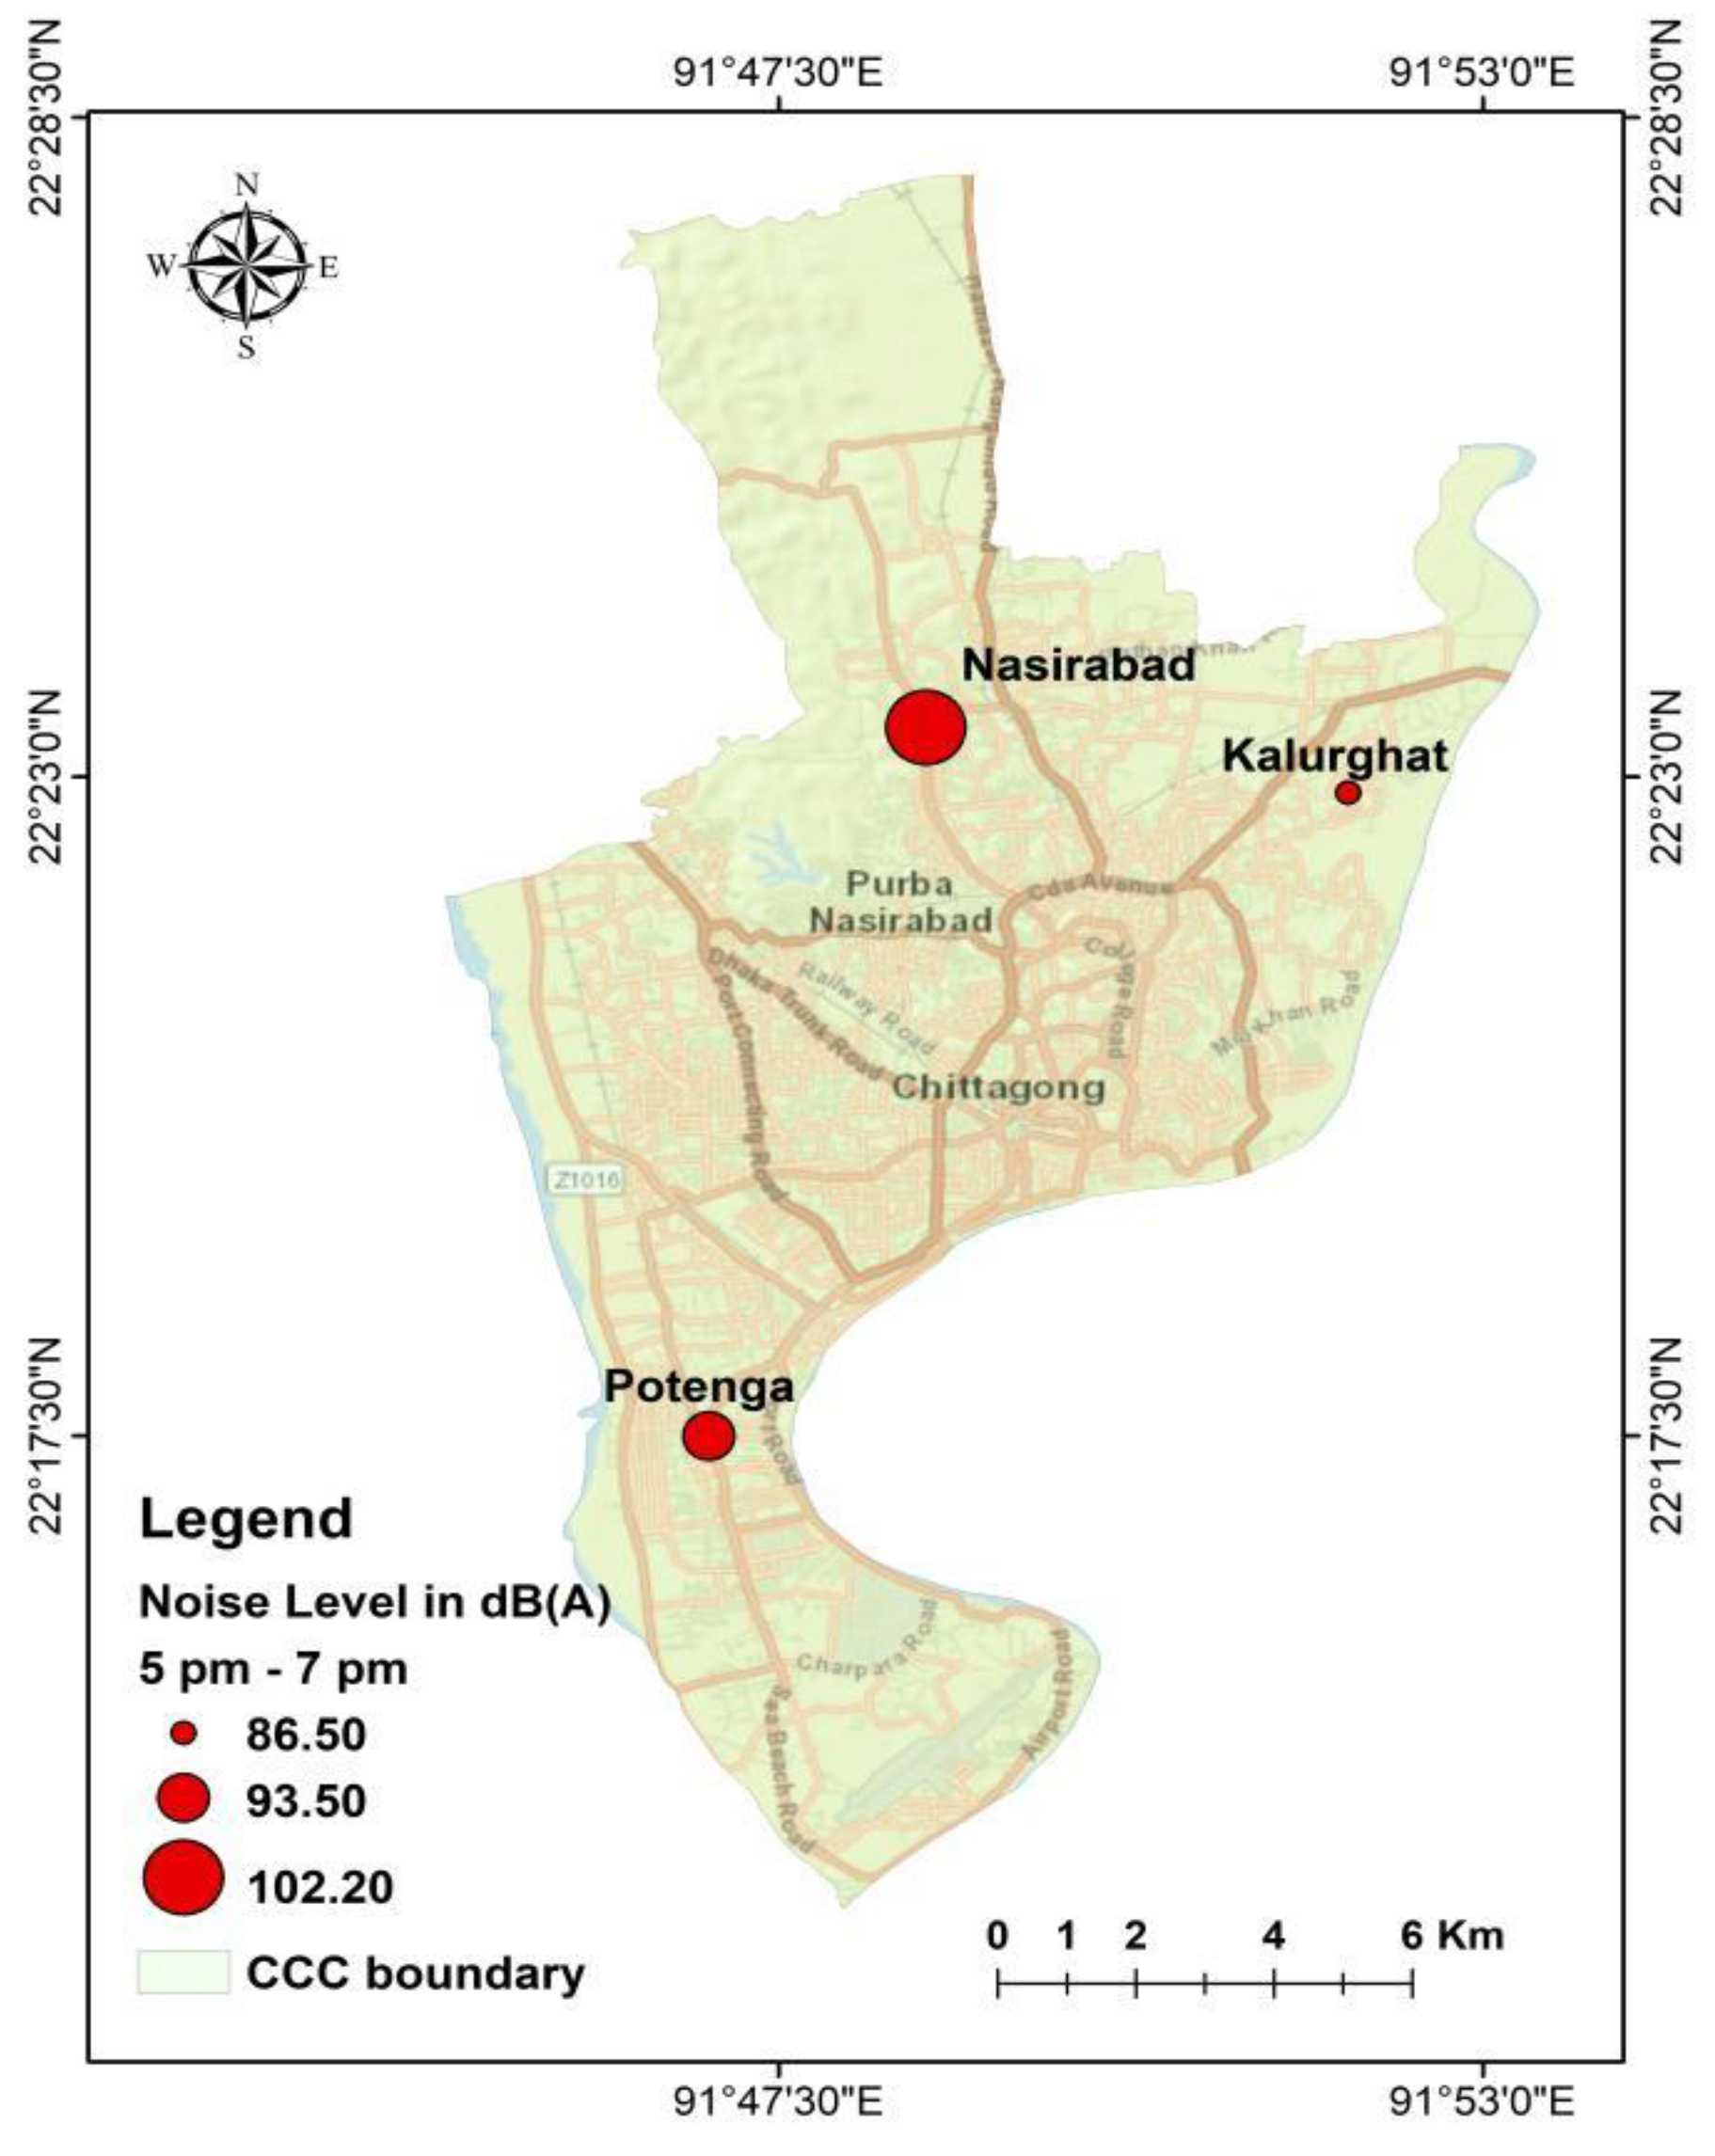
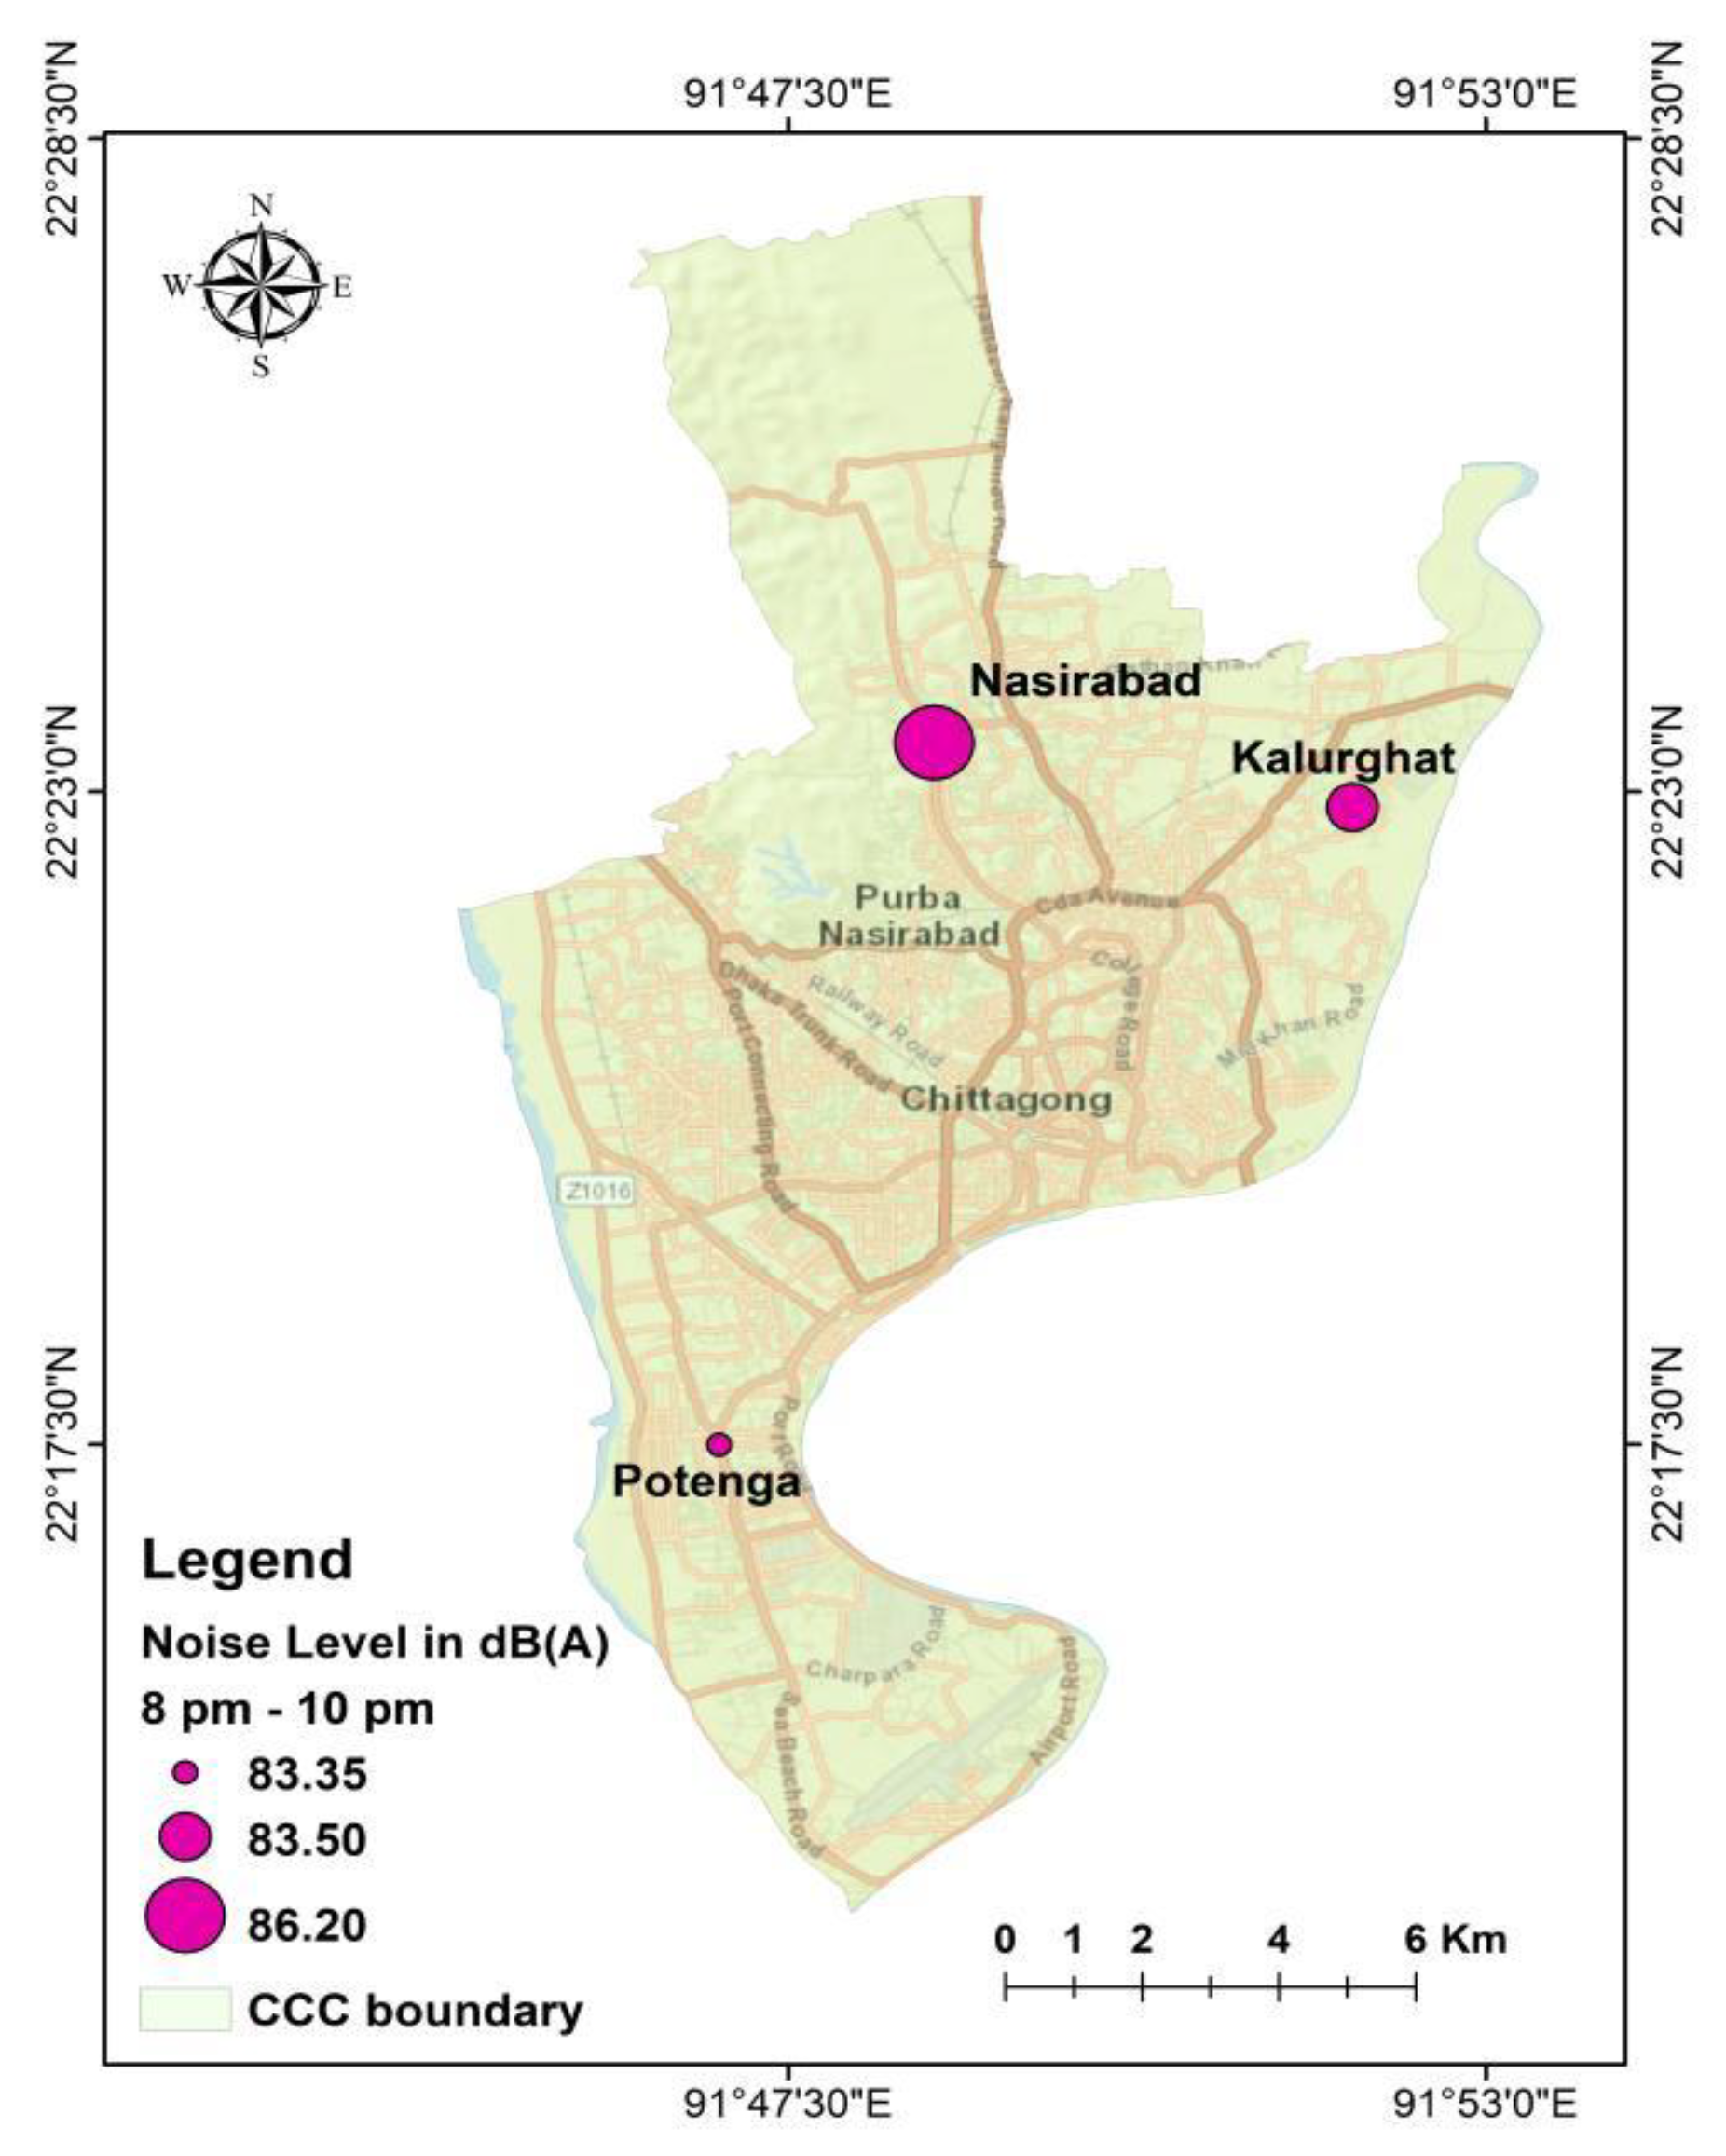
The maps also reflect industrial noise readings in decibels dB(A) during working days in the study region in the evening (5 pm to 7 pm) and at night (8 pm to 10 pm). According to the map, the highest noise value at the Nasirabad industrial area is 102.20 dB(A) between 5 and 7 pm. Between 5 and 7 pm, 93.50 dB(A) and 86.50 dB(A) are measured from Patenga and Kalurghat. The highest noise reading reported from Nasirabad between 8 and 10 p.m. is 86.20 dB(A). Noise levels measured at Kalurghat and Patenga were 83.50 dB(A) and 83.35 dB(A), respectively. Nasirabad is a densely populated and industrial area. There are numerous educational institutions and businesses located here. All of this results in greater noise readings throughout the evening (5 p.m.-7 p.m.) and night (8 p.m.-10 p.m.) times than the other two locations.
3.4. Industrial Noise Level at Holiday
The maps (
Figure 15,
Figure 16,
Figure 17 and
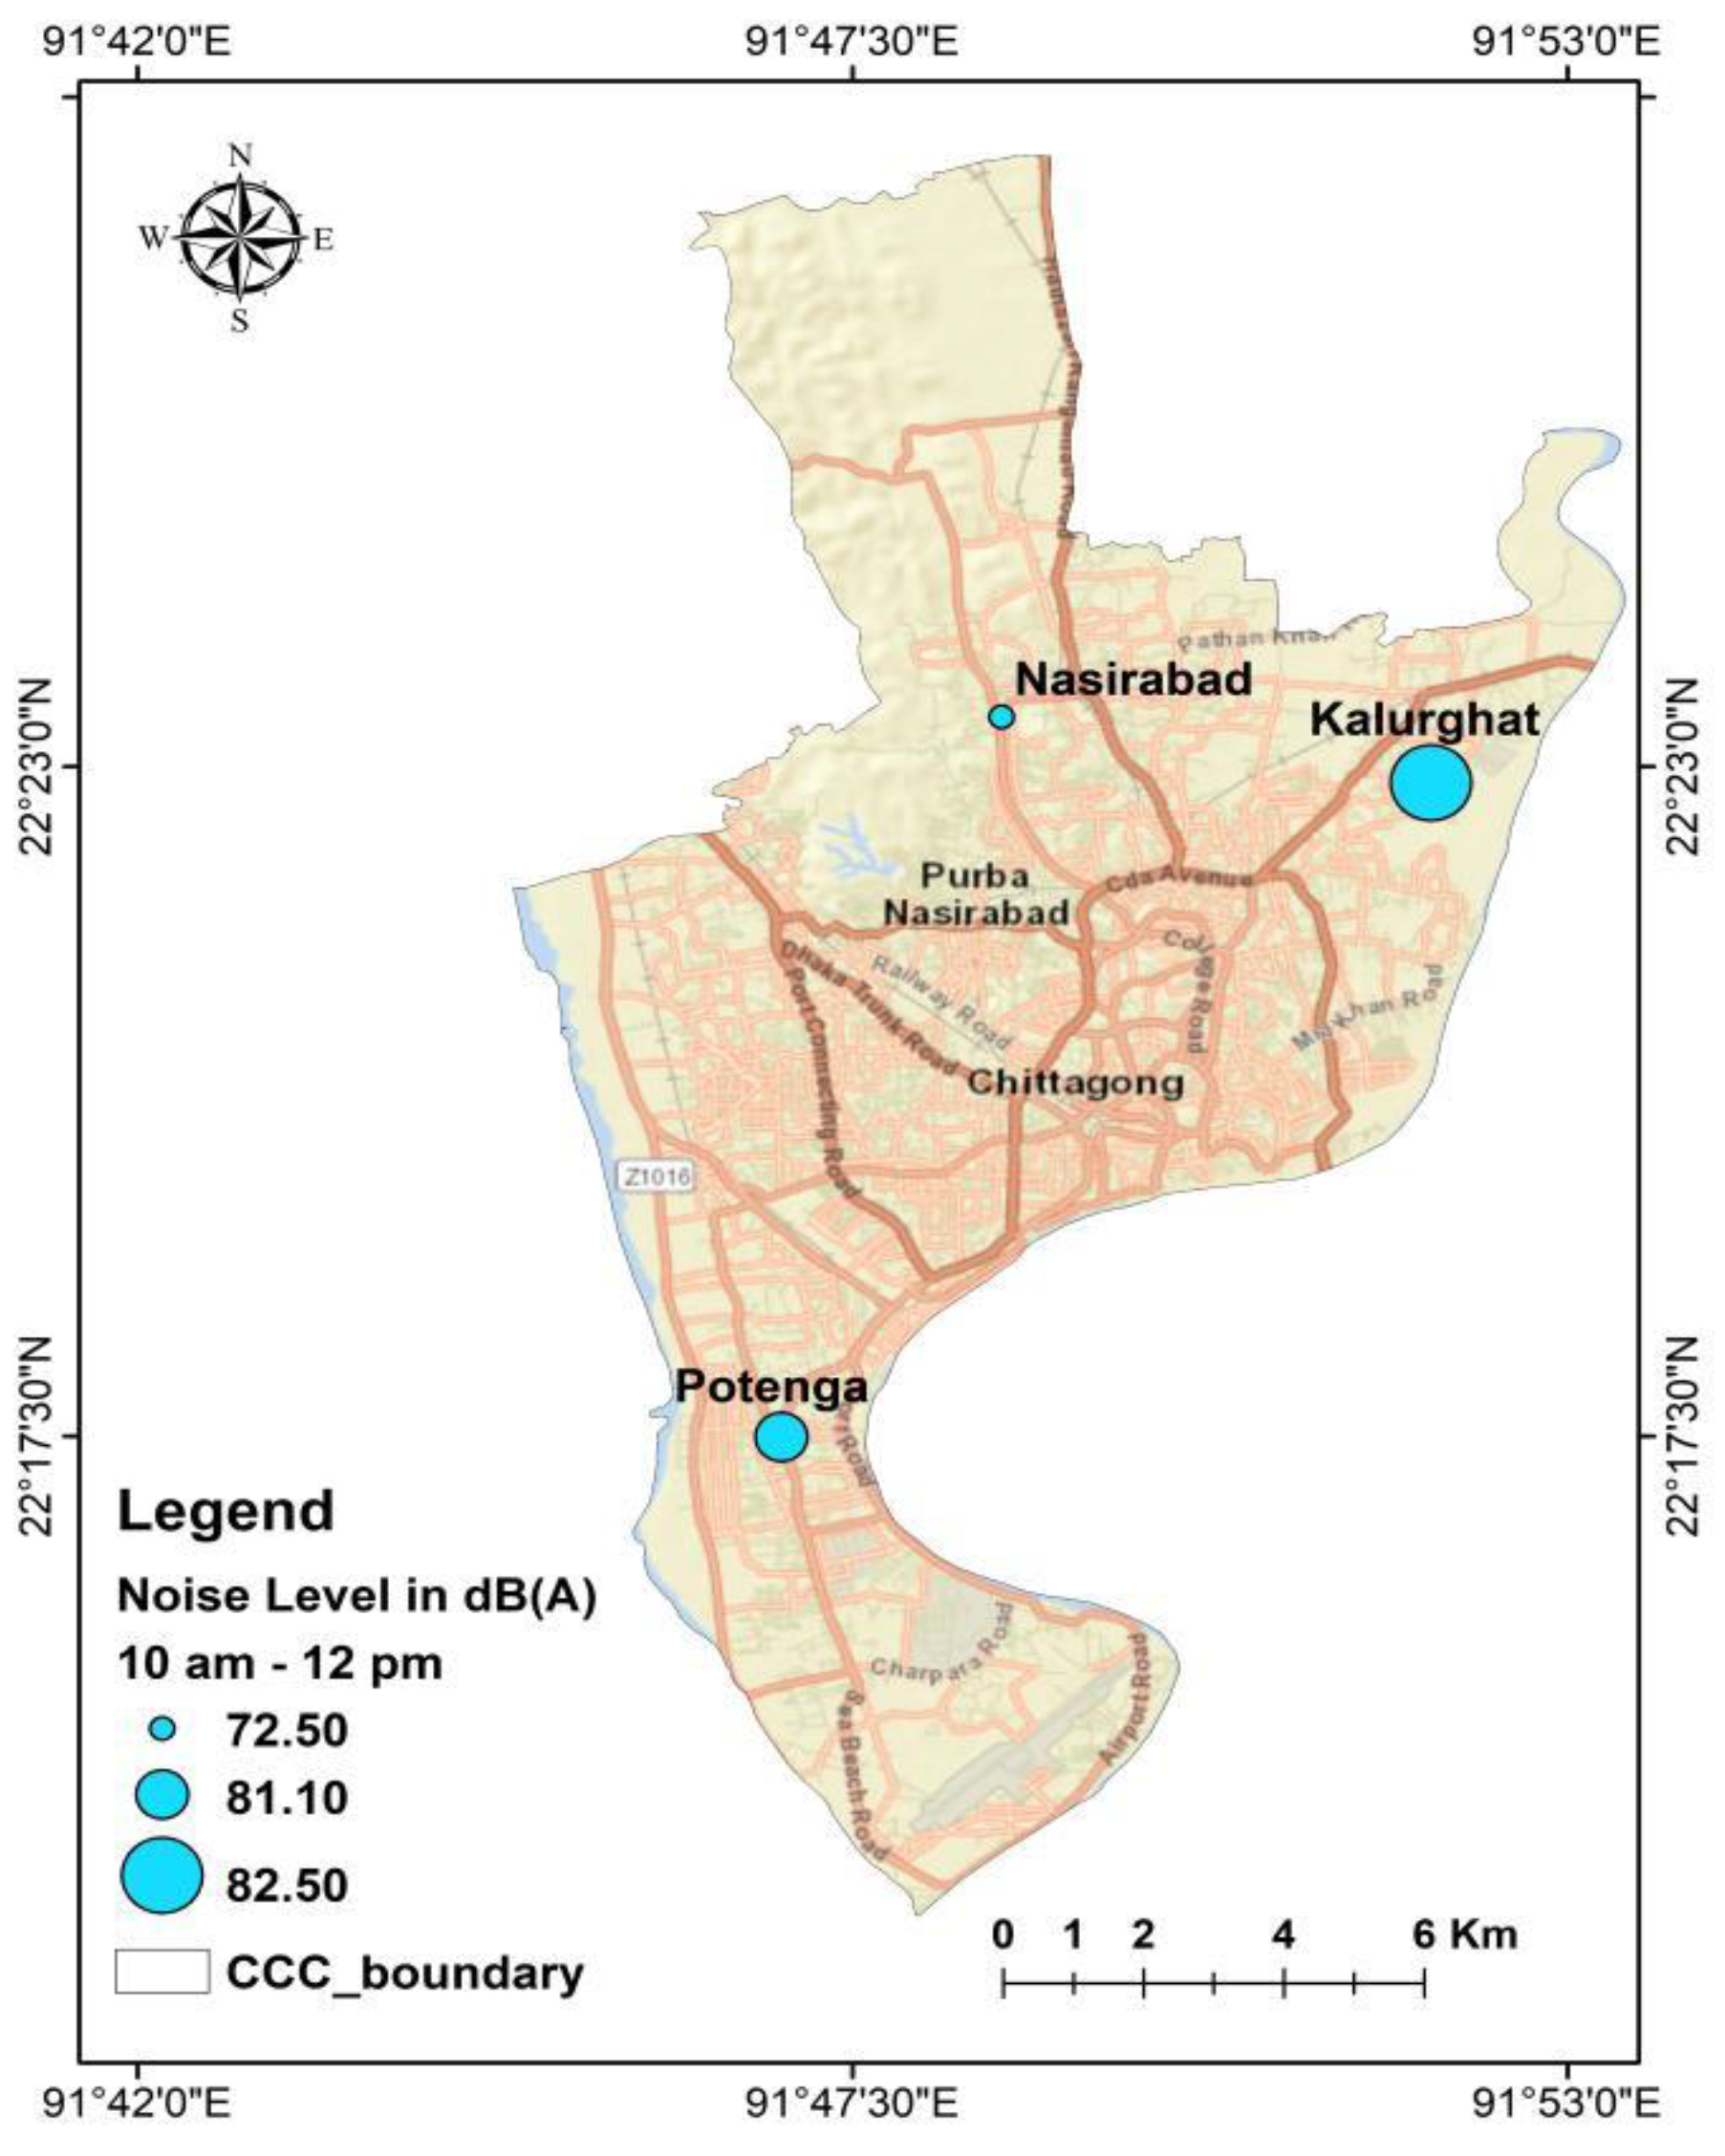
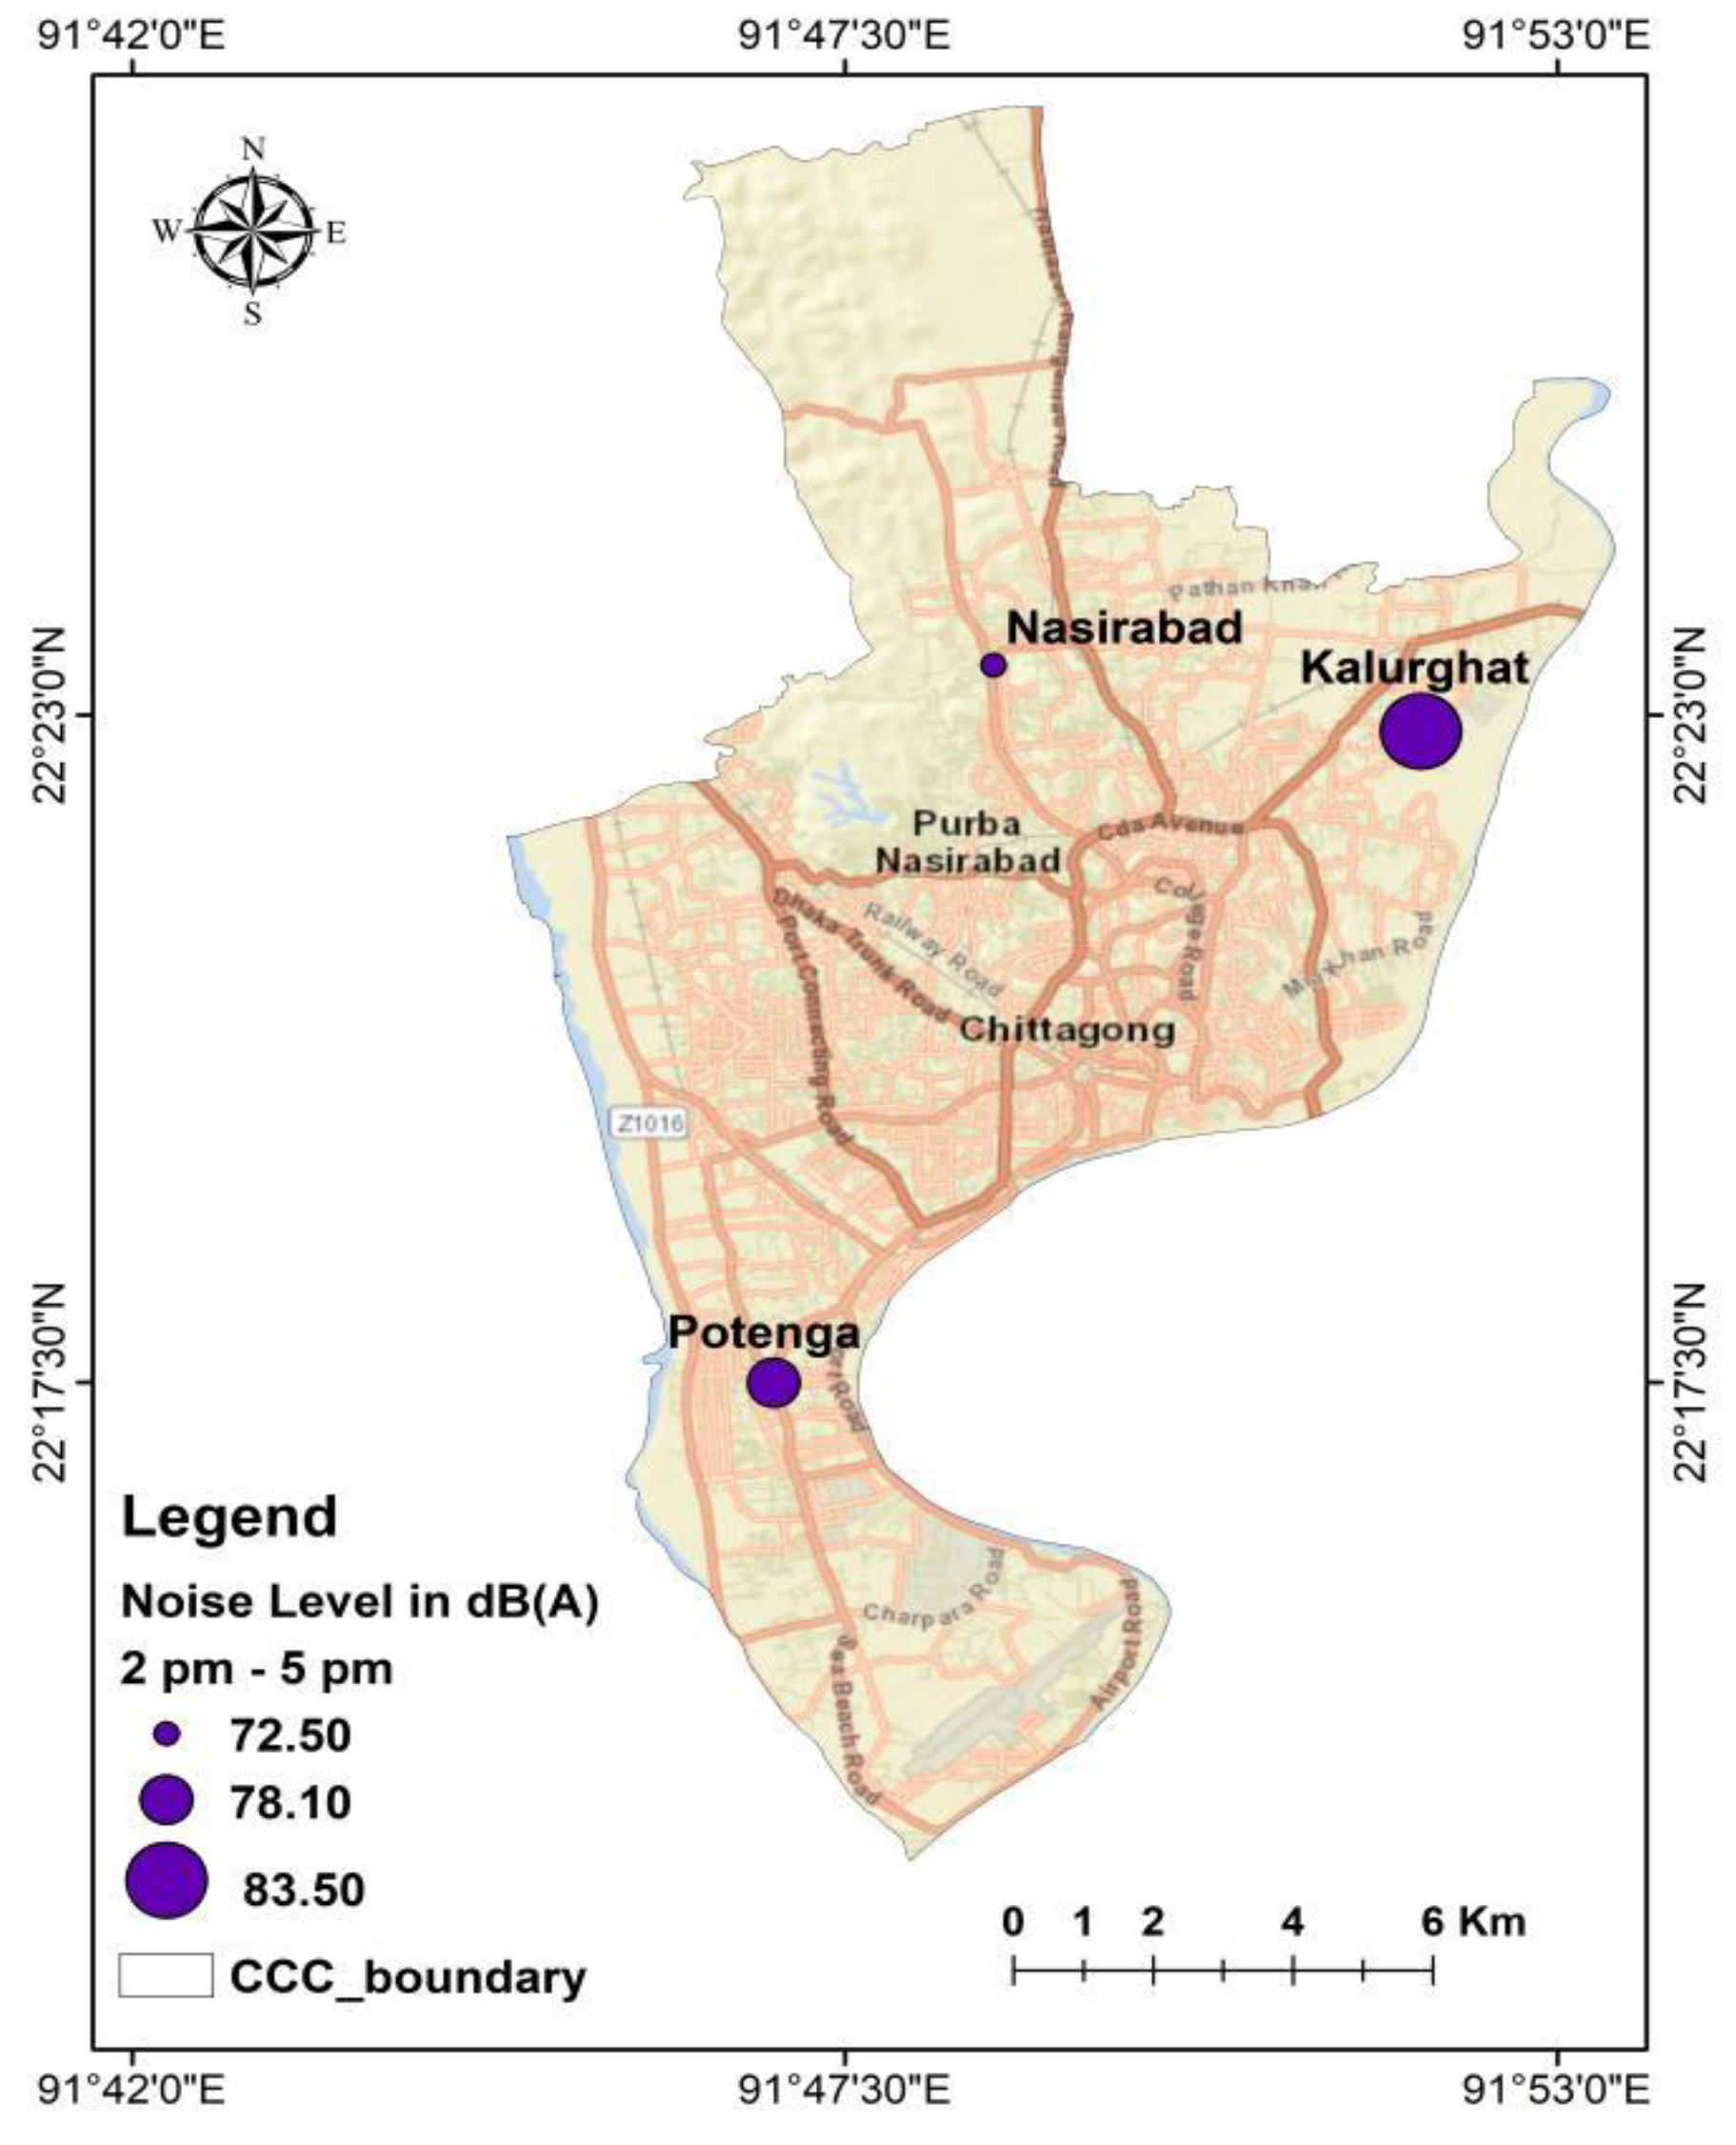
Figure 18) illustrate industrial noise readings in decibels dB(A) during holidays in the study area in the morning (10 am to 12 pm) and at midday (2 pm to 5 pm). According to the map, the highest noise value at the kalurghat industrial area is 82.50 dB(A) in 10 am-12 pm. Between 10 am and 12 pm, 81.10 dB(A) and 72.50 dB(A) are measured from Patenga and Nairabad. Again, Highest noise reading is measured from Kalurghat at 2 pm- 5 pm is 83.50 dB(A). 78.10 dB(A) and 72.50 dB(A) noise measured from Patenga and Nasirabad respectively. Nasirabad has a lower noise level than the other two areas since it is more densely populated. The primary reason for measuring value in holidays. Kalurghat is experienced higher noise reading since holiday. The main reason is there are almost 1200 industries are located in kalurghat
Bangladesh Small and Cottage Industries Corporation (BISIC) area according to Chittagong Chamber of Commerce and Industry (CCCI).
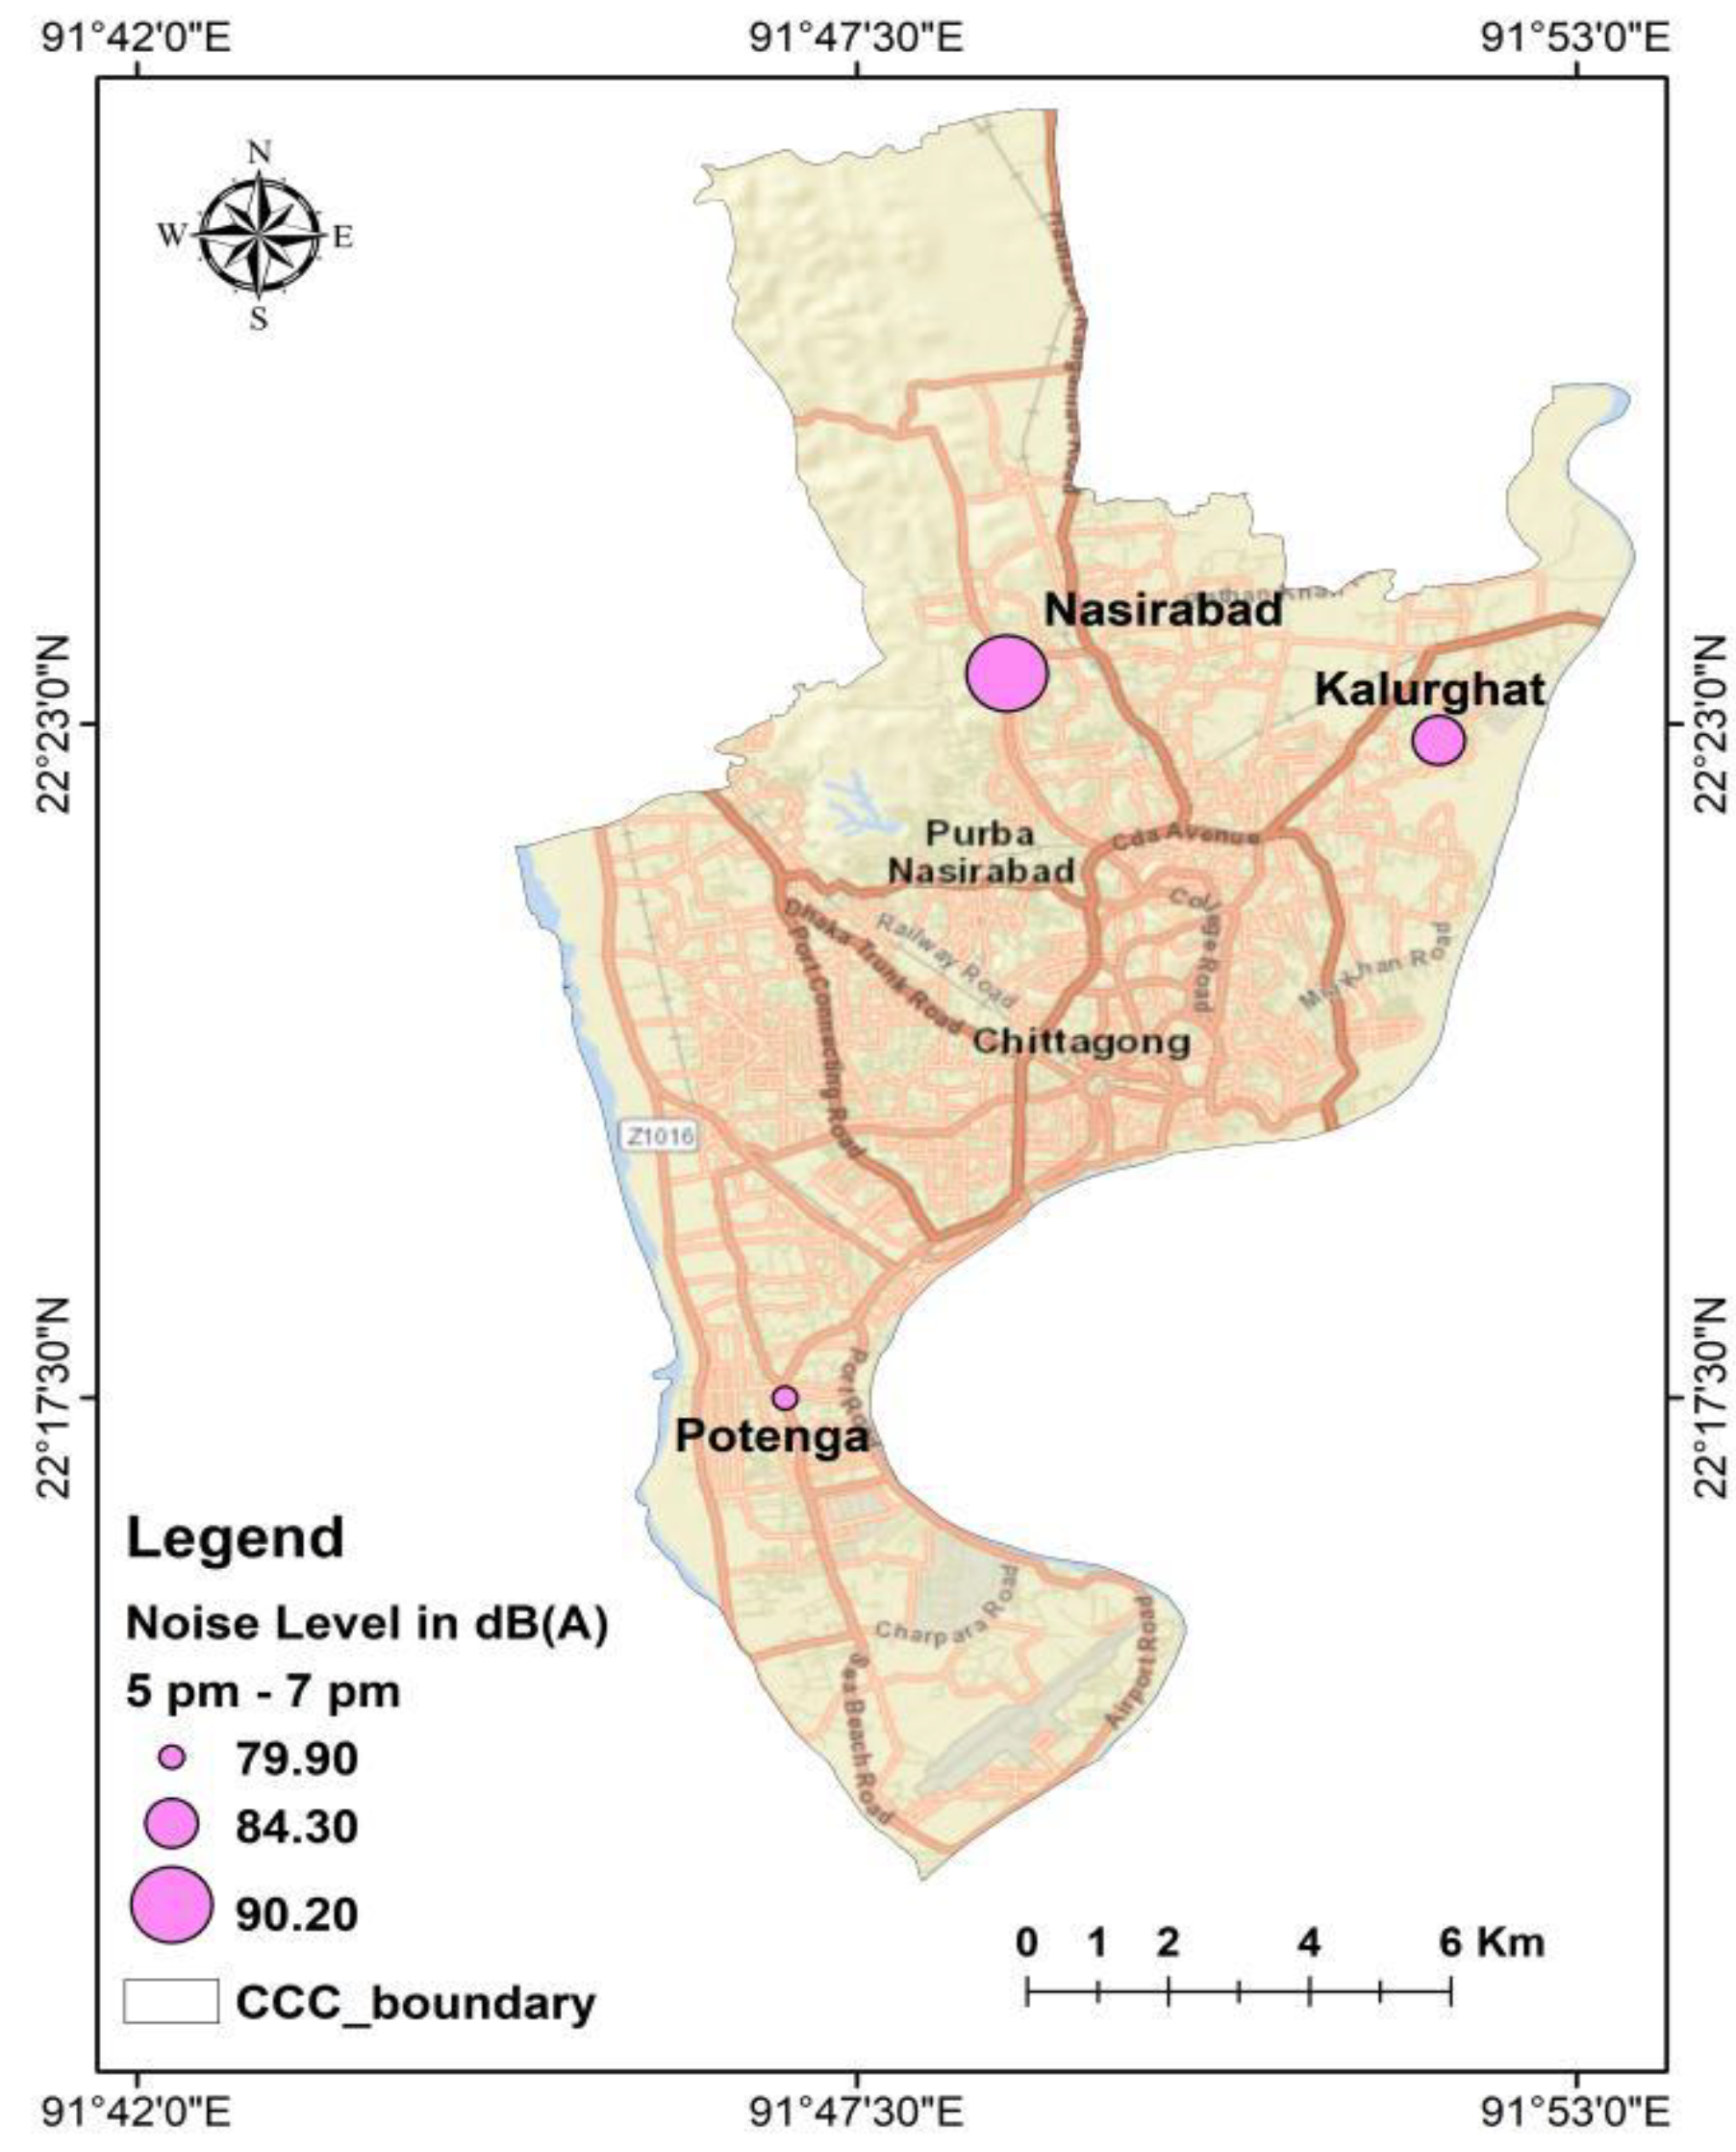
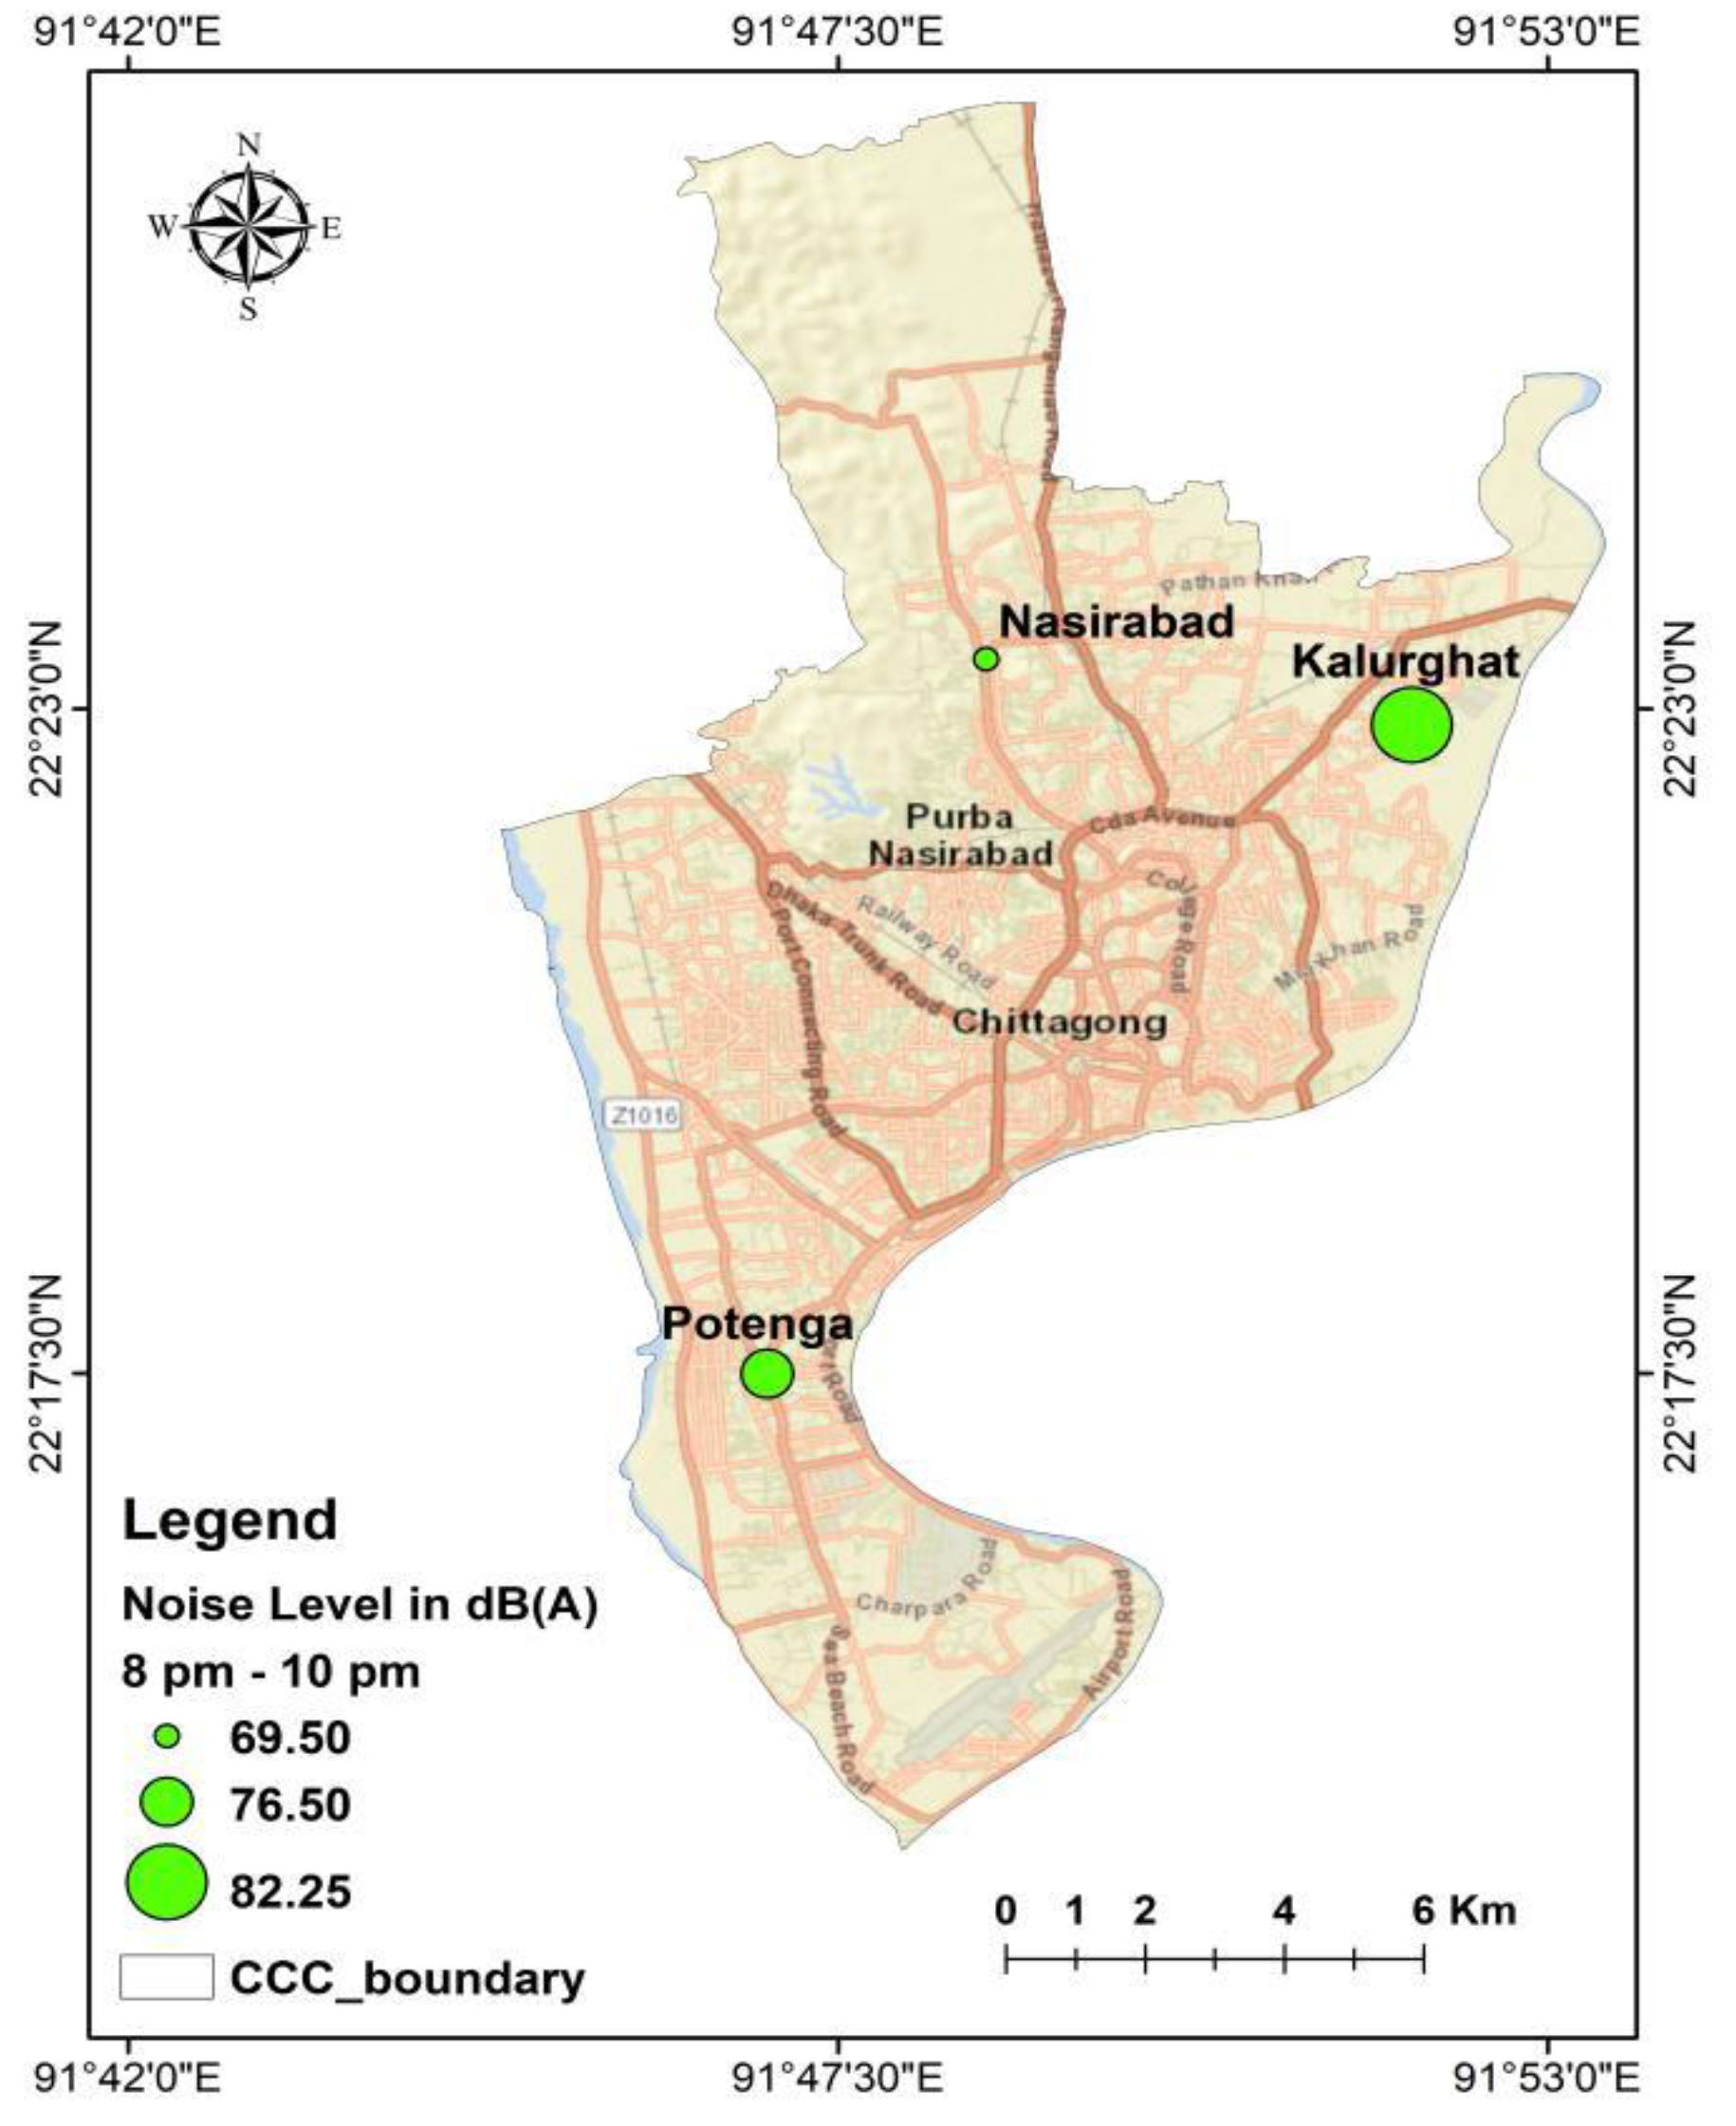
The maps further depict that industrial noise readings in decibels dB(A) in the evening (5 pm to 7 pm) and night time (8 pm to 10 pm) during holidays in the study area. A sound level meter is used to measure noise levels in the industrial areas of Kalurghat, Nasiranad, and Patenga. From the data, the highest noise level is 90.20 dB(A) in 5 pm-7 pm at Nasirabad industrial sector. 84.30 dB(A) and 79.90 dB(A) are measured between 5 pm and 7 pm at Kalurghat and Patenga.On the other hand, Highest noise reading is measured from Kalurghat at 8 pm- 10 pm is 82.25 dB(A). 76.50 dB(A) and 69.50 dB(A) noise measured from Patenga and Nasirabad respectively. The resulting noise value depicts a variance of the highest and lowest noise levels in the industrial region during the holiday time.
3.5. Noise Pollution in Working Day (Industrial and Residential Area)
The maps (
Figure 19 and
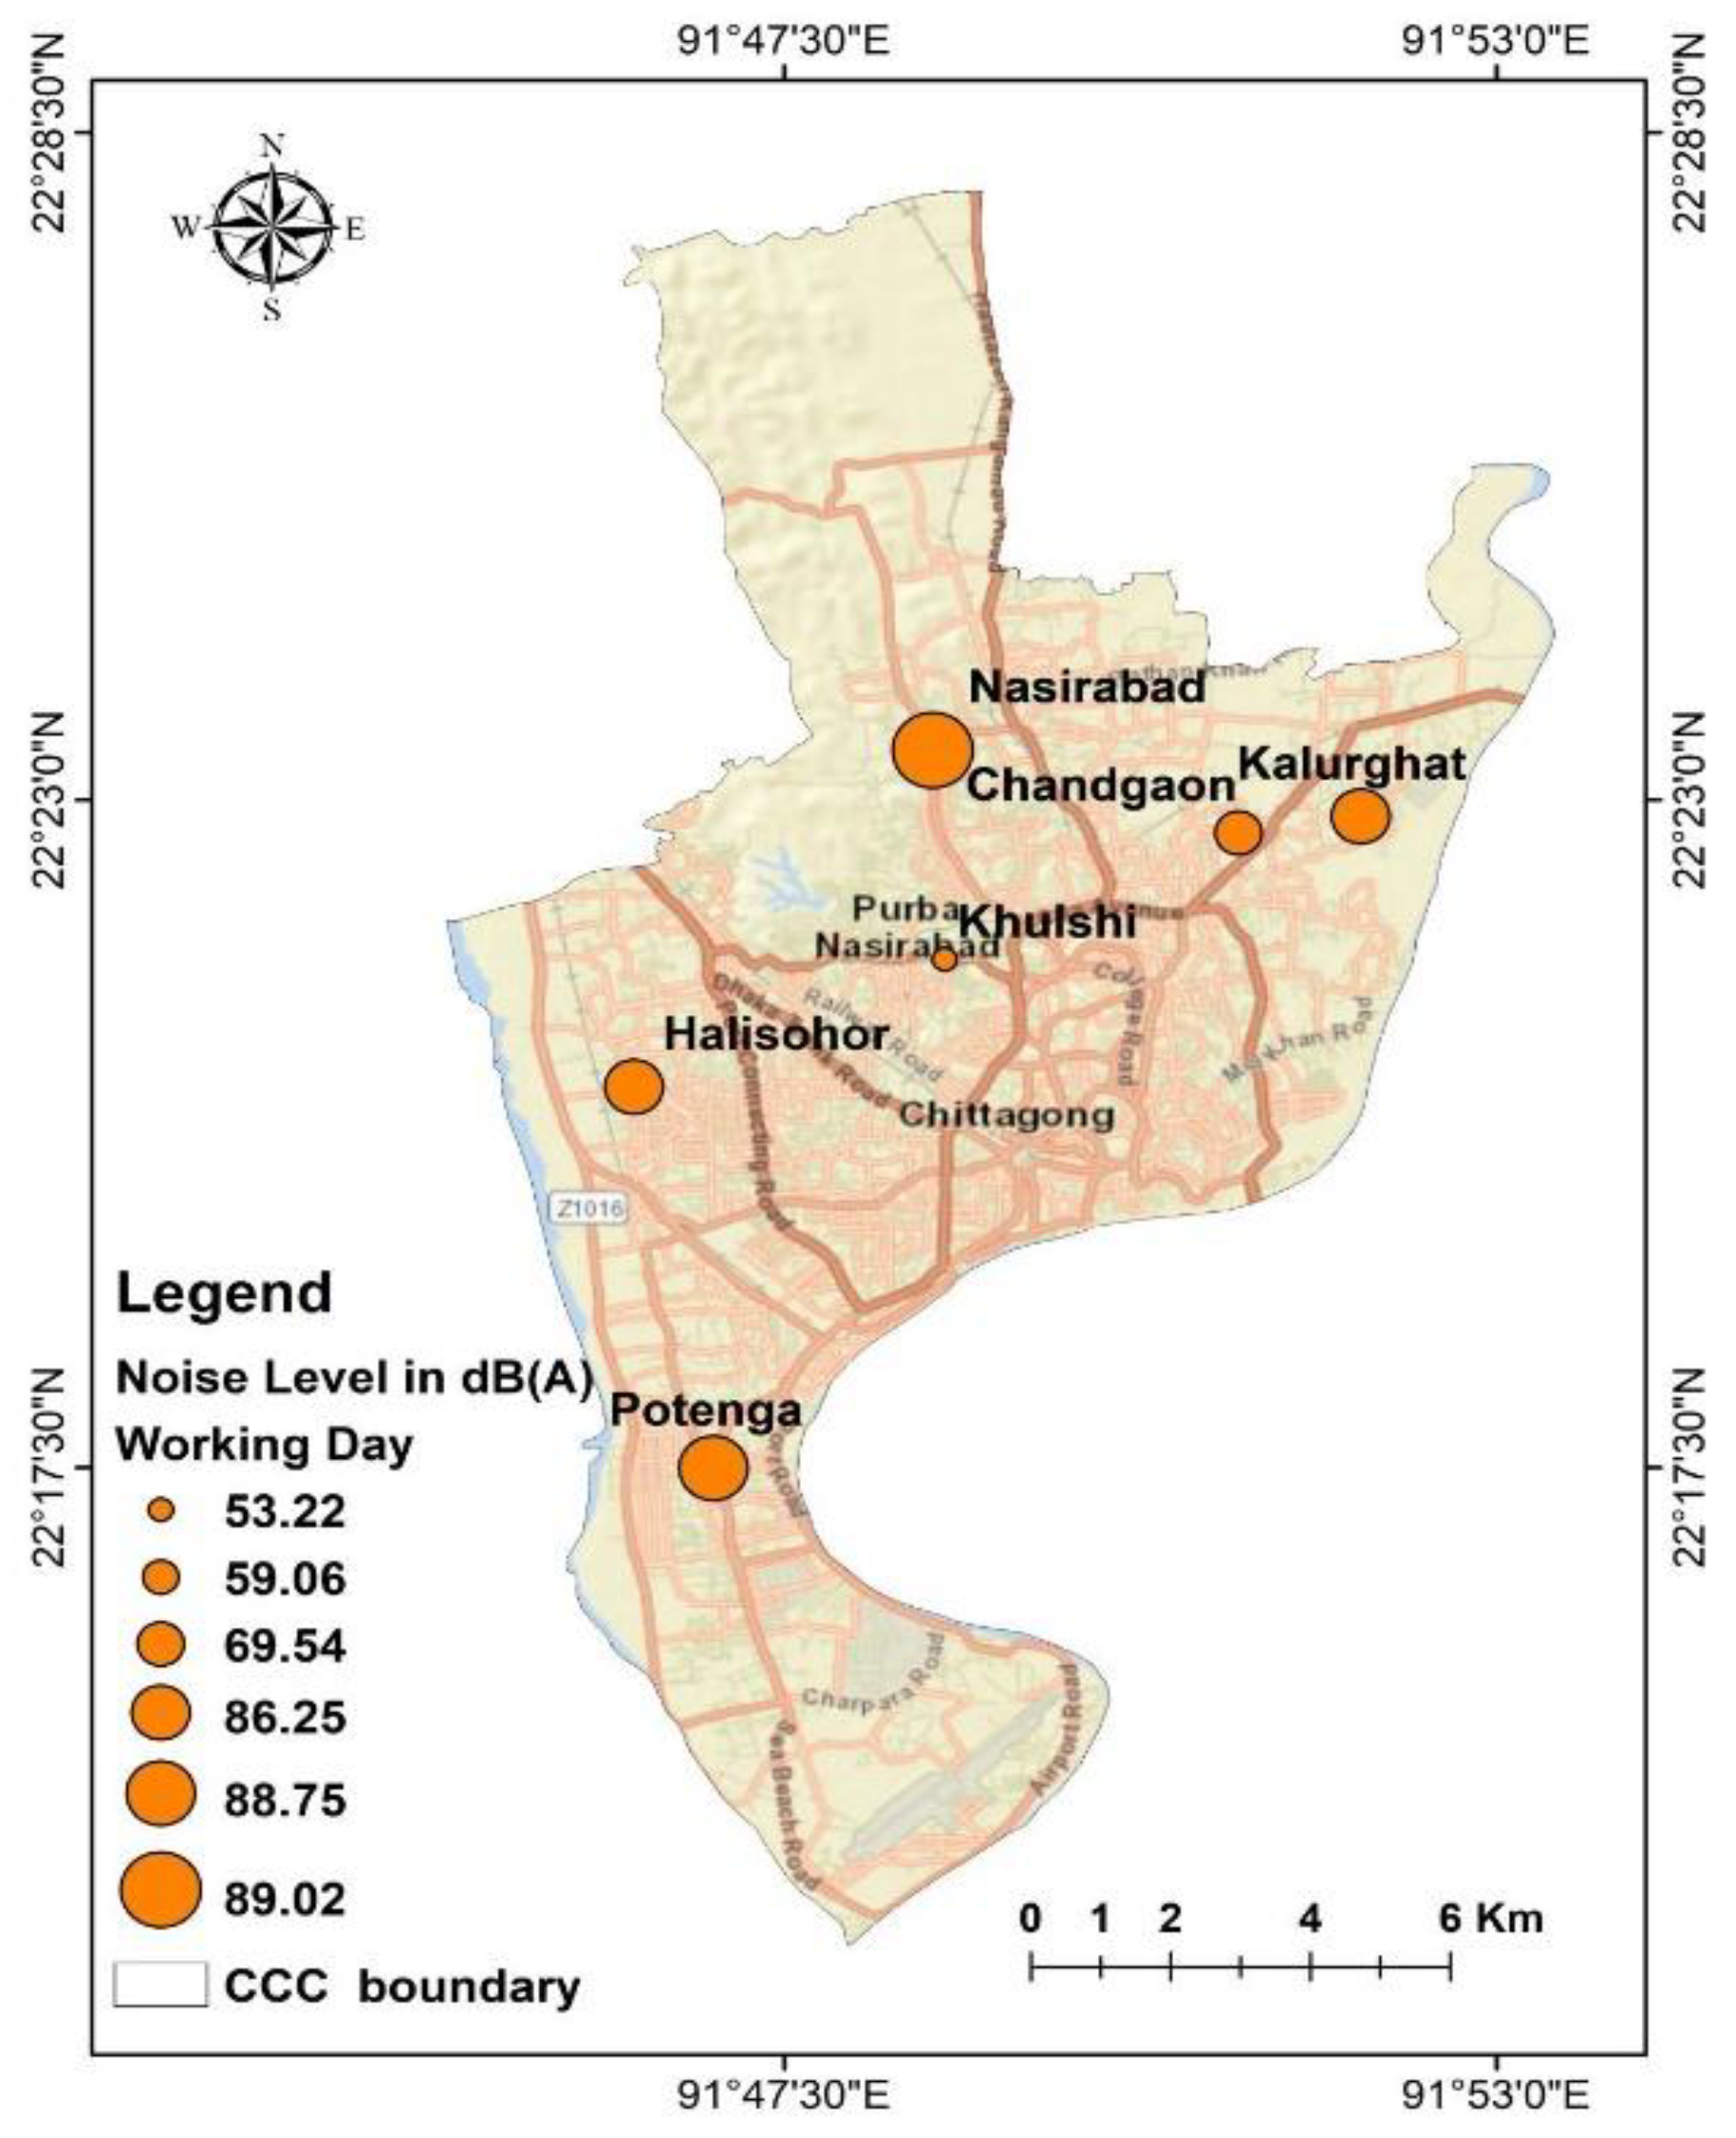
Figure 20) depict the degree of noise pollution during the working day in the specified industrial and residential areas. The graphic also compares noise readings in these study areas during the working day. From the map, Highest noise reading is measured in Nairabad industrial area, is 89. 02 dB(A). Two other industrial area patenga and Kalurghat is measured 88.75 dB(A) and 86.25 dB(A) ranked as second and third. The lowest noise value is measured in Khulshi residential area during working day, is 53.22 dB(A). Chandgaon and halisohor is measured as 59.14 dB(A) and 69.72 dB(A). The industrial average noise value is higher than residential areas and there is a similarity among the average noise value of industrial areas.
It is further depicted from the map that the degree of noise pollution during the working day in the specified industrial and residential areas. The graphic also compares noise readings in these study areas during the working day. From the map, Highest noise reading is measured in Nasirabad industrial area, is 89. 02 dB(A). Two other industrial area Patenga and Kalurghat is measured 88.75 dB(A) and 86.25 dB(A) ranked as second and third. The lowest noise value is measured in Khulshi residential area during working day, is 53.22 dB(A). Chandgaon and Halisohor is measured as 59.14 dB(A) and 69.72 dB(A).
3.6. Comparison of Noise Data in Residential and Industrial Area
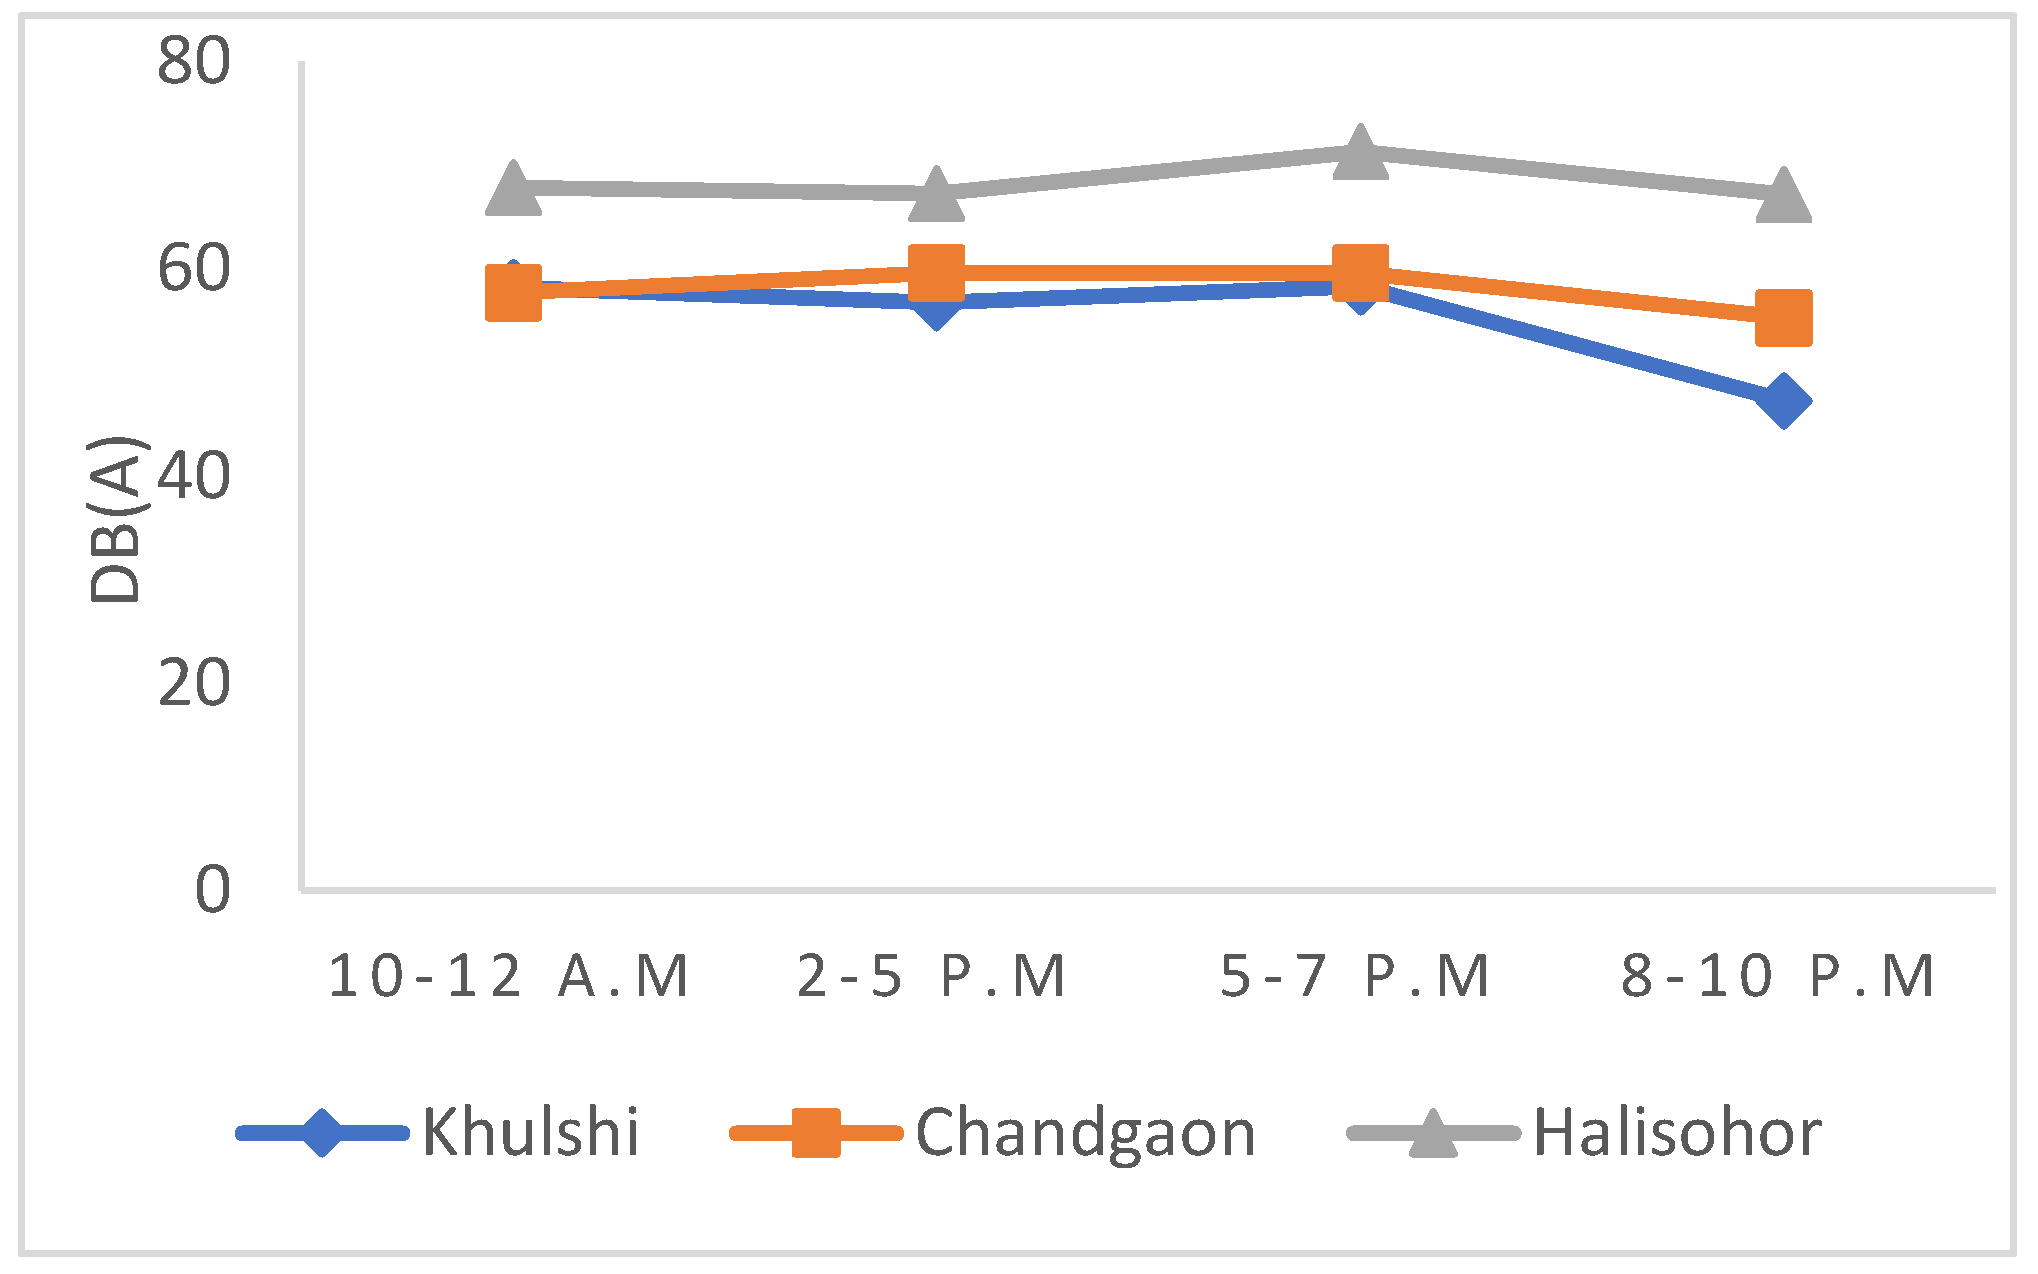
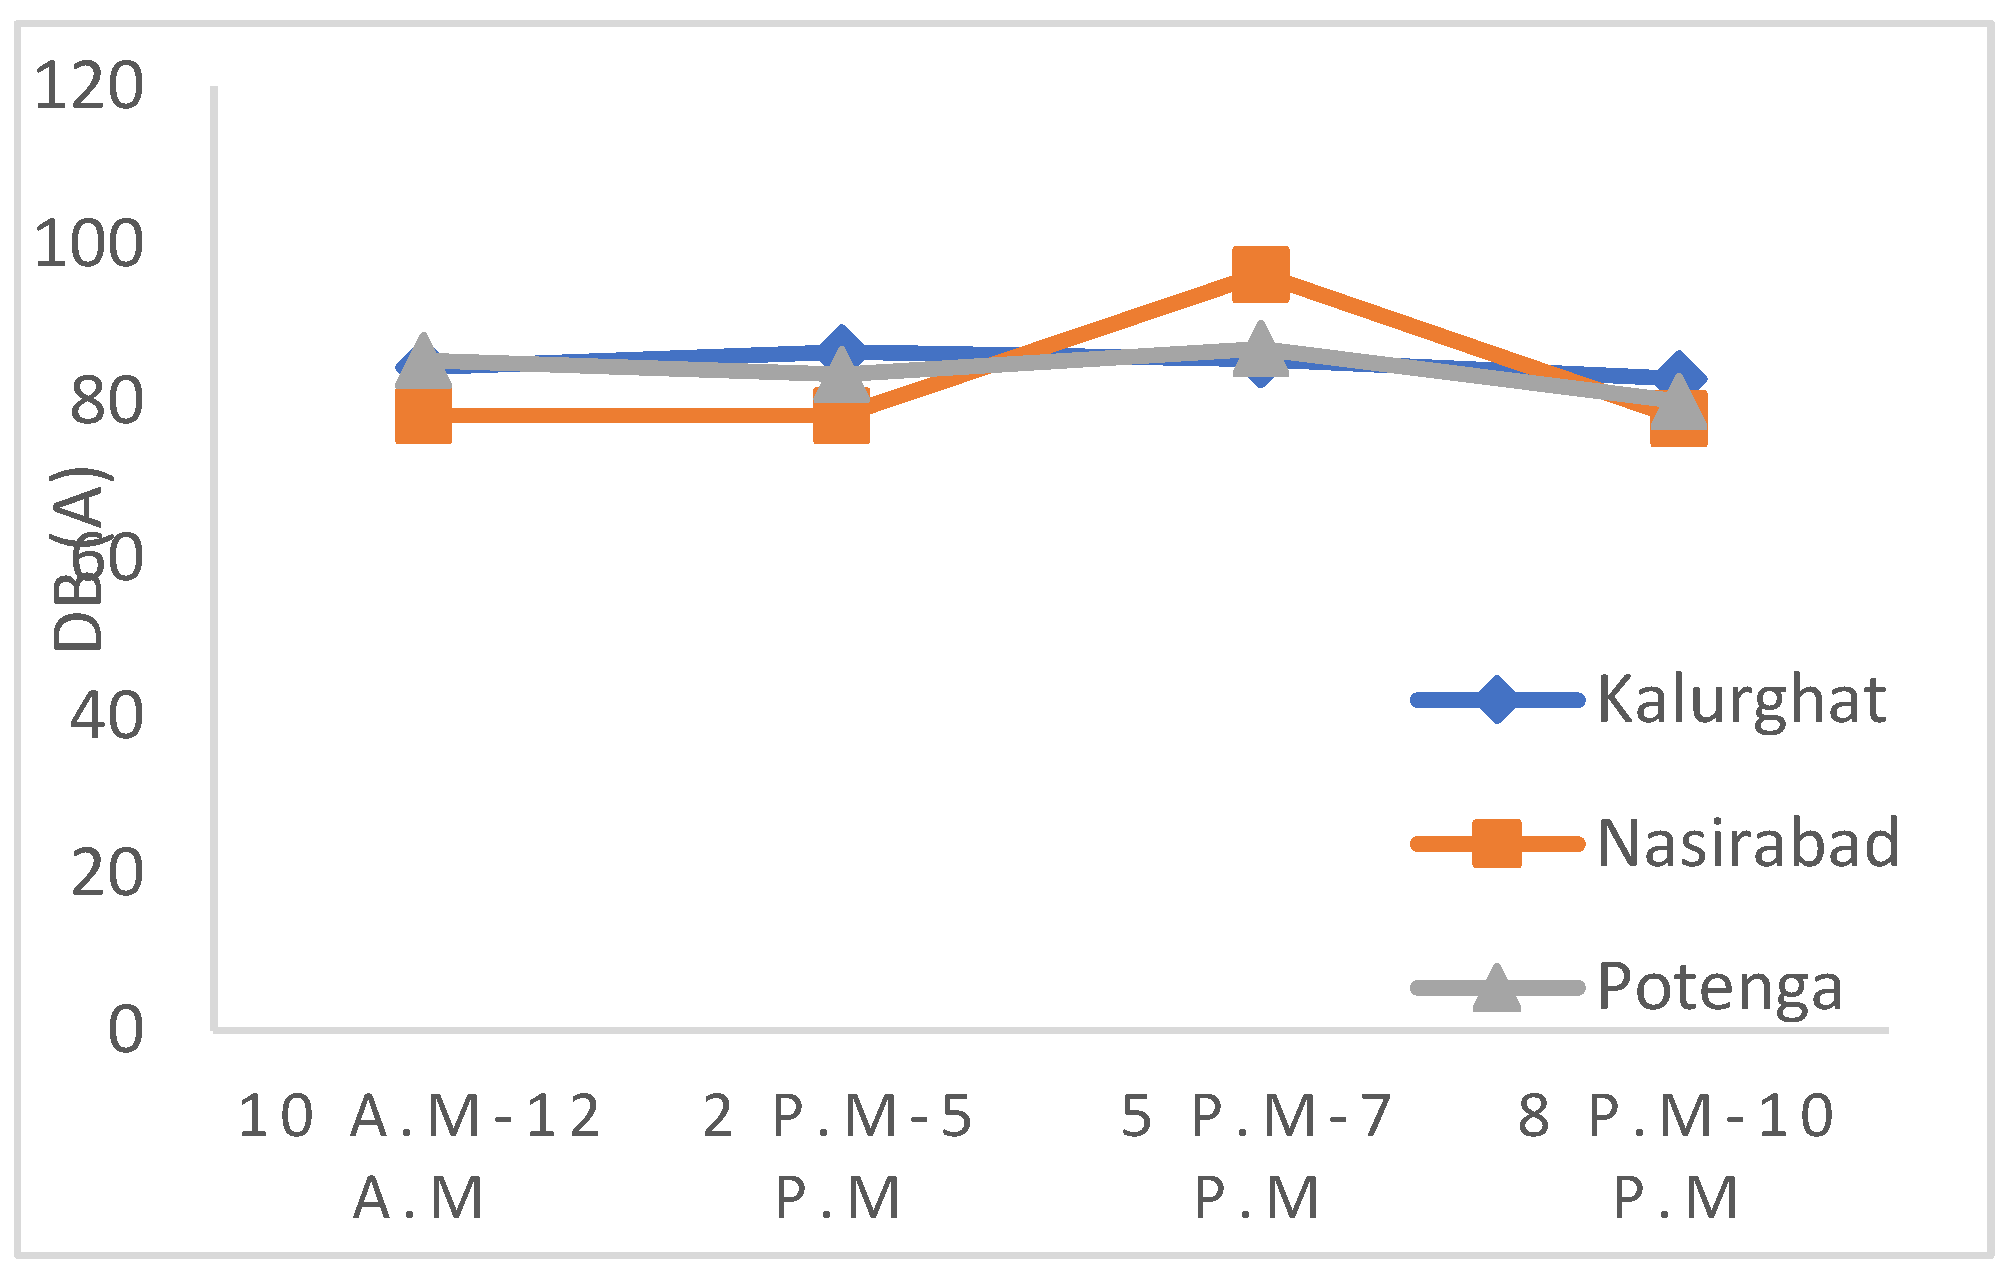
The graphs (
Figure 20 and
Figure 21) compare noise pollution in the selected residential and industrial study regions. Though there is some fluctuation at night, the noise level is quite similar to the Khulshi and Chandgaon neighborhoods, but the noise pollution in Halisohor is always higher than in these two locations. This indicates that Halisohor is not effectively organized as a residential area, as noted by the researcher. Noise pollution levels in Kalurghat and Patenga are high also similar in value. However, there is considerable volatility in the Nasirabad industrial area.
3.7. Correlation Between Industrial and Residential Readings
The data (
Table 1) shows the relationship between the noise levels in residential and industrial areas. According to the data, there is a slightly positive correlation (+0.165) between the noise readings in industrial and residential areas.
The data (
Table 2) shows the relationship between the noise levels of working day and holiday in study area. According to the data table, there is very strong positive correlation (+0.936) between the noise readings of working and holiday. It is clear that the noise pollution is very high in working days than that of holiday.
The data (
Table 3) shows the correlation between the noise levels of morning and evening time in study area. According to the data table, there is a strong positive correlation (+0.883) between the noise readings of morning and evening. It is clear that the noise pollution is very high in these two specific time period.
4. Recommendations
Noise can be defined as an unpleasant sound, a superfluous sound, or an unwanted sound. The city of Chittagong’s rapid infrastructure development, intense industrial activity, rapid urbanization, rising automobile traffic, and expanding population all contribute to noise pollution. Public must be aware and educate about noise nuisance through adequate news media, lectures, radio talks and other programs. A campaign should be started in schools, colleges, madrasa and universities to educate students about the negative effects of noise pollution. Industry-related noise can be reduced by building enclosures around the industrial machinery or coating the room walls with sound-absorbing materials like acoustic tiles. Automobile workshops and other industries should be placed away from residential areas, and those that are now located on road sides and in public spaces should be relocated to other outlying areas of the city. The best method for lowering noise pollution is this. It entails developing and producing noisier machinery and apparatus as well as applying noise-canceling technology where noise is generated. For instance, placing isolation devices for vibration on machinery and utilizing silencers on exhaust fans can both help to lower noise levels. Earmuffs and earplugs can be offered to employees who are exposed to noise. Locating the institutions in fringe or minimum distance from junction point is the greatest approach to safeguard them from noise disruption. To ensure the protection of employees’ health at work, urge those in charge of occupational safety and health in firms to take additional steps to decrease noise emission and require access to physical hearing protection in high-risk occupations. Green solution such as Green roof, vertical gardening or rooftop vegetation can attenuate sound by absorbing propagation over rooftop from street to quite sides. Tree belts are most effective at reducing high-frequency noise, such as the noise from traffic and aircraft. Studies have shown that tree belts can reduce noise levels by up to 6 dB. This may seem small, but it is equivalent to a halving of the perceived loudness of the noise. Urban green space and vegetation produce positive psychological effects. Public park, garden and other small green area provide pleasant sound from nature such as rustling leaves, swaying tree branches and creeping birds. Natural sound support stress recovery and attention restoration. Use of loudspeaker outside close premises induce public nuisance, be it religion or sports or political campaigns or banquet hall should be controlled by concerned agency such as Chittagong City Corporation (CCC). As green trees lessen the intensity of noise, planting evergreen trees close to or surrounding noisy locations can show to be an effective measure for noise pollution reduction. It is noteworthy and advised to maintain banning fireworks, lights, and bombs at weddings, Christmas, New Year’s celebrations, and other outdoor loud events. Hospitals should keep the cabins of post-operative patients, seriously ill patients, patients with chronic diseases, as well as those in the operating room, intensive care unit, coronary heart unit, and neonatal unit, away from the roadside. Strict rules, especially in Bangladesh, are essential, as is the execution of the law. In order to reduce the threat that noise pollution poses to the environment, NGOs, experts, the media, and concerned citizens all play a crucial role. The government should honorably recognize the people or group who fill that position. Traffic management should be improved by adopting automated traffic system. The government ought to promote more noise-related health research and studies and consider noise an essential factor when evaluating public health issues. Coordination among the concerned authorities, such as CDA, CCC, BRTA, DOE, Traffic department, FBCCI etc. is the best strategy to reduce noise pollution. The government should update and reform current laws and regulations, as well as enhance fines, penalties, and other forms of restitution. One of the key ways to minimize noise pollution is by proper execution of regulations that limit it, along with regular supervision.
8. Conclusions
There is no such thing as “silence” on the globe; sounds occur constantly and everywhere. Numerous industries, including shipbuilding, steel, textiles, and chemicals, are based in Chattogram city. The level of noise pollution in the Chattogram metropolitan Area (CMA) is extremely high, and it is emerging as a new hazard to city residents. Even at night, the total amount of noise pollution recorded exceeds both national and international acceptable limit. Noise pollution cause serious health problem to resident life. Concerned agencies, as well as city residents, should be aware of this new developing threat in order to create a sustainable, healthy and livable city.
References
- Al-Radhi, M.S.; Csapó, T.G.; Németh, G. Adaptive Refinements of Pitch Tracking and HNR Estimation within a Vocoder for Statistical Parametric Speech Synthesis. Appl. Sci. 2019, 9, 2460. [Google Scholar] [CrossRef]
- BBS. (2015). Population distribution and internal migration in Bangladesh. Bangladesh Population Monograph. 5, 28–31.
- Islam, M. T. , Nahar, N., Islam, M. J., Islam, M. A., & Hossen, M. A. (2015). Traffic-Induced Noise Pollution and its Impact on Human Health in Chittagong City Corporation. Journal of Environmental Science & Natural Resources, 8(2), 37-40. [CrossRef]
- Mason, M. J. (2016). Environmental Noise Pollution: Noise Mapping. Public Health and Policy.
- Rashin, & Ahmed. (2013). Assessment of Occupational Noise Hazard in Roadways and Traffic Intersections in Dhaka City. Dhaka.
- Shalini, K. , & Kumar, B. (2018). Study of Road Traffic Noise Sound Pressure Levels in Varanasi City, India. International Journal of Applied Engineering Research, 13(8). Retrieved from http://www.ripublication.
- Sultana, A.; Paul, A.K.; Nessa, M.U. The Status of Noise Pollution in the Major Traffic Intersections of Khulna Metropolitan City in Bangladesh and its Possible Effect on Noise-Exposed People. Eur. J. Environ. Earth Sci. 2020, 1. [Google Scholar] [CrossRef]
- Tania, M. , & Odagiu, A. (2007). Noise Pollution in Urban Areas: A Case Study of Cluj-Napoca Town. Bulletin USAMV-CN, 63.
- Uddin, M.N.; Hoque, S.; Islam, M.A. Determination of Traffic Induced Noise Pollution and its Impact on City Dwellers in the Chittagong City Area. Eur. Sci. J. ESJ 2018, 14. [Google Scholar] [CrossRef]
- Deafness and hearing loss. https://www.who.int/news-room/fact-sheets/detail/deafness-and-hearing-loss (accessed 2024-03-01).
- Wokekoro, E. (2020). Public Awareness of the Impacts of Noise Pollution on Human Health. World Journal of Research and Review, 28. Retrieved from http://www.wjrr.
Figure 1.
Map of the study area.
Figure 1.
Map of the study area.
Figure 2.
Methodological overview of the research.
Figure 2.
Methodological overview of the research.
Figure 3.
Residential Noise level at working day from 10 am to 12 pm.
Figure 3.
Residential Noise level at working day from 10 am to 12 pm.
Figure 4.
Residential Noise level at working day from 2 pm to 5 pm.
Figure 4.
Residential Noise level at working day from 2 pm to 5 pm.
Figure 5.
Residential Noise level at working day from 5 pm to 7 pm.
Figure 5.
Residential Noise level at working day from 5 pm to 7 pm.
Figure 6.
Residential Noise level at working day from 8 pm to 10 pm.
Figure 6.
Residential Noise level at working day from 8 pm to 10 pm.
Figure 7.
Residential Noise level at holiday from 10 am to 12 pm.
Figure 7.
Residential Noise level at holiday from 10 am to 12 pm.
Figure 8.
Residential Noise level at holiday from 2 pm to 5 pm.
Figure 8.
Residential Noise level at holiday from 2 pm to 5 pm.
Figure 9.
Residential Noise level at holiday from 5 pm to 7 pm.
Figure 9.
Residential Noise level at holiday from 5 pm to 7 pm.
Figure 10.
Residential Noise level at holiday from 8 pm to 10 pm.
Figure 10.
Residential Noise level at holiday from 8 pm to 10 pm.
Figure 11.
Industrial Noise level at working day from 10 am to 12 pm.
Figure 11.
Industrial Noise level at working day from 10 am to 12 pm.
Figure 12.
Industrial Noise level at working day from 2 pm to 5 pm.
Figure 12.
Industrial Noise level at working day from 2 pm to 5 pm.
Figure 13.
Industrial Noise level at working day from 5 pm to 7 pm.
Figure 13.
Industrial Noise level at working day from 5 pm to 7 pm.
Figure 14.
Industrial Noise level at working day from 8 pm to 10 pm.
Figure 14.
Industrial Noise level at working day from 8 pm to 10 pm.
Figure 15.
Industrial Noise level at holiday from 10 am to 12 pm.
Figure 15.
Industrial Noise level at holiday from 10 am to 12 pm.
Figure 16.
Industrial Noise level at holiday from 2 pm to 5 pm.
Figure 16.
Industrial Noise level at holiday from 2 pm to 5 pm.
Figure 17.
Industrial Noise level at holiday from 5 pm to 7 pm.
Figure 17.
Industrial Noise level at holiday from 5 pm to 7 pm.
Figure 18.
Industrial Noise level at holiday from 8 pm to 10 pm.
Figure 18.
Industrial Noise level at holiday from 8 pm to 10 pm.
Figure 19.
Noise Pollution in working day (Industrial and Residential Area).
Figure 19.
Noise Pollution in working day (Industrial and Residential Area).
Figure 20.
Noise Pollution in working day (Industrial and Residential Area).
Figure 20.
Noise Pollution in working day (Industrial and Residential Area).
Figure 21.
Comparison in industrial data in residential and industrial and area.
Figure 21.
Comparison in industrial data in residential and industrial and area.
Figure 22.
Comparison in industrial data in residential and industrial and area.
Figure 22.
Comparison in industrial data in residential and industrial and area.
Table 1.
Correlation between industrial and residential readings.
Table 1.
Correlation between industrial and residential readings.
| |
Industrial |
Residential |
| Industrial |
Pearson Correlation |
1 |
.165 |
| Sig. (2-tailed) |
|
.442 |
| Residential |
Pearson Correlation |
.165 |
1 |
| Sig. (2-tailed) |
.442 |
|
Table 2.
Correlation between working day and holiday readings.
Table 2.
Correlation between working day and holiday readings.
| |
Working day |
Holiday |
| Working |
Pearson Correlation |
1 |
.936**
|
| Sig. (2-tailed) |
|
.000 |
| Holiday |
Pearson Correlation |
.936**
|
1 |
| Sig. (2-tailed) |
.000 |
|
Table 3.
Correlation between morning and evening readings.
Table 3.
Correlation between morning and evening readings.
| |
Morning |
Evening |
| Morning |
Pearson Correlation |
1 |
.883**
|
| Sig. (2-tailed) |
|
.000 |
| Evening |
Pearson Correlation |
.883**
|
1 |
| Sig. (2-tailed) |
.000 |
|
|
Disclaimer/Publisher’s Note: The statements, opinions and data contained in all publications are solely those of the individual author(s) and contributor(s) and not of MDPI and/or the editor(s). MDPI and/or the editor(s) disclaim responsibility for any injury to people or property resulting from any ideas, methods, instructions or products referred to in the content. |
© 2025 by the authors. Licensee MDPI, Basel, Switzerland. This article is an open access article distributed under the terms and conditions of the Creative Commons Attribution (CC BY) license (http://creativecommons.org/licenses/by/4.0/).