
Submitted:
07 December 2024
Posted:
10 December 2024
You are already at the latest version
Abstract
Noise pollution poses significant challenges for urban infrastructure management, necessitating practical assessment tools such as noise maps. These maps facilitate the visualisation and geo-referencing of noise levels, enabling the identification of areas requiring immediate intervention and long-term strategic responses. Road sections with more than 3 million vehicles per year were selected for measurement. The article presents the results in the form indicated. It obtains an excess of the Long-term Day-Night Average Noise Level (LDWN), affecting approximately 1.899 km² and impacting around 1,200 residents within the exceedance zone. Similarly, the equivalent noise level (LN) exceeds acceptable limits over 1.220 km², affecting an additional 700 residents. At the same time, there were no exceedances of the key noise impact indicators such as a high annoyance (HA), high sleep disturbance (HSD), and ischaemic heart disease (IHD). For areas that exceed the applicable noise standards, a change in traffic organisation was introduced by banning heavy goods vehicles and introducing local speed limits. The changes made have eliminated the noise problem in the urban area. Further anti-noise measures are planned to involve planting plants in the road lane.
Keywords:
noise
; noise map
; road management
1. Introduction
Studies indicate that around 40% of Europeans are exposed to daytime noise above the World Health Organisation (WHO) recommended threshold of 55 dB [1,2]. The European Environment Agency reported that road noise affects approximately 125 million people and has become a significant social and environmental problem [3,4]. Noise is estimated to contribute to the loss of approximately 1.6 million disability-adjusted life years (DALYs) per year in Europe alone [5,6]. The ever-increasing urbanisation and increased demand for transport services, with the simultaneous increase in the number of motor vehicles, significantly impact the magnitude of the adverse effects of noise on people and the environment [7]. According to the Polish Central Statistical Office, car transport in the context of freight transport accounted for over 80% of all freight transport carried out in Poland [8], which compounds the problem of noise emissions. Car transport is a major contributor to urban noise pollution, accounting for about 80% of the overall noise levels in many cities [9,10]. The relationship between traffic congestion and noise levels is the subject of several research papers, which at the same time point to the co-occurrence of public health problems as a result of increased noise impacts [3,8,11,12]. The main organ exposed to excessive noise impact is hearing, while indirect effects related to increased stress levels and reduced quality of life caused by increased dB values are indicated [13,14].
The World Health Organisation (WHO) has established guidelines indicating that noise levels above 55 dBA can lead to significant annoyance and health disorders. In comparison, levels above 70 dBA can cause permanent hearing loss and increased mortality from cardiovascular causes [15]. Studies also indicate that noise can lead to physiological stress responses, manifest as elevated blood pressure, heart disease and other cardiovascular conditions [16,17]. A meta-analysis by Badisch highlights that road noise is a risk factor for coronary heart disease and potentially influences increased stroke risk [18]. Similarly, studies have shown that people living near roads with heavy traffic experience more sleep disturbances and other health issues. Estimates point to the indirect impact of road noise as a cause of 2,000 premature deaths per year in Japan alone [19]. The effect of noise on sleep disturbance is associated with a potential increased risk of cognitive impairment and mental health [16,20,21,22,23,24]. The relationship between noise exposure and annoyance is also significant, with studies showing that even at similar decibel levels, different types of noise (e.g. road vs aeroplane) can induce various degrees of annoyance and health impacts [25,26]. This suggests that noise characteristics, including frequency and duration, are key in determining health effects [25]. Researchers indicate that prolonged exposure to high noise levels can result in increased irritability, anxiety and depression [13,27].
In addition to direct health impacts, noise from motorised transport has wider implications for urban planning and community well-being. Metropolitan areas with high traffic noise often experience reduced physical activity among residents, as noise discomfort can discourage outdoor activity [28,29]. Reduced physical activity can contribute to several health problems, including obesity and related chronic diseases [30,31]. In addition, green spaces have been shown to mitigate some of the adverse effects of noise pollution by promoting physical activity and mental well-being [32].
The accumulation of noise pollution in urban areas can reduce the quality of life, disrupt local ecosystems [33,34] and contribute to biodiversity loss [35,36]. Animals exposed to high levels of anthropogenic noise may alter their behaviour, leading to habitat fragmentation and reduced reproductive success [35,36]. Noise pollution can disrupt wildlife habitats and change their behaviour, leading to broader ecological impacts [9]. As urban areas continue to develop, the need for effective noise management strategies becomes more critical.
Effective noise mapping and mitigation strategies are essential for identifying high-exposure areas and implementing measures to reduce noise pollution, thereby protecting public health and improving environmental quality [37,38,39,40,41,42]. This article presents an example of carrying out road noise impact measurements by developing maps that indicate the area exposed to negative impacts.
2. Materials and Methods
Urban development requires effective noise management strategies [43,44,45]. While the implementation of noise regulations is a key element of a comprehensive noise management approach [3,14], there is currently insufficient control [46].
The simplest solution applied to multi-lane roads is the introduction of noise barriers [47,48], while for single-lane roads, the application of the indicated solution is economically and visually irrational. Therefore, research and application of road noise mitigation pavements is essential [49,50]. Transport development is also related to the use of quieter engines and the implementation of tyres that reduce noise emissions from motor vehicles [14,51]. The electrification of transport is also an essential aspect of combating noise emissions [52,53,54]. as electric motors operate much quieter than traditional internal combustion engines [14,51].
An interesting conclusion of the study is that traffic control should be considered to reduce road noise emissions. Traffic reduction measures like priority for public transport, development of cycling infrastructure [55], the concept of the 15-minute city and promotion of walking [53,56] are key. Educating residents about the health impacts of noise and encouraging community involvement in local planning decisions can foster a collective approach to noise reduction [55]. In addition, policies that promote public transport and non-motorised modes can help shift social norms towards quieter, more sustainable transport options [14,55]. Awareness campaigns can also educate communities about the health impacts of noise pollution and encourage them to engage in noise reduction initiatives [57].
Measuring and mapping road transport noise is essential to establish areas of harmful exposure and is key to verifying noise standards [7,58]. One of the primary methods for mapping road noise involves using statistical models that correlate noise levels with various urban parameters such as traffic volume, road geometry and environmental conditions. For example, Hanigan et al. [59]. A statistical approach was used to generate high-resolution health risk maps related to road noise. In contrast, Adza et al. [60] used Geographic Information System (GIS) techniques to investigate the combined effects of road noise and air quality according to the UK Road Noise Calculation Method (CRTN). This research highlights the importance of integrating statistical analysis with spatial data to improve the accuracy of noise mapping. Suyunov emphasises the importance of using noise data to update noise maps and produce mapping work that reflects the changing urban landscape [61]. The systematic collection of noise data is essential to accurately represent noise exposure in urban environments based on actual measurement data [62,63].
By the regulations in force, the assessment was carried out for one-hour indicators. The basis of the evaluation is the Regulation of the Minister of Environment of 14 June 2007 on permissible noise levels in the environment and the requirements contained therein [64].
According to the Environmental Protection Law, the basis for categorising areas subject to noise protection are the provisions of local spatial development plans. Article 114 (1) of the Act states that when drawing up a local spatial development plan, when differentiating between areas with different functions or development principles, it shall be indicated which of them belong to the particular types of areas referred to in Article 113 (2) para. 1 (i.e. the areas specified in the Decree of 14 June 2007 [64]). The applicable values of permissible sound levels in the environment are presented in Table 1 and Table 2.
Methods and data used to perform acoustic calculations
Measurements and development of the noise map were performed by the requirements of the Minister of Climate and Environment Regulation of 1 July 2021 on the detailed scope of data included in strategic noise maps, the manner of their presentation and the form of their transmission [66]. For the calculations, CadnaA software was used with the CNOSSOS-EU methodology implemented as required by law in accordance with the provisions of Directive 2002/49/EC of the European Parliament [67].
The reference methodology for the measurement of road noise levels discharged into the environment is set out in the Decree of the Minister of the Environment of 16 June 2011 on the requirements for conducting measurements of the levels of substances or energy in the environment by the manager of a road, railway line, tramway line, airport, port [68]. The method of determining the long-term LDWN indicator is set out in the Regulation of the Minister of the Environment of 10 November 2010 on the process of determining the value of the LDWN noise indicator [69], according to which the value of the indicator is determined according to the following relation:
where:
LD - long term average A sound level expressed in dB, determined during all daytime periods of the year, including the time of day (understood as the interval from 06:00 to 18:00 hours),
LW - long-term average sound level A expressed in dB, determined over all the evening periods of a year, including the daytime (defined as the interval from 06:00 to 22:00),
LN - long-term average sound level A expressed in dB, determined during all the night periods of the year (understood as the time interval from 22:00 to 06:00).
Description of the methodology used to calculate the number of dwellings in residential buildings and the population attributed to residential buildings
Central to the strategic noise mapping is the analysis related to determining the potential number of inhabitants exposed to noise and the related harmful effects. These analyses, according to point 2.8 of Annex II of Directive 2002/49/EC, concern the calculation of noise emissions at the façade of residential buildings [67]. Then, based on the estimation of the number of dwellings, the number of inhabitants is estimated for the area; for this purpose, data published by the Central Statistical Office [70] for the municipality where the measurements were carried out was used.
Testing ground
Central to noise mapping is the accurate characterisation of the area being assessed. It is essential to identify potential noise sources regarding the impact on the regulatory adopted characteristic regions. In the methodology adopted, communication routes (roads) are treated as linear noise sources in the computational model, the generated noise level of which depends on many factors such as:
- geometrical parameters of the noise source (road): type and technical condition of the road surface, cross-section of the road (width of the carriageway, number of lanes, width of the separation lane), location of the road about the ground level (on an embankment, in a trench, at ground level), location of engineering structures limiting noise emissions (acoustic screens),
- traffic parameters: traffic volume and structure (number of light and heavy vehicles), average traffic speed, type of traffic (smooth, interrupted, accelerated, decelerating),
- independent parameters: topography and land cover between the noise source and the reception point, meteorological conditions.
The following assumptions were made for the measurements:
- Traffic intensity. The traffic volume values on the individual road sections included in the scope of this study were assumed based on the traffic volume measurements carried out on the separate sections of the analysed roads. The 24-hour average traffic volumes used in the calculations, broken down into daily and annual numbers of vehicles, are shown in the table below.
- Traffic speed. For the purpose of the calculations, the average speed of vehicle traffic was assumed to be equal to the permissible speed of vehicles at a given time of day. The permissible traffic speeds were determined according to the list of vertical signs provided by the Contracting Authority.
- Type and condition of the road surface. The type and condition of the pavement in the calculation model were adopted in accordance with the actual condition found based on the site visit during the conducted noise level field measurements.
- Landforms, Screening Objects. For this study, a Numerical Terrain Model (NMT) layer and a Topographic Database (BDOT) were obtained from the resources of the Central Land Surveying and Cartographic Documentation Centre. The data received made it possible to appropriately model the nullification of individual road sections about neighbouring areas, the landform in the immediate vicinity, and objects of a reflective and screening nature.
3. Results
For the verification and calibration of the computational model, measurements were carried out using the sampling method by point G of the reference methodology, recording the value of the equivalent sound level A at representative noise emission intervals. The number of measurements in each representative measurement interval tk of not less than three and with a duration of at least 10 minutes depended on the gap between the extreme results of these measurements. If the difference between the results of the individual measurements is greater than 7 dB, the duration of a single measurement is increased to a minimum of 15 minutes. The value of the acoustic background level was determined as far as possible when the source noise was not emitted, and if this was not possible, using the L95 index.
Description of the calculation model calibration methodology
Calibration of the computational model was carried out concerning the results of noise measurements and vehicle traffic recorded during the study. The calibration process sought to minimise the error resulting from the difference between the measured sound level value and the value derived from the calculation model. During the calibration process, corrections were made to parameters determined with the most significant uncertainty, e.g. parameters relating to the type of road surface and ground absorption coefficient G.
The calibration started once the complete data had been entered into the computer model, viz:
- complete geometry of the individual road sections,
- traffic volume and vehicle speeds observed during the noise measurements,
- type of pavement - based on visual inspection,
- geometry of shielding, attenuating and reflecting objects,
- elevation model of the area.
Irrespective of the measured sound level, either a single measurement result, Lzm, or a set of n values is available for comparison with the calculation results. In the second case, the average value used in the validation procedure is determined from the formula (2):
Validation is a process that aims to determine the degree of agreement between the model predictions and the actual value. More specifically, validation will be understood as the methodology for assessing the accuracy of the calculation method, with the measure of accuracy being the error (difference) between the calculated and measured sound level. The result of the validation procedure will be the determination of a so-called calibration correction to the computational model (a value-added or subtracted to the result of the calculation or to the emission level of the noise source, depending on the software used), introduced to increase its accuracy. If the calibration correction is within the allowed range (meets the criterion), then the model and its predictions can be considered valid, The smallest possible value of the calibration correction is determined in a procedure referred to as calibration or adjustment of the acoustic model parameters in order to obtain the best agreement with the measurement result.
Comparison of measurement and calculation results
Table 5 compares the measured results with the results obtained by calculation.
Based on the calculations performed, it is concluded that the prerequisite for calibration has been met.
Results of the Strategic Noise Map Development
Description and location of areas where permissible noise levels expressed by the LDWN indicator are exceeded.
The permissible value of the LDWN indicator = 50 dB applies to development areas:
- protective zone ‘A’ of the spa,
- hospital areas outside the city.
The permissible LDWN = 64 dB applies to the development areas:
- areas of single-family residential development,
- areas of buildings connected with permanent or temporary residence of children and young people
- Areas of social housing
- Urban hospital areas.
The limit value of LDWN = 68 dB applies to the areas of:
- areas of multi-family residential development and collective residence,
- areas of farm buildings,
- recreation and leisure areas,
- residential and service areas.
Description and location of areas where permissible noise levels expressed by the LN indicator are exceeded.
The permissible value of the indicator LN = 45 dB applies to the development areas:
- protective zone ‘A’ of the spa,
- areas of hospitals outside the city.
The permissible value of indicator LN = 59 dB applies to development areas:
- areas of single-family housing development,
- areas of buildings connected with permanent or long-term residence of children and young people
- Areas of social housing
- urban hospital areas,
- areas of multi-family residential development and collective residence,
- areas of farm buildings,
- recreation and leisure areas,
- residential and service areas.
Population figures exposed to noise.
The following subsections summarise statistics on the estimated number of dwellings, residents, facilities for the permanent or temporary residence of children and young people, hospitals and social care homes exposed to road noise expressed by LDWN and LN indicators.
The data relating to the number of residents and dwellings exposed to noise expressed by LDWN and LN indicators in accordance with the guidelines contained in Appendix No. 2 of the Regulation of the Minister of Climate and Environment of 01.07.2021 on the detailed scope of data included in strategic noise maps, the manner of their presentation and the form of their transmission [66] were rounded to the nearest 100, i.e. according to the explanations in Annex VI of the Directive 2002/49/EC of the European Parliament and of the Council on standard methods of noise assessment ‘the numbers are rounded to the nearest hundred (i.e. 5 200 = between 5 150 and 5 249; 100 = between 50 and 149; 0 = less than 50).
Harmful effects of noise
Based on the data obtained, values were calculated for indicators to assess the harmful effects of environmental noise:
- significant annoyance (HA, from high annoyance),
- high sleep disturbance (HSD),
- ischaemic heart disease (IHD).
The results of the analyses are presented in Table 9.
Strategic noise map for district roads
Noise maps have been produced for all road routes, as indicated in Table 3. Three sections are presented below for visualisation:
4. Discussion
Noise maps are one tool to assess the scale of the noise problem for infrastructure managers [71,72,73]. The visualisation of noise levels on a map, together with the geo-referencing of data, makes it possible to clearly identify sites which require intervention or which will require a response in the long term. The issue of noise pollution in the context of building approvals should be included in the local spatial development plan. According to the measurements carried out, noise impact according to LDWN was found on 1.899 km2. This translates into an impact on approximately 1,200 residents living in the exceedance zone of the indicated indicator. In the case of LN, the exceedance occurs over an area of 1.220 km2 and affects around 700 residents. It should be noted, however, that none of the key indicators were referenced for the study area, i.e. LN: significant annoyance (HA, from high annoyance), high sleep disturbance (HSD) and ischaemic heart disease (IHD).
One of the most common solutions to reduce traffic noise is the use of noise barriers [74,75,76]. However, this measure is often ineffective due to difficult urban conditions and lack of space for their installation [77]. Minor noise exceedances can be reduced by using greenery in the road lane [78,79,80]. The main elements in the fight against traffic noise in cities are the use of noise protection measures consisting of proper traffic organisation [81,82] or the introduction of new solutions such as noise-reducing pavements[49].
As part of the results, the infrastructure manager decided to reduce noise levels by applying speed limits and increasing enforcement of existing speed limits [15,83]. For the short section of road with the highest exceedances, it was decided to ban heavy goods vehicle traffic [84,85]. In the next stages, it is planned to plant greenery in the road lane. Applying the indicated solutions has made it possible to reduce noise levels and eliminate the problem for the surveyed road sections.
Author Contributions
Conceptualization, P.J. , M.K., J.M. and A.K.; methodology, P.J. and M.K.; software, P.J. and M.K..; validation, J.M. and A.K.; formal analysis, P.J. , M.K., J.M. and A.K.; investigation, P.J. , M.K., J.M. and A.K.; resources, P.J. , M.K., J.M. and A.K.; data curation, P.J. and M.K.; writing—original draft preparation, P.J. , M.K., J.M. and A.K.; writing—review and editing, P.J. , M.K., J.M. and A.K.; visualization, P.J. and M.K.; supervision, X.X.; project administration, P.J. and M.K.; funding acquisition, P.J.. All authors have read and agreed to the published version of the manuscript.
Funding
This research received no external funding.
Conflicts of Interest
The authors declare no conflicts of interest.
References
- European Environment Agency., Environmental noise in Europe, 2020. LU: Publications Office, 2020. Dostęp: 6 grudzień 2024. [Online]. Dostępne na:. Available online: https://data.europa.eu/doi/10.2800/686249.
- A. L. Brown i I. v. Kamp, „WHO Environmental Noise Guidelines for the European Region: A Systematic Review of Transport Noise Interventions and Their Impacts on Health”, Int. J. Environ. Res. Public. Health, t. 14, nr 8, s. 873, 2017. [CrossRef]
- E. Ugnenko, V. E. Ugnenko, V. Gavrish, G. Viselga, G. Garbinčius, V. Turla, i S. Nagurnas, „EXPERIMENTAL STUDY OF CARRIAGEWAY OPERATIONAL CONDITION INFLUENCE ON ACOUSTIC ROADSIDE AREA POLLUTION”, Transport, t. 34, nr 5, s. 591–599, grudz. 2019. [CrossRef]
- K. Abdur-Rouf, „Measuring, Mapping, and Evaluating Daytime Traffic Noise Levels at Urban Road Intersections in Doha, Qatar”, Future Transp., 2022. [CrossRef]
- E. Bocher, G. E. Bocher, G. Guillaume, J. Picaut, G. Petit, i N. Fortin, „NoiseModelling: An Open Source GIS Based Tool to Produce Environmental Noise Maps”, Isprs Int. J. Geo-Inf., t. 8, nr 3, s. 130, 2019. [CrossRef]
- R. B. Smith i in., „Impact of London’s Road Traffic Air and Noise Pollution on Birth Weight: Retrospective Population Based Cohort Study”, BMJ, s. j5299, 2017. [CrossRef]
- H. L. Yadav i J. Yadav, „Traffic Noise and Its Risks on Human Health in India: A Systematic Review From 1990 to 2022”, Ecol. Environ. Conserv., t. 29, s. 191–205, 2023. [CrossRef]
- M. Jacyna, M. M. Jacyna, M. Wasiak, K. Lewczuk, i G. Karoń, „Noise and Environmental Pollution From Transport: Decisive Problems in Developing Ecologically Efficient Transport Systems”, J. Vibroengineering, t. 19, nr 7, s. 5639–5655, 2017. [CrossRef]
- L. Leipus, D. L. Leipus, D. Butkus, i T. Januševičius, „Research on Motor Transport Produced Noise on Gravel and Asphalt Roads”, Balt. J. Road Bridge Eng., t. 5, nr 3, s. 125–131, wrz. 2010. [CrossRef]
- L. Paulauskas i R. Klimas, „MODELING OF THE SPREAD OF MOTOR TRANSPORT NOISE IN ŠIAULIAI CITY / AUTOTRANSPORTO TRIUKŠMO SKLAIDOS ŠIAULIUOSE MODELIAVIMAS / МОДЕЛИРОВАНИЕ РАССЕЯНИЯ ТРАНСПОРТНОГО ШУМА В ГОРОДЕ ШЯУЛЯЙ”, J. Environ. Eng. Landsc. Manag., t. 19, nr 1, s. 62–70, kwi. 2011. [CrossRef]
- B. Jakovljevic, K. B. Jakovljevic, K. Paunovic, i G. Belojevic, „Road-traffic noise and factors influencing noise annoyance in an urban population”, Environ. Int., t. 35, nr 3, s. 552–556, kwi. 2009. [CrossRef]
- C. Camusso i C. Pronello, „A study of relationships between traffic noise and annoyance for different urban site typologies”, Transp. Res. Part Transp. Environ., t. 44, s. 122–133, maj 2016. [CrossRef]
- D. Khan i R. Burdzik, „A review on different regulation for the measurement of transport noise and vibration”, J. Meas. Eng., t. 11, nr 2, s. 196–213, cze. 2023. [CrossRef]
- I. Sippel, K. I. Sippel, K. Magdin, i S. Evtyukov, „Study of traffic noise exposure on street and road networks in a megapolis”, E3S Web Conf., t. 431, s. 08005, 2023. [CrossRef]
- T. Vilniškis, A. T. Vilniškis, A. Naimušin, i T. Januševičius, „INVESTIGATION AND MODELING OF TRANSPORT NOISE DEPENDENCE ON TRAFFIC SPEED AND IMPACT ON POPULATION ANNOYANCE”, J. Environ. Eng. Landsc. Manag., t. 30, nr 1, s. 22–29, sty. 2022. [CrossRef]
- A. Pyko i in., „Long-Term Exposure to Transportation Noise and Ischemic Heart Disease: A Pooled Analysis of Nine Scandinavian Cohorts”, Environ. Health Perspect., t. 131, nr 1, 2023. [CrossRef]
- M. Sørensen i in., „Road Traffic Noise and Incident Myocardial Infarction: A Prospective Cohort Study”, PLoS ONE, t. 7, nr 6, s. e39283, cze. 2012. [CrossRef]
- W. Babisch, „Updated exposure-response relationship between road traffic noise and coronary heart diseases: A meta-analysis”, Noise Health, t. 16, nr 68, s. 1, 2014. [CrossRef]
- J. Tagusari i T. Matsui, „Estimation of Health Risk Posed by Road Traffic Noise in Japan Based on the Environmental Noise Guidelines for the European Region”, Nippon Eiseigaku Zasshi, t. 76, nr 0, s. n/a, 2021. [CrossRef]
- J. Hegewald i in., „Traffic Noise and Mental Health: A Systematic Review and Meta-Analysis”, Int. J. Environ. Res. Public. Health, t. 17, nr 17, s. 6175, 2020. [CrossRef]
- K. V. F. Weyde i in., „Road Traffic Noise and Children’s Inattention”, Environ. Health, t. 16, nr 1, 2017. [CrossRef]
- M. Schubert i in., „Traffic-Related High Sleep Disturbance in the LIFE-Adult Cohort Study: A Comparison to the WHO Exposure-Response-Curves”, Int. J. Environ. Res. Public. Health, t. 20, nr 6, s. 4903, mar. 2023. [CrossRef]
- B. Orban i in., „Residential Road Traffic Noise and High Depressive Symptoms after Five Years of Follow-up: Results from the Heinz Nixdorf Recall Study”, Environ. Health Perspect., t. 124, nr 5, s. 578–585, maj 2016. [CrossRef]
- S. Perron, C. S. Perron, C. Plante, M. S. Ragettli, D. J. Kaiser, S. Goudreau, i A. Smargiassi, „Sleep Disturbance From Road Traffic, Railways, Airplanes and From Total Environmental Noise Levels in Montreal”, Int. J. Environ. Res. Public. Health, 2016. [CrossRef]
- J. H. Sung, J. J. H. Sung, J. Lee, S. J. Park, i C. S. Sim, „Relationship of Transportation Noise and Annoyance for Two Metropolitan Cities in Korea: Population Based Study”, PLOS ONE, t. 11, nr 12, s. e0169035, grudz. 2016. [CrossRef]
- J. Méline, A. J. Méline, A. Van Hulst, F. Thomas, N. Karusisi, i B. Chaix, „Transportation noise and annoyance related to road traffic in the French RECORD study”, Int. J. Health Geogr., t. 12, nr 1, s. 44, 2013. [CrossRef]
- R. Guski, D. R. Guski, D. Schreckenberg, i R. Schuemer, „WHO Environmental Noise Guidelines for the European Region: A Systematic Review on Environmental Noise and Annoyance”, Int. J. Environ. Res. Public. Health, t. 14, nr 12, s. 1539, 2017. [CrossRef]
- M. Foraster i in., „High Blood Pressure and Long-Term Exposure to Indoor Noise and Air Pollution From Road Traffic”, Environ. Health Perspect., t. 122, nr 11, s. 1193–1200, 2014. [CrossRef]
- M. Foraster i in., „Exposure to Road, Railway, and Aircraft Noise and Arterial Stiffness in the SAPALDIA Study: Annual Average Noise Levels and Temporal Noise Characteristics”, Environ. Health Perspect., t. 125, nr 9, 2017. [CrossRef]
- M. J. Zare Sakhvidi, F. M. J. Zare Sakhvidi, F. Zare Sakhvidi, A. H. Mehrparvar, M. Foraster, i P. Dadvand, „Association between noise exposure and diabetes: A systematic review and meta-analysis”, Environ. Res., t. 166, s. 647–657, paź. 2018. [CrossRef]
- M. Foraster i in., „Long-term transportation noise annoyance is associated with subsequent lower levels of physical activity”, Environ. Int., t. 91, s. 341–349, maj 2016. [CrossRef]
- M. Kondo, J. M. Kondo, J. Fluehr, T. McKeon, i C. Branas, „Urban Green Space and Its Impact on Human Health”, Int. J. Environ. Res. Public. Health, t. 15, nr 3, s. 445, mar. 2018. [CrossRef]
- A. K. Sahu, S. A. K. Sahu, S. Nayak, C. R. Mohanty, i P. K. Pradhan, „Archives of Acoustics”, 2021. [CrossRef]
- M. Wrótny i J. Bohatkiewicz, „Impact of Railway Noise on People Based on Strategic Acoustic Maps”, Sustainability, t. 12, nr 14, s. 5637, lip. 2020. [CrossRef]
- K. Konstantopoulos, A. K. Konstantopoulos, A. Moustakas, i I. N. Vogiatzakis, „A spatially explicit impact assessment of road characteristics, road-induced fragmentation and noise on birds species in Cyprus”, Biodiversity, t. 21, nr 1, s. 61–71, sty. 2020. [CrossRef]
- A. Ortiz-Urbina, L. A. Ortiz-Urbina, L. Diaz-Balteiro, i C. Iglesias-Merchan, „Influence of Anthropogenic Noise for Predicting Cinereous Vulture Nest Distribution”, Sustainability, t. 12, nr 2, s. 503, sty. 2020. [CrossRef]
- J. Tagusari, „H-RISK with NoiseModelling: a QGIS plugin to predictenvironmental noise and estimate health risks”, J. Open Source Softw., t. 9, nr 93, s. 6023, sty. 2024. [CrossRef]
- F. E. Selamat, J. F. E. Selamat, J. Tagusari, i T. Matsui, „Mapping of transportation noise-induced health risks as an alternative tool for risk communication with local residents”, Appl. Acoust., t. 178, s. 107987, lip. 2021. [CrossRef]
- G. Meller, W. M. G. Meller, W. M. De Lourenço, V. S. G. De Melo, i G. De Campos Grigoletti, „Use of noise prediction models for road noise mapping in locations that do not have a standardized model: a short systematic review”, Environ. Monit. Assess., t. 195, nr 6, s. 740, cze. 2023. [CrossRef]
- M. Arana, R. M. Arana, R. San Martin, i J. C. Salinas, „People exposed to traffic noise in european agglomerations from noise maps. A critical review”, Noise Mapp., t. 1, nr 1, sty. 2014. [CrossRef]
- E. A. King i E. Murphy, „Environmental noise – ‘Forgotten’ or ‘Ignored’ pollutant?”, Appl. Acoust., t. 112, s. 211–215, lis. 2016. [CrossRef]
- M. Birk, O. M. Birk, O. Ivina, S. v. Klot, W. Babisch, i J. Heinrich, „Road Traffic Noise: Self-Reported Noise Annoyance Versus GIS Modelled Road Traffic Noise Exposure”, J. Environ. Monit., t. 13, nr 11, s. 3237, 2011. [CrossRef]
- C. R. Bragdon, „Noise Control in Urban Planning”, J. Urban Plan. Dev. Div., t. 99, nr 1, s. 15–23, mar. 1973. [CrossRef]
- J. M. B. Morillas, G. R. J. M. B. Morillas, G. R. Gozalo, D. M. González, P. A. Moraga, i R. Vílchez-Gómez, „Noise Pollution and Urban Planning”, Curr. Pollut. Rep., t. 4, nr 3, s. 208–219, wrz. 2018. [CrossRef]
- D. Naish, „A method of developing regional road traffic noise management strategies”, Appl. Acoust., t. 71, nr 7, s. 640–652, lip. 2010. [CrossRef]
- M. Perna i in., „Comparison of Road Noise Policies across Australia, Europe, and North America”, Int. J. Environ. Res. Public. Health, t. 19, nr 1, s. 173, grudz. 2021. [CrossRef]
- E. Lezhneva, K. E. Lezhneva, K. Vakulenko, i A. Galkin, „Assessment of Traffic Noise Pollution Due to Urban Residential Road Transport”, Romanian J. Transp. Infrastruct., t. 8, nr 1, s. 34–52, lip. 2019. [CrossRef]
- D. Butkus i T. Januševičius, „Investigation of the variation of noise spectrum behind noise barriers made of different materials”, w The 9th International Conference „Environmental Engineering 2014”, Vilnius, Lithuania: Vilnius Gediminas Technical University Press “Technika” 2014, 2014. [CrossRef]
- F. I. Lai, Z. F. I. Lai, Z. Huang, i F. Guo, „Noise Reduction Characteristics of Macroporous Asphalt Pavement Based on a Weighted Sound Pressure Level Sensor”, Materials, t. 14, nr 16, s. 4356, 2021. [CrossRef]
- E. Freitas, J. E. Freitas, J. Lamas, C. Silva, F. Soares, S. Mouta, i J. Santos, „Tyre/Road Noise Annoyance Assessment Through Virtual Sounds”, w Advances in Noise Analysis, Mitigation and Control, N. Ahmed, Red., InTech, 2016. [CrossRef]
- A. Miškinytė i A. Dėdelė, „Evaluation and analysis of traffic noise level in Kaunas city”, w The 9th International Conference „Environmental Engineering 2014”, Vilnius, Lithuania: Vilnius Gediminas Technical University Press “Technika” 2014, 2014. [CrossRef]
- M. Koniak, P. M. Koniak, P. Jaskowski, i K. Tomczuk, „Review of Economic, Technical and Environmental Aspects of Electric Vehicles”, Sustainability, t. 16, nr 22, s. 9849, lis. 2024. [CrossRef]
- D. Briggs, K. D. Briggs, K. Mason, i B. Borman, „Rapid Assessment of Environmental Health Impacts for Policy Support: The Example of Road Transport in New Zealand”, Int. J. Environ. Res. Public. Health, t. 13, nr 1, s. 61, grudz. 2015. [CrossRef]
- X. Zhang, H. X. Zhang, H. Kuehnelt, i W. D. Roeck, „Traffic Noise Prediction Applying Multivariate Bi-Directional Recurrent Neural Network”, Appl. Sci., 2021. [CrossRef]
- S. Gössling, A. S. Gössling, A. Humpe, T. Litman, i D. Metzler, „Effects of Perceived Traffic Risks, Noise, and Exhaust Smells on Bicyclist Behaviour: An Economic Evaluation”, Sustainability, t. 11, nr 2, s. 408, sty. 2019. [CrossRef]
- S. Clark i in., „Space-Time Characterization of Community Noise and Sound Sources in Accra, Ghana”, Sci. Rep., t. 11, nr 1, 2021. [CrossRef]
- Department of Civil Engineering, National Institute of Technology Raipur, Chhattisgarh 492001, India, V. Kumar, A. V. Ahirwar, i A. D. Prasad, „A Review on Noise Pollution Monitoring, Mapping, Modelling, and Health Impacts”, J. Environ. Inform. Lett., 2023. [CrossRef]
- A. Ongel, „Inclusion of Noise in Environmental Assessment of Road Transportation”, Environ. Model. Assess., t. 21, nr 2, s. 181–192, kwi. 2016. [CrossRef]
- I. Hanigan i in., „A Statistical Downscaling Approach for Generating High Spatial Resolution Health Risk Maps: A Case Study of Road Noise and Ischemic Heart Disease Mortality in Melbourne, Australia”, Int. J. Health Geogr., t. 18, nr 1, 2019. [CrossRef]
- W. K. Adza, A. W. K. Adza, A. Hursthouse, J. Miller, i D. Boakye, „Exploring the Combined Association Between Road Traffic Noise and Air Quality Using QGIS”, Int. J. Environ. Res. Public. Health, t. 19, nr 24, s. 17057, 2022. [CrossRef]
- A. Suyunov, „Innovative Solutions in Creating Noise Maps in Cities”, E3s Web Conf., t. 463, s. 02007, 2023. [CrossRef]
- I. Lakawa, „Noise Mapping Due to Motor Vehicle Activities in the by-Pass Ring Road Area of the City of Kendari”, Przegląd Nauk. Inż. Kształt. Śr., t. 32, nr 4, s. 392–406, 2023. [CrossRef]
- O. Ghaffarpasand, „Traffic Noise Assessment Using Intelligent Acoustic Sensors (Traffic Ear) and Vehicle Telematics Data”, Sensors, t. 23, nr 15, s. 6964, 2023. [CrossRef]
- Decree of Minister of Environment of 14 June 2007 on permissible levels of noise in the environment, , Journal of Laws, No 120, item 826.
- Decree of the Minister for the Environment of 1 October 2012 amending the Ordinance on permissible levels of noise in the environment, (Journal of Laws 2012 No. 0, item 1109).
- Regulation of the Minister of Climate and Environment of 1 July 2021 on the detailed scope of data included in strategic noise maps, the manner of their presentation and the form of their transmission (Journal of Laws of 2021, item 1325).
- Directive 2002/49/EC of the European Parliament and of the Council of relating to the assessment and management of environmental noise–Declaration by the Commission in the Conciliation Committee on the Directive relating to the assessment and management of environmental noise.
- Regulation of the Minister of the Environment of on the requirements for the measurement of the levels of substances or energy in the environment by the manager of a road, railway line, tramway line, airport or port (Journal of Laws of 2011, No. 140, item 824, as amended).
- Decree of Minister of Environment of on the establishment of the noise indicator LDWN, Journal of Laws, No 215, item 1414.
- „Statistics Poland”. [Online]. Dostępne na:. Available online: https://stat.gov.pl/en/.
- P. Alam, Mohd. A. Mazhar, K. Ahmad, Z. Aslam, S. S. Afsar, i A. Husain, „Comparative Assessment of Road Traffic Noise Through 2D Noise Mapping: A Case Study of an Urban Area”, Front. Sustain., t. 3, 2022. [CrossRef]
- N. Akhtar, K. N. Akhtar, K. Ahmad, i P. Alam, „Noise Monitoring and Mapping for Some Pre-Selected Locations of New Delhi, India”, Fluct. Noise Lett., t. 15, nr 02, s. 1650019, 2016. [CrossRef]
- M. A. Zytoon, „Opportunities for Environmental Noise Mapping in Saudi Arabia: A Case of Traffic Noise Annoyance in an Urban Area in Jeddah City”, Int. J. Environ. Res. Public. Health, t. 13, nr 5, s. 496, 2016. [CrossRef]
- L. Fredianelli, A. D. L. Fredianelli, A. D. Pizzo, i G. Licitra, „Recent Developments in Sonic Crystals as Barriers for Road Traffic Noise Mitigation”, Environments, 2019. [CrossRef]
- H. M. Lee, W. H. M. Lee, W. Luo, J. Xie, i H. P. Lee, „Traffic Noise Reduction Strategy in a Large City and an Analysis of Its Effect”, Appl. Sci., 2022. [CrossRef]
- M. R. Monazzam i S. M. Bellah Fard, „A Study on the Effect of Different Median Barrier Shapes in Presence of Single or Parallel Noise Screens”, Adv. Mater. Res., 2011. [CrossRef]
- K. L. Bar-Sinai, T. K. L. Bar-Sinai, T. Shaked, E. S. Fettahoglu, J. Krimm, i W. Boucsein, „Embedding Acoustic Analysis in Landscape Architecture Design Processes: A Case Study of Munich Airport”, Buildings, 2023. [CrossRef]
- T. Samara i T. Tsitsoni, „The Effects of Vegetation on Reducing Traffic Noise From a City Ring Road”, Noise Control Eng. J., 2011. [CrossRef]
- T. Sultan, „Investigation of Tree Characteristics for Traffic Noise Abatement”, Environ. Prot. Eng., 2024. [CrossRef]
- T. V. Renterghem, „Exploiting Supporting Poles to Increase Road Traffic Noise Shielding of Tree Belts”, Acta Acust. United Acust., 2016. [CrossRef]
- E. A. King, E. E. A. King, E. Murphy, i H. J. Rice, „Evaluating the Impact on Noise Levels of a Ban on Private Cars in Dublin City Centre, Ireland”, Transp. Res. Part Transp. Environ., 2011. [CrossRef]
- M. M. Zefreh i Á. Török, „Theoretical Comparison of the Effects of Different Traffic Conditions on Urban Road Traffic Noise”, J. Adv. Transp., 2018. [CrossRef]
- J. Borst, W. J. Borst, W. Lohman, A. R. Eisses, i H. S. Miedema, „Decision Support System for Action Planning in the Framework of the European Noise Directive”, J. Acoust. Soc. Am., 2008. [CrossRef]
- O. Mironyuk, „Assessment of the Noise Level on Arterial Streets Depending on Traffic Flow Indicators”, Transp. Technol., 2021. [CrossRef]
- M. Yuan, Z. M. Yuan, Z. Wu, H. Wang, i J. Chen, „Impact Evaluation of Different Network Planning Concepts on Traffic Noise”, Noise Vib. Worldw., 2023. [CrossRef]
Figure 1.
Noise immission map showing noise expressed by LDWN.
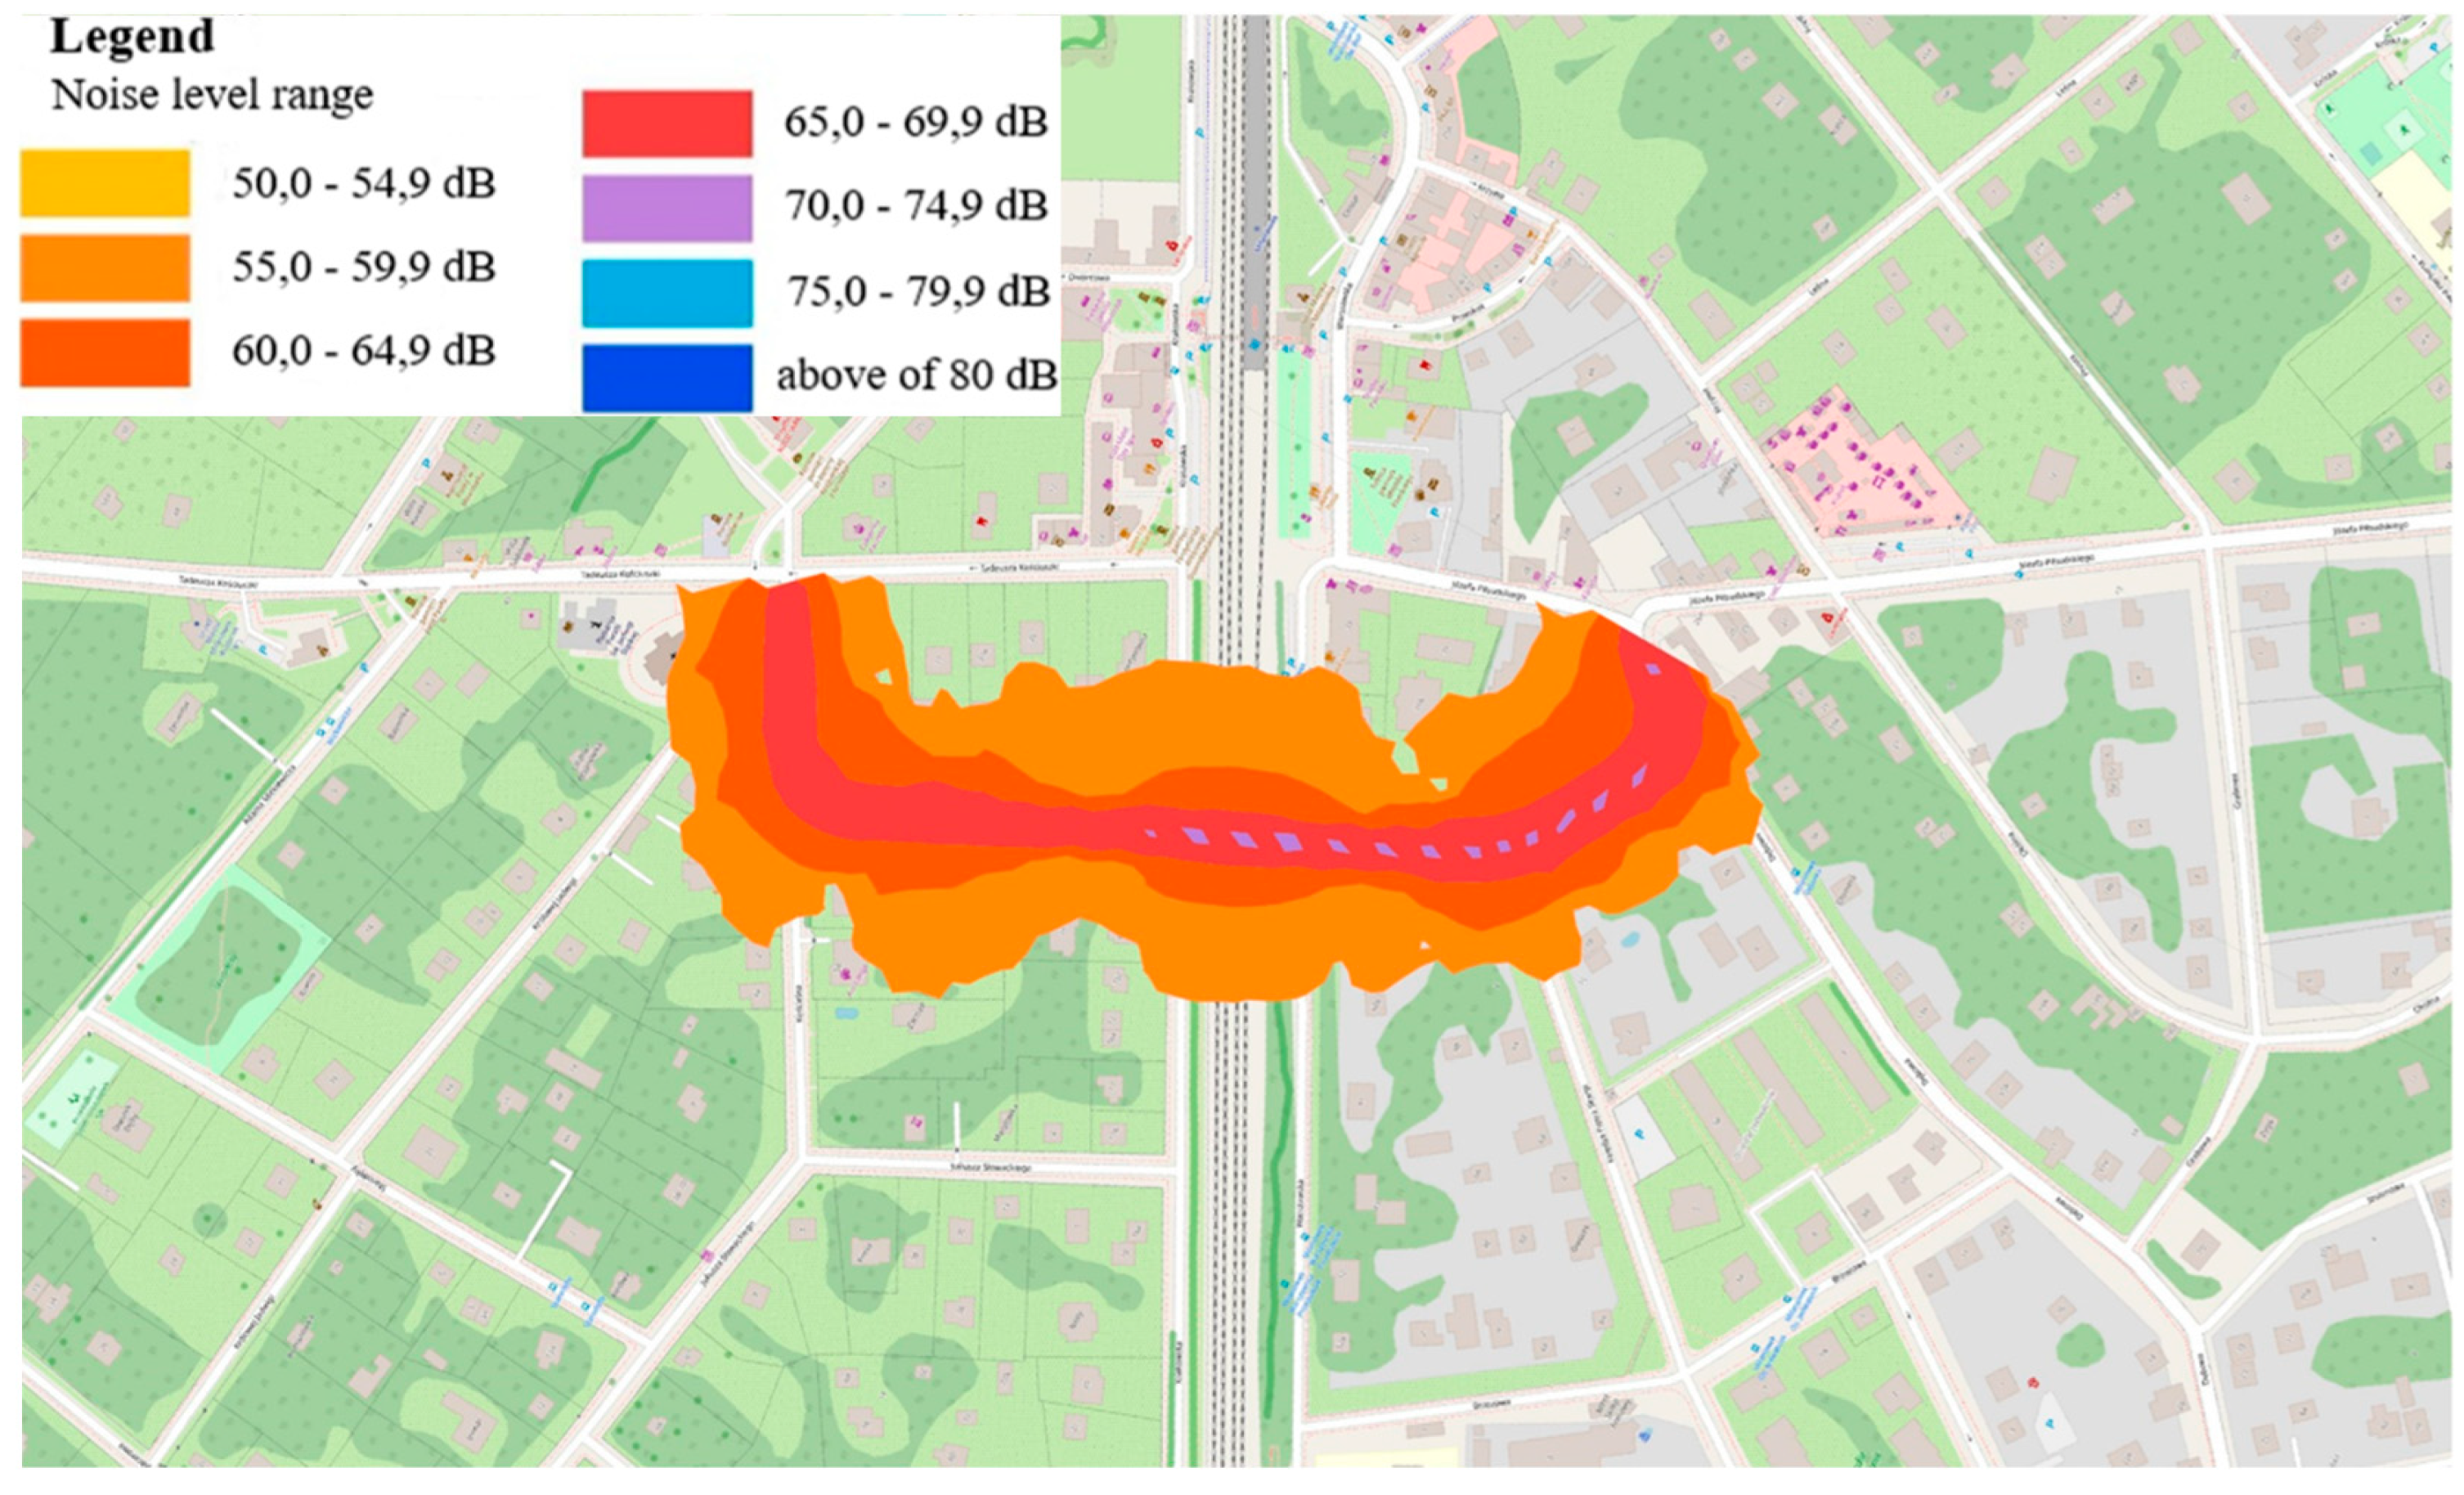
Figure 2.
Noise immission map showing noise expressed by LDWN.
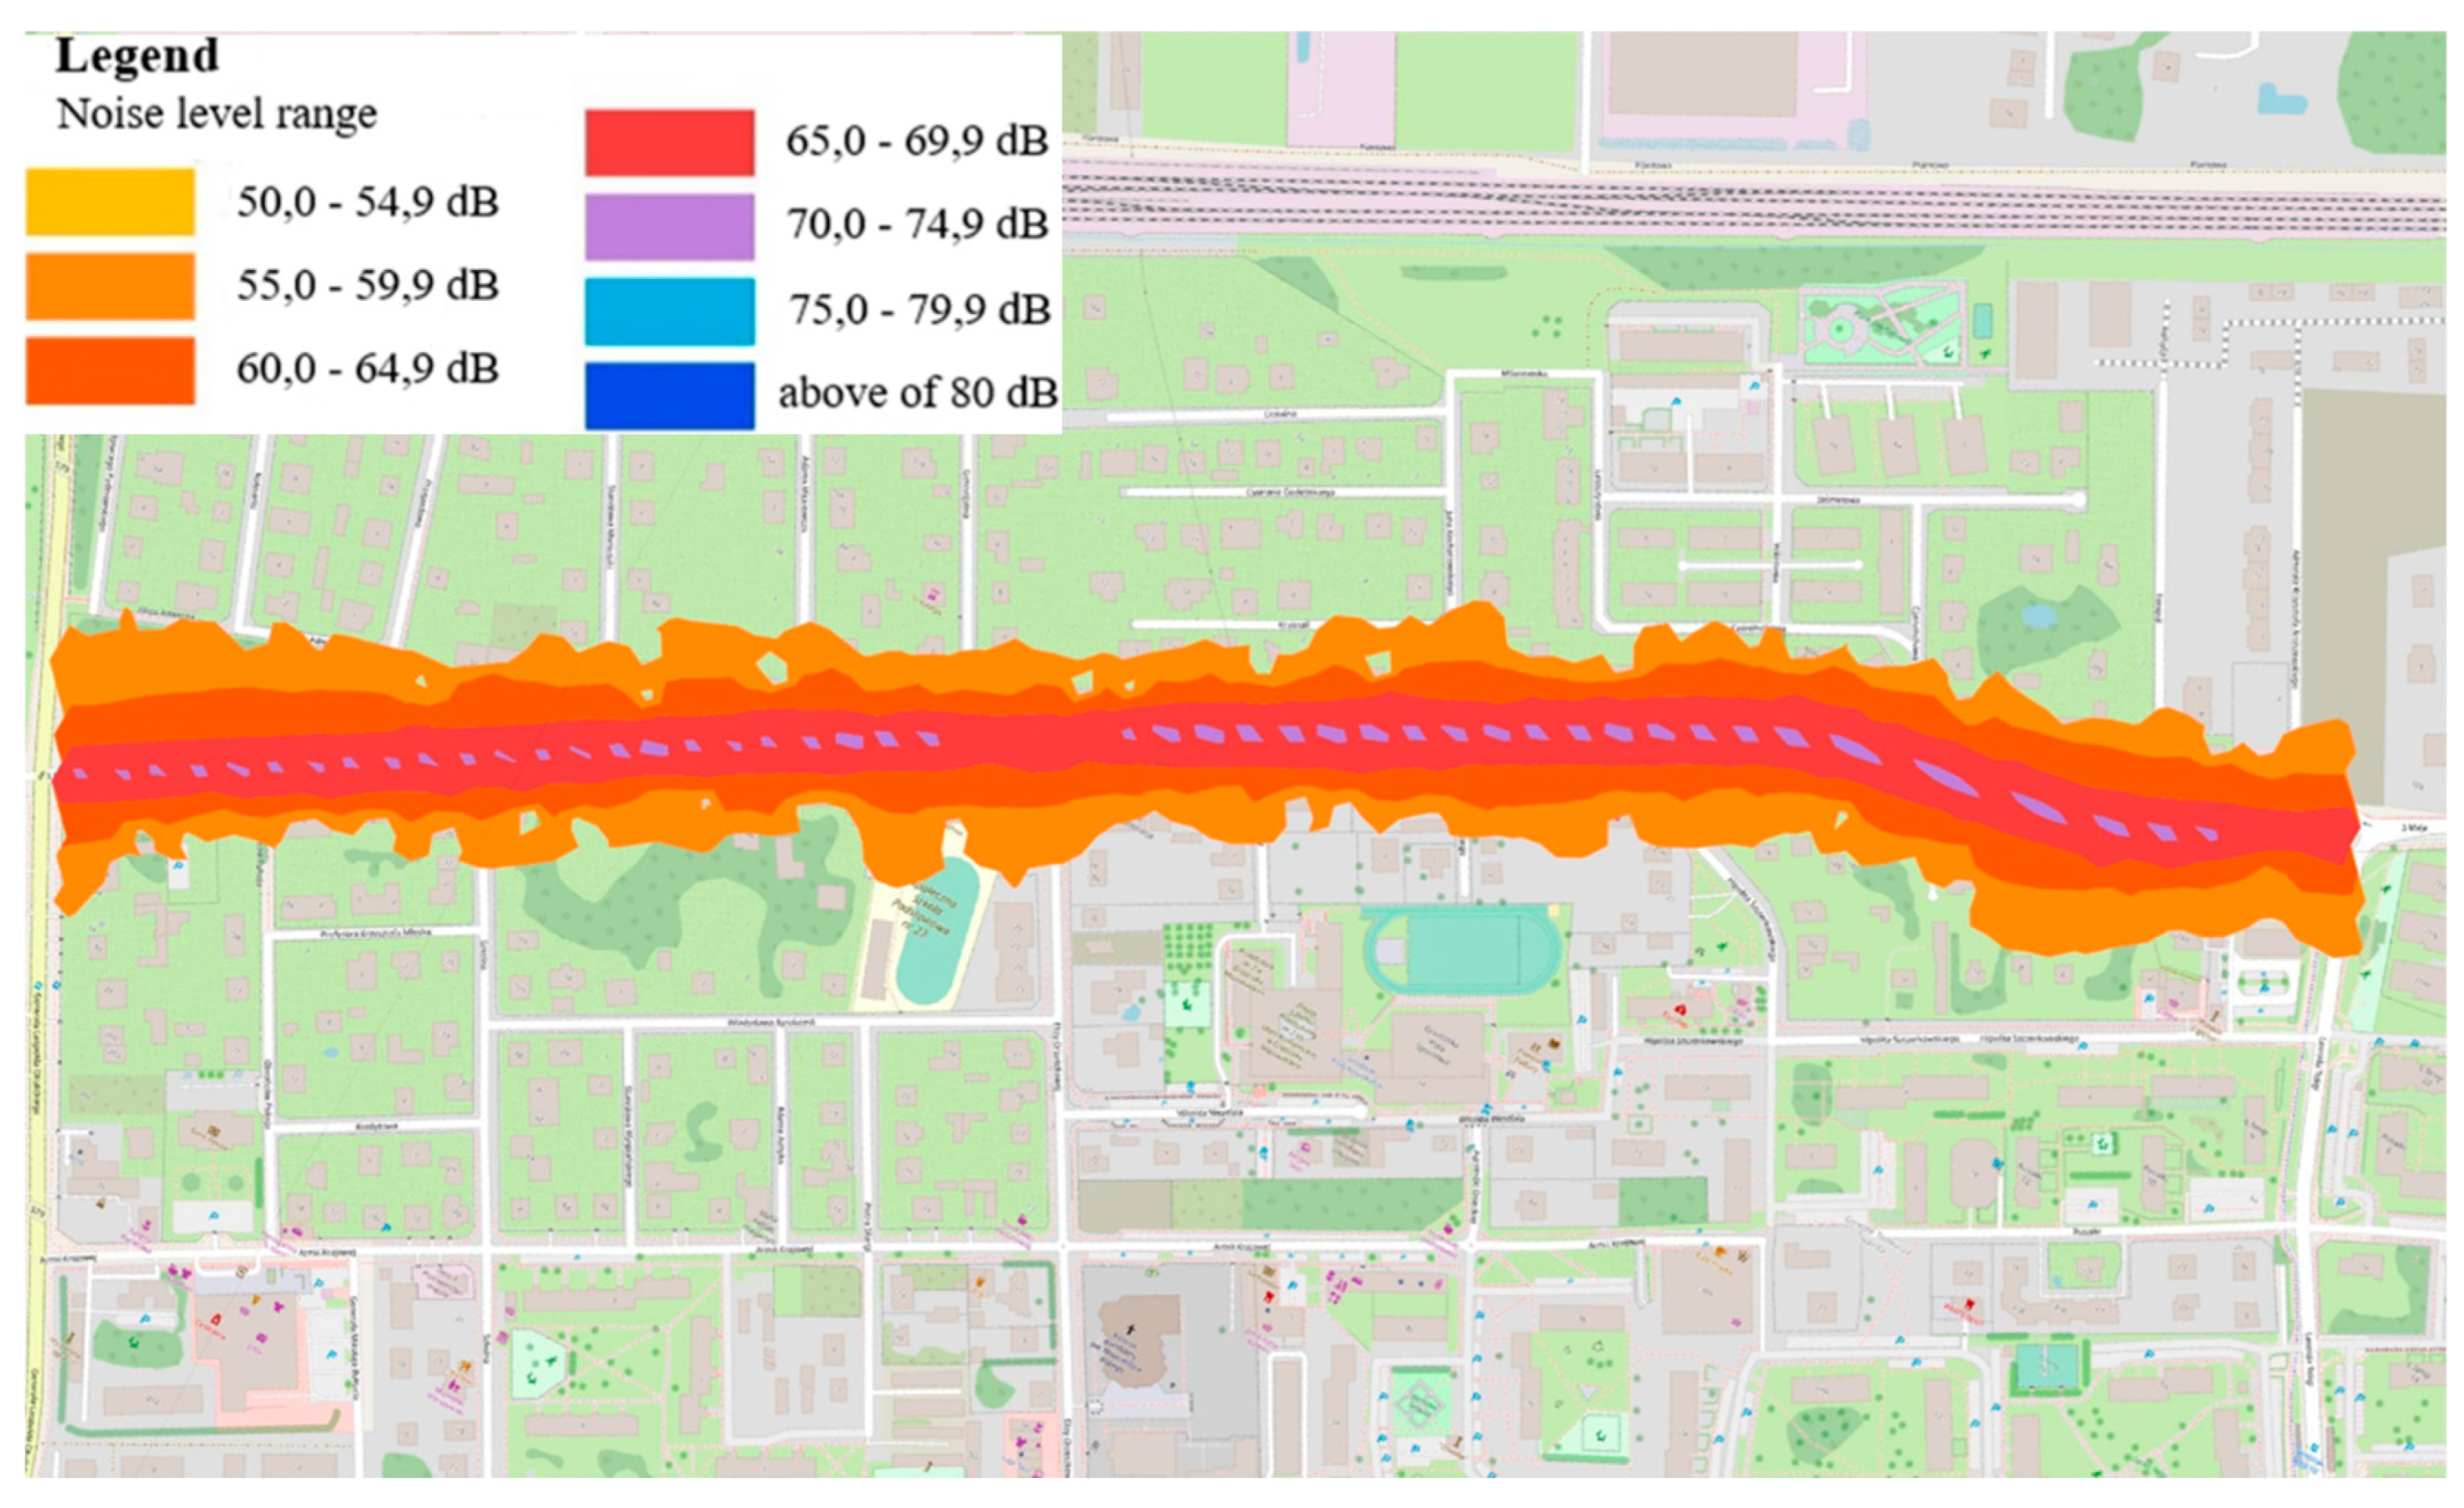
Figure 3.
Noise immission map showing noise expressed by LDWN.
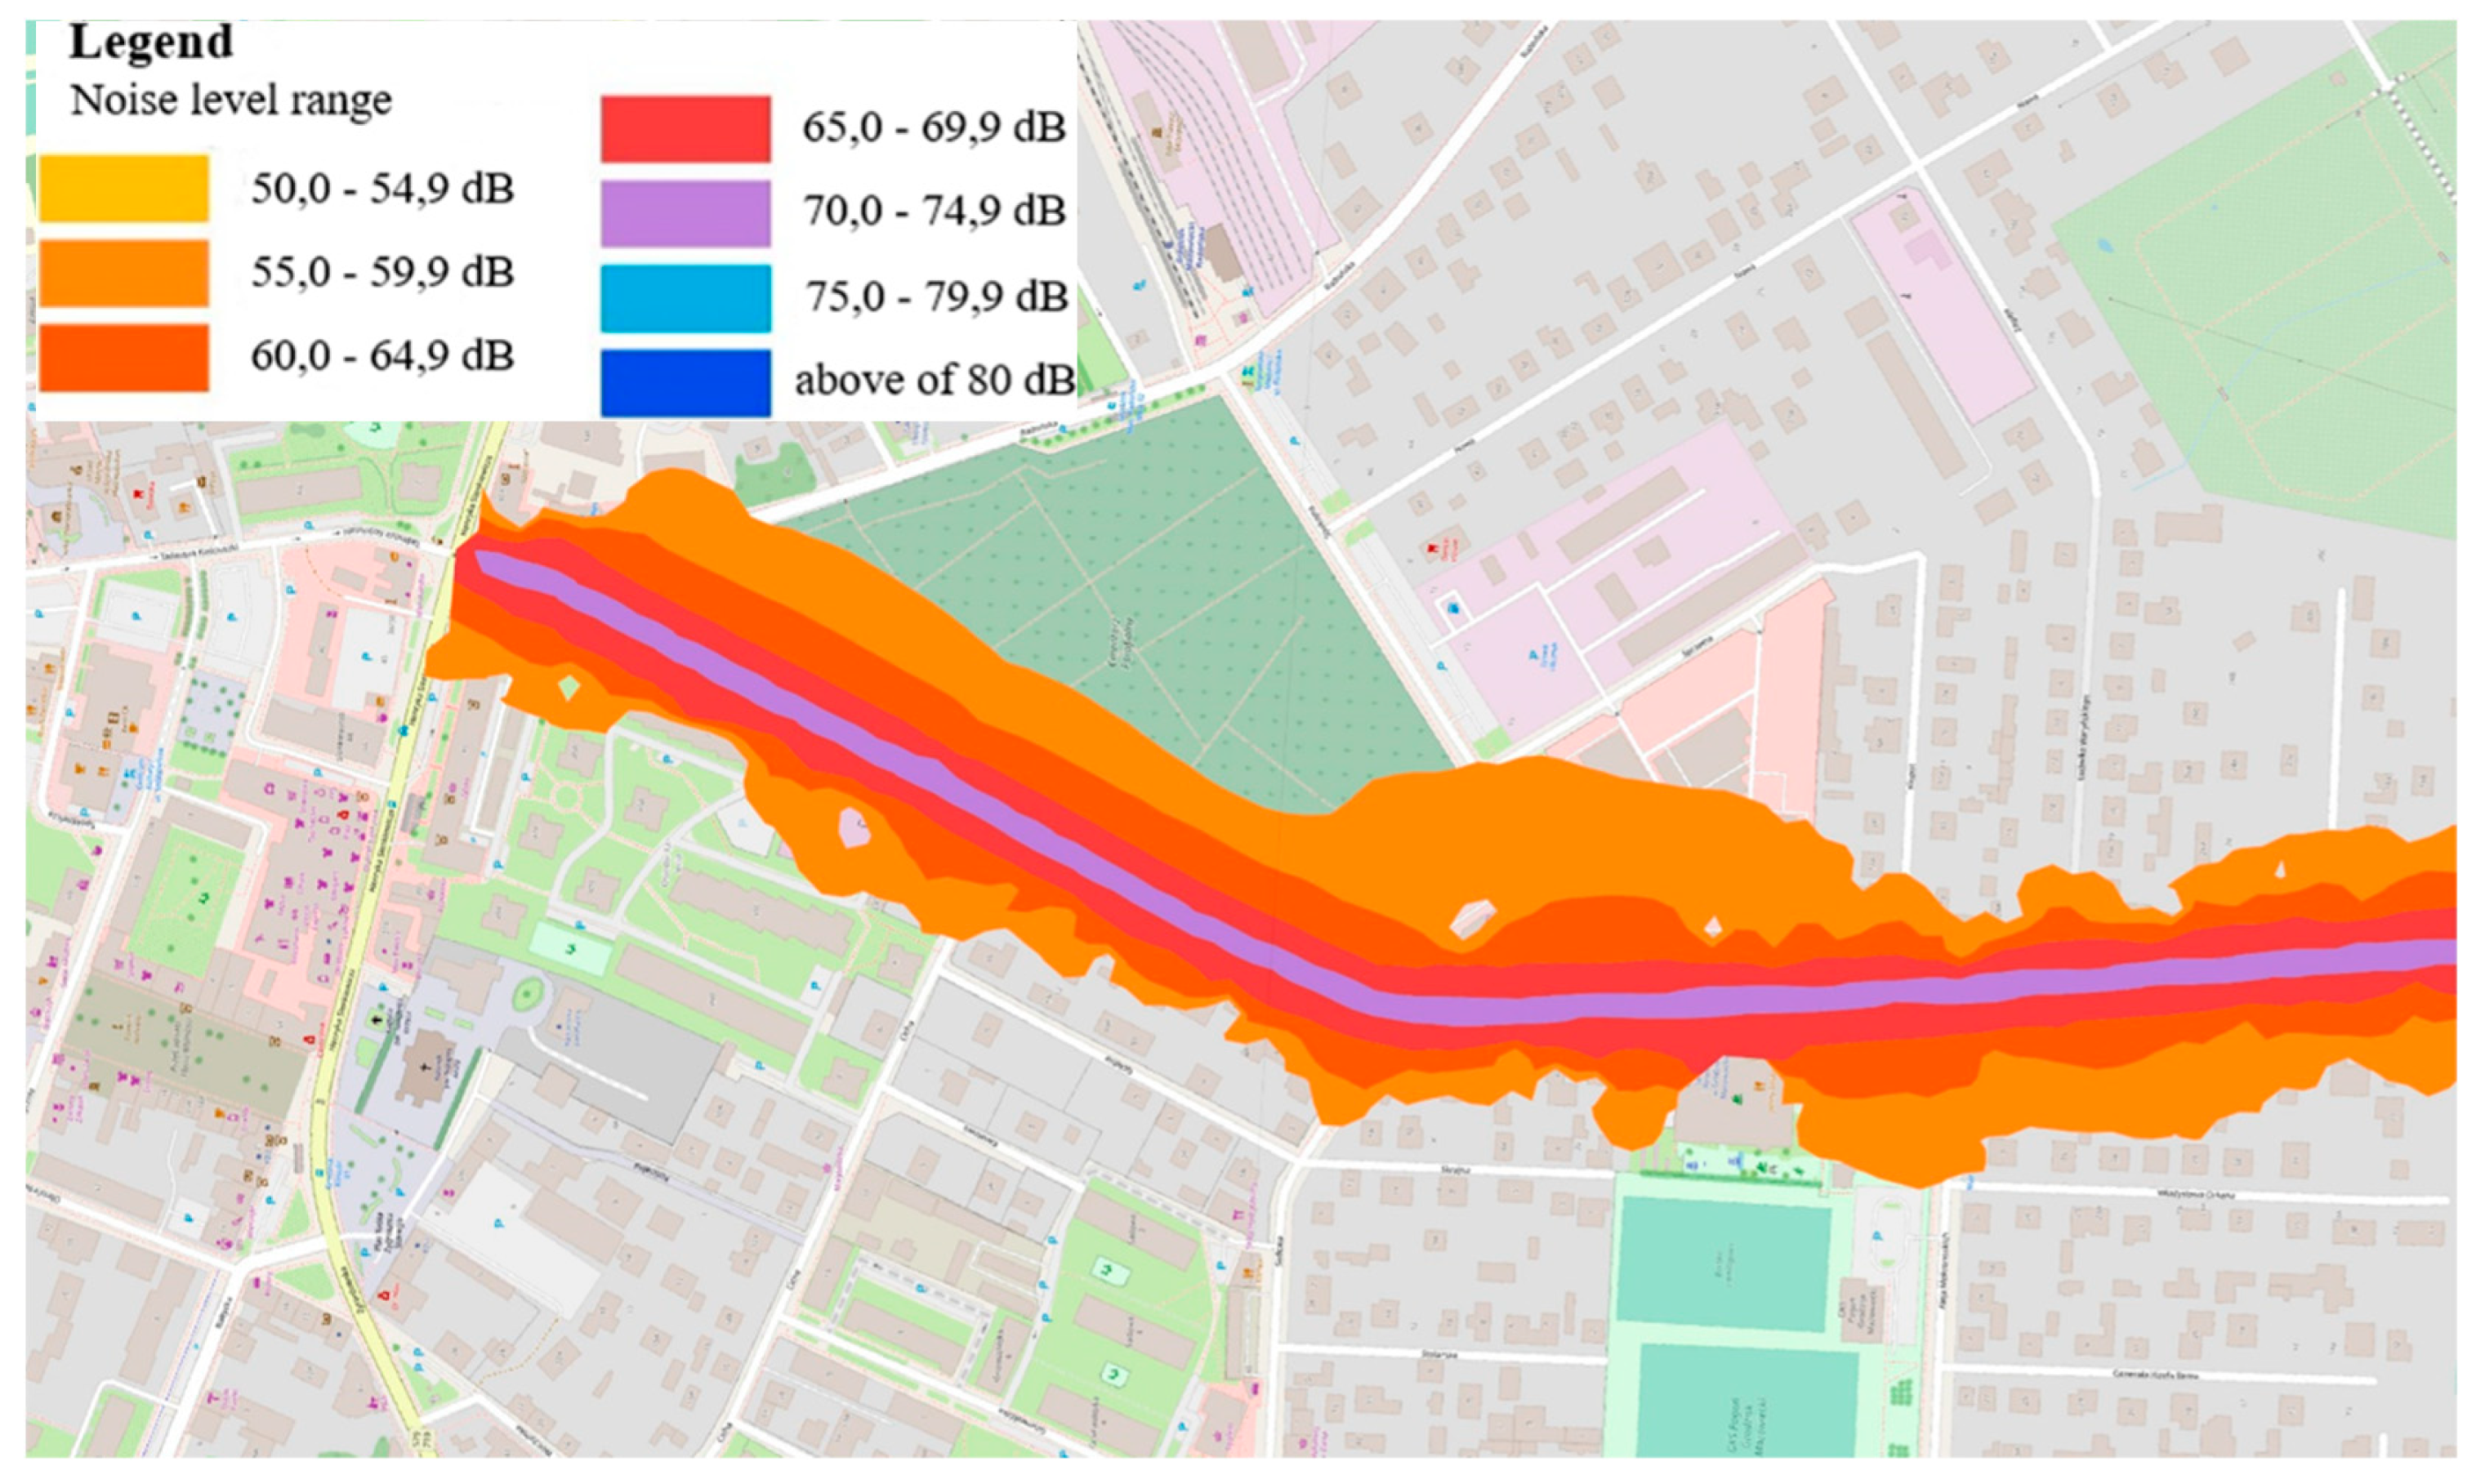
Figure 4.
Immission map showing noise expressed as LN.
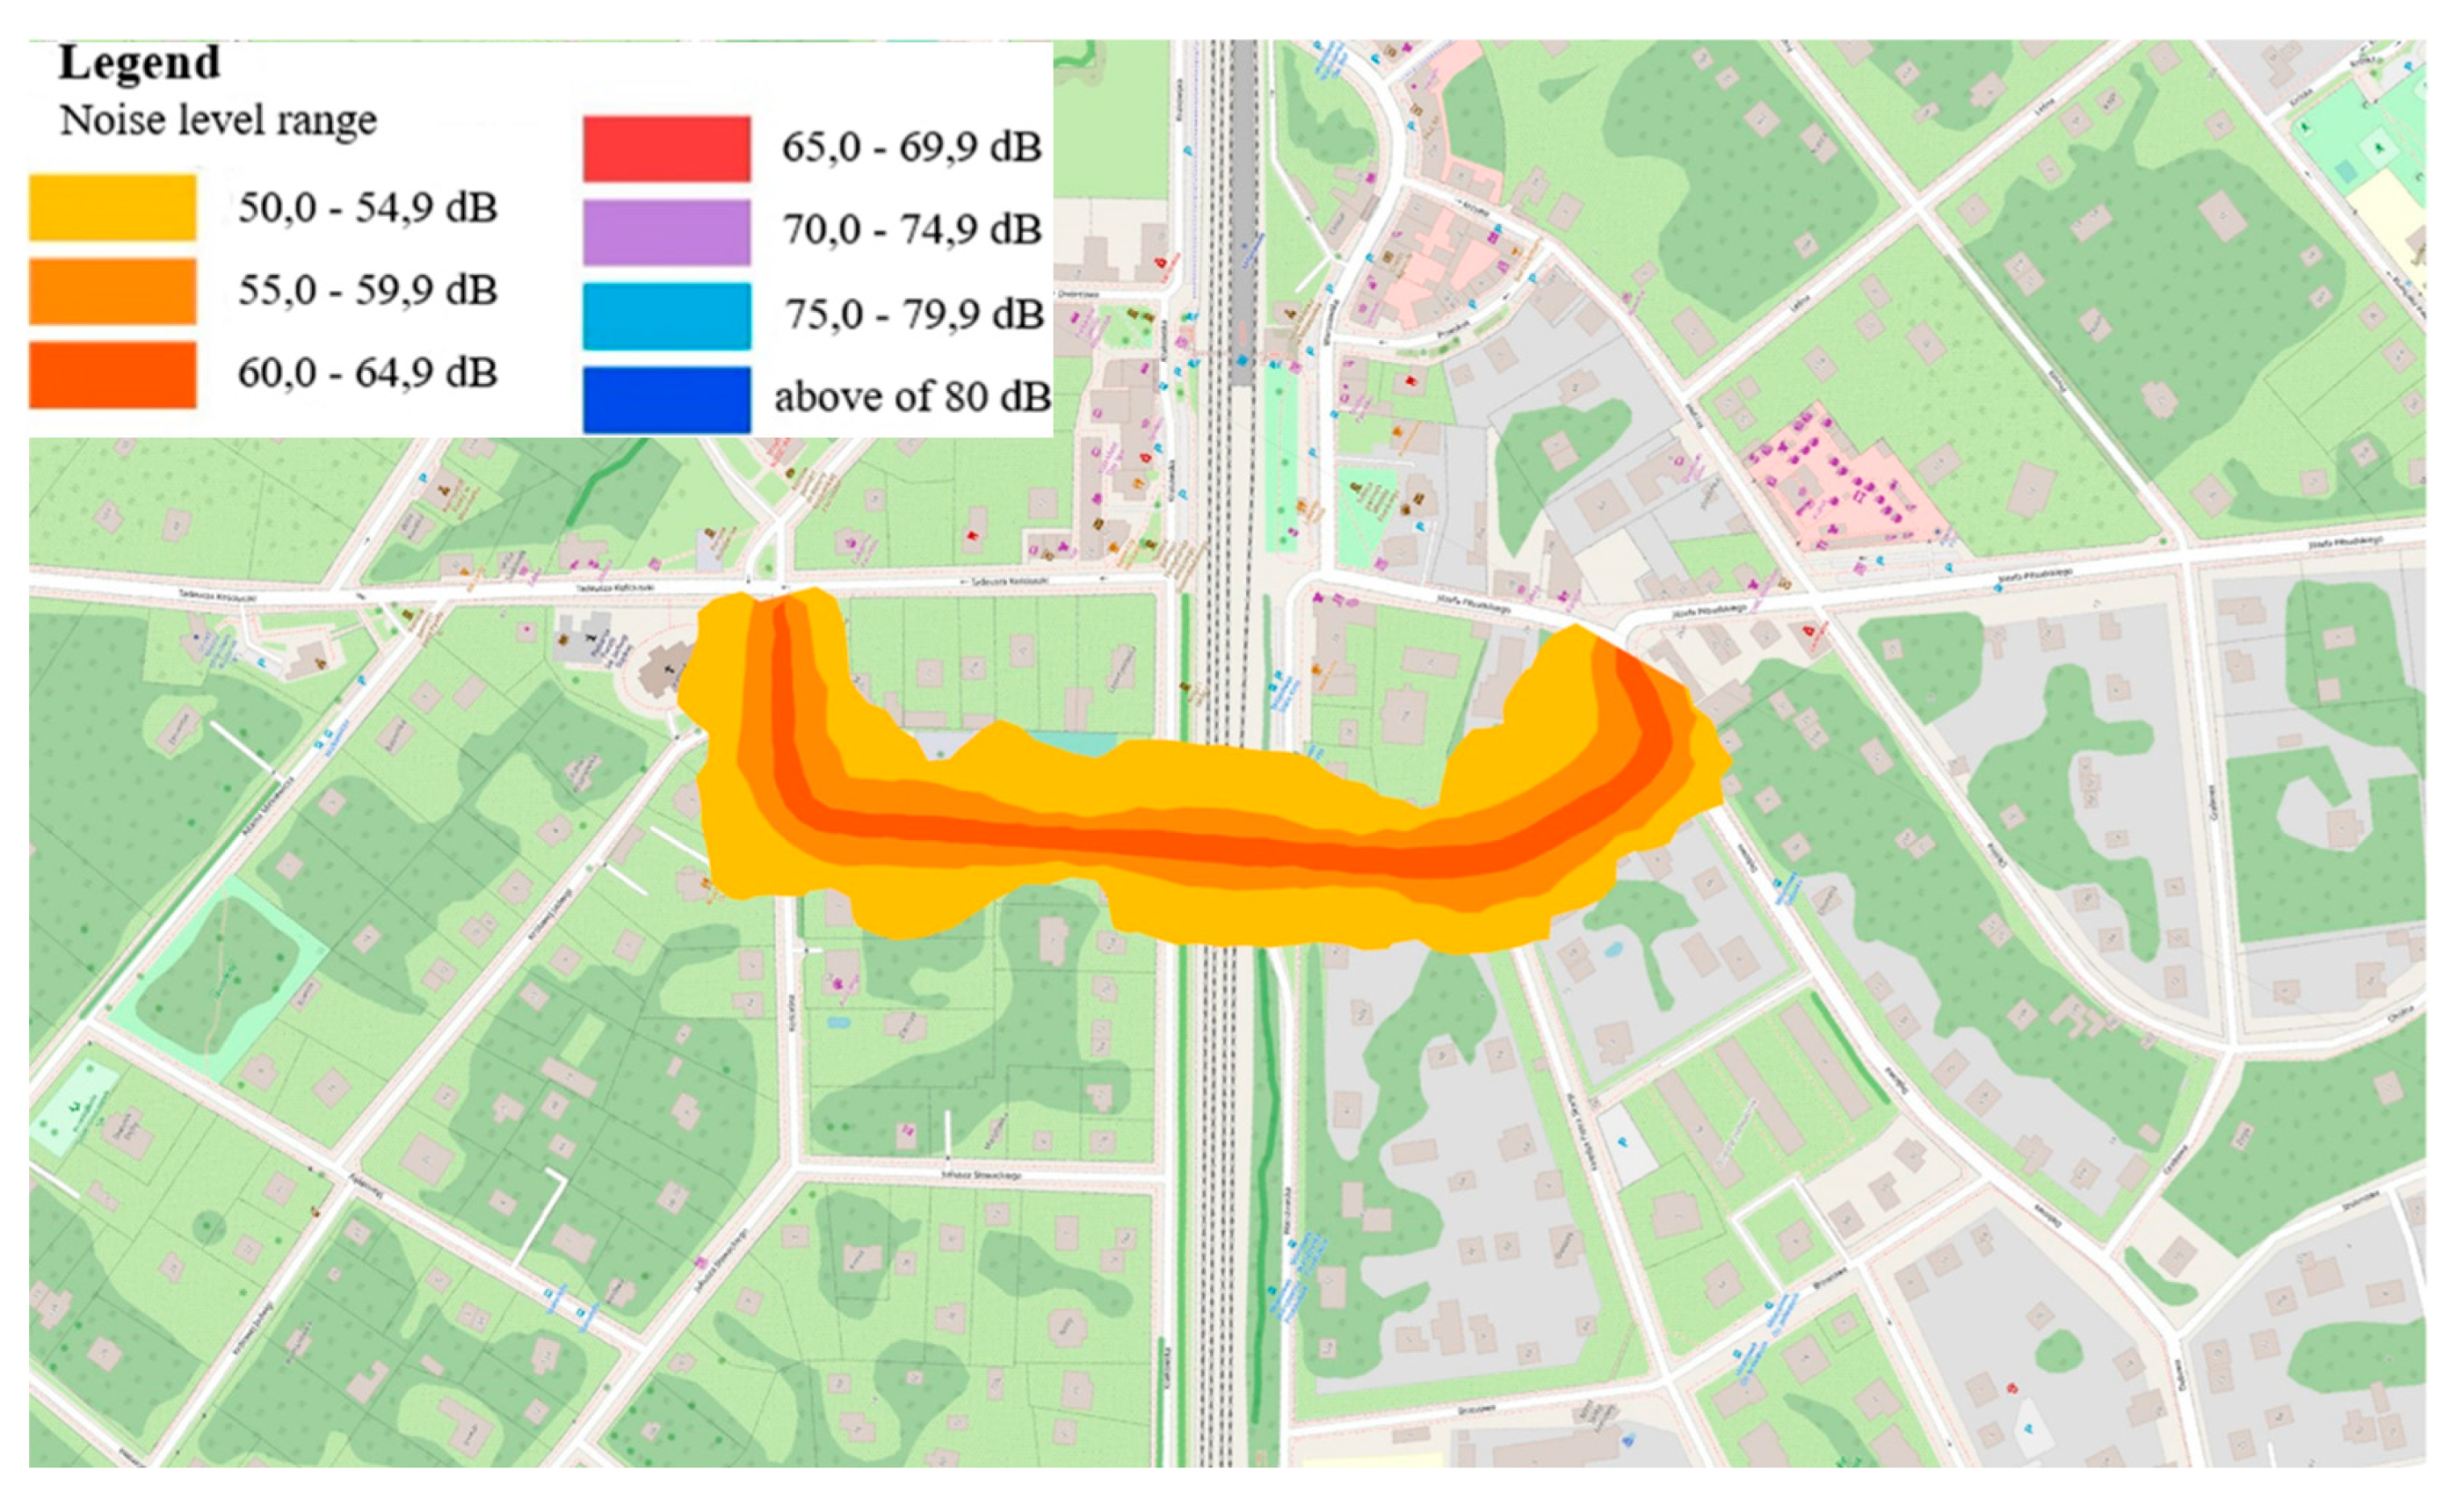
Figure 5.
Immission map showing noise expressed as LN
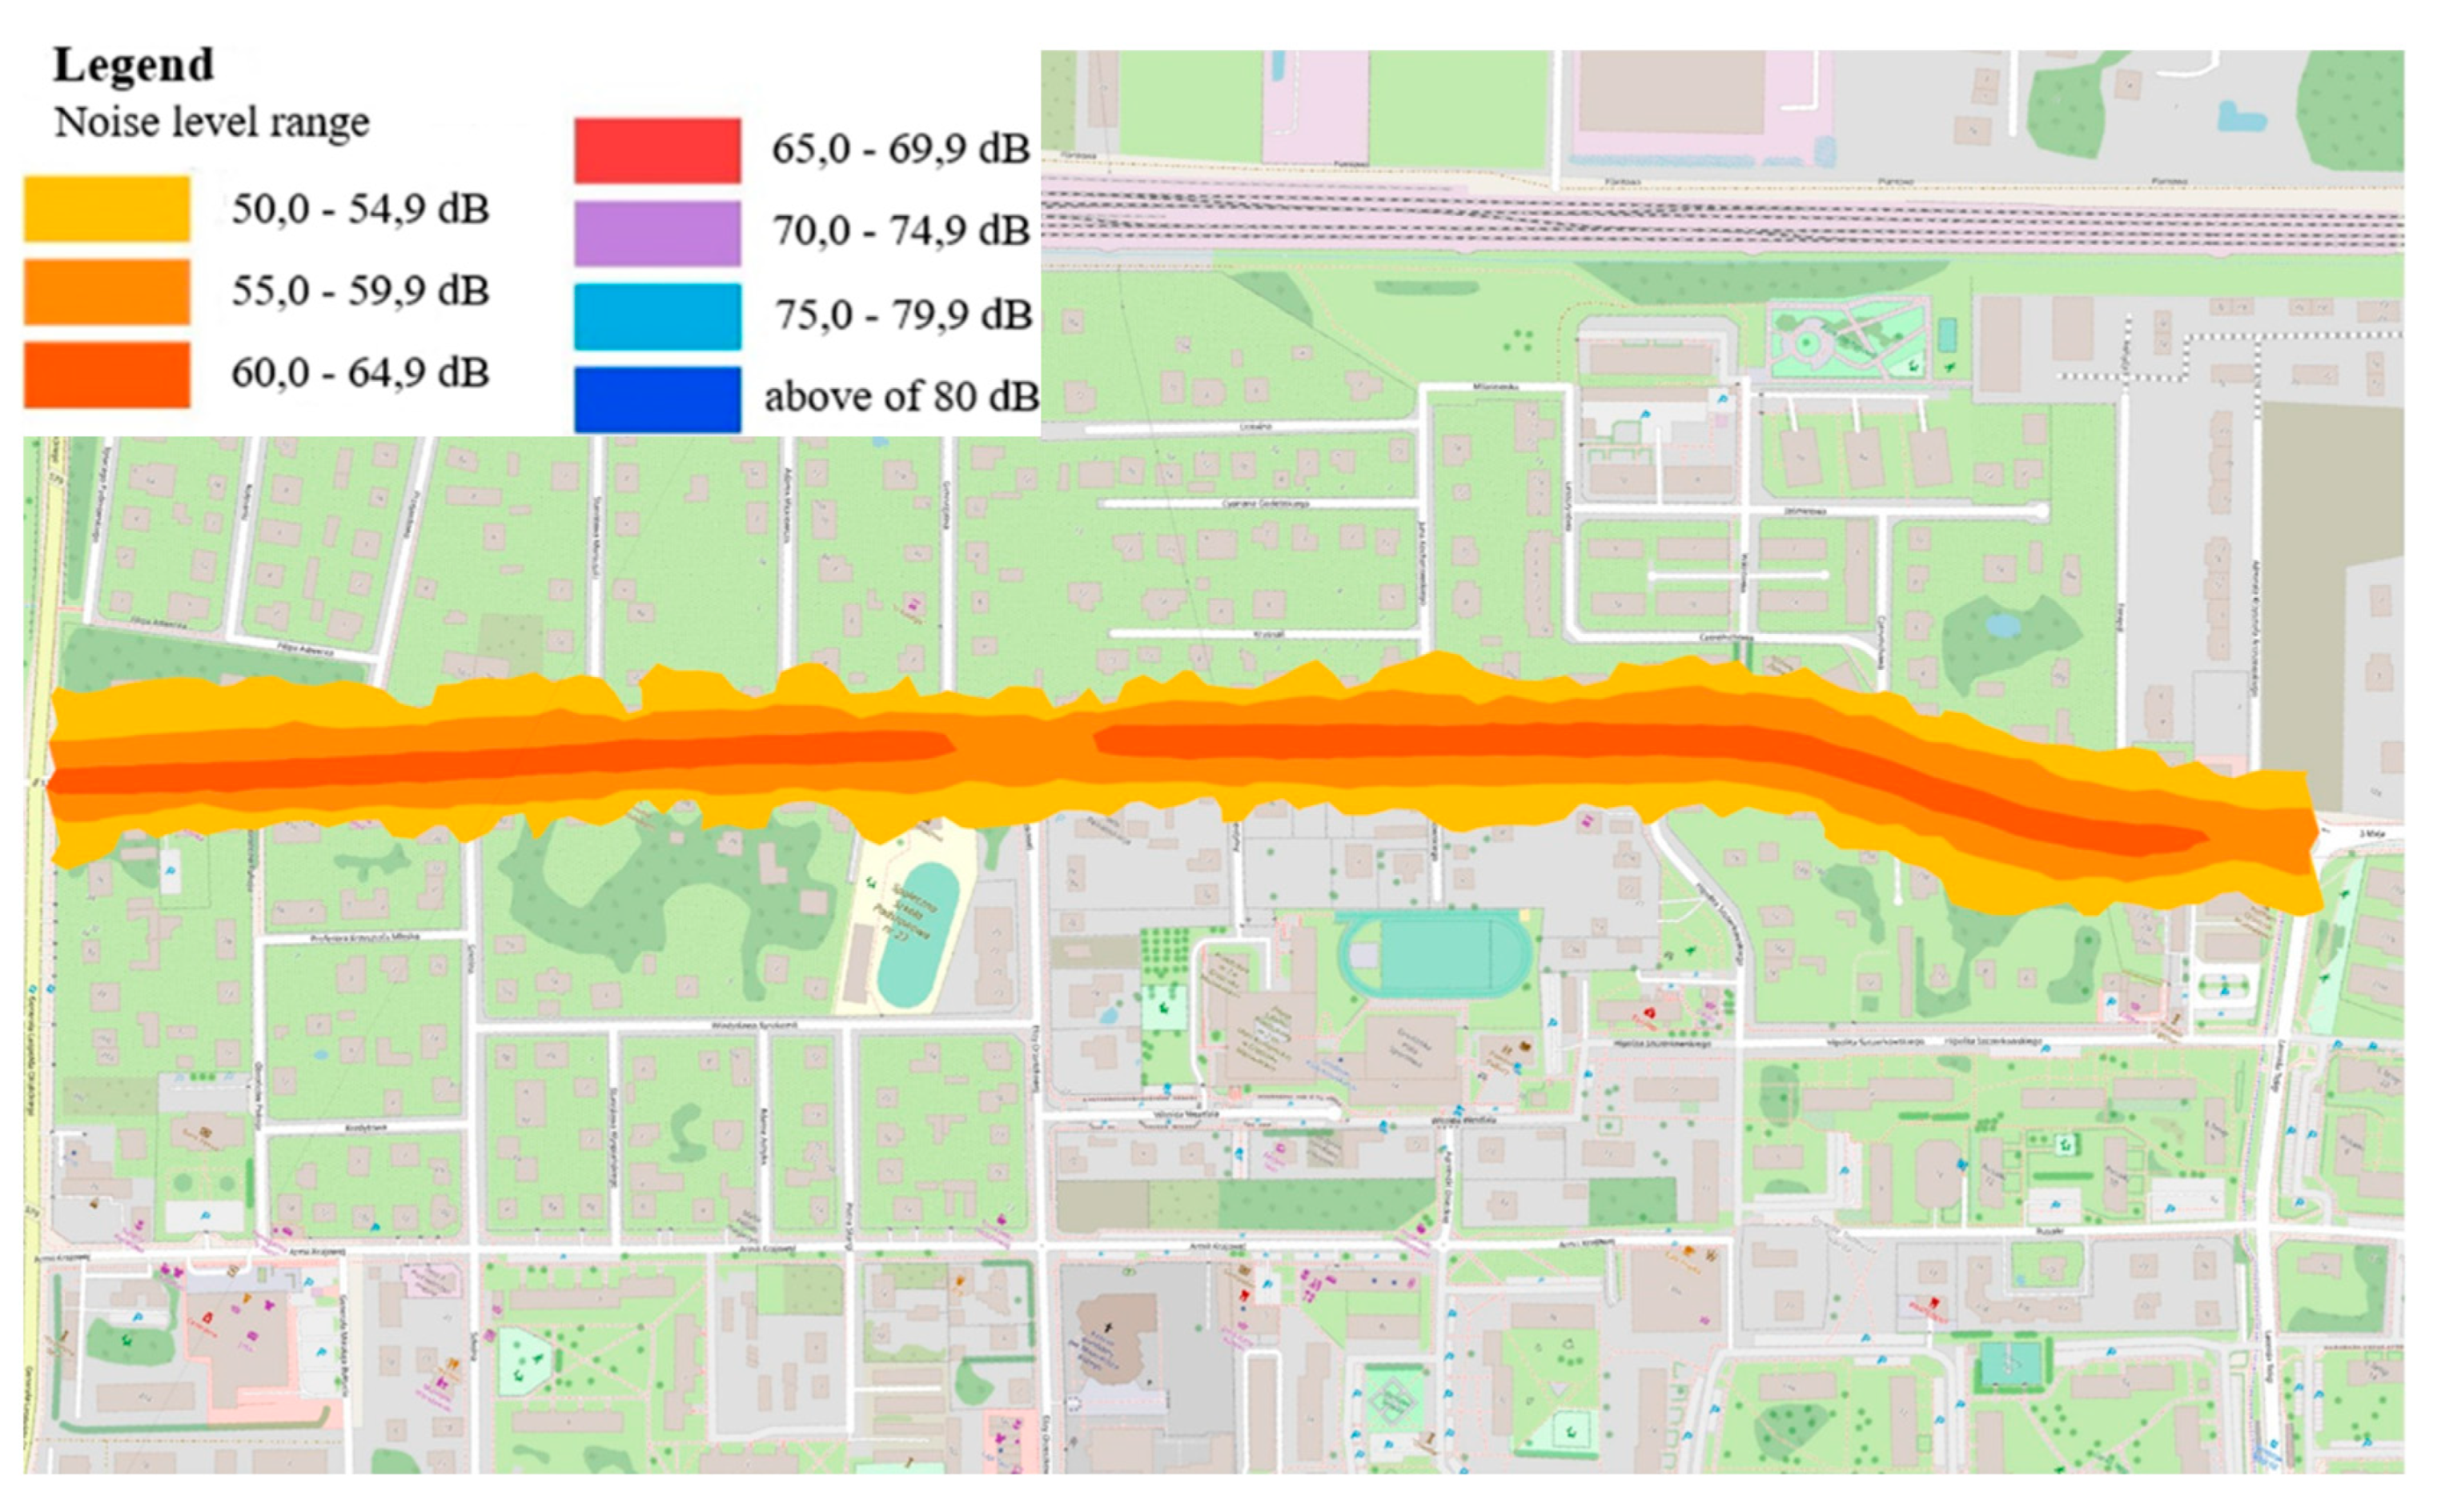
Figure 6.
Immission map showing noise expressed as LN.
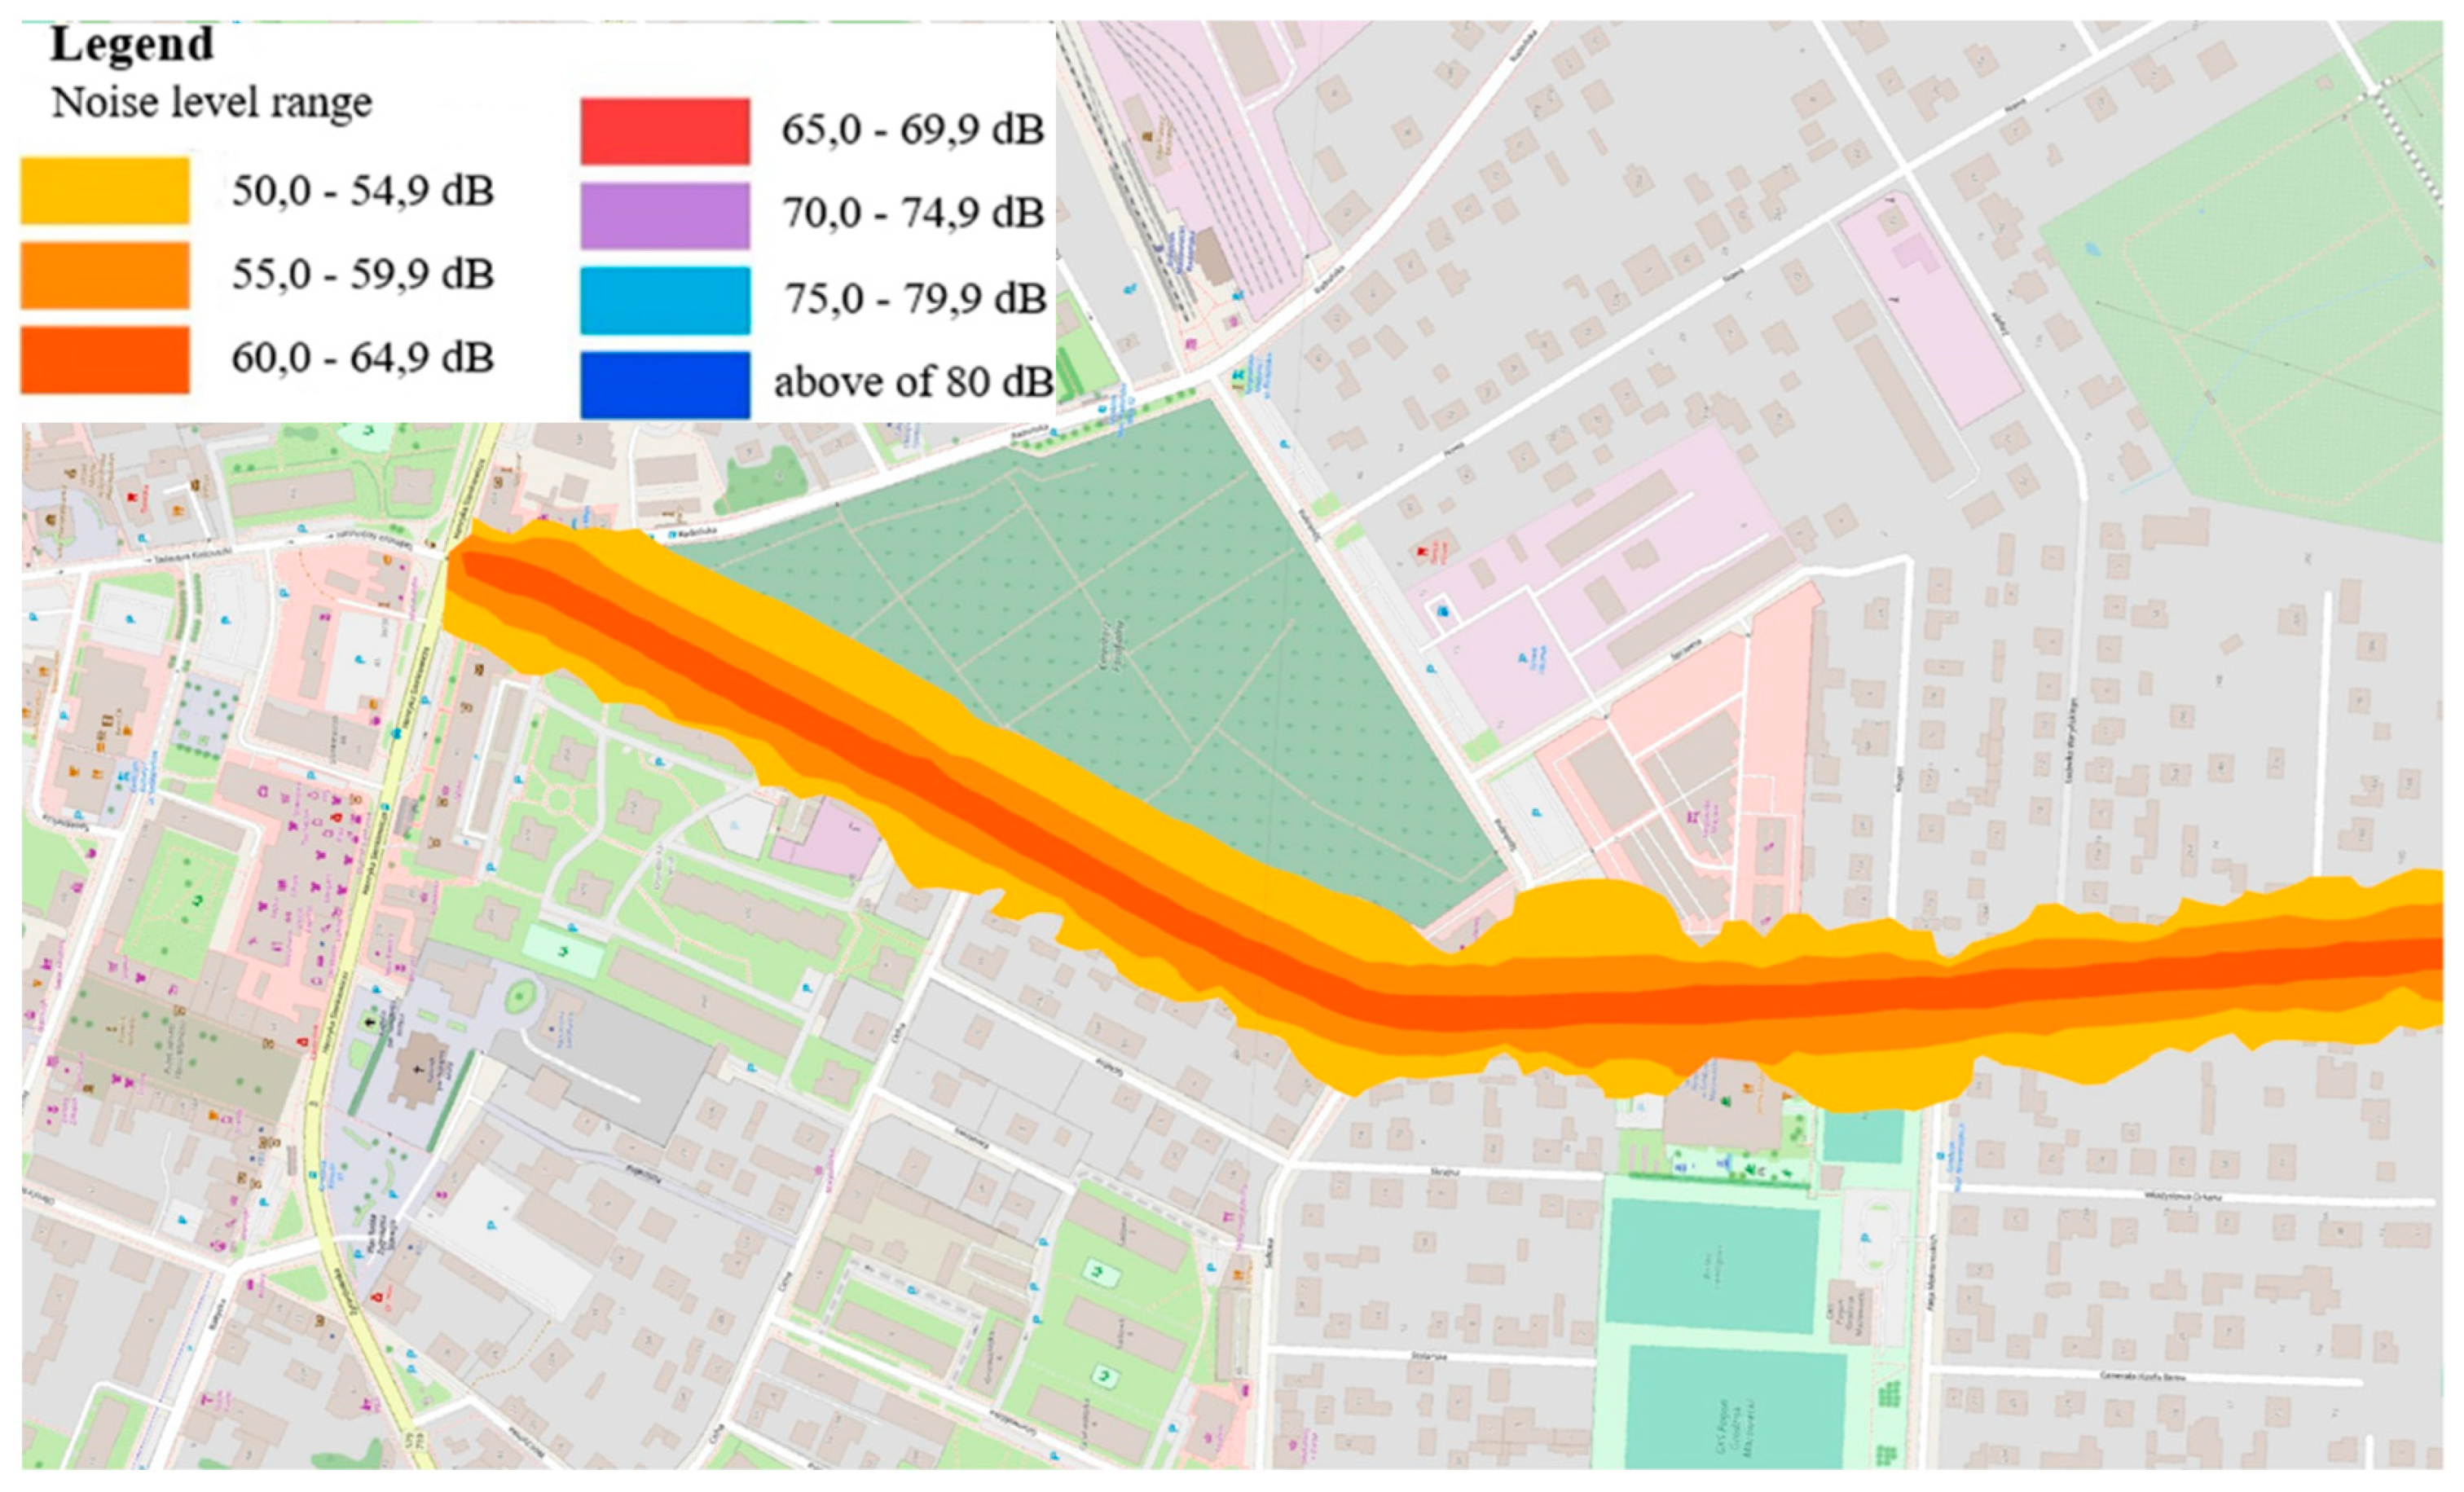
Figure 7.
Map of acoustically protected areas with permissible noise levels expressed in LDWN and LN indicators.
Figure 7.
Map of acoustically protected areas with permissible noise levels expressed in LDWN and LN indicators.
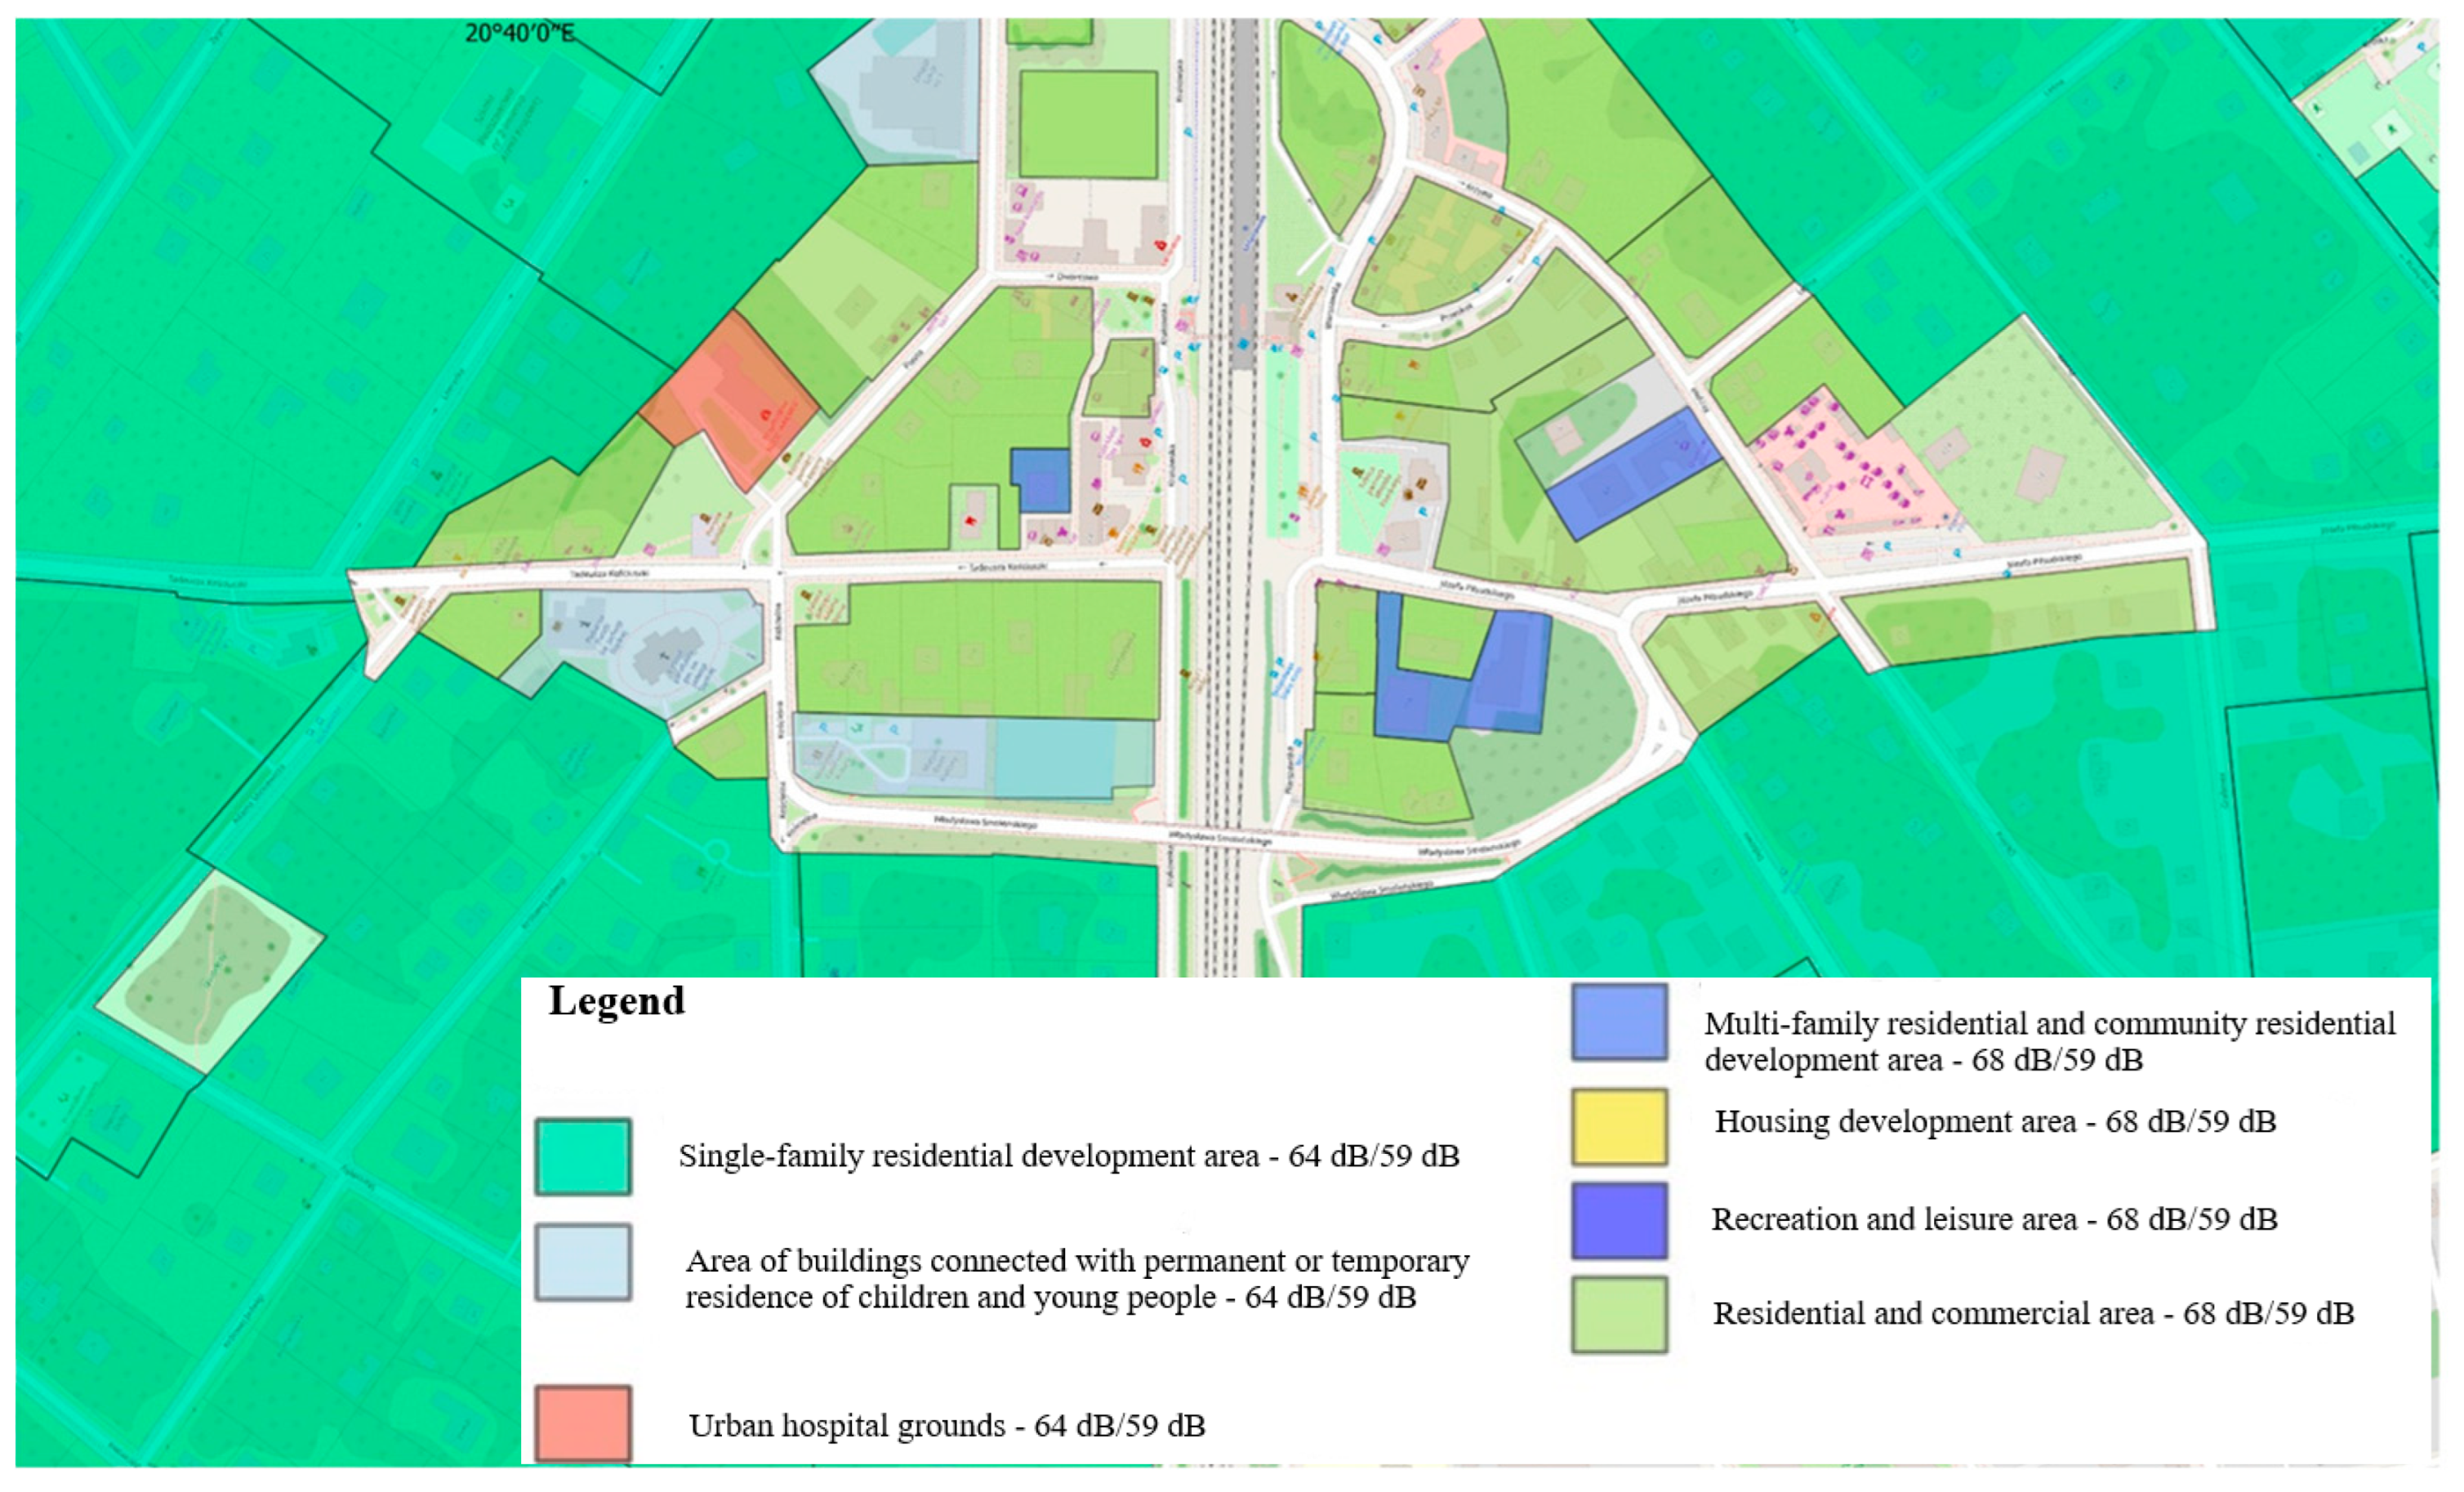
Figure 8.
Map of acoustically protected areas with permissible noise levels expressed in LDWN and LN indicators.
Figure 8.
Map of acoustically protected areas with permissible noise levels expressed in LDWN and LN indicators.
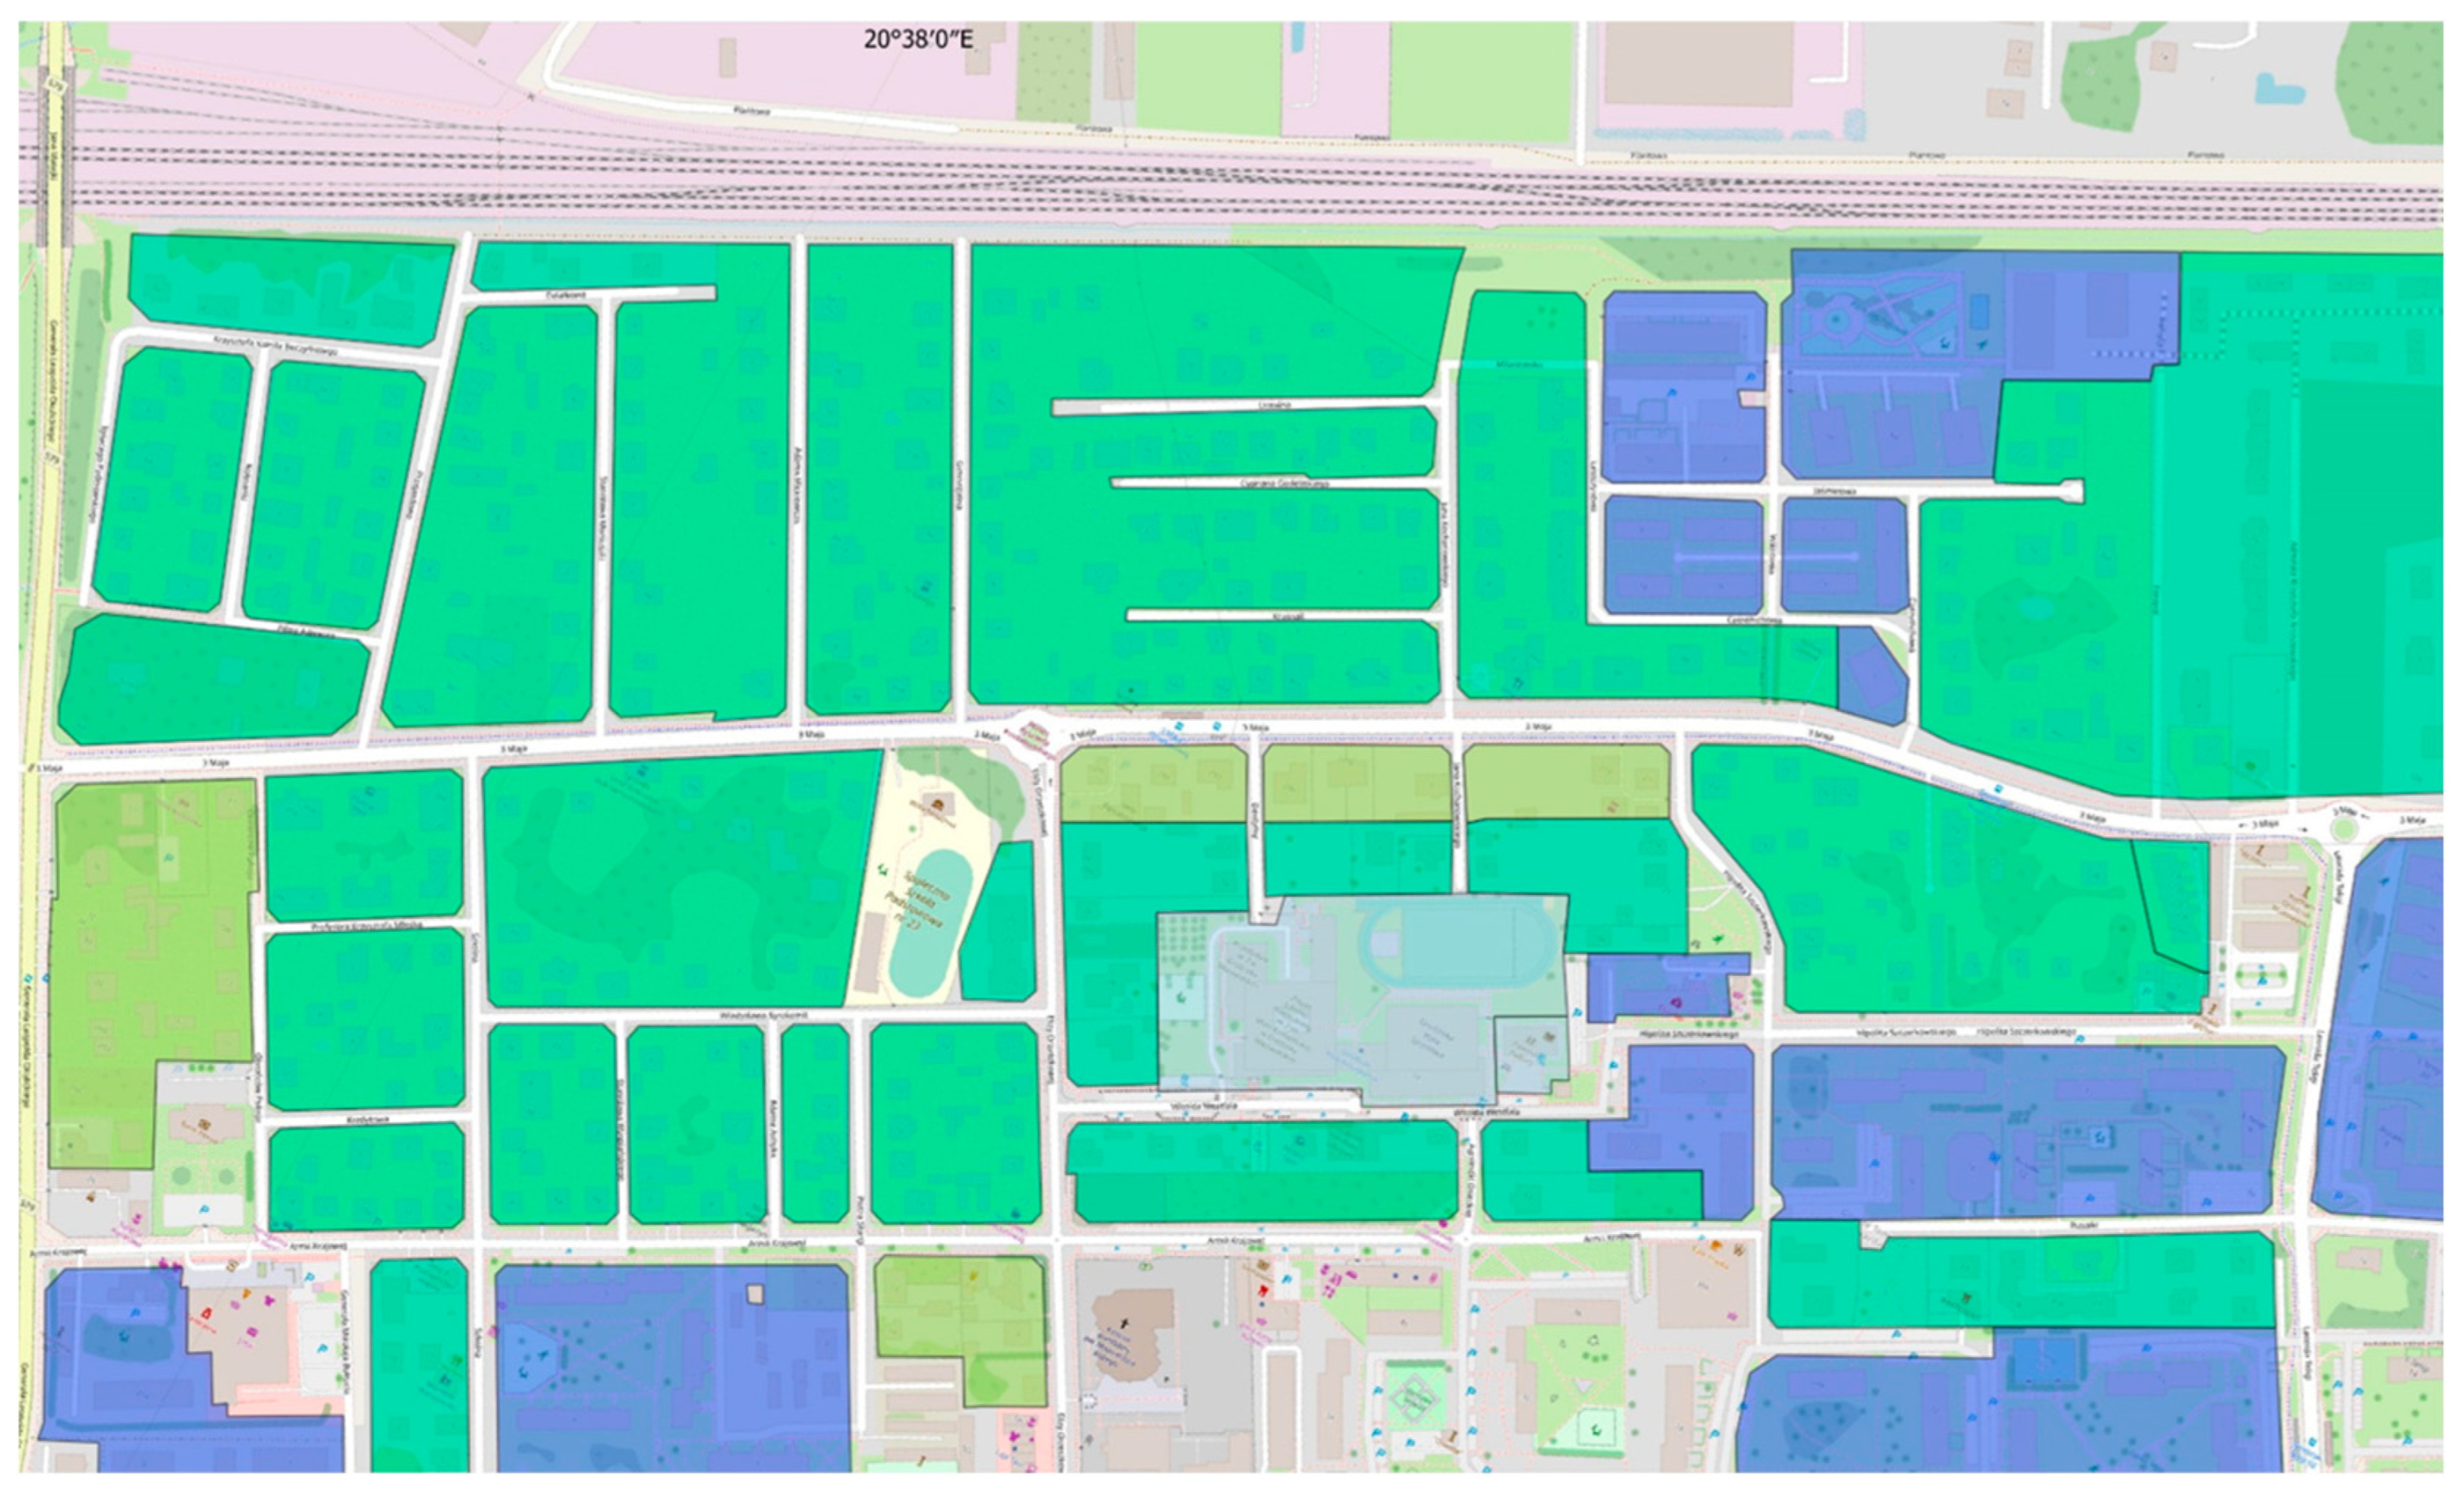
Figure 9.
Map of acoustically protected areas with permissible noise levels expressed in LDWN and LN indicators.
Figure 9.
Map of acoustically protected areas with permissible noise levels expressed in LDWN and LN indicators.
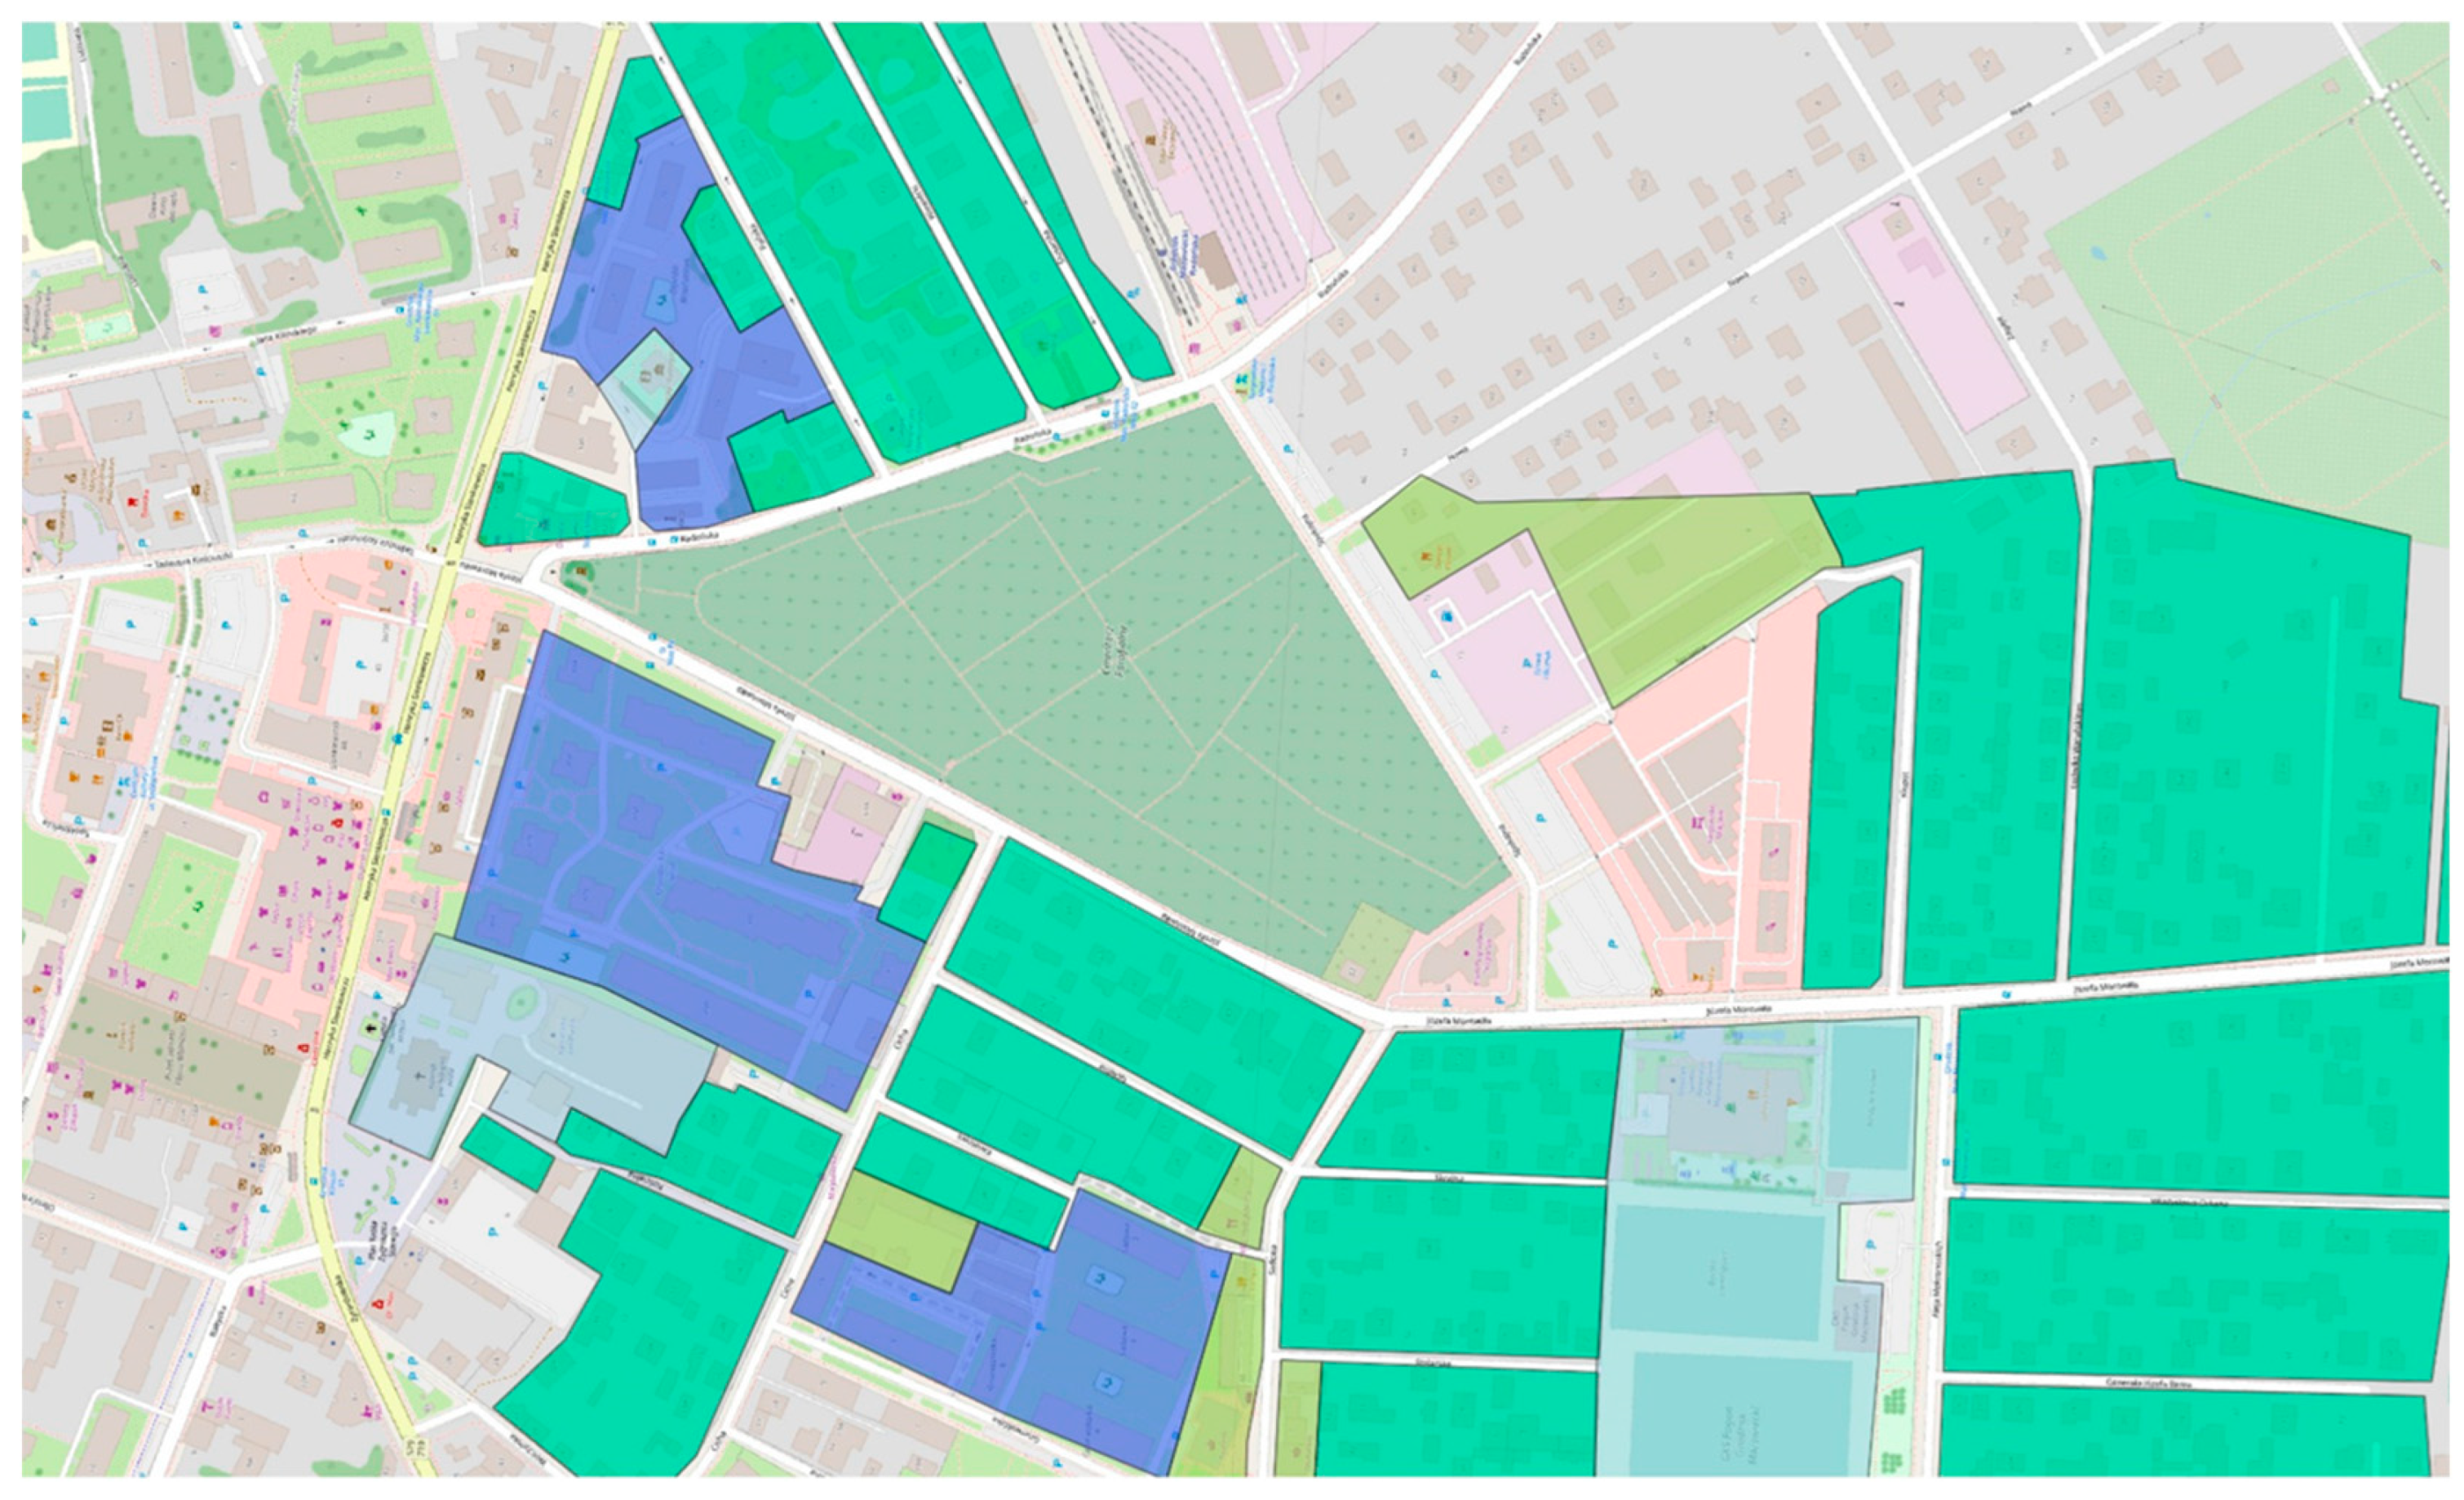
Figure 10.
Map of noise-prone areas in which the permissible noise levels expressed in LDWN are exceeded.
Figure 10.
Map of noise-prone areas in which the permissible noise levels expressed in LDWN are exceeded.
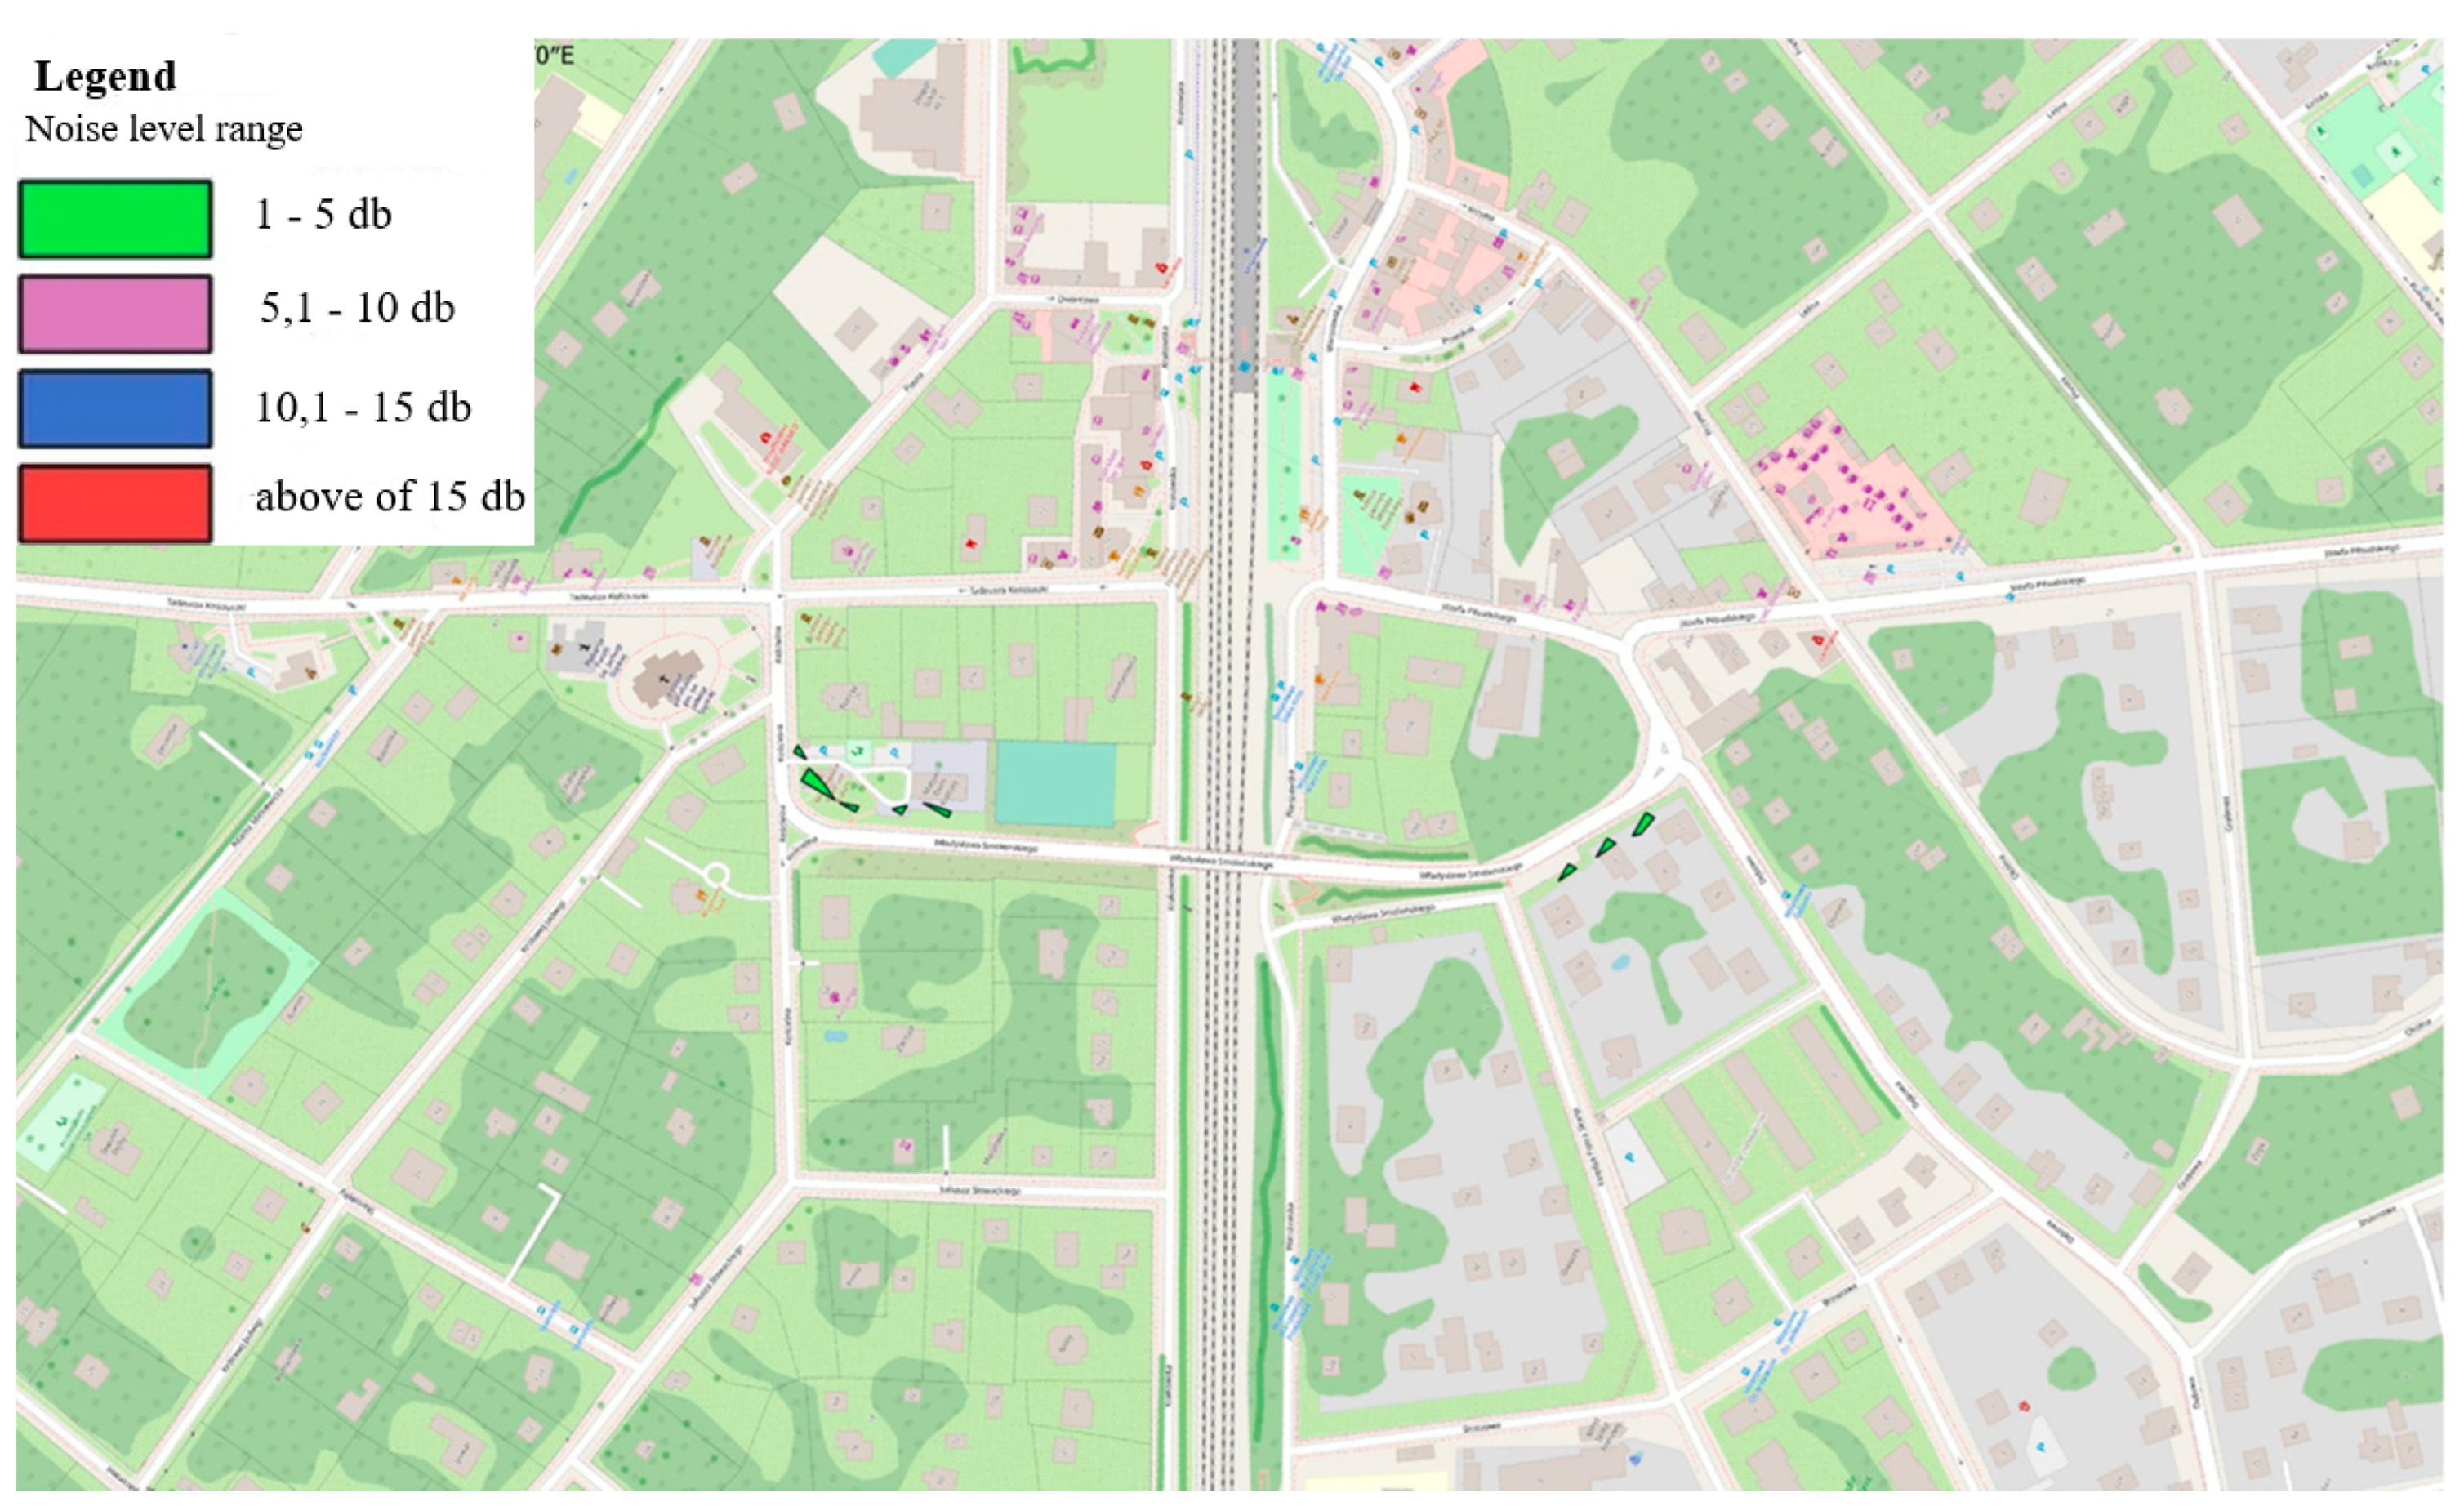
Figure 11.
Map of noise-prone areas in which the permissible noise levels expressed in LDWN are exceeded.
Figure 11.
Map of noise-prone areas in which the permissible noise levels expressed in LDWN are exceeded.
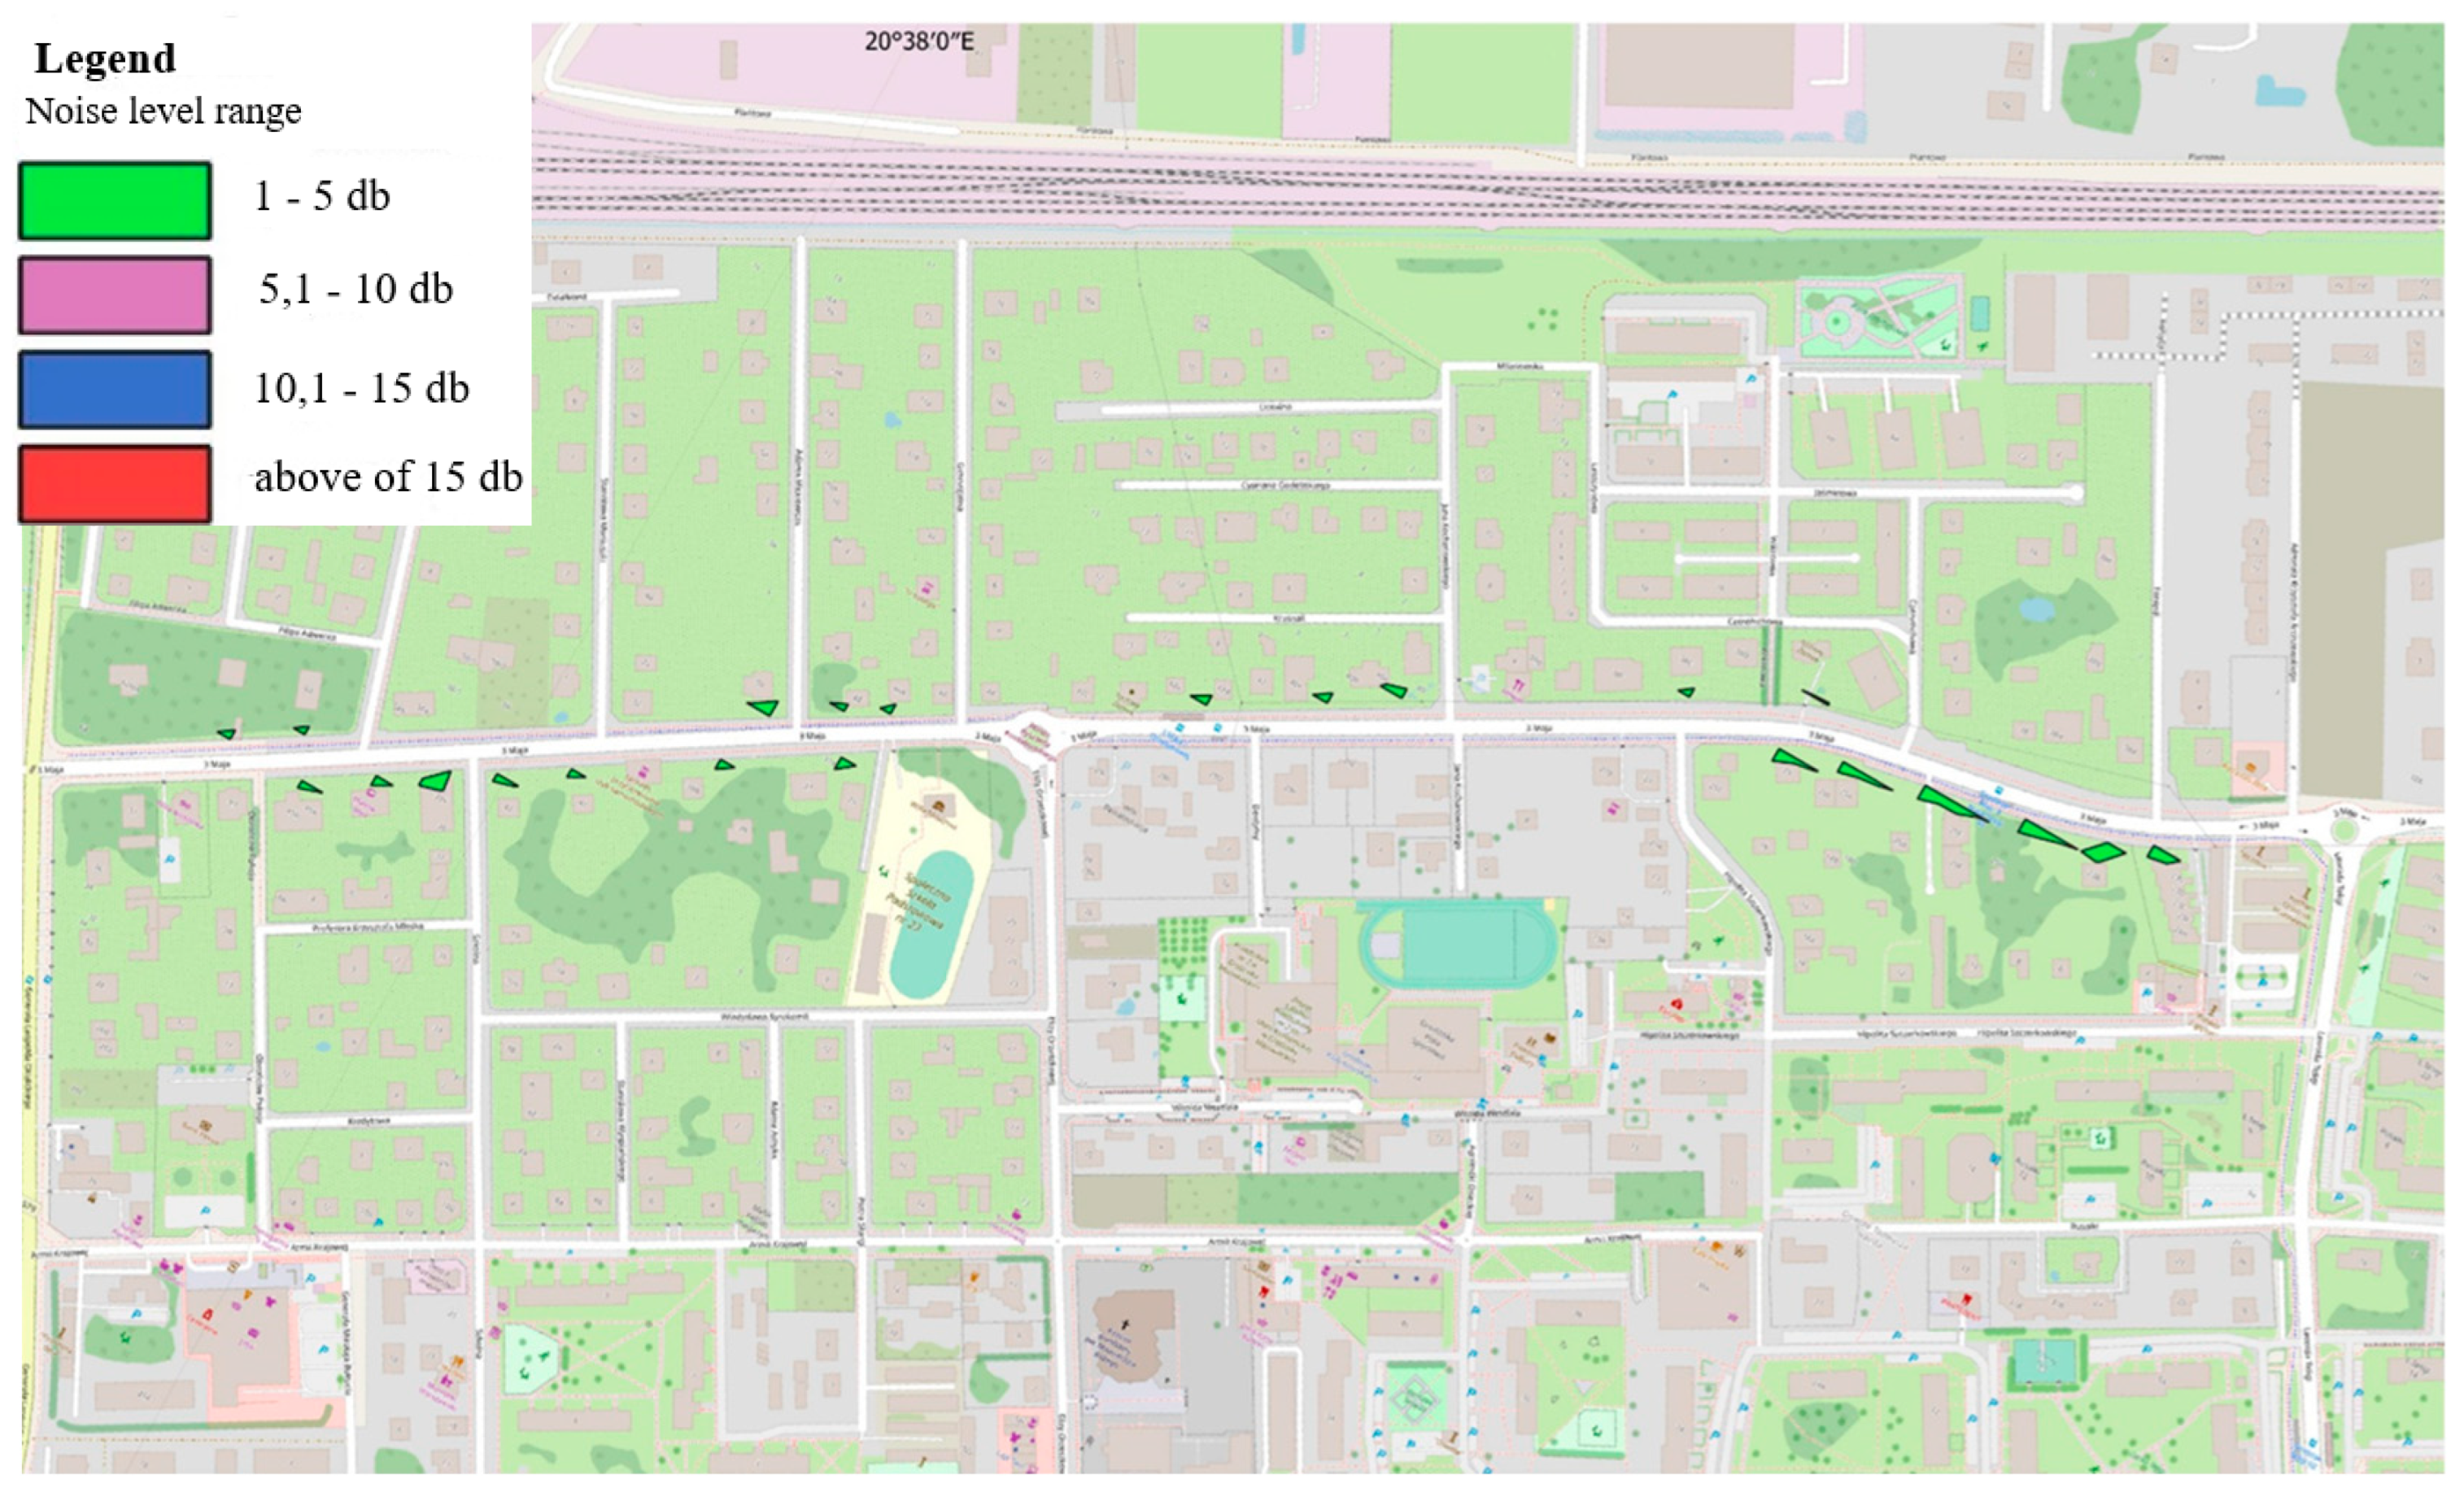
Figure 12.
Map of noise-prone areas in which the permissible noise levels expressed in LDWN are exceeded.
Figure 12.
Map of noise-prone areas in which the permissible noise levels expressed in LDWN are exceeded.
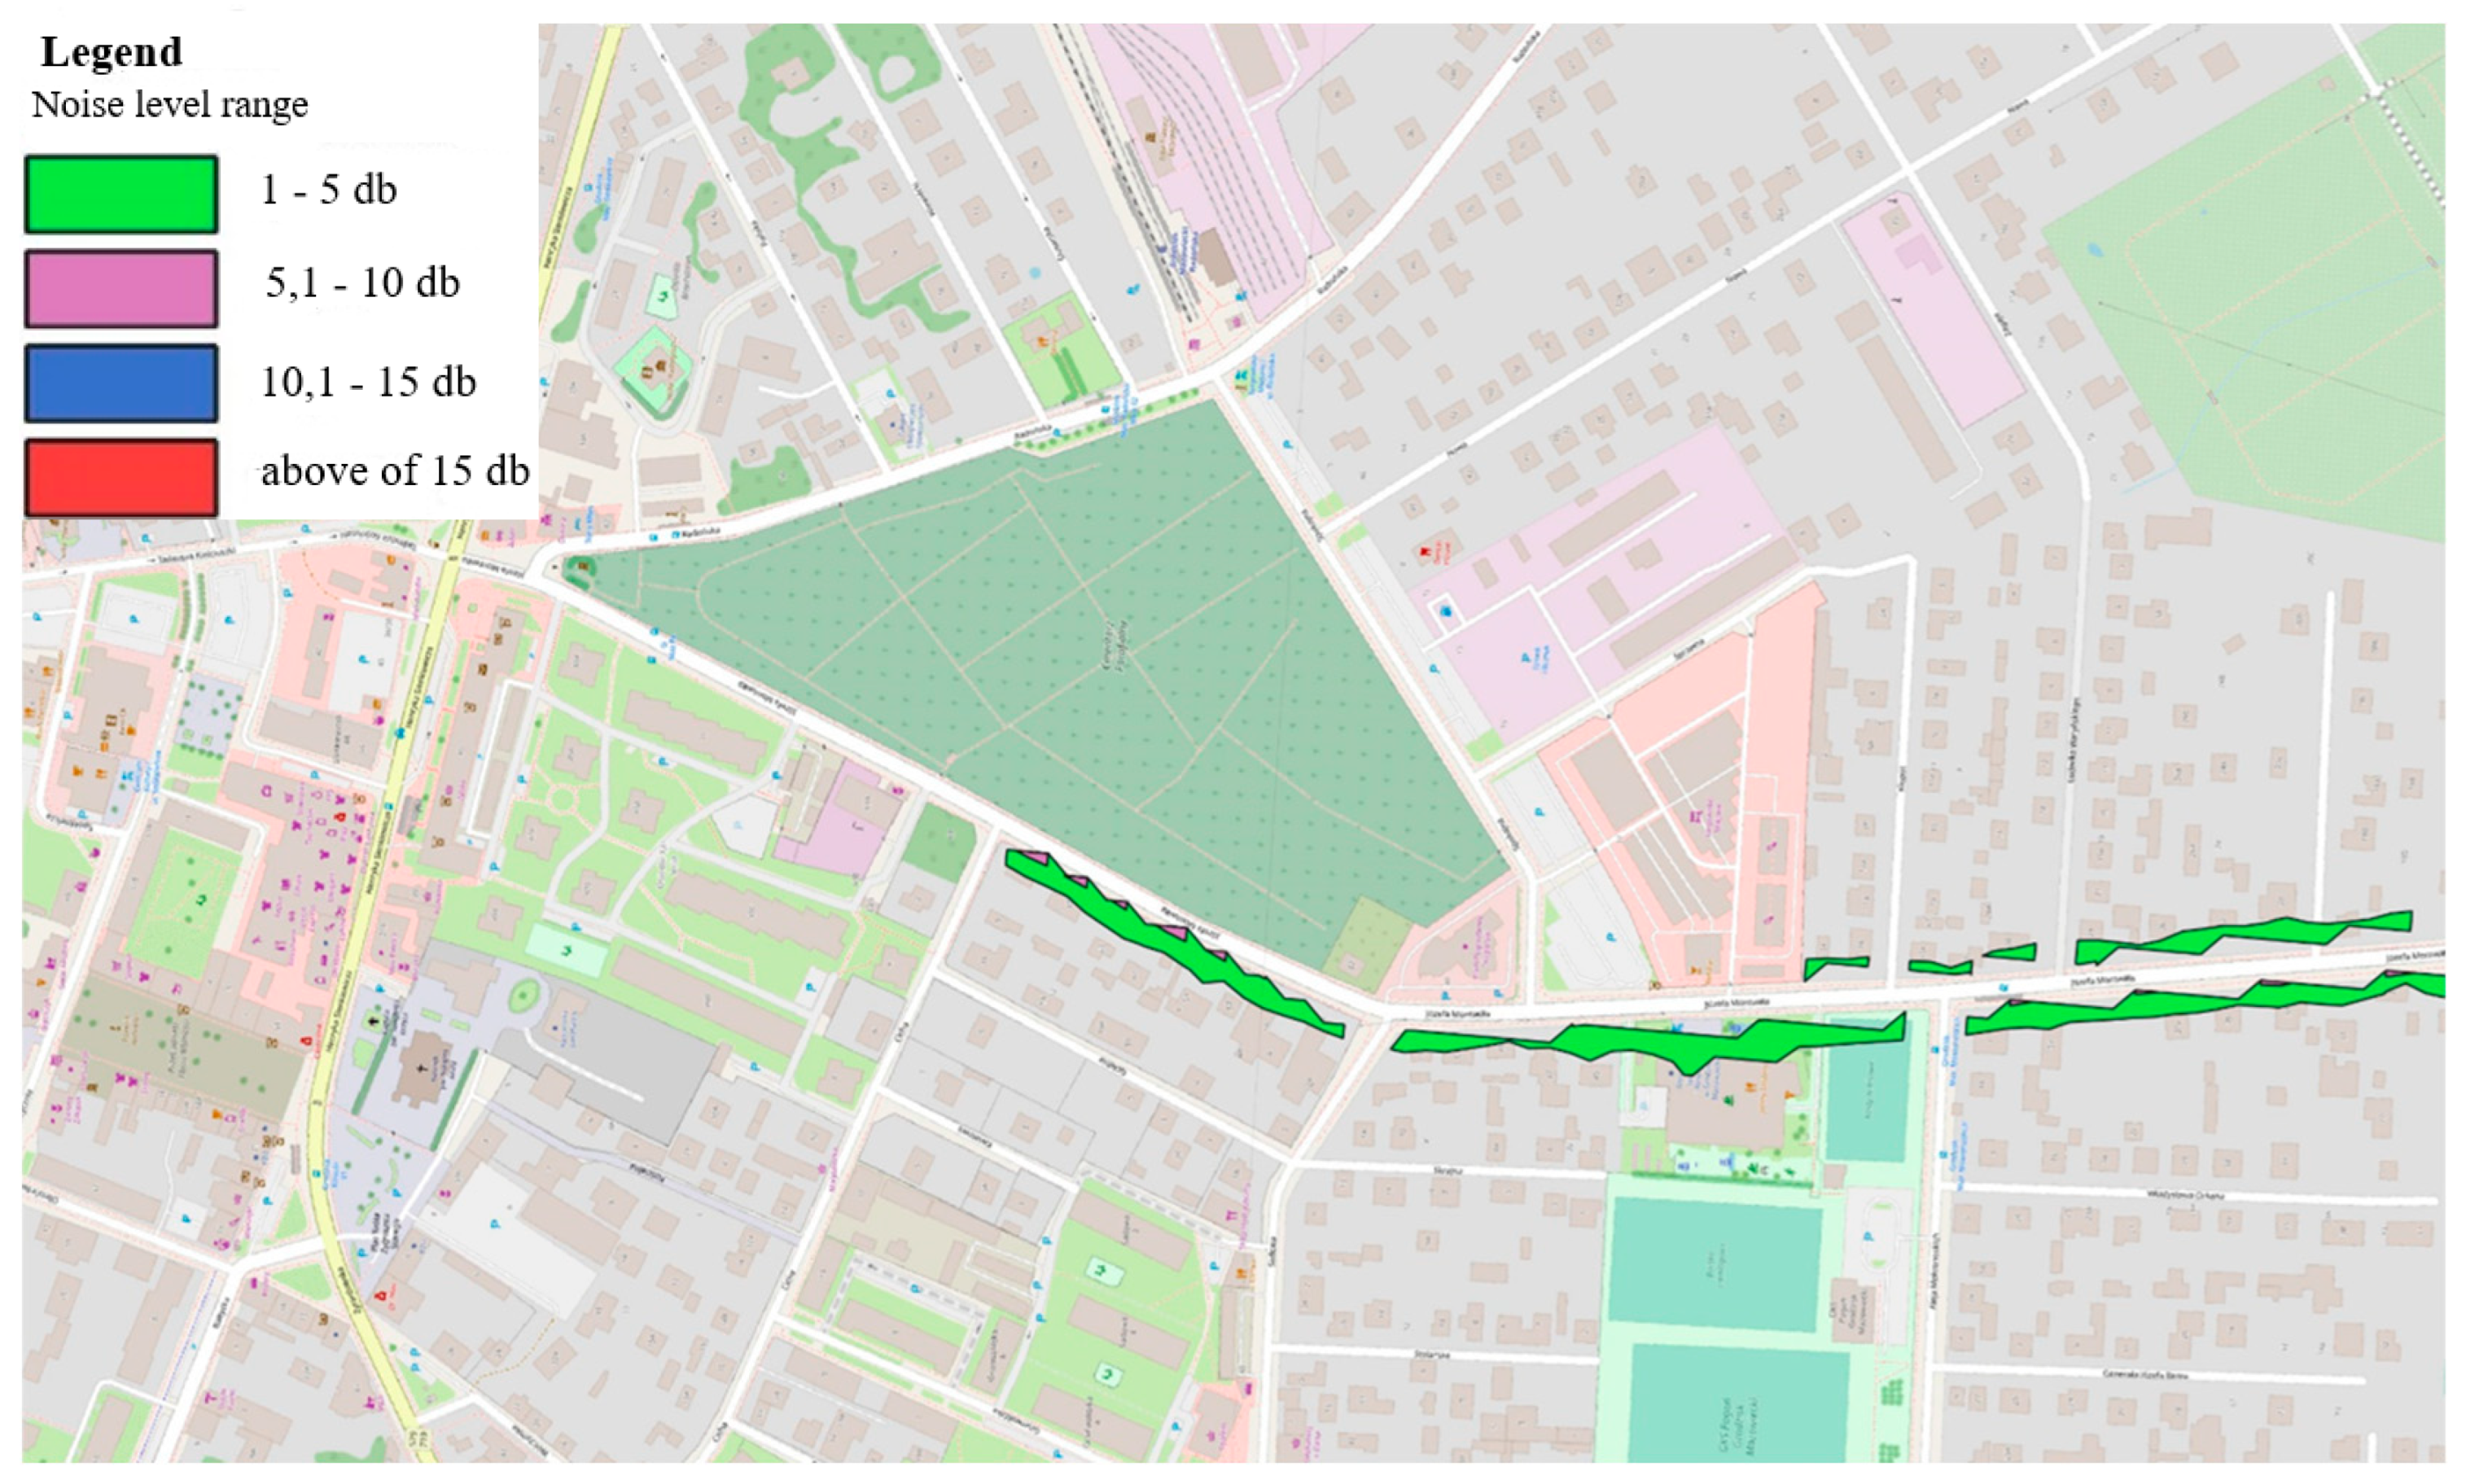

Table 1.
Permissible levels of environmental noise caused by specific groups of noise sources, excluding noise caused by aircraft take-offs, landings and overflights, and power lines expressed in terms of LAeqD and LAeq N [65].
Table 1.
Permissible levels of environmental noise caused by specific groups of noise sources, excluding noise caused by aircraft take-offs, landings and overflights, and power lines expressed in terms of LAeqD and LAeq N [65].
| No. | Type of terrain | The permissible noise level in [dB] | |||
|---|---|---|---|---|---|
| roads or railway lines | other facilities and noise-generating activities |
||||
| LAeq D time reference interval equal to 16 hours | LAeq N 8-hour post-elevation time interval | LAeq D reference time interval equal to the 8 least favourable hours of the day consecutively | LAeq N time reference interval equal to 1 least favourable hour of the night | ||
| 1 | a) Spa protection zone ‘A’ b) Hospital areas outside the city |
50 | 45 | 45 | 40 |
| 2 | a) Areas of single-family residential development b) Areas of buildings connected with permanent or long-term residence of children and young people c) Social housing areas d) Hospital areas in cities |
61 | 56 | 50 | 40 |
| 3 | a) Areas of multi-family residential development and collective housing b) Areas of homestead development c) Recreation and leisure areas d) Residential and service areas |
65 | 56 | 55 | 45 |
| 4 | Areas in the inner city zone of cities with more than 100,000 inhabitants | 68 | 60 | 55 | 45 |
Table 2.
Permissible environmental noise levels caused by specific groups of noise sources, excluding noise caused by aircraft take-offs, landings and overflights, and power lines, expressed in terms of LDWN and L N [65].
Table 2.
Permissible environmental noise levels caused by specific groups of noise sources, excluding noise caused by aircraft take-offs, landings and overflights, and power lines, expressed in terms of LDWN and L N [65].
| No. | Type of terrain | Permissible noise level in [dB] | |||
|---|---|---|---|---|---|
| roads or railway lines | other facilities and noise-generating activities |
||||
| LDWN reference time interval equal to all days of the year | L N reference time interval equal to all times of the night | LDWN reference time interval equal to all days of the year | L N reference time interval equal to all times of the night | ||
| 1 | a) Spa protection zone ‘A’ b) Hospital areas outside the city |
50 | 45 | 45 | 40 |
| 2 | a) Areas of single-family residential development b) Areas of buildings connected with permanent or long-term residence of children and young people c) Social housing areas d) Hospital areas in cities |
64 | 59 | 50 | 40 |
| 3 | a) Areas of multi-family residential development and collective housing b) Areas of homestead development c) Recreation and leisure areas d) Residential and service areas |
68 | 59 | 55 | 45 |
| 4 | Areas in the inner city zone of cities with more than 100,000 inhabitants | 70 | 65 | 55 | 45 |
Table 3.
Geographical coordinates of the analysed sections.
| Road number | Street name | vehicles / year |
Length [m] | GPS coordinates in the 1992 system |
|
|---|---|---|---|---|---|
| Start of road section X / Y |
End of road section X / Y | ||||
| 1503 | Grodzisk Mazowiecki - Siestrzeń Ojrzanów | 3.901.120 | 8060 | 472176,28 / 611955,16 |
467138,46 / 617626,89 |
| 1505 | Grodzisk Mazowiecki - Józefina | 4.113.915 | 2870 | 472031,80 / 611317,31 |
469229,06 / 611540,84 |
| 1511 | Milanówek - Falęcin - Kotowice | 5.114.380 | 620 | 474633,94 / 613882,26 |
474284,26 / 614061,16 |
| 1526 | Grodzisk Mazowiecki- Milanówek | 3.935.795 | 1200 | 472789,29 / 611620,36 |
473320,31 / 612598,64 |
Table 4.
Characteristics of the central district roads.
| Road | Road class | Width of road lane | Surface width | Width of roadway | number of roadways | number of lanes | type of surface |
|---|---|---|---|---|---|---|---|
| Droga 1503W Grodzisk Maz. - Siestrzeń – Ojrzanów, ul. Nadarzyńska |
Main road (G) | do 25m | 6-7 m | 8-9 m | 1 | 2 (1 in each direction) | Bituminous mass |
| Droga 1505W Grodzisk Maz. - Józefina |
Collective (Z) | 20 | 6,5-7,5 m | 8-9 m | 1 | 2 (1 in each direction) | Bituminous mass |
| Droga 1526W Grodzisk Mazowiecki ul. 3-go Maja, Milanówek ul. Dębowa |
Collective (Z) | 20m | 6,7-7,2 m | 8-9 m | 1 | 2 (1 in each direction) | Bituminous mass |
| Droga 1511W Milanówek – Falęcin – Kotowice, ul. Kazimierzowska, ul. Nowowiejska, ul. Piłsudskiego, ul. Dębowa, ul. Smoleńskiego, ul. Kościelna, ul. Kościuszki |
Collective (Z) | 20m | 5,9-6,2 m | 6,5-7,5 m | 1 | 2 (1 in each direction) | Bituminous mass |
Table 5.
Summary of results of calibration of the computational model.
| Street | Measured value [dB] | Calculated value [dB] | Difference [dB] | |||
|---|---|---|---|---|---|---|
| LAeq D | LAeq N | LAeq D | LAeq N | LAeq D | LAeq N | |
| ul. Nadarzyńska | 67,2 | 61,4 | 66,9 | 60,9 | 0,3 | 0,5 |
| 3 Maja | 67,4 | 61,1 | 66,2 | 60,3 | 1,2 | 0,8 |
| ul. Smoleńskiego | 65,1 | 60,2 | 64,8 | 59,6 | 0,3 | 0,6 |
Table 7.
Statistics on the occurrence of exceedances of noise limits for district roads.
| Grodzisk District | LDWN | LN | ||||||
|---|---|---|---|---|---|---|---|---|
| 1–5 dB |
5,1–10 dB |
10,1–15 dB |
> 15 dB |
1–5 dB |
5,1–10 dB |
10,1–15 dB |
> 15 dB |
|
| area [km2] | 0,114 | 0,012 | 0,000 | 0,000 | 0,022 | 0,000 | 0,000 | 0,000 |
| number of residential units | 0 | 0 | 0 | 0 | 0 | 0 | 0 | 0 |
| number of residents | 0 | 0 | 0 | 0 | 0 | 0 | 0 | 0 |
| facilities for the permanent or temporary stay of children and young persons | 0 | 0 | 0 | 0 | 0 | 0 | 0 | 0 |
| healthcare facilities | 0 | 0 | 0 | 0 | 0 | 0 | 0 | 0 |
| social welfare facilities | 0 | 0 | 0 | 0 | 0 | 0 | 0 | 0 |
Table 8.
Noise exposure statistics for district roads.
| Grodzisk District | LDWN | LN | ||||||||||
|---|---|---|---|---|---|---|---|---|---|---|---|---|
| 55-59 dB | 60-64 dB | 65-69 dB | 70-74 dB | 75-79 dB |
+ 80 dB | 50-54 dB | 55-59 dB | 60-64 dB | 65-69 dB | 70-74 dB |
+ 75 dB | |
| area [km2] | 0,836 | 0,527 | 0,367 | 0,169 | 0,000 | 0,000 | 0,572 | 0,410 | 0,230 | 0,008 | 0,000 | 0,000 |
| number of residential units | 372 | 301 | 232 | 0 | 0 | 0 | 252 | 312 | 11 | 0 | 0 | 0 |
| number of residents | 600 | 500 | 100 | 0 | 0 | 0 | 500 | 200 | 0 | 0 | 0 | 0 |
| facilities for the permanent or temporary stay of children and young persons | 1 | 3 | 4 | 0 | 0 | 0 | 0 | 0 | 0 | 0 | 0 | 0 |
| healthcare facilities | 0 | 0 | 0 | 0 | 0 | 0 | 0 | 0 | 0 | 0 | 0 | 0 |
| social welfare facilities | 0 | 0 | 0 | 0 | 0 | 0 | 0 | 0 | 0 | 0 | 0 | 0 |
Table 9.
Analysis of the number of residents affected by the harmful effects of noise.
| District | The number of people affected by the harmful effects of noise, as expressed by the indicator | ||
|---|---|---|---|
| HA | HSD | IHD | |
| grodziski | 0 | 0 | 0 |
Disclaimer/Publisher’s Note: The statements, opinions and data contained in all publications are solely those of the individual author(s) and contributor(s) and not of MDPI and/or the editor(s). MDPI and/or the editor(s) disclaim responsibility for any injury to people or property resulting from any ideas, methods, instructions or products referred to in the content. |
© 2024 by the authors. Licensee MDPI, Basel, Switzerland. This article is an open access article distributed under the terms and conditions of the Creative Commons Attribution (CC BY) license (http://creativecommons.org/licenses/by/4.0/).
Copyright: This open access article is published under a Creative Commons CC BY 4.0 license, which permit the free download, distribution, and reuse, provided that the author and preprint are cited in any reuse.


