1. Introduction
Hydroxyapatite (HAP, Ca₁₀(PO₄)₆(OH)₂), a bioavailable and biocompatible inorganic material, has emerged as a highly versatile catalyst support due to its unique properties, including chemical and thermal stability, tuneable surface acidity, and the ability to accommodate various active metal species, such as Cu²⁺ and Fe³⁺, within its framework through ionic exchange properties.[
1,
2,
3,
4] These features, combined with its eco-friendly nature, make HAP a suitable choice for a wide range of catalytic applications, particularly in environmental catalysis for addressing pressing challenges, such as the mitigation of greenhouse gases and air pollutants.[
5]
In this field, copper-modified hydroxyapatite (Cu/HAP) has gained significant attention in various catalytic environmental reactions due to the unique redox and Lewis acid properties of Cu(II) and its good dispersibility on the HAP surface. Cu/HAP has shown promising performance in the selective catalytic reduction of NO
x by NH
3 (NH
3-SCR),[
6,
7,
8,
9,
10] decomposition of N₂O (De-N₂O),[
11,
12] and the abatement of volatile organic compounds (De-VOCs).[
13,
14,
15] Previous studies have demonstrated that the method of Cu incorporation into the HAP significantly affects the speciation and distribution of copper, thereby influencing catalytic activity and selectivity. Copper species on HAP can adopt various forms depending on the preparation method, conditions used, and copper loading. Qu et al. [
16] identified five distinct locations for Cu species in HAP:
i) substitution of surface-exposed Ca²⁺ ions leading to dispersed Cu(II) clusters,
ii) deposition and structuring as bulk CuO or libethenite (Cu₂(OH)PO₄) on the surface,
iii) substitution at bulk Ca(2) or
iv) Ca(1) sites, and
v) location within the c-axis oriented channels as CuO particles. These different copper configurations vary in terms of accessibility and reactivity, influencing their suitability for different catalytic applications. In addition, approaches such as co-precipitation and post-synthesis functionalization of supports result in varying levels of Cu dispersion and structuring.
Co-precipitation has emerged as a particularly effective method for preparing Cu/HAP catalysts with good dispersion of copper species. In this approach, copper ions are incorporated into the hydroxyapatite lattice during the precipitation process, often resulting in isolated Cu(II) species that are surface-complexed with HAP groups or re-place calcium ions in the surface layers of the HAP structure. Recently, an innovative one-pot synthesis method based on co-precipitation followed by hydrogen treatment for copper exsolution has been developed by Costentin et al.[
10] This approach has shown to be highly effective in producing Cu/HAP catalysts with highly dispersed copper phases. The process promotes the migration of copper from the bulk to the surface under reducing conditions, forming highly active and accessible Cu species, which significantly enhance catalytic performance, particularly in NH₃-SCR. Such exsolution processes, inspired by similar phenomena in perovskite-based systems, allow for the precise tuning of Cu species while maintaining the structural integrity of the HAP support.
In post-synthesis functionalization, the metal speciation is particularly sensitive to the loading and contact time during preparation.[
12] At low loadings (<3 wt.%) and short contact times (up to
ca., 4h), copper predominantly forms isolated species that interact strongly with surface HAP groups or substitute surface-exposed calcium ions, resulting in highly dispersed CuO nanoclusters. These isolated species are often associated with higher catalytic activity for reactions such as VOC oxidation or NH
3-SCR due to their increased accessibility and optimal dispersion. At moderate loadings (up to 6 wt.%), slight copper aggregation into nanoparticles (~1.6 nm) begins to occur, while still maintaining significant catalytic activity. This behaviour has been recently observed in reactions such as N₂O decomposition, where vicinal copper sites are essential for achieving high N₂O decomposition activity. Higher loadings (>6 wt.%) and extended contact times (48 hours) lead to the aggregation of copper into larger CuO clusters, eventually resulting in the formation of the libethenite phase (Cu₂(OH)PO₄); this phase is catalytically inactive for most reactions. Each preparation method and set of conditions has distinct advantages, underscoring the importance of preparation strategies in tailoring Cu/HAP catalysts for specific applications.
Among the many reactions catalysed by Cu/HAP, the selective catalytic oxidation of ammonia (NH₃-SCO) has been less investigated despite its relevance. NH₃-SCO is a critical process for removing excess ammonia from industrial exhaust streams, converting it to nitrogen and water without forming undesirable by-products such as NO
x or N
2O.[
17] In the context of NH₃-SCO reaction, copper-containing zeolites have demonstrated superior performance due to their high catalytic activity and selectivity for nitrogen (N₂) production.[
18,
19] The efficiency of these catalysts is strongly dependent on the speciation of copper, which includes various forms such as isolated Cu²⁺ ions, CuO clusters, and Cu
xO
y nanoparticles. Several studies have shown that the isolated Cu²⁺ and Cu⁺ species are the primary active sites in this reaction, with CuO clusters also contributing to certain conditions. The activity of Cu/zeolites, such as Cu/SSZ-13, is primarily attributed to the redox cycling of Cu²⁺ and Cu⁺, which facilitates the oxidation of ammonia to nitrogen and water [
18,
20,
21] through internal selective catalytic reduction (i-SCR) mechanism. In this pathway, NH
3 is first oxidized to NO, which is then rapidly consumed by the SCR reaction, leading to the formation of N₂ and H₂O. This mechanism is supported by observations that NO is barely detected in the effluent at low temperatures, indicating its swift consumption in the reaction sequence.[
18,
22,
23] For this mechanism, the presence of copper species appropriately coordinated to a support and with suitable electronic properties is crucial.
This study explores the potential of Cu/HAP catalysts for the ammonia oxidation reaction, with a focus on how different preparation methods influence structural and catalytic properties. Specifically, one-pot co-precipitation and post-synthesis functionalization of HAP were employed to synthesize Cu/HAP with varying Cu loading. The relationship between Cu dispersion at the surface, its oxidation state, and catalytic performance in NH₃-SCO was thoroughly examined.
2. Results
Two series of catalysts were prepared by introducing copper into hydroxyapatite
via one-pot co-precipitation (OP) or post-synthesis deposition (D) methods, as described in detail in
Section 4.1 (Materials and Catalyst Preparation).
Scheme 1 schematically illustrates the experimental conditions for the synthesis of the Cu/HAP catalysts and the variations in the operative parameters among the different samples, particularly the copper loading. In brief, one-pot co-precipitation synthesis involved copper ion incorporation into the HAP lattice during its formation, giving rise to an expected homogeneous copper distribution throughout the final particles, from bulk to surface. In contrast, in post-synthesis deposition, copper is loaded onto the surface of preformed HAP powder, making in principle all the added copper accessible at the surface. The two different preparative strategies are expected to impact copper dispersion and structuring.
Table 1 summarizes the copper loading, surface area values, and porosity features of the Cu/HAP catalysts studied. In general, copper was quantitatively incorporated into the catalysts using both preparation methods. The actual copper loading, determined by ion chromatography (IC) analysis, closely matched the nominal values (3 wt.% or 6 wt.%) for all catalysts, except for Cu/HAP
OPS and Cu/HAP
D,F, which exhibited slightly lower Cu contents (4.5-4.6 wt.%) compared to the nominal value (6 wt.%). The lower Cu loading in Cu/HAP
OPS was likely due to the highly concentrated ammonium hydroxide in the synthesis medium. Since copper was introduced only at the final stage, it encountered an ammonia-rich environment, where strong complexation with ammonia likely stabilized the copper ions, limiting their incorporation into HAP (see
Scheme 1). Concerning Cu/HAP
D,F, its lower loading compared to nominal value was expected due to the short contact time (0.25 h) between the Cu-salt precursor and HAP powder (
Scheme 1), which limited copper adsorption on the HAP surface.
The adsorption/desorption isotherms and pore size distributions of the Cu/HAP samples, presented in Fig. S.1, showed that all samples exhibited the profile and hysteresis loop typical of mesoporous materials. Surface area values ranged from 55 to 75 m
2 g
-1, while the average pore size and pore volume values were in the range 8.5-12 nm and 0.2-0.3 cm
3 g
-1, respectively. These values align with those of bare and calcined hydroxyapatites, indicating that copper modification did not significantly affect the pristine mesoporosity of HAP, as already reported in our previous works.[
6,
7] The only exception was Cu/HAP
OPC sample, synthesized via conventional co-precipitation, which exhibited a higher surface area (95 m
2 g
-1) and the smallest average pore size (4.9 nm) of all the other samples. This suggests that conventional co-precipitation produced smaller Cu particles compared to the other synthesis/preparation methods.
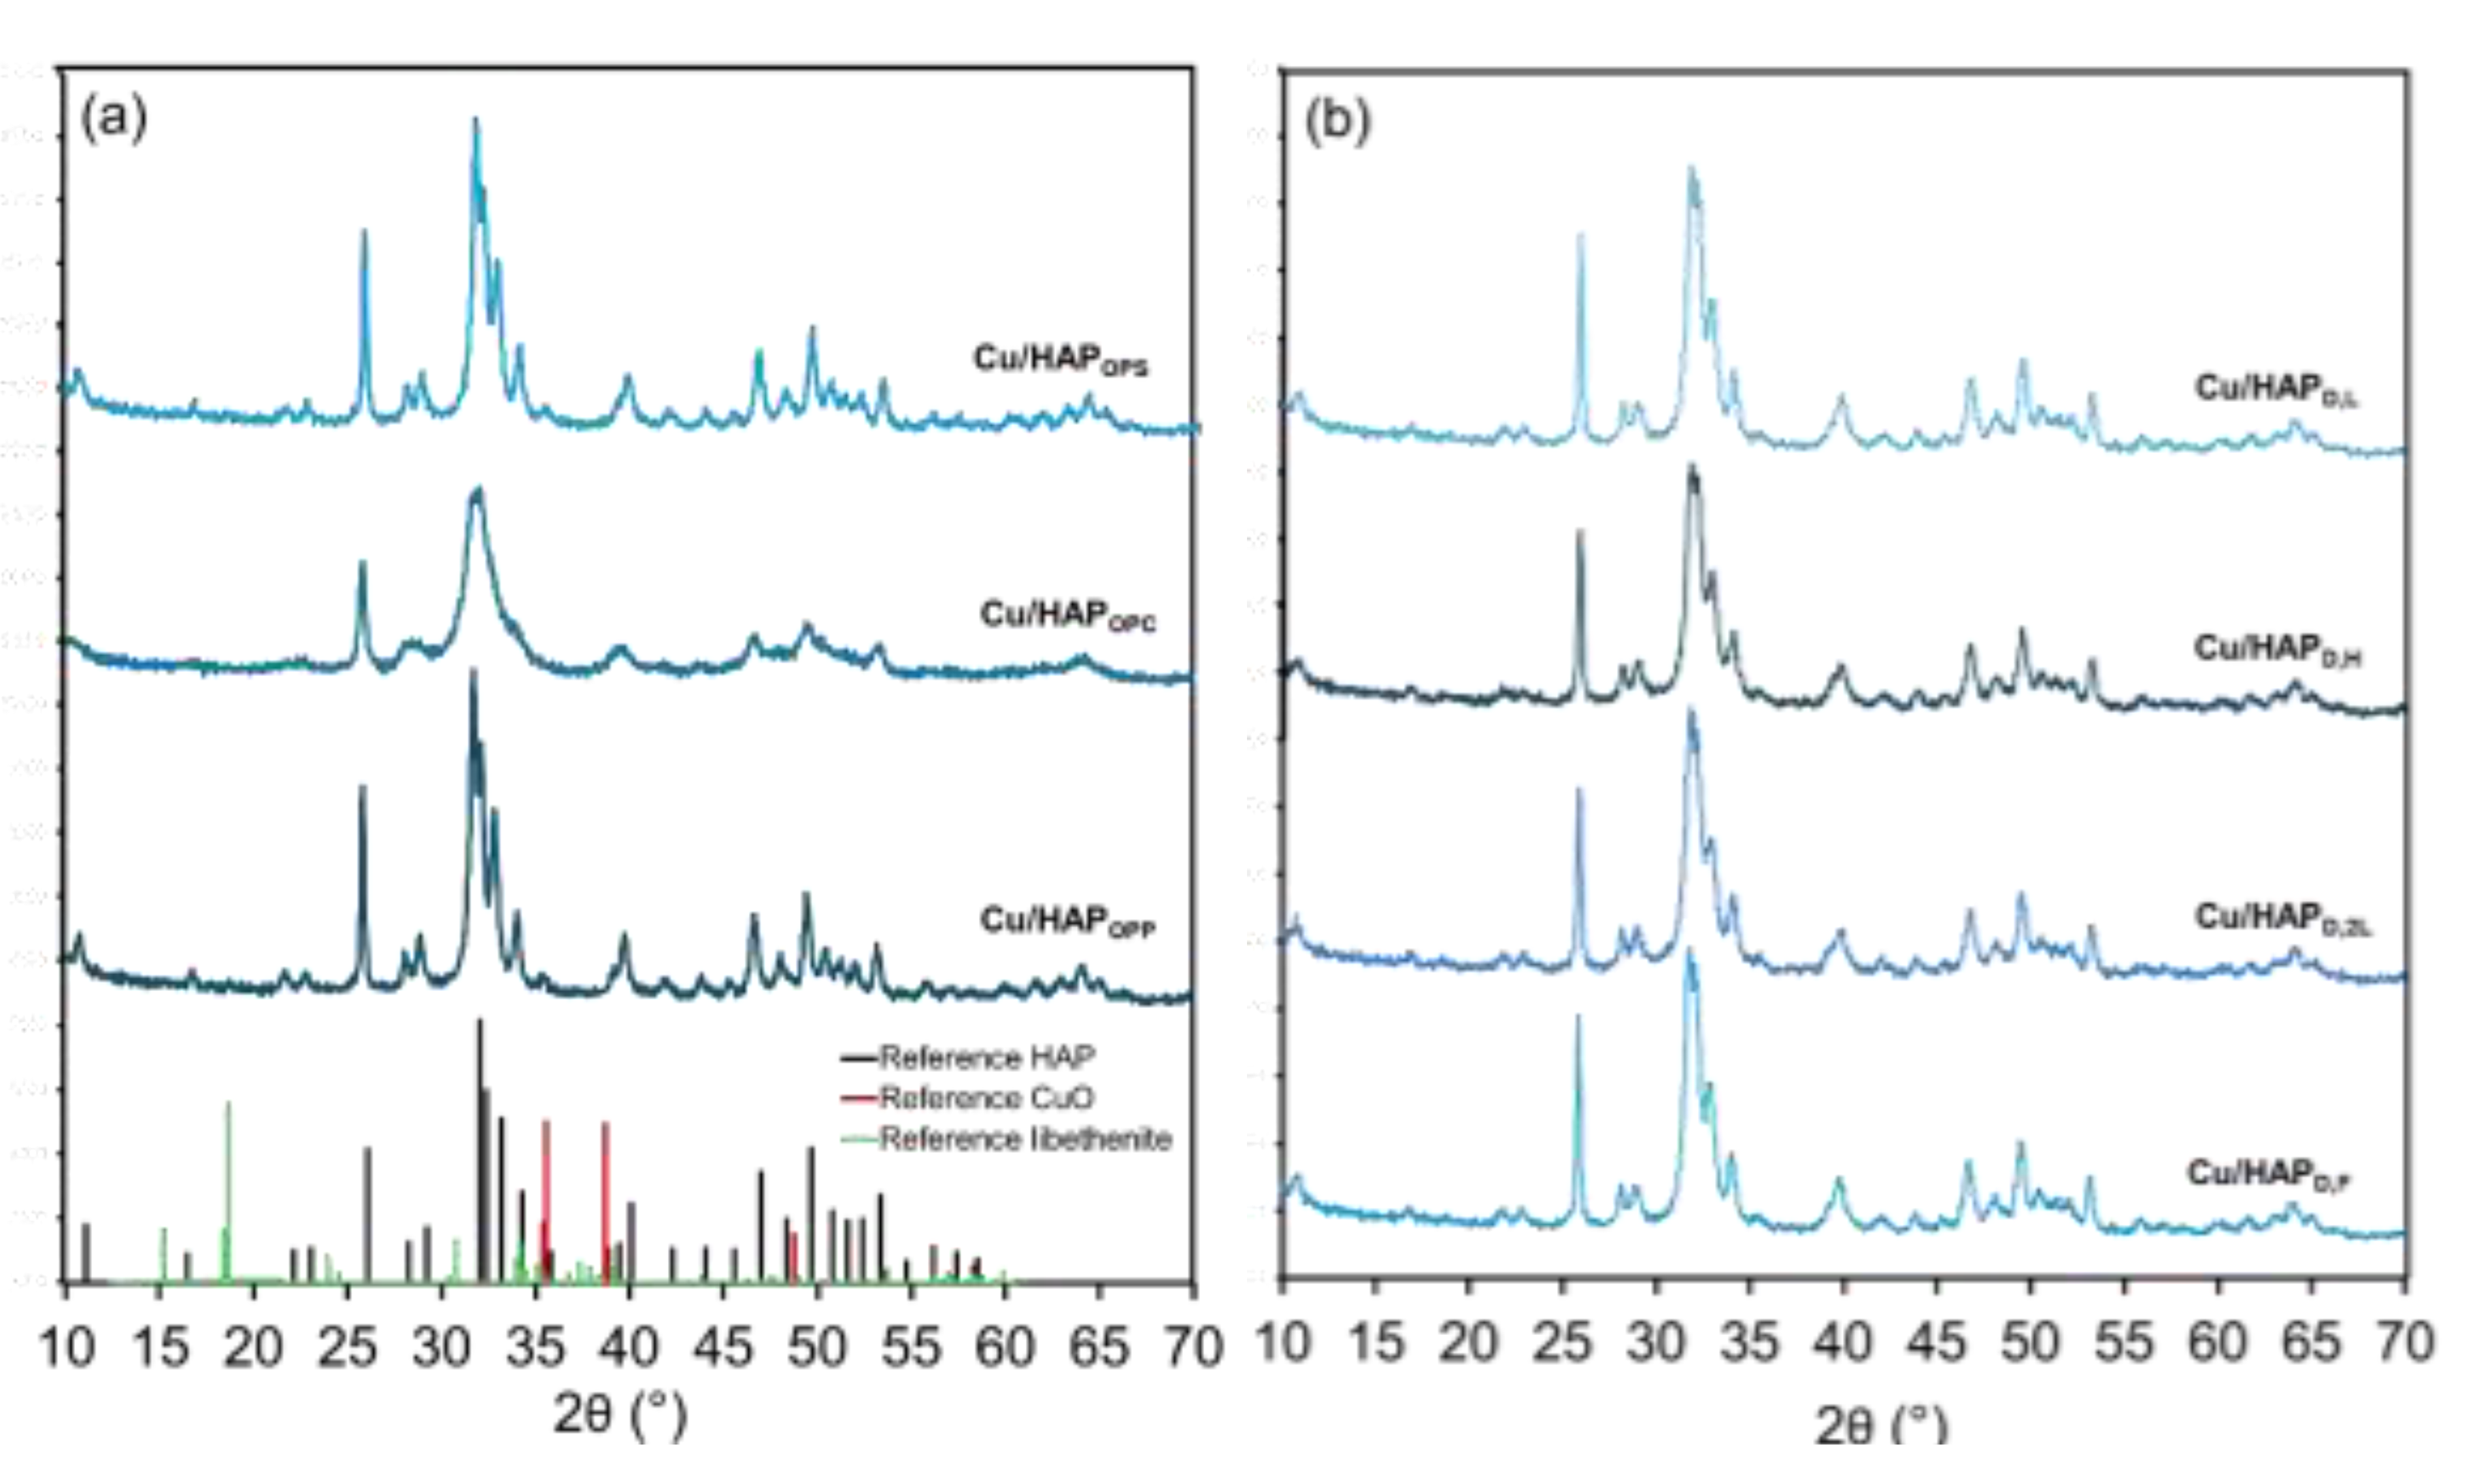
The XRD patterns of the samples (Fig. 1) confirmed the presence of the hydroxyapatite phase (JCPDS: 00–09–0432) in a hexagonal space group, as indicated by the characteristic peaks at 2θ values of 26.1°, 28.2°, 32.0°, 33.2°, 40.1°, 46.9°, and 48.5°, corresponding to the (002), (012), (211), (300), (310), (222), and (320) planes, respectively. Notably, no CuO or libethenite (Cu
2PO
4OH) phases were detected, indicating that copper was highly dispersed within the HAP matrix without segregation into crystalline copper-containing phases. However, given the relatively low copper content, the presence of minor Cu-containing secondary phases cannot be entirely ruled out. All the collected diffractograms displayed sharp peaks, except for Cu/HAP
OPC, which has broader peaks, suggesting the presence of smaller particles, in agreement also with the surface area measurements (
Table 1).
Figure 1.
X-ray powder diffraction (XRPD) patterns of Cu/HAP samples prepared by (a) one-pot coprecipitation and (b) post-synthesis deposition methods. Standard XRD patterns for hydroxyapatite (in black, JCPDS: 00–09–0432), copper(II) oxide (in red, JCPDS: 048-1548) and libethenite (in green, JCPDS: 01–083–2264) are reported in the bottom part of panel (a).
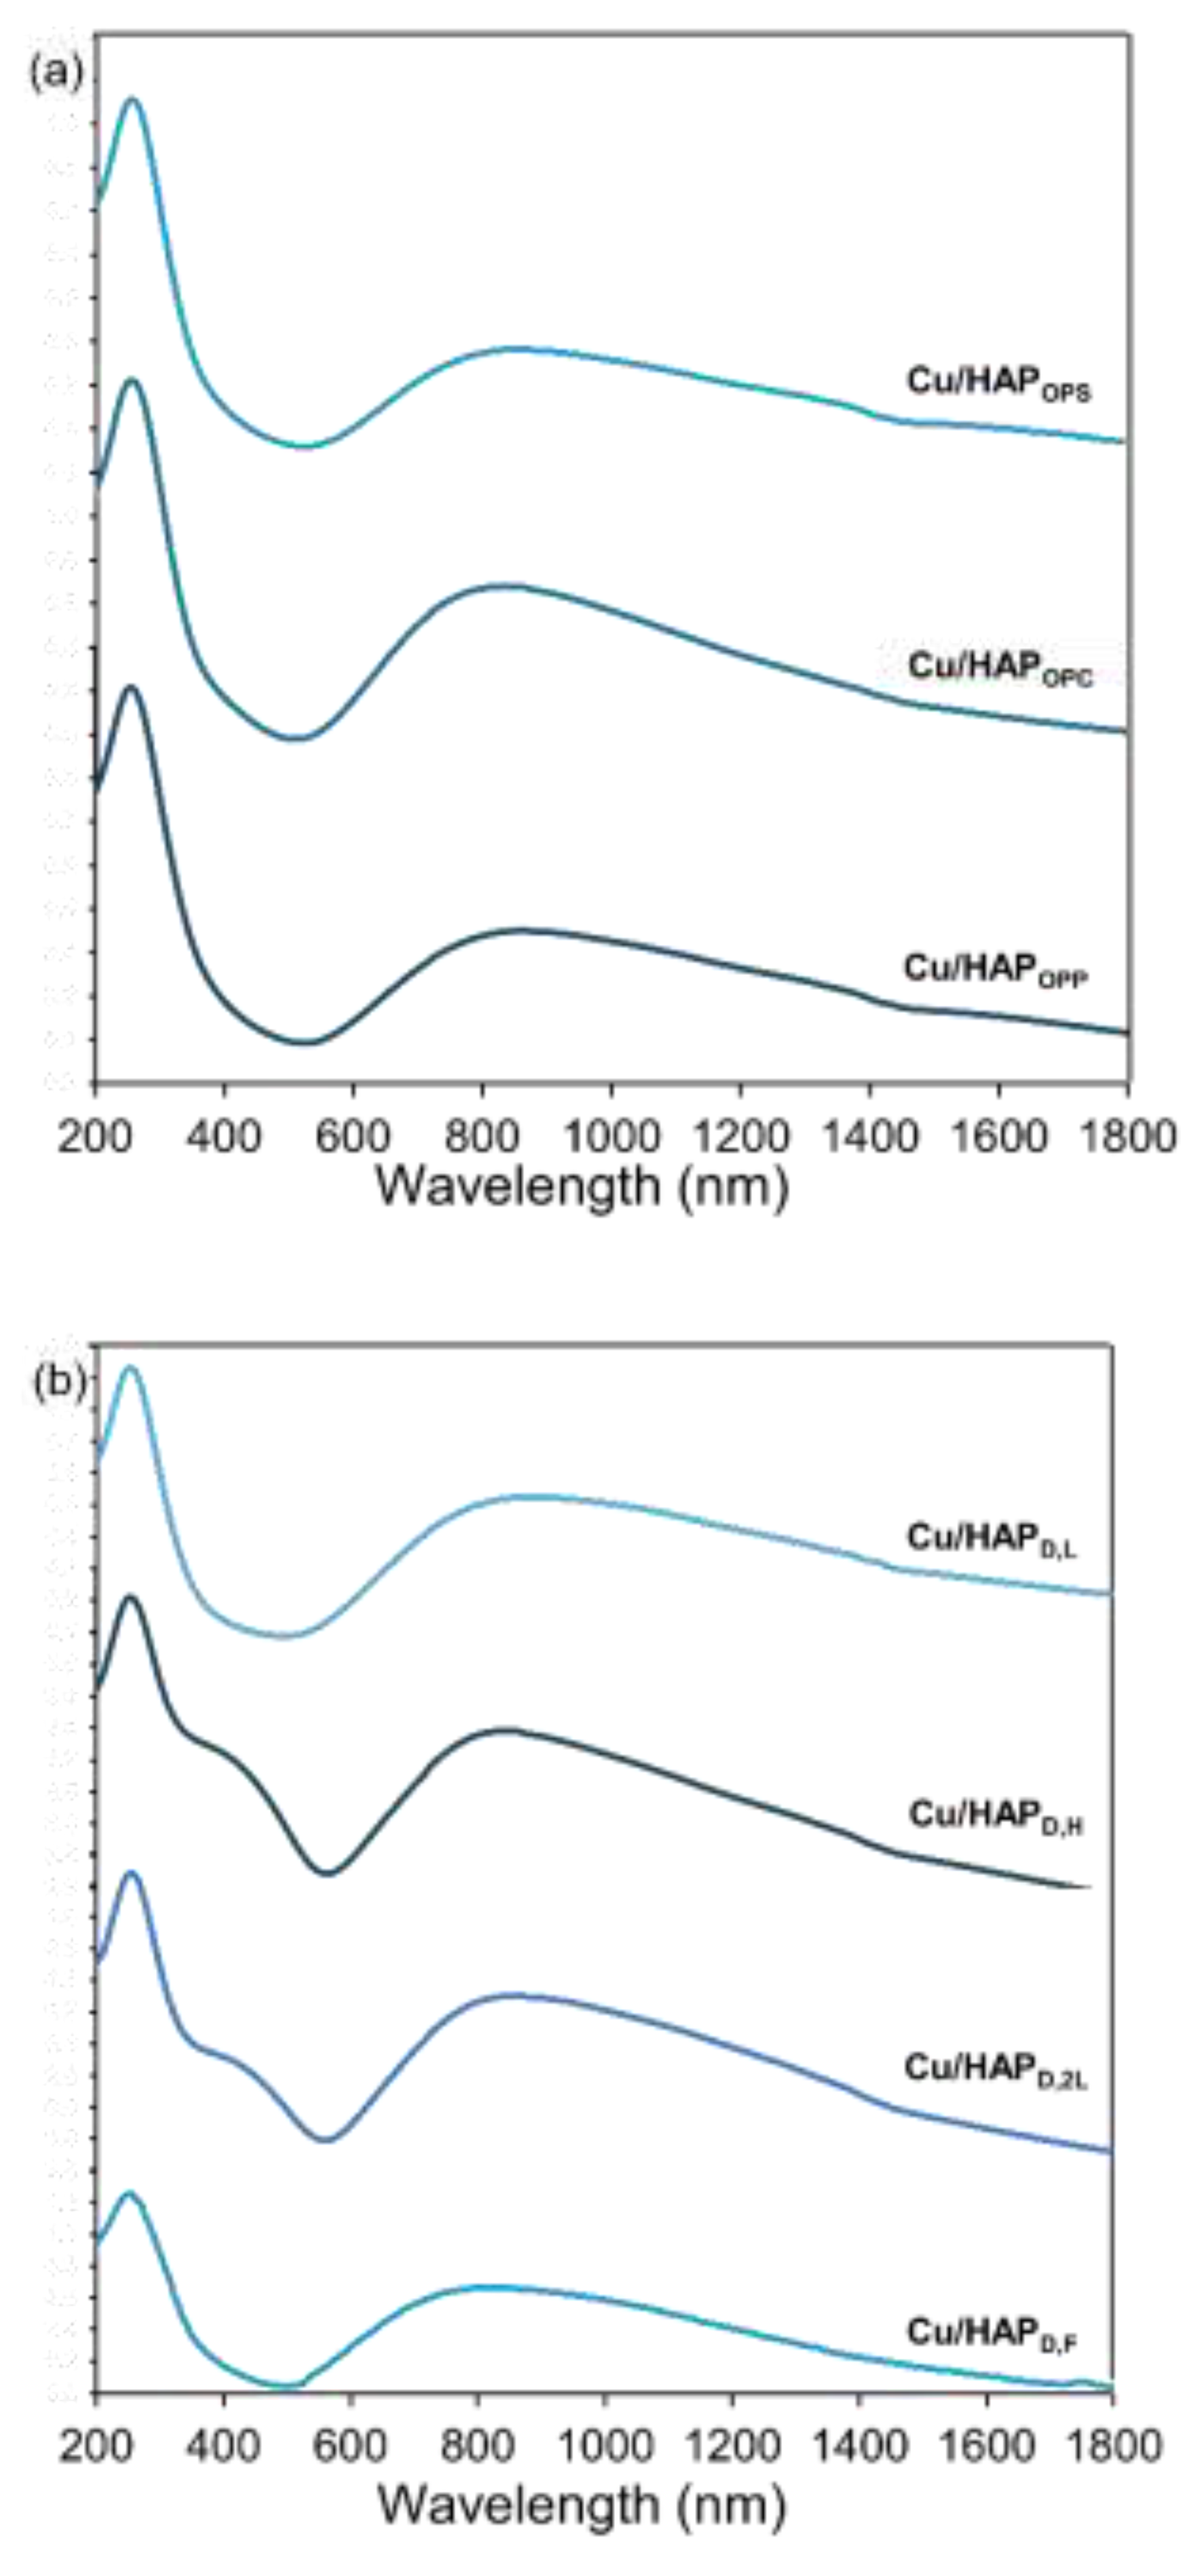
To gain insights into the coordination and aggregation state of copper in all samples, UV-Vis-DR spectra were recorded at room temperature over the 200-2000 nm wavelength range. The resulting spectra (Fig. 2) exhibited multiple complex bands, far from being simple to assign; a tentative interpretation, provided through sub-band decomposition, is shown in Fig. S.2 and Table S.1.[
25]A broad absorption band between 590 and 1000 nm, centred around 850 nm, was observed in all Cu/HAP samples, along with a distinct narrow band at approximately 200 nm. The broad band is attributed to d–d transitions of Cu
2+ ions in a pseudo-octahedral oxygen ligand environment, suggesting copper species occupying substitutional lattice positions or existing as dispersed nanoparticles. The narrow band near 200 nm corresponds to the O → Cu
2+ ligand-to-metal charge transfer (LMCT) transition, which involves lattice oxygen and isolated mononuclear Cu
2+ centres.
Additionally, a pronounced shoulder at 420 nm was observed exclusively in the samples prepared via post-synthesis functionalization with high copper loading (6 wt.%). This feature is likely associated with Cu–O–Cu complexes, indicative of partial copper structuring in these samples, which was made possible by the high contact time and copper concentration adopted in the post-synthesis method.
XPS analysis was carried out to elucidate the surface composition as well as the chemical states of copper on the sample surfaces.
The XPS survey spectra confirmed the presence of Ca, P, O, and Cu as the major elements present at the surface of Cu/HAP samples consistently with the expected composition of Cu/HAP catalysts. The additional presence of carbon was due to carbonate (CO32−) incorporation.
Table 2 gathers the atomic percentage (at%) of the elements observed on Cu/HAP catalysts.
Figure 2.
Diffuse Reflectance UV-vis (DR-UV) spectra of Cu/HAP samples prepared by (a) one-pot coprecipitation and (b) post-synthesis deposition.
Figure 2.
Diffuse Reflectance UV-vis (DR-UV) spectra of Cu/HAP samples prepared by (a) one-pot coprecipitation and (b) post-synthesis deposition.
Regarding the surface copper concentration, interesting evidence has emerged. Specifically, the highest surface copper concentration was found in the samples prepared via one-pot co-precipitation, with atomic percentages of Cu between 2.3% and 3.5%, whereas those prepared via post-synthesis deposition exhibited lower values, ranging from 1.5% to 1.9%, except for Cu/HAPD,F (2.5 %) as discussed below. This may seem counterintuitive, as post-synthesis deposition should lead to copper being primarily accommodated on the surface, thus resulting in higher Cu surface concentrations. However, the extended contact time between the copper solution and the HAP solid during the deposition process likely facilitated the formation of structured copper species. As a result, despite being present uniquely at the surface, copper was not highly dispersed but rather gave rise to CuO nanoaggregates, as indicated by DR-UV spectroscopy. This interpretation is further supported by the observation that the sample prepared by post-deposition of copper but with shorter contact time (Cu/HAPD,F) exhibited a high copper percentage (2.5 %), comparable to that of samples prepared through co-precipitation method. In contrast, co-precipitation appeared to facilitate the gradual incorporation of copper into the HAP lattice, leading to a more homogeneous and dispersed distribution, including in surface layers.
Moreover, from data in
Table 2 it appears that XPS Ca/P and (Ca+Cu)/P ratios were consistently lower than the bulk stoichiometric values in all the samples. This discrepancy has been widely reported in the literature for hydroxyapatite and other calcium phosphate materials, and it might be due to the instability of the materials under prolonged exposure to the X-ray source as well as to surface reconstruction and segregation phenomena.
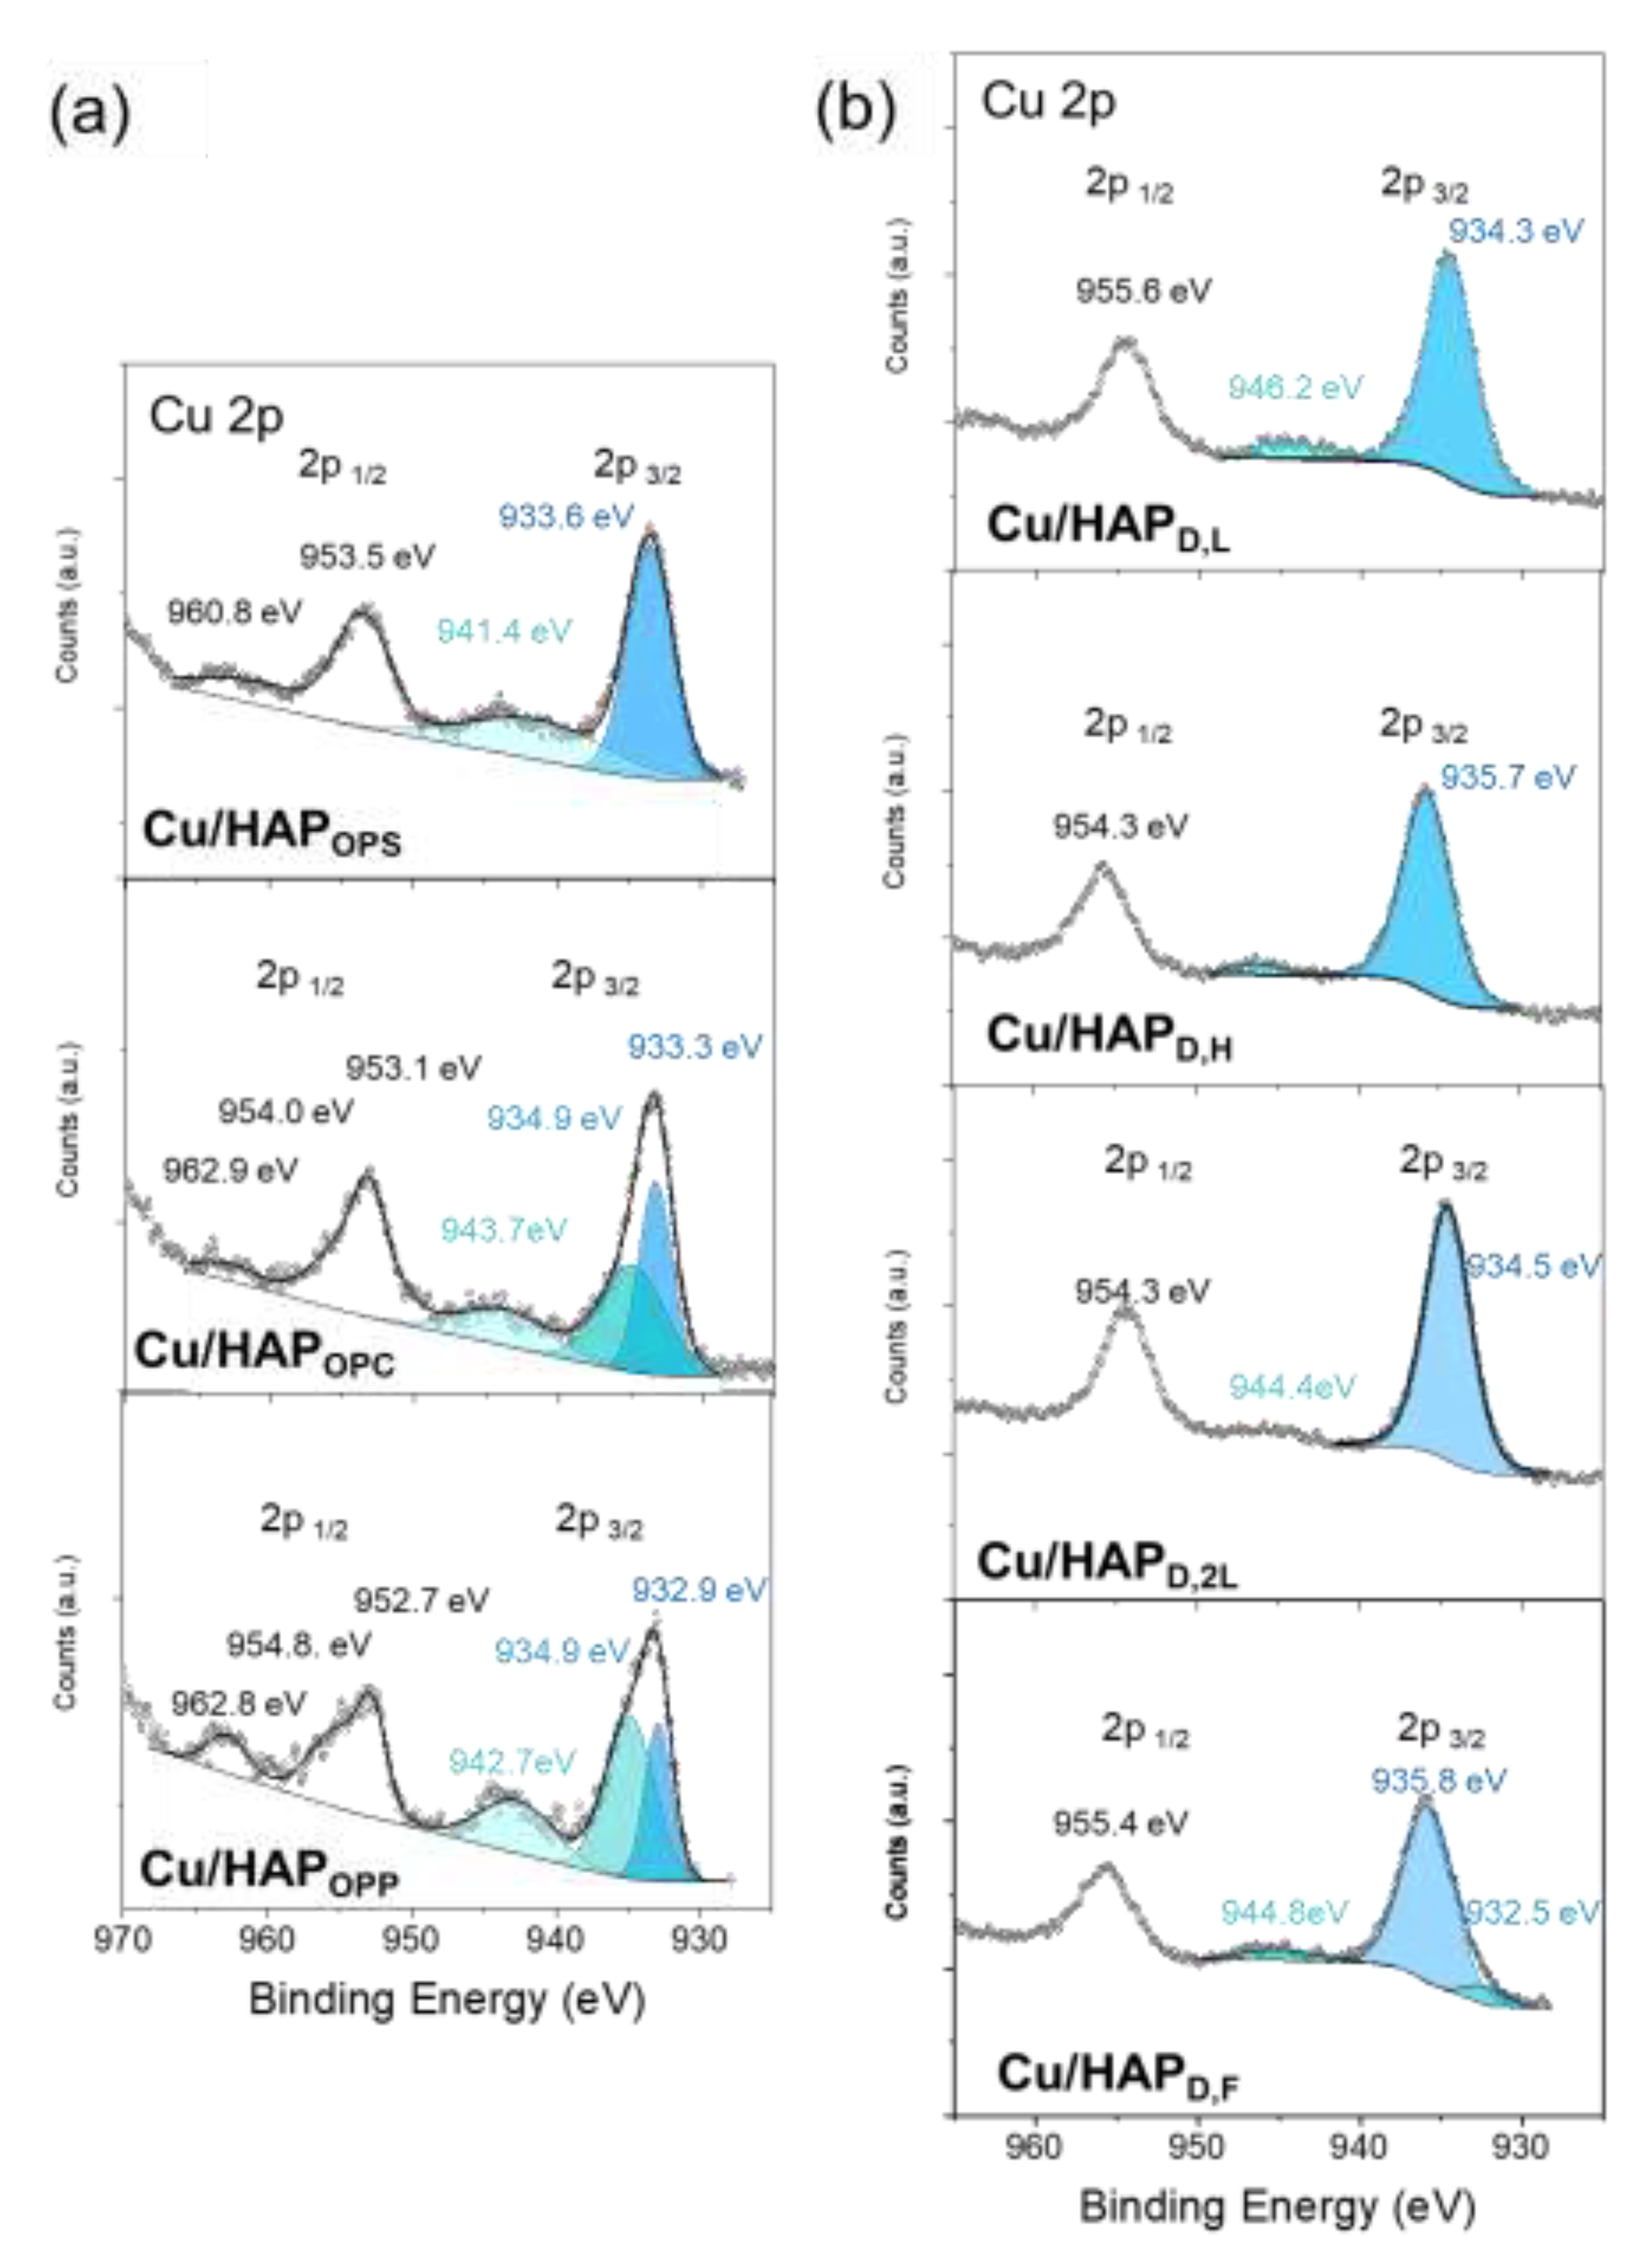
Figure 3 reports the high-resolution Cu 2p spectra of Cu/HAP samples, which show spin–orbit splitting into Cu 2p
3/2 (930-935 eV) and Cu 2p
1/2 (950-960 eV) peaks. Since both peaks convey similar chemical information, the attention was focused only on the 2p
3/2 region.
A clear difference in Cu 2p characteristic peaks can be seen by fitting procedure between the catalysts prepared by one-pot coprecipitation and those obtained by post-synthesis deposition.
In the catalysts prepared via one-pot coprecipitation, the primary peak appears at a binding energy of approximately 933 eV. While this binding energy is consistent with both Cu(I) and Cu(II) oxidation states, the presence of a strong satellite peak between 941 and 944 eV, along with the observed spin–orbit splitting of around 20 eV between the Cu 2p
3/2 and Cu 2p
1/2 peaks, suggests that copper is predominantly present as isolated Cu(II). Additionally, a smaller shoulder peak (934.9 eV) is observed in the Cu/HAP
OPC and Cu/HAP
OPP samples; this signal is typical of Cu(OH)
2 environment and can be attributed to copper in interstitial positions along the hexagonal channel, which during calcination forms [O
2–– Cu
2+– O
2–] moieties.[
26,
27]
In contrast, the analysis of samples prepared via post-synthesis deposition reveals the absence of the 933 eV component, and thus Cu species are not present as isolated centers on catalyst surfaces. Instead, the primary peaks are centered at approximately 934 eV for Cu/HAP
D,L and Cu/HAP
D,2L, corresponding to Cu(OH)
2 and ascribable to oligomeric [O
2–– Cu
2+– O
2–] moieties, and at 935.7 eV for Cu/HAP
D,H and Cu/HAP
D,F, which can be attributed to nanostructured CuO/CuCO
3. Regarding this difference in copper speciation, among the post-synthesis samples, an interesting correlation seems to emerge between copper speciation and copper concentration in the precursor salt solution used for deposition. Specifically, in Cu/HAP
D,L and Cu/HAP
D,2L samples prepared using a less concentrated copper nitrate solution (0.08 M, see
Scheme 1), the predominant species is interstitial Cu
2+, whereas by using higher concentration solutions (0.16 M, see
Scheme 1) formation of copper nanostructures in Cu/HAP
D,H and Cu/HAP
D,F is observed. This phenomenon could be attributed to the differing acidity of the precursor salt solutions, which correlates with copper concentration: the higher the copper concentration, the more acidic the environment. The increased acidity may partially dissolve HAP, leading to the reprecipitation of nanoaggregates containing copper.
The catalytic performances of bare HAP and Cu/HAP samples in NH3-SCO reaction were evaluated by feeding a gaseous mixture containing ammonia (ca. 300 ppm), oxygen (ca. 10000 ppm) and nitrogen (as inert) in a fixed bed reactor at a GHSV of 120,000 h-1. Along with NH3 consumption and N2 formation, even NO, N2O and NO2 production from side reactions was monitored through FT-IR spectrophotometry.
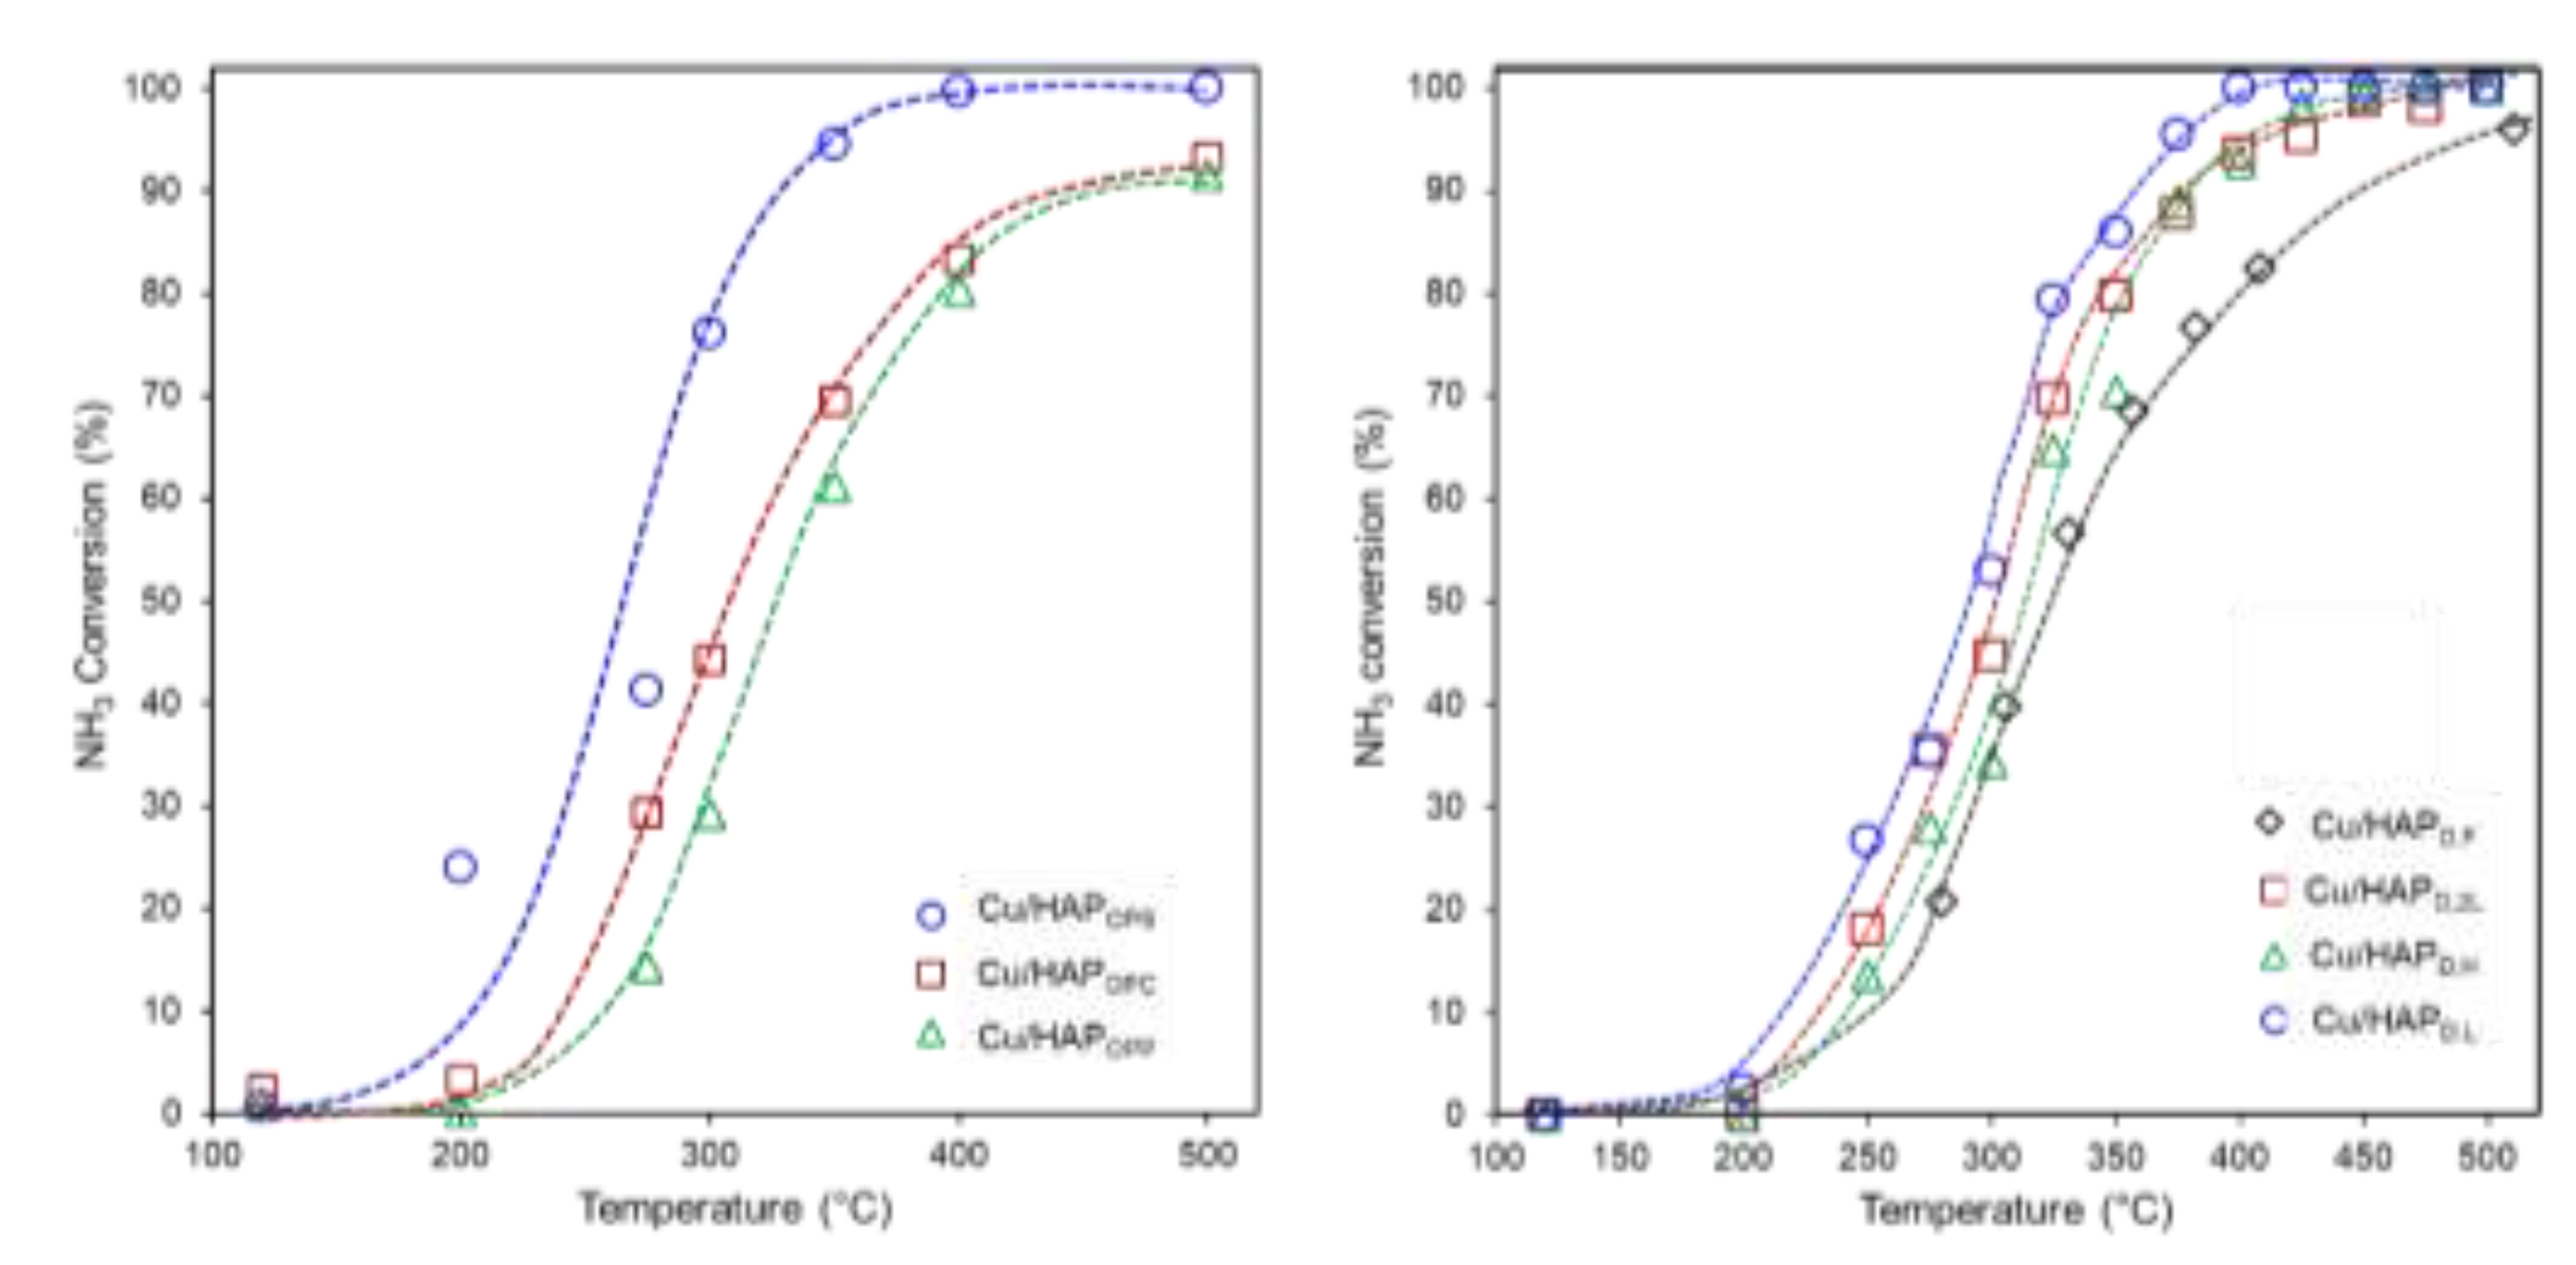
The catalytic results are shown in Fig. 4 as plots of NH
3 conversion as a function of the temperature, while values of selectivity to N
2 at fixed temperature (350°C) are listed in
Table 3.
Catalytic tests confirmed that bare HAP exhibited negligible oxidation activity (Fig. S.3), highlighting the crucial role of copper in enabling efficient NH₃ oxidation. Regardless of the preparation procedure, all Cu-containing catalysts exhibited significant catalytic activity in the 300–400°C range, with good selectivity toward N₂, the desired product. Overall, the best catalytic performance was observed at 350°C, where NH₃ conversion surpasses 90% (Fig. 4) while maintaining relatively high N₂ selectivity. However, excessive oxidation beyond this temperature led to the overproduction of nitrogen oxides (in particular, N2O and NO), limiting the practical catalyst efficiency.
Variations in Cu loading and preparation method influenced both the conversion efficiency and the selectivity trends. Among the Cu/HAP one-pot catalysts (
Figure 4a), Cu/HAP
OPS demonstrates the best catalytic performance, with an onset temperature of 200°C and NH
3 conversion exceeding 90% at 350°C. In contrast, Cu/HAP
OPC and Cu/HAP
OPP showed lower catalytic activity, requiring temperatures of 500°C to achieve similar NH
3 conversion levels. Despite this, these two catalysts exhibited higher selectivity toward N
2, particularly Cu/HAP
OPP (Figure S.4 and
Table 3). The high N
2 selectivity at 350°C suggests that these catalysts may favor a reaction pathway that minimizes the formation of undesired nitrogen oxides. However, above 350°C, N
2 selectivity declined sharply, indicating increased formation of nitrogen oxides such as N
2O, NO, and NO
2. This behavior reflects with the well-known mechanism of ammonia oxidation, where at higher temperatures, excessive oxidation promotes the formation of oxidized nitrogen species. [
28,
29]
For catalysts prepared via deposition, Cu/HAP
D,L exhibited the highest catalytic activity, achieving >90% NH
3 conversion before 400°C. Cu/HAP
D,2L and Cu/HAP
D,H displayed comparable performance (
Figure 5, b), with conversion efficiencies approaching those of Cu/HAP
D,L. On the other hand, Cu/HAP
D,F exhibited significantly lower activity, reaching ~90% NH₃ conversion only at 500°C (
Figure 5,b).
Based on catalytic performance, evaluated as NH3 conversion to N2, the following ranking, computed at 350°C, can be established:
Cu/HAPOPS > Cu/HAPD,L > Cu/HAPD,2L > Cu/HAPD,H ≈ Cu/HAPD,F > Cu/HAPOPC > Cu/HAPOPP.
This ranking highlights that an optimal NH₃-SCO catalyst could be designed by enhancing NH₃ conversion, which requires high copper dispersion on the surface, or by achieving high N₂ selectivity through a judiciously structured copper surface.
3. Discussion
The present study aimed to provide significant insights into the impact of preparation methods and copper loading on the structural and catalytic properties of Cu-modified hydroxyapatite (Cu/HAP) catalysts for NH₃-SCO reaction. The comparative analysis of Cu features in the samples obtained via one-pot co-precipitation and post-synthesis deposition methods highlights critical differences in copper dispersion, structure, and catalytic efficiency.
A key finding is that the one-pot co-precipitation method facilitated higher copper dispersion, as evidenced by the XPS results showing an increased surface copper concentration (2.5-3.5% at.) compared to post-synthesis deposition (1.5–1.9% at.). This is attributed to the gradual incorporation of Cu²⁺ into the HAP lattice during synthesis, preventing the formation of large CuO clusters. In contrast, prolonged contact time in the post-synthesis deposition method promotes copper aggregation into larger nanoaggregates, as indicated by the UV-Vis and reduces effective catalytic surface area. These results corroborate findings from previous studies on metal-doped hydroxyapatites ad other inorganic supports, where uniform metal dispersion enhances catalytic activity.[
30,
31,
32]
XPS analysis further confirms that Cu/HAP catalysts prepared by one-pot co-precipitation predominantly contained isolated Cu²⁺ species, which are known to enhance catalytic activity in NH₃-SCO due to their ability to participate in redox cycles.
The post-synthesis catalysts, particularly those prepared with extended deposition times, exhibited Cu(OH)₂ and nanoaggregates of CuO-like species, which are often associated with lower catalytic performance, in particular, low selectivity. The presence of a Cu 2p peak at ~935.7 eV in post-synthesis samples suggests an increased contribution from CuO/CuCO₃ phases, which are less catalytically active in NH₃ oxidation.
Regarding catalytic performance, Cu/HAP
OPS emerges as the most effective catalyst, achieving >90% NH₃ conversion at 350°C with high N₂ selectivity (~84%). This superior performance aligns with the hypothesis that well-dispersed Cu species promote selective oxidation pathway favouring N₂ formation over undesired over oxidated by-products such as NO and N₂O. Cu/HAP
OPP, despite having the highest Cu surface concentration (3.53%), exhibited lower overall conversion while maintaining high N₂ selectivity (~89%), suggesting that additional factors, such as the oxidation state and local coordination environment, as well as accessibility, influence overall catalytic efficiency. In particular, considering the HR-XPS peak in the Cu 2p
3/2 region (933-935 eV) and its decomposition in sub-bands (Fig.3), Cu/HAP
OPS presented one only contribution centred at ~933.6 eV, typical of high electron density copper-species, while Cu/HAP
OPP presented two different contributions for the 2p
3/2 peak (932.9 and 934.9 eV) indicating more complex coordinative environment for copper. Additionally, due to differences in synthesis conditions (
Scheme 1), Cu species might be preferentially located on the surface in Cu/HAP
OPS, while in Cu/HAP
OPC and Cu/HAP
OPP, they are present in both the bulk and surface regions.
Interestingly, the performance of catalysts prepared via post-synthesis deposition varied significantly with copper loading and contact time. Cu/HAPD,L, with a moderate copper content (3.1 wt.%), exhibited high NH₃ conversion (>90% at 350°C) and N₂ selectivity (85.3%), comparable to the best co-precipitated sample. However, increasing Cu loading (Cu/HAPD,H and Cu/HAPD,2L) did not proportionally enhance performance, implying an optimal dispersion threshold beyond which aggregation counteracts catalytic benefits. This is even more evident in the case of Cu/HAPD,F. Indeed, although this catalyst exhibited the highest surface copper concentration among the post-synthesis series, according to XPS, it ultimately resulted in the poorest NH₃ conversion and a high production of undesired nitrogen oxides. This behavior may be attributed to the non-optimal dispersion of copper, which, despite being located on the surface, is present in the form of copper oxide nanoaggregates, as suggested by the HR Cu 2p₃/₂ peak analysis.
These findings reinforce the importance of synthesis strategy in tailoring Cu/HAP catalysts for optimal NH₃-SCO performance.
Figure 5 summarizes the relationship between copper phase properties and catalytic performance. Specifically, the observed catalytic ranking can be explained by considering four key factors: copper structuring, surface concentration, accessibility, and catalyst surface area.
The one-pot co-precipitation method proves more effective in generating highly dispersed and catalytically active Cu species, although part of these species might be not accessible, being accommodated in the bulk. Post-synthesis deposition requires precise control of loading and contact time to avoid detrimental aggregation.
4. Materials and Methods
4.1. Materials and Catalyst Preparation
(NH4)2HPO4, ≥ 98% purity, NH4OH solution, 28-30% w/w, Cu(NO3)2∙3H2O, > 99% purity, oxalic acid, 50 mM, > 99% purity were from Sigma Aldrich (Germany).
Ca(NO3)2∙4H2O, ≥ 99% purity and lithium hydroxide > 95⋅mM, > 95% purity and HCl solution, 37 wt.%, were from Carlo Erba (Italy); (NH4)H2PO4, ≥ 98% purity, was from Fine Chemicals Inc. Milli-Q® water purification system by Merck Millipore. Lithium hydroxide, 95mM, > 99% purity, from Carlo Erba. Oxalic acid, 50 mM, ≥ 99% purity, from Sigma-Aldrich. Barium sulfate, extrapure reagent, from Nacalai Tesque Inc., USA
Complexometric indicator solution, 4-(2'-pyridylazo)-resorcinol free acid, 96% purity from Sigma-Aldrich, 0.4 mM in NH4OH, 30% purity, from Carlo Erba, and acetic acid, pure reagent, from Carlo Erba was employed
Stoichiometric (Ca/P=1.67) bare HAP was synthesized by conventional coprecipitation method starting from diammonium hydrogen phosphate ((NH4)2HPO4) and calcium nitrate tetrahydrate (Ca(NO3)2∙4H2O) as phosphate and calcium precursors, respectively. Each preparation batch assured the obtainment of about 4 g of HAP. In short, 250 cm3 of a 0.167 M solution of Ca(NO3)2∙4H2O was added dropwise, through a peristaltic pump, to a 250 cm3 of a 0.100 M solution of (NH4)2HPO4 previously stirred and thermostated at 80°C in a 5-necked flask.
Dropping rate was fixed at about 1.65 cm3/min and pH value (about 10) was maintained constant during the synthesis by proper addition of a 28-30% solution of ammonium hydroxide solution by means of a titrator (736 GP Titrino by Metrohm, Herisau, Switzerland). The as-obtained suspension was cooled down to room temperature and aged under mild stirring for about 20 h. It was then filtered and washed with Milli-Q® water, until neutral pH. The as-obtained white solid was dried at 80°C under moderate vacuum for 8h to remove the excess of ammonia and finally dried at 120°C overnight.
Seven Cu-containing hydroxyapatite (HAP) samples were prepared, employing two distinct methodologies. Three samples were synthesized via a one-pot coprecipitation procedure, and four were through a deposition process onto preformed HAP. Each preparation yielded approximately 4 g of sample with a nominal total copper content of 3 wt.% or 6 wt%.
The one-pot coprecipitation method integrated a copper precursor salt during HAP synthesis, enabling the incorporation of copper into the sample crystal structure. In this process, solutions of Cu(NO₃)₂·3H₂O and Ca(NO₃)₂·4H₂O were added to an (NH₄)H₂PO₄ solution, which served as the phosphate precursor. In this case, the use of (NH₄)H₂PO₄ over (NH₄)₂HPO₄ was preferred for maintaining a pH of ~7, preventing the precipitation of copper as hydroxide.
Three variations of the coprecipitation procedure were implemented:
One-Pot-Superficial (OPS): a dropwise addition of a 0.167 M Ca(NO₃)₂·4H₂O solution followed by a 0.176 M Cu(NO₃)₂·3H₂O solution to a 0.100 M (NH₄)H₂PO₄ solution, using a peristaltic pump (1.65 cm³·min⁻¹); ii) One-Pot-Co-Alimented (OPC): simultaneous dropwise addition of 0.167 M solutions of Ca(NO₃)₂·4H₂O and Cu(NO₃)₂·3H₂O to a 0.100 M (NH₄)H₂PO₄ solution, also using a peristaltic pump (1.65 cm³·min⁻¹); and iii) One-Pot-Phosphate (OPP): a procedure identical to OPS but with a final addition of 3 mL of a 2 M H₃PO₄ solution, aimed at lowering the pH to avoid copper oxide aggregation or precipitation.
The resulting suspensions were cooled to room temperature and aged under mild stirring for 20 minutes. They were then filtered and washed with Milli-Q® water until neutral pH was achieved. The powders were dried under vacuum at 80°C for 8 hours, further dried at 120°C overnight at atmospheric pressure, and calcined at 500°C (1°C·min⁻¹) for 1 hour.
The three samples obtained were labelled as: Cu/HAPOPS (One-Pot-Superficial), Cu/HAPOPC (One-Pot-Co-alimented), and Cu/HAPOPP (One-Pot-Phosphate).
Four additional Cu-containing samples were prepared using a deposition procedure, where HAP powder was contacted with a solution of Cu(NO₃)₂·3H₂O. During the preparation of these samples, two operational parameters were varied: Cu-loading (3 wt.% and 6 wt.%) and contact time between HAP and the Cu-salt solution (15 minutes or 48 hours).
For the preparation of approximately 4 g of each sample, HAP powder, pre-dried at 120°C overnight, was added to 250 mL of Cu(NO₃)₂·3H₂O solution (concentrations of 8.3⋅10⁻³ M or 1.7⋅10⁻² M, corresponding to 3 wt.% or 6 wt.% Cu loading, respectively). The mixture was stirred at 40°C for 48 hours. The samples were then filtered, washed with Milli-Q water, dried overnight at 120°C, and finally calcined at 500°C at a rate of 1°C·min⁻¹ for 1 hour.
The resulting samples were labelled as Cu/HAPD,L, Cu/HAPD,H, and Cu/HAPD,2L. The latter sample was prepared by repeating the described procedure twice. Additionally, another sample, labelled as Cu6/HAPD,F, was prepared following the same procedure but with a shortened contact time of 15 min between HAP and the Cu-salt solution.
4.2. Catalyst Characterization
The determination of copper loading in the prepared HAP-based samples was performed using a Dionex C-120 ion chromatograph equipped with a UV-Vis detector. The system was fitted with a CS5 column containing a negatively charged resin as the stationary phase and used a 95 × 10⁻³ M lithium hydroxide solution as the eluent.
As eluent, a solution of lithium hydroxide, 95mM, purity 99%, from Carlo Erba and oxalic acid, 50 mM, purity ≥ 99%, from Sigma-Aldrich was used. A complexometric indicator solution constituted by 4-(2'-Pyridylazo)-resorcinol free acid (0.4 mM, purity 96%, from Sigma-Aldrich) in NH4OH (purity 30%, from Carlo Erba) and acetic acid (pure reagent, from Carlo Erba) was added to the eluent to allow the detection of copper ion by an UV-vis detector.
To obtain a calibration line for the Cu-determination, a commercial multi-standard of various metal ions, (10 components, 1000 ppm each, from AreaChem) was employed to make three standard solutions with concentration 1, 5, and 10 ppm.
Copper concentration of the samples was double-checked both on digested solids (after mineralization with HCl 37 wt.%) and on filtrated solutions.
Specific surface area (S.A.) and porosity (pore volume and pore size) were determined by N2 adsorption/desorption isotherms collected at -196°C, using an automatic analyser of surface area (Sorptomatic 1990 by Carlo Erba Instruments, Italy).
Prior to the analysis, the sample (ca. 0.30 g, pressed, ground, and sieved to a particle size range of 80–200 mesh) was outgassed at 350°C for 4 h under vacuum to remove water and other volatile organic compounds adsorbed on the surface. The specific surface area (S.A.) was calculated using the Brunauer-Emmett-Teller (BET) two-parameter equation in the p/p0 range of 0.05–0.3. Pore volume and pore size were determined from the desorption branch (0.3 < p/p0 < 0.95) of the collected isotherms using the Barrett-Joyner-Halenda (BJH) model equation.
The structural characterization was performed by X-rays powder diffraction analysis using an Analytical XPERT PRO powder diffractometer fitted with copper tube (CuKα=1.54060 Å). The X-ray source operated at 40 kV and 25 mA with the following method: type of scan: continuous; angle (2θ): 5°-65°; step size (2θ): 0.033°; scan rate: 50 s; and total time: 14 min.
The obtained diffractograms have been compared with the reference XRPD patterns present in the JCPDS-ICDD database.
UV-vis diffused reflectance spectra (UV-DRS) were recorded in 200-2600 nm region using a UV-3600 Plus (Shimadzu, Kyoto, Japan) spectrophotometer, equipped with an ISR-603 integrating sphere for solids.
The sample powders were finely pressed in a circular sample holder, which was then positioned in a quartz cuvette and finally fixed on the integrating sphere. Barium sulfate was used as the reference material (100% reflectance).
Spectra were collected as reflectance (R%) and then converted into absorbance (Abs) using the following equation: Abs = − log(R%/100)
The obtained spectra were decomposed in the range of 200–2000 nm using the OriginPro 8 software using a combination of Gaussian functions.
Surface composition of the samples was studied by X-ray Photoelectron Spectroscopy (XPS) using M-PROBE Surface Spectrometer with an Al (Kα) source with a spot size from 0.15 mm to 1 mm in diameter. A 10 V applied voltage at a vacuum of 10-7 –10-8 Torr was used. The survey scans were observed in 0-1100 eV binding energy range, using a spot size of 800 microns with an energy resolution of 4 eV (scan rate of 1 eV per step). ESCA Hawk Software was used for data curation. All the resulting binding energy values were corrected using the C 1s peak (C–C) fixed at 285 eV as a reference. The C 1s photopeak comprised four components (C–C, C–O and C=O bonds, as well as a specific feature corresponding to CO32-, with respective binding energies of 284.6, 286.5, 288.5 and 290.0 eV (see Fig. S.5).
The normalized surface concentrations of the detected species were computed by excluding the contribution of adventitious carbon (C–C at 284.6 eV).
4.3. Catalytic Tests
Catalytic performances of all samples in NH3-SCO reaction were evaluated in a dedicated stainless-steel continuous reaction line equipped with a set of mass flow controllers (Bronkhorst, Hi-Tech Instruments, Nijverheidsstraat, Netherlands), a tubular vertical electric oven (Controller-Programmer type 818, Eurotherm, Como, Italy), a quartz tubular catalytic microreactor (5 mm i.d.), and an online FT-IR spectrophotometer with a DTGS detector (Bio-Rad, Hercules, CA, USA) for qualitative and quantitative determination of the fed and vented gaseous species.
In a typical experiment, a fixed amount of catalyst sample (ca. 500 mg) was pressed, grinded, crushed, and sieved to obtain particles in the range 45–60 mesh (0.35–0.25 mm), then dried at 120°C overnight. Then, catalyst pretreatment was performed in situ under air flow (20% v/v) at 120 C for 30 min.
The catalytic activity was studied as a function of temperature in the 120–500°C interval, maintaining each temperature for 60 min to guarantee the attainment of the steady-state reaction condition.
Ammonia was fed at fixed concentration (300 ppm) and diluted in synthetic air containing 1000 ppm of O2 The total flow rate was 6 NL/h-1 (GHSV was 120,000 h-1).
The gas mixture vented from the reactor was monitored by an online FT-IR consisted of a multiple reflection gas cell (with 2.4 m path length; resolution, 2 cm-1; sensibility, 1.5; 92 scans per 180 s) for quantifying the unconverted reagent and formed products. The total absorbance of all the IR active gaseous species (Gram–Schmidt) vented by the reactor was continuously recorded as a function of time while reaction temperature was changing. The main species detected, NH3, NO, N2O and NO2, were quantified considering the peak height of a selected absorbance line (Fig. S.6) by using the measured calibration factors. Details on calculations for each reaction are reported in the Supplementary Material (Table S.2).