Preprint
Article

This version is not peer-reviewed.

The Molecular Mass and Isoelectric Point of Cytokinin Riboside 5'-Monophosphate Phosphoribohydrolase Sequences for Wheat Genome

A peer-reviewed article of this preprint also exists.

Submitted:

03 March 2025

Posted:

05 March 2025

Read the latest preprint version here

Abstract

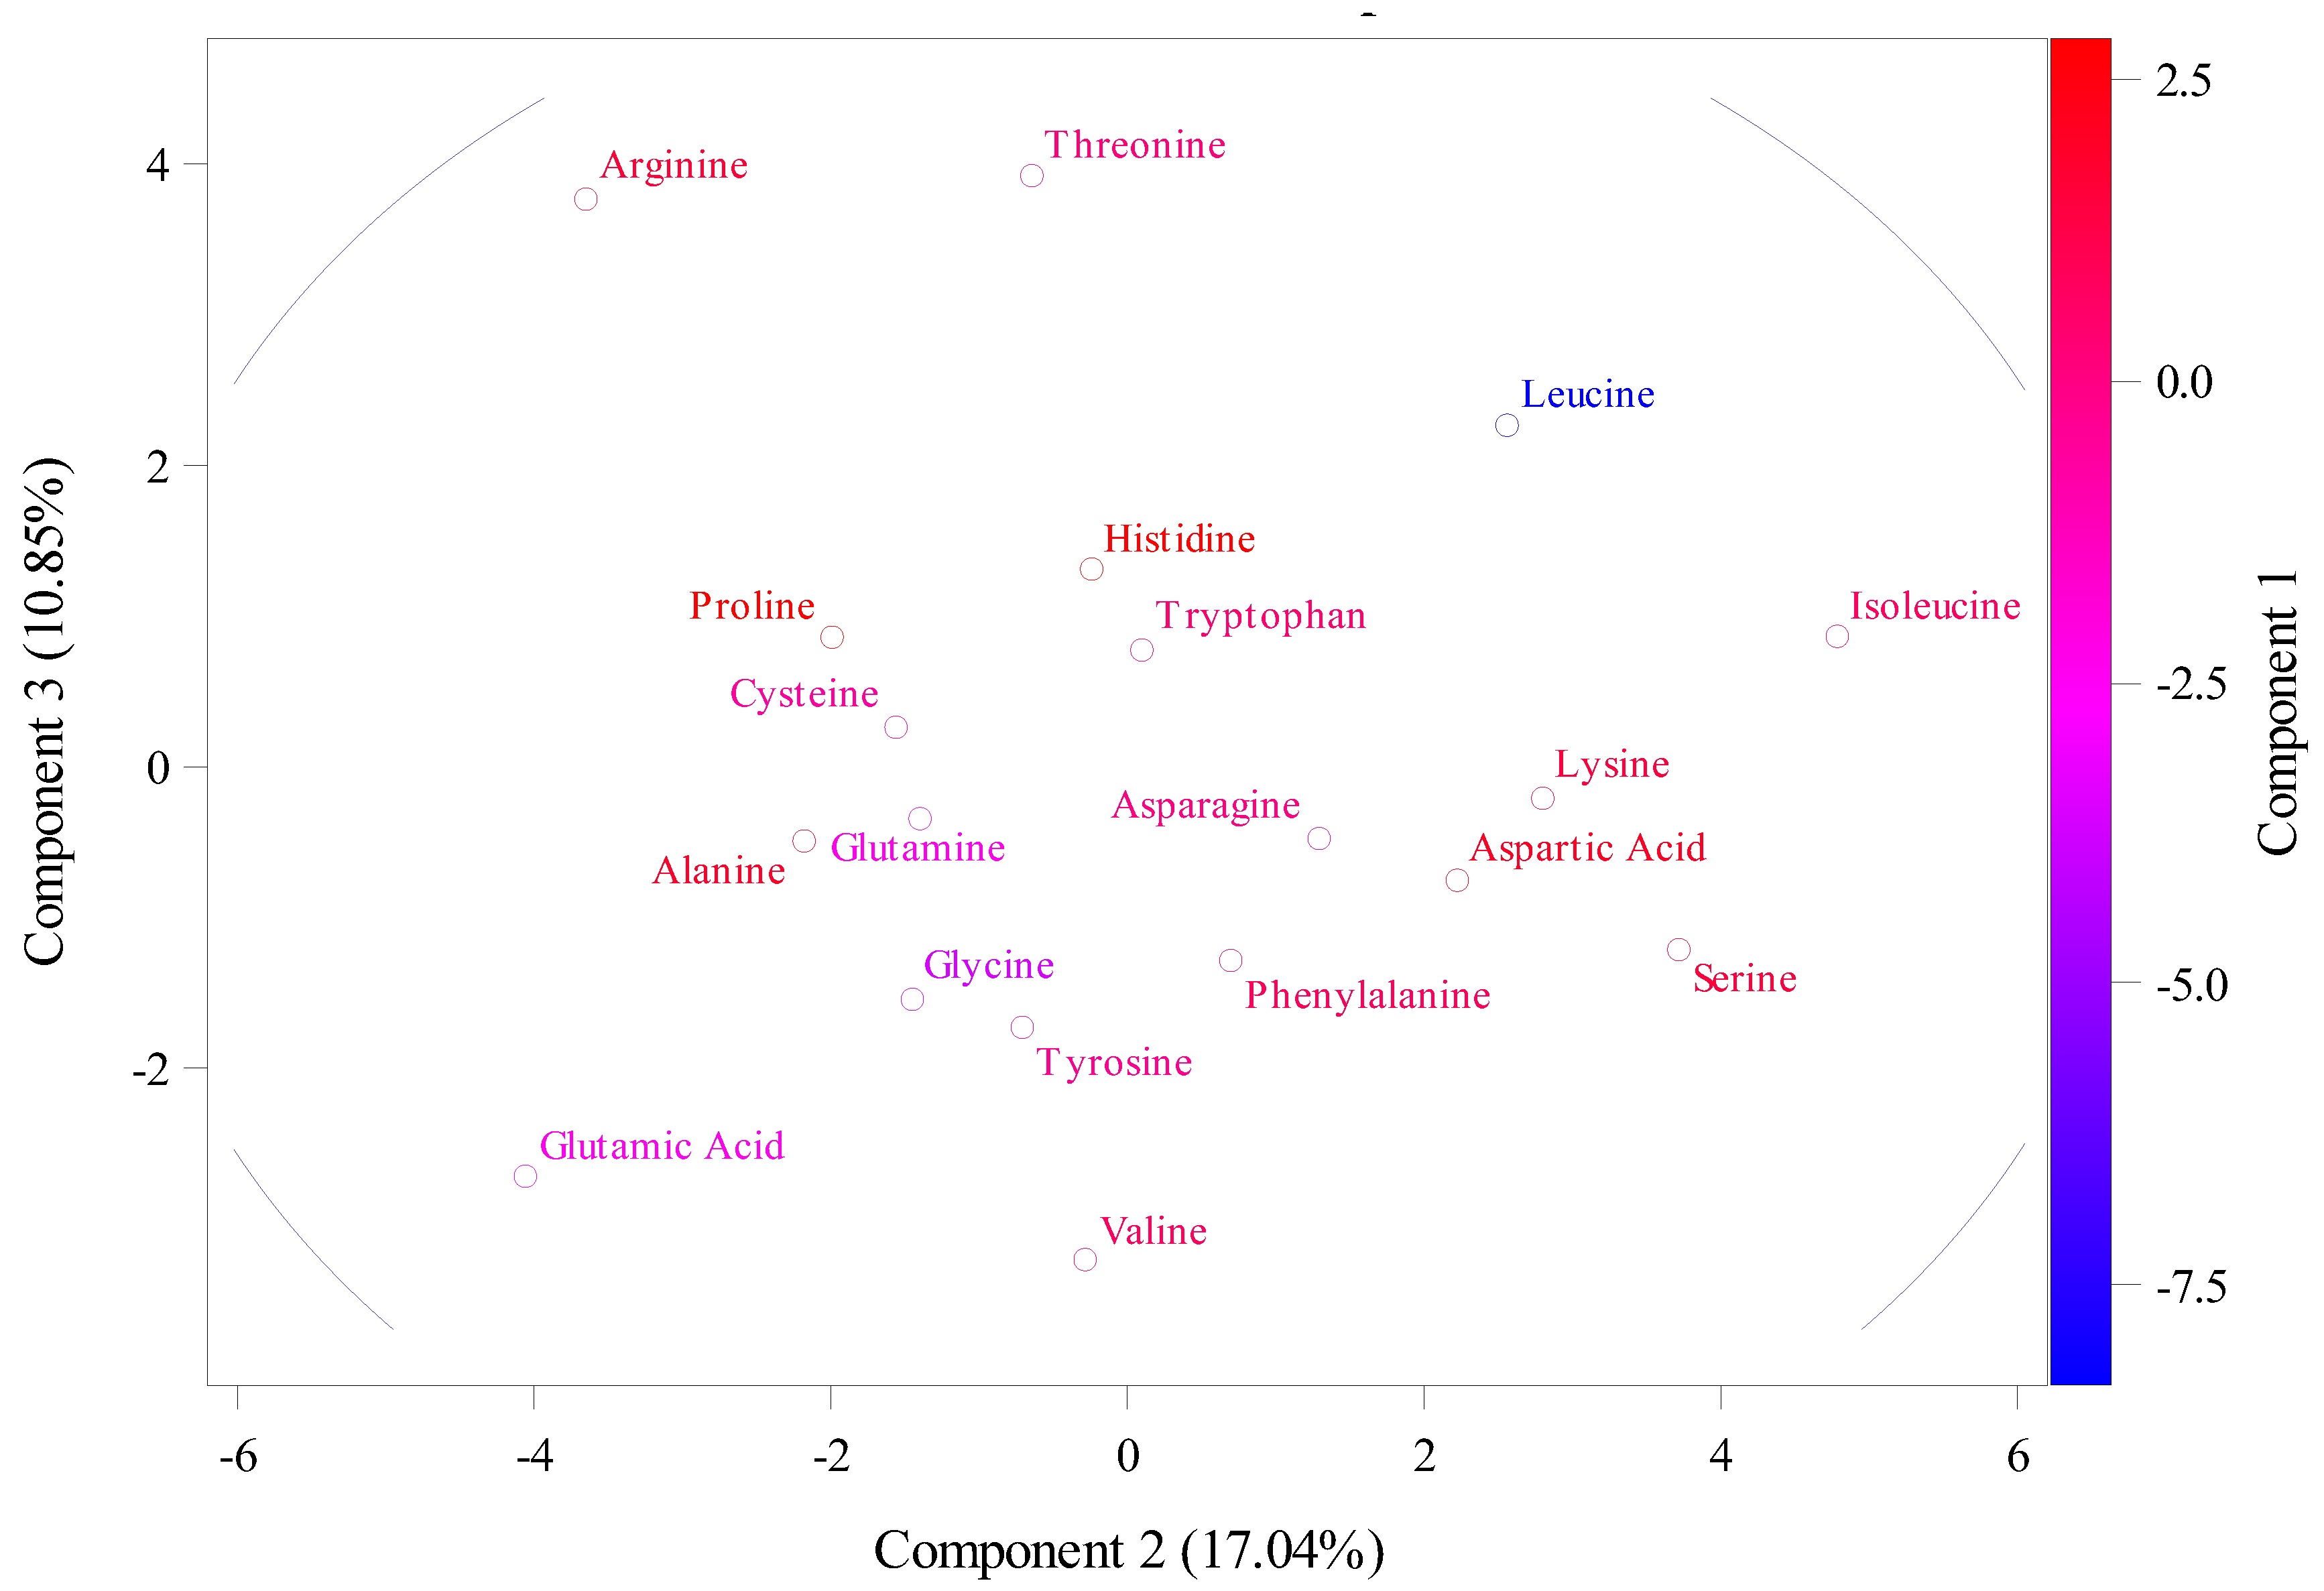
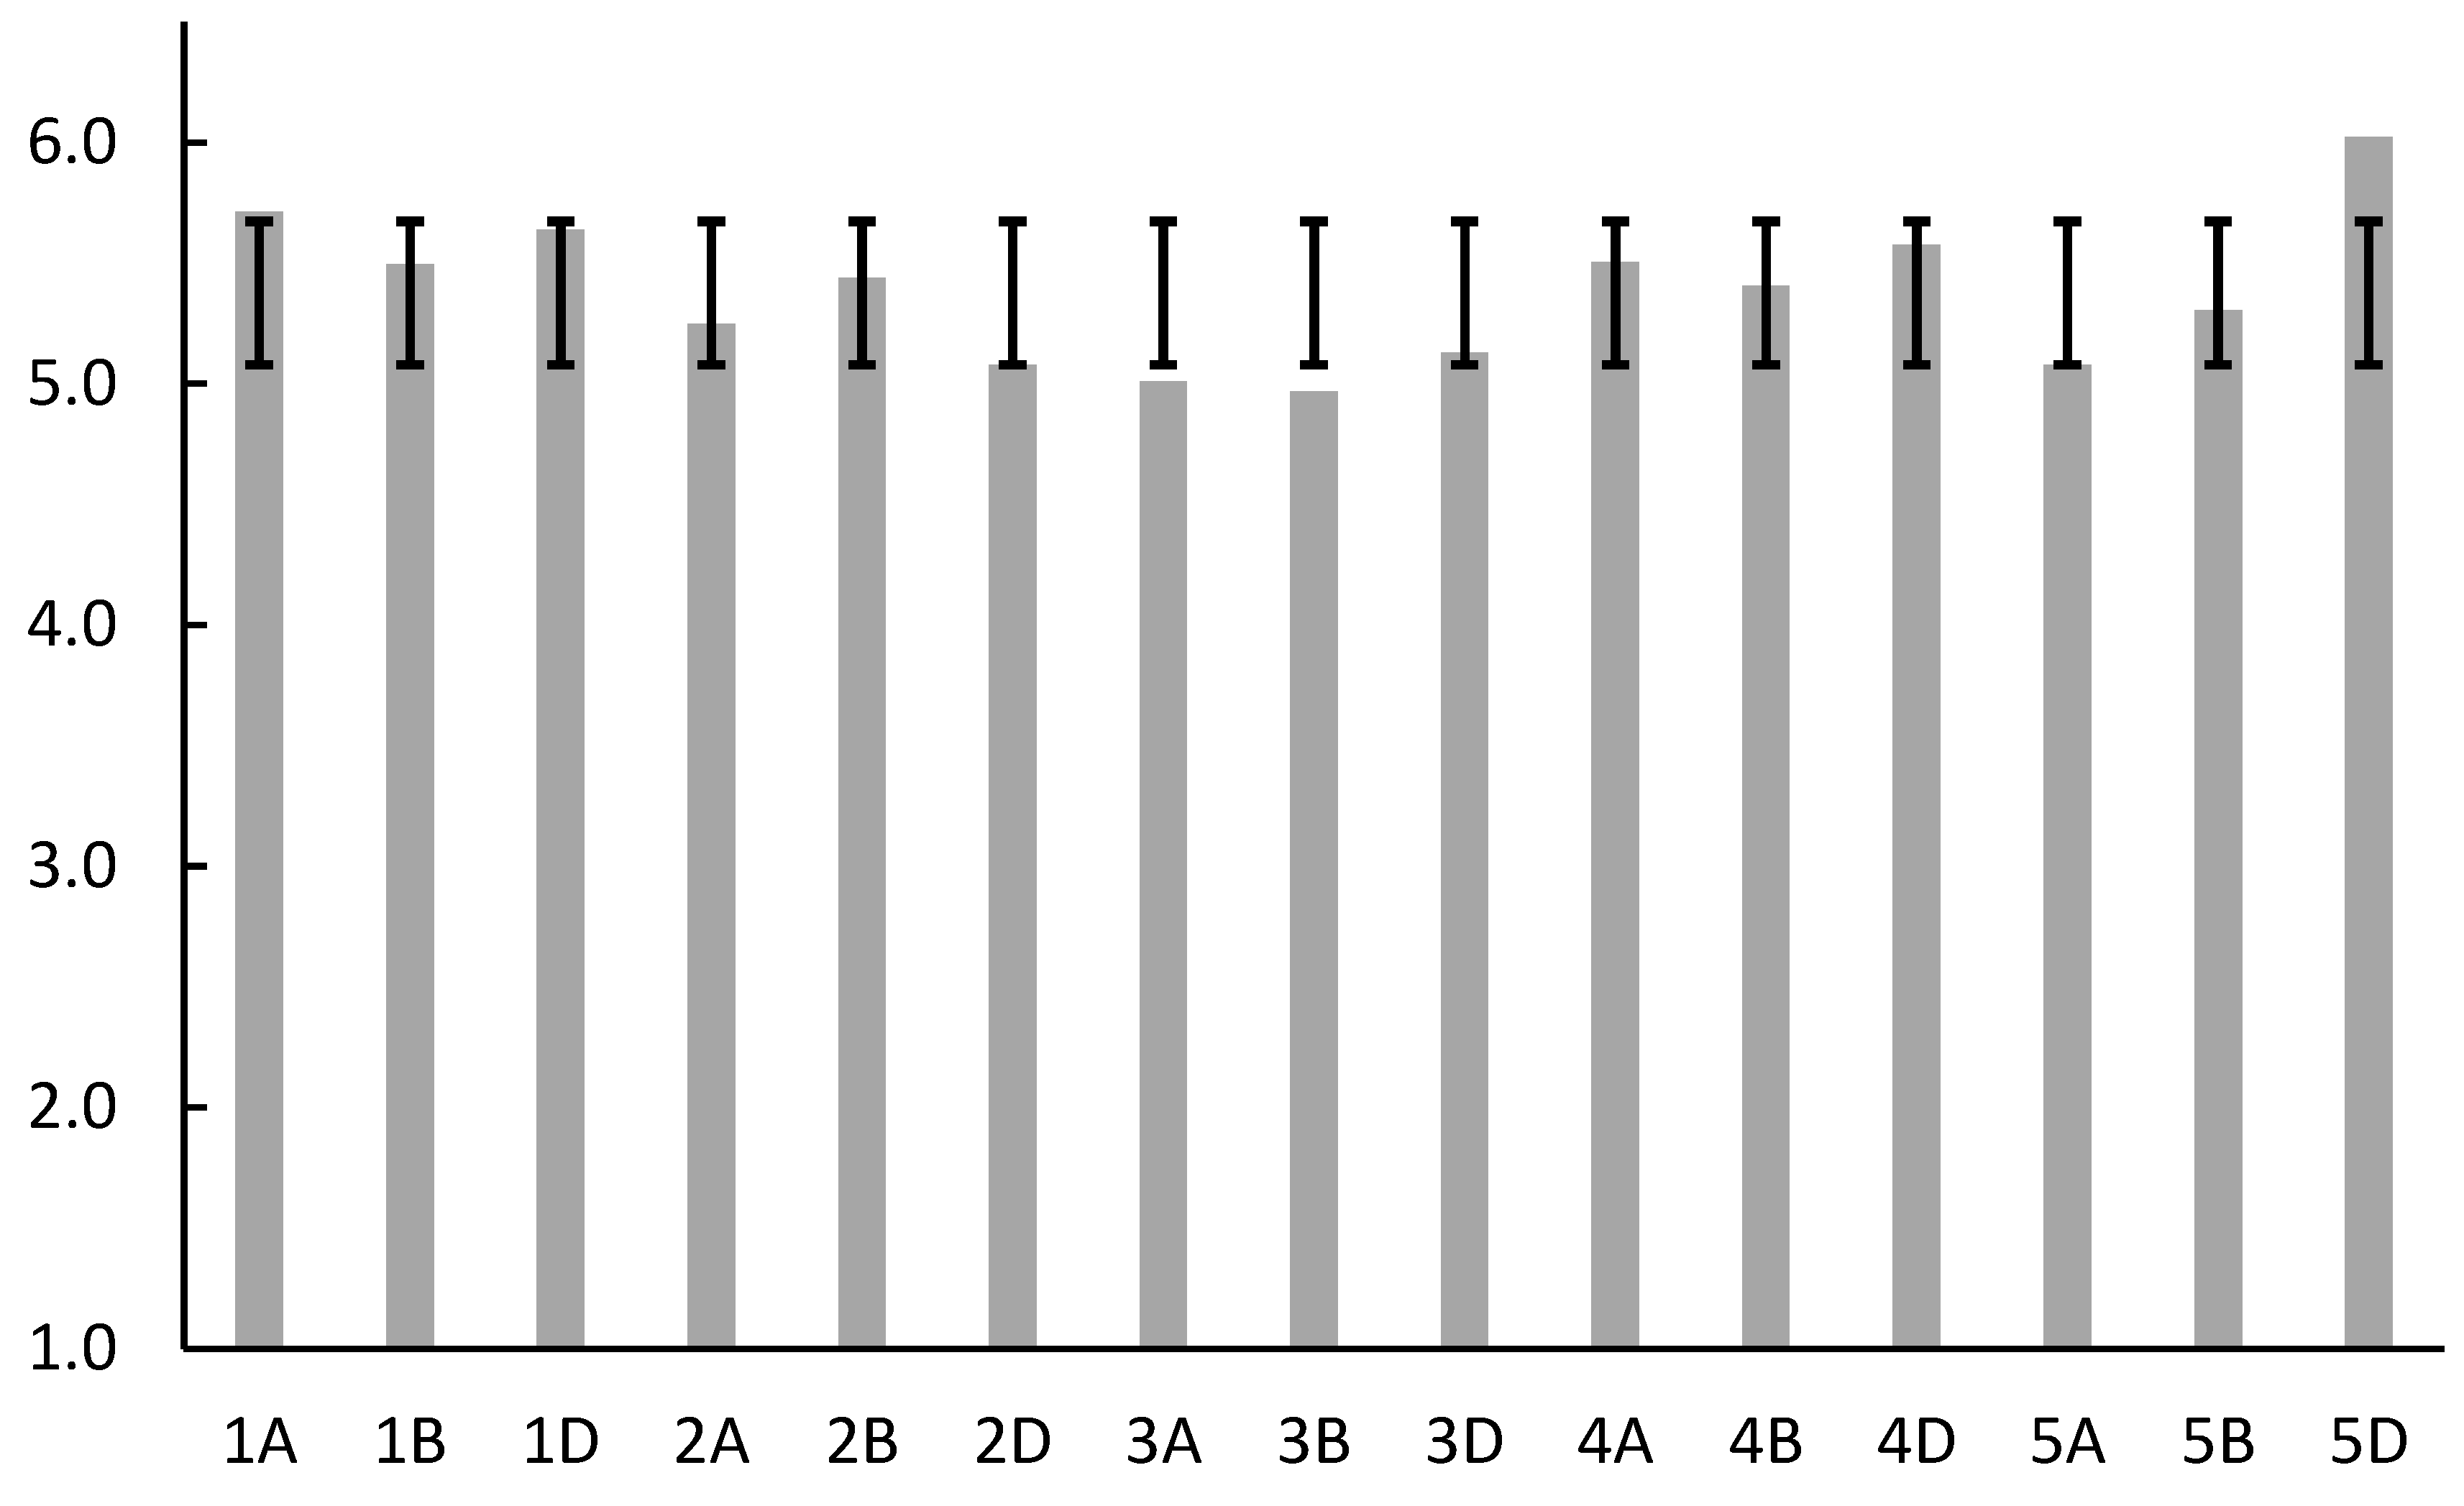
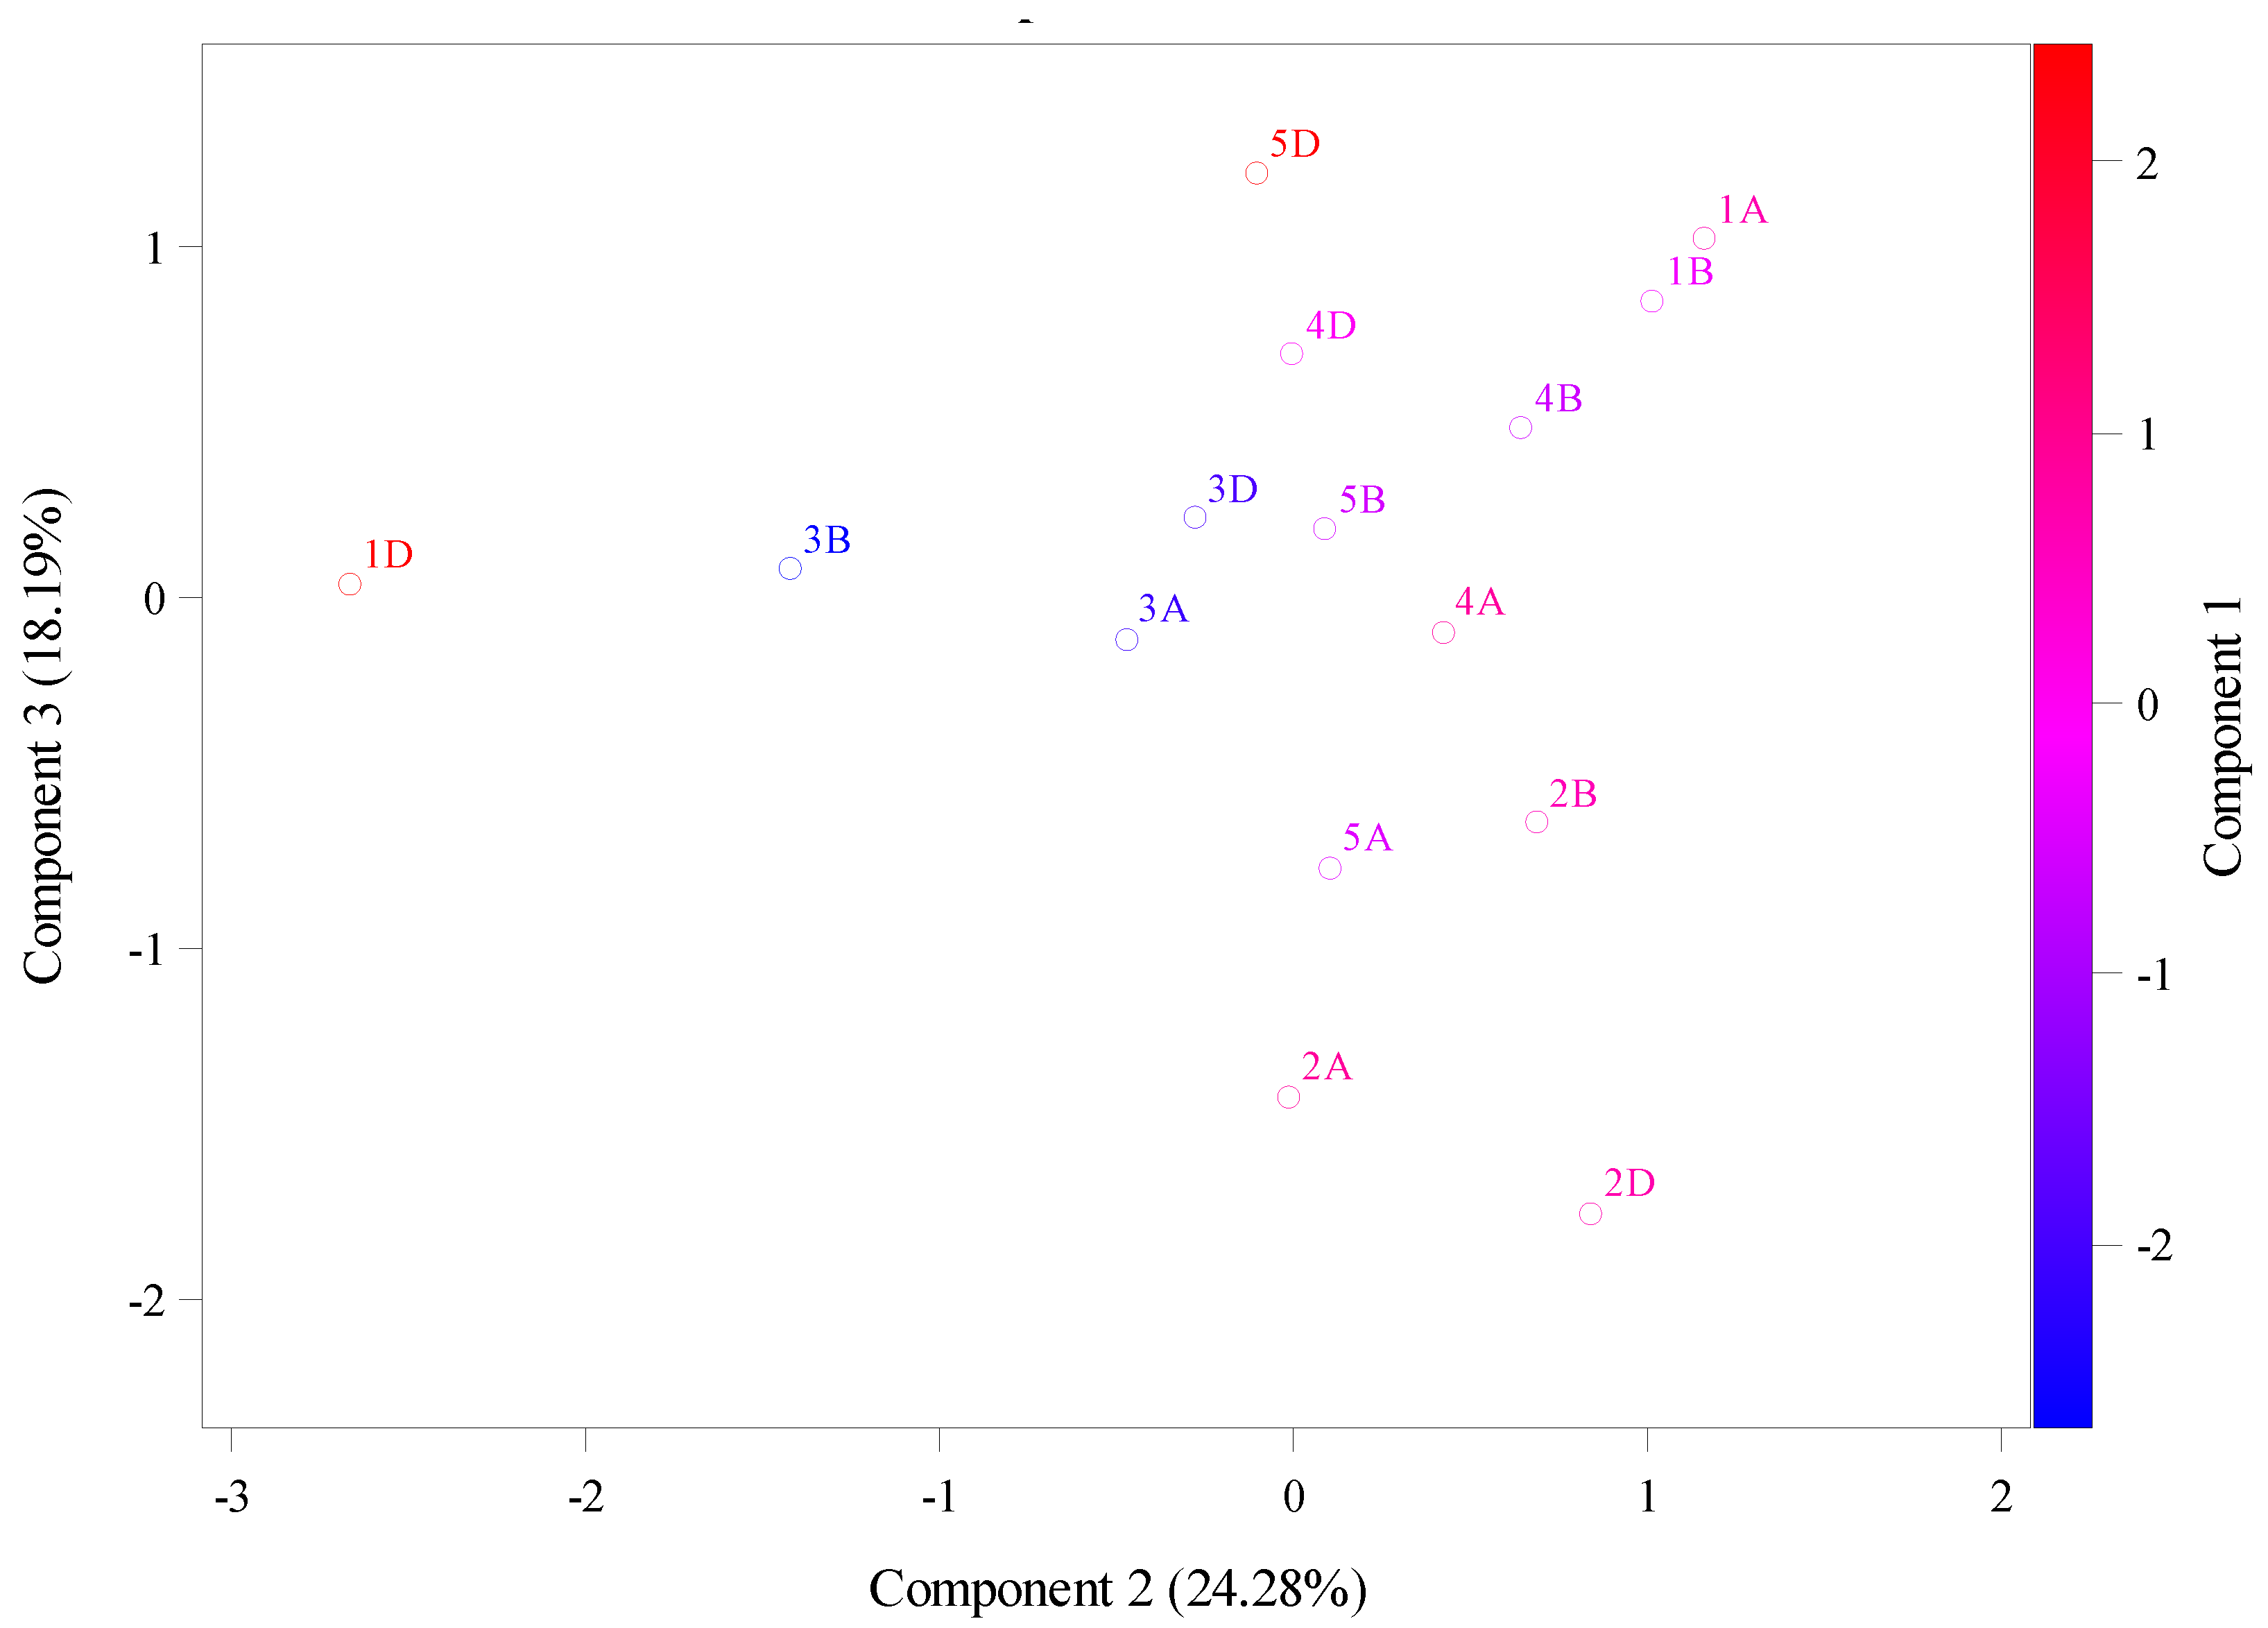
Cytokinin is play strongly role and implicated in wheat breeding in terms of flowering and yield. The aims here was to explain the wheat cytokinin riboside 5'-monophosphate phosphoribohydrolase sequences from two different databases through the using relative synonymous codon usage (RSCU), molecular weight (g/mol), theoretical isoelectric point, instability index, aliphatic index, and hydrophobicity. The RSCU divided values into two crops. First crop, significant overrepresentation were values above 1.6 that as in phenylalanine (TTC) located in 5B chromosomes, Leucine (TTA) located in 5A, and 1D chromosomes, leucine (TTG) located in 5B chromosome, leucine (CTC) located in 5D, 7D, and 7B. Leucine (CTA) located in 5D and second crop, underrepresentation were values below 0.6 as in leucine (CTA) located in 3A, 5D, 1B, 5B, and 7B. Valine (GTT) located in 4D, 5B, 4A, and 5B. In addition, theoretical isoelectric point (PI) ranged from 4.81 to 6.6 in chromosomes 3A and 4D respectively that were instability index was 34.3 and 38.16 respectively. The high instability was found at 1D and 5D with 54.16 and 50.36 respectively with decreasing in their stability as shown in aliphatic index at 92.98 and 88.91. Principal component analysis (PCA) of RSCU were explained main of variation is assigned to PCA1 with total variation about 72.11% and these amino acids are Isoleucine, Leucine, Lysine, Aspartic Acid, and Serine while the PCA2 and PCA3 had total variation, 17.04% and 10.85. While PCA of the theoretical isoelectric point results explained main of variation was assigned to PCA1 with total variation about 58.88 % and these chromosomes are 5D, 4D, 1A, 4B, 3D. While the PCA2 and PCA3 had total variation, 27.52% and 13.6% respectively assigned with 1D, 3B, 3A, 2D, 2A and 2B. The future objective from these results would be benefit for in nutrition and industrial and aid in breeding programs.

Keywords: 
;  ;  ;  ;  ;  

1. Introduction

As one of most important plant hormone group, cytokinin is play strongly role and implicated in plant breeding of wheat in terms of flowering and yield [1,2] and including other role such as environmental stress (biotic and abiotic stresses) [3]. The metabolic cycling of cytokinin involves initial by isopentenyl transferase enzymes in order to formation of cytokinin nucleotides and thus activation into active free-base forms by lonely guy enzymes (LOG) [4]. The pathway of signaling cytokinins have multi-step systems of phosphorylation by involving histidine kinases, histidine phosphotransfer proteins, and regulators response [5]. In wheat, cytokinins occur during grain development especially in rapid endosperm nuclear divisions and can help to delaying senescence by stimulating sucrose by stay-green phonotypes in late stage of development. In addition, cytokinin can manipulate amino acid metabolism by distribution of nutrient inside plan and enhance the expression of transported and mobilization [6].
A common wheat (Triticum aestivum) is allohexaploid that has three genomes, which has been driven from ancestral species (AABBDD, A genome from Triticum Urartu, B genome from Aegilops speltoides, and D genome: from Aegilops tauschii). This genome reflects complex instruction of genetic wheat, which has six sets of chromosomes as hexa-ploid [7]. The benefit of this complexity of wheat genome leads to genetic diversity and adaptability to grown and survive in a variety of environmental conditions. However, wheat under drought stress has been classified based on its ability by different mechanisms such as mange water or reduced transpiration, or improved root depth [6]. Cytokine influence stomatal closure to reduce water loss and can develop and elongation of root growth to access water deeper from soil. Under water limitation, wheat species were significantly noted by reduction in traits such as photosynthesis rate (14% and 10% compared to 24% and 12%), stomatal conduction, total sugar, and total starch content [1,2,3,4,5,6,7,8]. The metabolism of cytokinin in wheat regulates by active cytokinin level by dephoshorylation and deribosylation during development processes. This processes included shoot apical meristem, flower, and vascular developments, and retaining sink activity to inhibit nitrogen remobilization, and maintaining proteins synthesis [9]. The objective of study wheat’s cytokinin expression through amine acid is crucial for development wheat stage. The aims here was to explain the wheat genomes (mRNA and proteins) for its properties and function from two different databases through the cytokinin riboside 5'-monophosphate phosphoribohydrolase sequences using relative synonymous codon usage (RSCU), molecular weight (g/mol), theoretical isoelectric point, instability index, aliphatic index, and hydrophobicity. The future objective from these results would be benefit for in nutrition and industrial applications such as digestibility and nutritional supplements that can aid in breeding programs [10].

2. Results

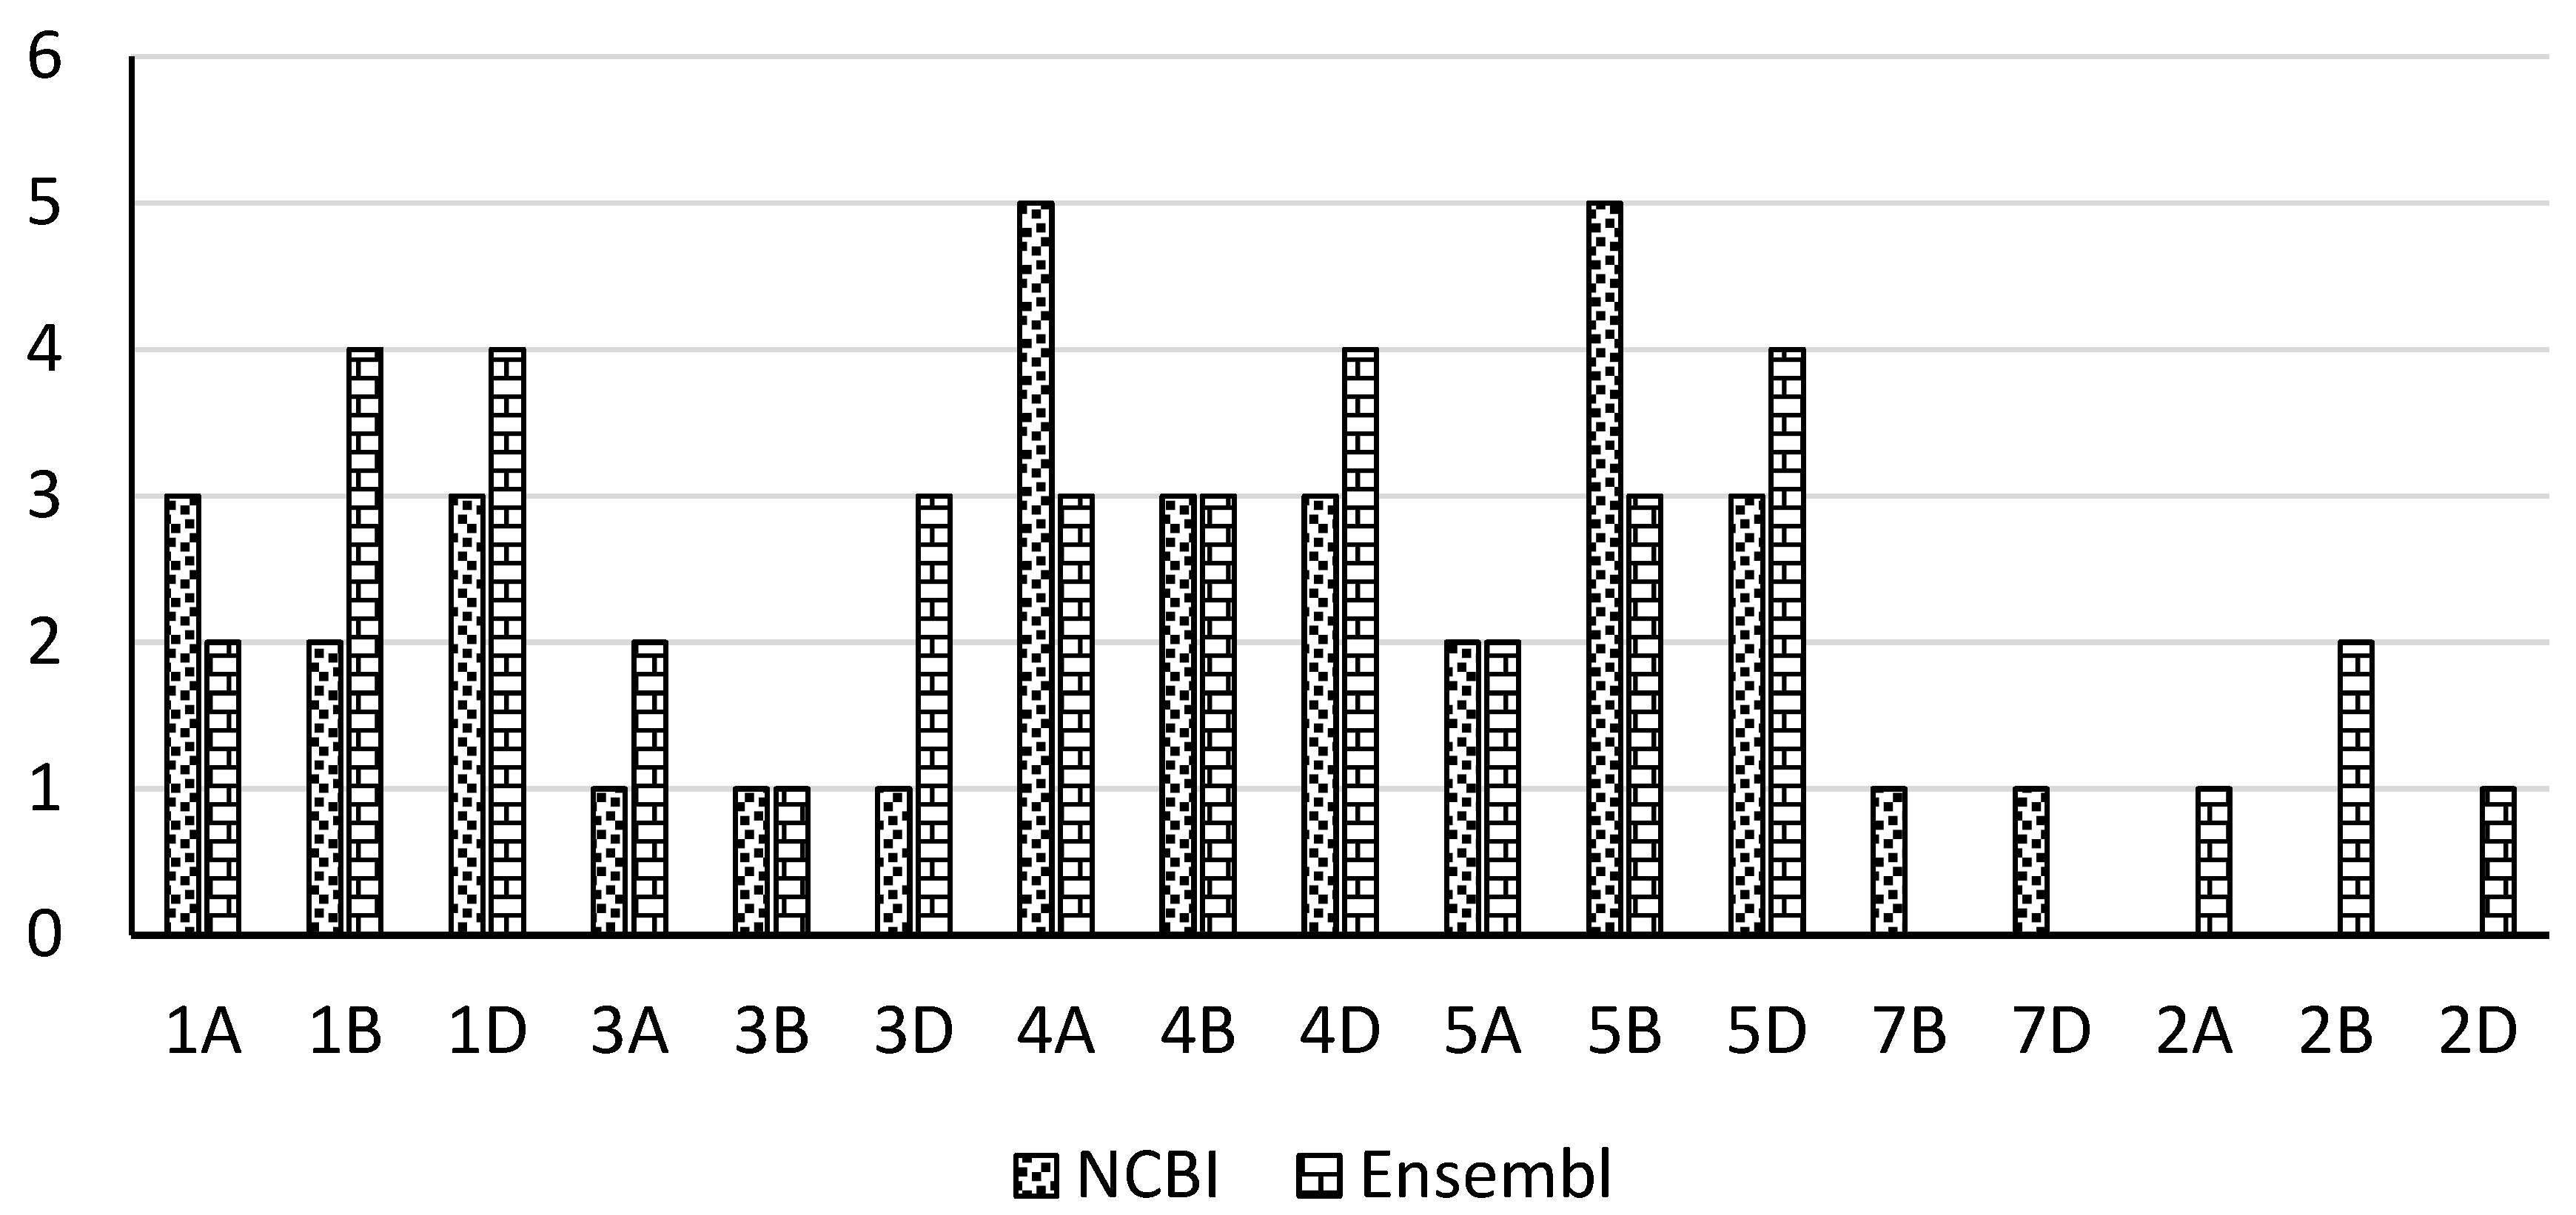
2.2. The Number of Chromosomes for Cytokinin Riboside 5'-Monophosphate Phosphoribohydrolase Genes Through NCBI and Ensemble Databases

NCBI had 35 genes in different chromosomes while ensemble had 38 genes and both databases had able to show these genes in different chromosomes. Figure 1 shows that A, B, and D genomes with different numbers of chromosomes in each one. 2A, 2B, and 2D was zero number from NCBI databases comparing with ensemble databases that shows 1 genes in both genomes 2A and 2D and 2 genes in 2B genome. Some genomes had more genes than other genes. For example, genome 4A and 5B had five genes from NCBI databases while 4 genes shown in genomes 1B, 1D, 4D, and 5D from ensemble databases. This gene differences came from key factors such as accumulation over times of genetic differences, repeated sequences due to transposable elements (TEs) that could insert into different locations, gene loss as shown in several reports by 10 to 16 thousand genes losses, and hybridization of wheat from breeding programs. In addition, the Cytokinin riboside 5'-monophosphate phosphoribohydrolase has multiple members from 1 to 11 reflect the functional redundancy for cytokinin metabolism roles across developmental stages. Gene expression of cytokinin riboside 5'-monophosphate phosphoribohydrolase has different elements of cis-regulatory.

2.3. The Relative Synonymous Codon Usage (RSCU)

The results of RSCU values (data not shown due to large table) above 1.6 reflect significant overrepresentation such as phenylalanine (TTC) located in 5B chromosomes, Leucine (TTA) located in 5A, and 1D chromosomes, leucine (TTG) located in 5B chromosome, leucine (CTC) located in 5D, 7D, and 7B. Leucine (CTA) located in 5D. Isoleucine (ATT) located in 5A, and 1D. Valine (GTC) located in 5D, and 4A. Serine (TCT) located in 5D, 1B, and 4A. Proline (CCT) located in 4B. Threonine (ACG) located in 4D, 5B, 5A, and 4B. Arginine (CGC) located in 5B, 5D, and 1B. Glycine (GGC) 5D, 4A, 5B, 3D, 7B, and 5D. However, RSCU values below 0.6 suggest underrepresentation such as leucine (CTA) located in 3A, 5D, 1B, 5B, and 7B. Valine (GTT) located in 4D, 5B, 4A, and 5B. Proline (CCC) located in 5B, 5D, 5A, 4B, 1B, and 4A. Threonine (ACC) located in 3A, 4D, 5B, 5A, and 4B. Glutamic Acid (GAA) located in 5B, 5D, 5A, 4A, 1D, 5B, and 7B. Arginine (CGT) located in 3A, 5B, 1B, 5B, and 7D. Serine (AGT) located in 4D, 5B, 5A, 4D, 4B, and 7B. Glycine (GGT) located in 3A, 5B, 5D, 7D, and 7B. Figure 2 is data of principal component analysis that shown amino acid patterns. From this Figure 2, amino acids that explained main of variation is assigned to PCA1 with total variation about 72.11% and these amino acids are Isoleucine, Leucine, Lysine, Aspartic Acid, and Serine and more shown in Figure 2. While the PCA2 and PCA3 had total variation, 17.04% and 10.85 respectively assigned with arginine, glutamic acid and threonine for PCA2 and assigned with aspartic Acid.
The physiochemical characterization:
Table 1 shows the results values of molecular weight (g/mol), theoretical isoelectric point, instability index, aliphatic index, and hydrophobicity. Theoretical isoelectric point (PI) is the pH that ranged from 4.81 to 6.6 in chromosomes 3A and 4D respectively (average 5.37 ± 0.297 Figure 3). However, the instability index showed that these two chromosomes (3A and 4D) were at 34.3 and 38.16 respectively. In addition, these two chromosomes (3A, 4D) had 88.69 and 89.59 of aliphatic index indicate increasing of their stability and their hydrophobicity were lower 0.04 and -0.04 respectively. The high instability was found at 1D and 5D with 54.16 and 50.36 respectively with decreasing in their stability as shown in aliphatic index at 92.98 and 88.91. Figure 4 is data of principal component analysis that shown amino acid patterns. From this Figure 4, amino acids that explained main of variation is assigned to PCA1 with total variation about 58.88 % and these chromosomes are 5D, 4D, 1A, 4B, 3D and more shown in Figure 4. While the PCA2 and PCA3 had total variation, 27.52% and 13.6% respectively assigned with 1D, 3B, 3A, 2D, 2A and 2B.

3. Discussion

These cytokinins are important phytohormones encoded by LOG family of genes in wheat and other crops. It is play roles in several stage of plant development such as regulating growth and affecting of yield component of wheat [11]. Its biosynthesis occurs in the plant cell and. It also showed about 11 to 14 genes family allocated in three chromosomes of wheat. In barely, report showed that the pattern of expression of these genes reflects role in growth and reproductive development. In addition, the results showed the possibility of selection natural variation in gene expression for incorporation into wheat genotypes breeding material. In Arabidopsis, this cytokinin acted at specific level with redundantly at vascular tissues of developing flowers and leaves [12,13].
The important of the relative synonymous codon usage (RSCU) in plant breeding is to help breeders for understanding the mechanisms and functional wheat genomes and thus wheat genomes can be build for environmental adaptations. Selection optimal codon helps for transcription termination of mRNA expression especially in binding sites by either generating or depleting this site of gene expression. RSCU values above 1.6 is strong positive codon in several codons such as TTC, TTA, TTG, CTC, CTA, ATT, and GTC these codons are hold T codon. In addition, codons TCT, CCT, ACG have C codon while codons CGC and GGC have G codon. Thus, these codons can be used for optimizing gene expressions in order to modifying endogenous of some genes to increase protein productions [14]. The important of principal component analysis here is to identify important amino acid for the Cytokinin riboside 5'-monophosphate phosphoribohydrolase to make best decision about selection in plant breeding programs. From PCA1 that explain total variation as largest loading has highlights most important amino acids that are associated to variability of this enzyme and thus more attention in breeding program to these amino acids [15,16]. Thus, the beneficial of these results would be developed wheat in nutrition and industrial applications such as increasing essential amino acids that related to improve proteins quality for valuable nutrition and to address starch for better wheat digestible and thus enhance human consumption [17].

4. Materials and Methods

The DNA and proteins sequences of cytokinin riboside 5'-monophosphate phosphori-bohydrolase have been retrieved from two different databases names the National Center for Biotechnology Information (NCBI) and ensemble plants websites as shown in Table 2. All of the studied sequences were annotated such as genes, regulatory elements and location of genes. From NCBI, the relative synonymous codon usage (RSCU) were calculated individually as the ration between the observed frequency and expected frequency for the particular codon by using website such as https://jamiemcgowan.ie/bioinf/index.html#. Some of codons were excluded from the calculation such as methionine (ATG), and tryptophas (TGG), and (TAA, TAG, TGA). The formula of calculation RSCU for codon j of amino acid I is by using formula as below: RSCU= ( n_(i x_(i,j ) ))/(∑_(j=1)^(n_i)▒〖xi,j〗) where n_i is the number of codon that code amino acid i, and the x_(i,j )is the number of occurrences of codon j [18]. The interpretation for RSCU values equals to 1 indicated no codon preferences (no bias) while values less than 1 indicated notable negative bias in codon usage. Values above 1.6 reflects significant overrepresentation while values below 0.6 suggest underrepresentation. Once, the RSCU values were determined, all values were analysis through SAS for more analysis by using principal component.
The physiochemical characterization
From ensemble plants were used to analysis some of chromosomes characterization such as molecular weight (g/mol), theoretical isoelectric point, instability index, aliphatic index, and hydrophobicity. These characterizations were contacted through web.expasy.org. The theoretical isoelectric point (PI) was the pH value that can be calculated through the formula pI = (pKa1 + pKa2) / 2 where pKa1 refers to dissociation constant for group of carboxylic acid and pKa2 refers to amino group. Both molecular weight and isoelectric point help to understand of biochemical and functional chromosomes of wheat breeding programs. The theoretical isoelectric point helps to know the stability of protein charge. The instability index refers to stability of protein if the values less than 40 reflects stable proteins while above 40 showed instability protein. This instability index can be calculated through the sequences length and the weighted sum of dipeptides. The aliphatic index refers to relative volume through using mole percent of amino acid (alanine, valine, isoleucine, and leucine). Lastly, the hydrophobicity refers to tendency of amino acid [19].
Principal component analysis
Principal component analysis of the RSCU and physiochemical characterization values and the physiochemical characterization were used through SAS software version 9.4 by using excel file format. The PCA plot can help to analyze values for identify patterns in amino acid or codons that were favored or disfavored in specific or major trends with reducing complexity of datasets. In general, PCA were analytical method for enhances our understanding of protein characteristics and for gene expression and evolutionary biology.
Contribution statement: Meshal M. Almutairi: Conceptualization, Writing-original draft, Data curation, Formal analysis, methodology. ???Conceptualization, writing editing, Data curation.

Funding

This paper did not receive any funding resources or specific grants from agencies in the public, commercial, or any other sectors.

Data Availability Statement

The data presented in this study are available on request from the corresponding author upon reasonable request.

Conflicts of Interest

The authors declare no conflicts of interest.

References

  1. Jameson, P.E. and Song, J. (2016) Cytokinin: a key driver of seed yield. J. Exp. Bot. 67, 593–606. [CrossRef]
  2. Yamburenko, M.V., Kieber, J.J. and Schaller, G.E. (2017) Dynamic patterns of expression for genes regulating cytokinin metabolism and signaling during rice inflorescence development. PLoS ONE, 12, e0176060. [CrossRef]
  3. Cortleven, A., Leuendorf, J.E., Frank, M., Pezzetta, D., Bolt, S. and Schmülling, T. (2019) Cytokinin action in response to abiotic and biotic stresses in plants. Plant Cell Environ. 42, 998–1018. [CrossRef]
  4. Pavlů, J., Novák, J., Koukalová, V., Luklová, M., Brzobohatý, B. and Černý, M. (2018) Cytokinin at the crossroads of abiotic stress signalling pathways. Int. J. Mol. Sci. 19, 2450. [CrossRef]
  5. Prasad, R. 2022. Cytokinin and Its Key Role to Enrich the Plant Nutrients and Growth Under Adverse Conditions-An Update. Frontiers. An Update. Front. Genet. 13:883924. [CrossRef]
  6. Wang, W., Hao, Q., Tian, F., Li, Q., Wang, W. 2016. Cytokinin-Regulated Sucrose Metabolism in Stay-Green Wheat Phenotype. PLoS One. 11(8):e0161351. [CrossRef] [PubMed] [PubMed Central]
  7. Grewal, S., Yang, Cy., Scholefield, D. et al. Chromosome-scale genome assembly of bread wheat’s wild relative Triticum timopheevii. Sci Data 11, 420 (2024). [CrossRef]
  8. Nagar, S. (2011). Physiological basis of cytokinin induced drought tolerance in wheat (triticum aestivum l.). Journal of AgriSearch. 1(3): 139-144.
  9. Criado, M., Caputo, C., Roberts, I., Castro, M., Barneix, A. 2009. Cytokinin-induced changes of nitrogen remobilization and chloroplast ultrastructure in wheat (Triticum aestivum). Journal of Plant Physiology. 166. 1775-1785. [CrossRef]
  10. Mohanta, T.K., Khan, A., Hashem, A. et al. The molecular mass and isoelectric point of plant proteomes. BMC Genomics 20, 631 (2019). [CrossRef]
  11. Jablonski, B, Ogonowska H, Szala K, Bajguz A, Orczyk W, Nadolska-Orczyk A. Silencing of TaCKX1 Mediates Expression of Other TaCKX Genes to Increase Yield Parameters in Wheat. Int J Mol Sci. 2020;21(13):1–21. [CrossRef]
  12. Mameaux, S, Cockram J, Thiel T, Steuernagel B, Stein N, Taudien S, Jack P, Werner P, Gray JC, Greenland AJ, et al. Molecular, phylogenetic and comparative genomic analysis of the cytokinin oxidase/dehydrogenase gene family in the Poaceae. Plant Biotechnol J. 2012;10(1):67–82. [CrossRef]
  13. Zhang, J, Vankova R, Malbeck J, Dobrev P, Xu Y, Chong, K and Neff, M. (2009) AtSOFL1 and AtSOFL2 Act Redundantly as Positive Modulators of the Endogenous Content of Specific Cytokinins in Arabidopsis. PLoS ONE 4(12): e8236. [CrossRef]
  14. Gun L, Yumiao R, Haixian P, Liang Z. Comprehensive Analysis and Comparison on the Codon Usage Pattern of Whole Mycobacterium tuberculosis Coding Genome from Different Area. Biomed Res Int. 2018 May 8;2018:3574976. [CrossRef] [PubMed] [PubMed Central]
  15. Debnath S, Sarkar A, Perveen K, Bukhari NA, Kesari KK, Verma A, Chakraborty NR, Tesema M. Principal Component and Path Analysis for Trait Selection Based on the Assessment of Diverse Lentil Populations Developed by Gamma-Irradiated Physical Mutation. Biomed Res Int. 2022 Jul 18;2022:9679181. Retraction in: Biomed Res Int. 2024 Jan 9;2024:9835247. doi: 10.1155/2024/9835247. [CrossRef] [PubMed] [PubMed Central]
  16. Yang, Q., Xin, C., Xiao, Q., Lin, Y., Li, L., Zhao, J. 2023. Codon usage bias in chloroplast genes implicate adaptive evolution of four ginger species. Front. Plant Sci. 14. [CrossRef]
  17. Khalid, A, Hameed A, Tahir MF. Wheat quality. 2023. A review on chemical composition, nutritional attributes, grain anatomy, types, classification, and function of seed storage proteins in bread making quality. Front Nutr. ;10:1053196. [CrossRef]
  18. Wong, E. H., Smith, D. K., Rabadan, R., Peiris, M., and Poon, L. L. (2010). Codon usage bias and the evolution of influenza a viruses. Codon usage biases of influenza virus. BMC Evolutionary Biology, 10, 253. [CrossRef]
  19. Gasteiger, E., Hoogland, C., Gattiker, A., Duvaud, S., Wilkins, M., Appel, R., Bairoch A. 2005. Protein Identification and Analysis Tools on the ExPASy Server. In: Walker, J.M. (eds) The Proteomics Protocols Handbook. Springer Protocols Handbooks. Humana Press. pp. 571-607. [CrossRef]
Figure 1. The number of study sequences in each chromosomes between NCBI and ensemble plants databases.
Preprints 151085 g001
Figure 2. The principal component analysis (PCA) for the relative synonymous codon usage (RSCU) for 35 gene sequences retrieved from NCBI.
Preprints 151085 g002
Figure 3. The average theoretical isoelectric point (pI) of each wheat chromosomes with standard deviation.
Preprints 151085 g003
Figure 4. The principal component analysis (PCA) of Molecular weight (g/mol), theoretical isoelectric point, instability index, aliphatic index, and hydrophobicity values using ensemble plants databases.
Preprints 151085 g004
Table 1. shows the results values of molecular weight (g/mol), theoretical isoelectric point, instability index, aliphatic index, and hydrophobicity. .
Location bp molecular weight (g/mol) theoretical isoelectric point (pI) instability index (II), aliphatic index (AI) hydrophobicity (HY)
4A 218 22991.1 5.38 38.33 93.53 -0.105
2A 243 26618.74 5.25 40.31 91.44 -0.096
4B 205 22513.91 5.78 41.69 94.63 0.008
3A 234 25265.85 5.21 34.3 95 -0.017
1D 215 23152.61 5.77 54.16 92.98 0.035
3D 241 25737.38 5.21 33.91 93.49 0.01
1B 268 28401.58 5.06 38.27 96.12 0.071
1D 239 26037.71 5.66 43.3 84.1 -0.38
1A 208 22818.19 6.13 35.3 97.5 -0.045
2B 280 30712.62 5.71 39.74 95.71 -0.03
2B 246 26897.94 5.17 38.94 93.09 -0.118
5D 235 24482.96 6.22 42.68 88.04 0.008
3A 229 24220.69 4.81 29.84 88.69 0.04
4D 245 25850.59 6.6 38.16 89.59 -0.049
5D 248 26288.03 6.23 50.36 88.91 -0.108
5D 247 26070.71 6.17 41.8 86.52 -0.082
5A 246 26030.62 5.23 38.94 88.82 -0.063
1B 208 22819.17 5.98 36.23 97.5 -0.045
5B 241 25631.11 5.15 35.92 92.24 -0.012
1D 273 28817.09 5.15 36.73 39.99 0.067
2D 246 26898.99 5.08 43.64 94.31 -0.085
1A 215 23217.63 5.3 50 92.05 0.02
5B 241 25631.11 5.15 35.92 92.24 -0.012
4A 206 22487.78 5.15 37.95 95.58 0.052
4D 225 23599.69 5.26 36.46 93.24 -0.106
1B 215 23221.66 5.45 48 91.12 -0.003
5B 246 26101.79 5.62 41.79 91.99 -0.002
4D 250 26176.7 5.28 36.82 87.8 -0.004
3D 226 24032.55 4.97 28.66 88.98 0.023
5A 245 26310.95 4.93 39.99 95.51 -0.001
1D 208 22819.17 5.98 36.23 97.5 -0.045
3B 226 24032.55 4.97 27.99 88.98 0.023
4A 248 26111.76 5.99 48.45 88.06 -0.105
5D 249 26428.14 5.48 43.07 90.48 -0.032
3D 239 25637.3 5.21 34.82 94.64 0.014
4B 205 22282.61 5.29 34.03 97.51 0.107
4D 205 22315.99 5.17 36.73 96.05 0.08
4B 226 23572.58 5.15 37.49 91.15 -0.125
Mean 233.947 25058.883 5.455 39.130 90.923 -0.029
StD 19.385 1982.593 0.439 5.748 9.140 0.084
Table 2. The DNA and proteins sequences of cytokinin riboside 5'-monophosphate phosphori-bohydrolase from the National Center for Biotechnology Information (NCBI) and ensemble plants databases.
NCBI Ensembl
Gene symbol ID Chro. Gene symbol ID Chro.
1 LOC123045576 1A TraesCS4A02G277200 4A
2 LOC123045860 1A TraesCS2A02G380600 2A
3 LOC123061754 3A TraesCS4B02G250400 4B
4 LOC123065219 1A TraesCS3A02G211100 3A
5 LOC123070388 3B TraesCS1D02G367400 1D
6 LOC123078846 3D TraesCS3D02G213900 3D
7 LOC123080662 1B TraesCS1B02G471300 1B
8 LOC123082392 4A TraesCS1D02G003500 1D
9 LOC123083722 4A TraesCS1A02G156100 1A
10 LOC123087480 4A TraesCS2B02G397600 2B
11 LOC123087481 4A TraesCS5D02G568400 5D
12 LOC123088143 4A TraesCS3A02G251500 3A
13 LOC123093512 4B TraesCS4A02G317900 4A
14 LOC123094293 4B TraesCS5D02G568500 5D
15 LOC123095076 4B TraesCS5B02G561400 5B
16 LOC123097019 4D TraesCS5A02G347400 5A
17 LOC123098787 4D TraesCS1B02G173200 1B
18 LOC123099424 4D TraesCS5B02G348600 5B
19 LOC123107636 5A TraesCS1D02G444500 1D
21 LOC123107637 5A TraesCS2D02G376900 2D
22 LOC123112988 5B TraesCS1A02G362500 1A
23 LOC123112989 5B TraesCS5B02G561300 5B
24 LOC123114455 5B TraesCS4A02G413200 4A
25 LOC123116784 5B TraesCS4D02G033800 4D
26 LOC123117873 5B TraesCS1B02G379700 1B
27 LOC123121452 1B TraesCS5B02G348400 5B
28 LOC123123922 5D TraesCS5B02G348300 5B
29 LOC123125354 5D TraesCS3D02G251900 3D
30 LOC123126254 5D TraesCS5A02G347500 5A
31 LOC123157422 7B TraesCS1D02G154700 1D
32 LOC123160435 1D TraesCS3B02G281000 3B
33 LOC123161849 1D TraesCS4A02G318100 4A
34 LOC123165646 7D TraesCS5D02G353600 5D
35 LOC123181086 1D TraesCS3B02G241600 3B
36 TraesCS4B02G313800 4B
37 TraesCS4D02G310800 4D
38 TraesCS4B02G035700 4B
Disclaimer/Publisher’s Note: The statements, opinions and data contained in all publications are solely those of the individual author(s) and contributor(s) and not of MDPI and/or the editor(s). MDPI and/or the editor(s) disclaim responsibility for any injury to people or property resulting from any ideas, methods, instructions or products referred to in the content.
Copyright: This open access article is published under a Creative Commons CC BY 4.0 license, which permit the free download, distribution, and reuse, provided that the author and preprint are cited in any reuse.
Prerpints.org logo

Preprints.org is a free preprint server supported by MDPI in Basel, Switzerland.

Subscribe

Disclaimer

Terms of Use

Privacy Policy

Privacy Settings

© 2025 MDPI (Basel, Switzerland) unless otherwise stated