Preprint
Article

This version is not peer-reviewed.

Boosting Fruit and Vegetable Consumption Among Secondary School Students ‘Adolescents in Boukombe and Natitingou, North Benin

A peer-reviewed article of this preprint also exists.

Submitted:

03 March 2025

Posted:

04 March 2025

You are already at the latest version

Abstract

Fruit and vegetables (F&V) are recommended for a healthy life. Adolescence is a critical period for the onset of eating disorders and future health. F&V consumption among adolescents is globally low, making this group a key target for interventions. This cross-sectional study aimed to assess F&V consumption among secondary school students in the food-insecure communes of Boukombe (rural) and Natitingou (urban), Benin. Using probabilistic random sampling, 303 students completed F&V intake frequency questionnaires and 24-hour dietary recalls on school and non-school days. Poisson models identified factors associated with F&V consumption. Results showed that only 8.8% (Boukombe) and 11% (Natitingou) of students consumed fruit at least twice per day, while 9.9% and 11.4% consumed vegetables at least twice per day. Over 80% of students did not eat fruit in the preceding 24 hours. On average, 45.5% of students in Boukombe and 68% in Natitingou consumed at least three types of vegetables on school days. The most commonly consumed fruits were oranges in Boukombe and oranges with lemons in Natitingou. Factors influencing fruit consumption included sex (P=0.00582), age (P=0.0472), and mothers’ occupation (P=0.03385), while commune (P=0.00017) and ethnic group affected vegetable consumption. Such low F&V consumption among surveyed students is a matter of public health concern, as it is likely to affect their health―in terms of micronutrient deficiency―and intellectual performance. These results should incentivize nutrition researchers, project managers, public health officials, and policymakers to (re)design and implement broader measures targeting secondary school students’ dietary practices to increase their F&V consumption.

Keywords: 
;  ;  ;  ;  ;  

1. Introduction

Ensuring good nutrition and achieving food security are the major challenges of our generation [1]. Indeed, malnutrition and food insecurity are still public health problems in most low- and middle-income countries [2,3]. In Benin, as in many other African countries, food insecurity remains a serious problem with more than one 26% of households being food insecure [4,5]. The department of Atacora in northern Benin is one of the departments most affected by food insecurity and malnutrition, with 24% of the population being food insecure [6]. The food and nutrition assessment indicator of stunting prevalence among under-five-year-old children was 33% in 1996 and quite stable at 32% until 2018 [7]. This was above the critical Public Health level of 30% defined by World Health Organization [8] .The prevalence of food insecurity within households varies from one commune to another within the department, and the highest values are observed in the communes of Boukombe, Toucoutouna, and Natitingou with 46.3%, 30%, and 26.8% respectively[4].
The department of Atacora has a predominantly adolescent population aged between 10 and 19 years [9] and school is one of the places adolescents spend most of their day. Adolescence is a critical period, i.e. often the time of life for the onset of eating disorders [10]. Adolescents are thus an important target group for intervention efforts aiming to improve dietary practices [11,12,13]. However, across the world, adolescents are victims of poor eating habits and unhealthy diets [14,15]. The best way to avoid an unhealthy diet with long-term effects, is to promote dietary diversity and a healthy diet through the consumption of fruit and vegetables (F&V), which are generally considered two important components of a healthy diet [16].
Fruit and vegetable consumption significantly influences health and reduces the risk of disease incidence, including non-communicable diseases [17]. A low F&V intake positively correlates with a higher incidence of non-communicable diseases. A diet rich in F&V is recommended for human health at any age, and in particular for adolescents [18], as they provide the body with vitamins, minerals, fiber and several phytochemicals necessary for growth and development, cognitive performance, and health maintenance [19]. The World Health Organization (WHO) recommends a daily F&V intake of 400g, or five daily portions of F&V [20]. A large proportion of adolescents and secondary school students (This study focuses on adolescents aged 10−19. In the narrative, we refer to the adolescents of our study as ‘students’ or secondary-school students’, who are aged between 11 and 19) worldwide do not meet WHO’s recommended F&V intake [17]. Table 1 summarizes the results of some relevant studies assessing the levels of fruit and vegetable consumption among secondary school students.
There is scant information about F&V consumption among students/adolescents in Benin [21,22] and, to our knowledge, no study has been conducted in the department of Atacora, which is the most affected by food insecurity. However, there is a need for accurate data on young people (vulnerable groups) from this region to explore the determining factors associated with poor F&V consumption in order to identify strategies to improve F&V consumption among these adolescents. This study thus aimed at assessing F&V consumption among secondary school students in two schools of Boukombe and Natitingou and the factors associated with these consumption rates. The results of this study will supply important information on this age group, to inform the successful development of more specific interventions, and assess the need for school-based nutrition interventions in Benin’s secondary schools.

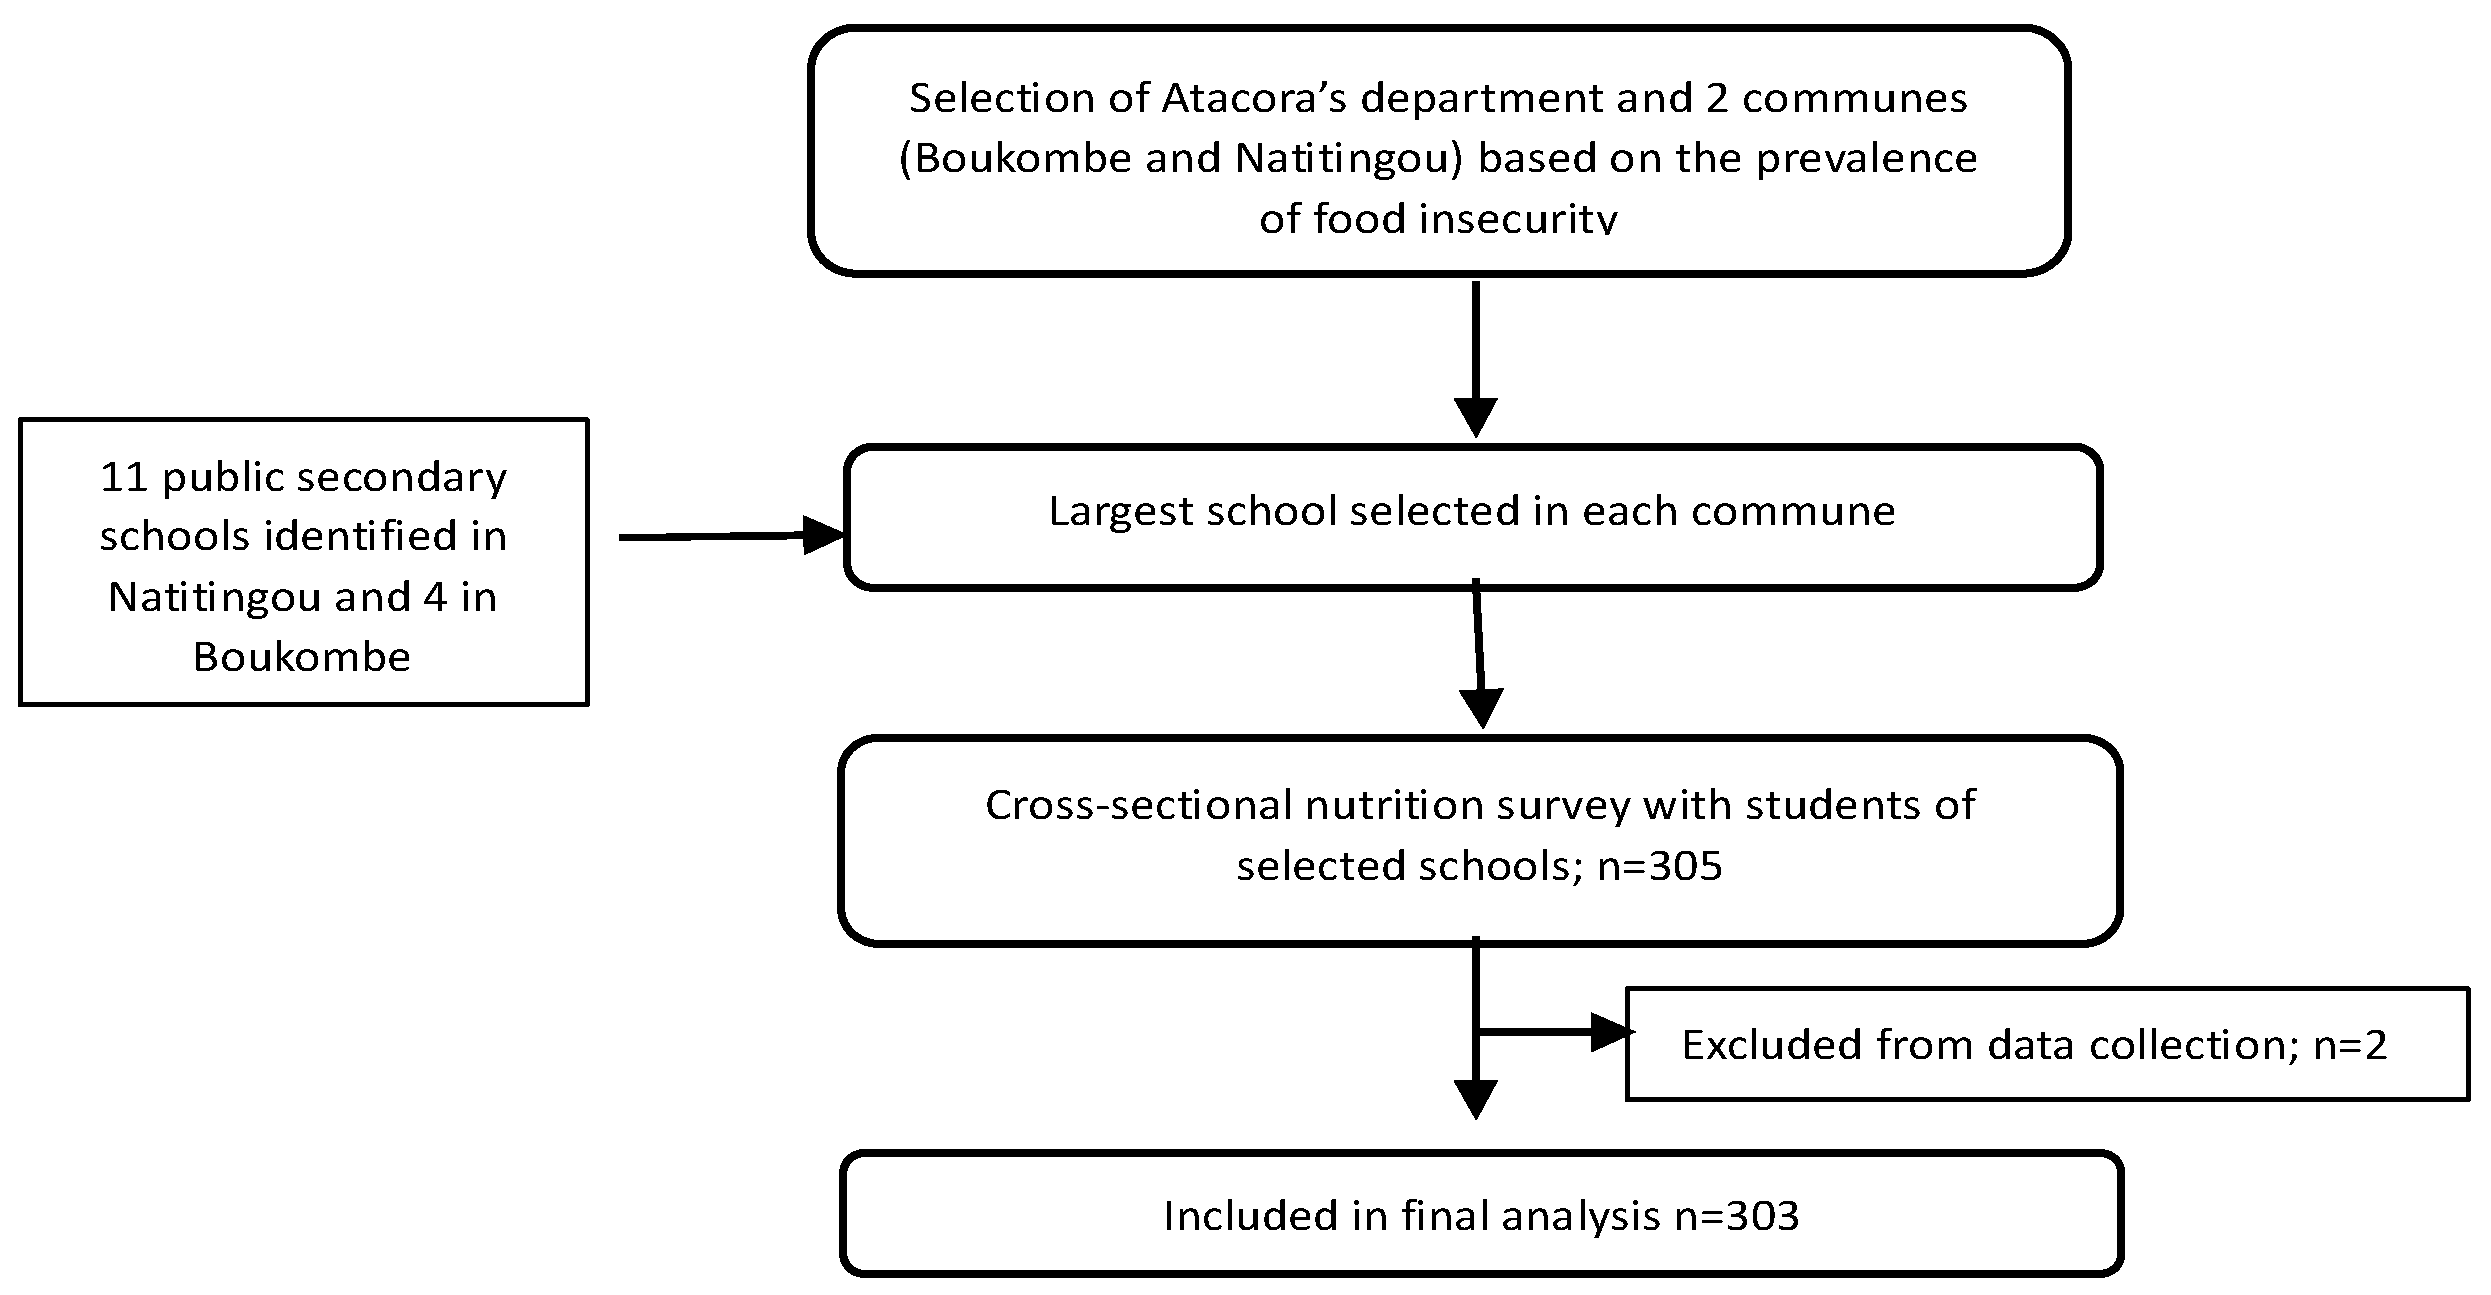
2. Materials and Methods

Study area
This study was conducted in the department of Atacora in Northern Benin, specifically, in the communes of Boukombe and Natitingou. Atacora department has a population of 769,337 residing within nine communes. Natitingou commune is the main city in the department. Boukombe and Natitingou communes are characterized by agricultural, forestry, and pastoral livelihoods [23]. Boukombe is a rural commune while Natitingou is urban. Both Boukombe and Natitingou communes have 46.3% and 26.3% of food insecure households. Agriculture is the main economic activity, often using slash-and-burn, with other traditional techniques predominating. The most-widely cultivated crops are maize, millet, cassava, and fonio [24]. After agriculture, livestock breeding is the second main activity mainly characterize by cattle, sheep, goats, pigs, poultry, and dogs [24].
Sampling and participants recruitment
In this cross-sectional, descriptive, and analytical study, we used convenience and probability random sampling. The target population were secondary or high school students aged between 11 to 19, enrolled in schools in these communes. Overall, four and 11 public secondary schools were identified in Boukombe and Natitingou communes, respectively. The largest public secondary school was selected in each commune, based on the number of students enrolled.
The sample size was calculated using the following formula [25]:
N= Z² xp (1-p) /m²
with Z being the confidence level (typical value of 1.96); p the prevalence of low dietary diversity in Atacora (which is 22.4% [6]), and m a 5% margin of error (standard value of 0.05). The value for dietary diversity was taken from household surveys as there was no specific data related to adolescents’ dietary diversity in this area. The sample size calculation resulted in a sample size of 268 students. Considering a 10% rate of refusal and non-response resulted in a final sample size of 300 students in total, randomly selected from the two secondary schools. A proportional distribution was made according to the number of enrolled students in each school, to ensure a representative sample. The selection criteria for students were to: (i) be enrolled in a non-exam class of the selected secondary schools; (ii) have received their parents’ approval to participate in the study; (iii) willingly to participate in the study; and (iv) be available for interview both on weekdays and weekends. After receiving the approval of the schools’ directors, the students were first met by the study management team in their respective classes. At this first meeting, the study’s goal was explained, followed by a questions and answers session. After that, 318 students volunteered to participate in the study, from which 305 students were randomly selected. The selected students met for a second time to complete the participant consent form. Out of the group of 305 selected students, two students were not available and were consequently excluded. At the end 303 (101 students were selected in Boukombe’s secondary school where 1,150 students were enrolled, and 202 students were selected in Natitingou’s secondary school where 2,350 students were enrolled at the time of data collection) actually participated and individual interviews were conducted by administering three different questionnaires (Figure 1).
Enumerator training
The data collection was carried out from November 18 to December 21, 2023. Before starting, the enumerators were selected based on their data collection experience and proficiency in the study area’s local languages. They were trained in the different tools and a pre-test was conducted to assess the efficiency of the tools and the enumerators. Data was collected using Kobo collect and Kobo toolbox software (Bah et al., 2023; Shapu et al., 2023; Tesfaye et al., 2024).
Data collection
-
Socioeconomic data
To characterize the students, their socio-economic data was collected [26]. The students’ age was calculated from their birthdate and recorded in years. Students’ sex, ethnic origin, and fathers’ and mothers’ principal sources of income were also recorded.
-
Fruit and vegetable consumption frequency data
Data relating to F&V consumption frequency were collected to assess usual F&V consumption based on different modalities―two or more times a day, once a day, 5–6 times a week, 3–4 times a week, 1–3 times month, less than once a month or never)―as suggested by [27].
-
24-hour dietary recall data
Finally, an interview based on a multiple pass qualitative 24-hour dietary recall questionnaire was conducted to reduce bias due to memory [28,29,30]. This method consists of five steps: 1) the ‘quick list’, which is an uninterrupted listing by the participant of foods and beverages consumed; 2) the forgotten-foods list, which queries the participant on categories of foods that have been documented as frequently forgotten; 3) listing the times and occasions when foods were consumed; 4) the detail cycle, which elicits descriptions of foods and amounts eaten; and 5) the final probe review [31,32]. For this questionnaire, two rounds of 24-hour dietary recall were conducted on non-consecutive days―a school day and on a non-school (weekend) day [33]. This will help to have an overview of the F&V consumption of students even if it will not help to have the real micronutrient intake of these students.
Data cleaning and processing
After collection, the data was extracted from Kobo to an Excel tab for cleaning and processing. Duplicate entries were deleted. Overall, 12 duplicate entries in the 24-hour recall base and for six participants who did not have two 24-hour recalls were deleted before processing.
The parents’ professions were categorized into nine groups: Farmer, Breeder, Public service worker, Taxi driver, Trader, Craftsman, Private service worker, Housewife, Processor, and No profession.
In order to assess the adequacy of students’ F&V consumption, data from the F&V consumption frequency questionnaire responses were used. At this point, students who consumed fruit or vegetables at least twice a day were considered as having an adequate F&V intake, and all the remaining respondents were considered as having an inadequate intake [34]. From the 24-h dietary recall data, we extracted an exhaustive list of different F&V consumed by students on school and non-school days. To determine the percentage of students who consumed each fruit or vegetable, a score of ‘1’ was given when the fruit or vegetable was consumed by the student and ‘0’ if not. A total for each F&V was made in order to assess the most-consumed F&V. We also determined the total number of consumed F&V per student in the previous 24 hours. With the two sets of different 24-h dietary recall data, we also appraised whether the number of different F&V consumed by students on school days differed from what they consumed on non-school days.
Data analysis
Data was analyzed using R software version 4.1.3. Descriptive analyses including frequency and proportion was conducted for all variables. The chi-square test and Fisher's test were used to assess the distribution and association between the categorical variables. The Shapiro test was used to check the normality of the distribution of quantitative variables before applying the appropriate comparison tests between the means of the quantitative variables. Levene's test was used to assess the homogeneity of variances between the Natitingou and Boukoumbe student populations for fruit consumption frequency; vegetable consumption frequency; fruits consumed; vegetables consumed; and students’ sex; age; ethnic group; and fathers’ and mothers’ profession. Where the data did not follow a normal distribution, Wilcoxon-Mann-Whitney’s non-parametric test was used to compare the distributions of the two groups of individuals, based on the medians of the quantitative variables. A Poisson model with zero inflation was used to determine the factors influencing the number of F&V consumed. This is because the dependent variable followed a Poisson distribution with zero inflation, indicating count data with a predominance of zeros (in the case of fruit consumption). A negative binomial model was used as an alternative to the Poisson model. In addition, the Poisson generalized estimating equations (GEE) model was used to account for the correlation between observations in the count data. A significance level of 5% (P < 0.05) was considered.

3. Results

This section may be divided by subheadings. It should provide a concise and precise description of the experimental results, their interpretation, as well as the experimental conclusions that can be drawn.

3.1. Participants’ Socio-Economic Data

The participating students’ socio-economic background data are presented in Table 2. Students’ average age was 16 ± 2.72 years in Boukombe, which was one year higher compared to those in Natitingou, although not statistically significant (15 ± 2.72 years). In this study, more girls than boys participated in both sites (59.39% in Natitingou and 56.57% in Boukombe). In terms of main source of income, 45% of students’ fathers in Boukombe reported agriculture as their main occupation, while in Natitingou, 38% were public service workers. Mothers in Boukombe were much more likely categorized under “no profession” (42.42%), while those in Natitingou were more likely to be traders (41.11%) (Table 2).

3.2. Fruit and Vegetable Consumption Frequency Based on the F&V Frequency Consumption Questionnaire

In the Boukombe secondary school, only 8.8% of students had reported consuming fresh fruits at least twice a day, as did 11% of Natitingou’s students (P=0.01). Only 9.9% of Boubombe’s students and 11.44% of Natitingou’s students had reported consuming vegetables at least twice a day (Table 3).

3.3. Number of Fruits and Vegetables Consumed Based on 24-Hour Dietary Recall

Fruits: The percentage of students consuming at least two different fruits in Boukombe secondary school was 2.02% on school days and 4.04% on non-school days (P=0.33), which was lower compared to Natitingou secondary school, where 5.06% of students consumed at least two different fruits on school days and 5.14% on non-school days (P=0.06). The difference between the two sites is significantly different (P= 0,03) (Table 4).
Vegetables: There was a lower prevalence of students consuming at least three different vegetables per day of 45.45% and 55.55% on school and non-school days, respectively in Boukombe compared to Natitingou secondary school, where it was 67.99% and 66.46% on school and non-school days, respectively. There was no significant difference between the different types of days (Boukombe P= 0.24; Natitingou P= 0.65), but a significant difference between the two secondary schools was observed (P<001).

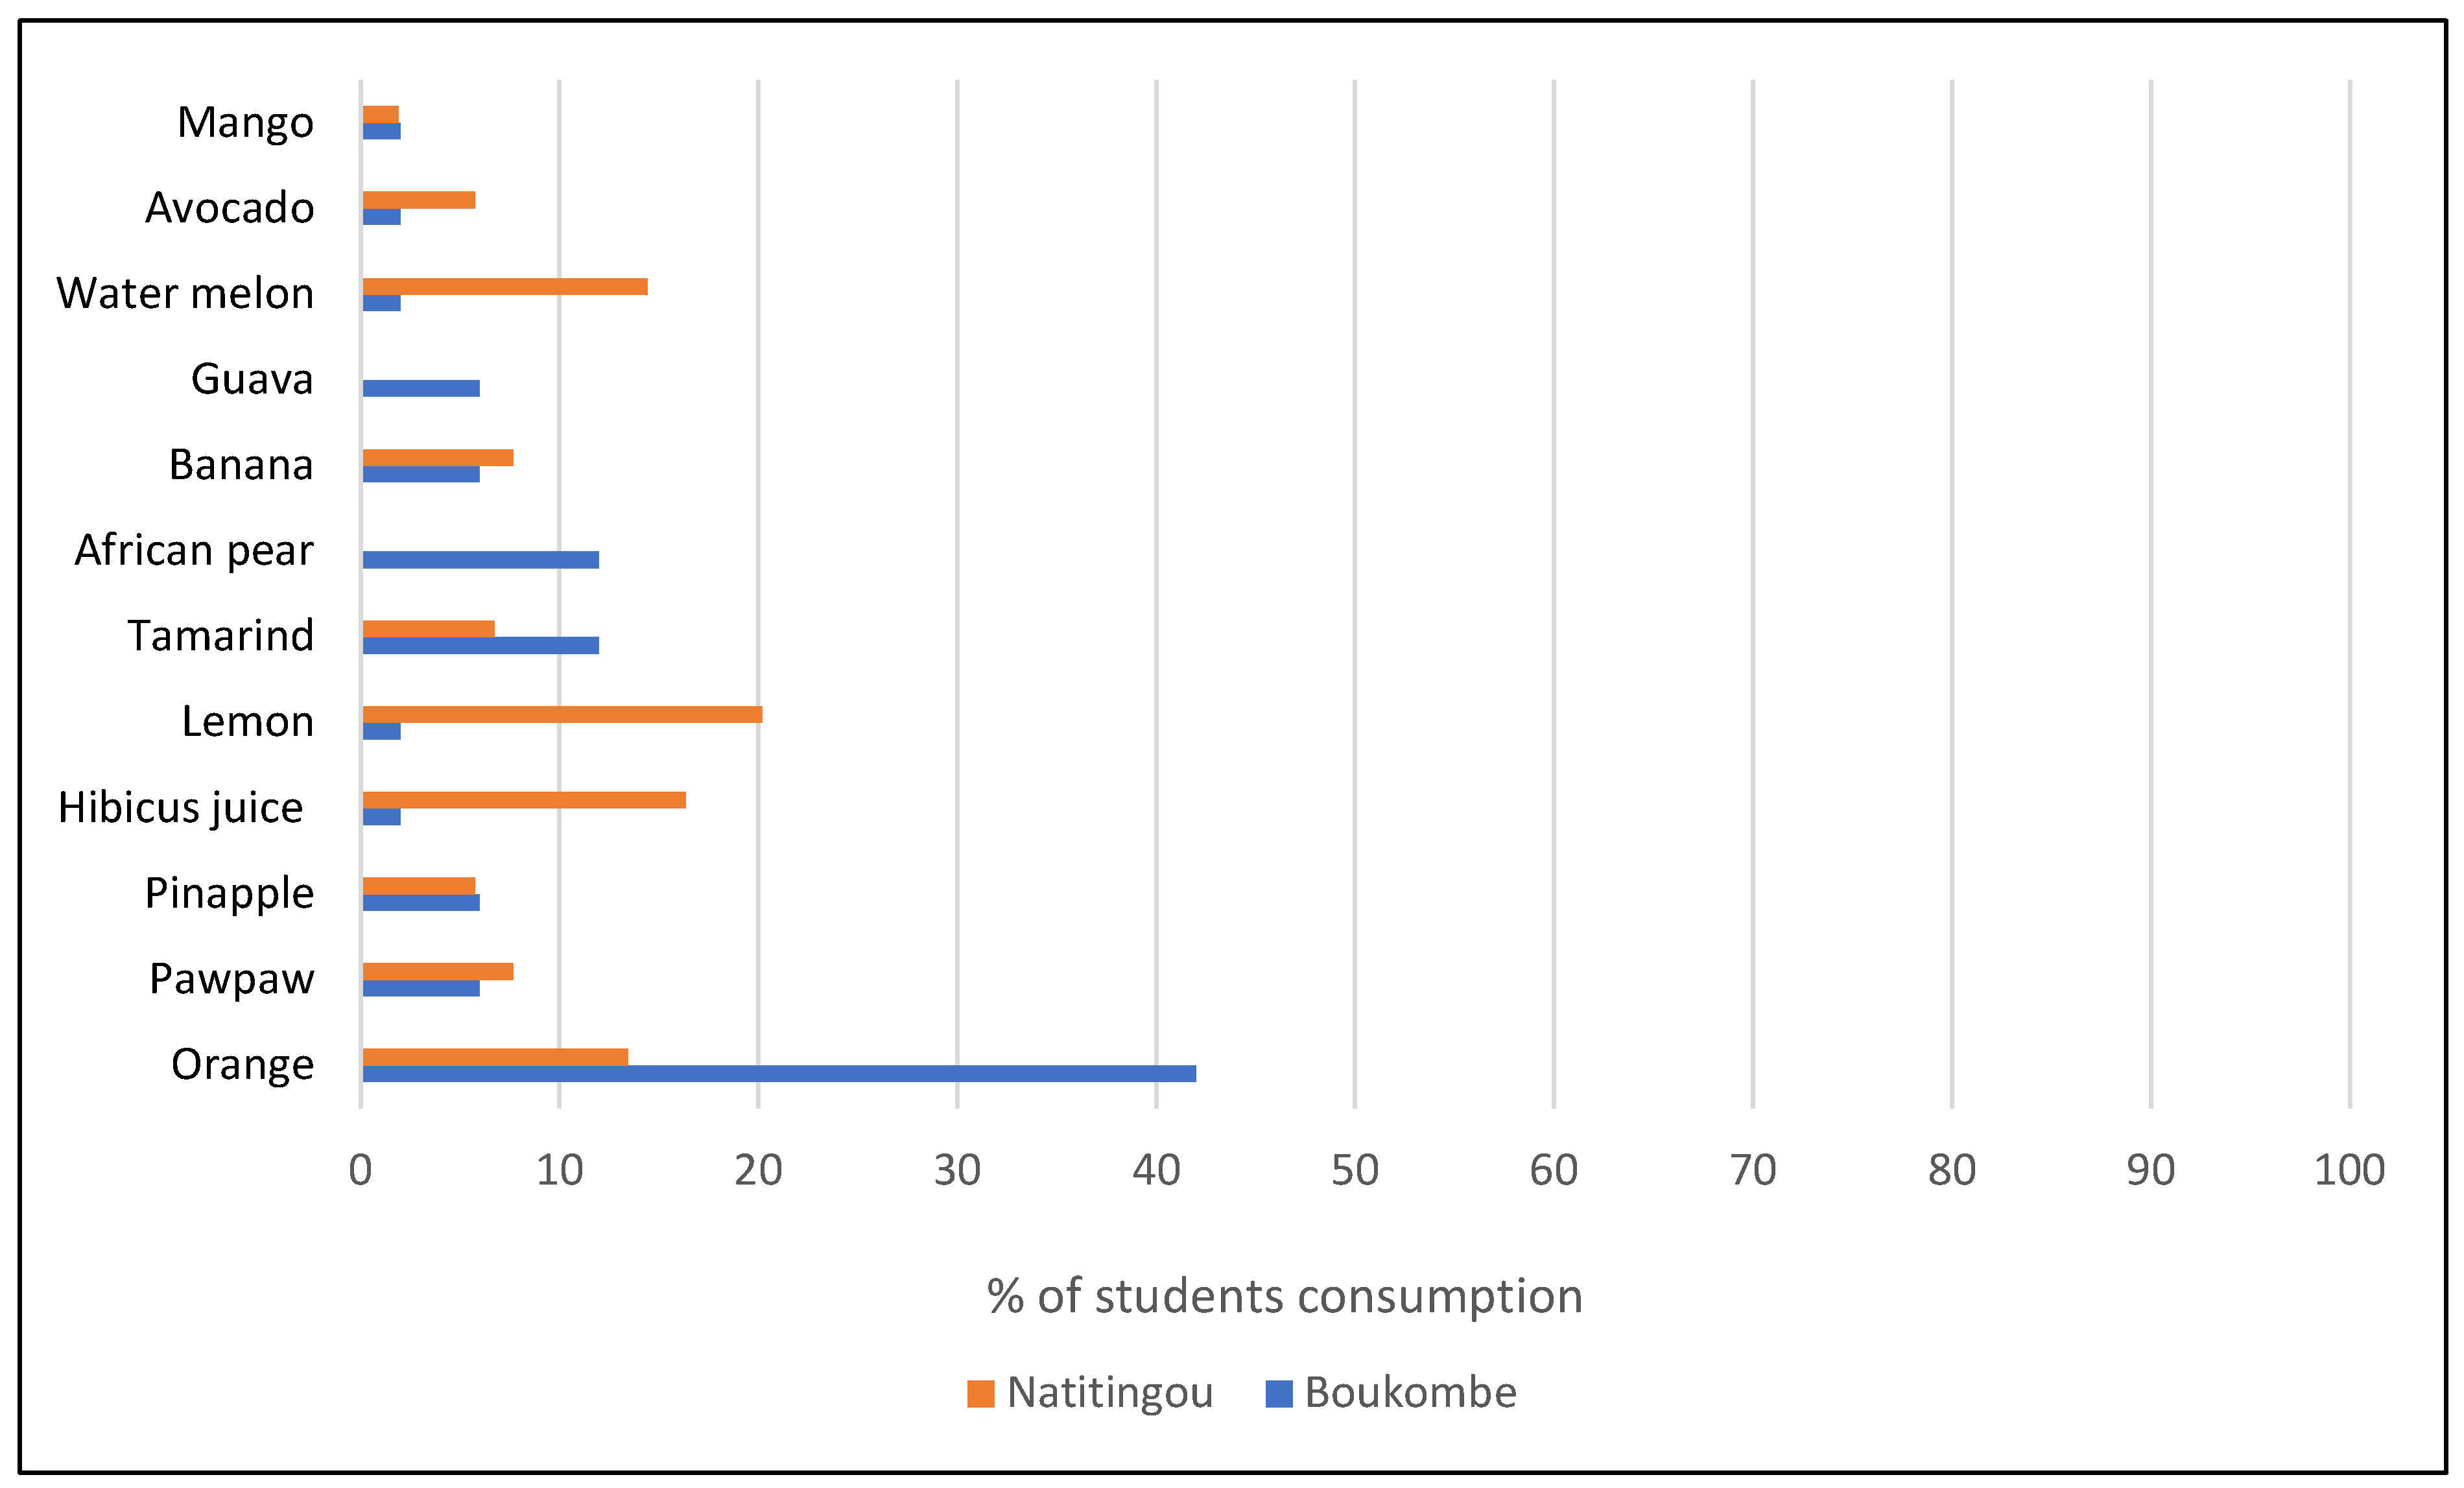
3.4. Fruits Consumed Based on 24-Hour Recall

Twelve different fruits were consumed by the students in both secondary schools. The most-consumed fruit in Boukombe secondary school was oranges (42%) and in Natitingou’s secondary school it was lemons (consumed as juice) (20.19%) (Figure 2).

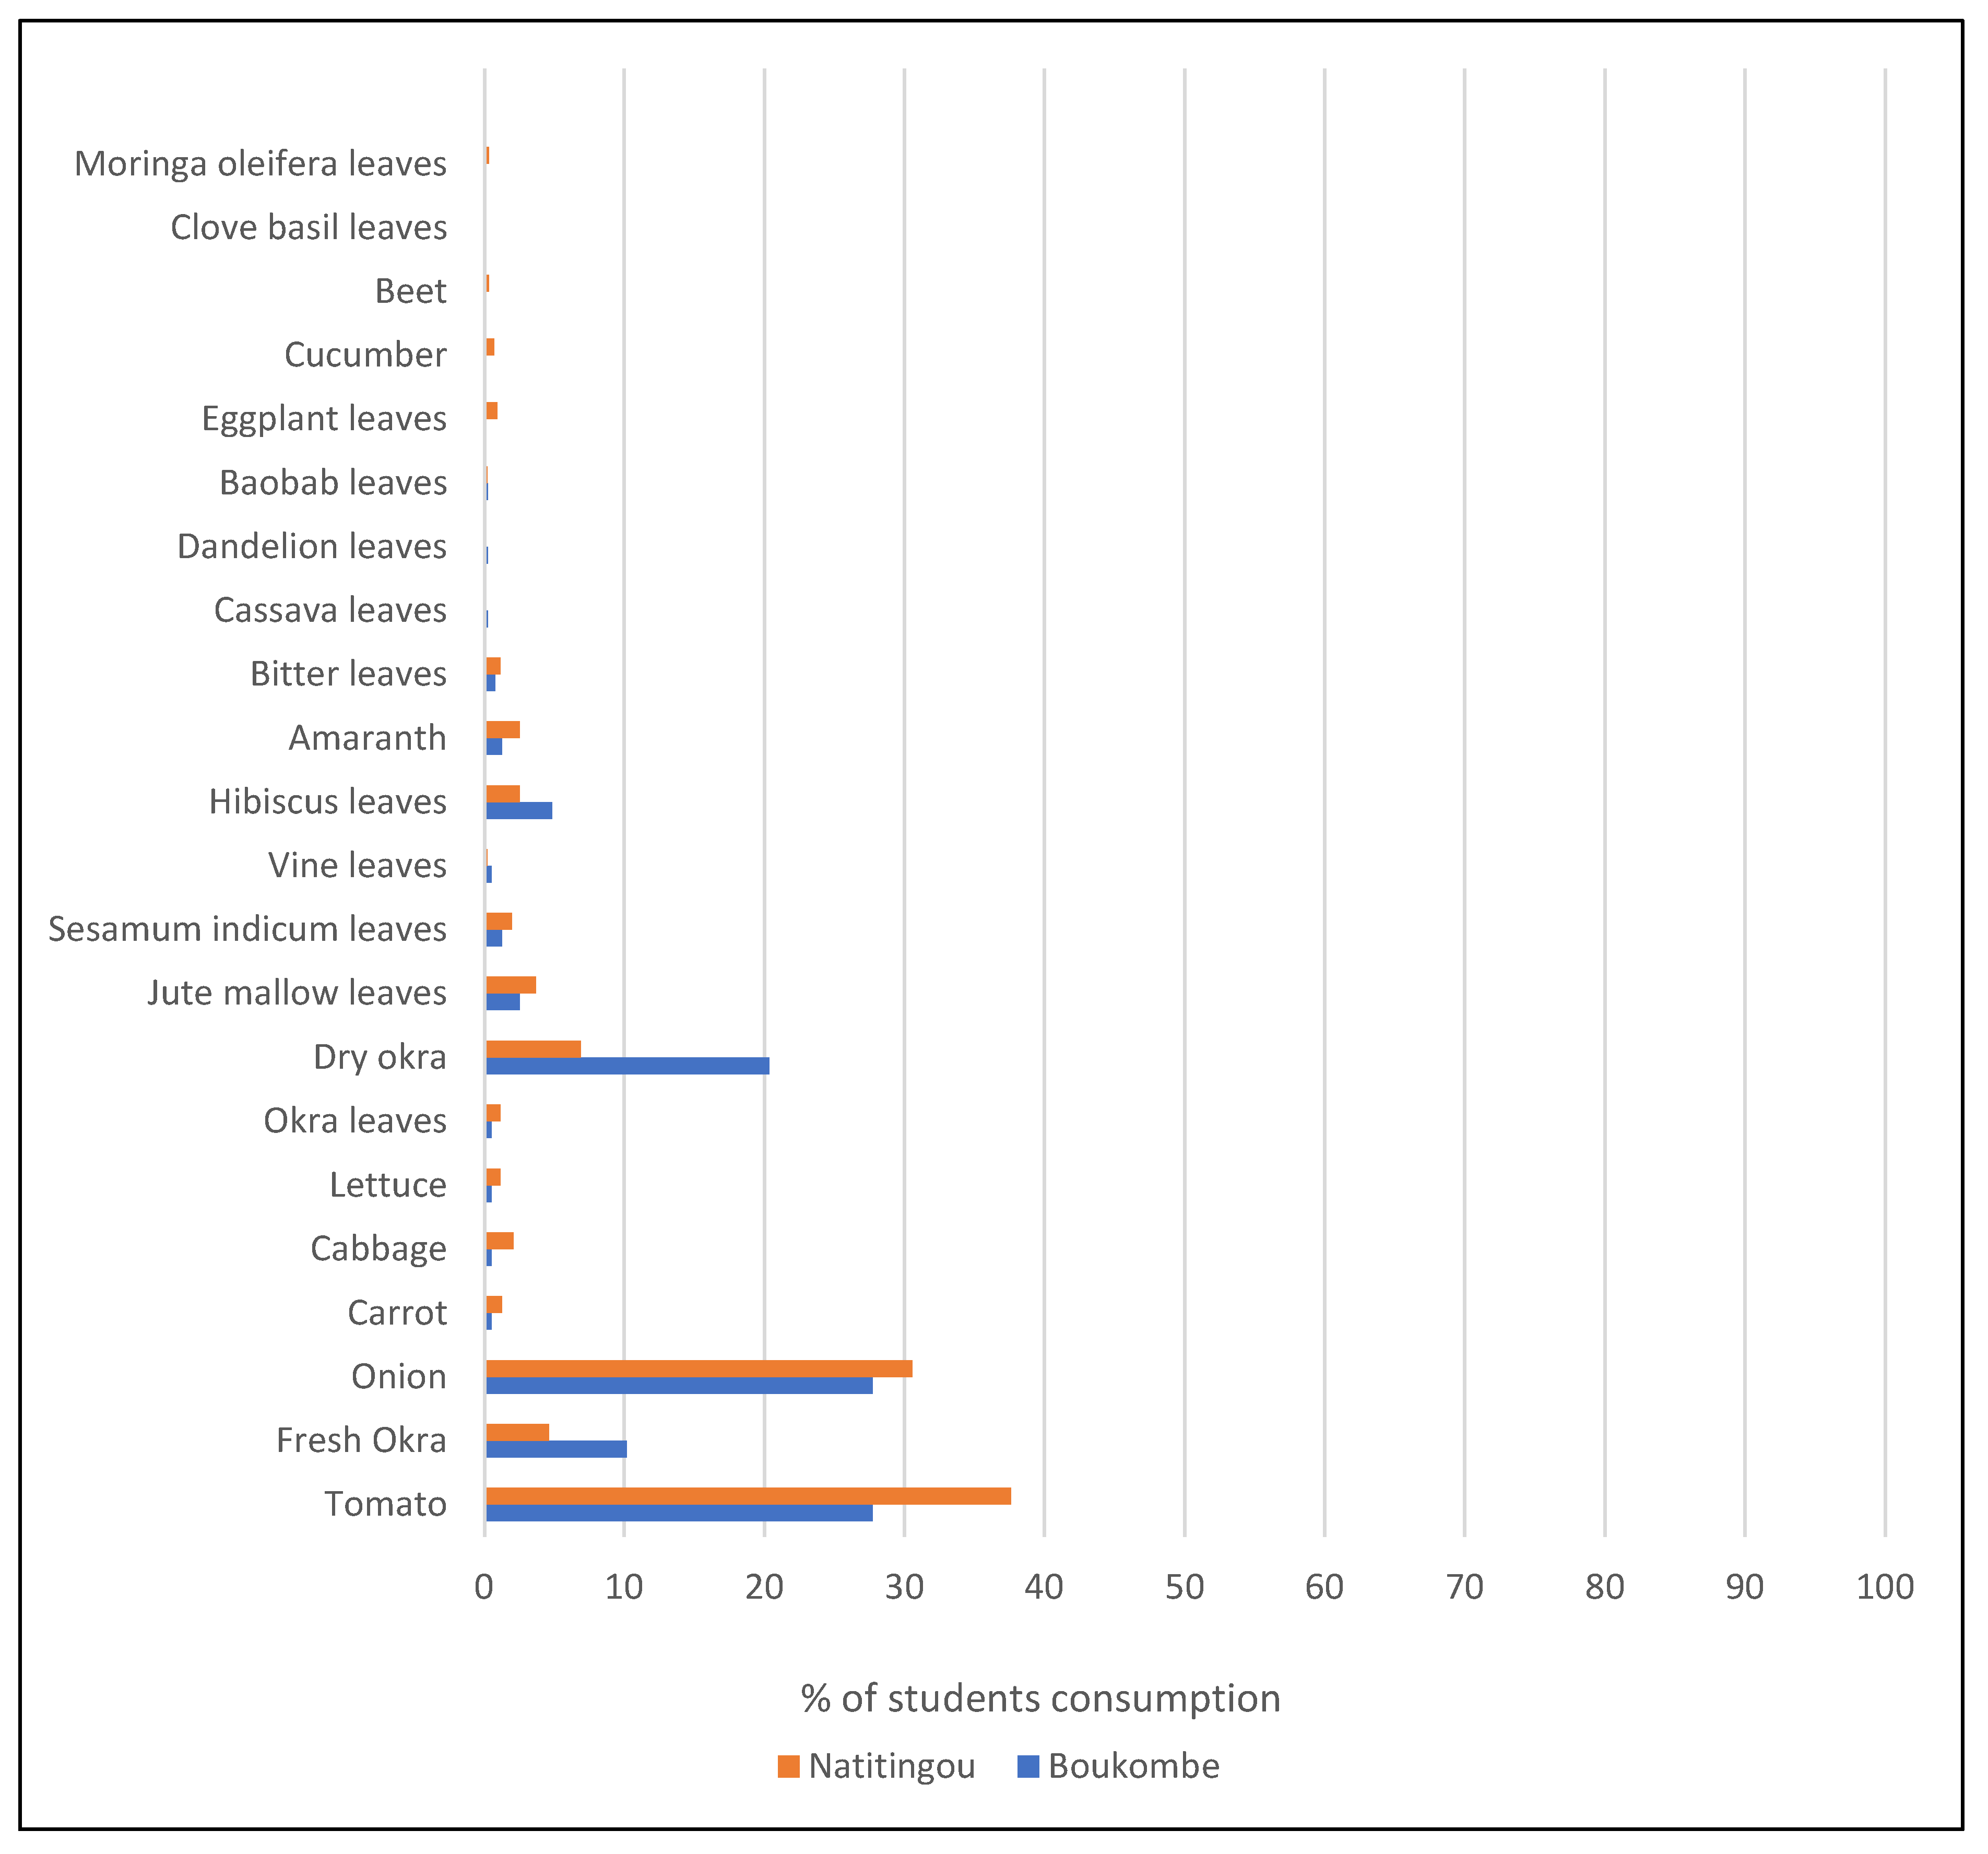
3.5. Vegetables Consumed Based on 24-Hour Recall

The 24-hour recall identified 22 different vegetables being consumed by Natitingou and Boukombe secondary school students (Figure 3)—the most important being tomatoes (Boukombe 27.73% and Natitingou 37.58%) and onion (Boukombe 27.73% and Natitingou 30.57%), followed by dry okra (Boukombe 20.35% and Natitingou 6.89%).

3.6. Factors Associated with Fruit Consumption

Students’ sex (P=0.005), age (years) (P=0.04), and mothers’ occupation (P=0.03) significantly influenced students’ fruit consumption on school days. On non-school days, students’ ethnicity (P= 0.001) and mothers’ occupation (P= 0.04) significantly influenced students’ fruit consumption (Table 5).

3.7. Factors Associated with Vegetable Consumption

Factors identified as being associated with vegetable consumption included the commune (P=0.00017) and the ethnicity (Table 6).

4. Discussion

This study has revealed a very low consumption of F&V among students from both targeted secondary schools in Boukombe and Natitingou communes. Most of the students did not meet the WHO daily intake recommendation based on a variety of five fruits and vegetables daily or a total of 400g of F&V in a day [20]. This implies that, in these schools, more than three out of four (3/4 or 75%) students may suffer from micronutrient deficiencies. In fact, regular fruit consumption is recognized as having a tangible effect on well-being, as well as on brain function [35], implying that low fruit consumption can affect students’ health and their school performance. A cross-sectional study carried out on in Burkina Faso on secondary school students using a food frequency questionnaire showed that 75.4% of students ate less than one serving of fruit per day [36]. Another study based on the Laos Global School-Based Student Health Survey (GSHS) found a prevalence of 74.0% for inadequate fruit consumption [37], which is 20% lower than in our study. The mean daily consumption of fruit identified in a study for Bangladeshi secondary school students was 1.22 servings [38]. Those studies have shown similar F&V consumption rates, indicating a severe challenge in F&V consumption levels for this age group in many food insecure countries. The low prevalence of fruits consumed in both Boukombe and Natitingou may be due to their location within the most insecure food department of Benin [4] and also seasonal fruit availability at the time of year when the data was collected, as fruit availability can fluctuate based on the season [39]. The most-consumed fruit, oranges in Boukombe’s secondary school, and lemons and oranges in Natitingou’s secondary school could also be associated with the data collection period. The orange season in Benin is between September and December which is when data were collected [40].
Students consumed more vegetables than fruits. This aligns with a study carried out in the Arab states, which also found that fruits were less consumed than vegetables [41] and where the mean daily consumption of fruits was 1.22 servings while vegetables was 1.99 servings [38]. Our study indicates that the most-consumed vegetables in both secondary schools were tomatoes and onions. This may be because tomato and onion are among the most the common vegetables used in most daily meals and they can easily be obtained throughout the year. Dry okra—the third most-consumed vegetable in both secondary schools—is often produced during harvesting periods to reduce waste and loss. It is used as base for sauce in the dry season when fresh okra is not available or too expensive. This is an adaptation strategy for people who cannot afford fresh okra, which allows them access to vegetables albeit dried. Students’ diets at our study sites lacked African green leafy vegetables, which are a very important source of micronutrients for health and wellbeing [42]. Similar results have been found with primary school children in Nigeria and also among secondary school students in Australia [43,44].
In our study, students’ sex, age, and their mother’s occupation influenced fruit consumption, while ethnic group and commune was shown to influence vegetable consumption. We also found that boys ate more fruit than girls. This could be explained by the fact that, in our study areas(Boukombe and Natitingou’s secondary schools), many fruit trees are publicly accessible, and boys may be more able or inclined to climb fruit trees than girls. Conversely, a cross-sectional study in Iran among adolescents showed that girls consumed more fruits than boys [18]. Students whose mothers earned an income also consumed more fruit than other students. Similar results are shared by many other studies, showing that fruit consumption is higher among students with income-generating mothers and/or with higher educational levels [45,46,47]. Mothers are often responsible for family feeding practices and the wealthier they are, the more they can improve their children’s dietary practices and make better food choices for their family. A significant difference was found between vegetable consumption in Boukombe (rural area) and Natitingou (urban area). The Boukombe students consumed fewer vegetables than the Natitingou students. However, another study found that students living in rural areas ate more vegetables than those living in urban areas [48]. This difference could be explained by our data having been collected in the transition period, a time of the year in which Boukombe normally faces a water shortage. Farmers in these communes only have access to sufficient water during the rainy season. As Natitingou is an urban area, it does not face these issues and the farmers of nearby villages bring their production to Natitingou to be sold. This increases the availability of vegetables in Natitingou and may contribute to better consumption by children in this commune. Whether it is for fruit or vegetables, ethnicity has been identified as having an influence on students’ consumption. Fruit and vegetable consumption is also culture based and the way students consume F&V could differ depending on their culture, race, or home practices. Similar results have been founded by other authors [49,50].
Limitations of the study
Fruits and vegetables are seasonal. They therefore influence seasonal consumption and data collection. The F&V consumption appraised in this study is linked to the season in which the study was conducted and may not fully reflect all of the F&V eaten by the study cohort throughout the year. This is due to the project design. Furthermore, other sociocultural factors―which are culture, parents education level, wealth and culture―influencing F&V consumption may not have been considered in the present study. Moreover, the 24-hour recall did not collect quantitative data, and therefore cannot provide an accurate overview of the real micronutrient intake of these students. Nonetheless, these limitations do not affect the reliability of the data presented in this paper.

5. Conclusions

Fruit and vegetable consumption among school children has a direct bearing on micronutrient intake and related health benefits or risks. Our study aimed to quantify and assess F&V consumption among secondary school children—as part of the national/local school feeding programs—in two secondary schools in Boukombe and Natitingou, both food-insecure communities located in North Benin. Our findings confirm that F&V consumption in study both sites is below WHO’s recommendation of 400g or five servings/portions of F&V per day [20]. This should be considered a major risk factor for micronutrient deficiencies and related health risks, and school performance among children/adolescents in these communities. These results should be an incentive for nutrition researchers, nutrition project managers and national policies to adopt broader measures targeting the dietary practices of secondary school students in order to improve their fruit and vegetable consumption. These should favor better availability of and accessibility to F&V in and around those schools, and culturally-appropriate incentives to motivate adolescents to consume more F&V. One such initiative could be cultivating school gardens, which stimulate the children’s understanding and appreciation related to growing food, in addition to supporting nutrition outcomes. Interventions focusing/centered on women’s empowerment will also help mothers improve their financial power that will in turn improve students’ access to healthy diets. Lastly, to appreciate the real micronutrient intake of these students and provide a more accurate overview of the nutritional situation, a quantitative 24-hour recall should be conducted. Further surveys should be conducted at different times of year to accommodate for seasonal fluctuations in F&V availability.

Supplementary Materials

The following supporting information can be downloaded at the website of this paper posted on Preprints.org.

Author Contributions

Conceptualization, Melina.HOUNDOLO., Fifali.BODJRENOU., Celine.TERMOTE. and Waliou. AMOUSSA.;methodology, Melina.HOUNDOLO., Fifali.BODJRENOU., Celine.TERMOTE. and Waliou. AMOUSSA.;data curation, Melina.HOUNDOLO. and Elianna.MAJALIWA.; data curation, Melina.HOUNDOLO.; formal analysis,Melina.HOUNDOLO.,Irmgard.Jordan., Elianna.MAJALIWA.;investigation, Melina.HOUNDOLO.; Writing - original draft, Melina.HOUNDOLO., Elianna.MAJALIWA.; Writing - review & editing, Melina.HOUNDOLO., Fifali.BODJRENOU., Irmgard.Jordan., Elie.KOUKOU., Kandala.NGIANGA-BAKWIN., Colette.AZANDJEME., Melanie.KATSIVO., Nadia.FANOU., Céline.TERMOTE. and Waliou. AMOUSSA.; Funding acquisition, Fifali.BODJRENOU. and Céline.TERMOTE.; Resources, Irmgard.Jordan. and Céline.TERMOTE.; Supervision, Fifali.BODJRENOU., Irmgard.Jordan., Waliou. AMOUSSA. and Céline.TERMOTE.; Project administration, Fifali.BODJRENOU. and Céline.TERMOTE

Funding

This work has been implemented with the support and funding of FRuit and vEgetable for Sustainable Healthy diet (FRESH) Initiative and Healthydiet4Africa (HD4A) project under Alliance of Bioversity and CIAT’s supervision. “Funded by the European Union. Views and opinions expressed are however those of the author(s) only and do not necessarily reflect those of the European Union or the European Research Executive Agency. Neither the European Union nor the granting authority can be held responsible for them.”

Institutional Review Board Statement

The study was conducted in accordance with the Declaration of Helsinki, and approved by the Institutional Review Board (or Ethics Committee) of the ALLIANCE OF BIOVERSITY-CIAT (2022-IRB57).

Informed Consent Statement

Informed consent was obtained from all subjects involved in the study. Their participation in the study was entirely voluntary. All the data collected was analyzed anonymously. No personal identifiers were used. All the authors signed a consent form.

Data Availability Statement

The data and material used in this article are available and will be shared on request from the corresponding author, with the permission of the Alliance of Bioversity and CIAT.

Acknowledgments

Additionally, the authors would like to acknowledge Vincent Johnson (Consultant) and Olga Spellman of the Alliance of Bioversity International and CIAT Science Writing Service for copy editing and editorial review of this manuscript.

Conflicts of Interest

“The authors declare no conflicts of interest.” “The funders had no role in the design of the study; in the collection, analyses, or interpretation of data; in the writing of the manuscript; or in the decision to publish the results”.

References

  1. Cole, M.B.; Augustin, M.A.; Robertson, M.J.; Manners, J.M. The science of food security. npj Sci. Food 2018, 2, 1–8. [Google Scholar] [CrossRef]
  2. Chevalier Ph, Delpeuch F, Maire B. Le complexe “malnutrition-infection” : premier problème de santé publique chez les populations défavorisées. Médecine Mal Infect. 1996 Apr 1;26:366–70.
  3. WHO. Africa’s health depends on improved nutrition [Internet]. WHO | Regional Office for Africa. 2024 [cited 2024 Mar 11]. Available from: https://www.afro.who.int/news/africas-health-depends-improved-nutrition.
  4. INSAE, PAM. analyse globale de la vulnérabilité de la sécurité alimentaire et de la nutrition Benin [Internet]. 2018 [cited 2023 Nov 16]. Available from: https://instad.bj/images/docs/insae-statistiques/sociales/Securite%20alimentaire%20et%20nutrition/RapportAGVSA_2017.pdf.
  5. African Development Bank. COMPACT BENIN POUR L’ALIMENTATION ET L’AGRICULTURE. 2023.
  6. INSAE, PAM. agvsan bénin 2017 - Recherche Google [Internet]. 2018 [cited 2023 Feb 24]. Available from: https://www.google.com/search?q=agvsan+b%C3%A9nin+2017&sxsrf=AJOqlzVP67GsE4jtgzwuPEor7KdVlW2JcQ%3A1677249822716&ei=Hs34Y-WYK-nXxc8Pz9mxkAo&ved=0ahUKEwjln4e_sq79AhXpa_EDHc9sDKIQ4dUDCA8&uact=5&oq=agvsan+b%C3%A9nin+2017&gs_lcp=Cgxnd3Mtd2l6LXNlcnAQAzIECCMQJzoICAAQgAQQsANKBAhBGAFQvSJYvyZgiztoAnAAeACAAbQEiAGjDZIBBzMtMi4xLjGYAQCgAQHIAQHAAQE&sclient=gws-wiz-serp.
  7. INSAE, ICF. Enquête Démographique et de Santé au Bénin, 2017-2018. 2019.
  8. de Onis, M.; Borghi, E.; Arimond, M.; Webb, P.; Croft, T.; Saha, K.; De-Regil, L.M.; Thuita, F.; Heidkamp, R.; Krasevec, J.; et al. Prevalence thresholds for wasting, overweight and stunting in children under 5 years. Public Health Nutr 2018, 22, 175–179. [Google Scholar] [CrossRef] [PubMed]
  9. UNFPA. Adolescents and Youth Dashboard - Nigeria | United Nations Population Fund [Internet]. 2022 [cited 2024 Jun 17]. Available from: https://www.unfpa.org/data/adolescent-youth/BJ.
  10. Chaulet S, Riquin É, Avarello G, Malka J, Duverger P. Troubles des conduites alimentaires chez l’adolescent. J Pédiatrie Puériculture. 2018 Jun 1;31(3):113–45.
  11. Hooshmand, S. Dietary Diversity and Nutritional Status of Urban Primary School Children from Iran and India. J Nutr Disord Ther. 2013 Jan 1;03.
  12. Nago, E.S.; Verstraeten, R.; Lachat, C.K.; Dossa, R.A.; Kolsteren, P.W. Food Safety Is a Key Determinant of Fruit and Vegetable Consumption in Urban Beninese Adolescents. J. Nutr. Educ. Behav. 2012, 44, 548–555. [Google Scholar] [CrossRef]
  13. Fabris M, Longobardi C. Critical Period (Psychology) - an overview | ScienceDirect Topics [Internet]. 2023 [cited 2023 Dec 7]. Available from: https://www.sciencedirect.com/topics/medicine-and-dentistry/critical-period-psychology.
  14. Brooks AM, Hanafin S, Molcho M, Gabhainn S, Cahill H. State of the nation’s children, Ireland 2010. 2010 Dec 1;
  15. Ruiz, L.D.; Zuelch, M.L.; Dimitratos, S.M.; Scherr, R.E. Adolescent Obesity: Diet Quality, Psychosocial Health, and Cardiometabolic Risk Factors. Nutrients 2019, 12, 43. [Google Scholar] [CrossRef] [PubMed]
  16. Ziaei, R.; Shahi, H.; Dastgiri, S.; Mohammadi, R.; Viitasara, E. Fruit and vegetable intake and its correlates among high-school adolescents in Iran: a cross-sectional study. J. Public Heal. 2019, 28, 711–718. [Google Scholar] [CrossRef]
  17. El Shikeri, A.B. Fruit and Vegetables’ Consumption among Children and Adolescents: Determinants of Consumption and Possible Solutions. Adv. Obesity, Weight. Manag. Control. 2017, 6, 1–3. [Google Scholar] [CrossRef]
  18. Shokrvash B, Majlessi F, Montazeri A, Nedjat S, Shojaeezadeh D, Rahimi A, et al. Fruit and Vegetables Consumption among Adolescents: A Study from a Developing Country. World Appl Sci J. 2013 Jan 1;21:1502–11.
  19. Morris, J.; Briggs, M.; Zidenberg-Cherr, S. School-based gardens can teach kids healthier eating habits. Calif. Agric. 2000, 54, 40–46. [Google Scholar] [CrossRef]
  20. World Health Organization (WHO). Healthy Diet: Key Facts. 2020. Available online: https://www.who.int/news-room/fact-sheets/detail/healthy-diet (accessed on 19 April 2023).
  21. Nago, E.S.; Lachat, C.K.; Huybregts, L.; Roberfroid, D.; Dossa, R.A.; Kolsteren, P.W. Food, energy and macronutrient contribution of out-of-home foods in school-going adolescents in Cotonou, Benin. Br. J. Nutr. 2009, 103, 281–288. [Google Scholar] [CrossRef]
  22. Darboux AJ, Sossa Jerome C, Falola LG. Etude de l’offre et du comportement alimentaires - ProQuest. Int J Innov Appl Stud. 2019;Vol. 27(N° 1):410–6.
  23. Agbanou BT. Dynamique de l’occupation du sol dans le secteur Natitingou-Boukombé (nord-ouest bénin) : de l’analyse diachronique à une modélisation prospective [Internet] [phdthesis]. Université Toulouse le Mirail - Toulouse II ; Université d’Abomey-Calavi (Bénin); 2018 [cited 2024 Jun 22]. Available from: https://theses.hal.science/tel-02476241.
  24. MEBOUNOU CC, DJAOUGA M, DJOMAMOU D. Apport de la cartographie numérique aux travaux cadastraux d’une portion du lotissement de YIMPORIMA dans la commune de NATITINGOU. 2019;
  25. Magnani R. Food and Nutrition technical assistance. Sampling guide. [Internet]. 1997 [cited 2024 Aug 9]. Available from: https://www.google.com/search?q=16.+Magnani%2CR.+(1997).+Food+and+Nutrition+technical+assistance.+Sampling+guide.+%5Bcited+2022+Octobre+30%5D.+Available+from%3A+file%3A%2F%2F%2FC%3A%2FUsers%2Fadmin%2FDownloads%2FFANTA_-_Sampling_Guide%2520(1).pdf&oq=16.%09Magnani%2CR.+(1997).+Food+and+Nutrition+technical+assistance.+Sampling+guide.+%5Bcited+2022+Octobre+30%5D.+Available+from%3A+file%3A%2F%2F%2FC%3A%2FUsers%2Fadmin%2FDownloads%2FFANTA_-_Sampling_Guide%2520(1).pdf&aqs=chrome..69i57.866j0j15&sourceid=chrome&ie=UTF-8.
  26. Delbosq S, Velasco V, Vercesi C, Gruppo Regionale HBSC Lombardia 2018, Vecchio LP. Adolescents’ Nutrition: The Role of Health Literacy, Family and Socio-Demographic Variables. Int J Environ Res Public Health. 2022 Jan;19(23):15719.
  27. Kristjansdottir, A.G.; Andersen, L.F.; Haraldsdottir, J.; de Almeida, M.D.V.; Thorsdottir, I. Validity of a questionnaire to assess fruit and vegetable intake in adults. Eur. J. Clin. Nutr. 2005, 60, 408–415. [Google Scholar] [CrossRef]
  28. Cogill B. Food and nutrition technical assistance. Anthr Indic Meas Guide URL Httpswww Fantaproject Orgsitesdefaultfilesresourcesanthropometry-2003-ENG Pdf Accessed 2019-05-14WebCite Cache ID 78MvIDHOF [Internet]. 2003 [cited 2024 Apr 14]; Available from: https://citeseerx.ist.psu.edu/document?repid=rep1&type=pdf&doi=90d1b6ef3275d1c3d723e1363301fd97f4261bf2.
  29. Gibson RS, Ferguson EL. An interactive 24-hour recall for assessing the adequacy of iron and zinc intakes in developing countries [Internet]. ILSI Press Washington, DC; 2008 [cited 2024 Jun 24]. Available from: https://www.academia.edu/download/68047630/An_Interactive_24-Hour_Recall_for_Assess20210712-30399-1r342zm.pdf.
  30. Hounkpatin, W.A.; Koukou, E.; Termote, C.; Ntandou-Bouzitou, G.; Mitchodigni, I.; Bodjrènou, S.; Alaofè, H. Dietary Diversity Predicts the Adequacy of Micronutrient Intake in 6- to 23-Month-Old Children Regardless of the Season in Rural Southern Benin. Food Nutr. Bull. 2023, 44, 39–50. [Google Scholar] [CrossRef]
  31. Conway, J.M.; A Ingwersen, L.; Vinyard, B.T.; Moshfegh, A.J. Effectiveness of the US Department of Agriculture 5-step multiple-pass method in assessing food intake in obese and nonobese women. Am. J. Clin. Nutr. 2003, 77, 1171–1178. [Google Scholar] [CrossRef] [PubMed]
  32. Conway, J.M.; Ingwersen, L.A.; Moshfegh, A.J. Accuracy of dietary recall using the USDA five-step multiple-pass method in men: An observational validation study. J Am Diet Assoc. 2004, 104, 595–603. [Google Scholar] [CrossRef] [PubMed]
  33. Rochedy A, Ehlinger V, Godeau E. Habitudes alimentaires et activité physique des collégiens en 2018. Résultats de l’enquête nationale en collèges et en lycées chez les adolescents sur la santé et les substances- EnCLASS 2018. Rennes, Paris: EHESP; 2020 p. 10.
  34. Seidu, A.-A.; Aboagye, R.G.; Frimpong, J.B.; Iddrisu, H.; Agbaglo, E.; Budu, E.; Hagan, J.E.; Ahinkorah, B.O. Determinants of Fruits and Vegetables Consumption among In-School Adolescents in Ghana. Adolescents 2021, 1, 199–211. [Google Scholar] [CrossRef]
  35. Lamport DJ, Saunders C, Butler LT, Spencer JP. Fruits, vegetables, 100% juices, and cognitive function. Nutr Rev. 2014 Dec 1;72(12):774–89.
  36. Yaméogo, T.M.; Sombié, I.; Kyelem, C.G.; Guira, O.; Lankoandé, D.; Coulibali, B.; Tapsoba, M.M.D.; Ilboudo, A.; Kissou, A.S.-L.; Bagbila, A.; et al. Determinants of Fruit and Vegetables Intake among Secondary School Pupils in the City of Bobo-Dioulasso (Burkina Faso): A Cross-Sectional Study. Open J. Intern. Med. 2018, 08, 1–9. [Google Scholar] [CrossRef]
  37. Pengpid, S.; Peltzer, K. Prevalence and correlates of fruit and vegetable consumption among adolescents in Laos. Int. J. Adolesc. Med. Heal. 2020, 33, 555–560. [Google Scholar] [CrossRef]
  38. Salwa, M.; Subaita, F.; Choudhury, S.R.; Khalequzzaman; Al Mamun, M.A.; Bhuiyan, M.R.; Haque, M.A. Fruit and vegetables consumption among school-going adolescents: Findings from the baseline survey of an intervention program in a semi-urban area of Dhaka, Bangladesh. PLOS ONE 2021, 16, e0252297. [Google Scholar] [CrossRef]
  39. Neary. Les fruits et légumes de saison [Internet]. Neary. 2024 [cited 2024 Jan 3]. Available from: https://neary.fr/blogs/les-fruits-et-legumes/le-calendrier-de-fruits-et-legumes-de-saison.
  40. FreshPlaza. Les oranges au Bénin : une filière qui reste à construire [Internet]. 2021 [cited 2024 Jan 3]. Available from: https://www.freshplaza.fr/article/9334734/les-oranges-au-benin-une-filiere-qui-reste-a-construire/.
  41. Zeidan, W.; Taweel, H.; Shalash, A.; Husseini, A. Consumption of fruits and vegetables among adolescents in Arab Countries: a systematic review. Int. J. Behav. Nutr. Phys. Act. 2023, 20, 1–11. [Google Scholar] [CrossRef]
  42. Moyo, S.M.; Serem, J.C.; Bester, M.J.; Mavumengwana, V.; Kayitesi, E. African Green Leafy Vegetables Health Benefits Beyond Nutrition. Food Rev. Int. 2021, 37, 601–618. [Google Scholar] [CrossRef]
  43. Fadeiye E, Adekanmbi AE. FRUIT AND VEGETABLE CONSUMPTION AMONG PRIMARY SCHOOL PUPILS OF EGBEDA LOCAL GOVERNMENT AREA, OYO STATE, NIGERIA. Int J Fam Consum Sci. 2020;9:103–15.
  44. Fayet-Moore, F.; McConnell, A.; Cassettari, T.; Tuck, K.; Petocz, P.; Kim, J. Vegetable intake in Australian children and adolescents: the importance of consumption frequency, eating occasion and its association with dietary and sociodemographic factors. Public Health Nutr 2019, 23, 474–487. [Google Scholar] [CrossRef]
  45. Alsharairi, N.A.; Somerset, S. Parental work status and children's dietary consumption: Australian evidence. Int. J. Consum. Stud. 2018, 42, 522–532. [Google Scholar] [CrossRef]
  46. Groele, B.; Głąbska, D.; Gutkowska, K.; Guzek, D. Mother-Related Determinants of Children At-Home Fruit and Vegetable Dietary Patterns in a Polish National Sample. Sustainability 2019, 11, 3398. [Google Scholar] [CrossRef]
  47. Quezada-Sánchez, A.D.; Shamah-Levy, T.; Mundo-Rosas, V. Socioeconomic characteristics of mothers and their relationship with dietary diversity and food group consumption of their children. Nutr. Diet. 2020, 77, 467–476. [Google Scholar] [CrossRef] [PubMed]
  48. Molz, P.; Pereira, C.S.; Reuter, C.P.; Prá, D.; Franke, S.I.R. Factors associated with the consumption of fi ve daily servings of fruits and vegetables by students. Rev. De Nutr. J. Nutr. 2019, 32. [Google Scholar] [CrossRef]
  49. Kiviniemi, M.T.; Orom, H.; Giovino, G.A. Race/ethnicity, psychological distress, and fruit/vegetable consumption. The nature of the distress-behavior relation differs by race/ethnicity. Appetite 2011, 56, 737–740. [Google Scholar] [CrossRef]
  50. Surjadi, F.F.; Takeuchi, D.T.; Umoren, J. Racial and Ethnic Differences in Longitudinal Patterns of Family Mealtimes: Link to Adolescent Fruit and Vegetable Consumption. J. Nutr. Educ. Behav. 2017, 49, 244–249.e1. [Google Scholar] [CrossRef]
Figure 1. Study flow, including selection and dropouts.
Preprints 151108 g001
Figure 2. The diversity of fruits consumed in Boukombe and Natitingou secondary.
Preprints 151108 g002
Figure 3. Vegetables consumed in Boukombe and Natitingou by secondary school students.
Preprints 151108 g003
Table 1. Previous studies relative to adolescents’ consumption of fruits and vegetables.
Type of study Location Year Target population Results References
Cross-sectional study (review) 22 Arabic countries 2023 Adolescents
10-19 years
A low proportion (10−29%) of adolescents met the five recommended daily F&V servings/portions target, with lower consumption of fruits than vegetables. [41]
Cross-sectional study Bangladesh 2021 Secondary school students 14−18 years Low intake was observed among secondary school students in Bangladesh, where only 21% ate at least five servings/portions of F&V per day. [38]
Cross-sectional study Ghana 2021 Secondary school students The prevalence of adequate F&V intake (both eaten at least twice a day) among secondary school student was 35.7% and 26.8%, respectively, and adequate F&V intake (both eaten at least five times a day) was 27.8%. [34]
Cross-sectional study Benin 2019 Adolescents
10−19 years
Another study carried in Cotonou on adolescents has shown that only 8.6% of adolescents/students consumed F&V at least five times a day. [22]
Cross-sectional study Benin 2010 Secondary school students 13−19 years The average quantity of daily fruit and vegetables intake was 97g. [21]
Table 2. Overview of the study populations’ backgrounds.
Student characteristics Boukombe Natitingou P
N % N %
Sex Female 56 56.57 117 59.39 0.62
Male 43 43.43 80 40.61
Age (years, SD) 15.88 ± 2.72 15.32 ± 2.72 0.12
School grade 6th grade 28 9.5 35 11.8 <0.001
7th grade 5 1.7 43 14.5
8th grade 18 6.1 19 6.4
10th grade 25 8.4 44 14.9
11th grade 23 7.8 56 18.9
Father's profession Farmer 45 45 33 17 <0.001
Breeder 2 2 0 0
Public service worker 22 22 74 38
Taxi driver 4 4 12 6
Trader 3 3 18 9
Craftsman 8 8 40 20
Private service worker 13 13 8 4
Processor 2 2 6 3
No profession 0 0 6 3
Mother’s profession Farmer 12 12.12 7 3.55 <0.001
Breeder 0 0 1 0.50
Public service worker 9 9.09 19 9.64
Trader 17 17.17 81 41.11
Craftsman 14 14.14 34 17.25
Housewife 42 42.42 50 25.38
Private service worker 1 1.01 1 0.50
Processor 1 1.01 0 0
No profession 3 3.03 4 2.03
Ethnic group Ditamari 79 78.78 33 16.24 <0.001
Bariba - 29 14.21
Peulhs 1 1.01 2 1.01
Waama 2 2.02 27 13.19
Fon 3 3.03 18 9.13
Nago 1 1.01 4 2.03
Others 14 14.15 89 44.19
Chi-Square and Fisher Test; P: p-value.; n= number; % : percentage.
Table 3. Fruit and vegetable consumption frequency.
Food type Consumption frequency Boukombe(n=101) Natitingou(n=202) P-value
% %
Fruit, not including juice 2 or more times a day 8.8 11.0 0.01
Once a day 12.8 20.0
5–6 times a week 2.9 2.0
3–4 times a week 13.8 17.5
1–3 times month 2.9 11.0
Less than once a month or never 58.4 38.5
Vegetables 2 or more times a day 9.9 11.44 0.12
Once a day 12.9 21.39
5–6 times a week 1.9 3.5
3–4 times a week 20.9 21.89
1–3 times month 2.9 6.97
Less than once a month or never 51.5 34.82
Fruits, not including juice 2 or more times a day 8.8 11.0 0.01
Once a day 12.8 20.0
5–6 times a week 2.9 2.0
3–4 times a week 13.8 17.5
1–3 times a month 2.9 11.0
Less than once a month or never 58.4 38.5
Vegetables 2 or more times a day 9.9 11.4 0.12
Once a day 12.9 21.4
5–6 times a week 1.9 3.5
3–4 times a week 20.9 21. 9
1–3 times a month 2.9 7.0
Less than once a month or never 51.5 34.8
Wilcoxon-Mann-Whitney test; n= number; % : percentage.
Table 4. Percentage of students based on the number of fruits consumed per student.
p-value p-value p-value
Boukombe Natitingou
SD (%) NSD (%) SD (%) NSD (%)
Number of different fruits consumed 0.034
0 84.84 79.79 0.335 81.13 68,55 0.065
1 13.13 16.16 13.70 26.28
2 2.02 4.04 4.06 4.12
3 0 0 0.50 0.51
4 0 0 0.50 0.51
Number of different vegetables consumed <0.01
0.24 0.65
0 6.06 4.04 5.07 3.09
1 15.15 12.12 8.12 8.76
2 33.33 28.28 18.27 18.55
3 20.20 26.26 17.76 19.58
4 10.10 15.15 20.81 16.49
5 9.09 8.08 13.19 13.91
6 6.06 5.05 5.58 9.27
7 0 1.01 6.59 4.12
8 0 0 4.06 3.09
9 0 0 0 1.03
10 0 0 0.50 0
11 0 0 0 1.54
13 0 0 0 0.51
Total 100 100 100 100
(0)no fruit, (1) one fruit, (2) 2 fruits, (3) 3 fruits, (4) 4 fruits, SD= School Day, NSD = Non-school day. Wilcoxon-Mann-Whitney test. % : percentage.
Table 5. Factors associated with fruit consumption on school and non-school days.
Estimate Std. Error Z value P
School day
(Intercept) -0.91691 1.15945 -0.791 0.43
Age -0.45641 0.22998 -1.985 0.04
Sex 0.99633 0.36129 2.758 0.005
Commune Natitingou 0.44776 0.40890 1.096 0.27
Student ethnicity -0.02352 0.01624 -1.449 0.14
Father’s occupation -0.02601 0.08333 -0.312 0.75
Mother’s occupation 0.20452 0.09639 2.122 0.03
Non-school day
(Intercept) -32.8 2140000 0.00 1.000
Age -0.01 0.04 -0.30 0.76
Male -0.33 0.26 -1.27 0.20
Commune Natitingou -0.50 0.34 -1.45 0.14
Student ethnicity 2.68 0.86 3.12 0.001
Mother’s occupation 2.73 1.32 2.06 0.039
Poisson model with zero inflation; P:P-value.
Table 6. Factors associated with vegetable consumption.
Estimate Std. Error Z value P
(Intercept) 3.703 0.714 26.85 <0.0001
Age 0.0110 0.0331 0.11 0.74
Male -0.0325 0.1868 0.03 0.86
Commune Boukombe -09814 0.2612 14.11 0.0001
Student ethnicity
Berba -1.9282 0.3350 33.14 < 0.0001
Biali 1.6654 0.3733 19.90 < 0.0001
Cenoufo -1.3389 0.4421 9.17 0.002
Djema -3.5776 0.7151 25.03 < 0.0001
Fodo -2.6850 0.5683 22.32 < 0.0001
Goun -1.0600 0.3734 8.06 0.004
Kpabiye -0.9735 0.4199 5.38 0.02
Mahi -0.9629 0.3362 8.20 0.004
M’berme 1.3184 0.3618 13.28 0.0002
Peda -2.1175 0.4188 25.56 < 0.0001
Xwla 1.1950 0.57558 4.28 0.03
Yom 4.8455 0.3824 160.57 < 0.0001
Yora -2.4539 0.4609 28.35 < 0.0001
Zeriman 1.9821 0.4477 19.60 < 0.0001
Poisson generalized estimating equations; P: P-value.
Disclaimer/Publisher’s Note: The statements, opinions and data contained in all publications are solely those of the individual author(s) and contributor(s) and not of MDPI and/or the editor(s). MDPI and/or the editor(s) disclaim responsibility for any injury to people or property resulting from any ideas, methods, instructions or products referred to in the content.
Copyright: This open access article is published under a Creative Commons CC BY 4.0 license, which permit the free download, distribution, and reuse, provided that the author and preprint are cited in any reuse.
Prerpints.org logo

Preprints.org is a free preprint server supported by MDPI in Basel, Switzerland.

Subscribe

Disclaimer

Terms of Use

Privacy Policy

Privacy Settings

© 2025 MDPI (Basel, Switzerland) unless otherwise stated