
Submitted:
28 February 2025
Posted:
03 March 2025
You are already at the latest version
Abstract
Transportation agencies often rely on manual surveys to monitor seatbelt compliance; however, these methods are limited by surveyor fatigue, reduced visibility due to tinted windows or low lighting, and restricted coverage to specific locations, making manual surveys prone to errors and unrepresentative of the broader driving population. This paper presents an automated seatbelt detection system leveraging the YOLO11 neural network on video footage from a tethered uncrewed aerial vehicle (UAV). The objectives are to (1) develop a robust system for detecting seatbelt use at stop-controlled intersections, (2) evaluate factors impacting detection accuracy, and (3) demonstrate the potential of UAV-based compliance monitoring. The model was evaluated in real-world applications at a single-lane and a complex multilane stop-controlled intersection in Iowa. Three studies examined key factors influencing detection accuracy: (i) seatbelt-shirt color contrast, (ii) sunlight direction, and (iii) vehicle type. The system’s performance was compared against manual video reviews and large language models (LLMs), with assessments focusing on detection accuracy, resource utilization, and computational efficiency. Overall, the model achieved a mean average precision (mAP) of 0.902, demonstrated high accuracy across the three studies and outperformed manual methods in reliability and efficiency while providing a scalable, cost-effective alternative to LLM-based solutions.
Keywords:
automated seatbelt compliance detection
; UAV-based monitoring
; vehicle occupant safety
; aerial video analysis
; large language models
1. Introduction
Seatbelt compliance remains a critical public safety concern, with road traffic fatalities continuing to claim thousands of lives annually. In 2022 alone, over 25,000 passenger vehicle occupants died in crashes, nearly half of whom were unrestrained at the time of impact [1]. The risks are even more pronounced in nighttime crashes, where 57% of fatalities involved individuals not wearing seatbelts [2]. Research consistently demonstrates that seatbelt use significantly reduces the risk of fatal injuries [3,4] —by up to 50% for front-seat passengers and 25% for rear-seat occupants [5]. In 2017, an estimated 2,549 lives could have been saved had all occupants properly worn seatbelts [1]. Despite their well-documented life-saving potential, seatbelt noncompliance persists due to behavioral resistance, enforcement challenges, and limited public awareness [6].
Current seatbelt compliance monitoring relies primarily on manual observational surveys conducted by transportation agencies [7]. While these surveys provide valuable data, they have inherent limitations. Geographic coverage is restricted, as surveyors typically monitor only one lane and direction per site, which may introduce sampling bias and limit the representativeness of the data. Visibility constraints—such as tinted windows, low lighting, and obstructions—can make it challenging to accurately assess compliance, potentially affecting the reliability of reported rates. Additionally, surveyors may need to reposition themselves along routes or use vantage points like overpasses and exit ramps to improve visibility [8], which can introduce variability in observation conditions. These limitations highlight the need for more scalable and efficient approaches to seatbelt compliance monitoring to ensure reliable and comprehensive data collection.
Beyond observational surveys, various interventions and advancements in vehicle occupant safety technology have aimed to promote seatbelt use, including automated warning systems, mass media campaigns, and legislative enforcement [9,10]. Automated seatbelt reminders, commonly integrated into modern vehicles, encourage compliance through audible or visual alerts. However, these systems serve only as reminders, leaving the decision to comply solely to the driver’s discretion. Furthermore, these systems depend on in-vehicle technology that is often absent in older or less advanced vehicle models, leaving many drivers without access to these safety features. Legislative measures, such as primary seatbelt laws in 35 U.S. states [11] and enforcement initiatives like “Click It or Ticket” [12] and "Buckle Up America" [13], run by the NHTSA, also effectively promote seatbelt use through extensive advertising and increased enforcement periods.
Despite these measures, wide-spread seatbelt compliance remains inconsistent, underscoring the need for innovative solutions to address the gaps in existing strategies. Real-time automated seatbelt compliance detection systems offer a promising approach [14], particularly when integrated with surveillance technologies. Recognizing the importance of such advancements, the U.S. Department of Transportation (U.S. DOT) has emphasized the development of innovative systems through its Small Business Innovation Research (SBIR) program. A recent SBIR solicitation specifically called for the development of devices capable of automatic seatbelt use detection, data collection, and driver feedback, highlighting the urgency of advancing research in this area [15].
The application of computer vision for seatbelt detection has gained significant traction in recent years. Early approaches primarily relied on traditional image-processing techniques, such as edge detection, salient gradient feature mapping, and color segmentation, to identify seatbelt presence [4,16]. However, these methods were highly sensitive to variations in lighting conditions, vehicle interiors, and camera angles, limiting their practical applicability. More recent advancements have shifted towards deep learning models, particularly convolutional neural networks (CNNs), which offer significantly improved accuracy and robustness [17]. By extracting hierarchical features from image data, CNN-based models effectively differentiate between buckled and unbuckled seatbelts with high precision. For instance, [18] proposed two methodologies: a single-stage detection model using YOLOv7 and a multi-stage approach incorporating a Region Proposal Network (RPN). While these models achieved promising results, they primarily relied on datasets of high-resolution images captured inside vehicles, which differ substantially from the perspectives and image quality of road surveillance systems, posing challenges for real-world deployment. Further advancements have incorporated multi-scale feature extraction techniques combined with deep learning. A study by [19] extracted features from key regions of interest, such as vehicles, windshields, and seatbelts, to train CNN models for seatbelt detection. By incorporating support vector machines (SVMs) to refine detection scores and spatial relationships, the method improved accuracy and robustness on road surveillance images, highlighting its real-world applicability.
Innovative methods have also explored thermal imaging for seatbelt detection, with [20] employing the Fully Connected One Shot (FCOS) network on thermal images captured from 5 to 20 meters, demonstrating effectiveness across varying lighting conditions. Additionally, research has integrated seatbelt detection into intelligent transportation systems (ITS), proposing IoT-enabled vehicle management systems that combine seatbelt monitoring with speed control and alcohol detection for comprehensive road safety solutions [21].
Building upon these advancements, this study presents an automated seatbelt detection system that leverages a YOLO11 neural network and video footage captured by a tethered UAV to identify and quantify seatbelt compliance among drivers at stop-controlled intersections. By leveraging aerial surveillance, this approach addresses several key challenges associated with manual surveys and in-vehicle detection methods. The primary objectives of this research include: (i) developing a robust detection system for monitoring seatbelt usage at stop-controlled intersections, (ii) evaluating key factors that impact seatbelt detection accuracy, and (iii) demonstrating the scalability and reliability of automated UAV-based seatbelt data collection as an alternative to traditional manual surveys. The system’s performance was evaluated through three focused studies designed to reflect common real-world challenges:
- Seatbelt-Shirt Color Contrast: Investigated the impact of varying color contrasts on detection accuracy, including challenging cases where seatbelt and shirt colors closely matched.
- Sunlight Direction: Assessed the model’s robustness under diverse lighting conditions, including glare and shadows, across different times of the day.
- Vehicle Type: Examined how differences in vehicle design and interior layouts influenced seatbelt visibility and detection accuracy.
To validate real-world applicability, the seatbelt detection system was deployed at two stop-controlled intersections in Iowa. Video footage from each site was manually reviewed and compared with the system’s detections. Additionally, performance was benchmarked against OpenAI’s GPT-4V(ision) to evaluate its feasibility for large-scale deployment. As part of this evaluation, a confidence threshold of 0.70 was implemented to conclude seatbelt status. Detections below this threshold were categorized as "unknown" and excluded from any compliance analysis, effectively reducing false detections and ensuring reliable results.
This study introduces a reliable and adaptable approach for real-world seatbelt compliance monitoring, offering valuable insights for policy and safety initiatives. The remainder of this paper is organized as follows: the Materials and Methods section outlines the experimental setup, data collection process, and model development, the Results section highlights the model’s performance and findings, the Discussion explores practical applications and associated challenges; and the Conclusion summarizes key insights and recommendations for future improvements.
2. Materials and Methods
2.1. Experimental Setup and Data Collection
A controlled video data collection was conducted at Iowa State University’s Institute for Transportation (InTrans) parking facility to develop a high-quality dataset for training and evaluating the seatbelt detection model. The experimental setup, depicted in Figure 1, simulated real-world stop-controlled intersection dynamics, where drivers were required to yield at designated points before proceeding.
A tethered UAV was used to capture video footage, positioned overhead and slightly to the left of the lane to achieve a near head-on perspective of approaching vehicles. This strategic placement minimized potential visual obstructions from the vehicle’s A-pillar, which could otherwise obscure the driver’s chest area and hinder seatbelt detection. The UAV operated at two altitudes, 15 and 18 feet, to assess the optimal elevation for maximizing seatbelt visibility while maintaining high detection accuracy. Additionally, the camera was zoomed in on the windshield, precisely focusing on the driver’s chest area to enhance image clarity and improve seatbelt detection reliability.
2.2. Evaluation Studies
To evaluate the robustness of our seatbelt detection model in real-world conditions, we designed three experimental studies, each targeting key factors that could impact detection accuracy. For each study, we curated distinct training and testing datasets to ensure a controlled and systematic assessment of the model’s performance. These studies allowed us to pinpoint potential limitations and refine the model to improve its generalizability. The following sections provide a detailed overview of each study.
2.2.1. Seatbelt-Shirt Color Contrast
This study examined how seatbelt-shirt color contrast affects detection accuracy, especially when the seatbelt closely matches the driver’s clothing. Footage was collected of drivers wearing shirts in various colors to ensure contrast variations. The dataset included high-contrast cases (e.g., black seatbelt on a white shirt) and low-contrast cases (e.g., gray seatbelt on a light-colored shirt) for a thorough performance evaluation.
Beyond assessing detection accuracy across contrast levels, we identified edge cases where the model struggled, such as misinterpreting clothing folds as seatbelts or detecting patterned fabrics as seatbelt-like features. By analyzing accuracy variations and failure modes, we uncovered the model’s limitations and explored refinements to enhance robustness in diverse real-world conditions.
2.2.2. Sunlight Direction
Lighting variability—particularly direct sunlight, glare, and shadows—poses a significant challenge for seatbelt detection. This study examined how sunlight direction affects detection accuracy by capturing footage at different times of the day under varying illumination.
The UAV was positioned in two setups: one facing the sun and another with the sun behind it, allowing us to assess how changing light angles influenced seatbelt visibility. The analysis revealed key failure cases, including overexposure washing out seatbelt details and shadows creating false seatbelt-like features. Based on these findings, we explored targeted improvements, such as exposure-based model adjustments (e.g., normalization and adaptive contrast correction) and data augmentation techniques to enhance detection accuracy under dynamic lighting conditions.
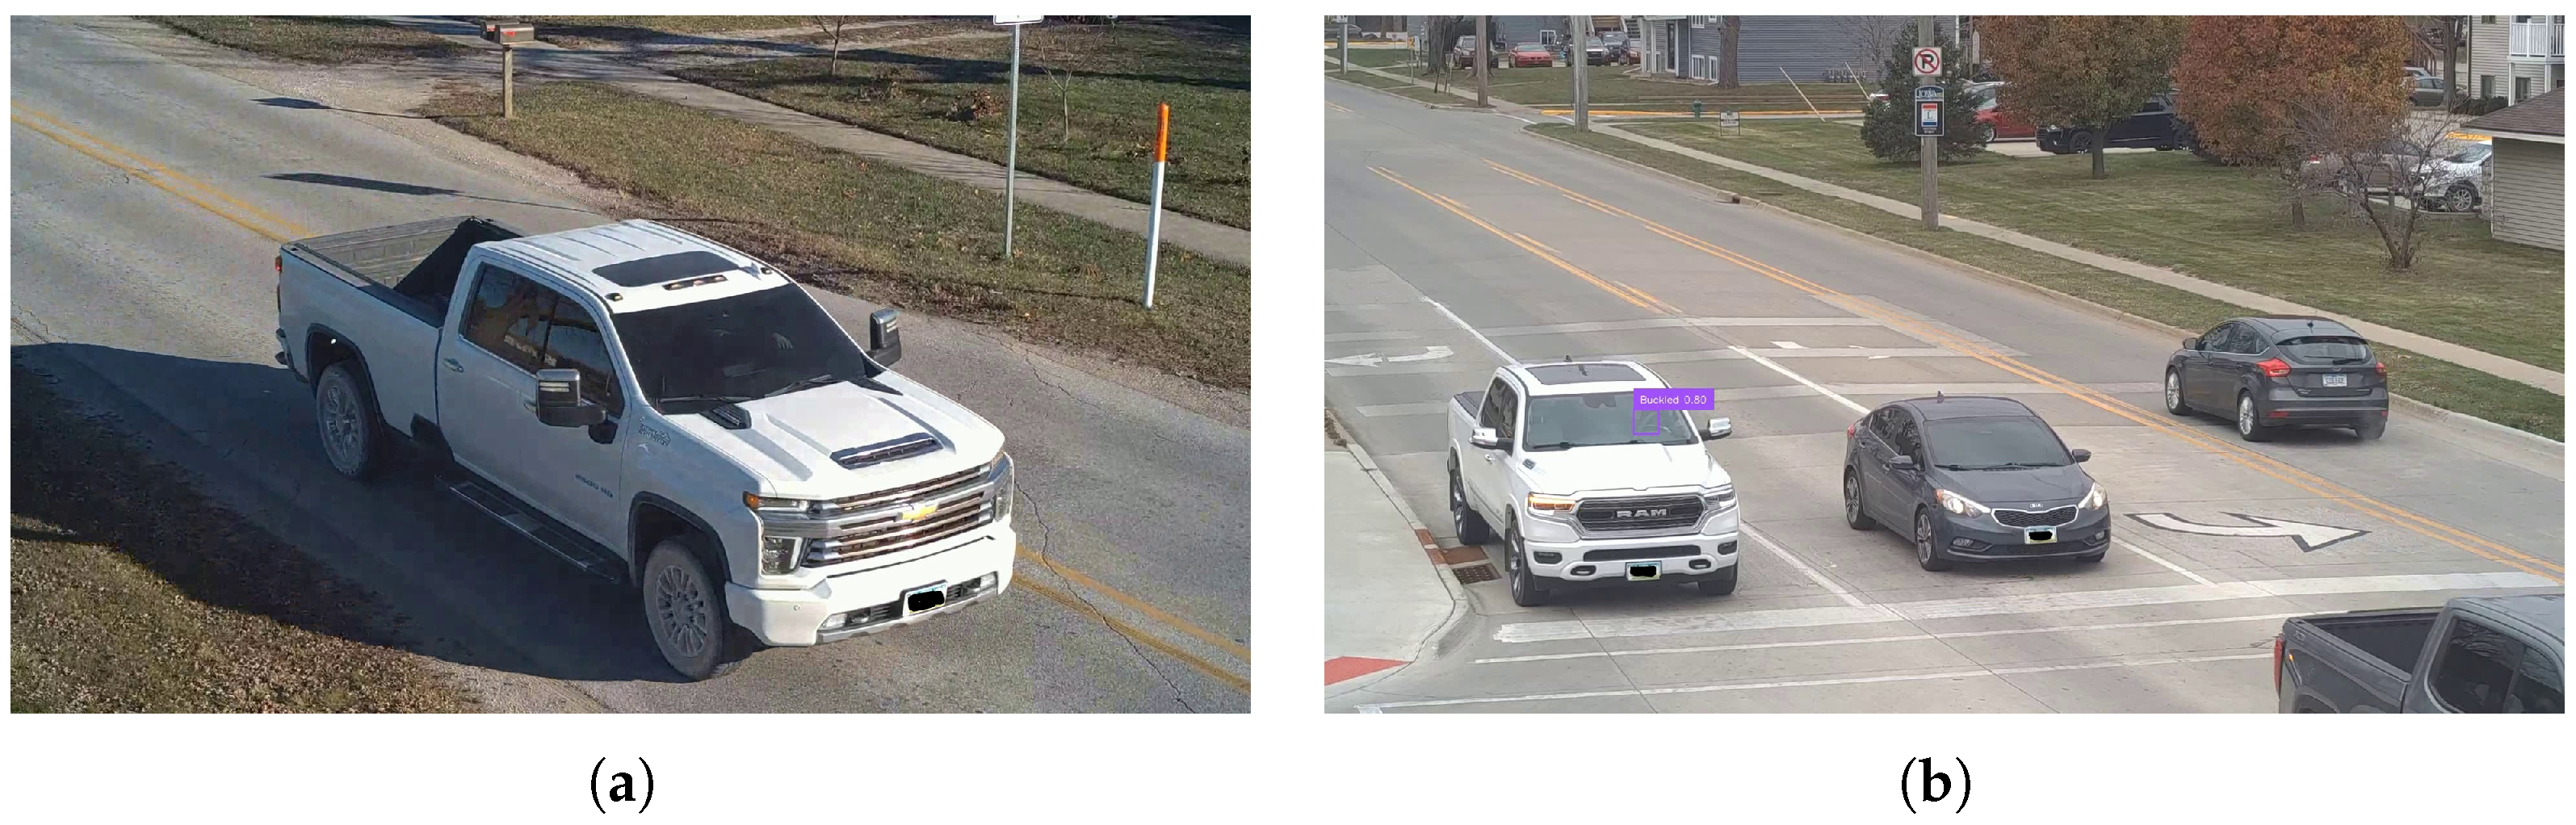
2.2.3. Vehicle Type
Variations in vehicle design—such as windshield height, tint, and interior layout—significantly impact seatbelt visibility. Tall, clear windshields provide an unobstructed view, improving detection, while shorter or steeply angled windshields may obscure parts of the seatbelt. Tinted windows further complicate detection by reducing contrast and masking seatbelt details under certain lighting conditions.
This study assessed model performance across a diverse range of vehicles, including sedans, mini-SUVs, and trucks, to ensure consistent detection accuracy despite design differences. By analyzing detection variations across vehicle types, we identified model limitations and applied adaptive fine-tuning to enhance robustness across different vehicle designs.
2.3. Model Selection
This study utilized YOLO11, one of the latest additions to the You Only Look Once (YOLO) family of object detection models, selected for its superior performance and advanced architectural features [22]. As a deep learning network designed for real-time object detection, YOLO11 identifies object locations within an image and classifies them using pre-trained weights. By analyzing pixel intensities, the model predicts bounding boxes, class labels, and associated probabilities, providing a comprehensive solution for detection tasks. The integration of advanced components, such as the Cross Stage Partial with Spatial Attention (C2PSA) block and Spatial Pyramid Pooling-Fast (SPPF) block, enhances YOLO11’s ability to focus on critical regions within images while preserving computational efficiency. These features make YOLO11 particularly suitable for complex real-world applications, such as detecting seatbelt usage from aerial footage, where accuracy and speed are paramount [23].
The choice of YOLO11 was driven by its capacity to handle challenging conditions in seatbelt detection. The C2PSA block enables effective isolation of critical image regions, improving detection accuracy for objects like seatbelts, which can vary significantly in size and orientation. Furthermore, its integration of multi-scale feature extraction via the SPPF block allows the model to adapt to diverse lighting scenarios, such as shadows and direct sunlight, ensuring reliable performance under varying environmental conditions.
One of the key challenges in seatbelt detection lies in scenarios with low contrast between the seatbelt and the driver’s clothing or vehicle interior. YOLO11 addresses this issue through high-resolution feature integration and residual connections, capturing subtle differences in texture and color. Specifically, using a C3k2 block, the model captures intricate details efficiently, and distinguishes the seatbelt from the surrounding background. This capability becomes crucial in addressing contrast-related challenges, such as when seatbelt colors closely match the driver’s shirt or the vehicle’s interior.
For this study, the system was configured with a confidence threshold of 0.70, categorizing detections into three outcomes: buckled, unbuckled, or unknown. The "unknown" category captured cases where the model’s confidence score was below the threshold, ensuring uncertain outputs were explicitly accounted for.
2.4. Training YOLO11 for Seatbelt Detection
The YOLO11 architecture was fine-tuned on a composite dataset of 3,922 images, incorporating UAV-captured footage with additional raw images sourced from the Seatbelt Detection dataset on Roboflow Universe [24]. UAV footage of drivers approaching the intersection was recorded at 30 frames per second, providing ample samples for training, validation, and testing. The dataset was split into 80% for training and 20% for validation. For testing, selected frames from the three experimental studies were meticulously annotated to assess the model’s general performance and across individual studies. Annotations were performed using the Computer Vision Annotation Tool (CVAT), labeling drivers as "Buckled" or "Unbuckled". This rigorous annotation process ensured high-quality training data, directly enhancing the model’s ability to achieve reliable detection across diverse conditions. By integrating external raw images, the dataset captured greater variability in lighting conditions, camera perspectives, and vehicle types, enhancing the model’s generalization and detection accuracy in real-world scenarios.
To enhance the model’s robustness under real-world conditions, targeted data augmentation techniques were applied on original images during training. These included brightness and contrast adjustments to simulate varying lighting conditions, as well as random cropping, scaling, and rotation to reflect diverse vehicle orientations and distances. Perspective transformations simulated aerial viewing angles, while noise and blur were added to mimic challenges and environmental factors such as low image quality or adverse weather conditions. These augmentations were crucial for improving the model’s generalization and reliability in detecting seatbelt usage in complex scenarios.
The YOLO11 training process optimized hyperparameters and validation strategies to balance performance and efficiency for real-world applications. Training began with an initial learning rate of 0.001667, gradually decayed using a cosine learning rate scheduler to ensure smooth convergence and minimize loss function oscillations in later stages. A batch size of 16 images was used, leveraging available GPU resources for efficient processing. To stabilize gradient updates, momentum was set to 0.9, and a weight decay factor of 0.0005 was applied to regularize the model and prevent overfitting.
The model was trained for 200 epochs to ensure sufficient dataset exposure for convergence. The AdamW optimizer was chosen for its effectiveness in large-scale deep learning tasks, leveraging momentum and weight decay to improve convergence while reducing overfitting. These carefully designed strategies enhanced detection accuracy and ensured robustness across diverse operational conditions.
2.5. Evaluation Metrics
Model performance was assessed based on detection accuracy and computational efficiency to ensure effectiveness and real-world applicability. Detection accuracy was measured using Mean Average Precision (mAP) across IoU thresholds (0.5–0.95) and further evaluated with Precision, Recall, and F1 Score to balance false positives and false negatives. Computational efficiency was analyzed by comparing the model’s detections with OpenAI’s GPT-4V(ision) on the same dataset, assessing resource utilization, cost-effectiveness, and performance consistency to determine feasibility for large-scale deployment.
- Precision reflects the proportion of true positive detections among all predicted positives, computed as:
- Recall measures the proportion of true positives among all actual positives and was calculated as:
- F1 Score balances Precision and Recall using their harmonic mean, capturing the trade-off between the two metrics:
2.6. Real-World Deployment
The system was deployed at two stop-controlled intersections with distinct geometric and traffic characteristics. The first, a simple single-lane, was located at the intersection between 330th Street and Linn Street (330th-Linn) in Slater, Iowa, while the second, a complex multi-lane intersection with three lanes per approach, was between North Dakota Avenue and Ontario Street (North Dakota-Ontario) in Ames, Iowa.
These sites were selected for their representative traffic patterns and their location along routes historically used for annual manual surveys in Iowa. The goal was to replicate real-world data collection conditions, where surveyors adjust to accessible vantage points along designated routes. Table 1 lists each site’s name, geographic coordinates (latitude and longitude), and weather conditions during deployment. At both locations, one hour of video footage was recorded to capture a representative sample of traffic patterns and environmental conditions.
2.6.1. Setup at Sites
At the North Dakota-Ontario intersection, researchers replicated setup during the experimental phase by positioning the drone directly overhead at the opposing approach with a slight lateral adjustment (Figure 1) and zooming in on the target approach. This setup provided a clear view of vehicles as they approached, stopped, and exited the intersection, optimizing detection by enhancing imaging clarity, particularly for slow-moving and stationary vehicles.
Data collection at 330th-Linn faced challenges in capturing ideal slow-stop-go scenarios. A roadside billboard required positioning the drone farther away to prevent tether interference, limiting footage to instances where drivers began reducing speeds. In some cases, drivers only slowed upon reaching the stop line, further complicating data. While other approaches allowed for broader coverage, the UAV was deliberately positioned with the sun behind it to avoid glare, which the conducted evaluation studies showed significantly reduced detection accuracy. This adjustment optimized imaging conditions but constrained the ability to capture complete driver behavior sequences.
3. Results
3.1. Seatbelt Detection Model Performance Evaluation
The performance of the customized YOLO11 model for detecting seatbelt usage was evaluated on a test set of 500 samples, evenly distributed between the two classes (250 Buckled, 250 Unbuckled), under both controlled and diverse scenarios. The model achieved a **mean average precision (mAP) of 0.902, with class-specific mAP values of 0.895 for the "Buckled" class and 0.909 for the "Unbuckled" class, as illustrated in the precision-recall curve (Figure 2(a)). The confusion matrix (Figure 2(b)) further highlights the model’s classification accuracy, where rows represent actual labels and columns denote predicted labels. Diagonal elements reflect correct predictions, while off-diagonal elements indicate misclassifications. Additionally, Figure 3 presents sample detections, demonstrating the model’s ability to accurately identify seatbelt compliance in various conditions.
Table 2 summarizes precision, recall, and F1-Score metrics calculated from the confusion matrix (Figure 2(b)). The "Buckled" class achieved a precision of 0.955 and recall 0.936, while the "Unbuckled" class achieved a precision of 0.948 and recall of 0.944. The overall F1 scores indicate robust model performance. The model achieved an overall average accuracy of 94.0% on the test data.
3.2. Impact of UAV Elevation on Detection Performance
To determine the optimal UAV elevation for detecting seatbelt use, the model was tested at two heights: 15 feet and 18 feet, both with a 2.3x camera zoom. For each elevation, 200 test samples (100 per class) were evaluated, with results averaged per class. Table 3 summarizes the performance metrics, including F1 Scores and detection accuracy, for both scenarios. The 18-foot elevation emerged as the optimal height, achieving an F1-Score of 0.930 and a detection accuracy of 93.0%. In contrast, the 15-foot elevation showed slightly lower performance, with an F1-Score of 0.906 and a detection accuracy of 91.5%. These results indicate that the 18-foot elevation offers the best seatbelt visibility and detection accuracy, making it the most suitable height for reliable seatbelt use detection.
3.3. Model Performance Across Evaluation Studies
Table 4 provides a summary of the performance of the customized YOLO11 model across three evaluated studies. Each study utilized 200 test samples per condition, evenly distributed between the "Buckled" and "Unbuckled" classes. Performance metrics are reported in terms of F1-Score and detection accuracy. In the seatbelt-shirt color contrast study, the model achieved near-perfect performance under high-contrast conditions (e.g., dark seatbelts on light-colored shirts), with an F1-Score of 0.995 and a detection accuracy of 99.5%. However, in low-contrast scenarios, where the seatbelt closely matched the occupant’s clothing, the model’s performance declined, with the F1-Score dropping to 0.917 and detection accuracy to 91.0%. Sunlight direction significantly influenced detection performance. When the UAV faced the sun, intense glare from direct sunlight reduced visibility, resulting in an F1-Score of 0.612 and an accuracy of 57.0%. In contrast, positioning the UAV with the sun behind it eliminated glare and provided even illumination of vehicle interiors, significantly improving performance to an F1-Score of 0.929 and an accuracy of 92.5%. The model achieved a high F1-Score of 0.940 and a detection accuracy of 94.0% for vehicles with clear windshields, where the seatbelt was easily distinguishable from the vehicle interior. However, tinted windshields introduced obstructions, reducing performance to an F1-Score of 0.865 and 84.5% accuracy. The model demonstrated strong performance across most conditions in the three studies, demonstrating adaptability to environmental challenges, while also highlighting opportunities to improve robustness and reliability under direct sunlight.
3.4. Real-world Applications
At the 330th-Linn intersection, 118 vehicle seatbelt instances were recorded, but 4 could not be manually confirmed with confidence. Of these, 2 were completely unclear and undetectable by both reviewers and the model. In the remaining 2 cases, the seatbelt status was somehow visible but not clear-cut enough for manual reviewers to confidently conclude statuses. Interestingly, in 1 of these unclear instances, the model confidently (above the 0.70 threshold) detected the same status that reviewers hesitated to confirm.
Also, at the North Dakota-Ontario intersection, 187 vehicle seatbelt instances were recorded, with 5 excluded due to uncertainty. All 5 of these cases were entirely unclear, with the model also failing to detect a status in 3 of these instances and detecting a status at low confidence levels for 2. After excluding these ambiguous cases, 114 instances from 330th-Linn and 182 from North Dakota-Ontario were used for further analysis to ensure a standardized dataset for fair evaluation.
3.5. Threshold Impact on Model Performance
Table 5 summarize the seatbelt model’s detection outcomes across the two intersections, comparing results with and without applying the 0.70 confidence threshold. At 330th-Linn, without the threshold, the model correctly detected seatbelt status in 105 out of 114 instances, misclassified 9, and missed none. With the threshold in effect, the model achieved 103 accurate detections, only 1 misclassification, and 10 classified as "Unknown." At the North Dakota-Ontario intersection, the model correctly detected seatbelt status in 169 of 182 instances without the threshold, with 7 misclassifications and 6 missed cases. With the threshold applied, it recorded 165 correct detections, no misclassifications, 6 missed cases, and 11 classified as "Unknown." While the threshold reduced correct detection counts and model’s accuracy, it significantly minimized misclassifications, enhancing the model’s reliability and suitability for real-world applications.
3.6. Model Performance Comparison with Traditional Methods
This section compares manual video reviews, simulating real-world surveys, with the seatbelt model’s detections across two settings: the single-lane intersection (330th-Linn) and the complex multi-lane intersection (North Dakota-Ontario). The analysis evaluates performance under varying complexities and examines compliance rates reported by both methods, demonstrating the superior efficiency and reliability of automated seatbelt monitoring over manual surveys.
3.6.1. Simple Intersection Setting - 330th-Linn
A single-lane setup provided a relatively simple monitoring environment. The model confidently detected seatbelt status in 103 out of 114 vehicle instances, missing 11 due to misclassifications or “unknown” instances. Manual reviewers, limited by challenges like fast-moving vehicles, tinted windows, and low-contrast conditions, identified seatbelt status in just 83 cases during a single vehicle pass and required multiple video replays to correctly assess an additional 31 instances. The YOLO11 model demonstrated superior performance, achieving faster, more reliable, and scalable results without the need for replays, underscoring its effectiveness for real-world seatbelt compliance monitoring. Table 6 provides a detailed summary of these comparisons.
3.6.2. Model vs. Manual Reported Compliance Rates - Simple Intersection Setting
Table 7 compares seatbelt compliance rates reported by the model (automated system) and manual reviews at 330th Street across two scenarios: (i) Restricted to single vehicle pass observations, and (ii) Allowing multiple replays.
After applying the confidence threshold to exclude low-confidence detections (classified as "unknown"), 104 total instances (103 correct detections and 1 misclassification, where a buckled status was misclassified as unbuckled) were used to calculate the model’s compliance rate. This comparison highlights what manual reviewers would have reported under idealized conditions of traditional real-world surveys.
The compliance rates were calculated as:
3.6.3. Complex Setting (Three Lanes Per Approach) - North Dakota-Ontario
At North Dakota-Ontario, a more complex monitoring environment with three lanes per approach tested the model’s capabilities under challenging conditions. The YOLO11 model outperformed manual reviews, accurately detecting seatbelt status in 165 out of 182 vehicle instances, with 6 undetected instances, 11 categorized as “unknown”, and no misclassifications.
Cloudiness on-site further reduced visibility of vehicle interiors, compounding challenges for manual reviewers. During single-pass observations, reviewers accurately identified seatbelt status in just 97 cases, overwhelmed with constraints such as tinted windows, low-contrast conditions, and multiple vehicles per lane. Reviewers required video replays to confidently assess an additional 85 cases.
In contrast, the YOLO11 model handled these complexities effortlessly, delivering faster and more reliable results without the need for replays. Its ability to navigate multi-lane scenarios and maintain high accuracy highlights its effectiveness for real-world seatbelt compliance monitoring.
3.6.4. Model vs. Manual Reported Compliance Rates - Complex Setting
At North Dakota-Ontario, seatbelt compliance rates reported by the model (automated system) and manual reviews were also compared across the same scenarios as the first site. Table 9 presents the results of these comparisons.
Figure 5.
Model accurately detecting seatbelt compliance in a multi-lane setting (North Dakota-Ontario) under cloudy site conditions.
Figure 5.
Model accurately detecting seatbelt compliance in a multi-lane setting (North Dakota-Ontario) under cloudy site conditions.
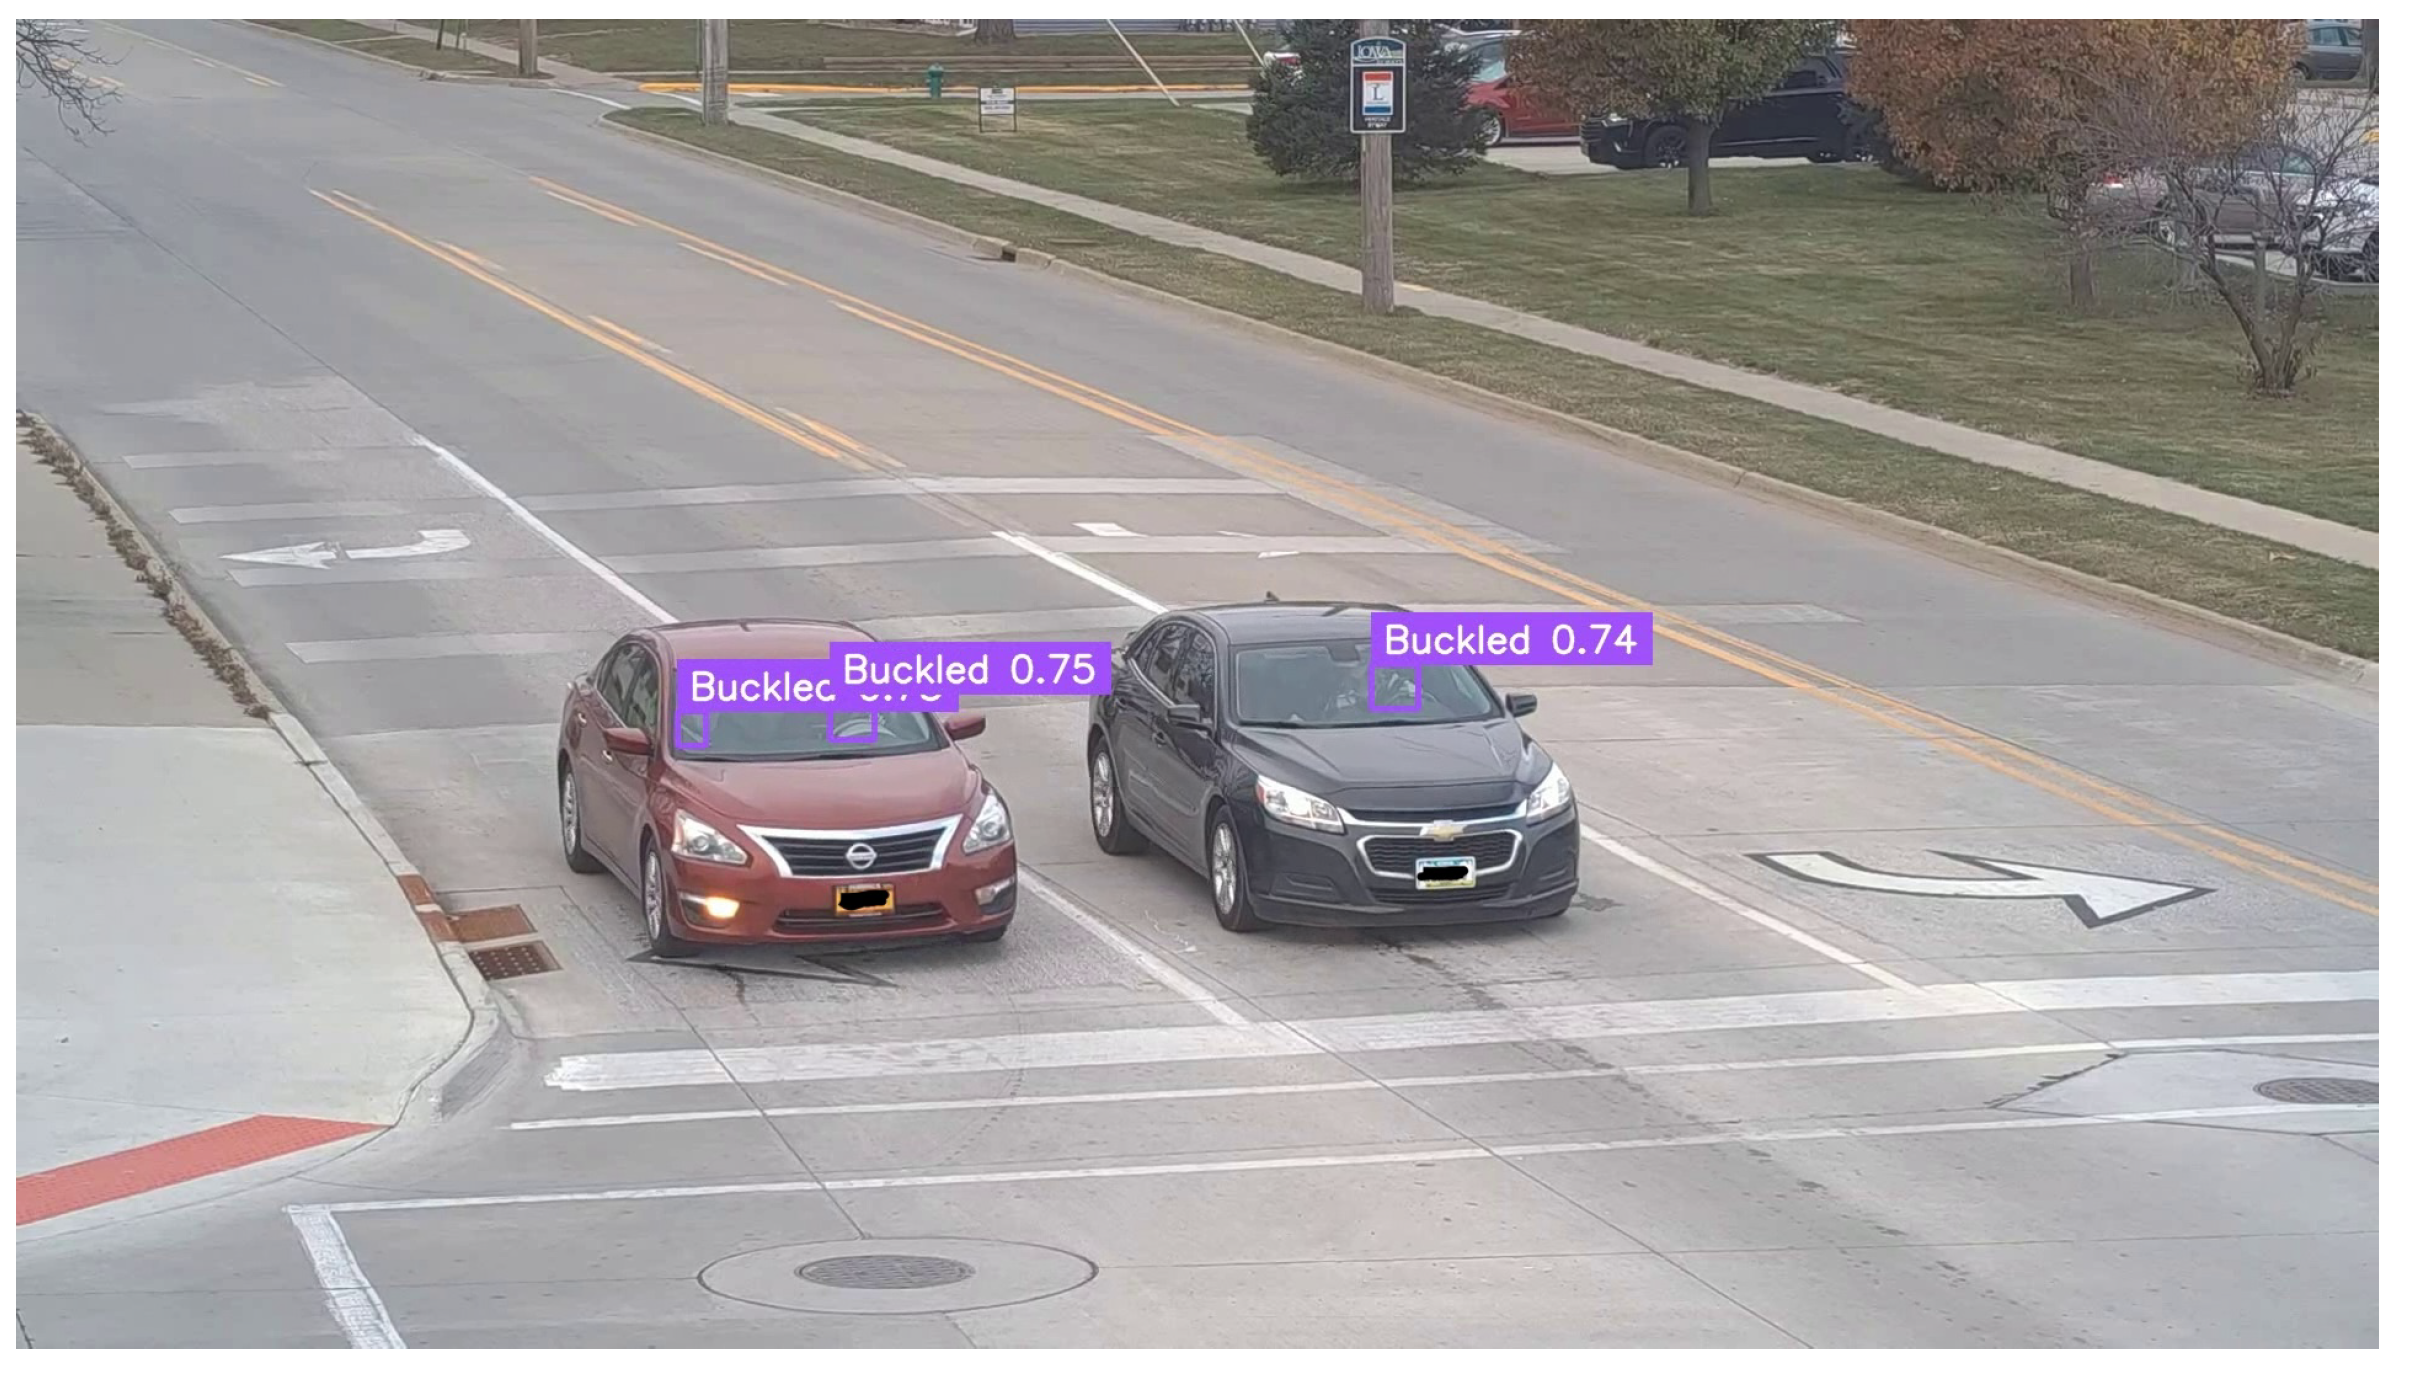
Figure 6.
Missed Detections—(a) Extreme windshield tint prevented detection; however, this case was excluded from analysis, as discussed in Section 3.4. (b) seatbelt detected with high confidence on the left vehicle, but missed on the right due to heavy tint and low lighting.
Figure 6.
Missed Detections—(a) Extreme windshield tint prevented detection; however, this case was excluded from analysis, as discussed in Section 3.4. (b) seatbelt detected with high confidence on the left vehicle, but missed on the right due to heavy tint and low lighting.
3.7. Model Performance Comparison with Large Language Models (LLMs)
A total of 100 frames of vehicle instances from 330th Street and Ontario Street were randomly selected, and GPT-4 V(ision) (GPT-4V) was queried for each frame to classify seatbelt status as "Buckled," "Unbuckled," or "Uncertain." We also requested confidence scores (0–1) with justifications. A 0.70 confidence threshold was applied, consistent with our model’s threshold. For comparison, our model was also evaluated on these images. Table 10 summarizes the performance and computational costs for both models. While GPT-4V achieved a slightly higher accuracy (93.0% vs. 91.0%), the difference was minimal, with our model having fewer misclassifications due to confidence thresholding. However, the computational trade-offs are significant. Each GPT-4V inference incurs a cost of per frame, whereas our model operates at zero cost. Additionally, GPT-4V required preprocessing to isolate the windshield area, increasing inference time and workflow complexity compared to our model’s near-instantaneous operation. These results underscore the advantages of our model for real-world deployment. While LLMs like GPT-4 V(ision) demonstrate strong seatbelt detection capabilities, our model delivers comparable accuracy with greater efficiency and no operational cost. Figure 7 presents a word cloud visualizing key terms from GPT-4V’s justifications, highlighting common detection challenges. Notably, glare, shadow interference, seatbelt-clothing blending, and poor lighting, which GPT-4V frequently cited, align with the key factors we addressed during our model development, reinforcing their real-world impact on seatbelt detection.
4. Discussion
This study demonstrates the effectiveness of integrating UAV-captured footage with advanced detection models to automate seatbelt compliance monitoring at stop-controlled intersections. Data collection utilized a tethered UAV system. The tether secures the UAV to the base station on the ground and provides power up and data transfer down the UAV. Depending on the power source, the system can operate continuously, be accessed remotely, adjust elevation at any time, and be transported to different locations within minutes, making it adaptable for various field settings. The customized YOLO11 model achieved high detection accuracy across experimental studies, even under challenging scenarios like low seatbelt-shirt contrast and tinted windows. A key finding was the impact of direct sunlight, where glare significantly reduced visibility and detection accuracy, emphasizing the importance of strategic UAV positioning. The study identified 18 feet with a 2.3x zoom as the optimal setup for detection accuracy. This configuration ensured clear visibility of drivers during critical moments— as they decelerate while approaching the stop sign, come to a full stop, and begin to accelerate again. These low-speed movements reduced motion blur, allowing the model to reliably detect seatbelt status. The zoom level also provided detailed views of the vehicle interior, further enhancing detection performance.
4.1. Automating Seatbelt Compliance Monitoring - Model vs Manual Review
The deployment of the seatbelt compliance model at two stop-controlled intersections, 330th-Linn with a simple one-lane-per-approach setting and North Dakota-Ontario with a complex three-lane-per-approach setting—demonstrated its reliability under real-world monitoring challenges. Manual reviews, simulating traditional methods, were compared against the model’s (automated system) performance.
The comparison criteria for manual reviews were designed to simulate the conditions faced by traditional surveyors who often stand on level ground. However, even these conditions pose significant challenges for accurate observations. Surveyors have been known to stand behind trucks to gain a better view of windshields or observe from overpasses when possible. For example, in a national seatbelt compliance report [8], surveyors explicitly stated the advantages of observing from overpasses: “Whenever possible, observations for high-volume, limited-access roadways were made from an overpass, allowing for easy viewing of seatbelt use for both the driver and the passenger.” This comparison highlights that the UAV-based system, which provides a consistent top-down view and enhanced zoom capabilities, replicates and even surpasses the preferred observational settings for manual surveys, offering a fair and practical benchmark.
At North Dakota-Ontario, during single-pass observations—reflective of real-world monitoring—reviewers struggled to determine seatbelt status reliably. When all lanes were occupied, with some lanes having multiple vehicles lined up moving through the intersection, reviewers found it difficult to keep pace. Conditions such as low color contrast between seatbelt and occupant clothing, tinted windshields, fast-moving vehicles, and the cloudiness on-site overwhelmed reviewers, resulting in many missed detections and a very low accuracy of 53.30%. In contrast, the YOLO11 model handled these complexities with ease, detecting seatbelt status with an accuracy of 90.66% and no misclassifications, reporting an excellent compliance rate. The model’s ability to simultaneously process multiple lanes and trailing vehicles, unaffected by visibility constraints, showcased its clear advantage over manual methods and reinforced its suitability for real-world seatbelt compliance monitoring.
At 330th-Linn, the deployment faced challenges due to suboptimal setup conditions, such as the proximity of utility poles and the need to avoid sunlight glare. These constraints limited the ability to capture ideal vehicle behavior, with some drivers failing to slow down as they approached the intersection. Even with less-than-ideal conditions, the model showed strong performance with 103 out 114, representing 90.35% correct detections on a single vehicle pass observation as compared to the 72.81% by manual reviews.
Although the model achieved commendable accuracy, there is room for refinement to further reduce the number of instances classified as "unknown." The application of a 0.70 confidence threshold significantly enhanced reliability by minimizing false detections, but it also excluded detections with potential for improvement. For example, at North Dakota-Ontario, applying the threshold resulted in zero misclassifications, compared to seven without the threshold, but 11 instances were still categorized as "unknown." Future iterations of the model should aim to reduce these ambiguous outcomes by improving confidence in challenging conditions, such as low-contrast settings or partially obstructed views. Each instance of detected and classified driver seatbelt compliance was meticulously verified, yielding highly satisfactory results.
4.2. Automating Seatbelt Compliance Monitoring - Model vs LLMs
Despite GPT-4 V(ision)’s ability to detect seatbelt usage with slightly higher accuracy, its computational cost and inference time present scalability concerns. Each inference requires token-based API calls, making large-scale deployment costly, whereas our model runs inference at no additional expense, ensuring seamless and cost-effective implementation.
The study also highlights the inherent challenges in seatbelt detection. GPT-4V’s justifications point to common sources of uncertainty, such as low image resolution, lighting variations, and seatbelt blending with clothing. However, our model was specifically designed to address these limitations through targeted evaluation studies and training on diverse datasets. This structured approach enhances its ability to perform reliably across different conditions, reinforcing its adaptability to real-world scenarios.
By balancing accuracy, efficiency, and scalability, our model provides a practical and deployable solution for automated seatbelt compliance monitoring, making it well-suited for large-scale enforcement and traffic safety applications.
4.2.1. Cost Analysis of GPT-4 V(ision) for Seatbelt Detection
The cost of using OpenAI’s GPT-4 V(ision) for seatbelt detection is determined by its token-based pricing model, which accounts for both input tokens (image encoding and prompt) and output tokens (AI-generated response). GPT-4 V processes images in 512×512-pixel tiles, with a token cost per tile calculated as:
where n represents the number of 512×512 tiles required to cover the image. For a 1365×768-pixel image, n is obtained by dividing the width:
rounding up each, and multiplying:
leading to an estimated **1105 input tokens**.
Additionally, GPT-4V generates a text-based response (300 output tokens) for seatbelt classification, confidence score, and reasoning.
Using OpenAI’s pricing ($0.01 per 1,000 input tokens, $0.03 per 1,000 output tokens), the cost breakdown is shown in Table 11.
4.3. Implications
- Real-World Applications By employing a tethered UAV system and a customized YOLO11 model, we developed a reliable method for monitoring seatbelt use at stop-controlled intersections. Traffic enforcement agencies can utilize this system to enhance compliance and reduce severe injuries and fatalities.
- Insights into Factors Affecting Seatbelt Detection Systems This study contributes valuable insights into factors influencing seatbelt detection performance, specifically the effects of shirt color contrast, sunlight direction, and vehicle types on detection accuracy.
4.4. Study Limitations
While this study contributes valuable insights, it is important to acknowledge its limitations:
- Environmental Conditions Although data augmentation processes simulated extreme conditions, actual extreme weather conditions and nighttime footage were not tested. These factors could significantly impact detection accuracy. Future studies should include data collection under a broader range of environmental conditions, such as heavy rain, snow, fog, and low-light or nighttime scenarios, to thoroughly evaluate the model’s robustness.
- Front Seat Passenger Detection The model performs exceptionally well in detecting drivers but struggles with consistent detection of front-seat passengers in certain scenarios. It performs well when vehicles are directly facing the UAV, but detection accuracy decreases when vehicles are inclined, and the windshield pillar obstructs the view of the front passenger. Addressing this limitation in future iterations could further improve the model’s reliability.
5. Conclusions
Integrating UAV technology with advanced detection models represents a significant advancement in monitoring seatbelt compliance at intersections. This paper introduced an automated seatbelt compliance system using a state-of-the-art YOLO11 detection model to assess seatbelt use at stop-controlled intersections. The model achieved an overall mean average precision (mAP) of 0.902, with exceptionally high accuracy across the various conditions evaluated. By implementing a confidence threshold of 0.70, the model minimized false detections, providing an accurate and reliable assessment of seatbelt compliance. The real-world deployment further validated the model’s effectiveness in diverse conditions, including challenging scenarios such as extreme cloudiness and complex multi-lane intersections. Its ability to efficiently process data with consistent accuracy underscores its practicality and reliability as a tool for real-world seatbelt compliance monitoring, paving the way for scalable and automated traffic safety solutions. Strategic placement of UAVs relative to the sun emerged as a key factor in maximizing detection accuracy. Positioning the UAV with the sun behind it consistently provided evenly illuminated vehicle interiors, minimizing glare and shadows that could obscure the driver’s seatbelt. This placement ensured clearer imaging and significantly improved the model’s performance, reinforcing its importance in real-world applications. Deploying these systems at intersections where drivers naturally yield or stop is also recommended, as these points provide an excellent opportunity for clear and unobstructed imaging. Vehicles moving at slower speeds or remaining stationary minimize motion blur, further enhancing detection accuracy. Future seatbelt compliance systems can be expanded beyond detection to include real-time feedback mechanisms. For example, dynamic message signs could be installed to encourage seatbelt use, similar to speed feedback signs. In cases where a driver is detected without a seatbelt, an immediate alert could be sent to law enforcement, or repeated violations could be logged to prompt targeted interventions. Regular analysis of this data could also reveal patterns of noncompliance, enabling safety implementations tailored to specific locations or demographic groups. By integrating detection, enforcement, education, and incentives, these expanded compliance systems have the potential to enhance seatbelt use rates, reduce traffic injuries and fatalities, and promote a stronger culture of safety among drivers.
Author Contributions
Conceptualization, G.O., A.S.; methodology, G.O., R.J.; software, G.O.; validation, G.O., A.D., and K.A.; formal analysis, G.O.; investigation, G.O.; resources, S.K., A.S., and N.H.; data curation, G.O., A.D., and E.A.; writing—original draft preparation, G.O.; writing—review and editing, K.A., E.A.; visualization, G.O.; supervision, S.K., A.S., and N.H.; project administration, G.O.; funding acquisition, N.H. All authors have read and agreed to the published version of the manuscript.
Funding
This research received no external funding.
Data Availability Statement
The datasets used for experimental study evaluations are available upon request from the corresponding author. However, the real-world application datasets are not readily available due to privacy considerations, as they involve identifiable participants who were aware of the data collection process. To maintain ethical data stewardship and participant confidentiality, these datasets are not publicly accessible. Requests to access the datasets should be directed to the corresponding author. Additionally, the external dataset used to supplement training data, the Seatbelt Detection dataset from Roboflow Universe [24], is publicly available and can be accessed at Roboflow Universe.
Acknowledgments
We express our sincere gratitude to all participants of this study, including our colleagues and the drivers who generously volunteered their time and vehicles for data collection. We are particularly indebted to Skylar Knickerbocker, Anuj Sharma, and Neal Hawkins, whose guidance and expertise as co-advisors significantly enhanced the quality and scope of this research. Additionally, we acknowledge the use of AI tools such as ChatGPT and Grammarly, which contributed to the refinement and comprehensiveness of this paper.
Conflicts of Interest
The authors declare no conflicts of interest.
Abbreviations
The following abbreviations are used in this manuscript:
| YOLO | You Only Look Once |
| UAV | Uncrewed Aerial Vehicle |
| mAP | Mean Average Precision |
| NHTSA | National Highway Traffic Safety Administration ( |
| RPN | Region Proposed Networks |
| CNN | Convolutional Neural Network |
| SVM | Support Vector Machines |
| FCOS | Fully Connected One Shot |
| LLMs | Large Language Models |
| C2PSA | Cross Stage Partial with Spatial Attention |
| SPFF | Spatial Pyramid Pooling - Fast |
| C3k2 | Cross Stage Partial with kernel size 2 |
| CVAT | Computer Vision Annotation Tool |
| GPU | Graphic Processing Unit |
| AdamW | Adaptive Moment Estimation with Weight Decay |
| IoU | Intersection Over Union |
| TP | True Positive |
| FP | False Positive |
| FN | False Negative |
| GPT-4V | GPT-4V(ision) |
References
- Seat Belts. National Highway Traffic Safety Administration. Available online: https://www.nhtsa.gov/vehicle-safety/seat-belts (accessed on 15 December 2024).
- Seat Belt Safety. Available online: https://www.trafficsafetymarketing.gov/safety-topics/seat-belt-safety (accessed on 20 December 2024).
- Wang, D. Intelligent Detection of Vehicle Driving Safety Based on Deep Learning. Wirel. Commun. and Mob. Comput. 2022, 2022, 1095524. [Google Scholar] [CrossRef]
- Qiao, Y.; Qu, Y. Safety Belt Wearing Detection Algorithm Based on Human Joint Points. In Proceedings of the Proceedings of the 2021 IEEE International Conference on Consumer Electronics and Computer Engineering (ICCECE), Xi’an, China, 2021 538–541. [CrossRef]
- Kargar, S.; Ansari-Moghaddam, A.; Ansari, H. The Prevalence of Seat Belt Use among Drivers and Passengers: A Systematic Review and Meta-Analysis. J. Egypt. Public Health Assoc. 2023, 98, 14. [Google Scholar] [CrossRef] [PubMed]
- What Works: Strategies to Increase Restraint Use. Centers for Disease Control and Prevention. Available online: https://www.cdc.gov/seat-belts/what-works/index.html (accessed on 20 December 2024).
- National Highway Traffic Safety Administration. Uniform Criteria for State Observational Surveys of Seat Belt Use. Federal Register, Vol. 76, No. 63, pp. 18042-18059, 2011. Accessed:. 25 December 2024.
- Lehman, N.; Berg, E.; Anderson, A. Iowa Seat Belt Use Survey: 2024 Data Collection Methodology Report. Technical report, Iowa State University, Center for Survey Statistics & Methodology, Ames, IA, USA, 2024. Prepared for the Iowa Governor’s Traffic Safety Bureau.
- Agarwal, G.; Kidambi, N.; Lange, R. Seat Belts: A Review of Technological Milestones, Regulatory Advancements, and Anticipated Future Trajectories. SAE Technical Paper, 2021, 2021-01-5097, 14. [Google Scholar] [CrossRef]
- Akbari, M.; Lankarani, K.B.; Tabrizi, R.; Heydari, S.T.; Vali, M.; Motevalian, S.A.; Sullman, M.J.M. The Effectiveness of Mass Media Campaigns in Increasing the Use of Seat Belts: A Systematic Review. Traffic Inj. Prev. 2021, 22, 495–500. [Google Scholar] [CrossRef] [PubMed]
- National Center for Statistics and Analysis. Seat Belt Use in 2022 – Use Rates in the States and Territories. Technical Report DOT HS 813 487, National Highway Traffic Safety Administration, 2023.
- Click It or Ticket. Available online: https://www.trafficsafetymarketing.gov/safety-topics/seat-belt-safety/click-it-or-ticket (accessed on 28 December 2024).
- Buckle Up Every Trip, Every Time. National Highway Traffic Safety Administration. Available online: https://www.trafficsafetymarketing.gov/safety-topics/seat-belt-safety/buckle-every-trip-every-time (accessed on 28 December 2024).
- Almatar, H.; Alamri, S.; Alduhayan, R.; Alabdulkader, B.; Albdah, B.; Stalin, A.; Alsomaie, B.; Almazroa, A. Visual Functions, Seatbelt Usage, Speed, and Alcohol Consumption Standards for Driving and Their Impact on Road Traffic Accidents. Clinical Optometry 2023, 15, 225–246. [Google Scholar] [CrossRef] [PubMed]
- Small Business Innovation Research (SBIR). SBIR Award Information, 2024. Accessed:. 28 December 2024.
- Zhou, B.; Chen, L.; Tian, J.; Peng, Z. Learning-based Seat Belt Detection in Image Using Salient Gradient. In Proceedings of the Proceedings of the 12th IEEE Conference on Industrial Electronics and Applications (ICIEA). IEEE, 2017, pp. 547–550. [CrossRef]
- Khamparia, A.; Singh, C. Advanced Safety Systems: Seat Belt and Occupancy Detection Using Attention Spiking Neural Networks. Int. J. Eng. Artif. Intell. Manag. Decis. Support Policies 2025, 2, 1–13. [Google Scholar]
- Nkuzo, L.; Sibiya, M.; Markus, E.D. A Comprehensive Analysis of Real-Time Car Safety Belt Detection Using the YOLOv7 Algorithm. Algorithms 2023, 16, 400. [Google Scholar] [CrossRef]
- Chen, Y.; Tao, G.; Ren, H.; Lin, X.; Zhang, L. Accurate Seat Belt Detection in Road Surveillance Images Based on CNN and SVM. Neurocomputing 2018, 274, 80–87. [Google Scholar] [CrossRef]
- Kannadaguli, P. FCOS-Based Seatbelt Detection System Using Thermal Imaging for Monitoring Traffic Rule Violations. In Proceedings of the Proceedings of the IEEE International Conference on Industrial Electronics and Applications (ICIEA). IEEE, 2020. [CrossRef]
- Saranya, N.; Priya, S.S.; F, R.P.; B, S. Intelligent Vehicle Management System Using IoT. In Proceedings of the Proceedings of the 5th International Conference on Electronics and Sustainable Communication Systems (ICESC 2024), Tiruchirappalli, India, 2024; pp. 493–497. [CrossRef]
- Khanam, R.; Hussain, M. YOLOv11: An Overview of the Key Architectural Enhancements. arXiv, 2024, 2410.17725v1. [Google Scholar]
- Vina, A. All You Need to Know About Ultralytics YOLO11 and Its Applications, 2024. Accessed:. 30 January 2025.
- Roboflow. Seatbelt Detection Dataset. Available online: https://universe.roboflow.com/traffic-violations/seatbelt-detection-esut6 (accessed on 25 December 2024).
Figure 1.
Experimental setup during data collection. (a) The drone mounted for aerial recording. (b) Sample output from the drone’s camera after mounting and zoom adjustment.
Figure 1.
Experimental setup during data collection. (a) The drone mounted for aerial recording. (b) Sample output from the drone’s camera after mounting and zoom adjustment.
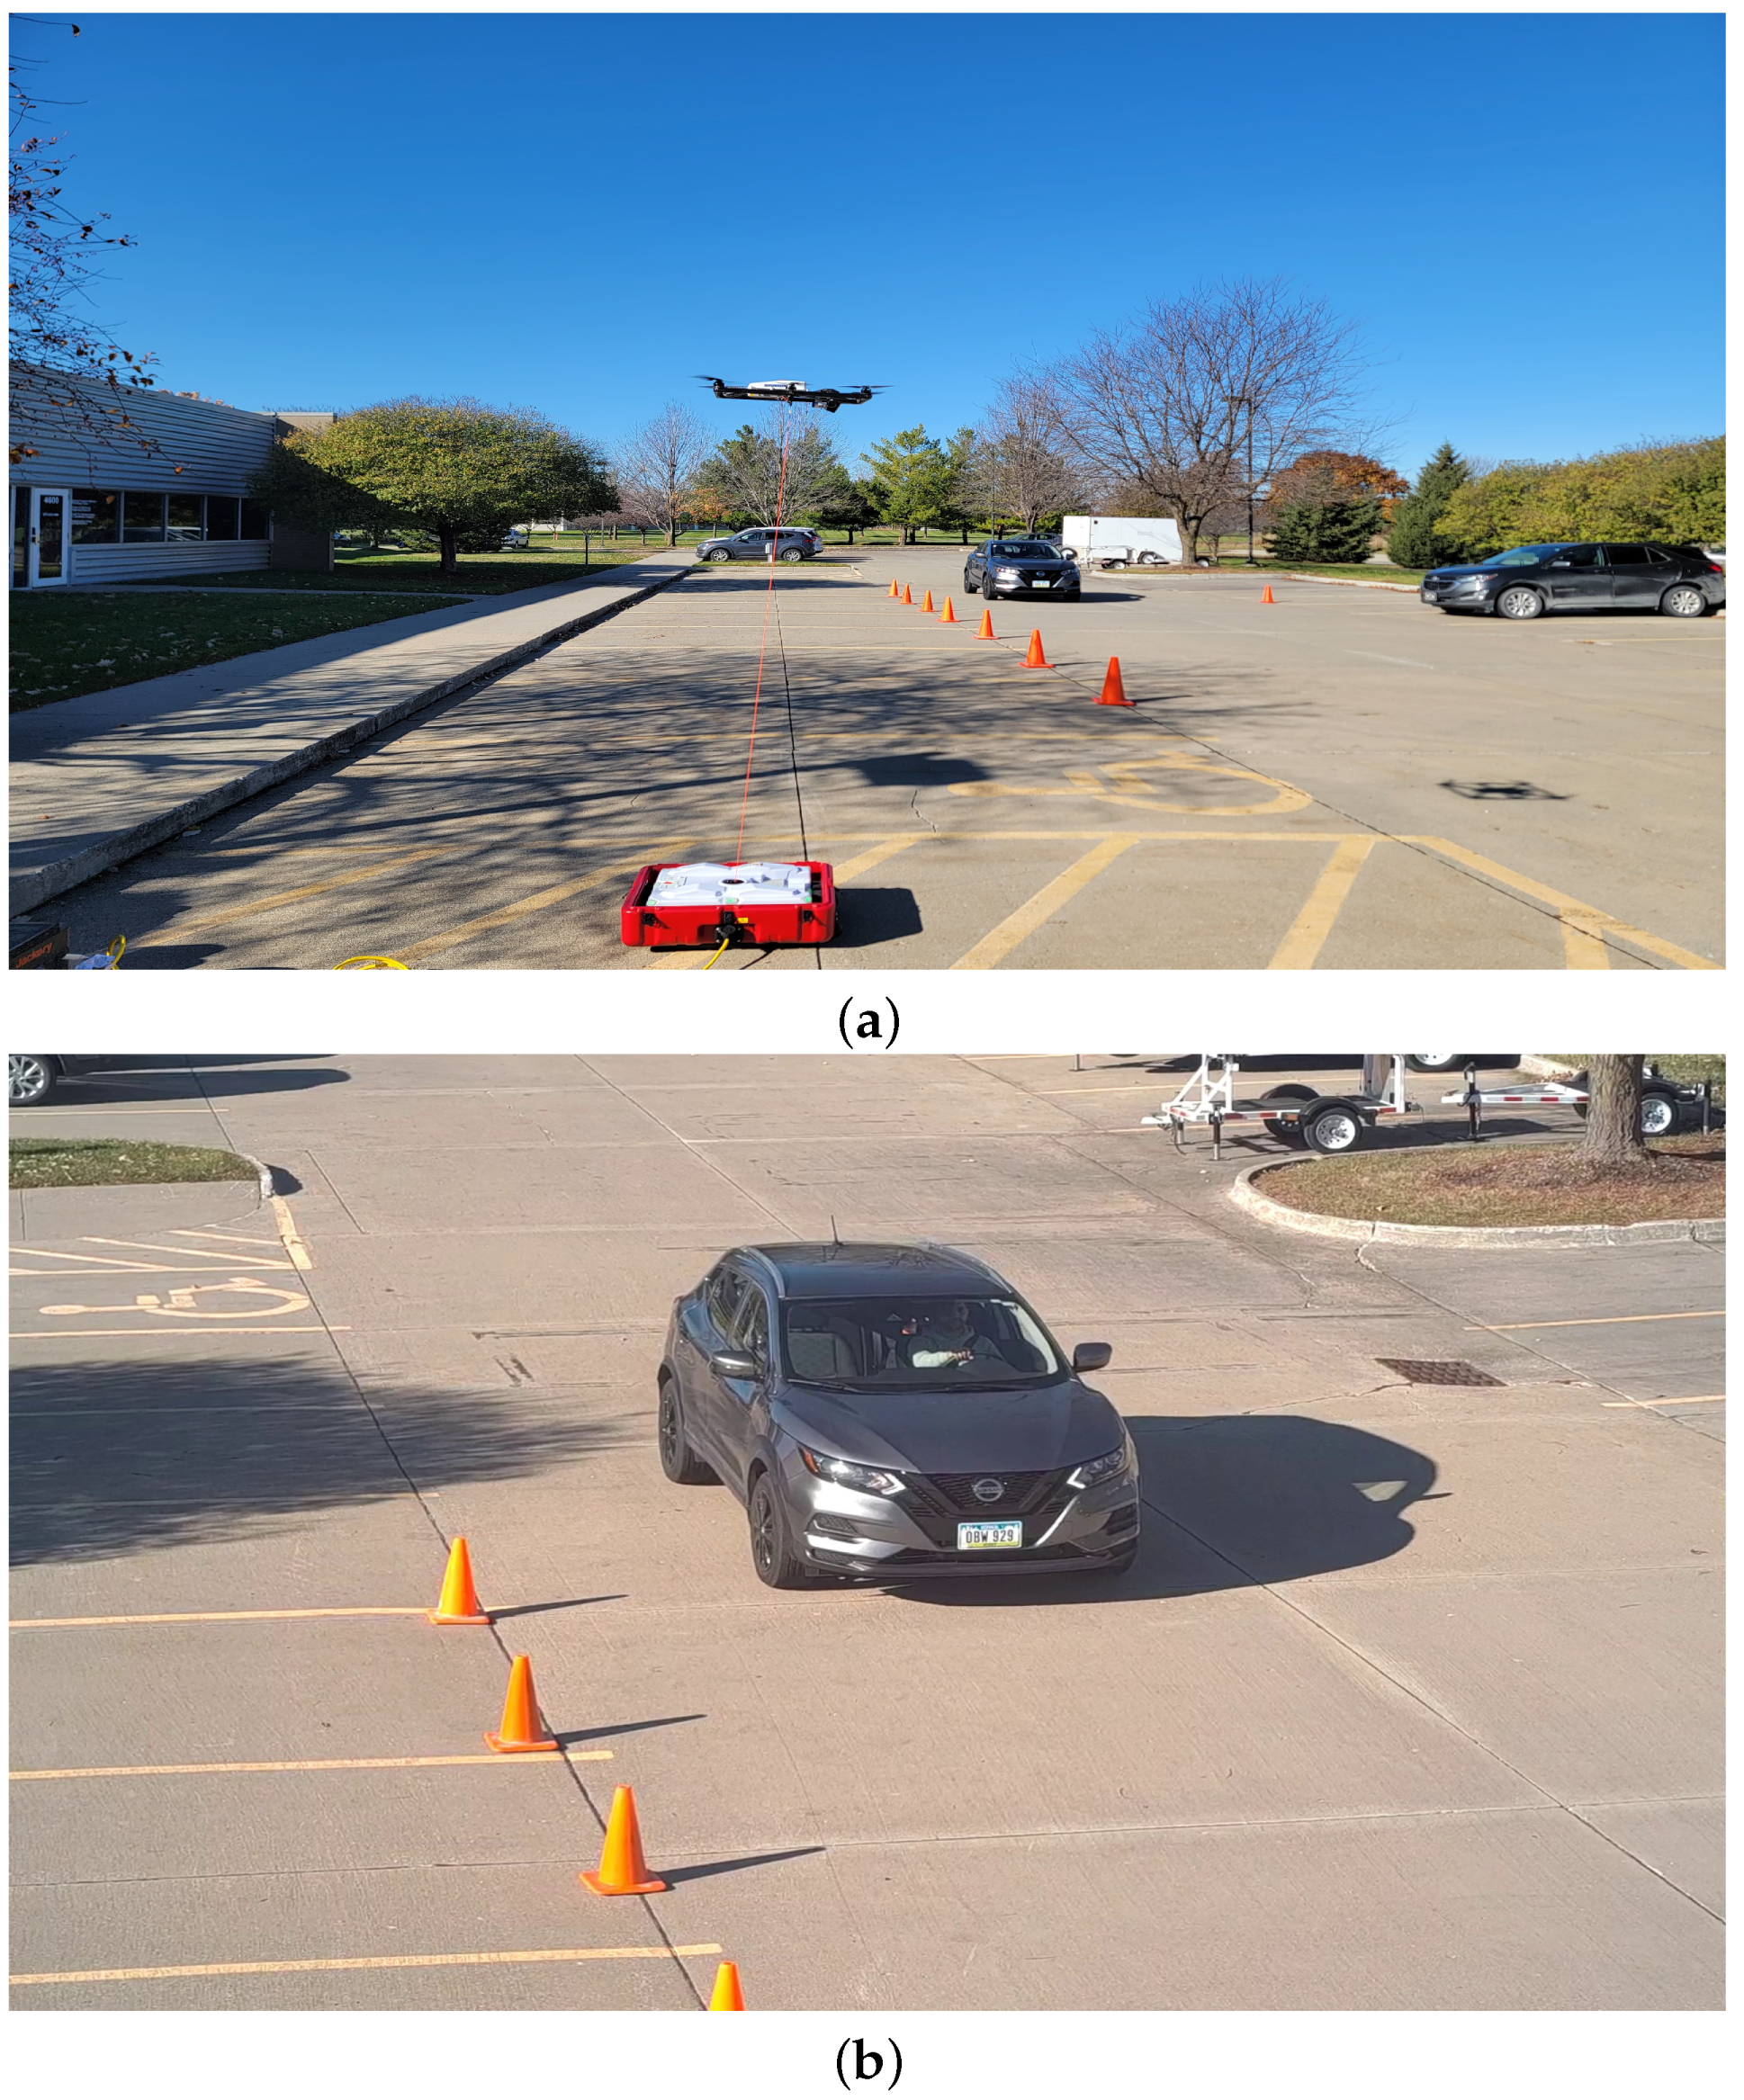
Figure 2.
(a) Precision-recall curve illustrating the model’s performance; (b) Confusion matrix showing classification accuracy between buckled and unbuckled classes.
Figure 2.
(a) Precision-recall curve illustrating the model’s performance; (b) Confusion matrix showing classification accuracy between buckled and unbuckled classes.
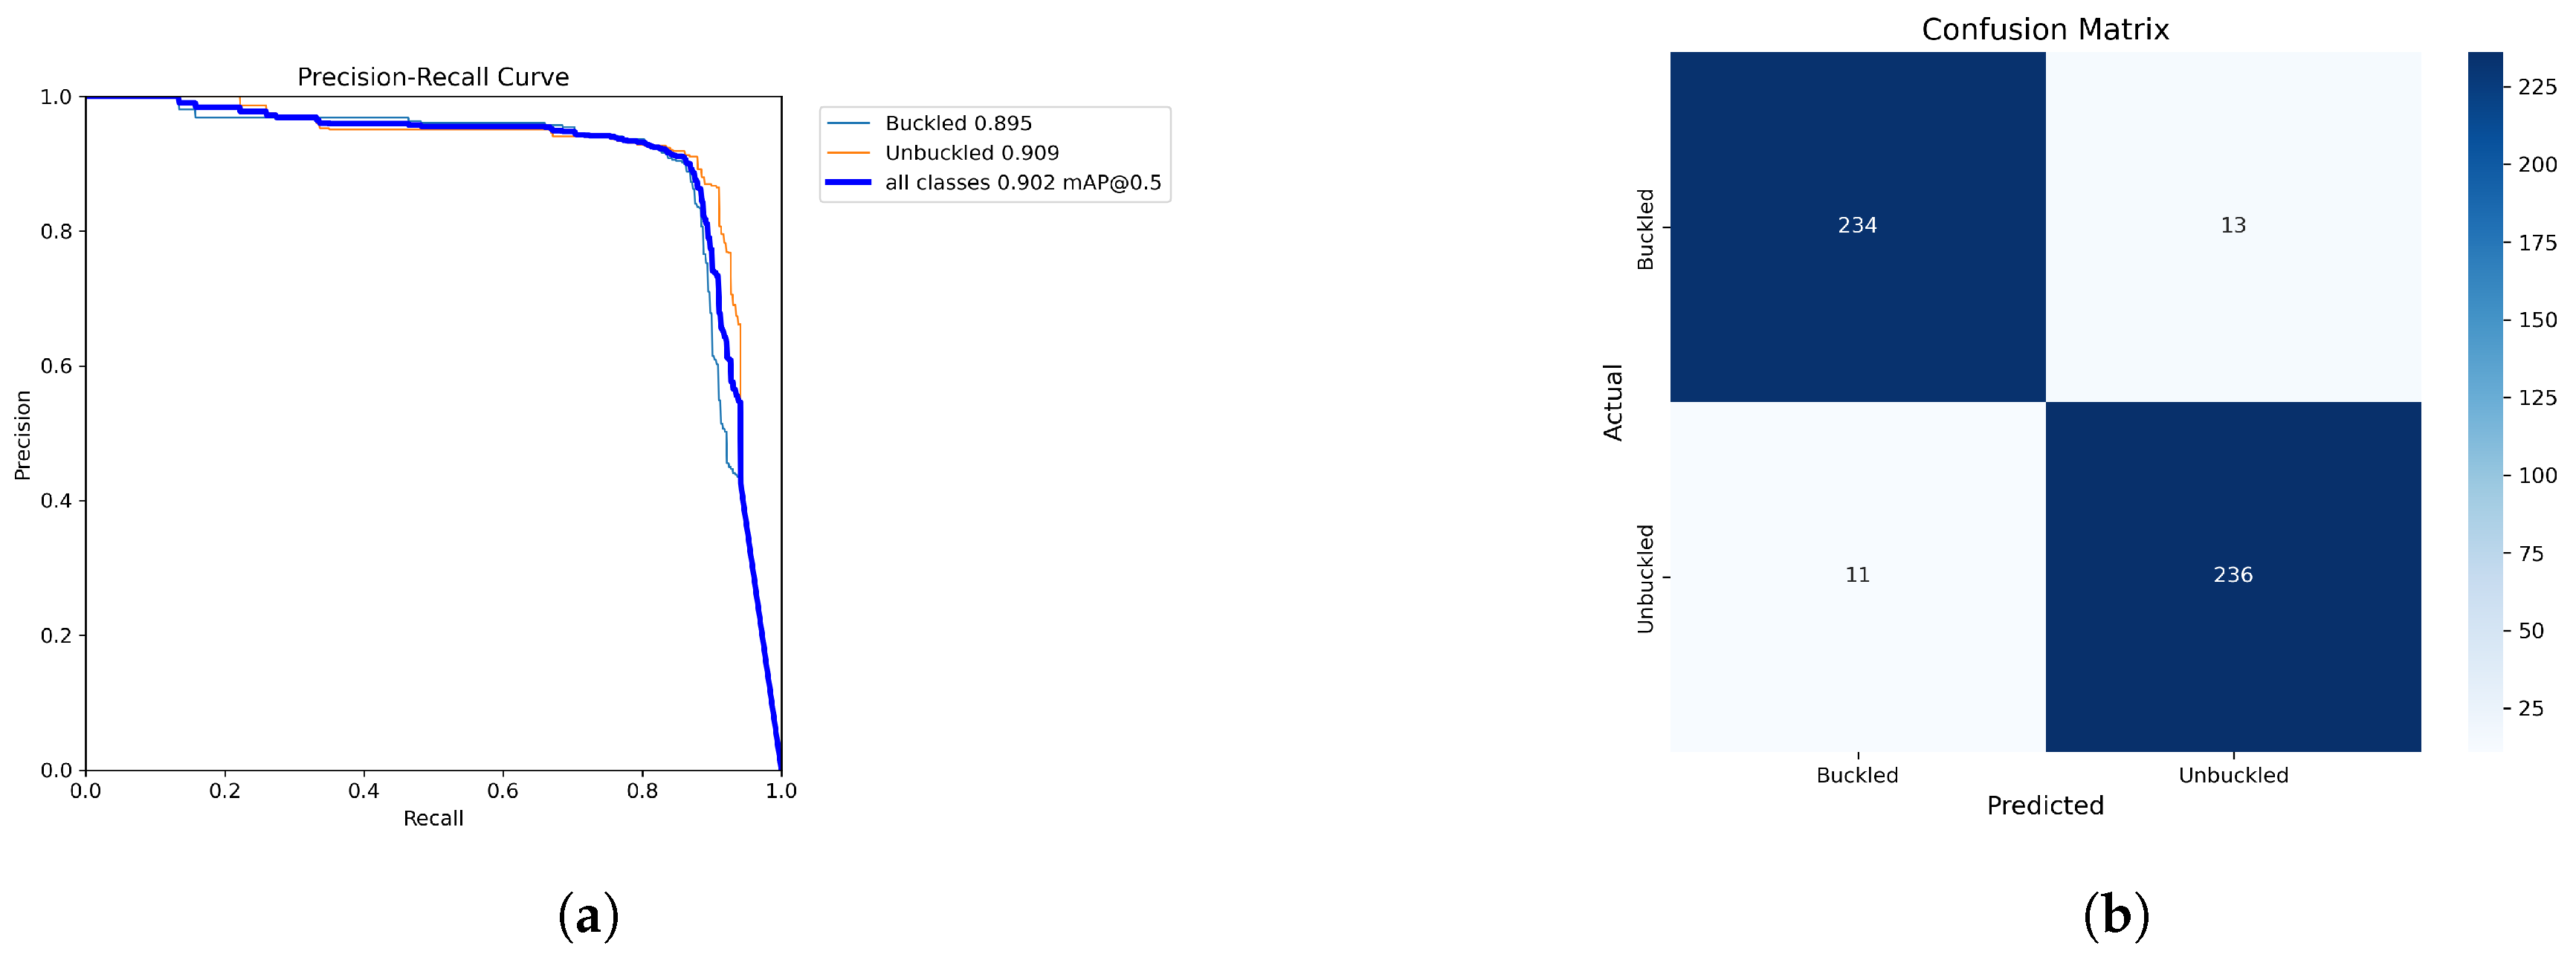
Figure 3.
Model Detection Examples: (a) Driver buckled, (b) Driver unbuckled.
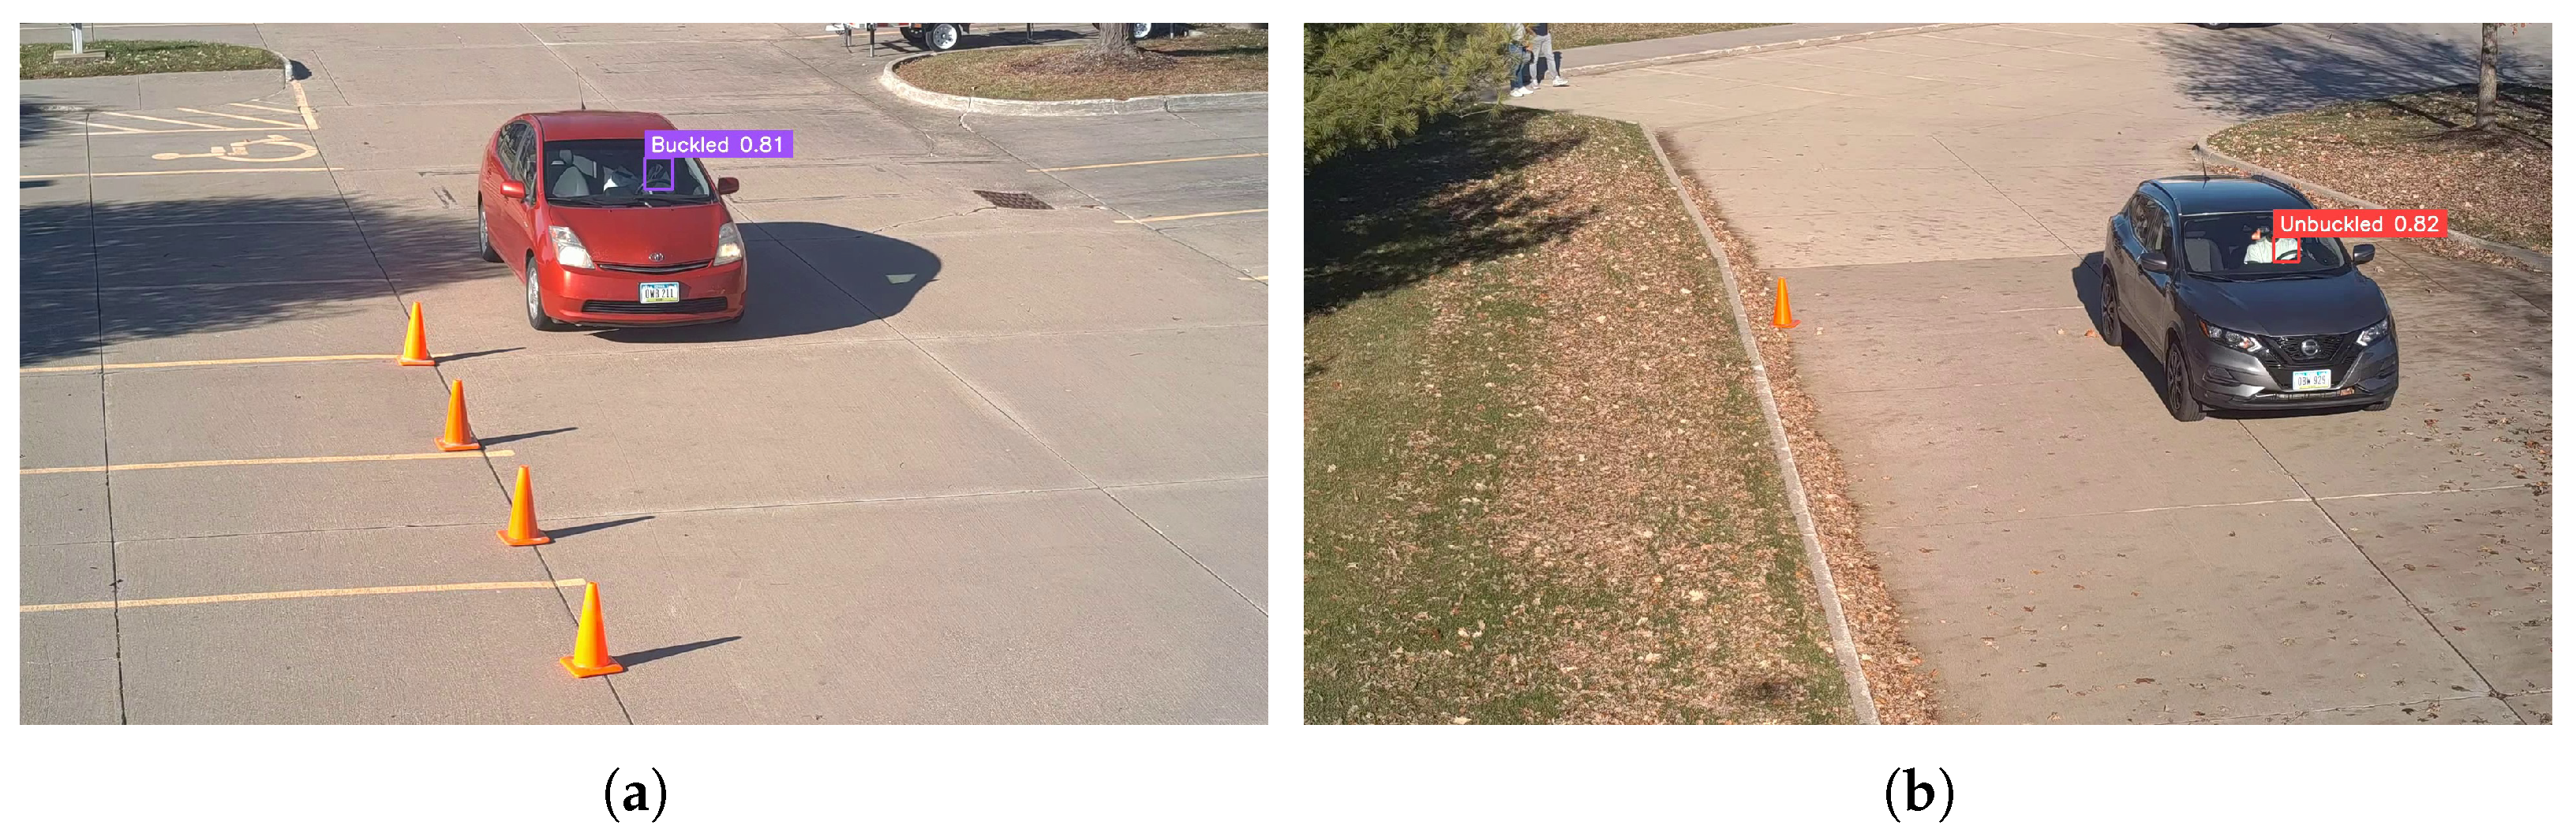
Figure 4.
Detection Example: Model confidently detecting an unbuckled driver.
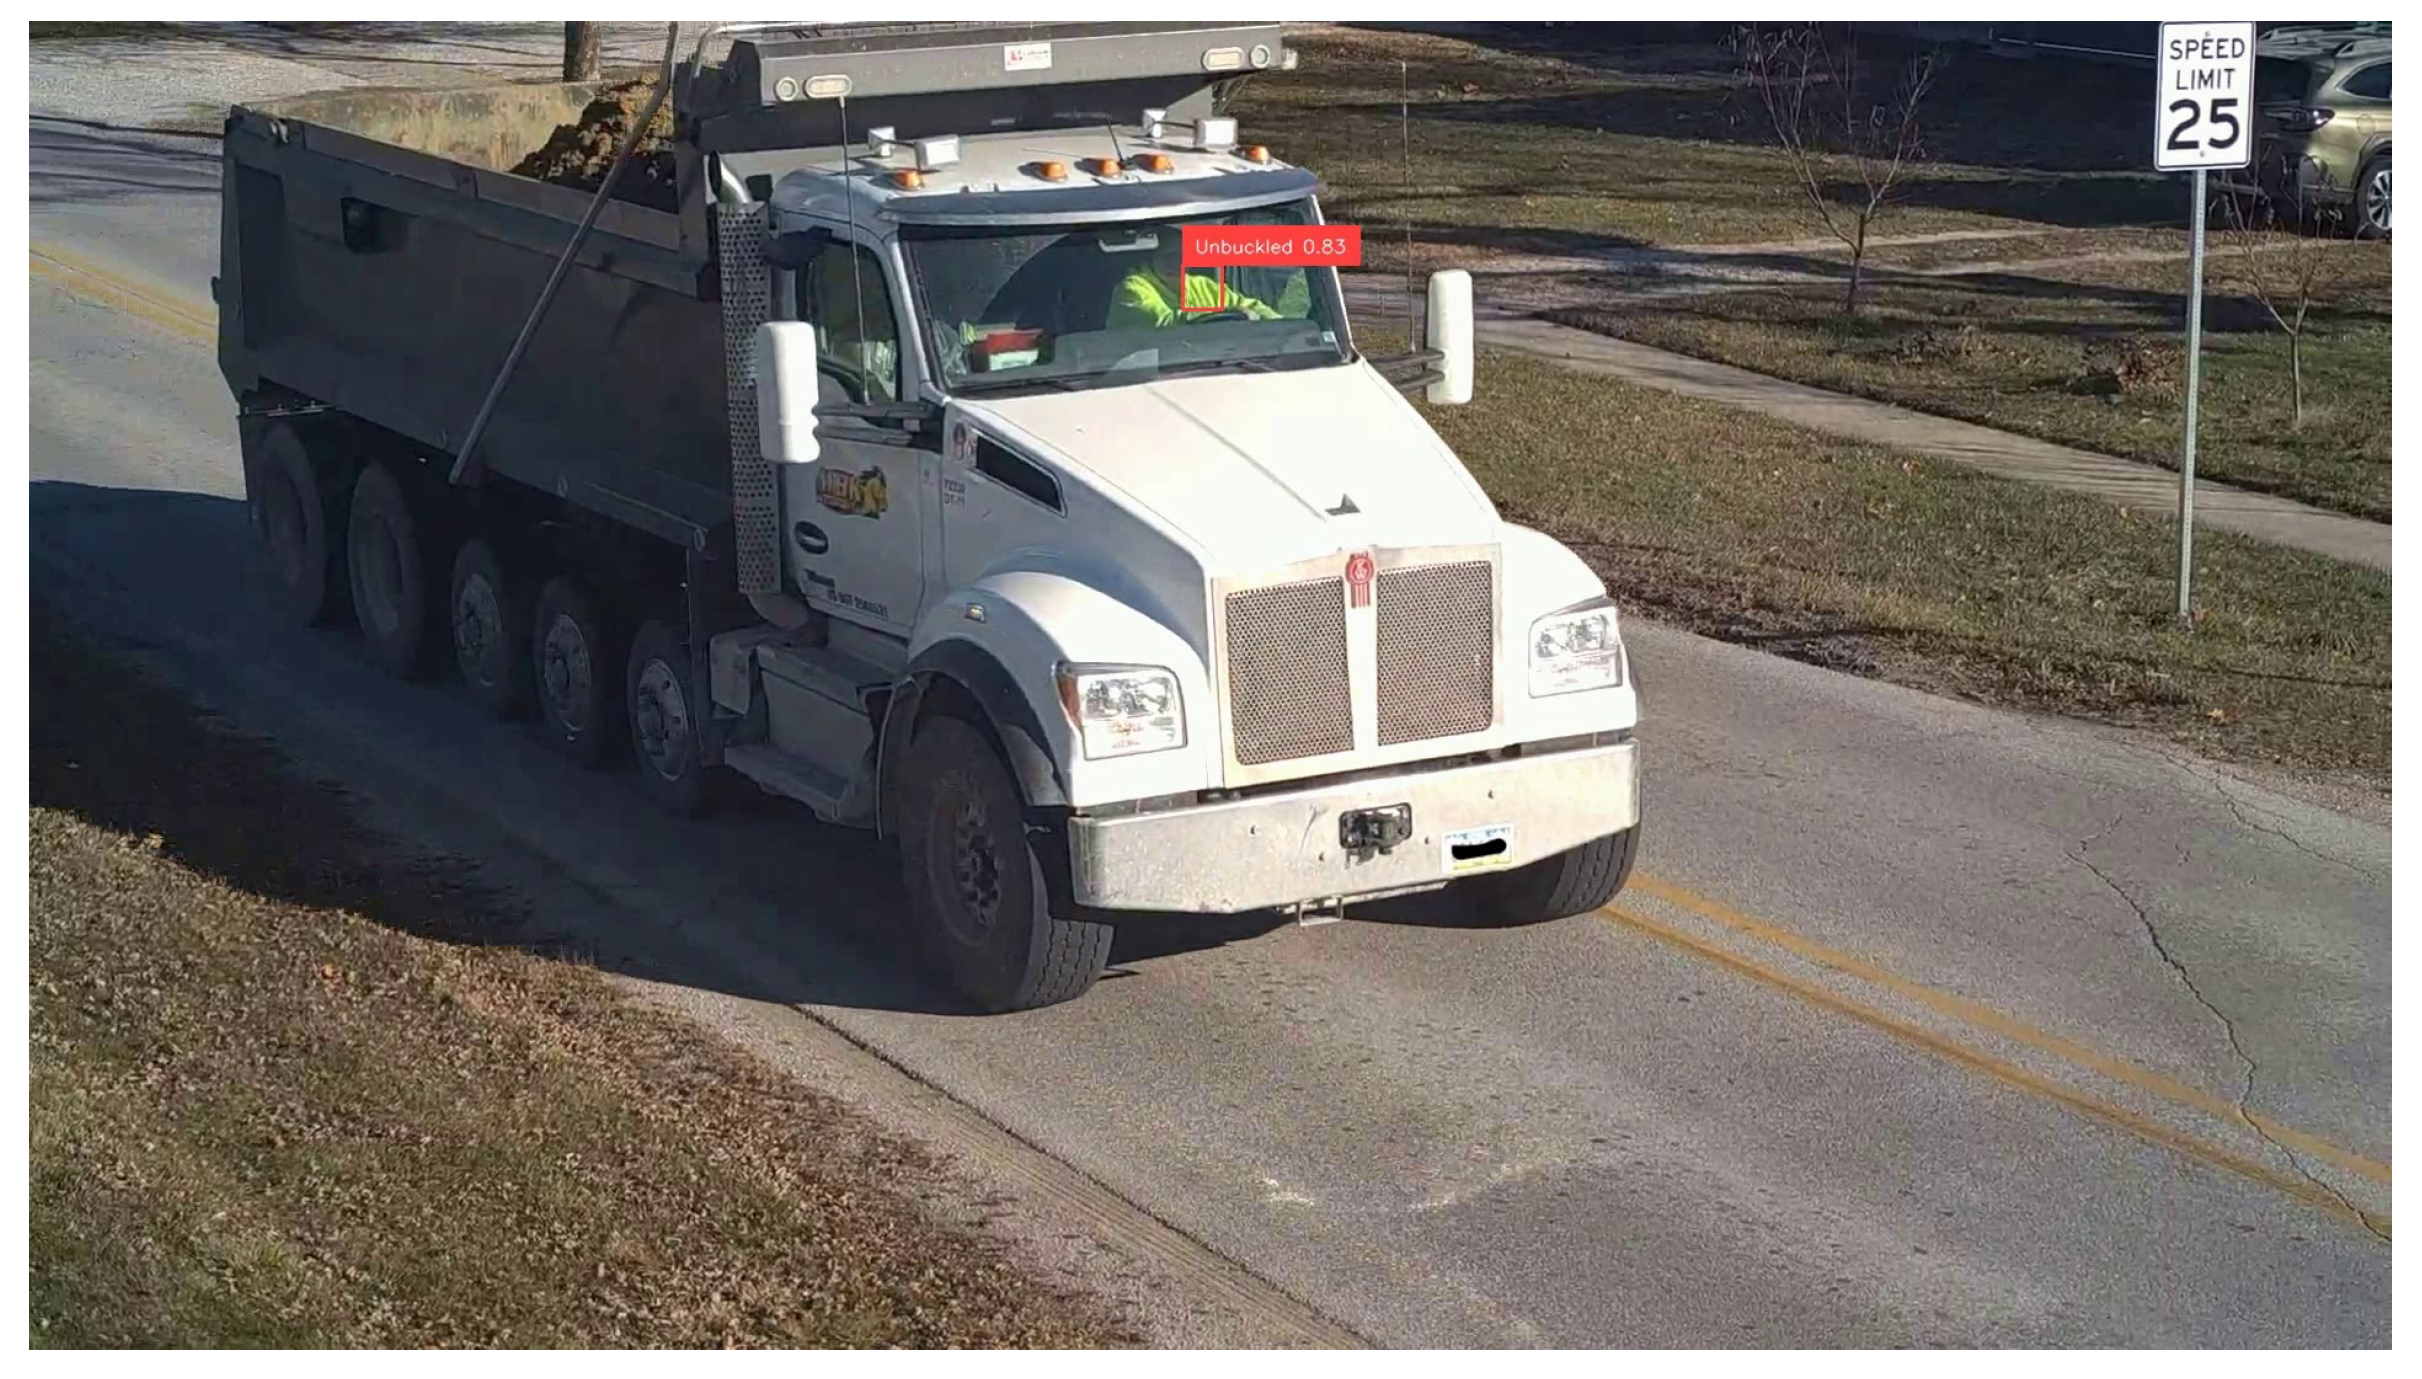
Figure 7.
Detection Example: Model confidently detecting an unbuckled driver.
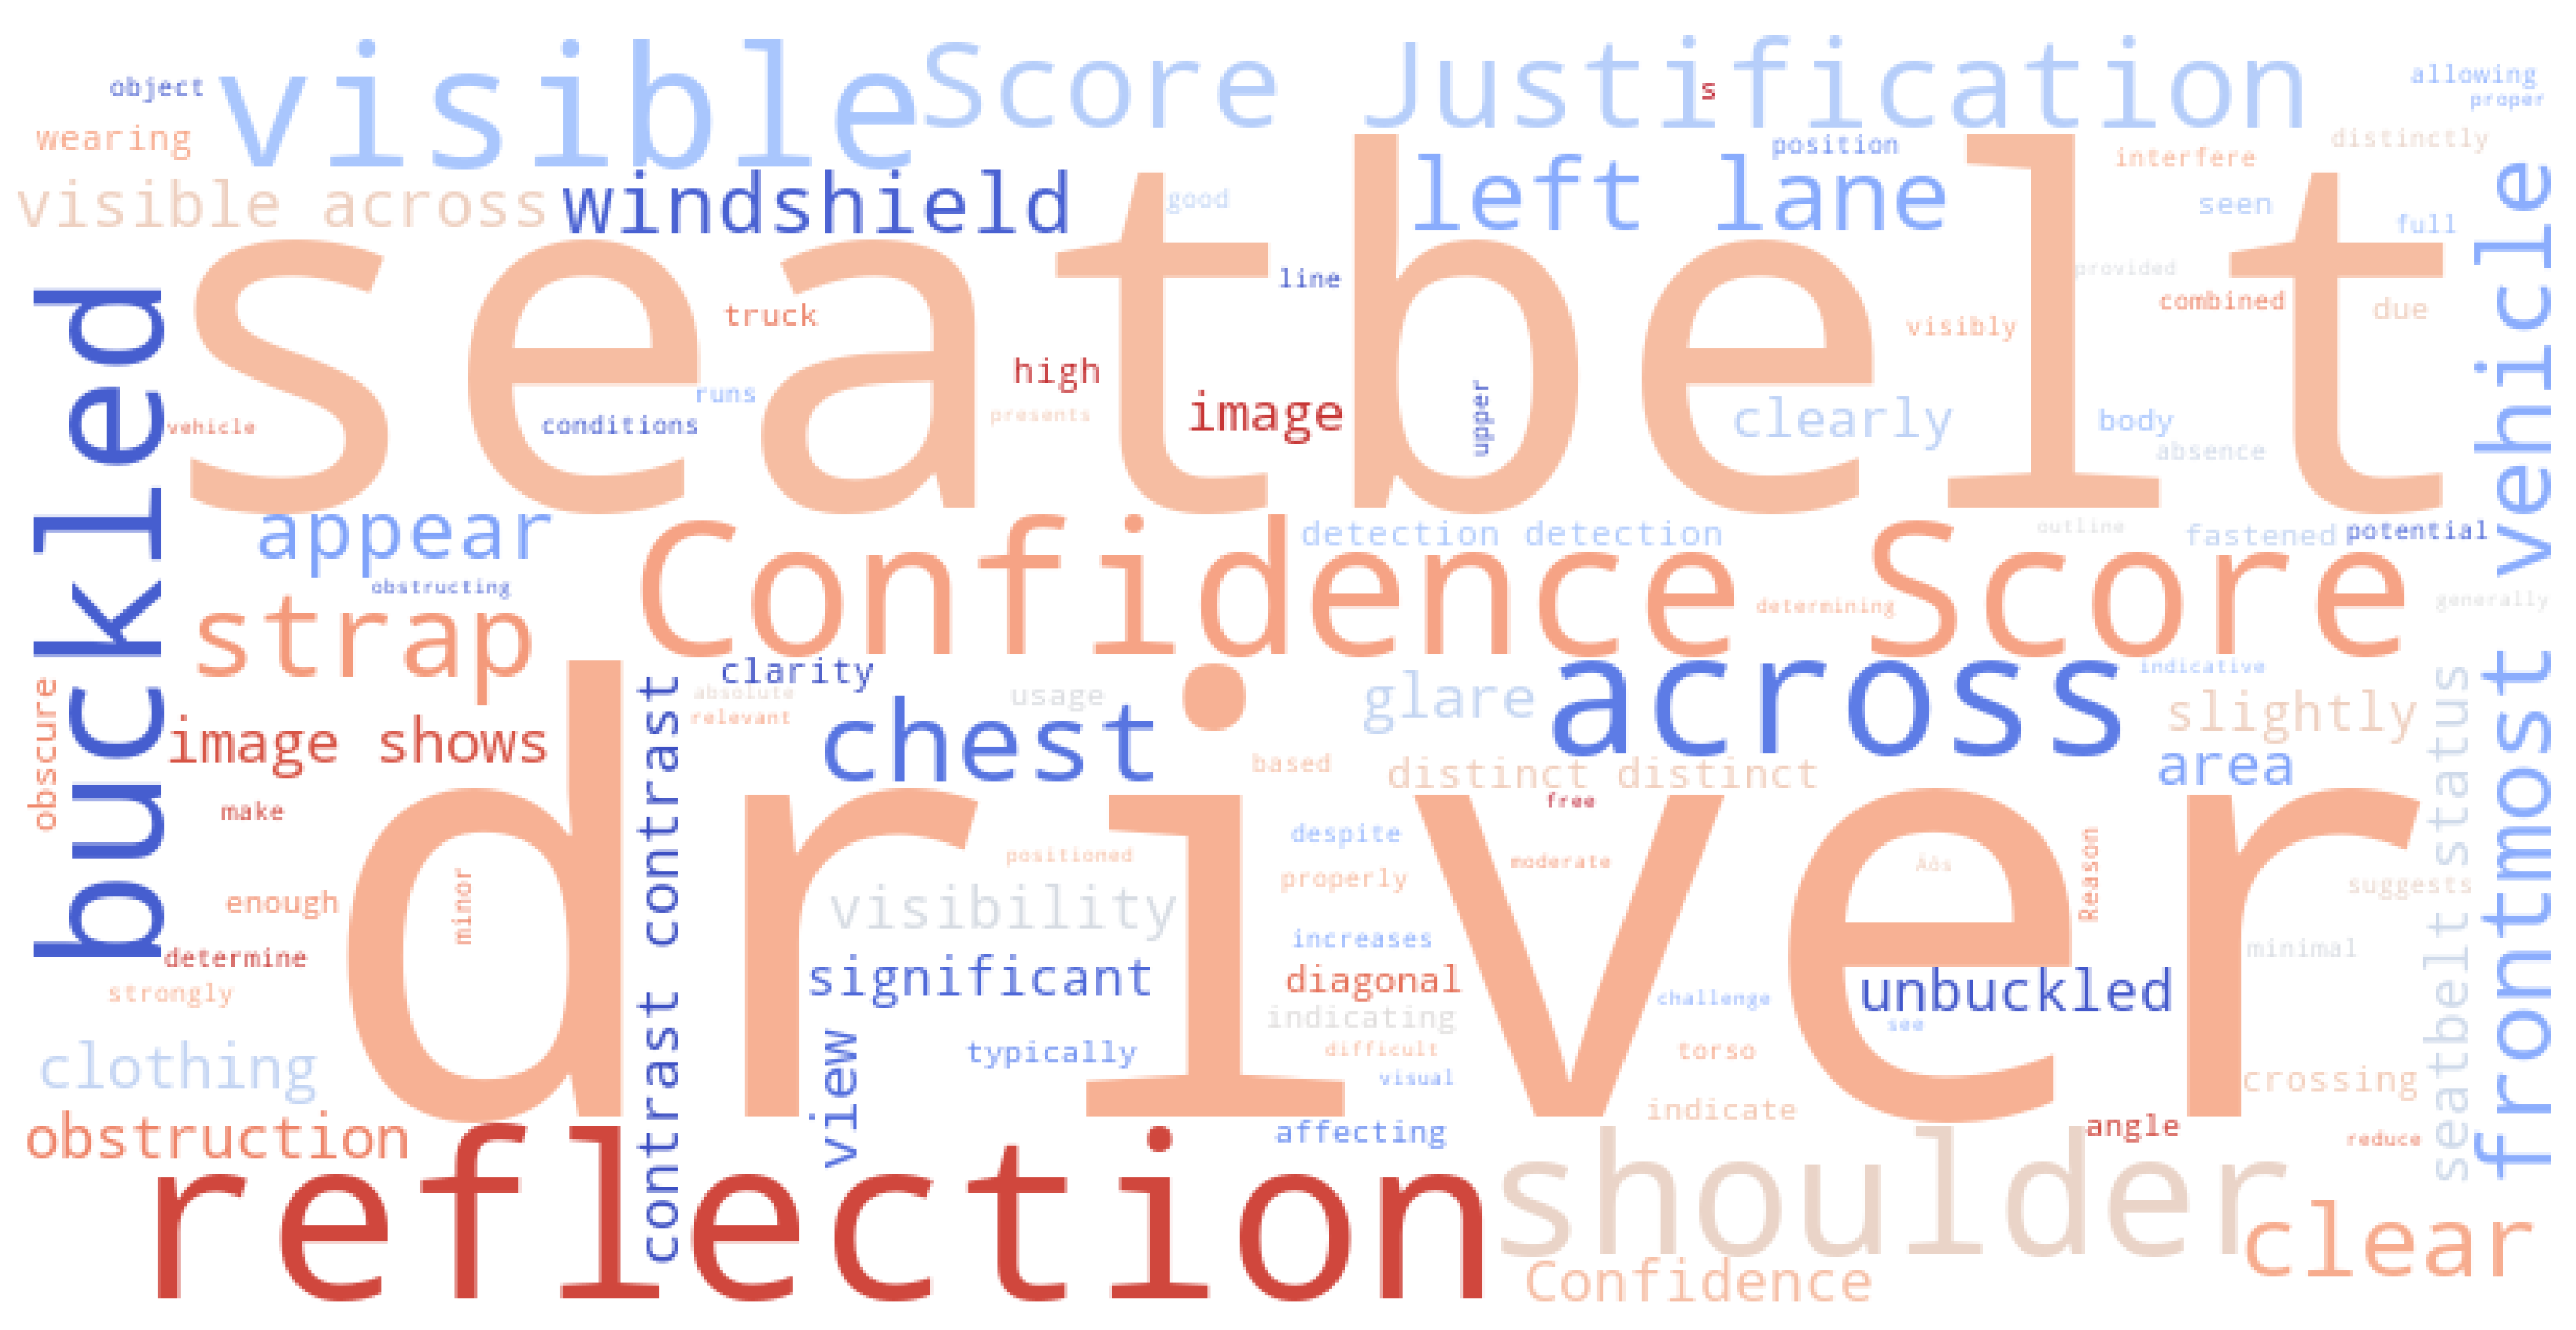

Table 1.
Study Site Name, Location Coordinates, and Weather Conditions.
| Intersection | Latitude | Longitude | Weather Conditions |
|---|---|---|---|
| 330th-Linn | 41.8780585 | 93.678716 | Mostly Sunny |
| North Dakota-Ontario | 42.034588 | -93.678842 | Cloudy |
Table 2.
Summary of Model’s Performance on Test Data.
| Class | Precision | Recall | F1-Score | Accuracy | Support |
|---|---|---|---|---|---|
| Buckled | 0.955 | 0.936 | 0.945 | 93.60 | 250 |
| Unbuckled | 0.948 | 0.944 | 0.946 | 94.40 | 250 |
| Average | 0.952 | 0.940 | 0.946 | 94.00 | 500 |
Table 3.
Model Performance Across UAV Elevations.
| UAV Elevation (Feet) | Precision | Recall | F1-Score | Accuracy (%) | Support |
|---|---|---|---|---|---|
| 15 | 0.897 | 0.915 | 0.906 | 91.50 | 200 |
| 18 | 0.930 | 0.930 | 0.930 | 93.00 | 200 |
Table 4.
Summary of Model Performance Across Evaluation Studies.
| Study | Condition | Precision | Recall | F1-Score | Accuracy (%) | Support |
|---|---|---|---|---|---|---|
| Seatbelt-Shirt Color Contrast | High Contrast | 0.995 | 0.995 | 0.995 | 99.50 | 200 |
| Low Contrast | 0.924 | 0.910 | 0.917 | 91.00 | 200 | |
| Sun Direction | Sun Behind UAV | 0.934 | 0.925 | 0.929 | 92.50 | 200 |
| UAV Facing Sun | 0.661 | 0.570 | 0.612 | 57.00 | 200 | |
| Vehicle Type | Clear Windshield | 0.940 | 0.940 | 0.940 | 94.00 | 200 |
| Tinted Windshield | 0.885 | 0.845 | 0.865 | 84.50 | 200 |
Table 5.
Impact of Confidence Threshold Configuration on Model Reliability.
| Intersection | Metric | Detections Without Threshold | Detections With Threshold |
|---|---|---|---|
| 330th-Linn | Correct Detections | 105 | 103 |
| Misclassifications | 9 | 1 | |
| Missed (Undetected) Cases | 0 | 0 | |
| Unknowns | 0 | 10 | |
| Total Instances | 114 | 114 | |
| Model Accuracy (%) | 92.11 | 90.35 | |
| North Dakota-Ontario | Correct Detections | 169 | 165 |
| Misclassifications | 7 | 0 | |
| Missed (Undetected) Cases | 6 | 6 | |
| Unknowns | 0 | 11 | |
| Total Instances | 182 | 182 | |
| Model Accuracy (%) | 92.86 | 90.66 |
Table 6.
Model and Manual Review Comparison: Detection Success at 330th-Linn
| Metric | Model | Manual Review |
|---|---|---|
| Cases Identified on Single Observation | 103 | 83 |
| Missed Cases on Single Observation | 11 | 31 |
| Cases Requiring Replays | 0 | 31 |
| Total Instances Observed | 114 | 114 |
| Accuracy on a Single Observation (%) | 90.35 | 72.81 |
1 Missed cases in the model’s single observation include undetected instances, misclassifications, and unknowns.
Table 7.
Manual vs. Model Reported Compliance Rates at 330th-Linn.
| Scenario | Method | Total | Buckled | Unbuckled | Compliance Rate (%) |
|---|---|---|---|---|---|
| Single Observation | Manual | 83 | 80 | 3 | 96.39 |
| Model (Automated) | 104 | 91 | 13 | 87.50 | |
| Replays Allowed | Manual | 114 | 98 | 16 | 85.96 |
| Model (Automated) | 104 | 91 | 13 | 87.50 |
Table 8.
Model and Manual Review Comparison: Detection Success at North Dakota-Ontario.
| Metric | Model | Manual Review |
|---|---|---|
| Cases Identified on Single Observation | 165 | 97 |
| Missed Cases on Single Observation | 17 | 85 |
| Cases Requiring Replays | 0 | 85 |
| Total Instances Observed | 182 | 182 |
| Accuracy on a Single Observation (%) | 90.66 | 53.30 |
1 Missed cases in the model’s single observation include undetected instances, misclassifications, and unknowns.
Table 9.
Manual vs. Model Reported Compliance Rates at North Dakota-Ontario.
| Scenario | Method | Total | Buckled | Unbuckled | Compliance Rate (%) |
|---|---|---|---|---|---|
| Single Observation | Manual | 97 | 96 | 1 | 98.97 |
| Model (Automated) | 165 | 164 | 1 | 99.39 | |
| Replays Allowed | Manual | 182 | 179 | 3 | 98.35 |
| Model (Automated) | 165 | 164 | 1 | 99.39 |
Table 10.
Performance Comparison of Our Model and GPT-4 V(ision) on Sampled Frames.
| Metric | Model | GPT-4V(ision) |
|---|---|---|
| Correctly Detected | 91 | 93 |
| Misclassifications | 2 | 6 |
| Missed Detections | 1 | 1 |
| Unknowns | 6 | - |
| Detection Accuracy (%) | 91.0 | 93.0 |
| Computational Workflow | Near-Instantaneous | Requires Preprocessing |
| Operational Cost ($) | 0.00 | 0.02 per frame |
| Total Samples | 100 | 100 |
Table 11.
Cost Breakdown for GPT-4V(ision) Inference Per Image.
| Token Type | Tokens | Cost per 1,000 Tokens ($) | Total Cost ($) |
|---|---|---|---|
| Input | 1105 | 0.01 | 0.01105 |
| Output | 300 | 0.03 | 0.009 |
| Total Cost per Image | 1405 | - | 0.02005 () |
Disclaimer/Publisher’s Note: The statements, opinions and data contained in all publications are solely those of the individual author(s) and contributor(s) and not of MDPI and/or the editor(s). MDPI and/or the editor(s) disclaim responsibility for any injury to people or property resulting from any ideas, methods, instructions or products referred to in the content. |
© 2025 by the authors. Licensee MDPI, Basel, Switzerland. This article is an open access article distributed under the terms and conditions of the Creative Commons Attribution (CC BY) license (http://creativecommons.org/licenses/by/4.0/).
Copyright: This open access article is published under a Creative Commons CC BY 4.0 license, which permit the free download, distribution, and reuse, provided that the author and preprint are cited in any reuse.


