
Submitted:
01 March 2025
Posted:
03 March 2025
You are already at the latest version
Abstract
This paper presents the design and analysis of a high-performance microstrip patch antenna (MPA) operating at 28 GHz, along with a multiple-input multiple-output (MIMO) configuration optimized for beyond 5G and IoT applications. The proposed MPA incorporates a rectangular patch with two symmetrical L-shaped slots and a central rectangular slot, enhancing impedance matching and radiation characteristics. Fabricated using Rogers RT5880 substrate with a dielectric constant (εr) of 2.2 and a loss tangent of 0.0009, the antenna achieves a return loss of -33.04 dB, ensuring minimal signal reflection and efficient power transfer. The simulated gain reaches 10.11 dBi, and the voltage standing wave ratio (VSWR) is measured at 1.04, indicating excellent performance. To further enhance system efficiency, a MIMO configuration is implemented, improving parameters such as return loss, isolation, and diversity gain. The MIMO system achieves gains of 10.2, 9.91, 10.2, and 9.84 dBi for individual elements, with a diversity gain of 10 dB, ensuring robust signal performance and increased data throughput. The design was fabricated and experimentally validated using a vector network analyzer (VNA), demonstrating strong agreement between simulations and measurements. These results confirm the antenna’s suitability for high-speed wireless communication in next-generation IoT networks.
Keywords:
IoT
; MIMO
; MPA
; Wireless Communications
1. Introduction
More signals are sent and received via antennas as the Internet of Things (IoT) becomes more widely used in daily life, increasing the need for wireless communication equipment [1,2]. Enhancing antenna design efficiency is therefore a crucial area of attention since antenna effectiveness is crucial in Internet of Things applications. Compact, surface-adaptable, physically durable, economical to manufacture using printed-circuit technology, and compatible with Monolithic Microwave Integrated Circuit (MMIC) designs are only a few advantages of microstrip antennas [3,4,5,6]. Additionally, they provide versatility in terms of impedance, radiation pattern, polarization, and resonant frequency. Moreover, adaptive characteristics with tunable resonant frequency, impedance, polarization, and radiation pattern are made possible by adding components such as pins and varactor diodes between the patch and the ground plane [7,8,9]. However, microstrip antennas also have drawbacks. They often suffer from low efficiency, limited power handling, and high-quality factors (Q), poor polarization purity, suboptimal scanning performance, and spurious feed radiation [10]. Their frequency bandwidth is usually narrow, sometimes only a fraction of a percent to a few percent [11,12,13,14,15]. One method involves increasing the substrate height, which can achieve efficiencies up to 90 percent (excluding surface waves) and bandwidths up to about 35 percent. However, a higher substrate height introduces surface waves, potentially degrading antenna performance by scattering at bends and surface discontinuities [8]. To address this, cavities can be used to eliminate surface waves while maintaining broad bandwidths. Additionally, techniques like stacking microstrip elements and other strategies can help expand bandwidth [16,17,18,19,20,21]. Despite their many advantages, microstrip antennas face challenges such as large electromagnetic signatures at frequencies outside the operating band, physical size limitations at Very High Frequency (VHF) and Ultra High Frequency (UHF) ranges, and trade-offs between bandwidth and scan volume in large arrays. Addressing these challenges requires ongoing innovation and refinement in antenna design and implementation [7]. So, the author in [11] proposes a model that demonstrates improved return loss and efficient performance. Operating at a frequency of 28.5 GHz (Ka-band), the patch antenna has dimensions of 7.885 mm x 8.935 mm x 0.5 mm. It achieves a return loss of -48.309 dB, a gain of 7.425 dB, a VSWR of 1.007129, and a directivity of 8.141 dBi. Additionally, it boasts an efficiency of 91.16%, a bandwidth of 1.2 GHz, and a surface current of 760.4 A/m, all of which contribute to faster 5G communication. These parameters indicate that the designed antenna is well-suited for future 5G technology applications. In addition, the work in [10] generates a prediction system for the intended antenna, a polynomial regression approach is proposed. Thorough physical prototyping and testing are no longer necessary thanks to the predictive model, which increases the speed of the design process. This study is distinct because it uses the Multivariate Polynomial technique to develop a mathematical model for each of the three parameters: VSWR, bandwidth, and return loss. To create mathematical models of the antenna parameters, an MPR was also used. The analysis of the anticipated results reveals that the MPR model obtained an RMSE of 0.0, 0.0, and 0.25 and an R2 score of 0.9999, 0.9968, and 0.9985, respectively. Analysis of variance (ANOVA) was used in the study to look at how various independent factors affect responses and model confirmation. The author in [12] introduced a dual-band circular microstrip patch antenna with an elliptical slot, to use it in upcoming 5G mobile communication networks. The antenna provides bandwidths of 1.3 and 1 GHz, respectively, and resonates at 28 and 45 GHz. The antenna has a maximum gain of 7.6 dB, a return loss of -40 dB, and an efficiency of 85.6% at 28 GHz. It achieves a maximum gain of 7.21 dB, a return loss of -14 dB, and an efficiency of 95.3% at 45 GHz. The antenna is constructed on a Rogers RT5880 (lossy) substrate with a loss tangent (tan δ) of 0.0013 and a dielectric constant of 2.2Measuring only 6 x 6 x 0.578 mm³, which is small. For mobile communication, an array arrangement is used to produce a gain of 12 dB. The suggested array has a maximum gain of 13.5 dB and a radiation efficiency of 98.75%. It resonates at 28 GHz, 34 GHz, and 45 GHz. An approach called center series-fed is used to excite the array. The array antenna’s Specific Absorption Rate (SAR) values are 1.19 W/kg at 28 GHz, 1.16 W/kg at 34 GHz, and 1.2 W/kg at 45 GHz. Using CST Microwave Studio, a 3D simulation program, the antenna design and parameter calculations, including SAR analysis, were carried out. The construction of a small, directional, single-element slotted microstrip antenna operating at 28 GHz for 5G applications is another objective of ref [13]. The suggested antenna is modeled on a FR4 substrate with a dielectric constant of 4.4, a thickness of 0.8 mm, and a loss tangent of 0.02 using the High-Frequency Structure Simulator (HFSS) program. Particular slots are added to the patch to comply with the design specifications, and the radiation pattern, gain, VSWR, and return loss of the antenna are assessed. Subsequently, reported findings are contrasted with these performance criteria.
Additionally, in [14], the author presents a dual-band Planar Inverted-F Antenna (PIFA) designed for 5G applications. This antenna utilizes an inexpensive substrate and offers significant bandwidth and a compact form factor in the 28 GHz and 38 GHz bands. The antenna features a modified U-shaped slot and a shorted patch, achieving bandwidths of 3.34 GHz and 1.395 GHz, with gains of 3.75 dBi and 5.06 dBi at 28 GHz and 38 GHz, respectively. The antenna is very compact, measuring just 1.3 mm by 1.2 mm, with a metallic cylindrical short on one end. It is printed on the top side of the substrate, with millimeter-wave measurements enabled by a Coplanar Waveguide (CPW) line and feeding from the bottom side. The design uses Isola FR406, a cost-effective substrate. In [15], the author proposes a MIMO dielectric resonator antenna with enhanced isolation for future 5G millimeter-wave applications, leveraging the advantages of MIMO technology. The design features two rectangular dielectric resonators (DRs) placed on a substrate, with slots beneath the DRs fed by rectangular microstrip lines. A metal strip is added to the upper surface of each DR to improve isolation between the antenna elements by diverting the strongest coupling field away from the exciting slot. The proposed antenna achieves a simulated impedance bandwidth (s₁₁ ≤ –10 dB) from 27.25 to 28.59 GHz, covering the 28 GHz band (27.5–28.35 GHz) designated for 5G by the FCC. Isolation between the antenna elements improves by up to 12 dB over this band. The letter details the design process and isolation enhancement technique, with a prototype produced and measured to validate the decoupling approach.
Further, in [16], the study explores impedance matching enhancements for a 1 × 4 rectangular microstrip antenna array aimed at 5G applications in the Ka-band. The study compares the effectiveness of various impedance matching methods, including the quarter-wave transformer, open or short-circuited transmission line stubs, and smooth forms shaped to fit the low corners of each antenna. The results demonstrate an impressive input reflection coefficient of -75 dB at 28 GHz and a bandwidth of 8.3%. The antenna array also exhibits a significant gain of 13 dB in the E-plane. The planar structure of this antenna array makes it a low-profile, simple, and easy-to-construct solution suitable for 5G applications in the Ka-band.
The work in [17], the authors propose a novel combined beam antenna for 5G communications operating at the 28 GHz frequency range, designed to produce slanted radiation on the elevation plane. Instead of using a traditional array approach for beam scanning, the design uses two distinct radiating components to create a moderately broad beam with high gain in a tilted target direction. The primary radiators consist of a waveguide aperture and a set of microstrip patches. The microstrip patches generate two strong split beams in the azimuth plane, while the waveguide aperture enhances the antenna gain in the elevation plane. The design achieves a broad beam spread in the azimuthal plane with a reasonably high gain by optimizing the constructive interference between the patches and the aperture. Experimental results closely match the models, validating the efficiency of the proposed approach.
Finally, in [18], the author suggests a novel multiband antenna array design with high gain for portable 5G communication devices, covering frequencies of 700 MHz, 3.5 GHz, and 28/38 GHz. The design integrates mm-wave and sub-6 GHz antenna arrays, with an S-shaped strip etched on the upper side for operation at 700 MHz A meander line coupled to an inverted C strip on the bottom side produces the 3.5 GHz band. To ensure that all four antennas get in-phase feeding power, the antenna array for the mm-wave frequencies is composed of four quadrupole components supplied by a 1:4 microstrip power divider. According to the results, the suggested antenna array may reach gains of 10.5 dBi in the mm-wave range and 4.6 dBi at the sub-6 GHz band. The suggested handset antenna is a good fit for 5G multiband applications because of its small size and straightforward construction. Based on the summary of previous simulation results, it’s evident that the research aimed to enhance functionality by concentrating on one or two specific performance metrics.
This paper introduces a new MPA and 4×4 MIMO configuration design using CST simulation. Additionally, the design was fabricated and tested using a vector network analyzer. The proposed MPA is designed to operate at a frequency of 28 GHz. It is based on a rectangular-shaped patch with two L-shaped slots which are symmetric and a single rectangle slot between them. It is built on a Rogers RT5880 substrate, which is 21 mm long, 18 mm wide, and 0.508 mm thick, with ε_r of 2.2 and tan(δ) of 0.0009. An inset feed (IF) achieves optimal impedance matching between the feed line and the patch. The patch dimensions are 9.63 × 12.4 mm², and it is fed by a 50Ω microstrip line that is 1.29 mm wide and 10 mm long. Furthermore, a 4x4 MIMO design is proposed to provide the needs of beyond 5G communication. The parameters validation is measured using VNA. Consequently, the results show that the simulated and measured parameters confirm the high performance of the proposed MPA.
2. Method and Experiment
This section introduces the proposed MPA and 4×4 MIMO configuration and design theory.
2.1. Design of the Proposed Single Antenna
This section outlines the design process leading to the proposed antenna. Initially, a traditional rectangular MPA was designed, as illustrated in Figure 1a, with the corresponding S₁₁ parameter shown by the solid black line in Figure 2. However, a significant frequency deviation was observed, with the return loss reaching its minimum at 29.5 GHz. Next, an IF was introduced, as shown in Figure 1b, to improve isolation and achieve impedance matching between the feed line and the radiating patch. The S₁₁ parameter for this design is depicted by the solid red line in Figure 2, with a minimum value of 26.07 GHz. To further enhance the resonant frequency and return loss, albeit at the cost of bandwidth, a rectangular slot was added along with the IF, as seen in Figure 1c. The resulting return loss, represented by the solid blue line in Figure 2, showed a minimum value of 31.9 GHz. To improve the resonance frequency further, an IF with an L-slot was added, as shown in Figure 1d. The return loss for this design, indicated by the solid green line in Figure 2, showed the resonance moving closer to the desired frequency, though multiple resonances appeared. Finally, the proposed design was achieved by incorporating an IF, a rectangular slot, and an L-slot, as shown in Figure 3. This design achieved a resonance frequency of 28 GHz. The dimensions were fine-tuned through several iterations to arrive at the final proposed MPA design, detailed as follows:
The initial determination of design parameters is as follows:
First, calculate the radiating patch’s dimensions. The width () of the radiating element is found using [8]:
where is the relative permittivity of the Rogers RT5880 dielectric substrate and is the speed of light. To get the value of the radiating patch length, the effective permittivity) is first calculated, and then the excess length of the radiating element is computed as [7]:
where denotes the substrate material thickness. After that, can be calculated as:
The real length () is then computed as follows [9]:
Once the initial dimensions of the radiating patch are determined, the following equations are used to calculate the width () and length () of the dielectric substrate material [9].
Finally, the feed line length () and width () are attained from
The IF technique is utilized to properly match the impedances of the microstrip line with the rectangular patch element. The IF gap () can be then determined as the following:
where is the operating frequency.
The suggested MPA is built on a rectangular Rogers RT5880 substrate. Let , , and denote the length, width, and thickness of MPA that are of 21, 18 mm, and 0.508 mm for thickness, respectively. The substrate’s tan is 0.0009 and its is 2.2. To get the best impedance matching between the feed line and the patch, an IF approach was used. A 50 microstrip line, 1.29 mm wide and 10 mm long, supplies power to the 9.63 × 12.4 mm² patch. As seen in Figure 3b, Table 1 displays the proposed antenna’s dimensions. A parametric study using the sweep feature in the CST Studio Suite simulator yielded these values, which varied from to MT. Additionally, Figure 3a shows the recommended MPA’s practical implementation using a SMA connection.
2.2. Design of the Proposed 4×4 MIMO Configuration
The design of a 4x4 MIMO system running at 28 GHz is shown in this section. Following careful design and production, measurements of the radiation pattern and return loss of the single antenna element were made to ensure the device operated as intended. Figure 4 depicts the development of the 4x4 MIMO system, with Figure 4a displaying the front view and Figure 4b displaying the rear view. Controlling the interaction of closely spaced radiators is known to depend on the components’ spacing and mutual coupling reduction strategies. This is frequently examined by looking at the scattering characteristics, including isolation (s₁₂) and return loss (s₁₁), between any two ports of a MIMO system. These parameters are further translated into various performance metrics, which will be discussed in a subsequent section. Furthermore, MIMO diversity parameters such as the envelope correlation coefficient (ECC), total active reflection coefficient (TARC), channel capacity loss (CCL), diversity gain (DG), and mean effective gain (MEG) are important for MIMO antenna performance and efficiency. These parameters affect the overall performance, reliability, and efficiency of MIMO systems. Optimizing these qualities enables faster data rates, higher signal quality, increased system capacity, and more efficient use of wireless resources, which are essential for advanced wireless communication applications. During the design process, particular attention was given to balancing these parameters to achieve optimal diversity gain and to create the best possible MIMO system design. The final practical implementation is depicted in Figure 5.
To evaluate the performance of MIMO antennas, several key metrics are used, which provide insights into the efficiency and suitability of the antennas for various applications. Here are some of the critical performance metrics.
2.2.1. Envelope Correlation Coefficient (ECC)
ECC plays a crucial role in diversity analysis because isolation parameters such as s₁₂ and s₂₁ alone do not provide a comprehensive picture of antenna mutual coupling. ECC incorporates all return loss and isolation parameters across various ports to offer a more complete evaluation. The International Telecommunication Union (ITU) recommends that the ECC value should be ≤ 0.5 for mobile communication systems. A lower ECC indicates minimal interaction between radiating elements, whereas a higher ECC suggests potential performance degradation. The ECC can be calculated using the following expression [5]:
For higher frequency applications such as 5G, the Envelope Correlation Coefficient (ECC) can be derived from the far-field parameters of the radiating elements. Let and denote the field patterns of two radiating elements concerning the θ and ϕ components. The ECC can then be expressed as [12]:
The ECC should be equal to zero in the ideal scenario. Nonetheless, an acceptable ECC value in real-world situations is usually less than 0.5. Two antennas’ independent radiation patterns are measured by the ECC. For instance, it would correspond to zero if one antenna was completely vertically polarized and the other was wholly horizontally polarized. Similarly, their ECC would be 0 if one antenna just directed energy upward and the other only downward. As a result, the ECC takes into consideration the relative phases of the fields between the two antennas as well as the polarizations and emission pattern forms. Importantly, antenna isolation can effectively determine the Envelope Correlation Coefficient (ECC) for highly efficient antennas (over 90% or below -1 dB). This implies that measuring S₁₂ alone can provide insight into the ECC without requiring radiation pattern analysis. This occurs because antennas with strong coupling (or low isolation) tend to produce similar or highly correlated radiation patterns. According to the principle of reciprocity, antennas maintain their characteristics during both transmission and reception; thus, when antenna 1 emits a specific radiation pattern, antenna 2 will detect it and receive energy based on the correlation of their radiation patterns. This straightforward concept allows designers to concentrate on improving the ECC by enhancing isolation, thereby saving time and effort. The formula for ECC about is outlined below [6]:
Eq. (13) demonstrates that all that is needed to determine the Envelope Correlation Coefficient is a Vector Network Analyzer (VNA) and a 2-port S-parameter measurement. The author believes that improving ECC is a waste of effort if you are creating a MIMO system. If you optimize for isolation (), you’ll achieve similar results with far less complicated measurements. But you should understand what ECC is because it seems like a big deal and is sometimes overemphasized in MIMO systems.
2.2.2. Diversity Gain (DG)
The improvement in signal quality and dependability that comes from using multiple antennas or signal routes in a communication system is known as diversity gain. It measures the rise in received signal strength or fall in mistake probability brought about by the increased spatial diversity these many antennas give. This gain is particularly crucial in situations when communication performance might be harmed by multipath propagation, interference, or signal fading. The technology may effectively lessen the negative effects of fading and improve overall performance by combining signals from many antennas. Diversity gain is a measurement that is commonly expressed in decibels (dB) and is determined by utilizing diversity approaches to increase the signal-to-noise ratio (SNR). Better performance is indicated by a larger diversity gain, which results in faster data rates, increased system capacity, and improved dependability. Transmission power losses with a MIMO antenna system can be investigated by analyzing DG. In a MIMO system, the diversity gains may be measured by contrasting the performance measures (BER, SNR, etc.) with and without diversity. The diversity advantage for a 4×4 MIMO system is represented by [6]:
where and represent the error probabilities without and with diversity, respectively. Although a DG of 10 dB is the optimum value, in reality, due to various losses, a close value of 10 dB is acceptable. The recommended antenna’s simulated gain (DG) between adjacent antenna elements is more than 9.999 dB. This implies that the implementation of diversity methods may prove beneficial for the suggested antenna [6]. A possible format for the DG is:
2.2.3. Total Active Reflection Coefficient (TARC)
TARC is a key metric for assessing the performance of antenna systems, especially in MIMO configurations. It quantifies the overall reflection characteristics of the system while accounting for the interactions between multiple antennas. TARC evaluates the reflected signals from each port and their impact on overall performance, offering insights into power transmission efficiency and the level of mutual coupling among antennas. A lower TARC value signifies improved matching and enhanced diversity performance, which are crucial for increasing communication reliability in complex environments. Similarly, random signals and their phase angles at diagonal and adjacent ports are utilized by TARC to assess the s-parameters for evaluating diversity performance. The source of TARC is:
where and are the scattering and excitation vectors, respectively. For adjacent/diagonal radiating ports, TARC can be written as [9]:
The phase angle between adjacent/diagonal ports is represented by . At various ports, different values of are used. Then, δ will be , , and so forth [8].
2.2.4. Mean Effective Gain (MEG)
Furthermore, MEG offers gain information for NLOS channel circumstances. MEG is assessed for far-field characterization within an anechoic chamber. It encompasses the power patterns and efficiency of the MIMO antenna. Let XPR (also referred to as cross-polarization discrimination, or XPD) denote the cross-polarization ratio of the incident field. For the θ and φ components, the probability distribution functions (pdf) of the incident waves are represented as and , respectively, where signifies the solid angle. and denote the power gains of the 2 × 2 MIMO antenna elements. The MEG equation in the 2-D plane is given by [9]:
Another key metric in diversity power analysis related to MEG, which is calculated as a function of return loss to facilitate the calculation of it. It can be calculated as:
where is the number of antennas and is the active antenna in Eq. (20). By extending formula (21), the following equations [8] were used to calculate the value of MEG for each element:
A 100% efficient MEG is provided by −3 dB. For MIMO, the best diversity performance is achieved when each element has an identical number of MEGs. For the outside environment, XPR = 0 dB is used, while for the inside environment, XPR = 6 dB. The mutual coupling functions and between MIMO antenna components are included in MEG. Better system sensitivity performance is indicated by lower MEG levels. Therefore, MEG = -3 dB would often offer greater sensitivity than MEG = -6 dB. However, this increased sensitivity may result in increased system design complexity or expense [10].
2.2.5. Channel Capacity Loss (CCL)
One of the most prevalent MIMO factors is channel capacity loss, which is brought on by correlation effects in a communication system. The CCL due to the MIMO antenna may be estimated using this formula. When analyzing the MIMO system, the most crucial parameter to consider is the CCL. Explanation of a four-port antenna’s channel capacity losses is crucial. The formula below was used to determine CCL [10]:
where the receiving antenna’s correlation matrix, denoted by , is as follows:
2.2.6. Multiplexing Efficiency (ME)
Diversity gain or MIMO capacity describes the overall performance of a MIMO antenna. Throughput measurements of MIMO systems have recently been used to characterize the impacts of MIMO antennas. On the other hand, MIMO throughput and capacity are intricate functions of the antenna characteristics. A ME was proposed in [8] to ease antenna designs. For a given MIMO capacity, the ME was defined as the SNR deterioration results from MIMO antenna-channel impairments.
Antenna efficiencies can be used to represent the ME:
3. Results and Discussion
CST software was used in this study’s antenna design, and a comprehensive assessment of its performance was conducted. A waveguide port was used to supply the excitation. The far-field pattern, return loss, gain, directivity, and surface electric field were all analyzed and compared to the observed data.
3.1. Proposed Single Antenna Configuration
In this section, the performance parameter of the proposed MPA is presented as follows:
3.1.1. Return Loss ()
The power returned to the source because of impedance mismatches is known as return loss. Figure 6 shows the suggested antenna’s results, which show a comparison between the measured prototype and the computed model. The magnitude is more than -33 dB, and the return loss is less than -10 dB for every model. The antenna effectively transmits most of the power, with just a very little amount being reflected, as demonstrated by its of -33.04 dB. This demonstrates unequivocally the flawless impedance matching. Furthermore, Figure 6 illustrates a strong connection between the simulation’s results for the same. The relative bandwidth, as calculated =1.307 GHz, represents the ratio of the bandwidth to the center frequency of the operating band. This measure provides a normalized perspective on the bandwidth coverage concerning the center frequency.
3.1.2. Gain
The antenna’s gain indicates its capacity to focus radio-frequency radiation in a certain direction. With a gain of 10.11dB, the antenna outperforms an isotropic radiator (an idealized antenna radiates power equally in all directions) in terms of signal intensity in its primary direction of radiation. It is important to keep in mind that array antenna structures may normally be needed to reach the high gain values attained in this work using a single patch construction. Nevertheless, these arrangements would jeopardize the antenna’s affordability and ease of design. Therefore, in terms of practical implementation, achieving high gain with a single patch structure is advantageous, as it enhances the reliability and range of wireless communication.
3.1.3. Radiation Pattern
The distribution of radiated power in the E-H plane is described by the antenna’s radiation pattern. The antenna concentrates its energy in one direction, increasing signal strength and decreasing interference from other directions, when it has a primarily unidirectional emission pattern. The two-dimensional radiation pattern of a single MPA element is shown in Figure 7. A reasonably concentrated radiation lobe is indicated by the half-power beamwidth (HPBW) of 54.1 degrees, which is the angle across which the radiated power is at least half of its highest value. These graphic depictions provide important information on the radiation properties of the antenna, including the polarization patterns and the directionality of the signals that are received or sent out. As shown in Table 2, it is evident that the suggested antenna offered a maximum gain of 10.11 dB when compared to other designs that had a maximum gain of 9.8 dB. 2. Directivity while maintaining other parameters unaltered, except bandwidth, which was made up for by the extremely high gain and directivity. This suggests that the suggested MPA may be a good option for 5G mobile communication devices, particularly if compactness, affordability, and ease of use are the primary design criteria. Moreover, Figure 8 presents the 3D radiation pattern.
3.1.4. Voltage Standing Wave Ratio
The VSWR is a measure of the efficiency of power transmission from a transmission line to a load. It quantifies how well the load is matched to the transmission line, indicating the presence of standing waves caused by reflections. VSWR of 1:1 represents perfect matching, meaning no power is reflected, while higher ratios indicate increased reflections and poor matching. A VSWR value below 2:1 is generally considered acceptable for most applications, as it suggests minimal signal loss and efficient power transfer. A VSWR of the proposed MPA shown in Figure 9 is equal to 1.04 indicating good impedance matching and little power loss from reflections because it is extremely near to the ideal value of 1.
3.1.5. Efficiency
Furthermore, the antenna efficiency exceeded 91% within the frequency range. It displays the ratio of radiated power to input power. Efficiency greater than 91.5%, as seen in Figure 10, indicates that the majority of the input power is effectively radiated as electromagnetic waves rather than being lost as losses inside the antenna design.
3.1.6. Surface Current
Certain aspects of an MPA’s surface current distribution might influence its radiation pattern and overall performance. It’s important to note that the exact surface current distribution will depend on the dimensions and specific design characteristics of the MPA. Figure 11 illustrates the surface current distribution of the proposed MPA. The regions with the highest current density concentration are the feed line, the edges of the rectangular patch, and the L-slot. The initial design of the antenna successfully generates resonances at 28 GHz.
3.1.7. Reference Impedance
The typical reference impedance of an MPA running at 28 GHz is 50 Ohms. For the sake of standardization and interoperability with commonly used RF systems and components, a reference impedance of 50 Ohms was chosen. A 50-ohm reference impedance is commonly used in MPA design and analysis because it allows for efficient power transfer between the antenna and the feeding network or transmission line. This reference impedance aids in impedance matching minimizes echoes and maximizes power transfer. It is shown in Figure 12.
3.1.8. Input Impedance
An essential electrical engineering characteristic, input impedance is vital to the design and analysis of electronic circuits. As a result, the circuit design and the components used affect how input impedance is calculated. The input impedance in the waveguide and T.L. cases is determined by the structure’s shape. As a result, impedance matching—the process of setting an electrical network’s input impedance to optimize the power delivered from a particular source—becomes crucial.
Calculating the Input Impedance
A known signal may be applied to the input and the resulting voltage and current can be measured experimentally to determine the input impedance. By varying the frequency of the signal and taking measurements at each frequency, the input impedance can be calculated. This approach is effective up to MHz frequencies, provided the electrical network’s input and output ports are clearly defined. The input impedance of the proposed design is presented in Figure 13.
3.2. Proposed MIMO
3.2.1. Reflection Coefficients (S-Parameters)
Reflection coefficients are crucial for assessing impedance matching and overall system performance. A reflection coefficient of 0 indicates perfect matching.
In addition, Isolation coefficients measure the degree of coupling between different elements of an antenna array or between antennas in a MIMO system. They quantify how much signal power is transferred from one port to another, typically denoted as and . Figure 14 presents the reflection and isolation coefficients of the measured and simulation results.
The results show a reflection coefficient value of less than -33 dB in both the simulation and measured cases. The reflection is very close to -40dB for measured while -33dB dB in the simulated case. However, the isolation coefficient is less than -25 dB. A high isolation coefficient indicates that the elements are effectively decoupled, reducing interference and improving overall system performance. This is essential for enhancing the diversity and reliability of communication systems, particularly in applications with multiple antennas. However, there is some shift in frequency due to the difference in port design and manufacturing.
3.2.2. D-Radiation Pattern and Gain
Figure 15 presents the graphical representation of how an antenna radiates energy in three-dimensional space, illustrating the distribution of radiated power in different directions, for four antenna elements of the proposed MIMO design. As observed, Figure 15a–d shows that the gains of elements 1, 2, 3, and 4 are all around 10.21 dB. It refers to the effectiveness of the antenna in focusing energy in a particular direction compared to an isotropic radiator, providing insights into its performance for communication applications. This is an excellent result. Consequently, the 2D radiation pattern is presented in Figure 16. This result is at phi=90 degrees. It illustrates how the antenna radiates energy in a specific plane, showing the distribution of power in various directions. This pattern helps visualize the antenna’s directivity and beamwidth, acceptable SLL providing valuable insights into its performance for IOT applications.
3.2.3. Envelope Correlation Coefficient (ECC)
As the isolation parameters ( and ) alone do not provide a complete characterization of antenna mutual coupling, the Envelope Correlation Coefficient (ECC) serves as an essential diversity metric. The ECC incorporates all return loss and isolation coefficient characteristics from different ports. For mobile communication, the International Telecommunication Union (ITU) advises that ECC be less than 0.5. Larger values imply a negative effect, whereas lower values reflect a weak connection between radiating parts. The ECC of the suggested MIMO architecture for four ports is displayed in Figure 17, Figure 18, Figure 19 and Figure 20. At an operating frequency of 28 GHz, the ECC values are found to be very close to 0, indicating that the performance of the proposed design has been improved.
3.2.4. Diversity Gain
The proposed MPA’s simulated DG is displayed in Figure 21. Adjacent antenna elements must have a DG of higher than 9.999 dB. It has been noted that diversity gain values exceeding 9.999 dB across the intended band are precisely equivalent to 10 dB. These outcomes guarantee a suggested MIMO’s outstanding diversity performance. Furthermore, the proposed antenna has the potential to be utilized in diversity scheme applications. Diversity scheme applications refer to techniques used to improve signal reliability and quality by utilizing multiple antennas or signal paths. These schemes are commonly employed to combat issues such as signal fading, interference, and multipath effects, enhancing overall communication performance.
3.2.5. Total Active Reflection Coefficient (TARC)
Figure 22 displays the TARC for the proposed MIMO design at various angles such as 0 º, 45 º, 90 º, 135 º and 180 º.
3.2.6. Mean Effective Gain (MEG)
Lower MEG values indicate better performance in terms of system sensitivity. So, Figure 23 presents the MEG versus frequency from the CST simulation. The value of MEG at a proposed frequency (f=28GHz) records -3 dB. However, this higher sensitivity comes at the cost of potentially higher complexity or cost in the system design
3.2.7. Channel Capacity Loss (CCL)
Figure 24 illustrates that the value of CCL is < 0.005 (bits/s/Hz), which is well within the acceptable limit of under 0.4 (bits/s/Hz). This indicates that the antenna framework exhibits high throughput under real-world conditions.
3.2.8. Multiplexing Efficiency
Measuring the MIMO systems’ throughput allows for the characterization of the MIMO antenna effects. Also, MIMO throughput and capacity are intricate functions of the antenna characteristics. Thus, the antenna design is made easier by the ME. Figure 25 displays the suggested design’s ME value, which is 0 dB. It suggests that there has been no deterioration.
Finally, the achievements of the proposed MPA are compared with other designs as shown in Table. The proposed MPA gives a better trade-off between parameters. It achieves higher efficiency than all other designs in comparison.
4. Conclusion
This study focuses on the design and analysis of a single-element MPA and MIMO configuration at 28 GHz for beyond 5G applications. The MPA design consists of a rectangular patch that includes two symmetrical L-shaped slots arranged back-to-back, along with a central square slot. The substrate is built using Rogers RT5880., which has a dielectric permittivity of 2.2. The antenna is ideal for Internet of Things applications because of its 28 GHz resonance frequency. is seen to be -33.04 dB, indicating ideal impedance matching and little signal reflection. With a calculated gain of around 10.11 dBi, the antenna provides sufficient signal strength for wireless communication over a respectable range. The radiation pattern is mainly unidirectional, with an HPBW of 54.1 degrees, guaranteeing focused signal transmission. Moreover, the VSWR of 1.04 is found, providing additional proof of the good power transfer efficiency between the antenna and transmission line. As a result, the simulation outcomes confirm that the proposed MPA design fulfills the essential requirements for effective wireless communication. Moreover, 4x4 MIMO aims to enhance properties such as return loss, isolation coefficients, and diversity gain (DG). Optimizing these parameters can lead to increased system capacity, faster data rates, improved signal quality, and more efficient use of wireless resources. Gains of 10.2, 9.91, 10.2, and 9.84 are observed in the four directional components of the MIMO. The DG reaches 10dB as well.
Funding
This research received no external funding.
Data Availability Statement
Data available when it is required.
Conflicts of Interest
The authors declare no conflicts of interest.
References
- S. Alwakeel, A. M. El-Rifaie, G. Moustafa, A. M. Shaheen, “Newton Raphson based optimizer for optimal integration of FAS and RIS in wireless systems,” Results in Engineering, Volume 25, 2025, 103822, ISSN 2590-1230. [CrossRef]
- D. Saha, I. M. Nawi, M.A. Zakariya, “Super low profile 5G mmWave highly isolated MIMO antenna with 360∘ pattern diversity for smart city IoT and vehicular communication,” Results in Engineering, Volume 24, 2024, 103209, ISSN 2590-1230. [CrossRef]
- J. R. James, P. S. Hall, and C. Wood, Microstrip Antenna Theory and Design, Peter Peregrinus, London, UK, 1981.
- R. E. Munson, “Microstrip Antennas,” Chapter 7 in Antenna Engineering Handbook (R. C. Johnson and H. Jasik, eds.), McGraw-Hill Book Co., New York, 1984.
- W. F. Richards, “Microstrip Antennas,” Chapter 10 in Antenna Handbook: Theory, Applications and Design (Y. T. Lo and S. W. Lee, eds.), Van Nostrand Reinhold Co., New York, 1988.
- J. R. James and P. S. Hall, Handbook of Microstrip Antennas, Vols. 1 and 2, Peter Peregrinus, London, UK, 1989.
- P. Bhartia, K. V. S. Rao, and R. S. Tomar, Millimeter-Wave Microstrip and Printed Circuit Antennas, Artech House, Boston, MA, 1991.
- J. R. James, “What’s New In Antennas,” IEEE Antennas Propagat. Mag., Vol. 32, No. 1, pp. 6–18, February 1990. [CrossRef]
- D. M. Pozar, “Microstrip Antennas,” Proc. IEEE, Vol. 80, No. 1, pp. 79–81, January 1992. [CrossRef]
- Md․ Sohel Rana, Sheikh Md․ Rabiul Islam, Sanjukta Sarker, “Machine learning based on patch antenna design and optimization for 5 G applications at 28GHz, “Results in Engineering, Volume24, 2024, 103366, ISSN 2590-1230. [CrossRef]
- F. Zavosh and J. T. Aberle, “Infinite Phased Arrays of Cavity-Backed Patches,” Vol. AP-42, No. 3, pp. 390–398, March 1994. [CrossRef]
- E. Jebabli, M. Hayouni, and F. Choubani, “Impedance Matching Enhancement of A Microstrip Antenna Array Designed for Ka-band 5G Applications,” in 2021 International Wireless Communications and Mobile Computing (IWCMC), Jun. 2021, pp. 1254–1258. [CrossRef]
- M. L. Seddiki, M. Nedil, S. Tebache and S. E. Hadji, “Compact Multiband Handset Antenna Design for Covering 5G Frequency Bands,” in IEEE Access, vol. 12, pp. 20822-20829, 2024. [CrossRef]
- Ishteyaq. K. Muzaffar. Multiple input multiple output (MIMO) and fifth generation (5G): An indispensable technology for sub-6 GHz and millimeter wave future generation mobile terminal applications. Int. J. Microw. Wirel. Technol. 2022, 14, 932–948. [CrossRef]
- S. Ali, M. Wajid, A. Kumar, M.S Alam,. Design Challenges and Possible Solutions for 5G SIW MIMO and Phased Array Antennas: A Review. IEEE Access 2022, 10, 88567–88594. [CrossRef]
- Lau, A, Z. Ying,” Antenna design challenges and solutions for compact MIMO terminals. In Proceedings of the 2011 IEEE International Workshop on Antenna Technology (iWAT), Hong Kong, China, 7–9 March; pp. 70–73, 2011.
- Kumar, A. Ansari, B. Kanaujia,, J. Kishor, L. Matekovits,” A Review on Different Techniques of Mutual Coupling Reduction Between Elements of Any MIMO Antenna. Part 1: DGSs and Parasitic Structures”. Radio Sci. 56, 2021. [CrossRef]
- P. Kumar, et al. “A Compact Quad-Port UWB MIMO Antenna with Improved Isolation Using a Novel Mesh-Like Decoupling Structure and Unique DGS”. IEEE Trans. Circuits Syst. II Express Briefs, 70, 949–953, 2023. [CrossRef]
- Abbas, et. al. “Highly selective multiple-notched UWB-MIMO antenna with low correlation using an innovative parasitic decoupling structure”. Eng. Sci. Technol. Int. J. 43, 101440, 2023. [CrossRef]
- R. N. Tiwari, P. Singh, B. K. Kanaujia, K. Srivastava, “Neutralization technique based two and four port high isolation MIMO antennas for UWB communication”. AEU Int. J. Electron. Commun. 110, 152828,2019. [CrossRef]
- X. Zou, et. al. Widebandcouplingsuppressionwiththeneutralization line-incorporated decoupling network in MIMO arrays. AEU Int. J. Electron. Commun, 167, 154688,2023. [CrossRef]
- T. Wu, M. Wang, J. Chen, “Decoupling of MIMO antenna array based on half-mode substrate integrated waveguide with neutralization lines’. AEU Int. J. Electron. Commun., 157, 154416, 2022. [CrossRef]
- F. Mahbub, R. Islam, S. A. Kadir Al-Nahiun, S. B. Akash, R. R. Hasan, and Md. A. Rahman, “A Single-Band 28.5GHz Rectangular Microstrip Patch Antenna for 5G Communications Technology,” in 2021 IEEE 11th Annual Computing and Communication Workshop and Conference (CCWC), Jan. 2021, pp. 1151–1156. [CrossRef]
- M. I. Khattak, A. Sohail, U. Khan, Z. Barki, and and G. Witjaksono, “Elliptical Slot Circular Patch Antenna Array with Dual Band Behaviour for Future 5G Mobile Communication Networks,” Progress In Electromagnetics Research C, vol. 89, pp. 133–147, 2019. [CrossRef]
- F. Kaeib, N. M. Shebani, and A. R. Zarek, “Design and Analysis of a Slotted Microstrip Antenna for 5G Communication Networks at 28 GHz,” in 2019 19th International Conference on Sciences and Techniques of Automatic Control and Computer Engineering (STA), Mar. 2019, pp. 648–653. [CrossRef]
- W. Ahmad and W. T. Khan, “Small form factor dual band (28/38 GHz) PIFA antenna for 5G applications,” in 2017 IEEE MTT-S International Conference on Microwaves for Intelligent Mobility (ICMIM), Mar. 2017, pp. 21–24. [CrossRef]
- Y. Zhang, J.-Y. Deng, M.-J. Li, D. Sun, and L.-X. Guo, “A MIMO Dielectric Resonator Antenna With Improved Isolation for 5G mmWave Applications,” IEEE Antennas and Wireless Propagation Letters, vol. 18, no. 4, pp. 747–751, Apr. 2019. [CrossRef]
- E. Jebabli, M. Hayouni, and F. Choubani, “Impedance Matching Enhancement of A Microstrip Antenna Array Designed for Ka-band 5G Applications,” in 2021 International Wireless Communications and Mobile Computing (IWCMC), Jun. 2021, pp. 1254–1258. [CrossRef]
- J. S. Park, J. B. Ko, H. K. Kwon, B. S. Kang, B. Park, and D. Kim, “A Tilted Combined Beam Antenna for 5G Communications Using a 28- GHz Band,” IEEE Antennas and Wireless Propagation Letters, vol. 15, pp. 1685–1688, 2016. [CrossRef]
Figure 1.
Steps of design proposed, (a): Traditional MPA, (b): MPA with IF, (c): MPA with IF and rectangular slots, (d): MPA with IF and L slots.
Figure 1.
Steps of design proposed, (a): Traditional MPA, (b): MPA with IF, (c): MPA with IF and rectangular slots, (d): MPA with IF and L slots.
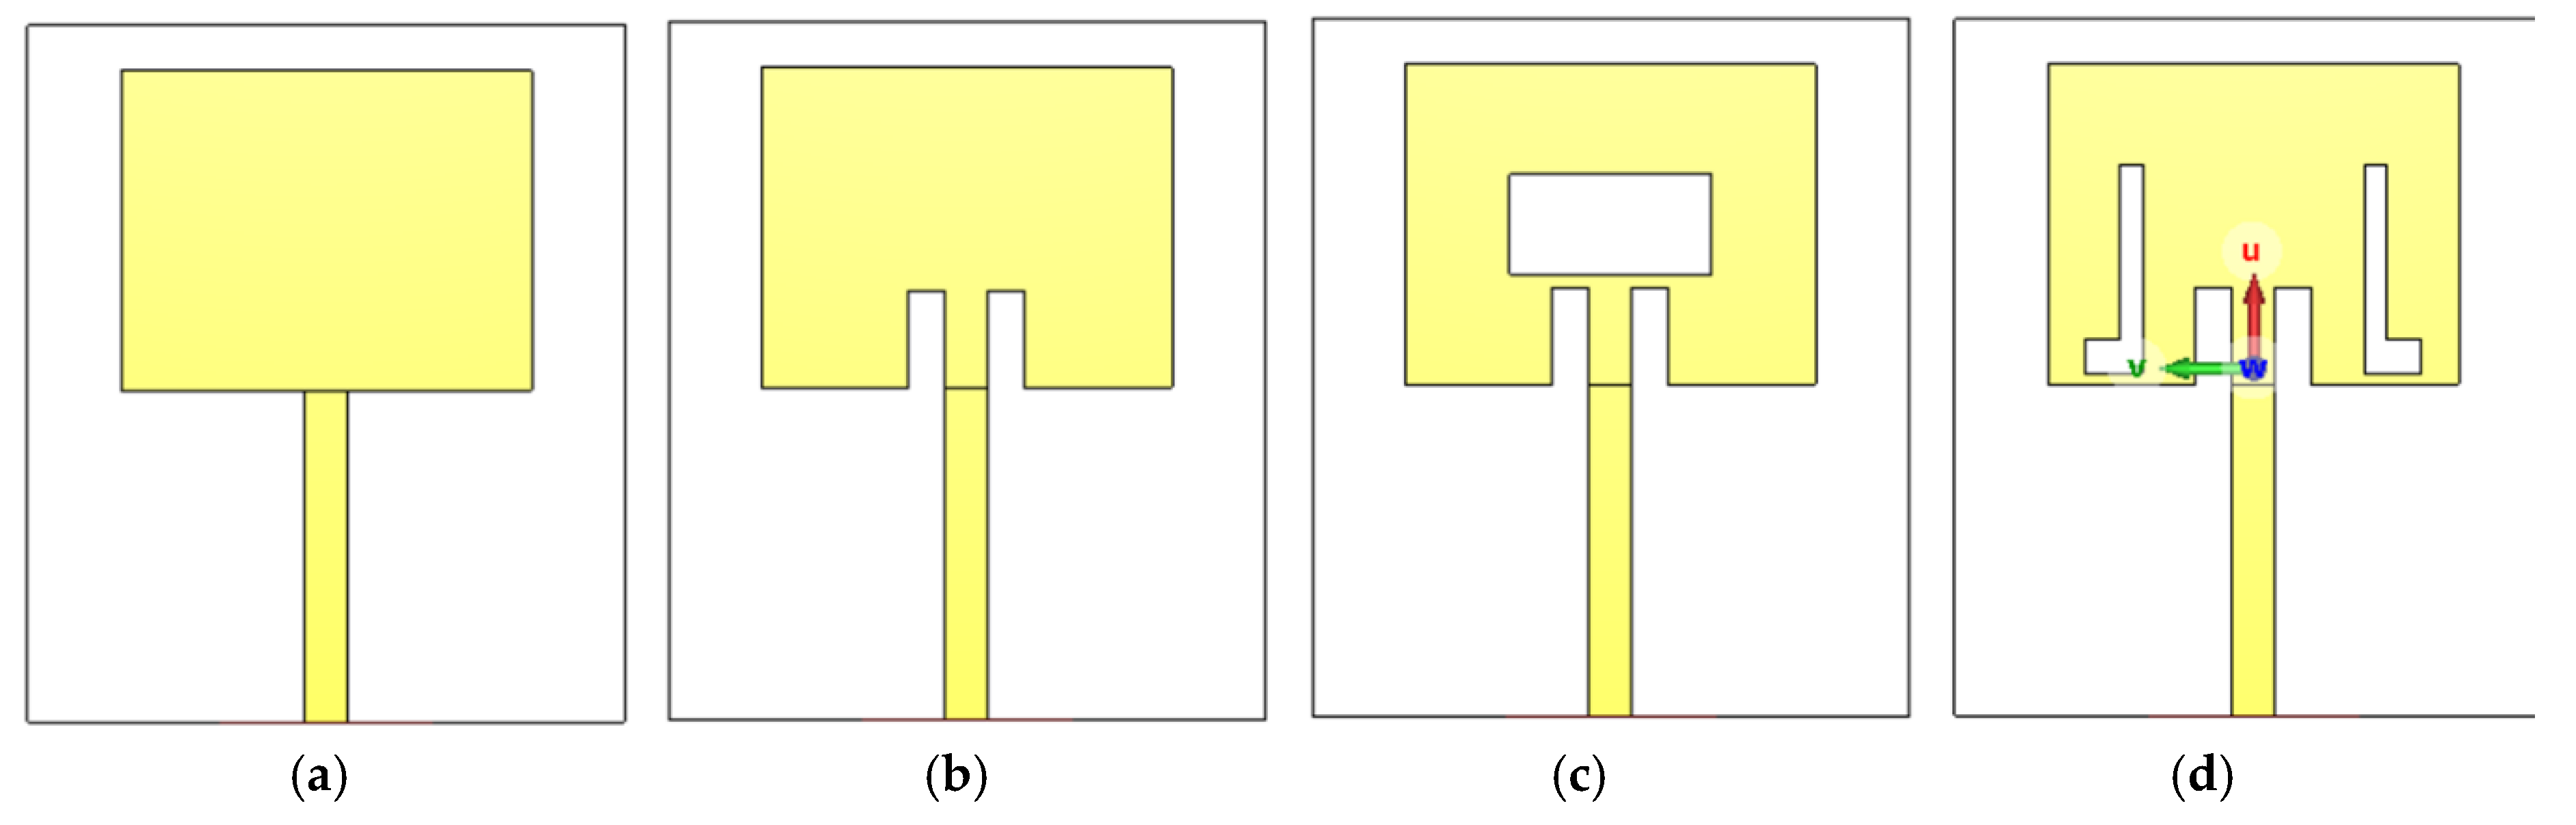
Figure 2.
Reflection coefficients of the initial design.
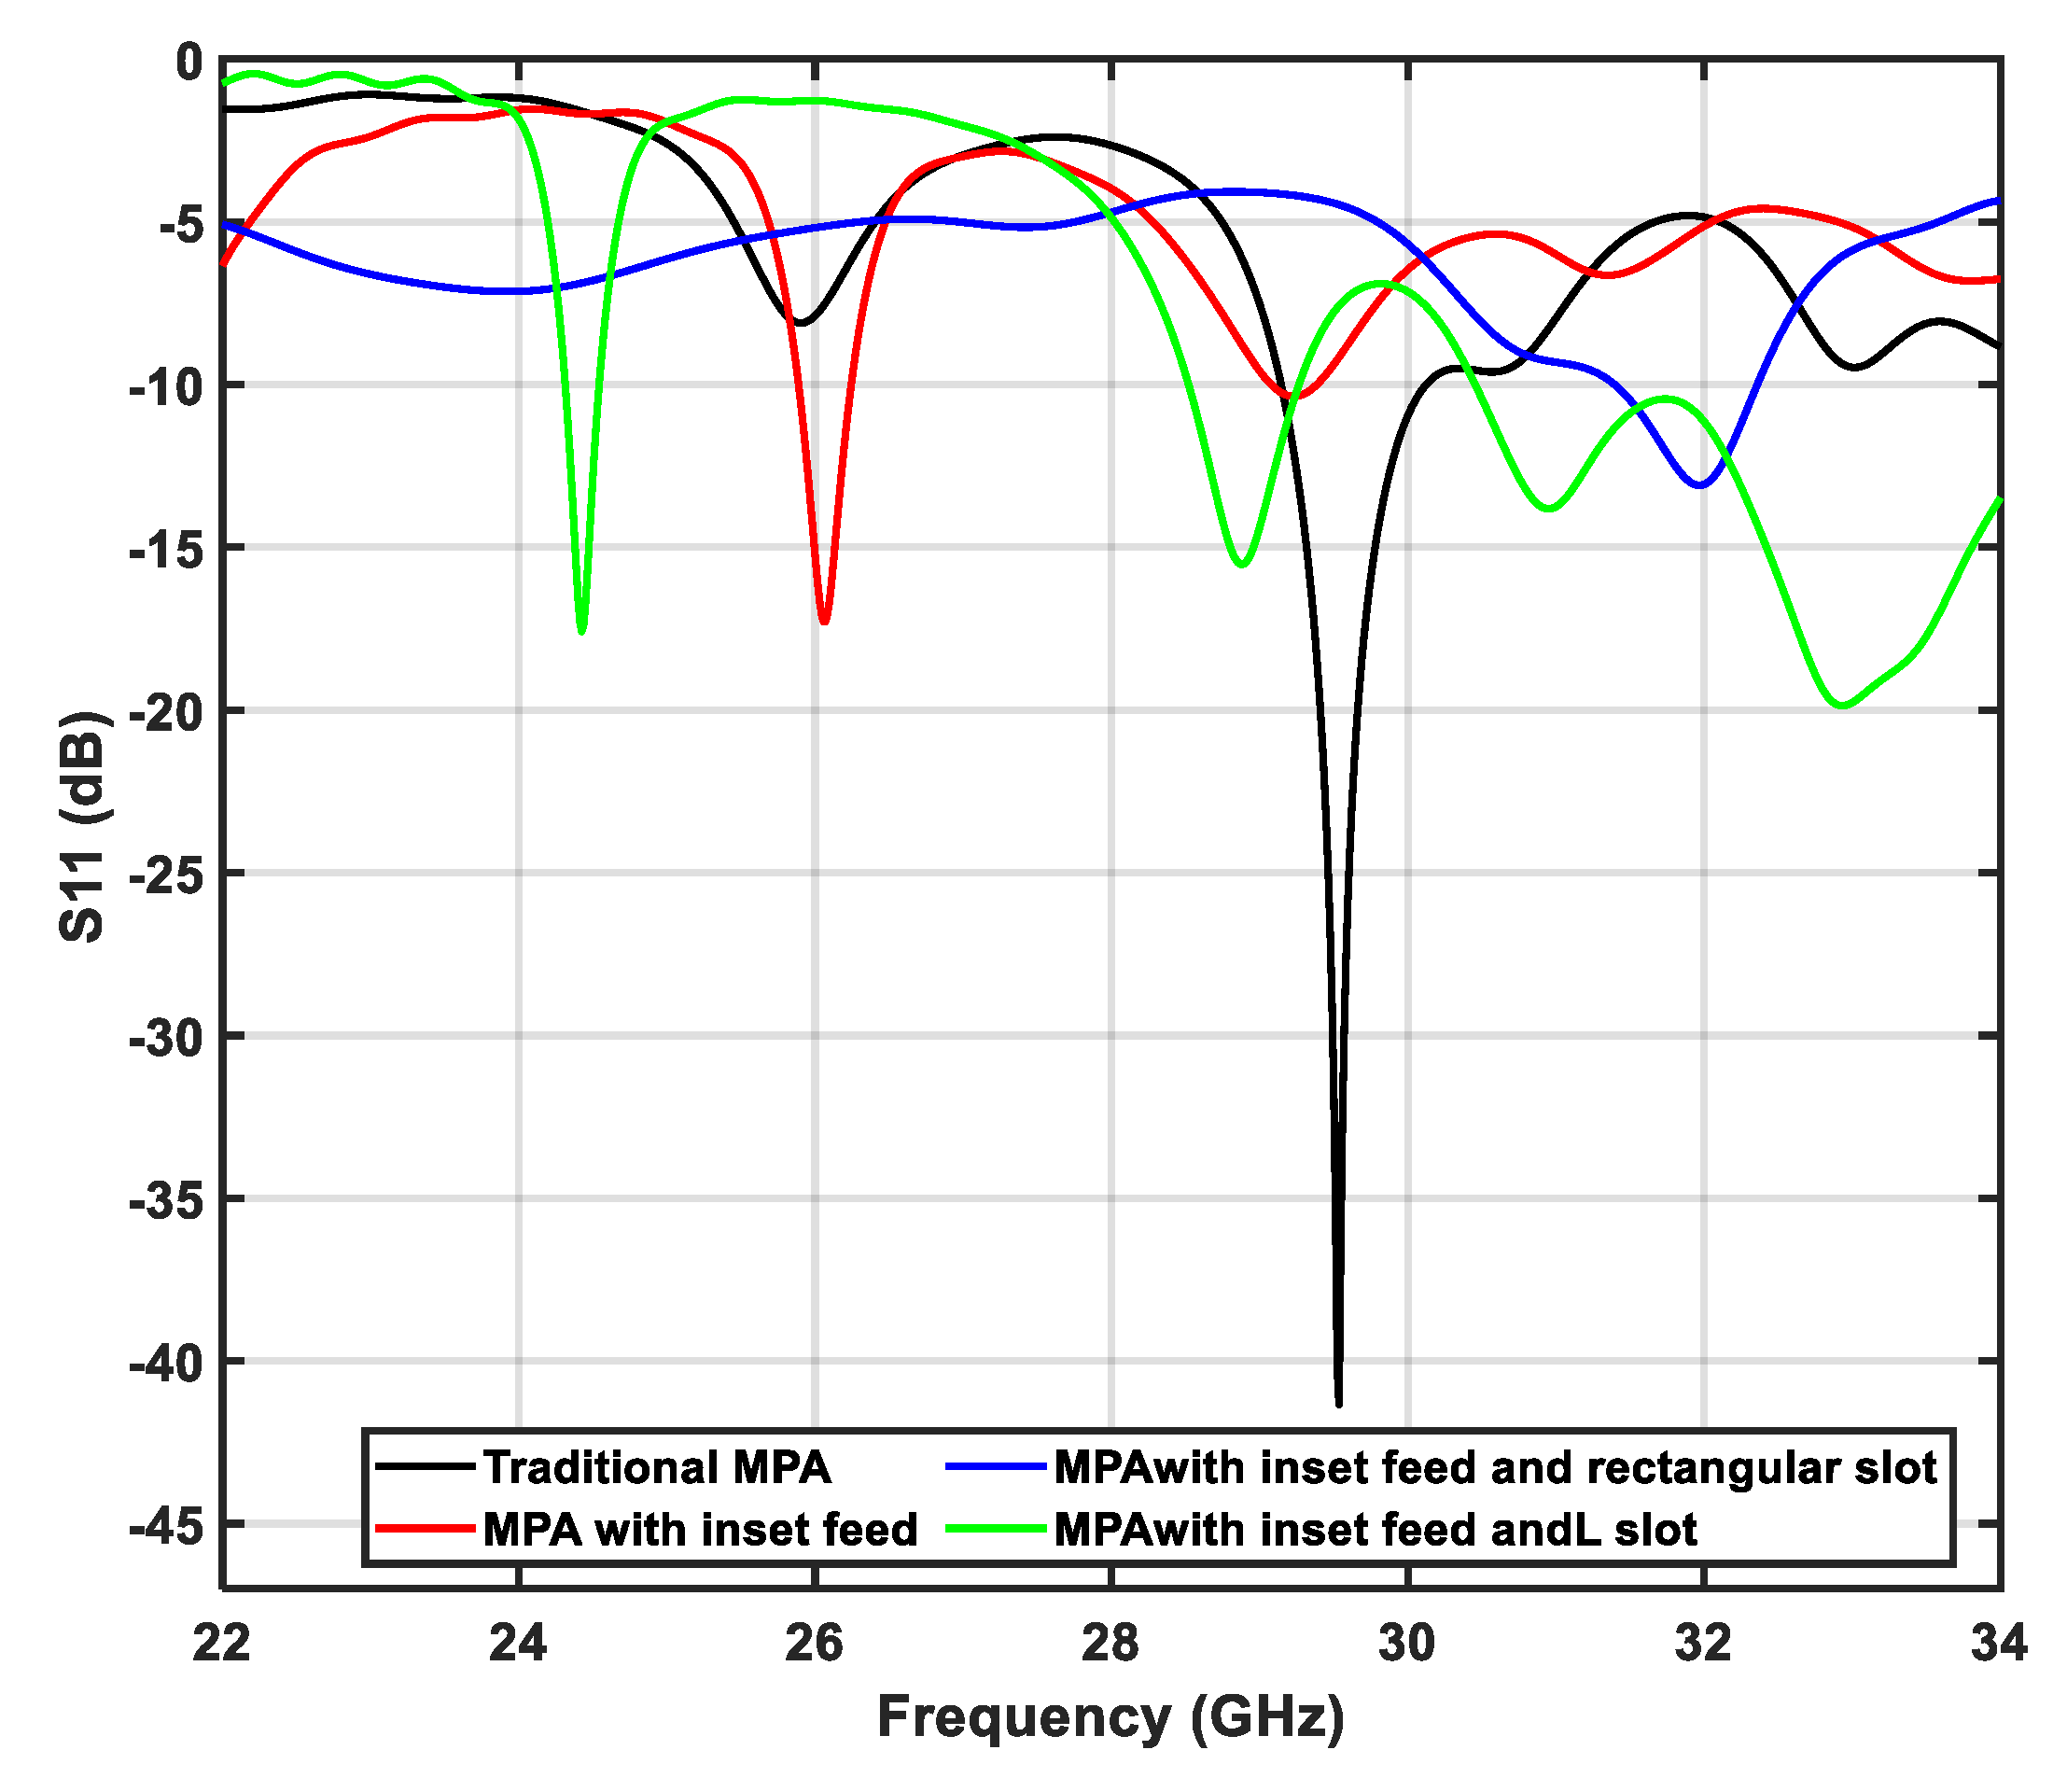
Figure 3.
Proposed MPA design, (a) Fabricated, (b) dimensions.
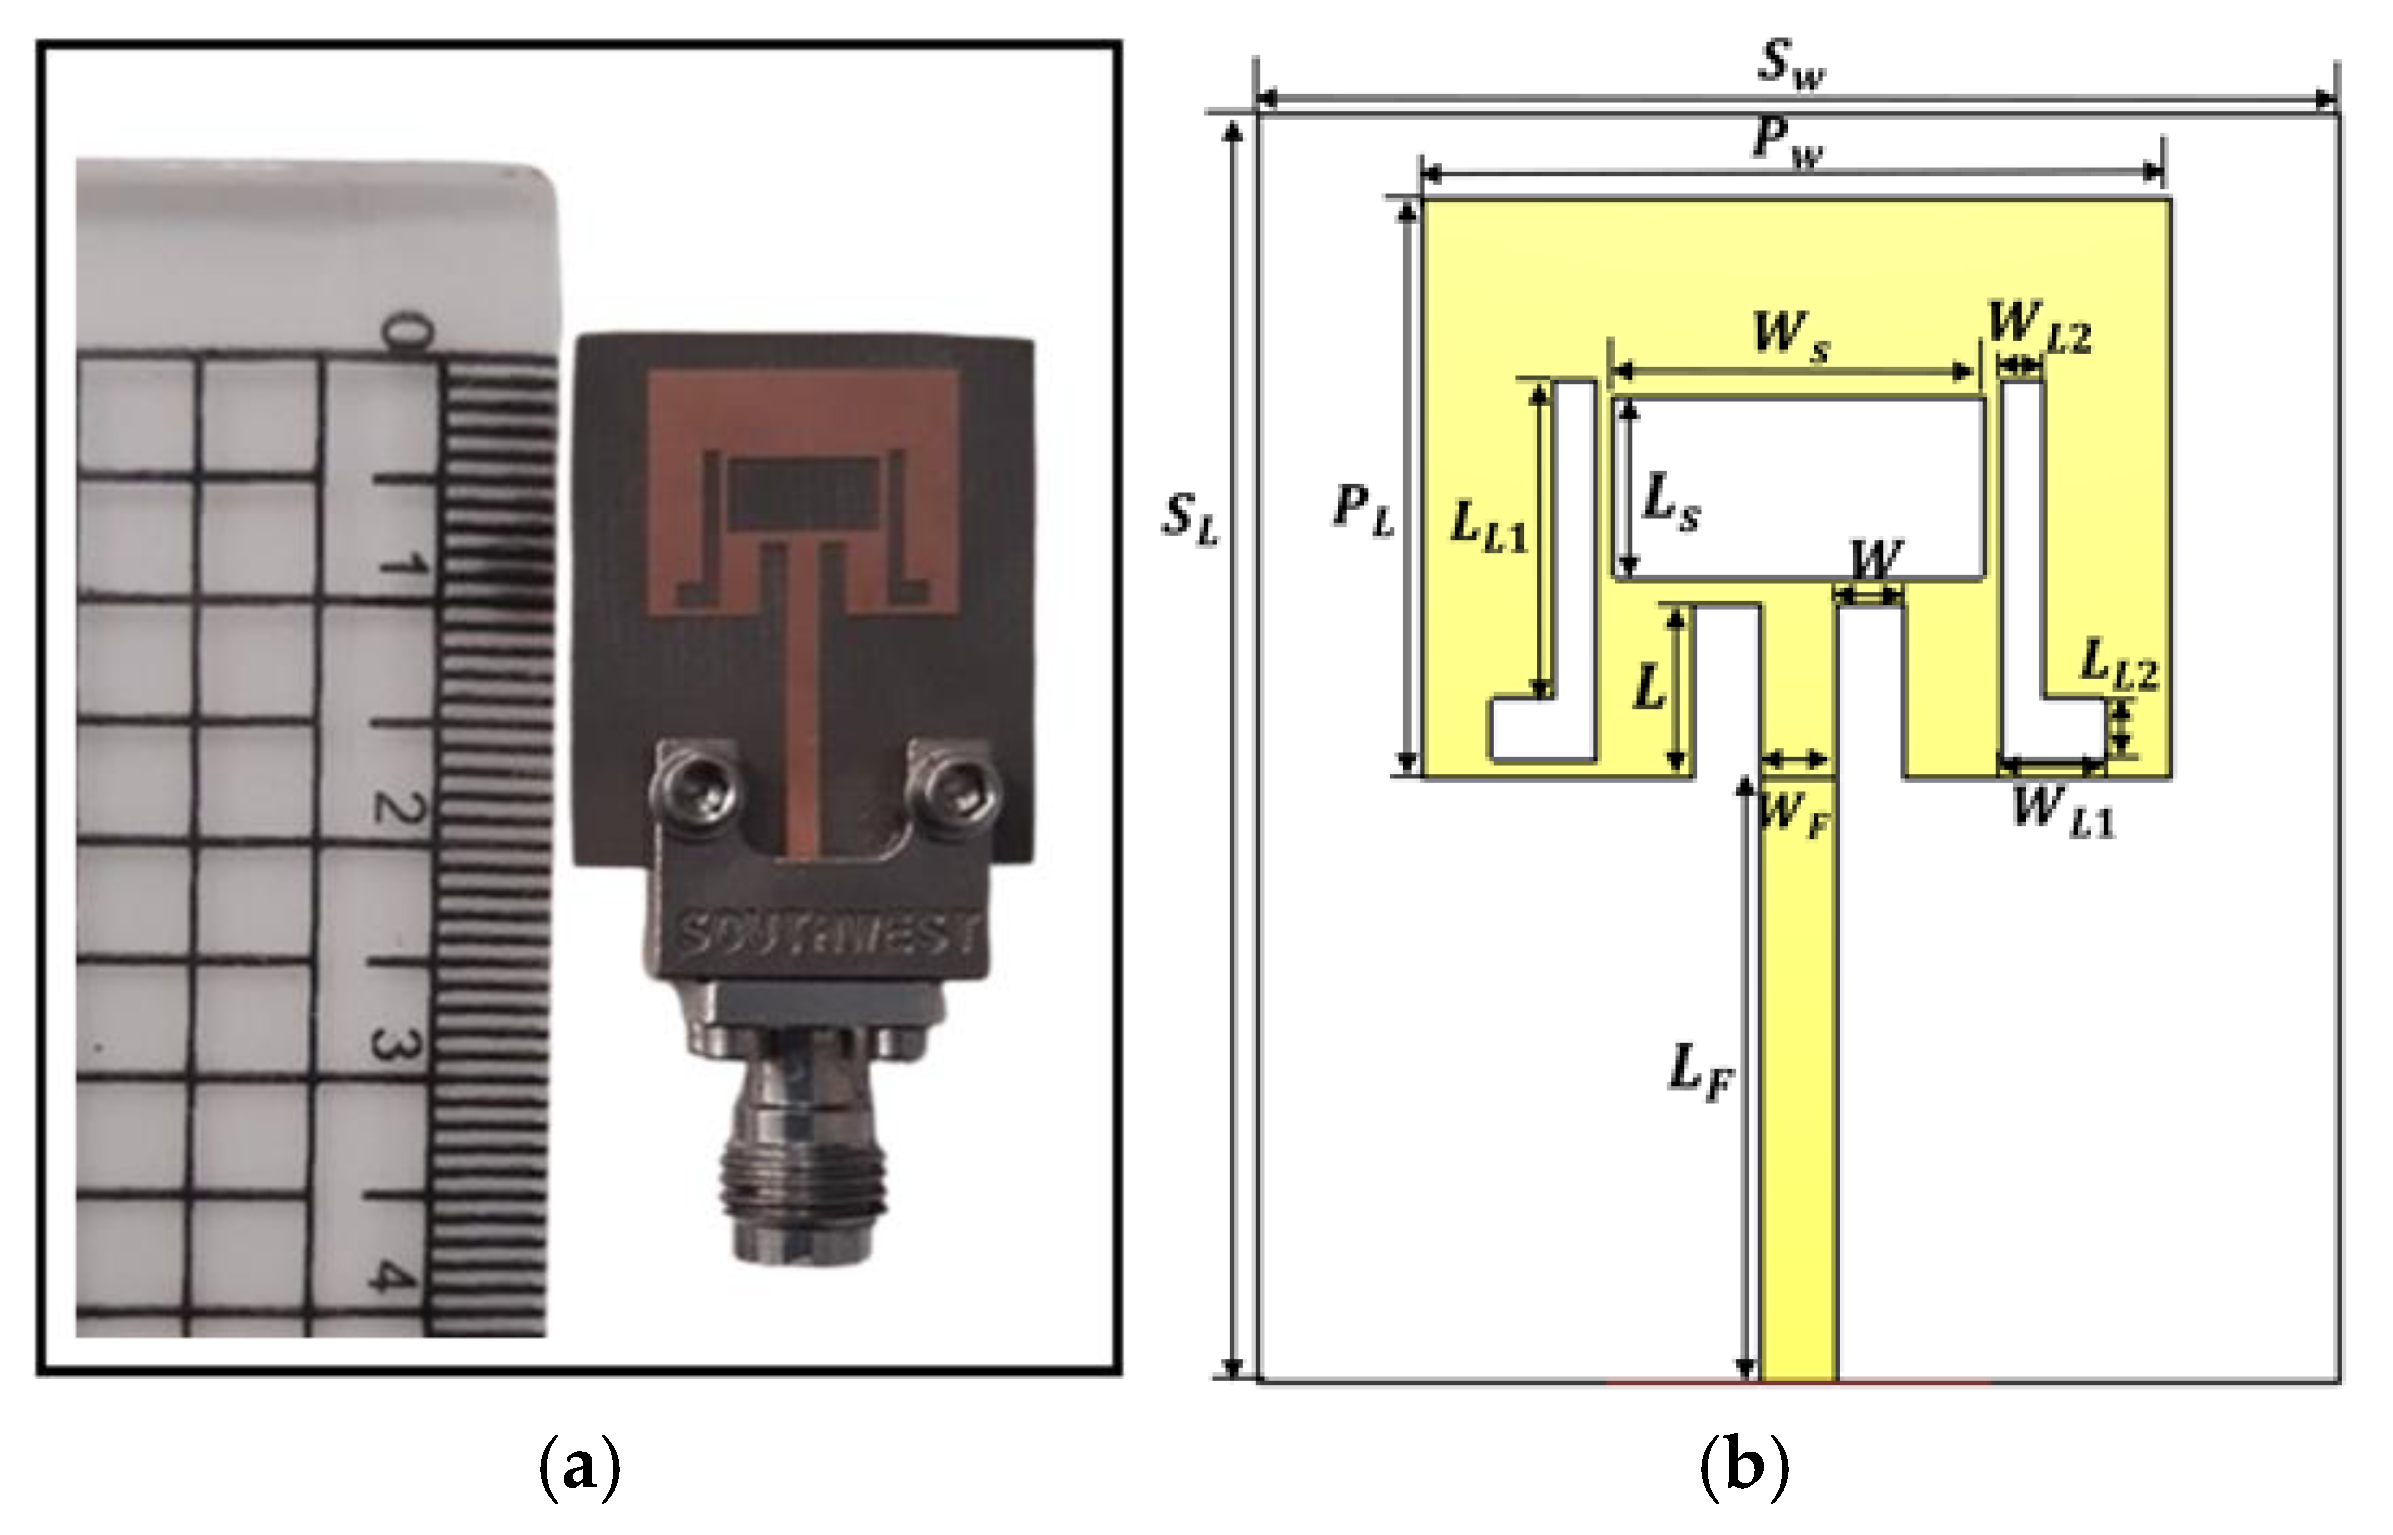
Figure 4.
Configuration of proposed 4x4 MIMO.
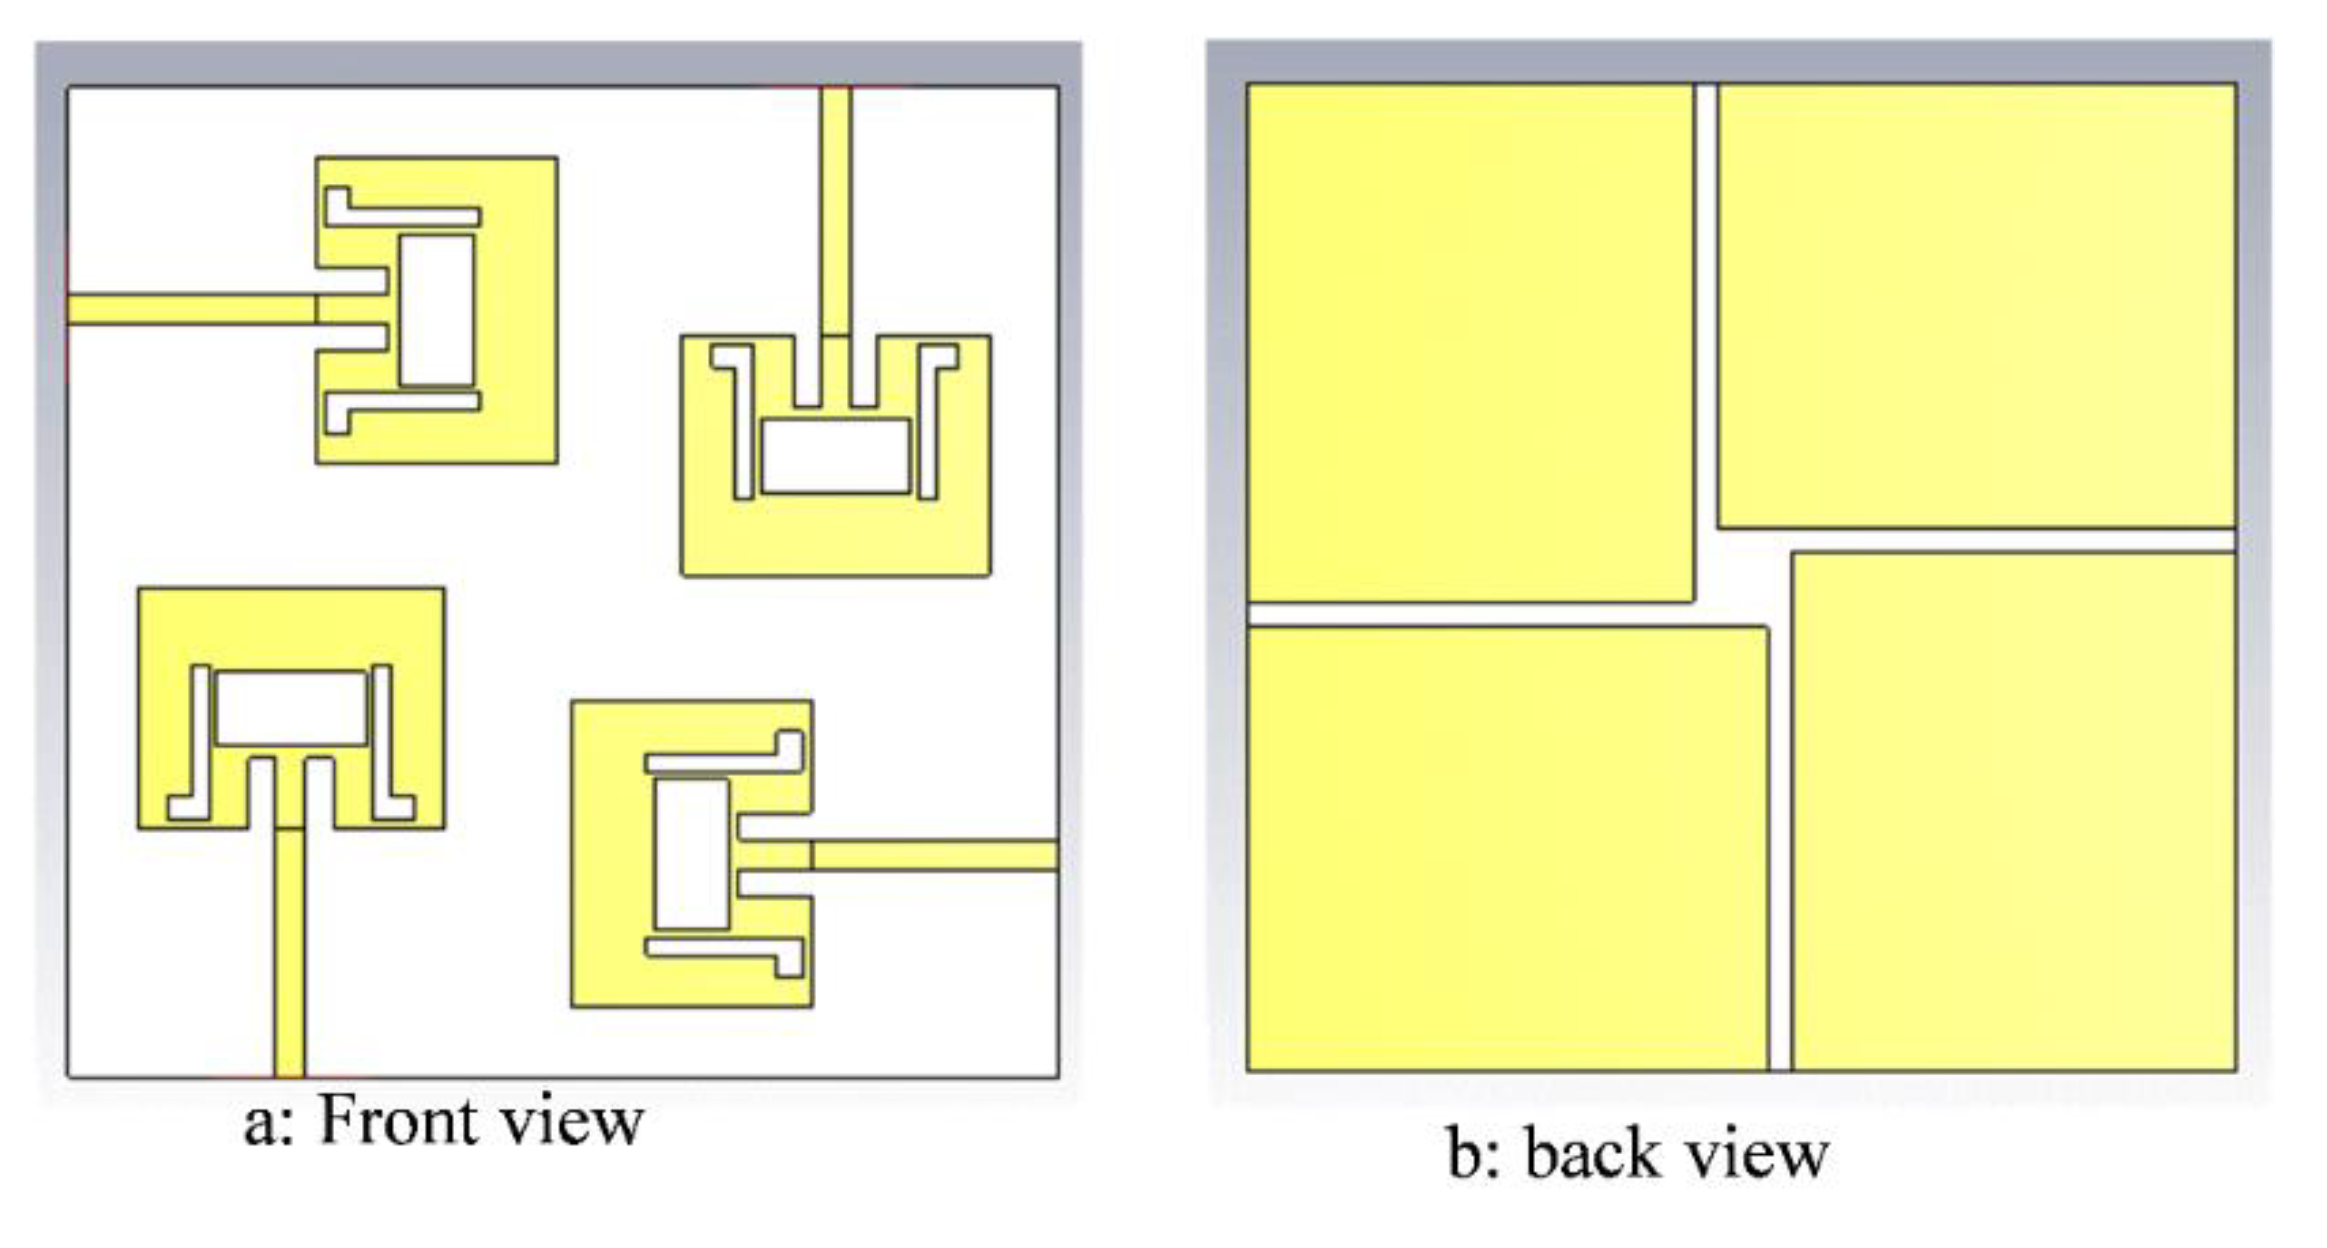
Figure 5.
Practical implementation of 4x4 MIMO.
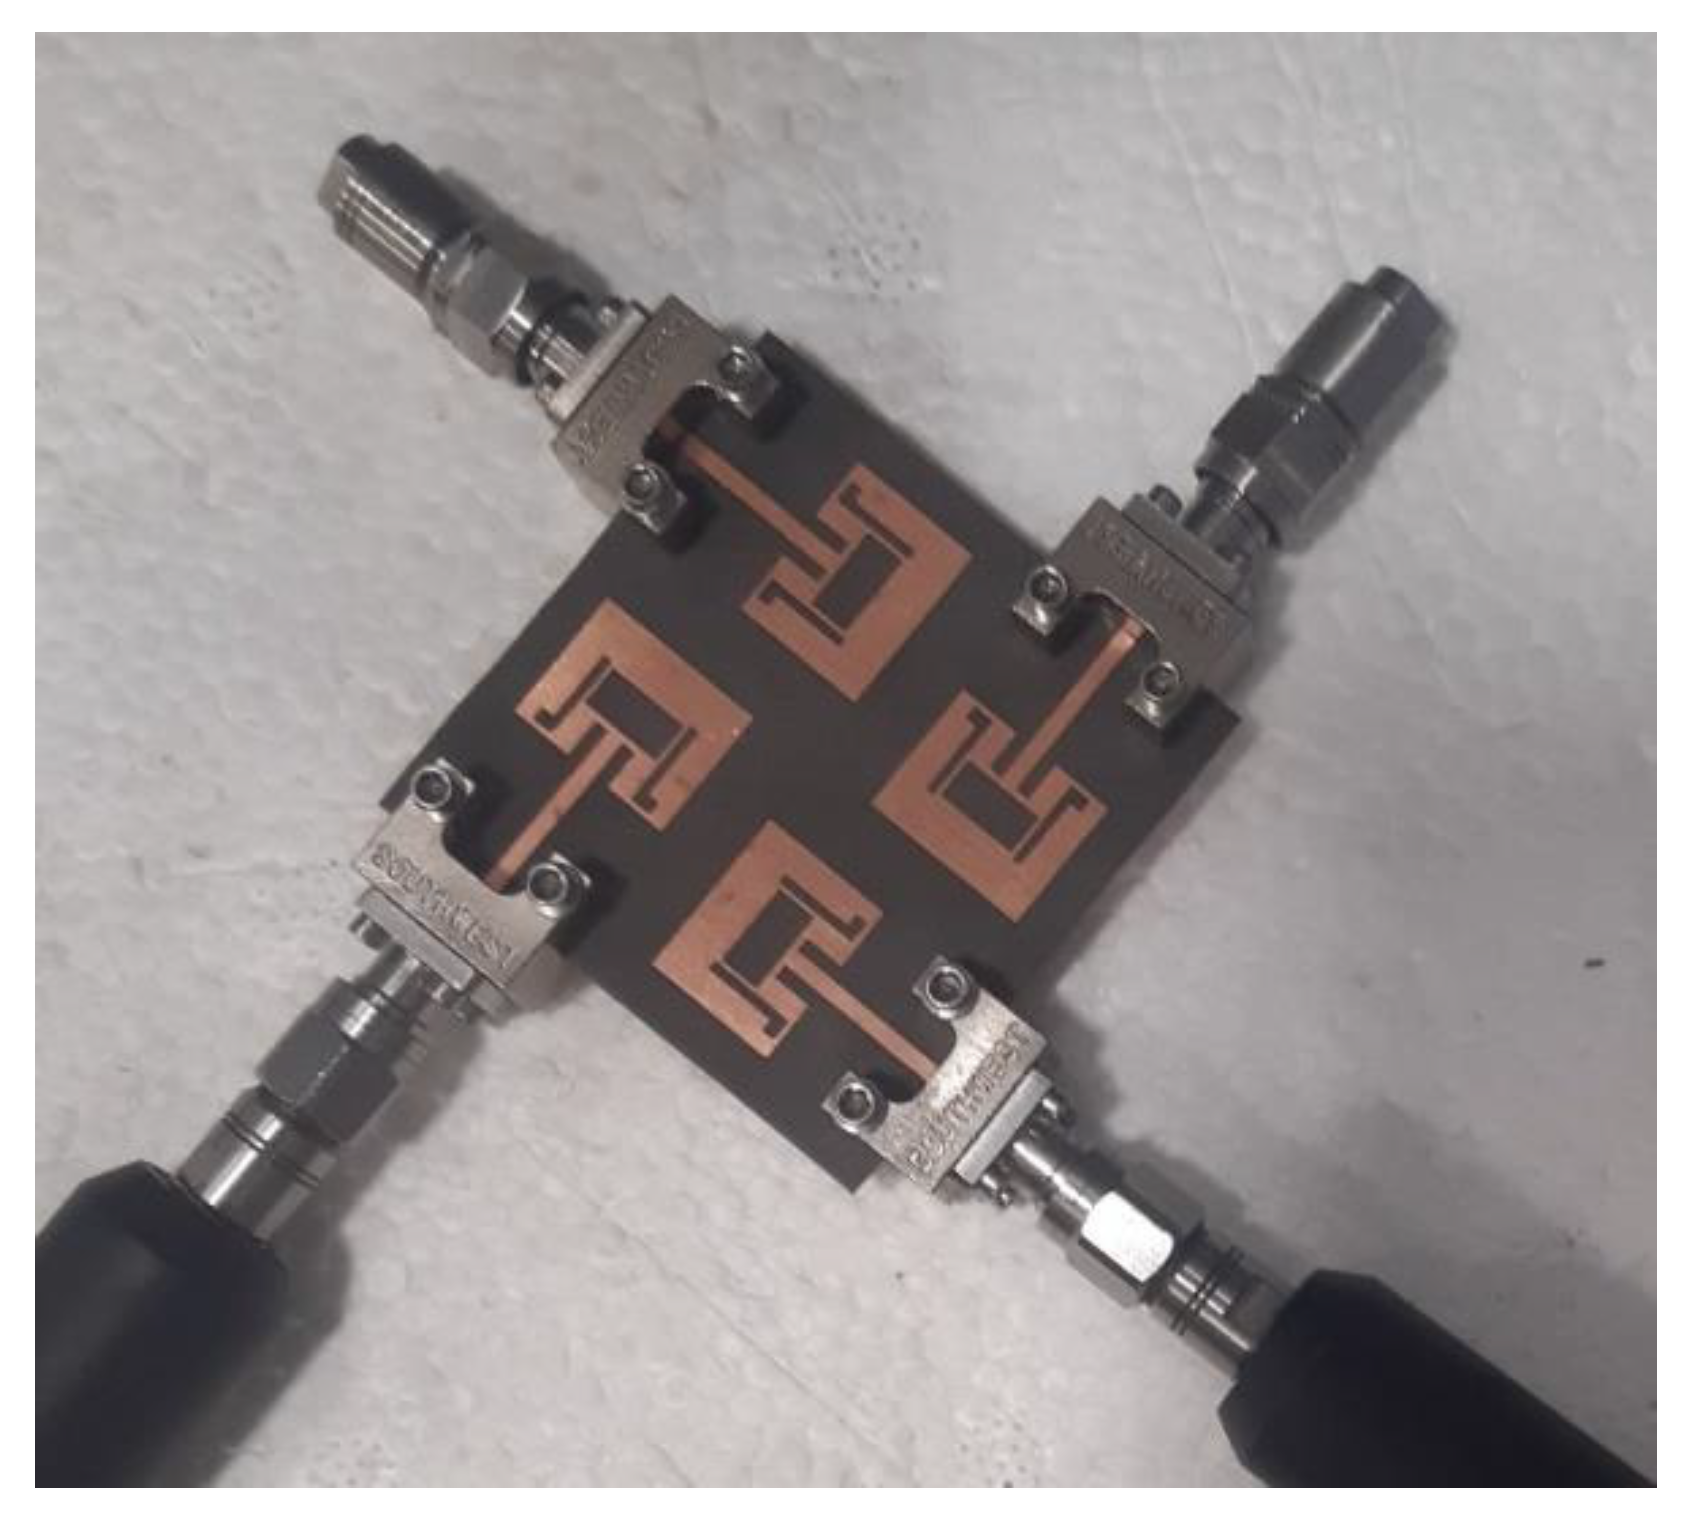
Figure 6.
S11 of simulation versus measure of the proposed MPA.
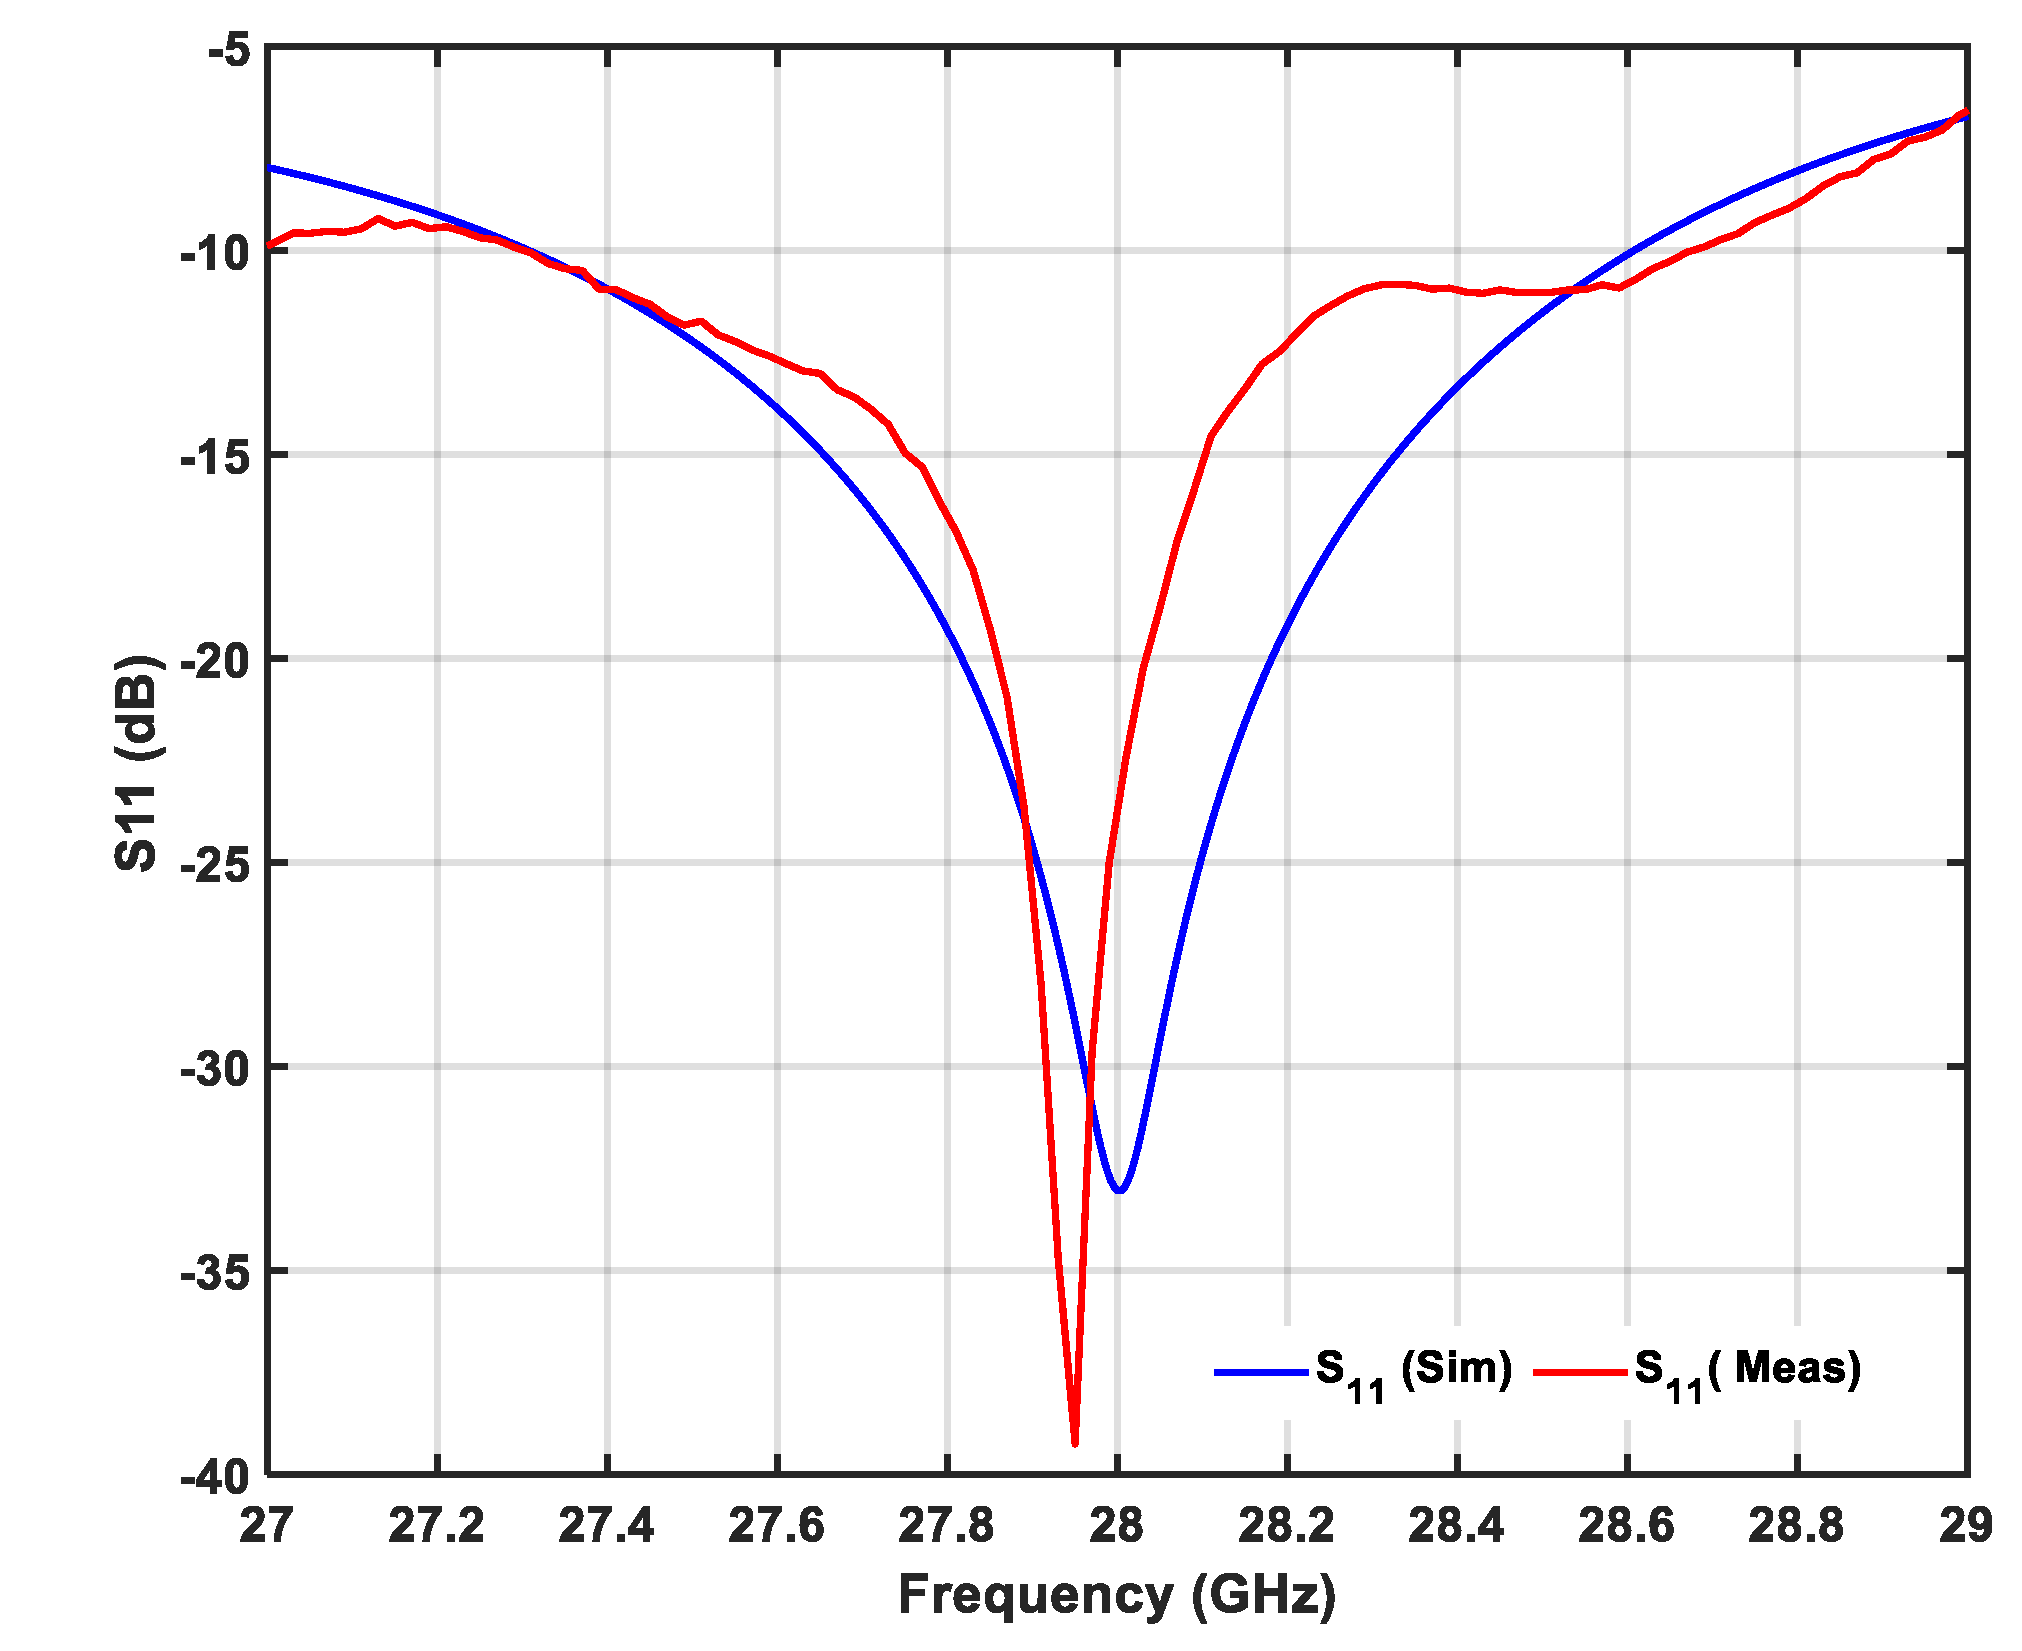
Figure 7.
Simulated and measured 2D radiation pattern of proposed MPA at (a) Phi = 90, (b) Phi = 0, (c) Theta=90.
Figure 7.
Simulated and measured 2D radiation pattern of proposed MPA at (a) Phi = 90, (b) Phi = 0, (c) Theta=90.
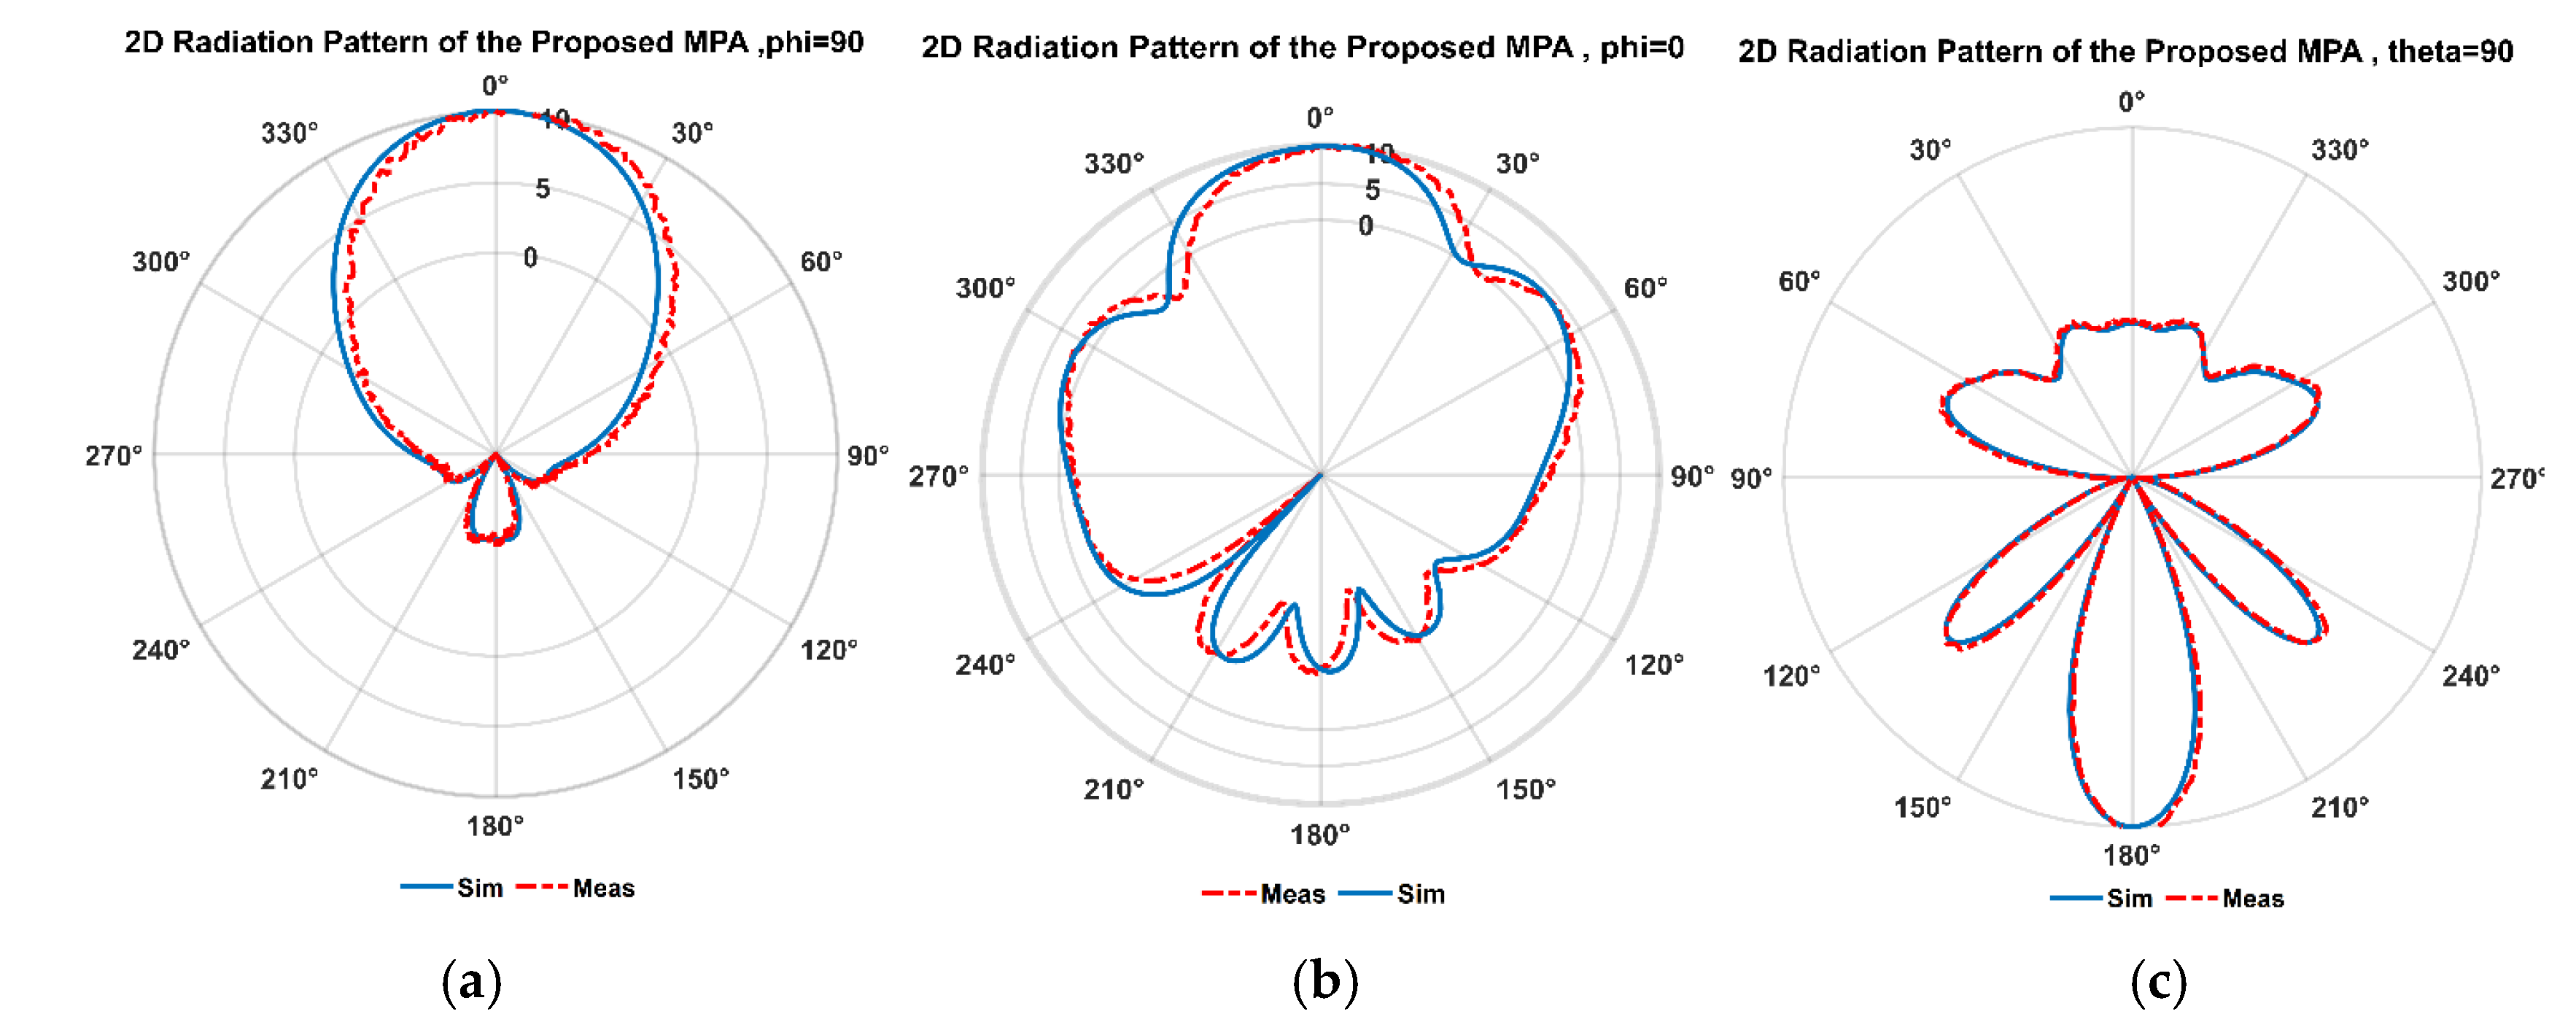
Figure 8.
3D radiation patterns of the proposed antenna at 28GHz.
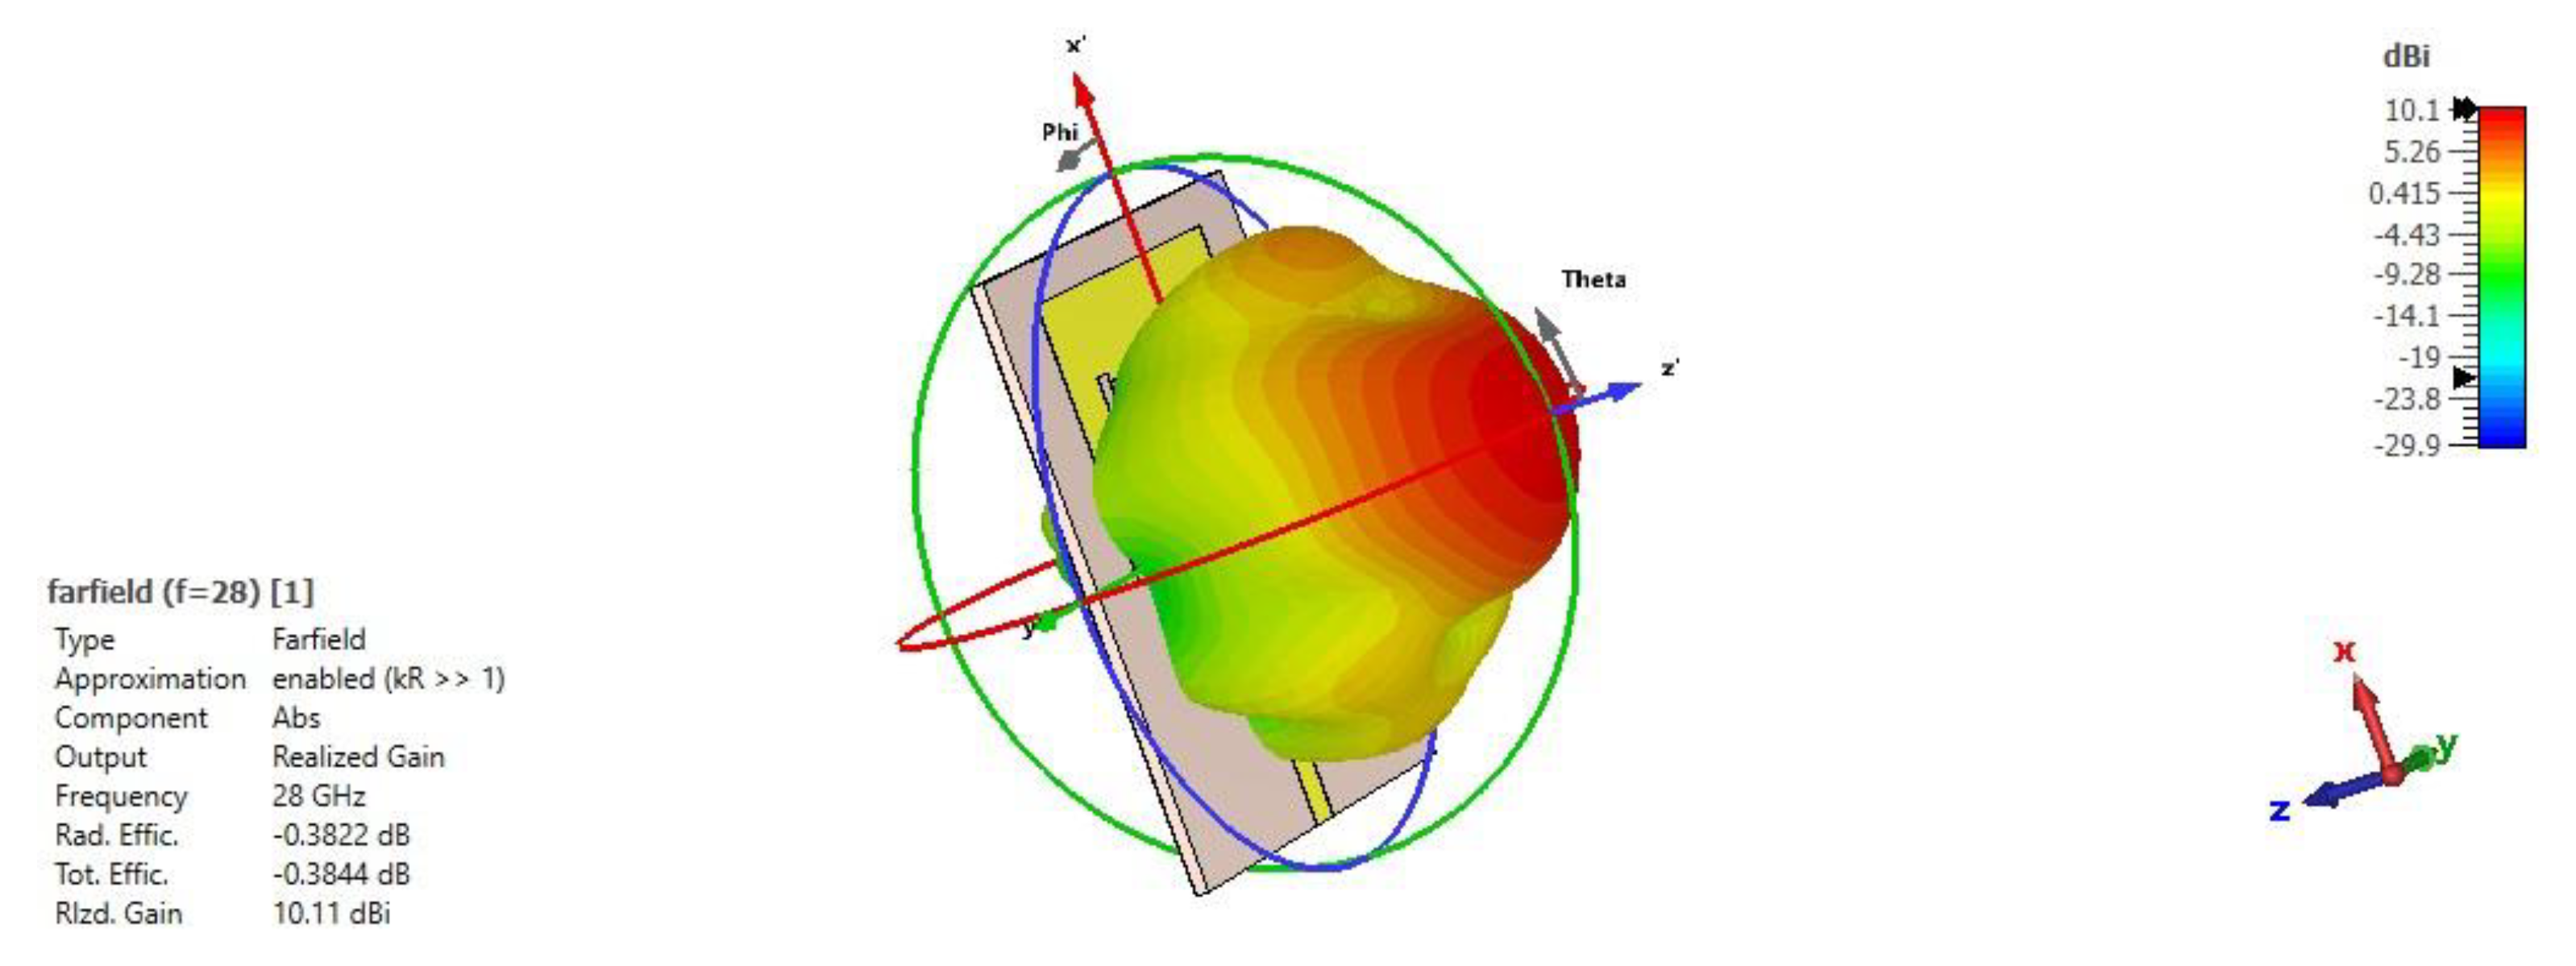
Figure 9.
VSWR of the proposed MPA.
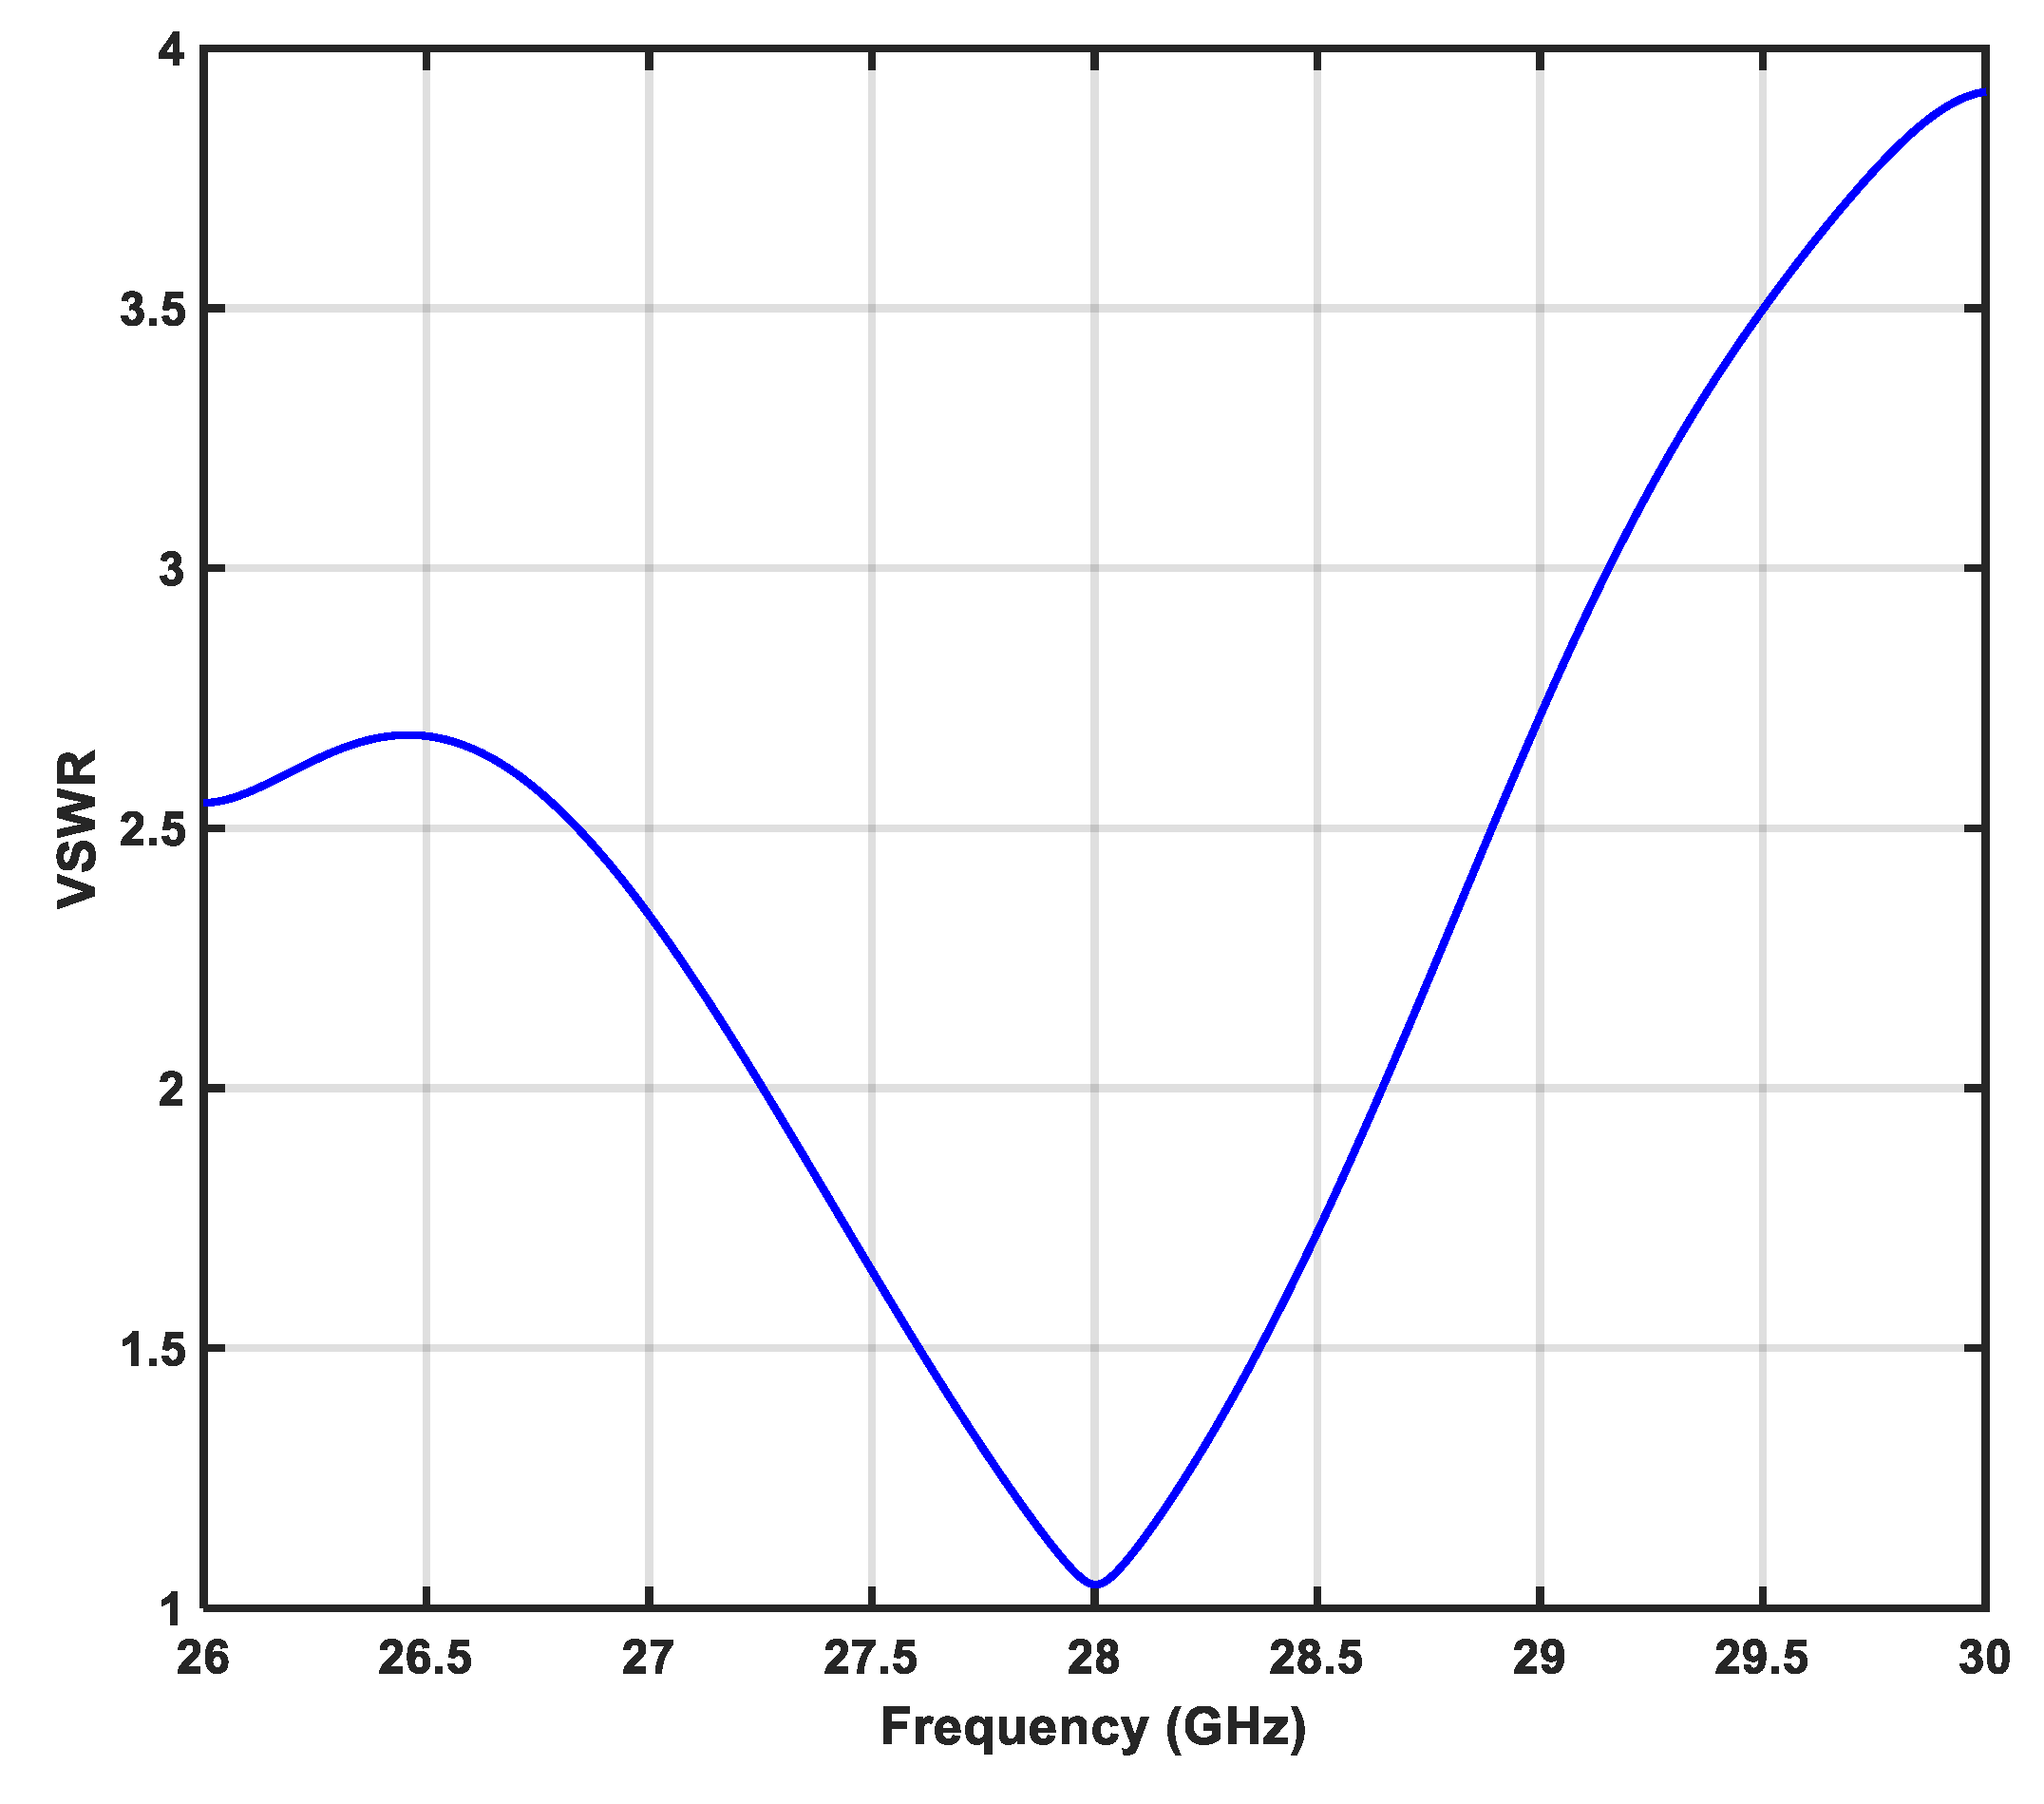
Figure 10.
Efficiency of the proposed MPA.
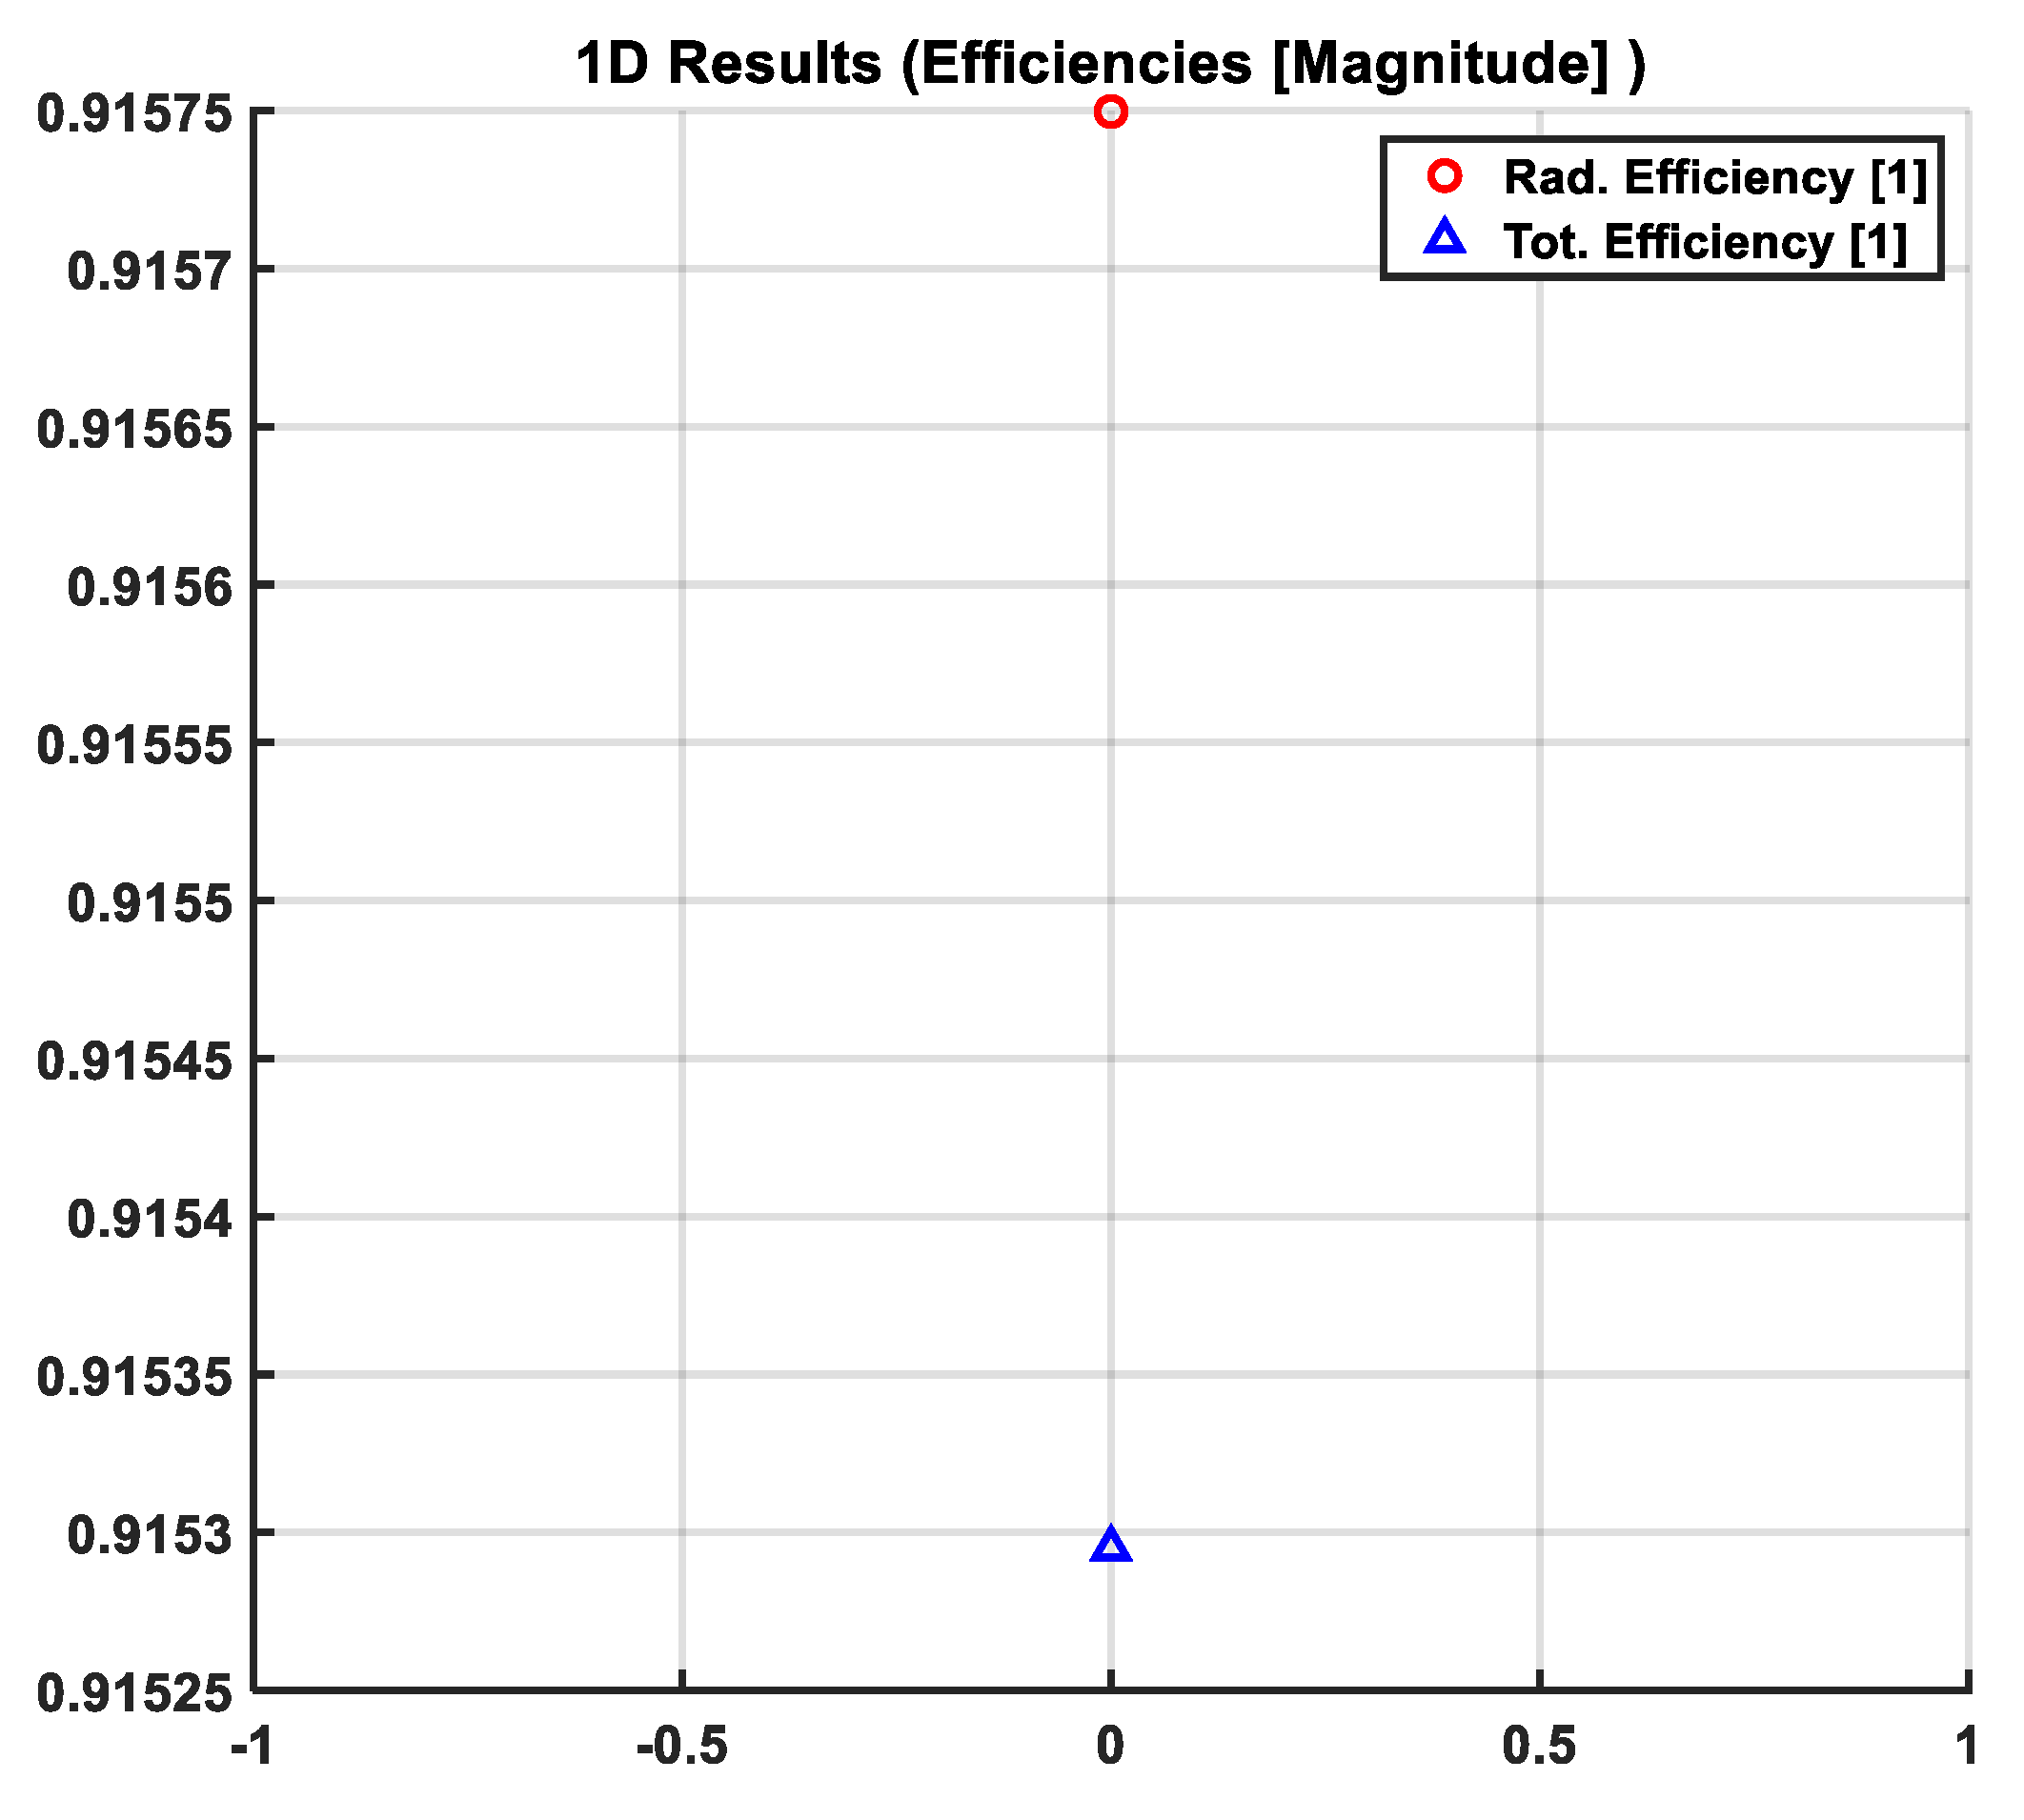
Figure 11.
Surface current distribution of the proposed MPA.
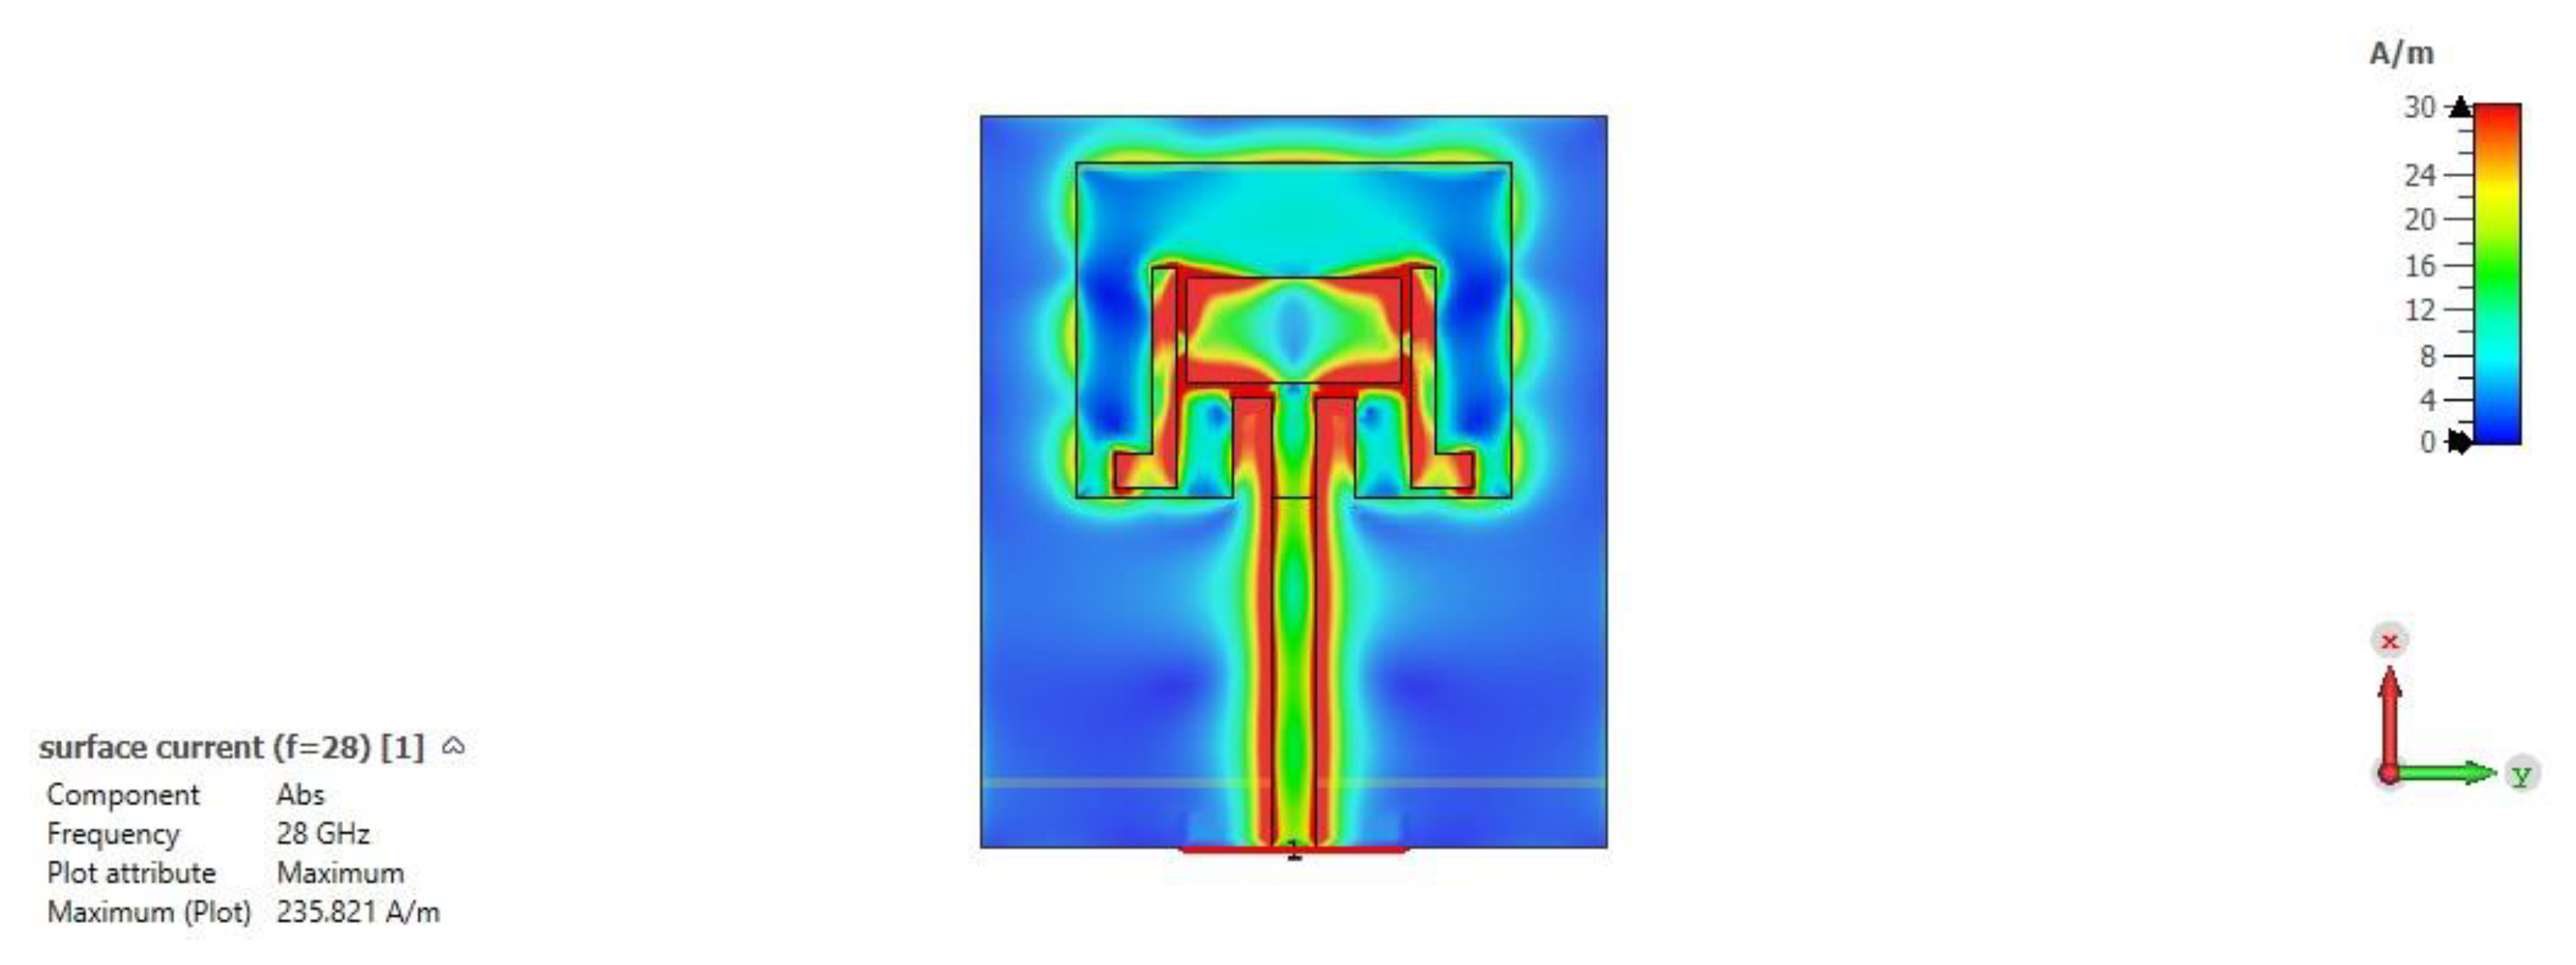
Figure 12.
Reference impedance of the proposed MPA.
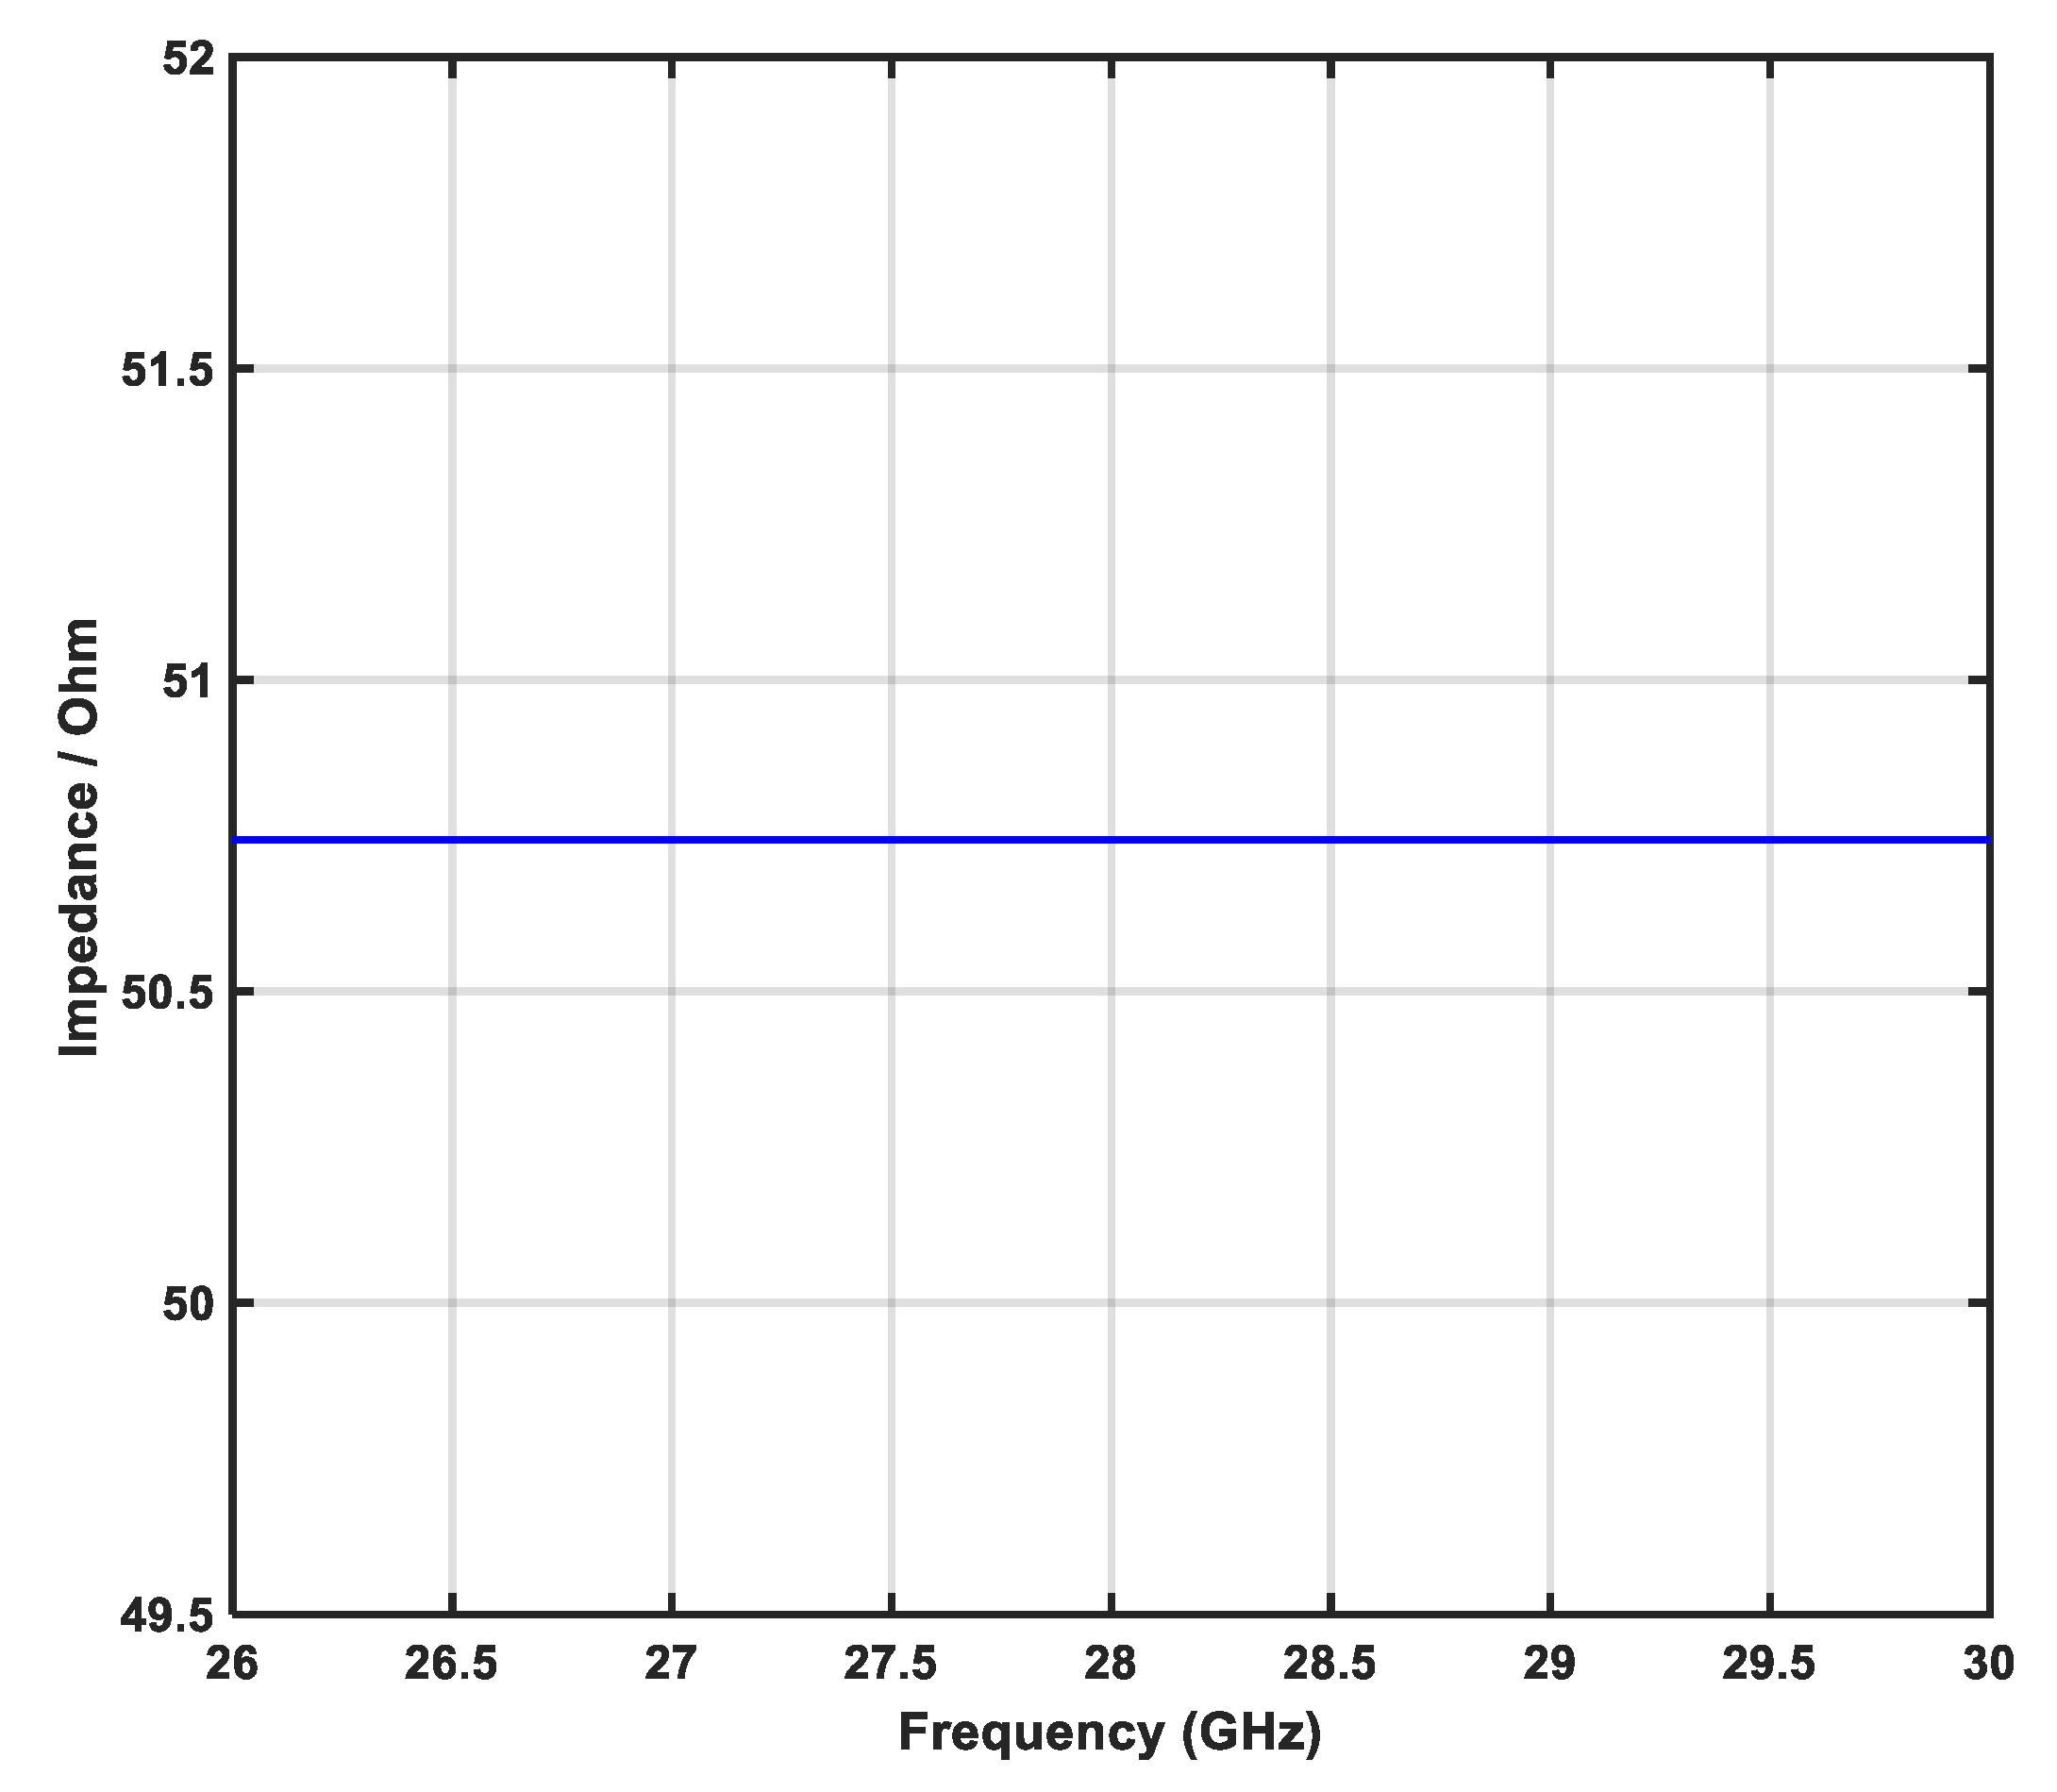
Figure 13.
Input impedance of the proposed MPA.
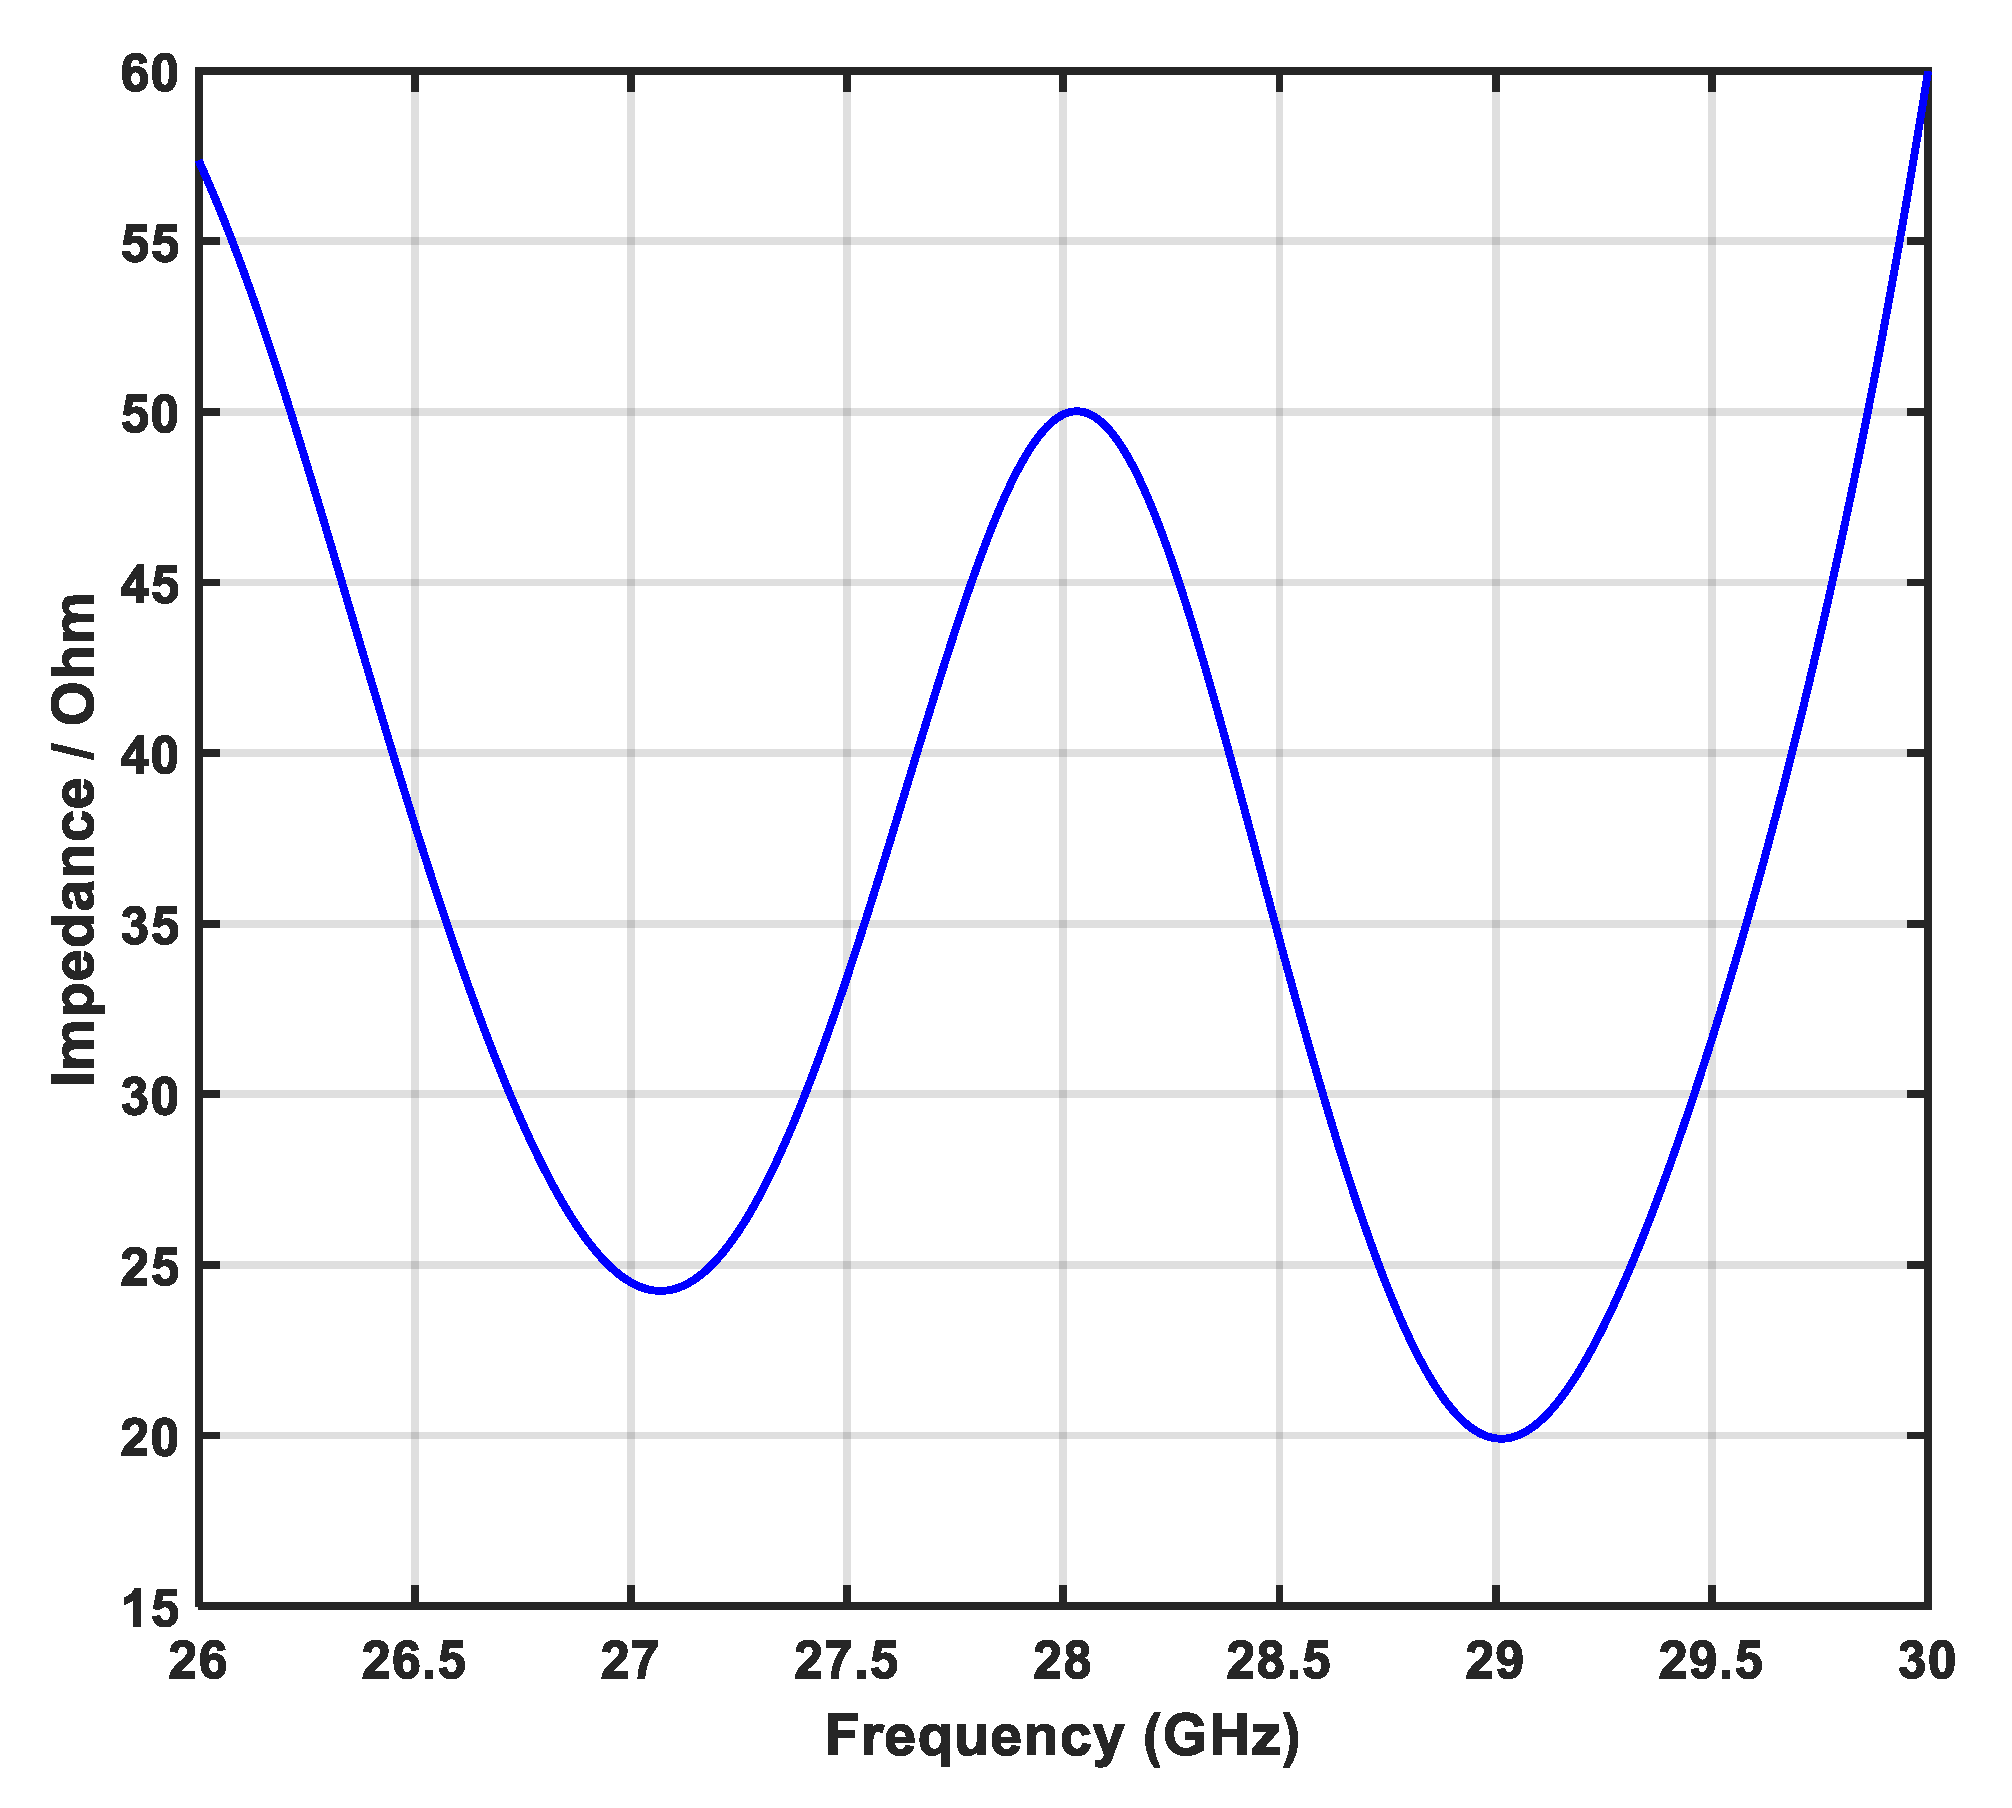
Figure 14.
Measured S-Parameter.
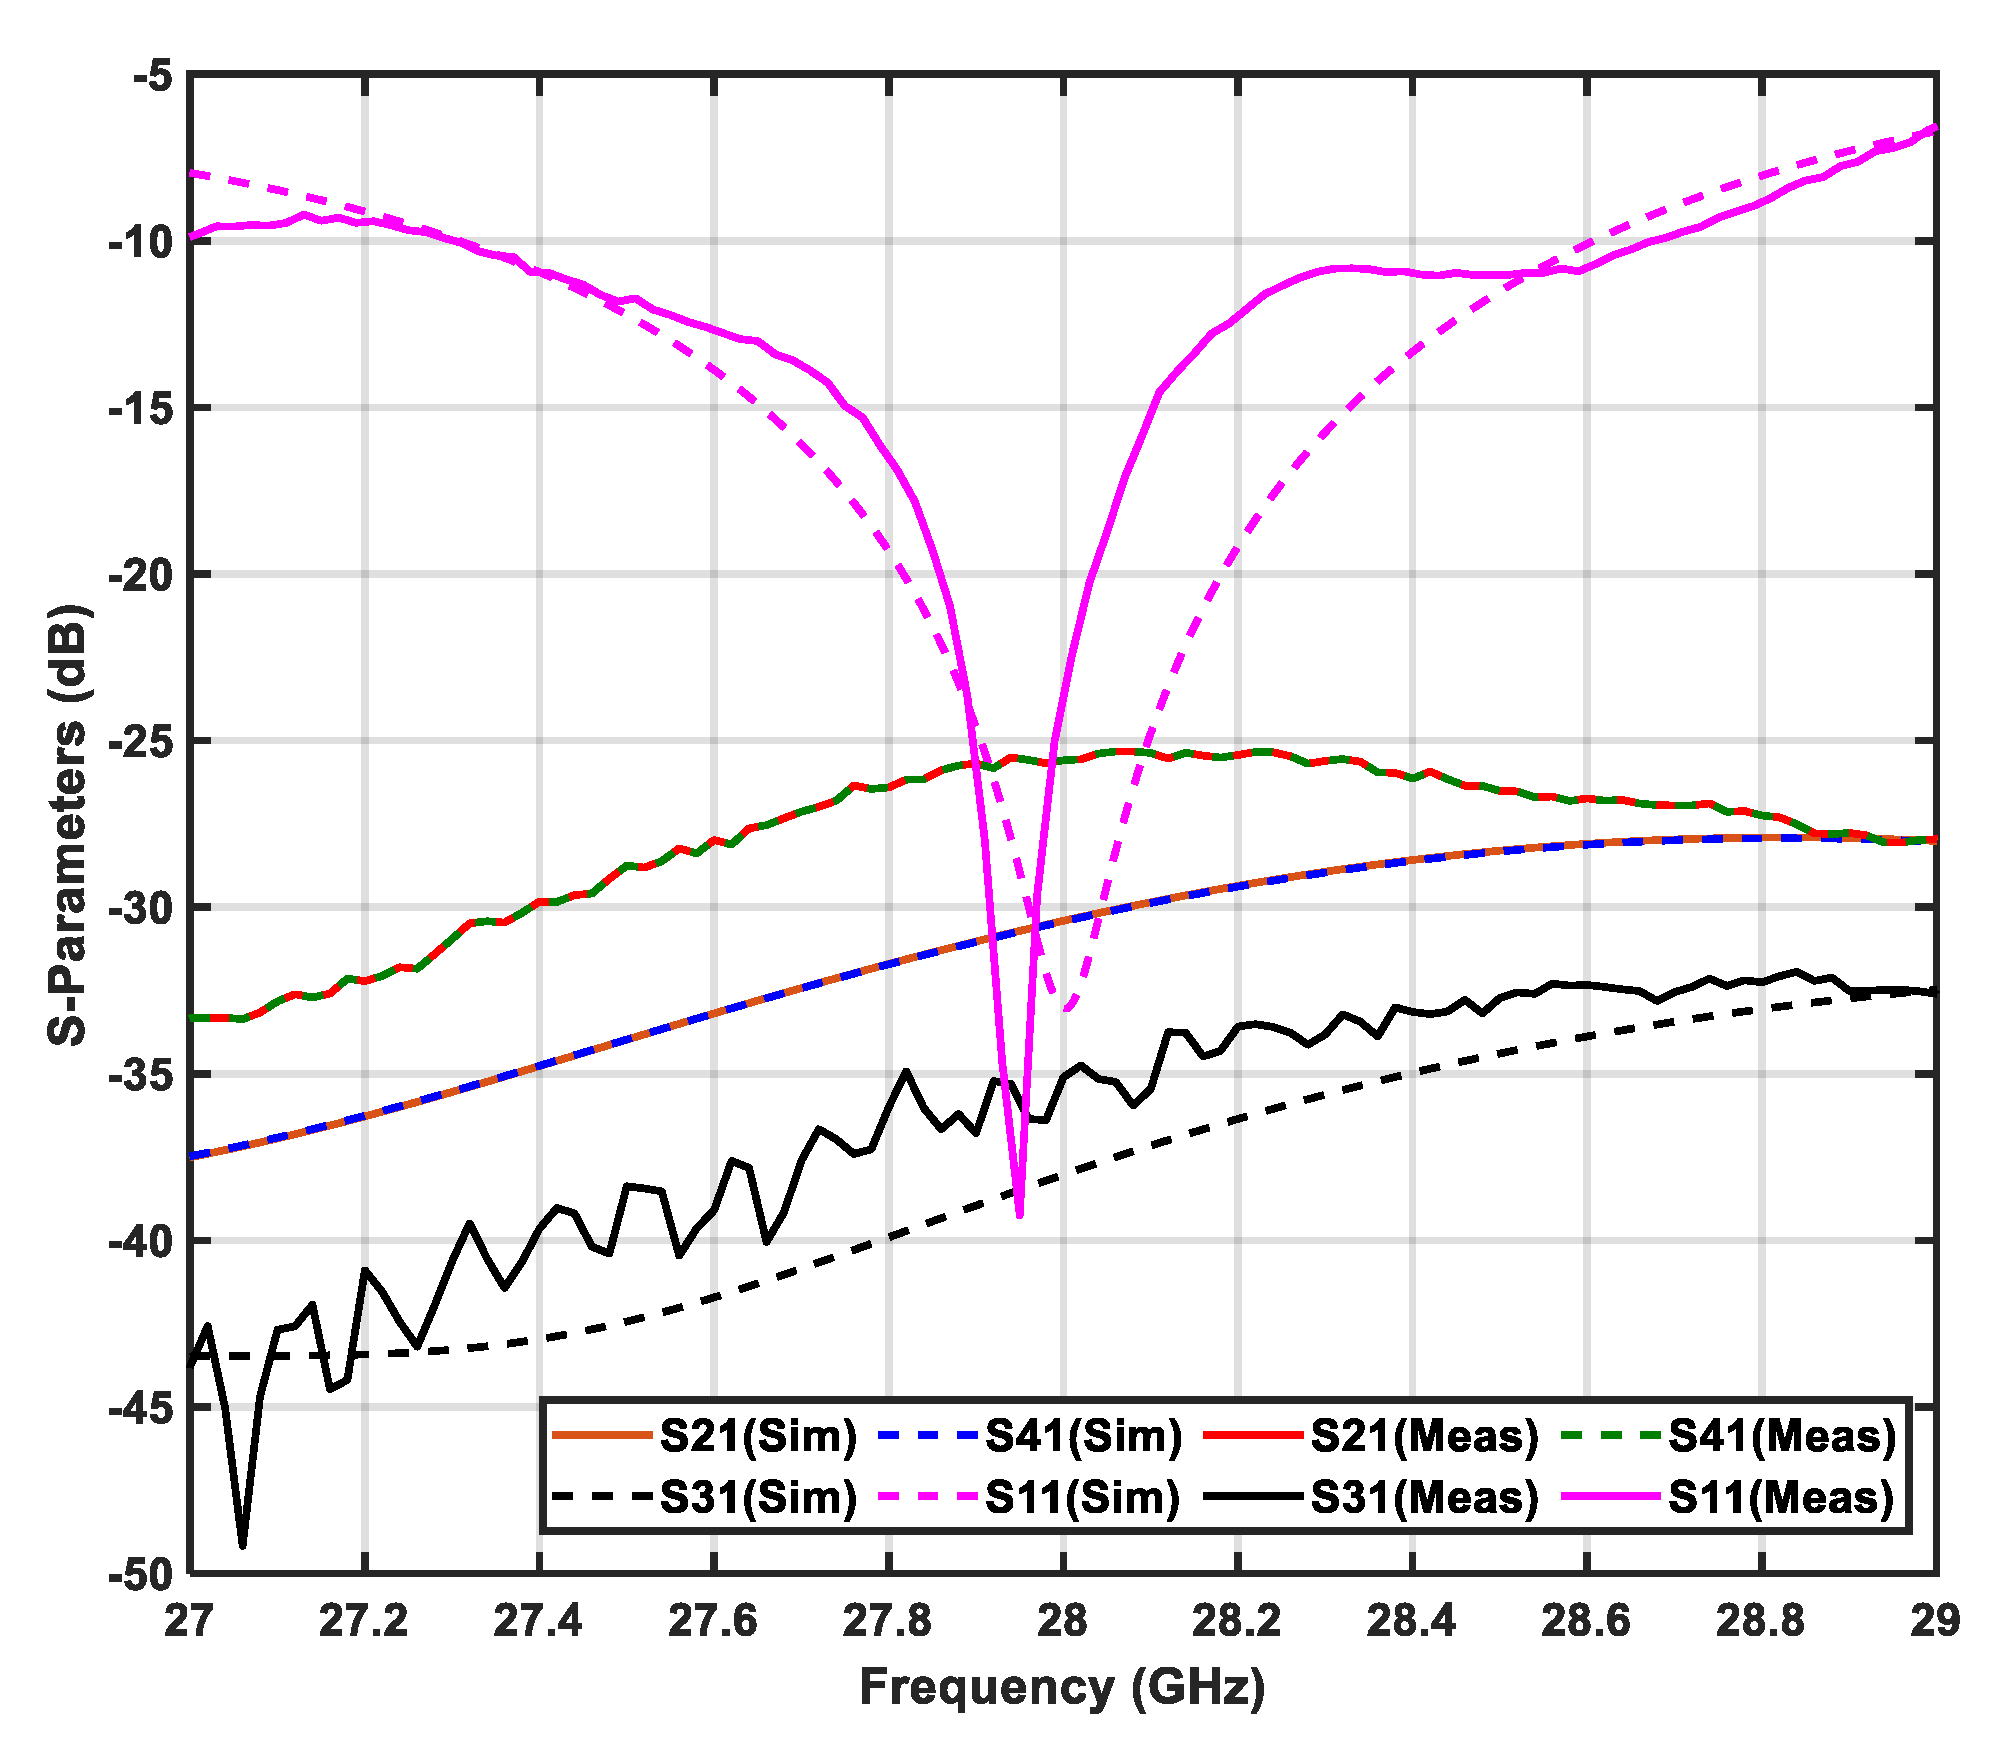
Figure 15.
3-D-Radiation pattern and gain.
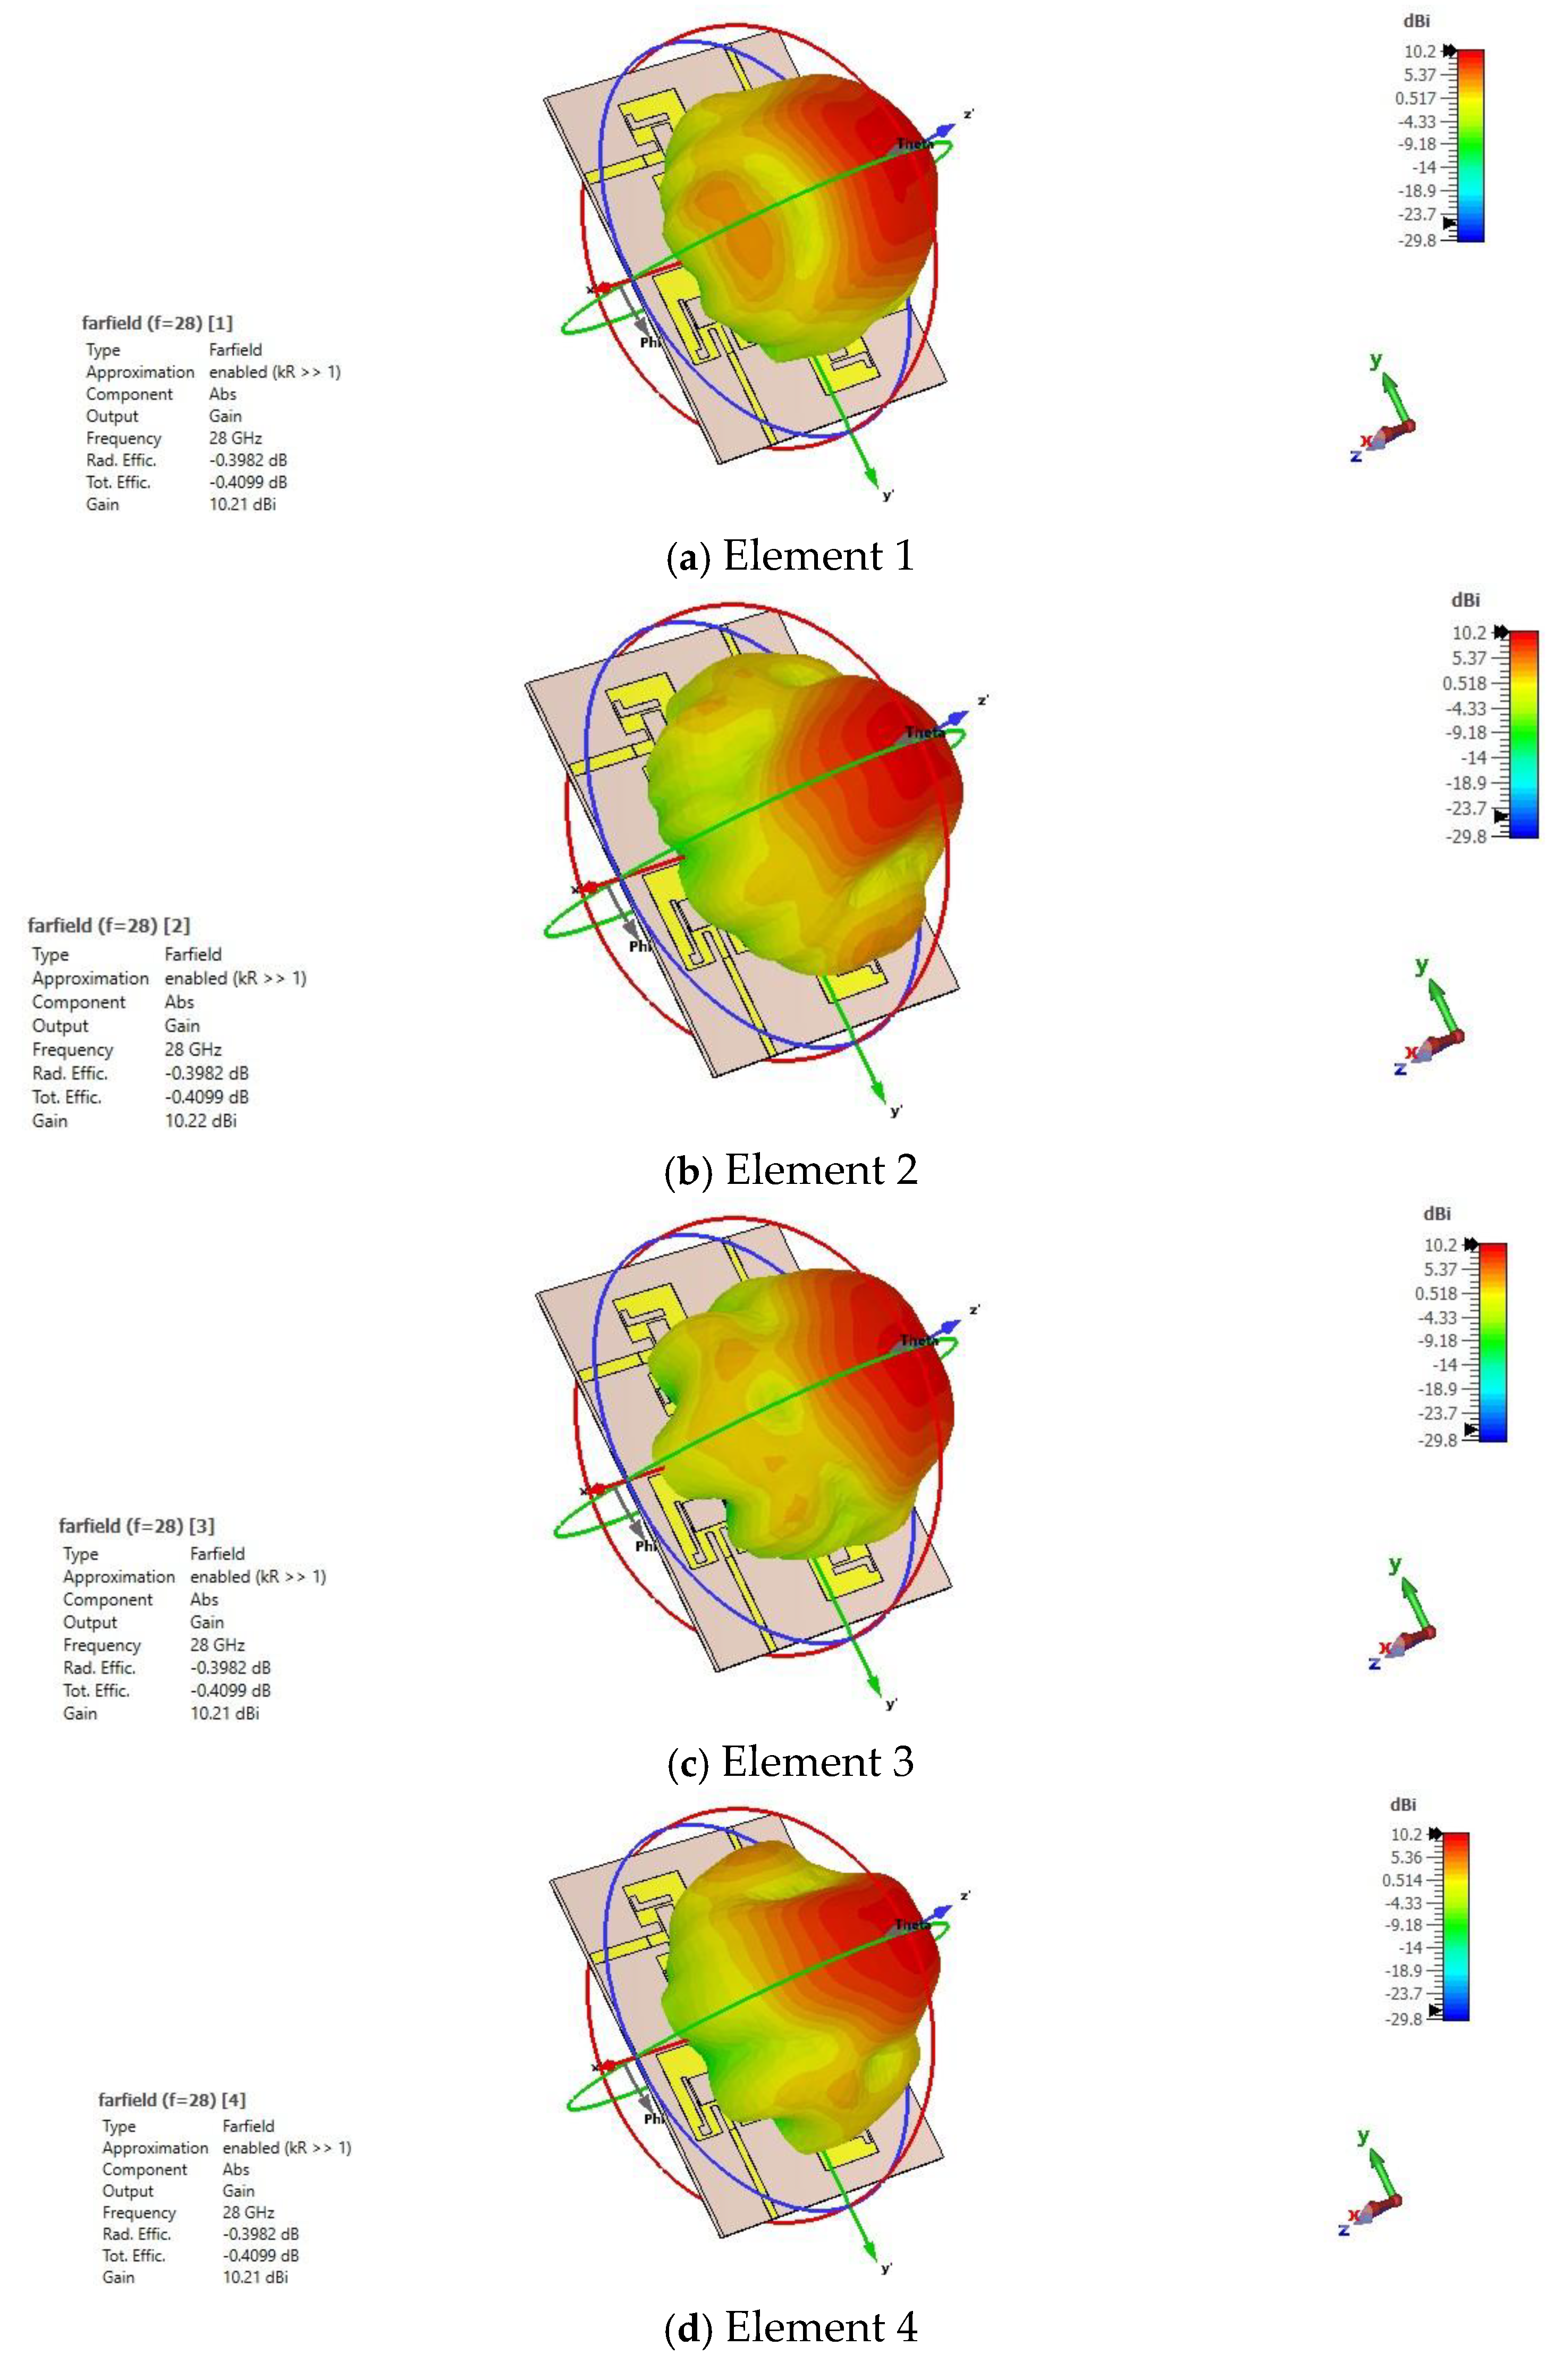
Figure 16.
Gain at phi=90, (a) for element 1, (b) for element 2, (c) for element 3, (d) for element 4.
Figure 16.
Gain at phi=90, (a) for element 1, (b) for element 2, (c) for element 3, (d) for element 4.
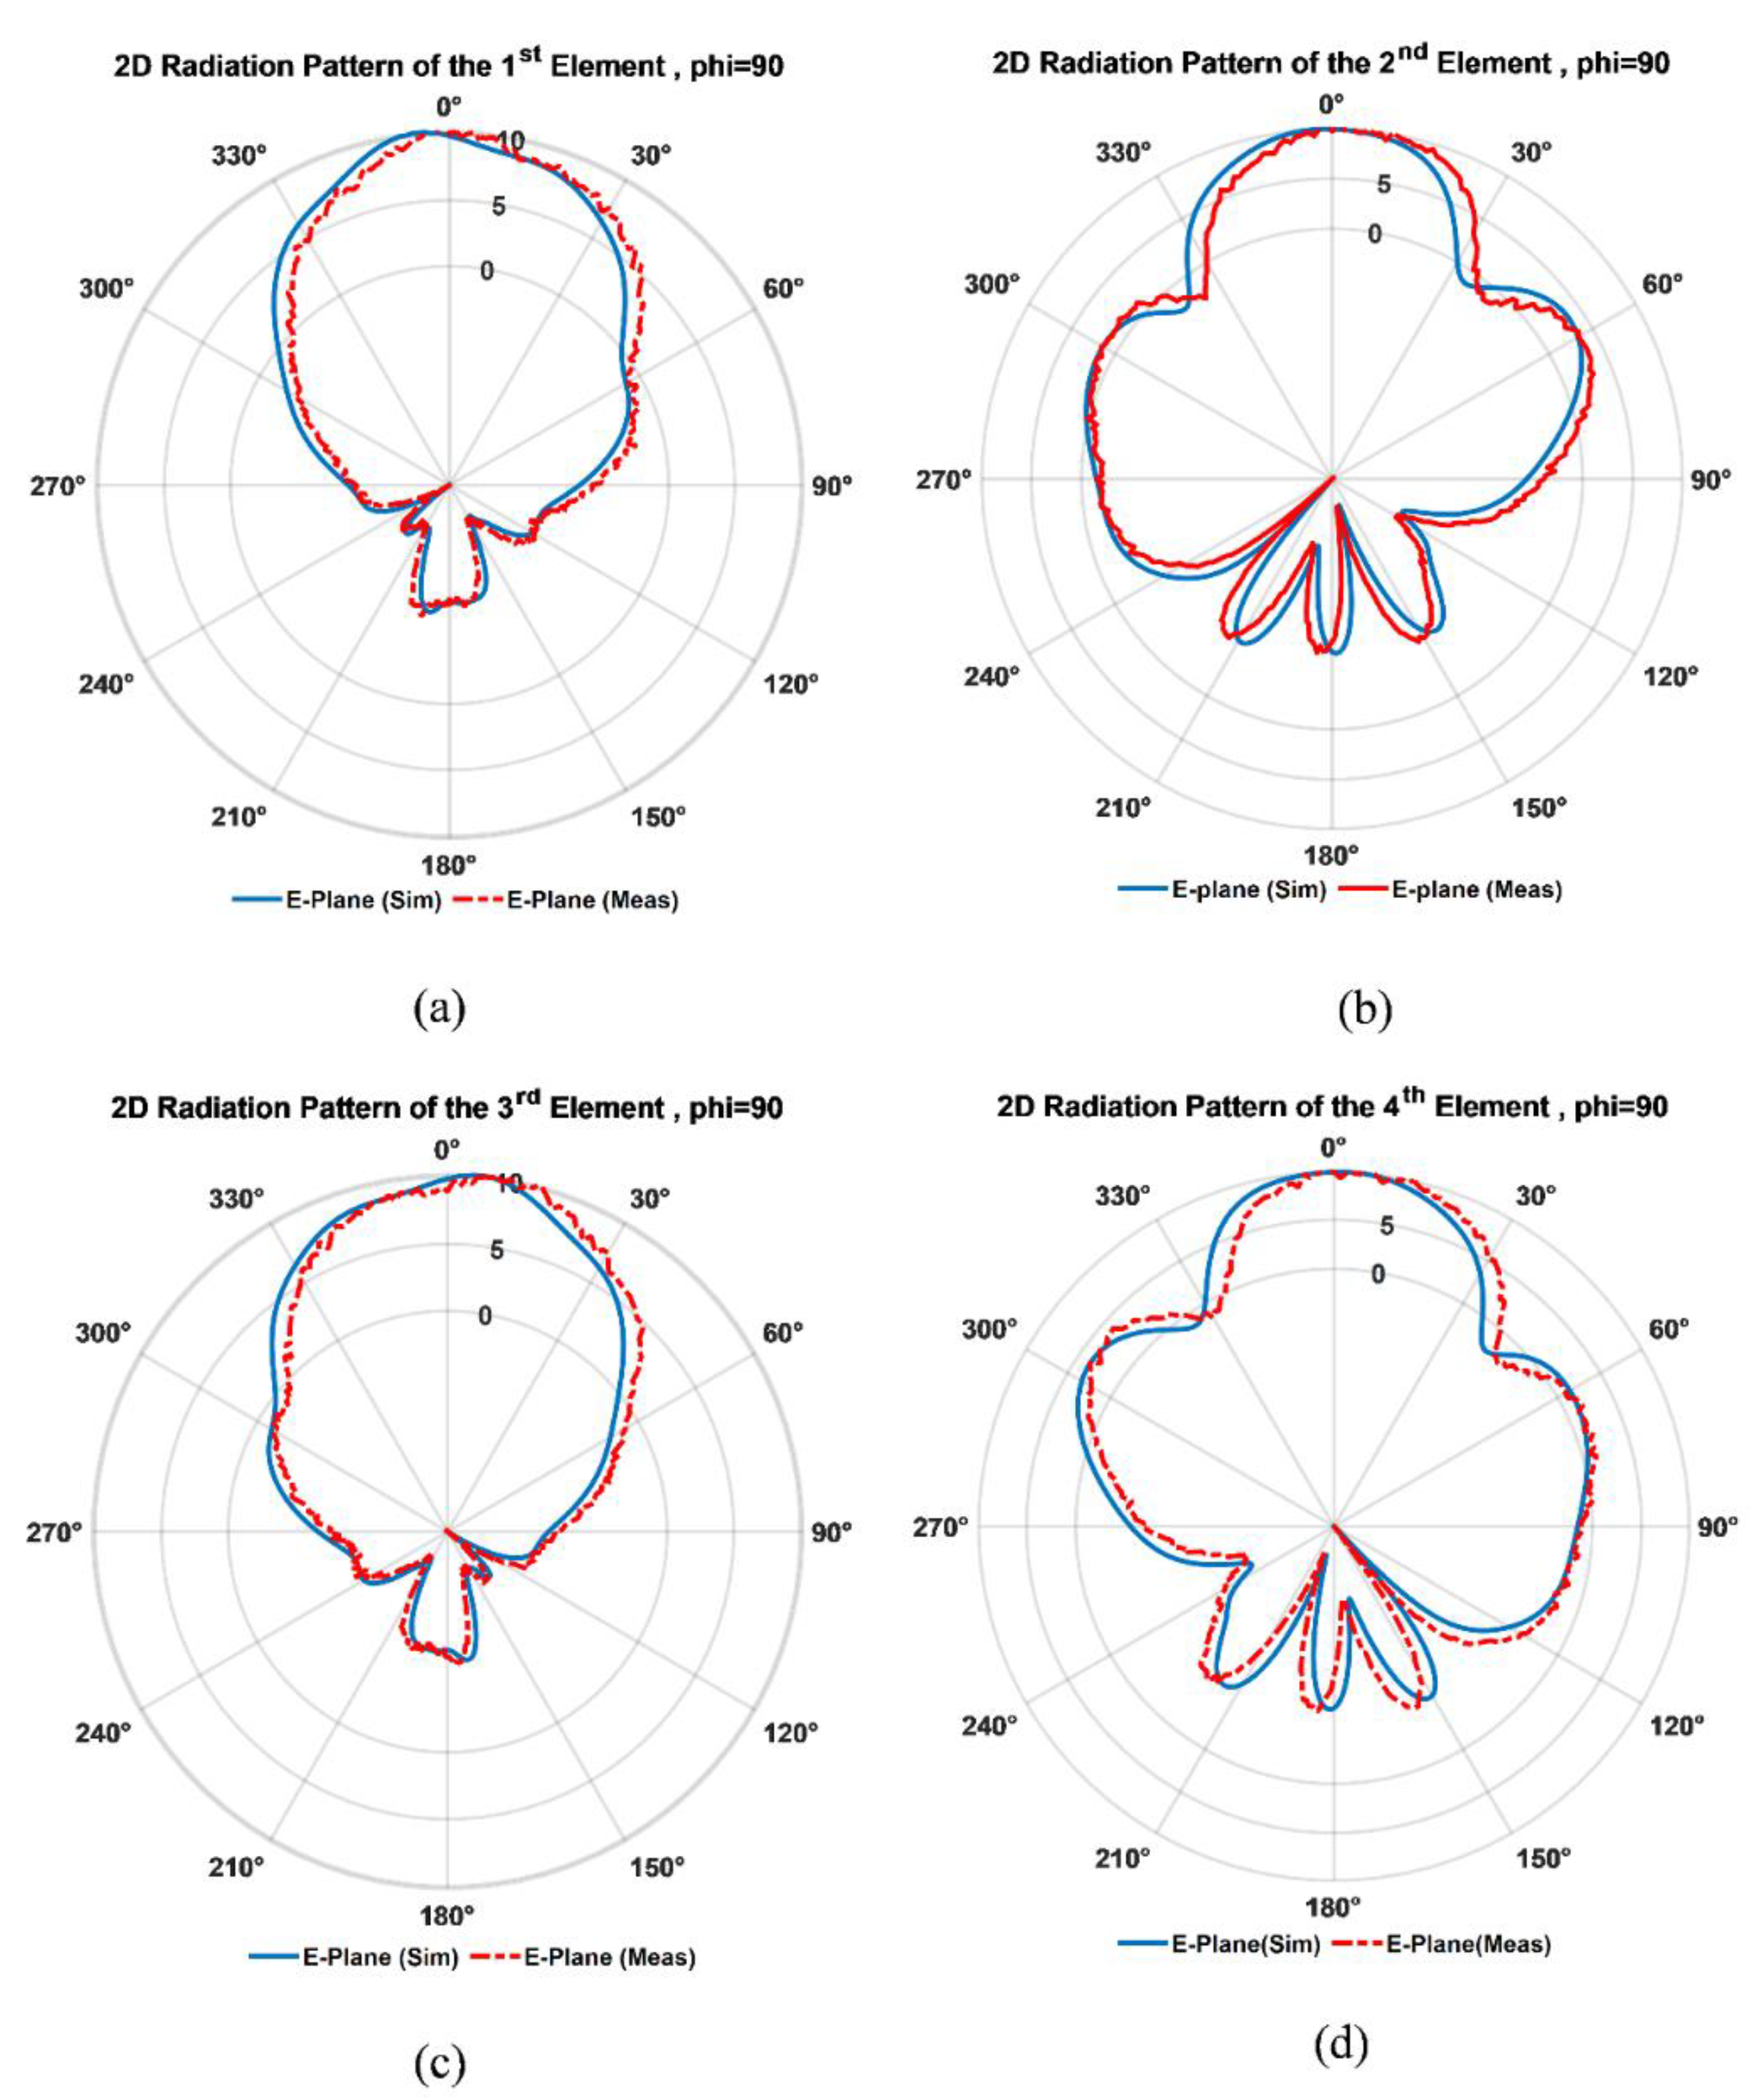
Figure 17.
Envelope correlation coefficient of port 1.
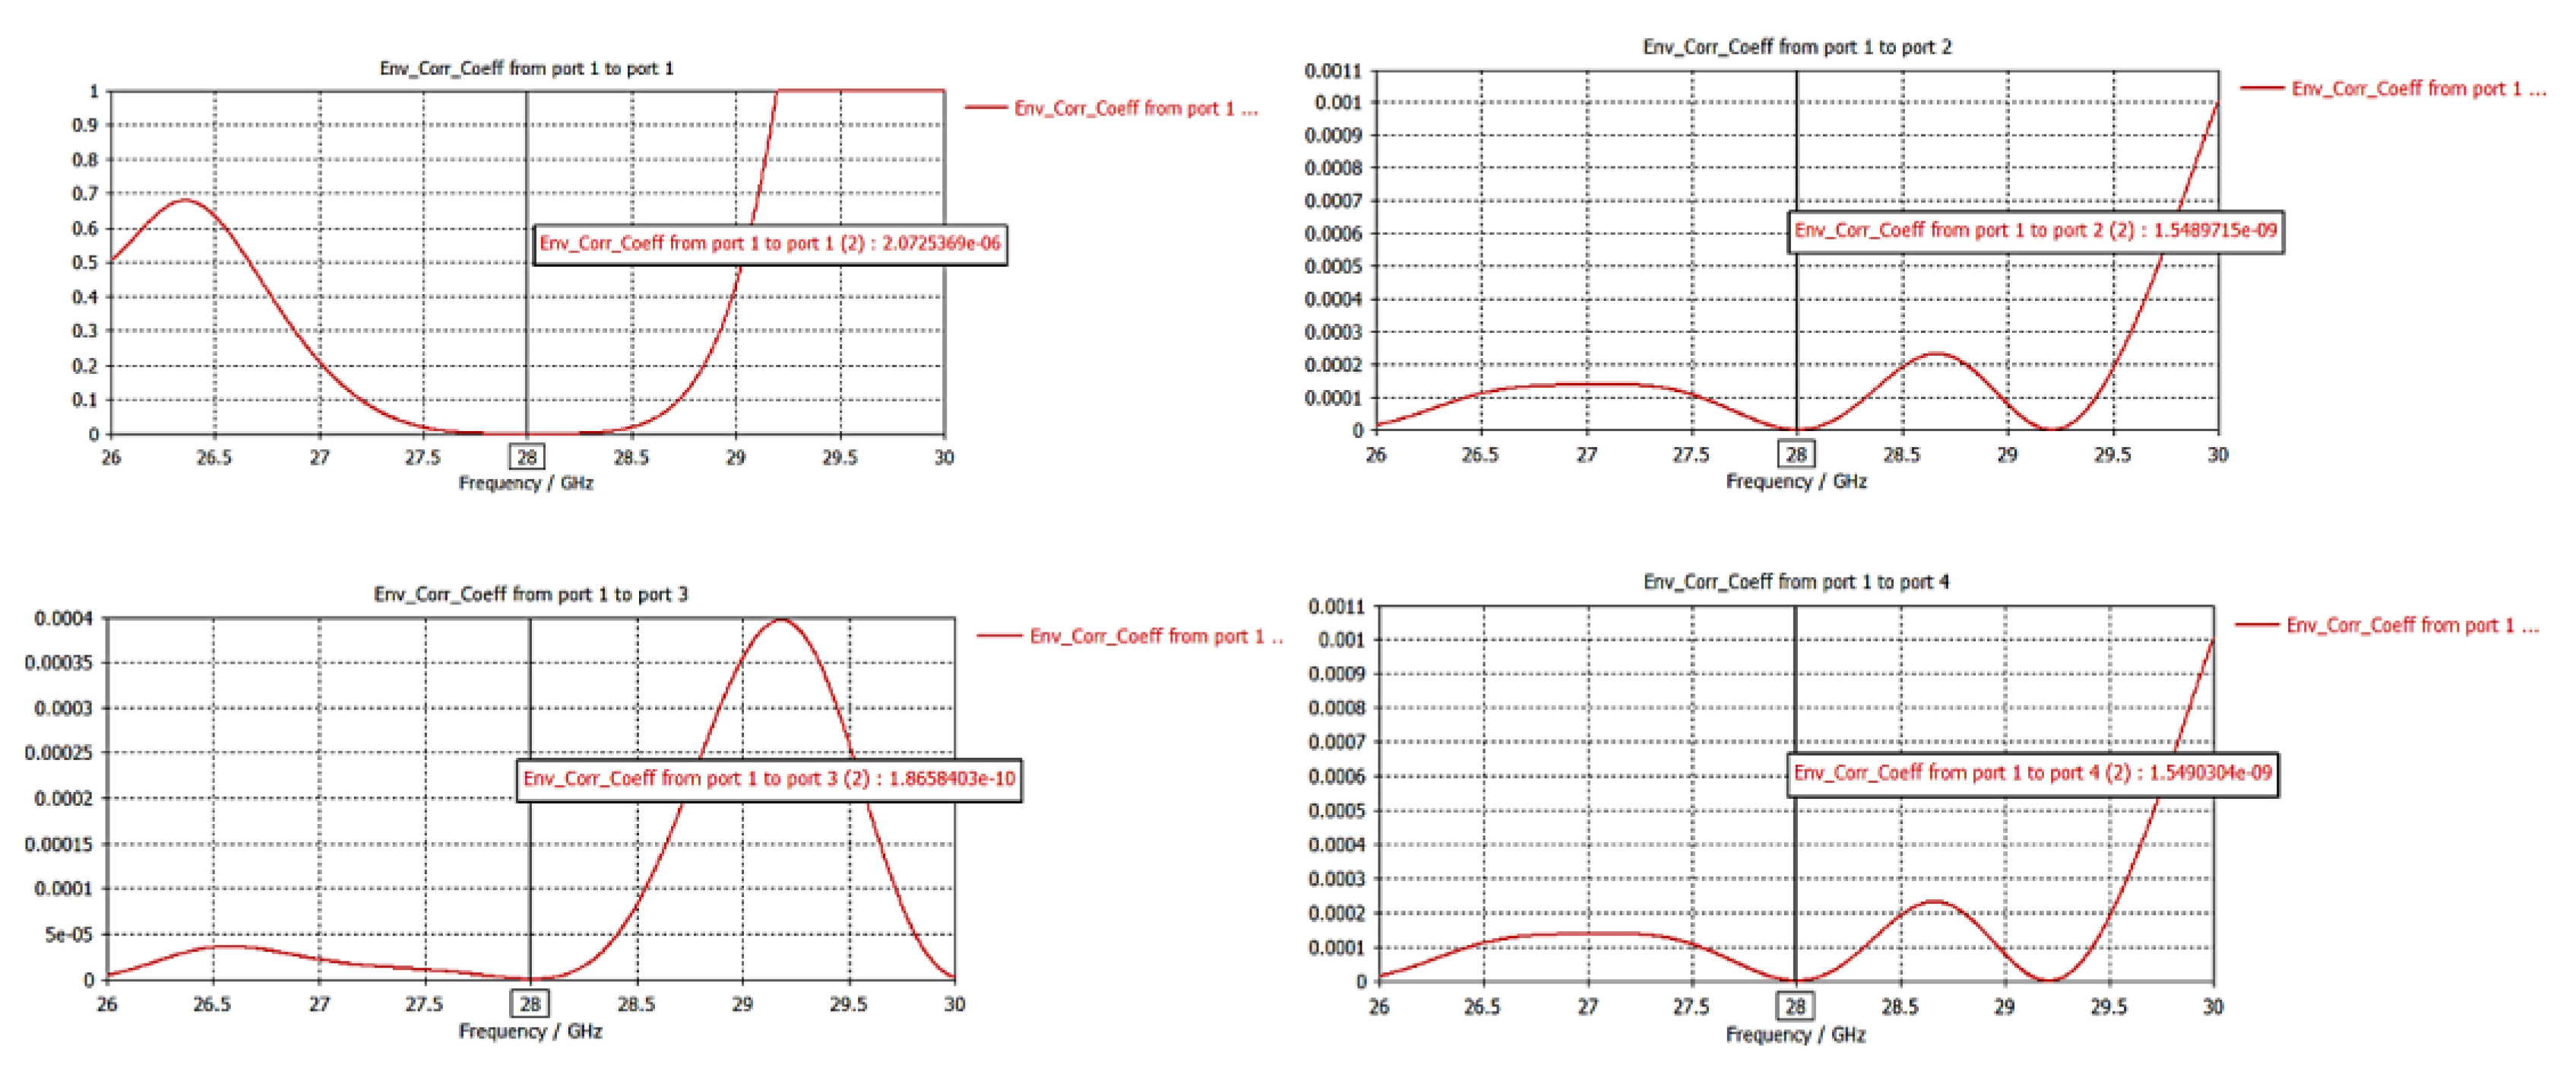
Figure 18.
Envelope correlation coefficient of port 2.
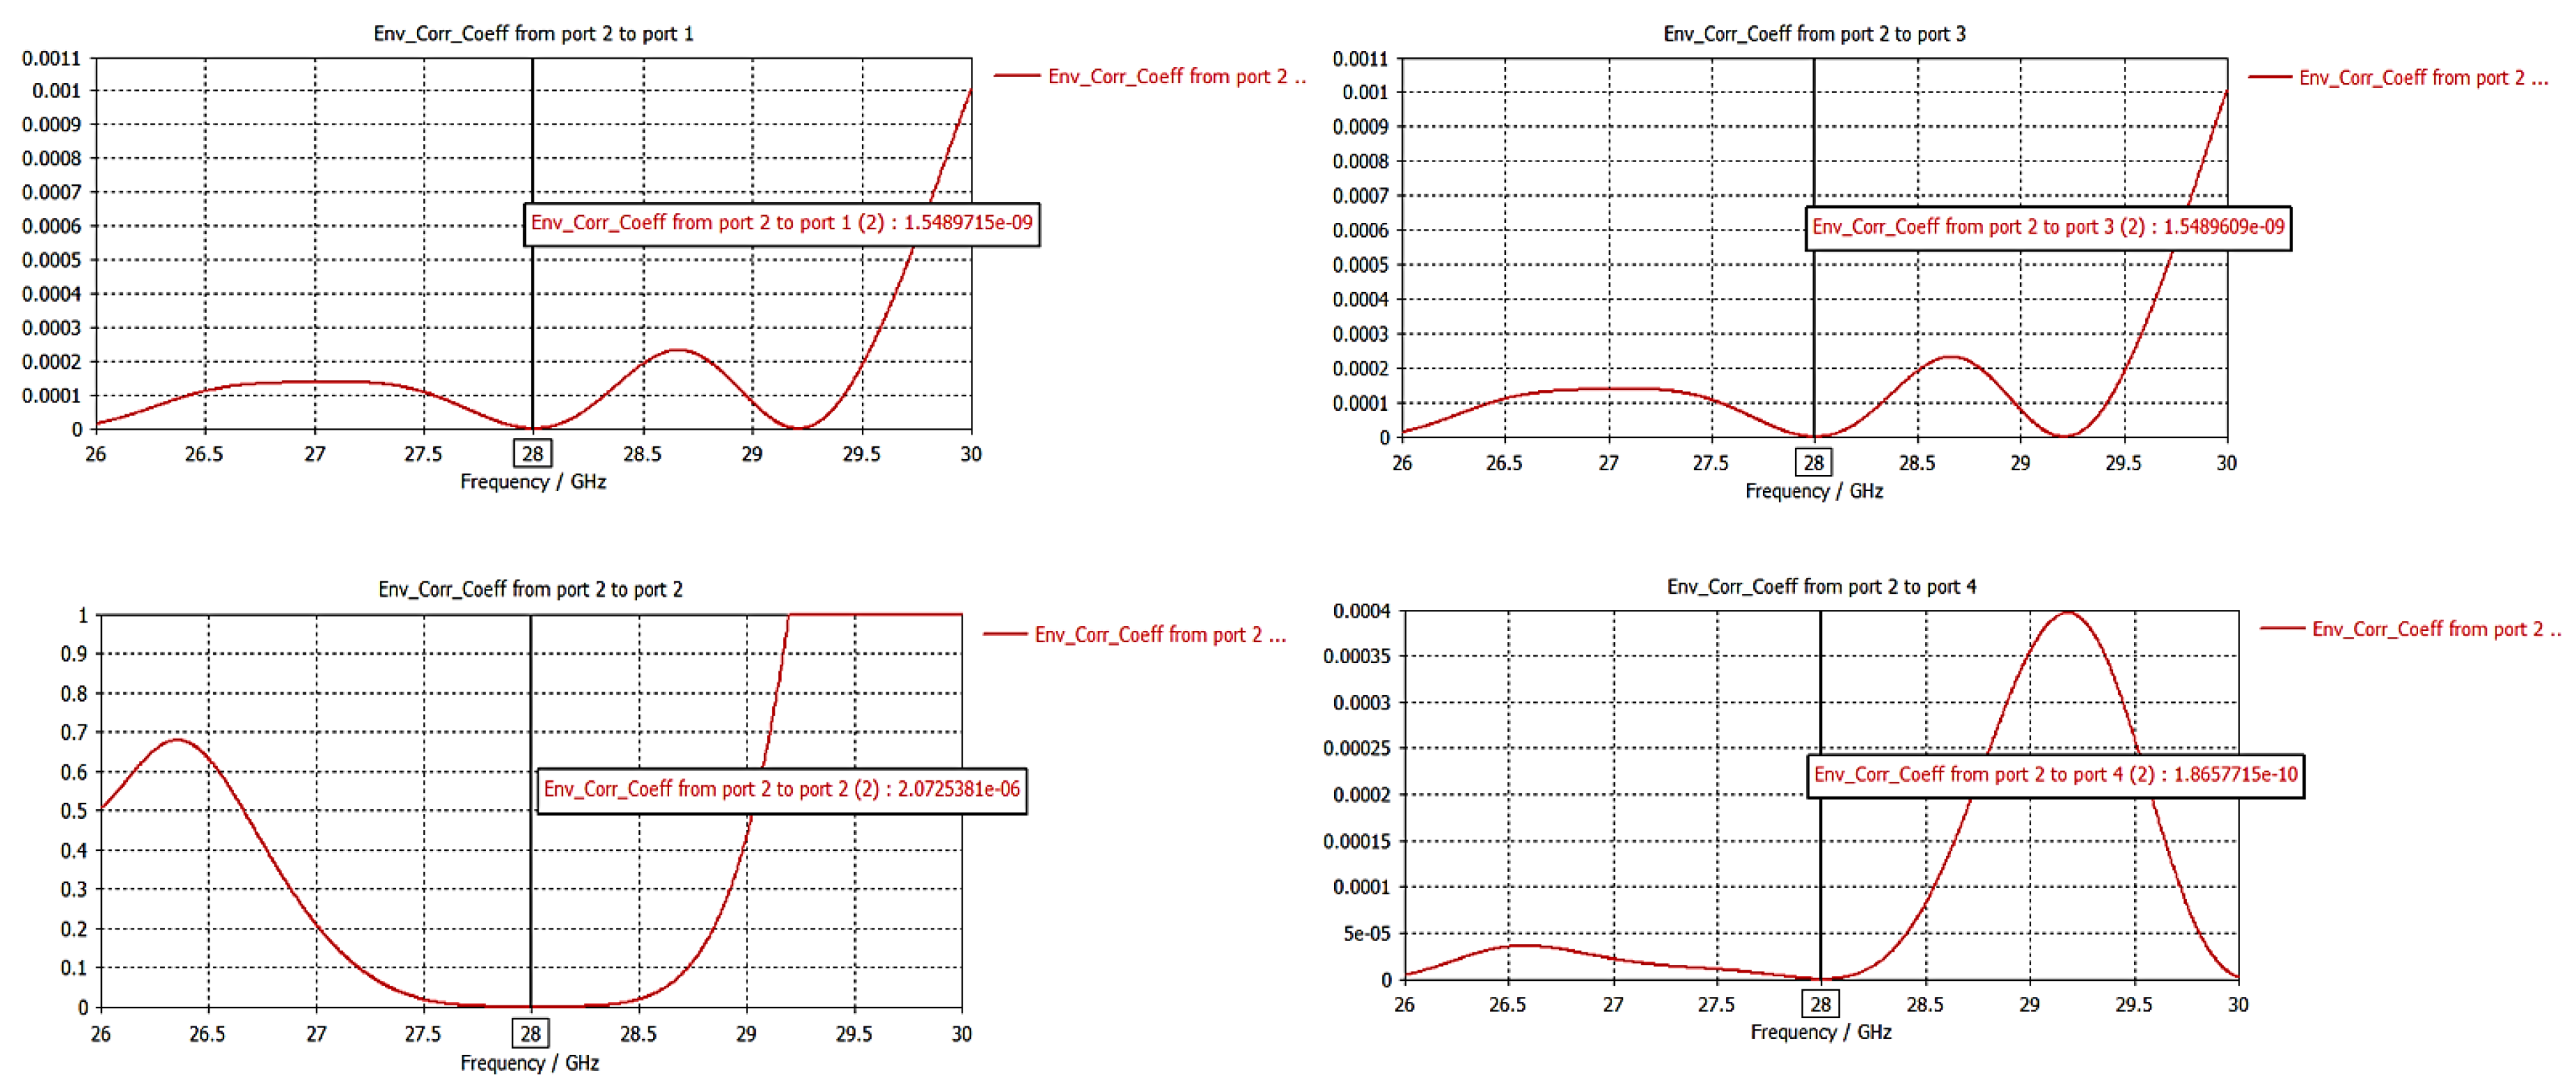
Figure 19.
Envelope correlation coefficient of port 3.
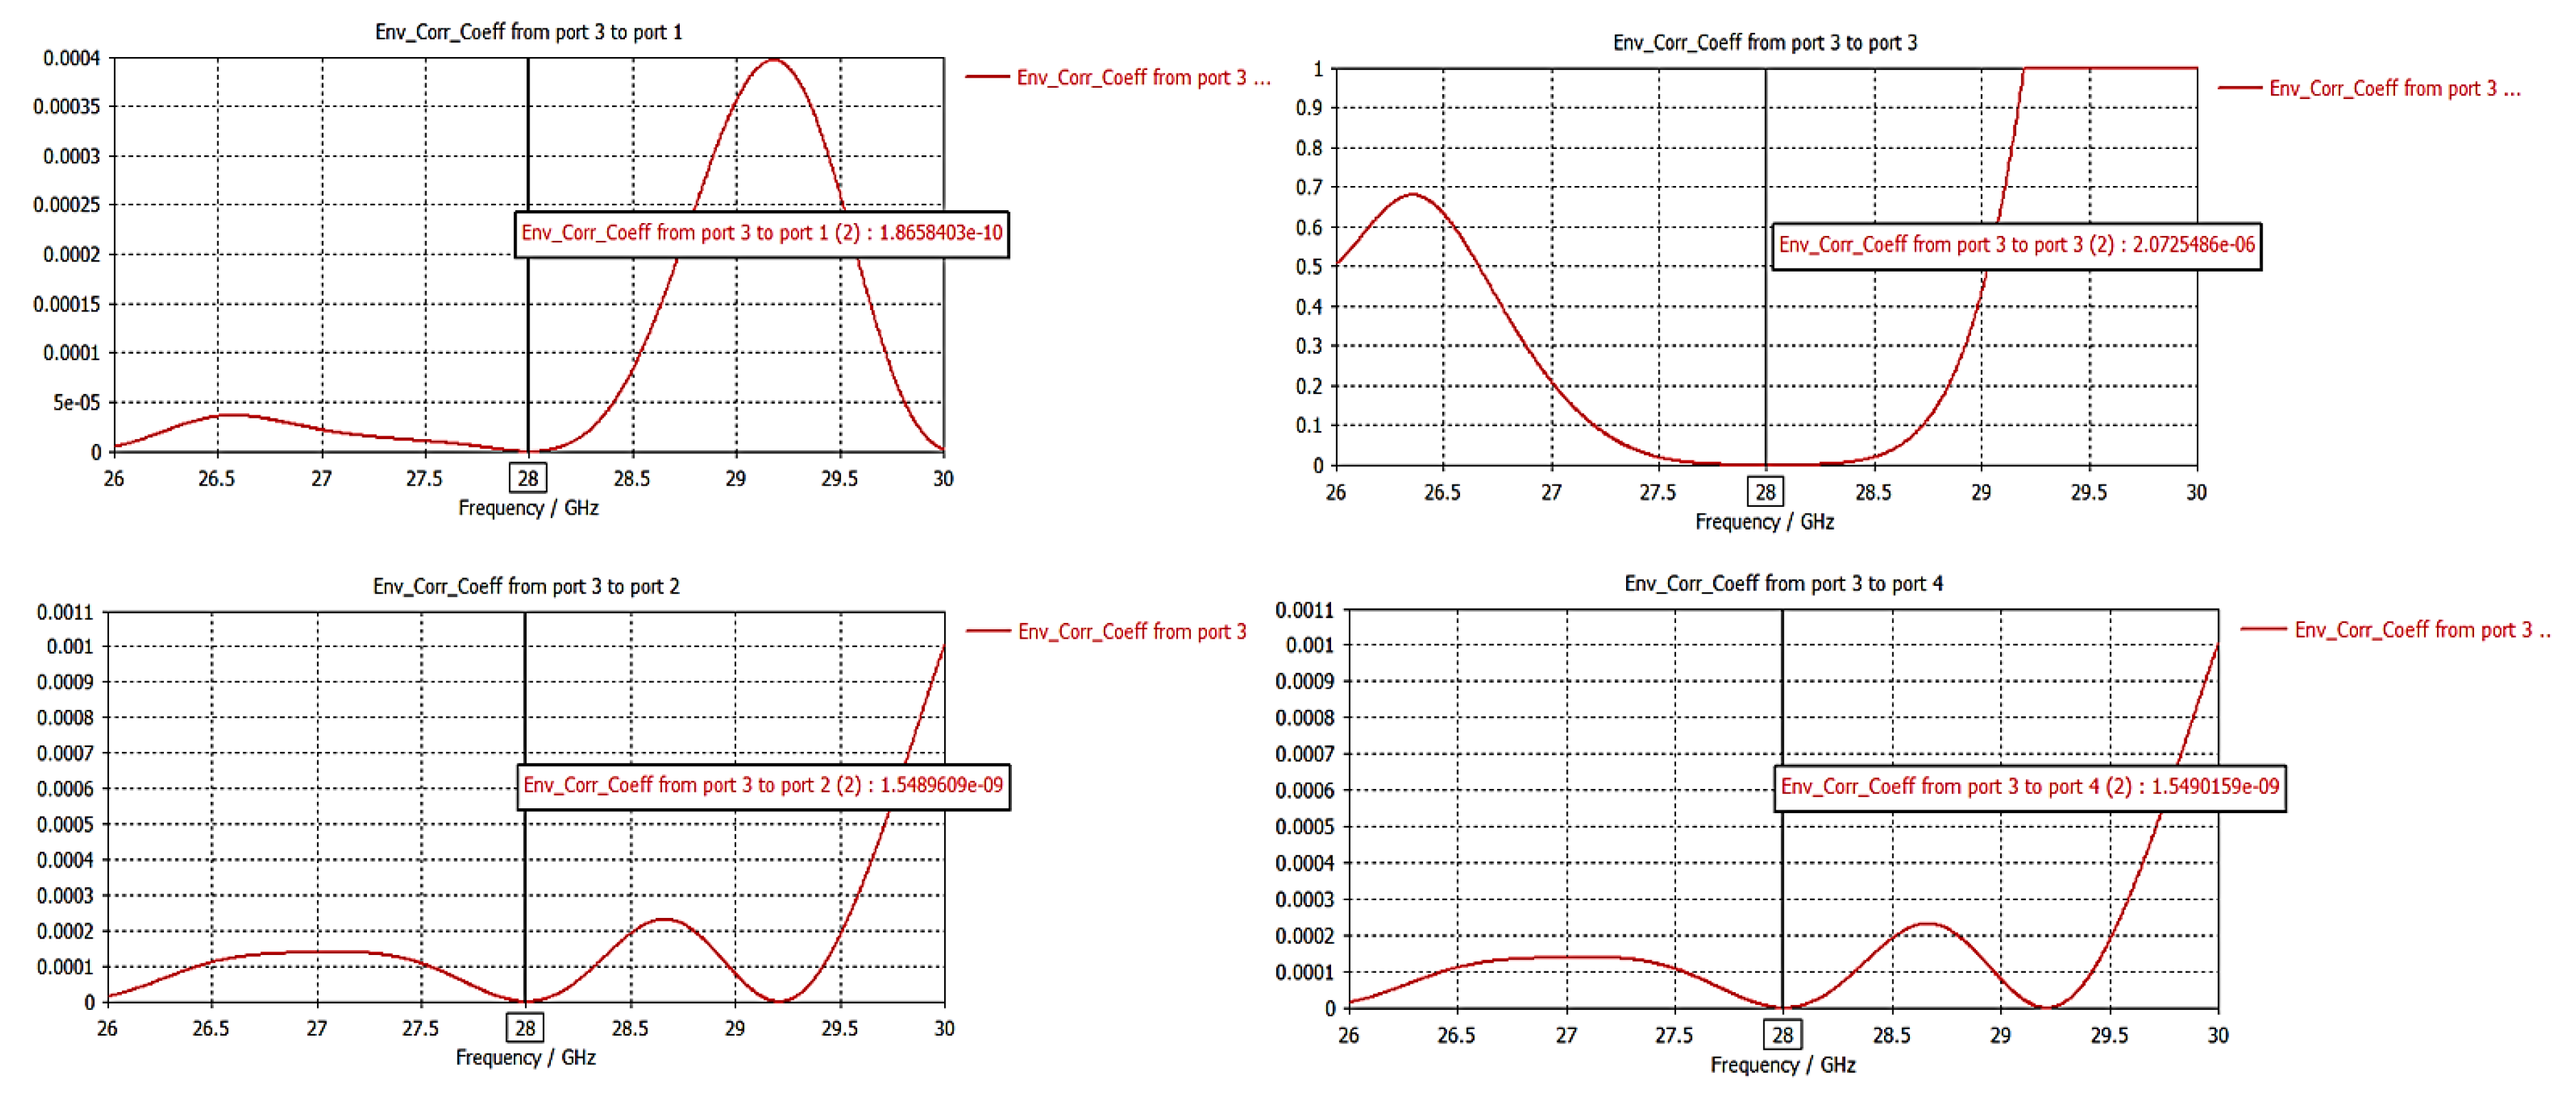
Figure 20.
Envelope correlation coefficient of port 4.
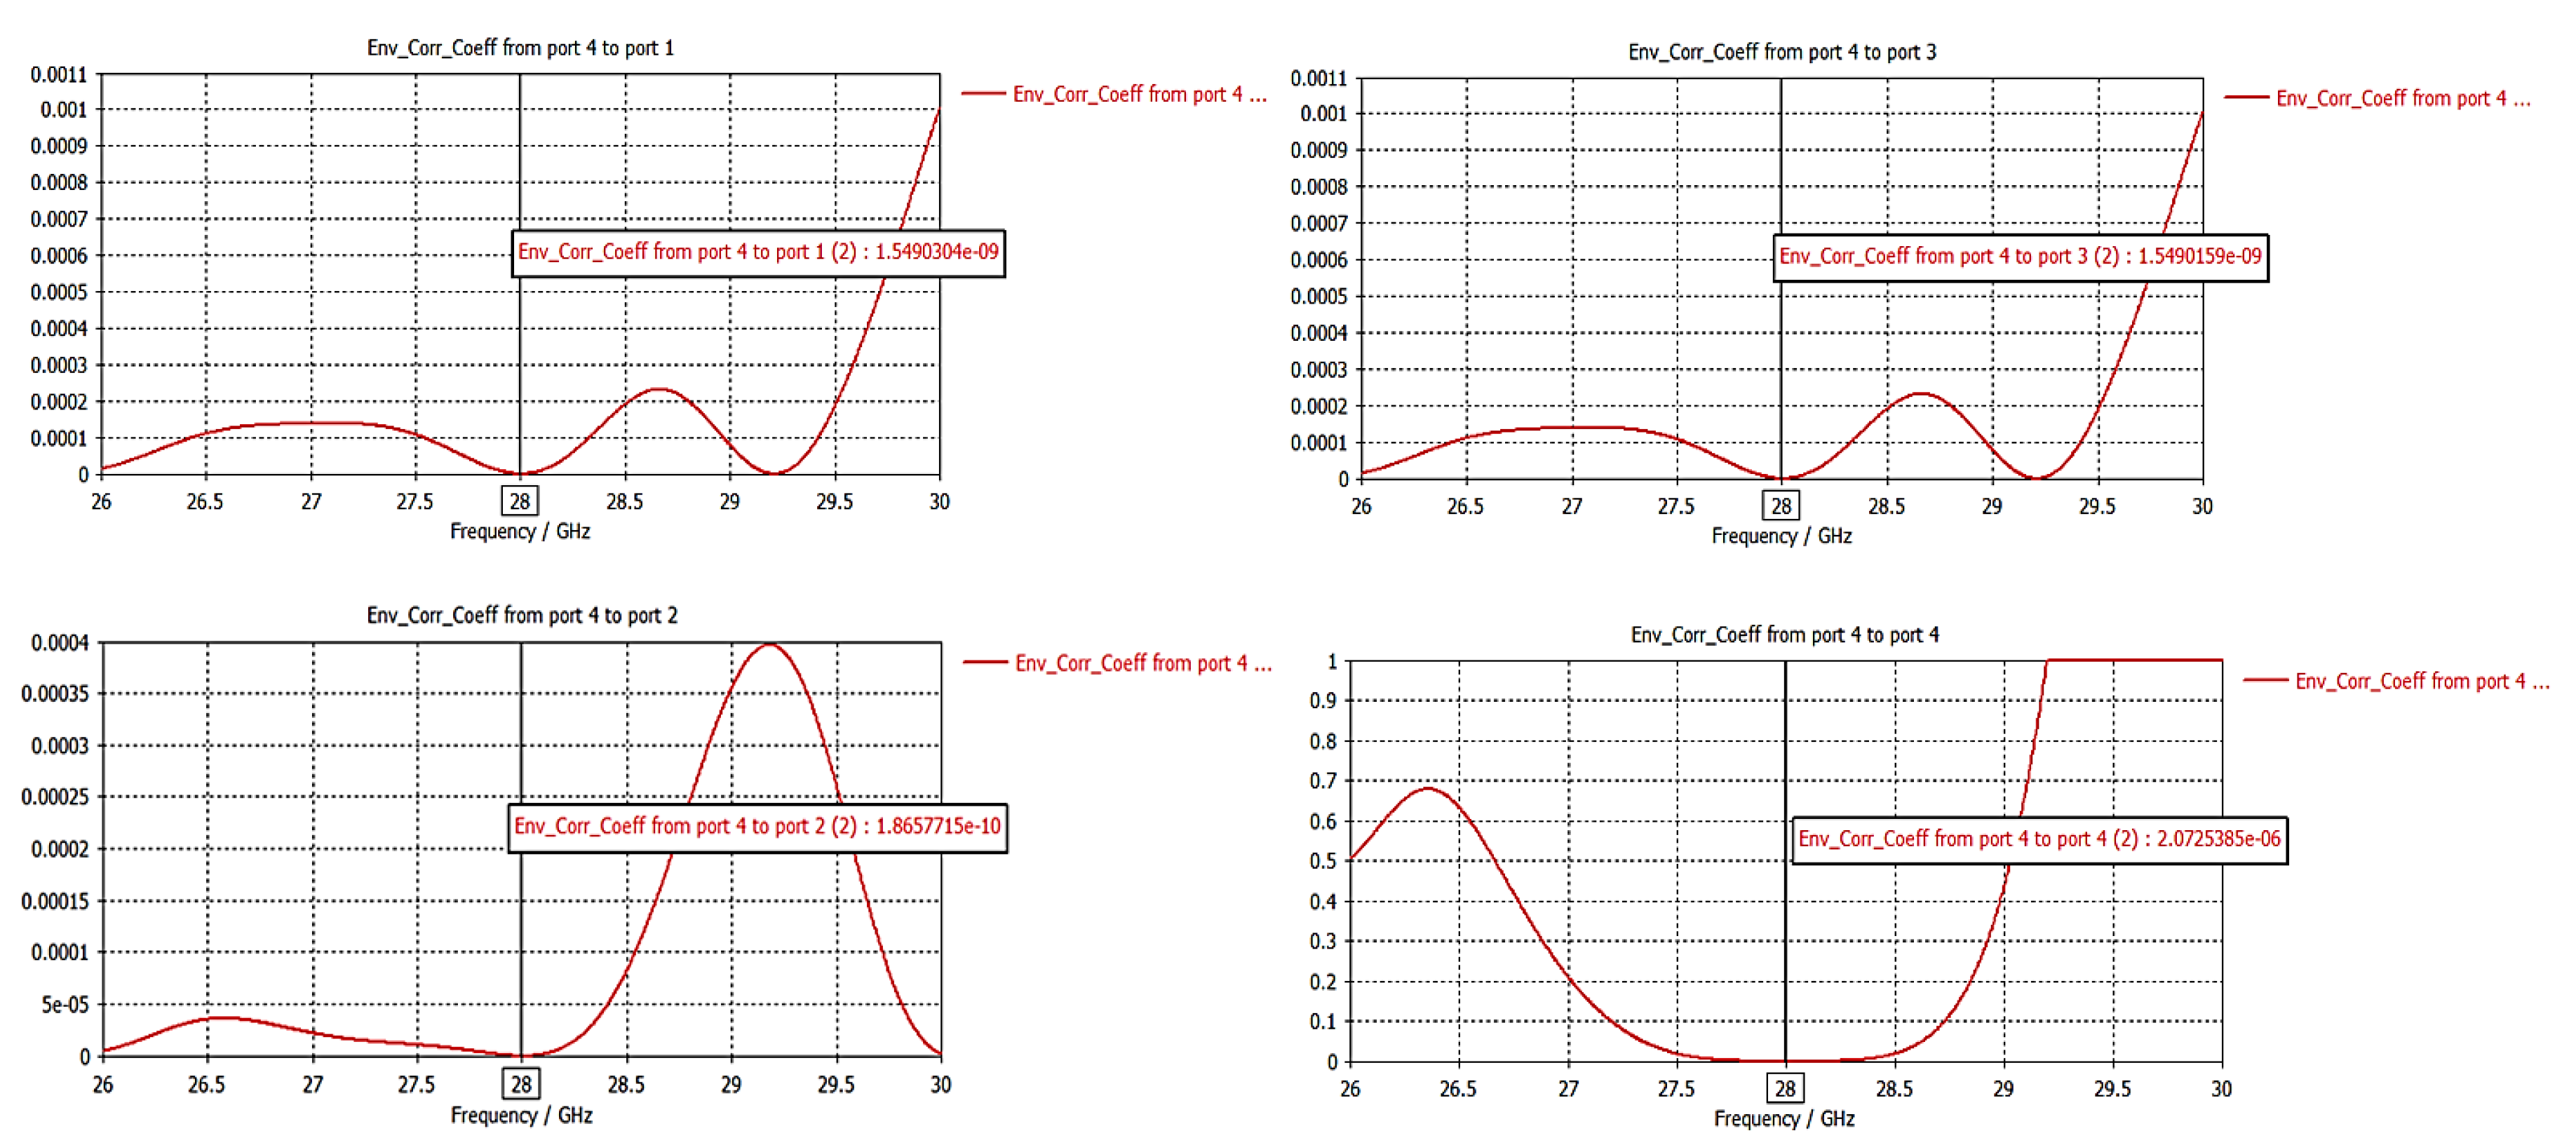
Figure 21.
Diversity gain of MIMO.
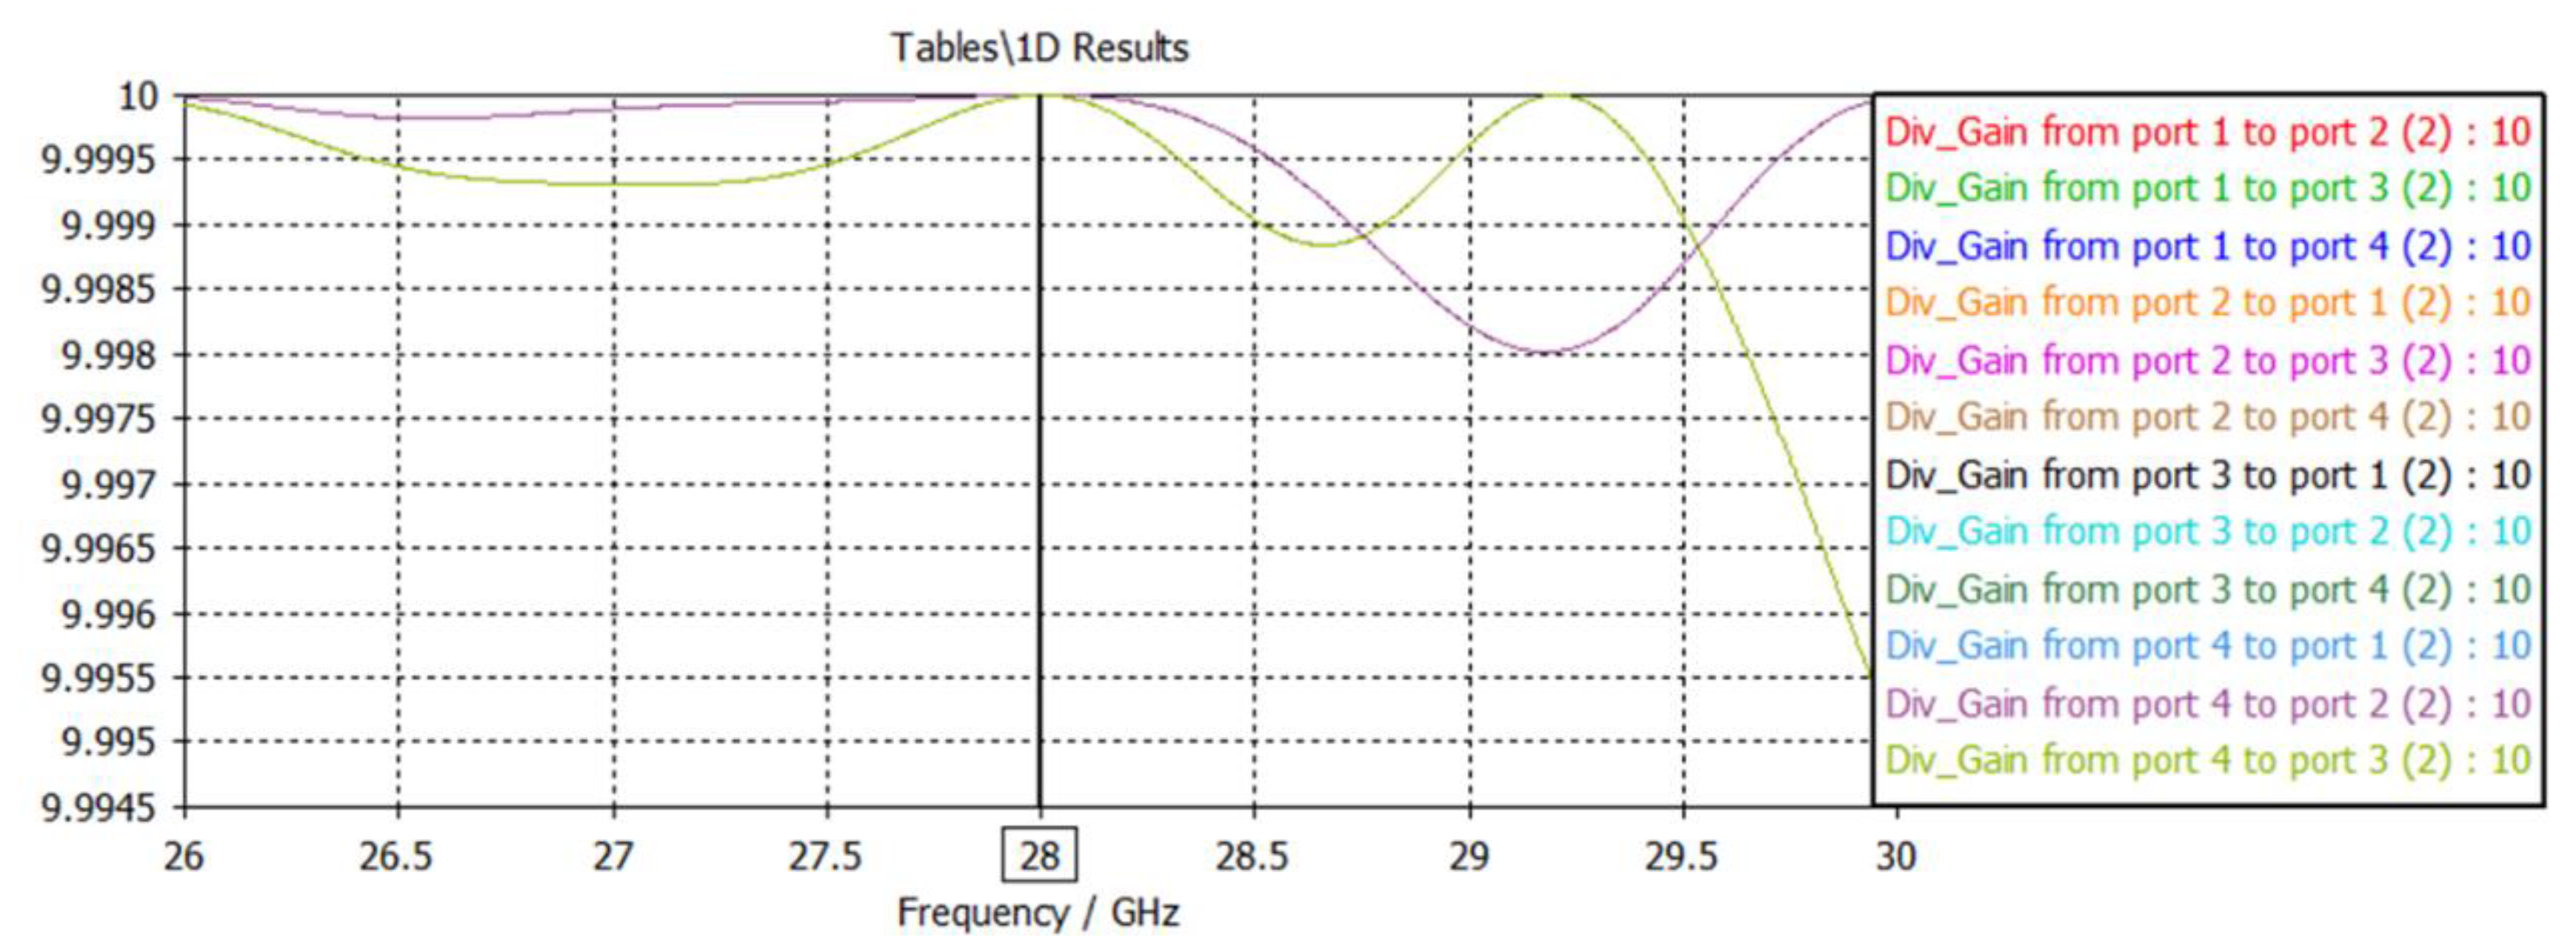
Figure 22.
Total Active Reflection Coefficient versus frequency at different.
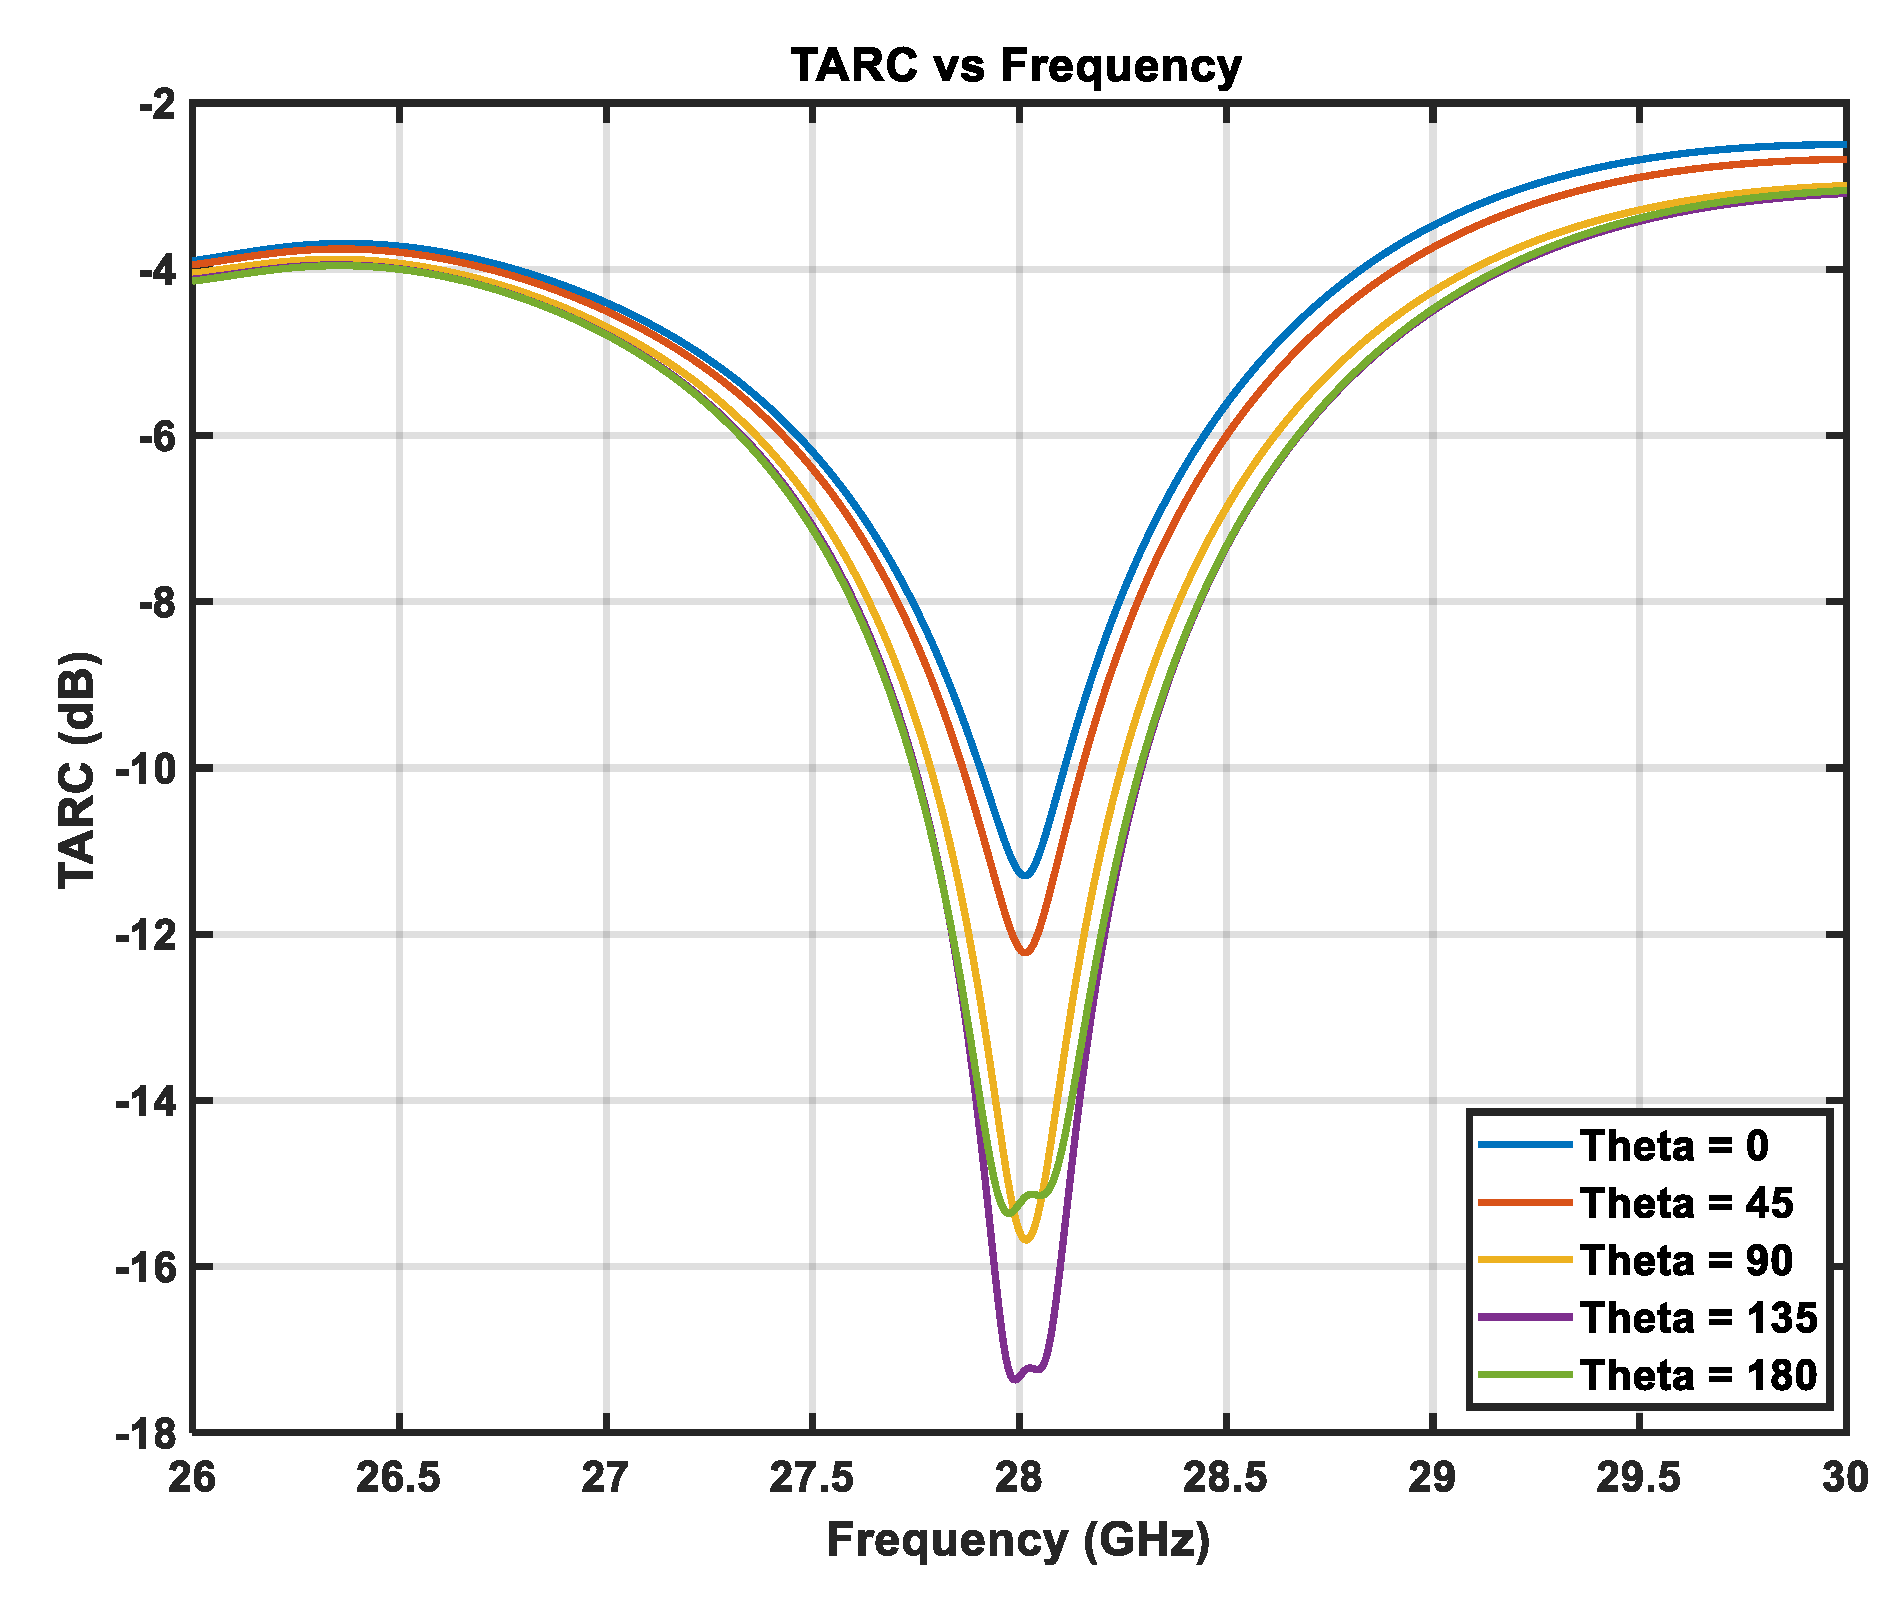
Figure 23.
Mean Effective Gain versus frequency.
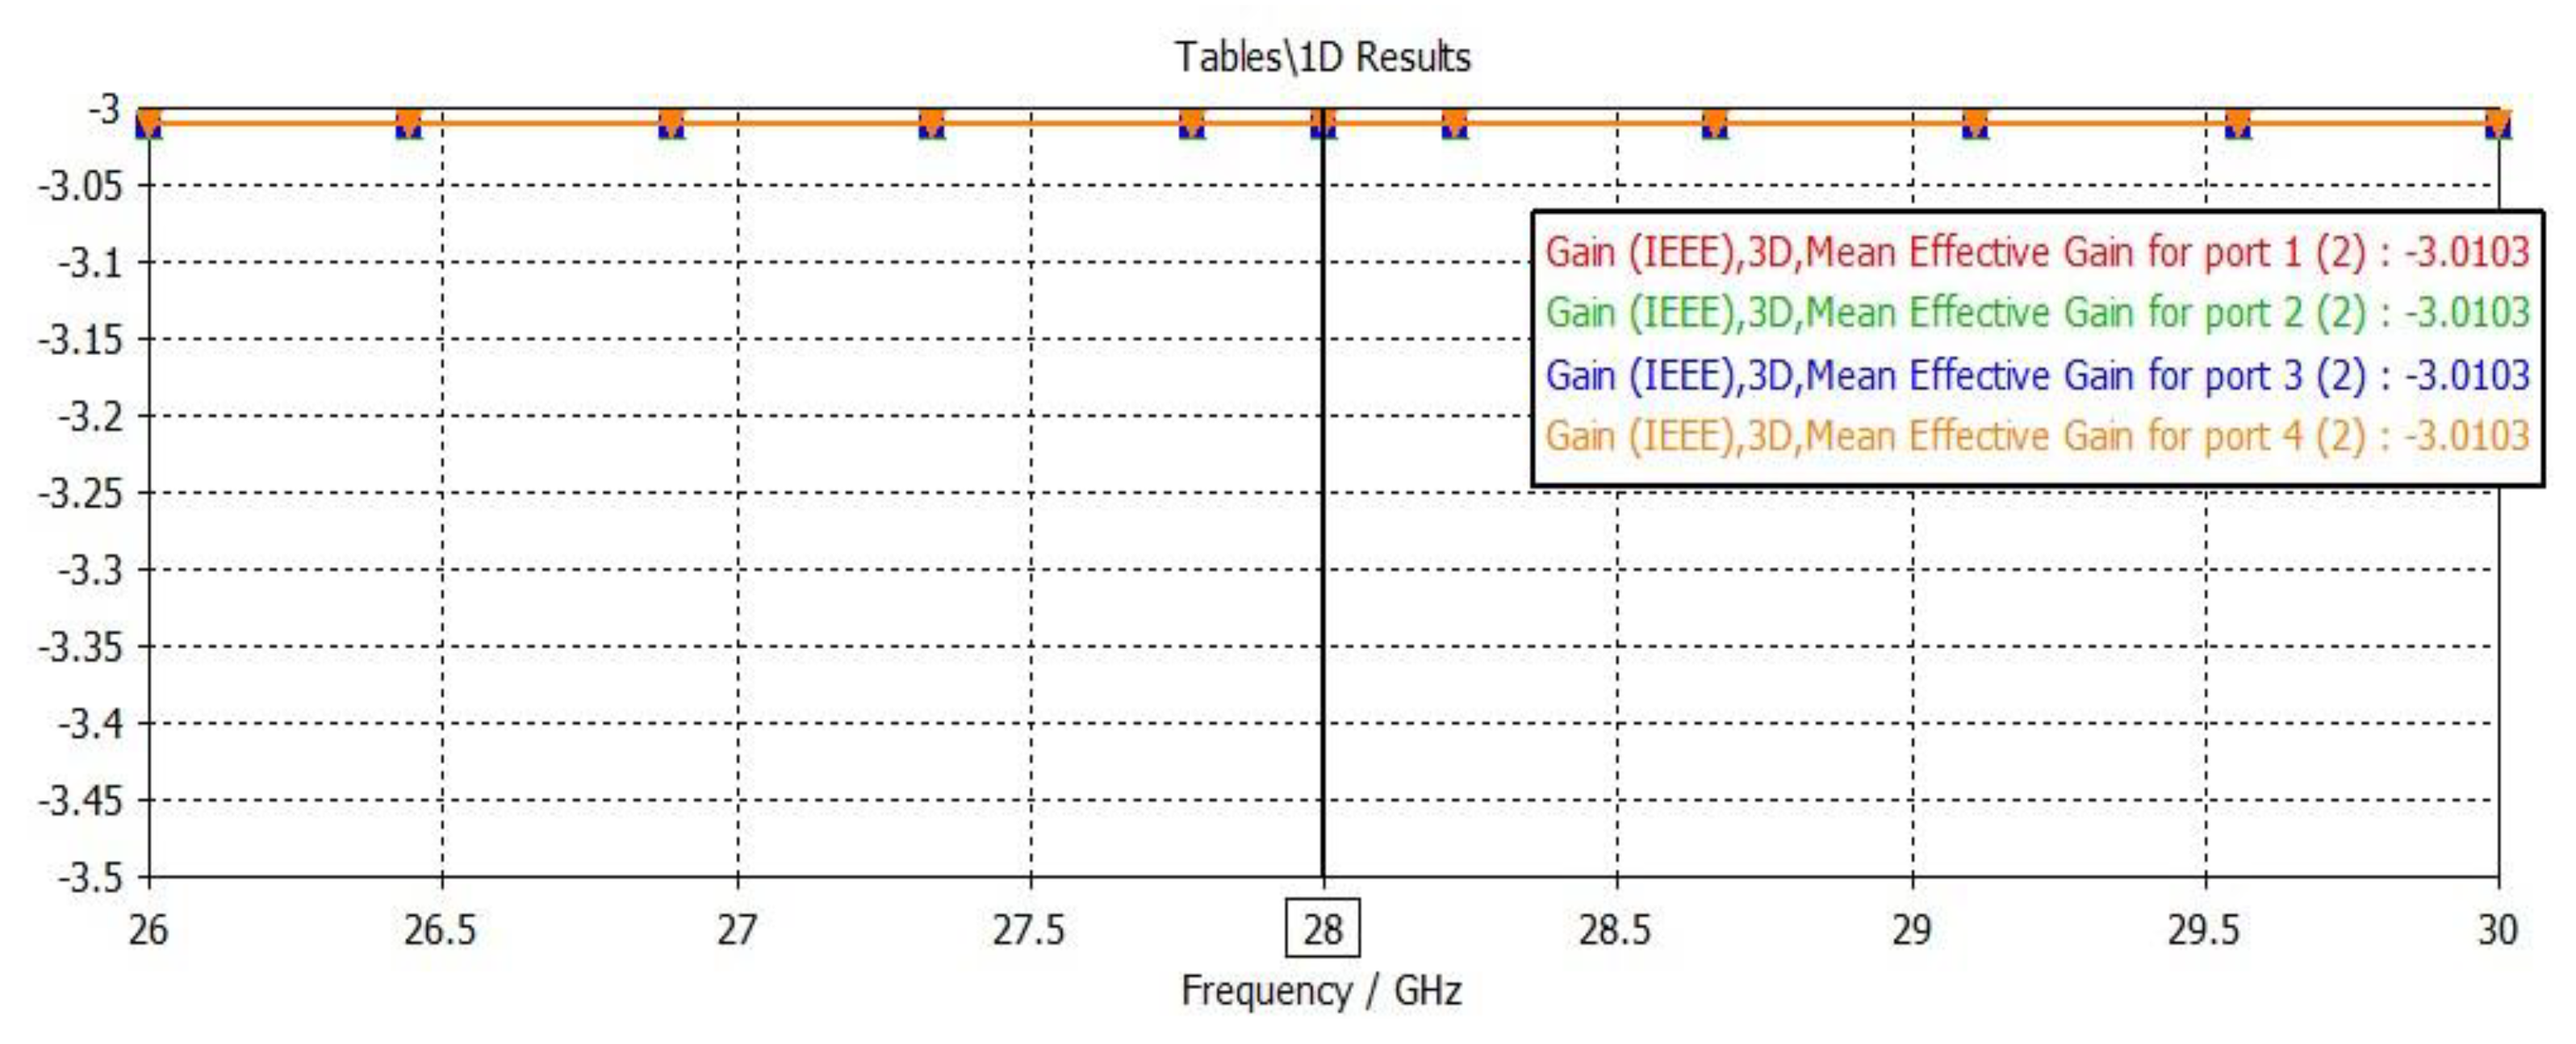
Figure 24.
Channel capacity loss versus frequency.
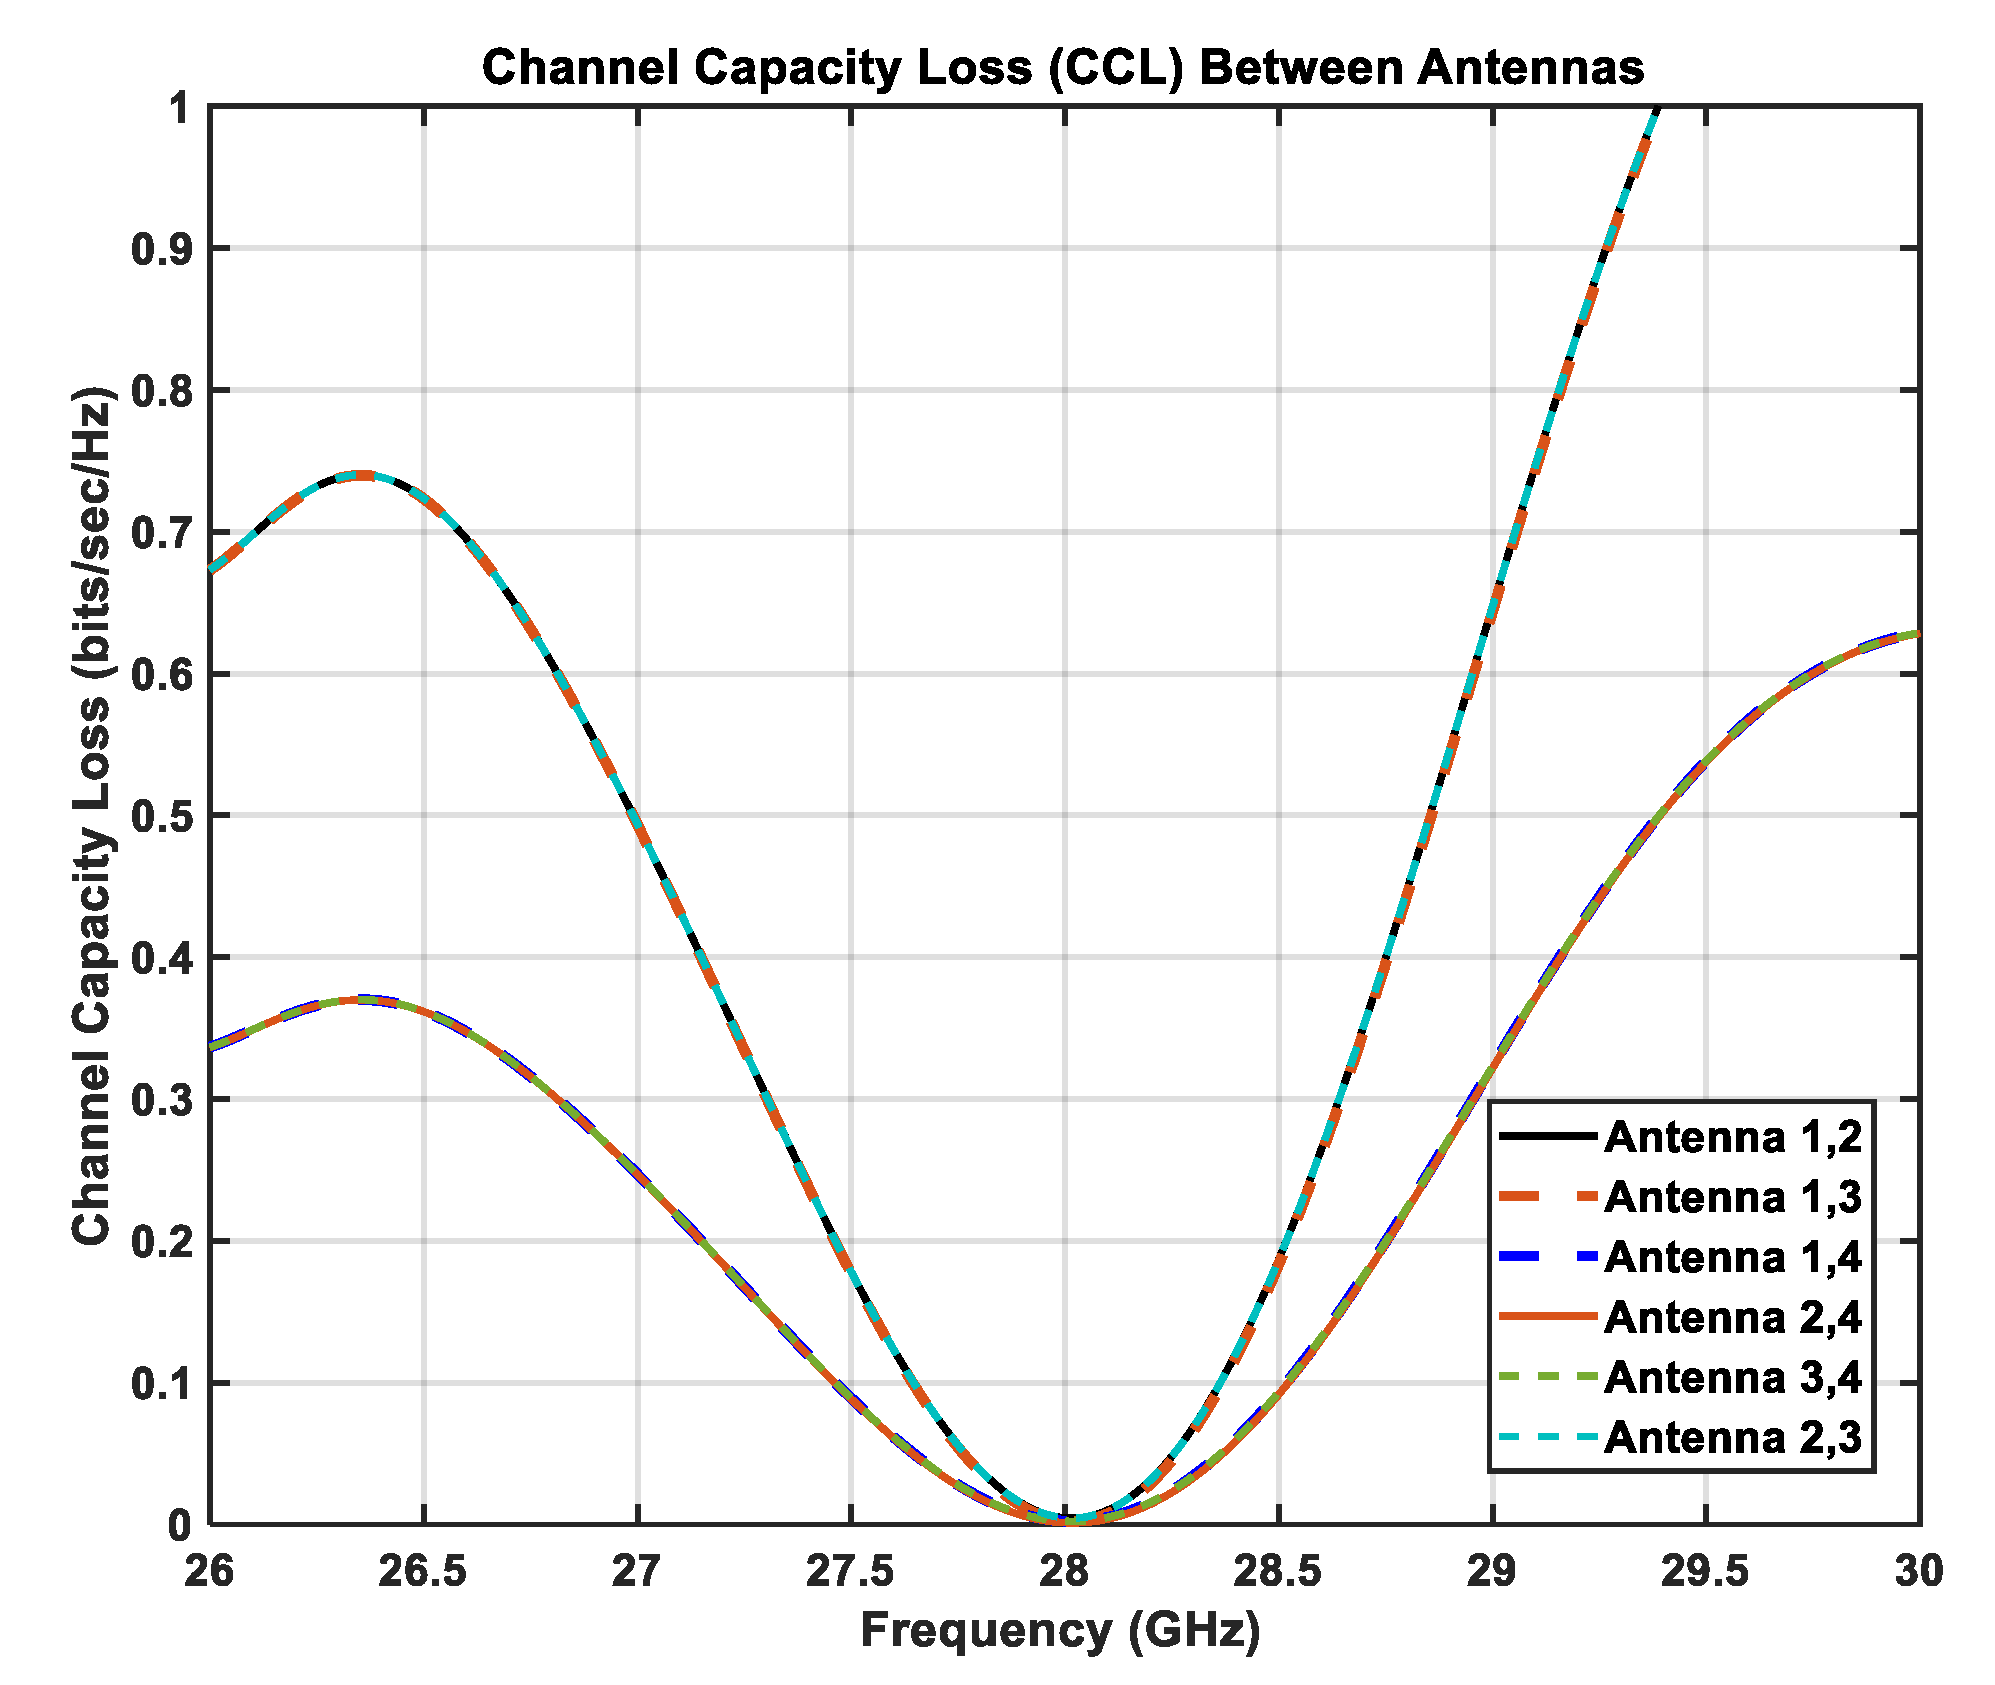
Figure 25.
Multiplexing efficiency versus frequency.

Table 1.
Dimensions of the proposed MPA.
| Dimension | ||||||||||||||||
|---|---|---|---|---|---|---|---|---|---|---|---|---|---|---|---|---|
| Value (mm) | 21 | 18 | 9.63 | 12.4 | 6.1 | 3 | 1.29 | 10 | 1.1 | 2.9 | 5.3 | 1 | 1.73 | 0.7 | 0.508 | 0.035 |
Table 2.
Comparison between the proposed design and other works.
| Design | Gain () |
Center frequency () |
() |
BW () |
Directivity () |
Efficiency | Other 5g bands () |
|---|---|---|---|---|---|---|---|
| [23] | 9.82 | 28.1 | -42 | 1.29 | - | 87.5% | - |
| [24] | 8.31 | 28 | -54 | 5.13 | 8.35 | 84.8% | 38.5 |
| [25] | 7.6 | 28 | -40 | 1.3 | 7.68 | 85.6% | 45 |
| [26] | 7.41 | 28 | -35 | 1.5 | - | - | - |
| [27] | 7.02 | 28.1 | -19.3 | 0.9 | 7.69 | 85.5% | 24.4,38 |
| [28] | 6.83 | 28.06 | -18.25 | 1.1 | - | - | - |
| [29] | 6.73 | 28 | -40 | 2.48 | 6.99 | 86.73% | - |
| Proposed | 10.11 | 28 | -33.54 | 1.3 | 10.5 | 91.5% | - |
Disclaimer/Publisher’s Note: The statements, opinions and data contained in all publications are solely those of the individual author(s) and contributor(s) and not of MDPI and/or the editor(s). MDPI and/or the editor(s) disclaim responsibility for any injury to people or property resulting from any ideas, methods, instructions or products referred to in the content. |
© 2025 by the authors. Licensee MDPI, Basel, Switzerland. This article is an open access article distributed under the terms and conditions of the Creative Commons Attribution (CC BY) license (http://creativecommons.org/licenses/by/4.0/).
Copyright: This open access article is published under a Creative Commons CC BY 4.0 license, which permit the free download, distribution, and reuse, provided that the author and preprint are cited in any reuse.


