Preprint
Article

This version is not peer-reviewed.

Transmission and Generation Expansion Planning Considering Virtual Power Lines/Plants, Distributed Energy Injection and Demand Response Flexibility from TSO-DSO Interface

A peer-reviewed article of this preprint also exists.

Submitted:

27 February 2025

Posted:

28 February 2025

You are already at the latest version

Abstract

This article presents a computational model for Transmission and Generation expansion planning considering the impact of Virtual Power Lines which consists of investment in energy storage in the transmission system, being able to determine the reduction and postponement of investments in transmission lines. The flexibility from the TSO-DSO interconnection is also modeled, analyzing its impact on system expansion investments. Flexibility is provided to the AC power flow transmission network model by distribution systems connected at the transmission system nodes. The Transmission system Flexibility requirements are provided by expansion planning performed by the connected DSOs. The objective of the model is to minimize the overall cost of system operation and investments in transmission, generation and the investments in flexibility requirements. A Data-Driven Distributionally Robust Optimization-DDDRO approach is proposed to consider uncertainties of demand and Variable Renewable Energy generation. The Column and Constraint Generation algorithm and Duality-Free Decomposition method are adopted. Case studies using a Garver 6-node system and the IEEE RTS-GMLC were carried out to validate the model and evaluate the values and impacts of local flexibility on transmission system expansion. The results obtained demonstrate a reduction in total costs, an improvement in the efficient use of the transmission system, and an improvement in the locational marginal price indicator of the transmission system.

Keywords: 
;  ;  ;  

1. Nomenclature

1.1. Sets

Ω D Dispatchable generation units
Ω CD Candidate Dispatchable generation units
Ω ND Non-Dispatchable generation units
Ω CND Candidate Non-Dispatchable generation units
Ω VPD VPP Dispatchable generation units
Ω VPND VPP Non-Dispatchable generation units
Ω H Battery Storage units
Ω VL Virtual Power Lines
Ω VP Virtual Power Plants
Ω S Demand stages
Ω CS Candidate Storage units
Ω B Set of nodes in the power transmission network
Ω L Set of Lines in the power transmission network, Ω L Ω B X Ω B
Ω C Set of circuits in the power transmission network line
Ω W Set of scenarios
Ψ a m b DDDRO Ambiguity Set

1.2. Indices

b Node, b Ω B
c Line Circuit, c Ω C
c d Candidate Dispatchable Generation, c d Ω CD
c n d Candidate Non-Dispatchable Generation, c n d Ω CND
h Battery Storage unit, h Ω H
l Line, l Ω L
s Stage, s Ω S
t Time step, t
v l Virtual Power Line, v l Ω VL
v p Virtual Power plant, v p Ω VP
w Scenario, w Ω W

1.3. Input Data and Operators

T Time horizon of the problem
a Area
b l Susceptance [p.u.] of line l
d r discount rate
g l Conductance (p.u.) of line l
L i n e _ M a x C i r c l Maximum number of circuits of line l
L C i r c _ C a p P l , c Active Power Capacity of circuit c of line l
L C i r c _ C a p V A l , c apparent Power Capacity of circuit c of line l
I C l , t T L Investment cost of additional line circuit at corridor l in time period t [$/circuit]
I C c d , b , t D Investment cost of additional dispatchable generation at node b in time period t [$/ M W ]
I C c n d , b , t N D Investment cost of additional Non-Dispatchable generation at node b in time period t [$/ M W ]
I C h , t S T Investment cost of Battery Storage h in time period t [$/ M W h ]
I C v l , t V L Investment cost of VPL v l in time period t [$/ M W h ]
O C b , t D Variable cost of existing dispatchable generation at node b in time period t [$/ M W h ]
O C b , t C D Variable cost of candidate dispatchable generation at node b in time period t [$/ M W h ]
O C b , t F x U Variable cost of upward flexibility at node b in time period t [$/ M W h ]
O C b , t F x D Variable cost of downward flexibility at node b in time period t [$/ M W h ]
O C b , t d F x U Variable cost of demand response upward flexibility at node b in time period t [$/ M W h ]
O C b , t d F x D Variable cost of demand response downward flexibility at node b in time period t [$/ M W h ]
O C h . t S T Variable cost of storage h in time period t [$/ M W h ]
O C b . t V P R Variable cost of P2P active power contracted at node b in time period t [$/ M VA ]
O C b . t V P R G Variable cost of P2P active generation contracted at node b in time period t [$/ M W h ]
O C b , t L C Variable cost of load curtailment at node b in time period t [$/ M W h ]
O C b , t N D C Variable cost of Non-Dispatchable generation curtailment at node b in time period t [$/ M W h ]
O C t C o n g Variable cost of congestion in time period t [$/ M W h ]
π w Probability of Scenario w
π w 0 Probability of Scenario w from data
d P b , t , s R S P Active power of Demand response, bus b, time period t, demand stage s [ M W ]
d Q b , t , s R S P Reactive power of Demand response, bus b, time period t, demand stage s [ M VAr ]
d B a n d b , t , s R S P Demand response available flexibility band, bus b, time period t, demand stage s [ p . u . ]
n d P b , t , s , w Active power of Net Demand, bus b, time period t, demand stage s, scenario w [ M W ]
n d Q b , t , s , w Reactive power of Net Demand, bus b, time period t, demand stage s, scenario w [ M VAr ]
p b , t , s , w CND Active power of Candidate Non-Dispatchable generation units, bus b, time period t, demand stage s, scenario w [ M W ]
q b , t , s , w CND Reactive power of Candidate Non-Dispatchable generation units, bus b, time period t, demand stage s, scenario w [ M VAr ]
p v p , b , t VPRC Active power of VPP contracted in the P2P market, vpp v p , bus b, time period t [ M W ]
q v p , b , t VPRC Reactive power of VPP contracted in the P2P market, vpp v p , bus b, time period t [ M VAr ]
a v l D b , t Active power available as downward flexibility at bus b, time period t [ M W ]
a v l U b , t Active power available as upward flexibility at bus b, time period t [ M W ]
E S S h , t C A P Energy capacity of Battery storage h, time period t [ M W h ]
P h S T M a x Maximum power of Battery storage h [ M W ]
p _ m a x b D Maximum active power of Existing Dispatchable generation units, bus b [ M W ]
q _ m a x b D Maximum reactive power of Existing Dispatchable generation units, bus b [ M VAr ]
p _ m a x v p VPD Maximum Active power of VPP Dispatchable generation, vpp v p [ M W ]
q _ m a x v p VPD Maximum Reactive power of VPP Dispatchable generation, vpp v p [ M VAr ]
p _ m a x v p VPR Maximum Active power of VPP Dispatchable generation, vpp v p [ M W ]
q _ m a x v p VPR Maximum Reactive power of VPP Dispatchable generation, vpp v p [ M VAr ]
p _ m a x b CD Maximum Active power of Candidate Dispatchable generation, bus b [ M W ]
q _ m a x b CD Maximum Reactive power of Candidate Dispatchable generation, bus b [ M VAr ]
p _ m a x b FxU Maximum Active power of Upward flexibility, bus b [ M W ]
p _ m a x b FxD Maximum Active power of Downward flexibility, bus b [ M W ]
v r e f Reference bar for voltage angle
M Large power value [p.u.]

1.4. Decision Variables

f l , t , s , w Active power flow of line l, time period t, demand stage s, scenario w [ M W ]
f l , t , s , w S i g n 1 Signed Active power flow of origin side of line l, time period t, demand stage s, scenario w [ M W ]
f l , t , s , w S i g n 2 Signed Active power flow of destination side of line l, time period t, demand stage s, scenario w [ M W ]
f Q l , t , s , w Reactive power flow of line l, time period t, demand stage s, scenario w [ M VAr ]
p v p , b , t , s , w VPR Active power of VPP demanded from reserve market, vpp v p , bus b, time period t, demand stage s, scenario w [ M W ]
q v p , b , t , s , w VPR Reactive power of VPP demanded from reserve market, vpp v p , bus b, time period t, demand stage s, scenario w [ M VAr ]
p v p , b , t , s , w VPD Active power of VPP Dispatchable generation, vpp v p , bus b, time period t, demand stage s, scenario w [ M W ]
q v p , b , t , s , w VPD Reactive power of VPP Dispatchable generation, vpp v p , bus b, time period t, demand stage, scenario w s [ M VAr ]
p b , t , s , w D Active power of Existing Dispatchable generation units, bus b, time period t, demand stage s, scenario w [ M W ]
q b , t , s , w D Reactive power of Existing Dispatchable generation units, bus b, time period t, demand stage s, scenario w [ M VAr ]
p b , t , s , w CD Active power of Candidate Dispatchable generation units, bus b, time period t, demand stage s, scenario w [ M W ]
q b , t , s , w CD Reactive power of Candidate Dispatchable generation units, bus b, time period t, demand stage s, scenario w [ M VAr ]
p b , t , s , w ND Active power of existing Non-Dispatchable generation units, bus b, time period t, demand stage s, scenario w [ M W ]
q b , t , s , w ND Reactive power of existing Non-Dispatchable generation units, bus b, time period t, demand stage s, scenario w [ M VAr ]
p v p , b , t , s VPND Active power of VPP Non-Dispatchable generation, vpp v p , bus b, time period t, demand stage s [ M W ]
q v p , b , t , s VPND Reactive power of VPP Non-Dispatchable generation, vpp v p , bus b, time period t, demand stage s [ M VAr ]
p b , t , s , w NDC Active power of Curtailed Non-Dispatchable generation units, bus b, time period t, demand stage s, scenario w [ M W ]
p b , t , s , w FxU Active power of Upward flexibility, bus b, time period t, demand stage s, scenario w [ M W ]
p b , t , s , w FxD Active power of Downward flexibility, bus b, time period t, demand stage s, scenario w [ M W ]
d P _ F x U b , t , s , w R S P Active power of procured demand response upward flexibility, bus b, time period t, demand stage s, scenario w [ M W ]
d P _ F x D b , t , s , w R S P Active power of procured demand response downward flexibility, bus b, time period t, demand stage s, scenario w [ M VAr ]
p b , t , s , w LC Active power of Curtailed demand, bus b, time period t, demand stage s, scenario w [ M W ]
p h , t , s , w STD Storage Active power discharge of storage h, time period t, demand stage s, scenario w [ M W ]
p h , t , s , w STC Storage Active power charge of storage h, time period t, demand stage s, scenario w [ M W ]
p D u r s Time duration of demand stage s [pu]
V b , t . s , w Voltage (p.u.) at bus b at time t, demand stage s, scenario w
d e l t a V b , t . s , w Voltage (p.u.) at bus b at time t, demand stage s, scenario w
θ i j , t , s , w Voltage phase angle between nodes i and j at time t, demand stage s, scenario w
S o C h , t , s , w State-of-charge ( M W h ), storage h, at time t, demand stage s, scenario w
E S S h , t , w Energy available at storage device h in time period t, scenario w [ M W h ]
a d m i t G l Admittance of line l - Real part
a d m i t B l Admittance of line l - Imaginary part
i F x D b , s Binary variable indicating if downward flexibility is considered at bus b, during demand stage s [0,1]
i F x U b , s Binary variable indicating if upward flexibility is considered at bus b, during demand stage s [0,1]
C i r c l , c , t Binary variable indicating the presence of a circuit c, in corridor l, time period t [0,1]
I n S T h , t Binary variable indicating the presence of storage h, time period t [0,1]
I n V L l , t Binary variable indicating the presence of VPL l, time period t [0,1]
i p c d , b , t CD Binary variable indicating the presence of candidate dispatchable generation c d , bus b, time period t [0,1]
i p c n d , b , t CND Binary variable indicating the presence of candidate Non-Dispatchable generation c n d , bus b, time period t [0,1]
s o c h , t , s Binary variable indicating the charge/discharge status of Battery storage unit h, time period t, stage s [0,1]
V P L _ F i j 1 _ S t l , t , s , w Binary variable indicating the flow status of VPL line l from side, time period t, stage s [0,1]
V P L _ F i j 2 _ S t l , t , s , w Binary variable indicating the flow status of VPL line l to side, time period t, stage s [0,1]
V P L _ C a r g 1 _ S t l , t , s , w Binary variable indicating the charge/discharge status of VPL Battery storage unit 1 of line l, time period t, stage s [0,1]
V P L _ C a r g 2 _ S t l , t , s , w Binary variable indicating the charge/discharge status of VPL Battery storage unit 2 of line l, time period t, stage s [0,1]

1.5. Vector Notation

y Set of network variables: [ C i r c l , c , t , w , I n S T h , t , w , i p c d , b , t , w CD , i p c n d , b , t , w CND ] b Ω B , h Ω H , t T , s Ω S , v Ω V , w Ω W .
x Set of network variables: [ p v , b , t , s , w VPR , q v , b , t , s , w VPR , p v , b , t , s , w VPD , q v , b , t , s , w VPD , p v , b , t , s , w VPND , q v , b , t , s , w VPND , p b , t , s , w D , q b , t , s , w D , p b , t , s , w CD , q b , t , s , w CD , p b , t , s , w ND , q b , t , s , w ND , p b , t , s , w CND , q b , t , s , w CND , p b , t , s , w NDC , p b , t , s , w FxU , p b , t , s , w FxD , i F x D b , s , w , i F x U b , s , w , d P b , t , s , w , d Q b , t , s , w , d P b , t , s , w RSP , d Q b , t , s , w RSP , p b , t , s , w LC , p h , t , s , w STD , p h , t , s , w STC , v b , t , s , w , θ i j , t , s , w ] b Ω B , h Ω H , t T , s Ω S , v Ω V , w Ω W .

2. Introduction

2.1. Background

The problem of planning the expansion of electric power transmission and generation systems continues to be the subject of research in the field of electrical engineering. In recent decades, the operational and commercial model of the electricity sector has been restructured on the world stage, bringing new processes, variables and technologies. The current context has evolved towards a situation with the participation of private investors in the areas of commercialization, distribution, transmission and generation, with a reality of competition in the provision of these services. Consumers also began to make their own investments in energy generation, both for consumption and for sale. The expansion planning process must minimize costs, and the variable profit and opportunity for the participating agents becomes present, as well as the need to enable competition in the provision of services, to obtain adequate prices for consumers. Ensuring the reliability and security of the system must be sought with a robust infrastructure to tolerate uncertainties.
Environmental issues related to global warming have restricted the activation of new generation structures that allow deterministic production. The various technologies that have been developed in pursuit of this objective have led, among others, to the growth in the use of renewable energy as a source for electricity generation units. Most of these technologies are characterized by high variability and limited predictability and control. They are often not dispatched by system operators and typically produce energy at a very low marginal cost.

2.2. Literature Review

The operation, planning, business model and regulatory aspects of an electrical system that has a significant presence of generation units with stochastic behavior, such as some renewable sources, are greatly impacted when compared to that used in a system that uses generation that has fully deterministic behavior and is dispatchable [1].
With the context described, the planning of the expansion of the transmission system is increasingly linked to the way in which the expansion of the generation system takes place, leading to the need to consider methods of jointly dealing with the planning of the expansion of these two systems [2].
Planning the capacity expansion of transmission and generation systems is an optimization problem, which needs to have a long-term view, usually analyzed in stages or stages over the proposed time horizon. Bibliographic reviews on the subject can be obtained at [3,4,5].
In [6] the authors develop a proposed model for coordinated planning of transmission and distribution expansion. It considers wind generation uncertainties, proposes a 1-stage model, assuming a predefined generation capacity value. It proposes a model that considers a coordinated expansion plan between transmission and distribution, which enables a mutual interest of an optimized investment.
In the work [7] the authors address a model proposal for Transmission Expansion Planning considering distributed generation of investors to be signaled for the planning process. The proposal generates a distributed energy resources (DER) activation plan (location and capacity) with financial information for investor remuneration. The impact on the Locational Marginal Pricing (LMP) referring to periods of high injection of DER power is considered.
In [8] the authors address a model proposal for Generation Expansion Planning (GEP), considering distributed generation, regulated systems, with centralized planning and operation. A model is proposed for situations where transmission and distribution are centralized and owned by the same company.
In [9] the authors address a model proposal for planning the expansion of the transmission system considering distributed generation of investors to be signaled for the planning process. Demand and capacity uncertainties of the distributed generators to be signaled are considered. Uncertainties related to natural accidents are considered. A joint plan for transmission expansion and DER activation (location and capacity) is generated, with financial information for investor remuneration.
In [10] it is discussed a proposed model for planning the expansion of the transmission system. It is considered a restriction regarding spinning reserves for security in the scenario with renewable energy without inertia. The DDDRO technique is used.
The use of the transmission system by the generation, distribution and consumption agents must be charged to make the investments and operating expenses of this system viable. With the aim of establishing a way to allocate these costs among users, methods based on several principles have already been proposed, and what has been used in current models is the so-called nodal method or Locational Marginal Pricing (LMP) [11].
Several exact methods have been used, such as: linear programming, nonlinear programming and mixed integer programming, Benders decomposition [12,13] and hierarchical decomposition, solving the integer problem with the [14,15] enumeration algorithm. More recent works that use a robust optimization approach, have used a three-level modeling proposal as a reference according to [16,17]:
min y ( c t y + max u U min x Ω y , u b t x )
Where, at the first level of (1), y is the vector with the binary variables referring to investments in transmission lines, generation units, and energy storage, and c is the vector of investment costs. At the second level, u is the vector of variable and uncertain generation, and U is the set of uncertainties. At the third level, b is the vector of operating costs and x the vector of operating variables, such as line fluxes, generator dispatch, bus voltage phase angles and load shedding . Ω y , u is the viability region created by operational constraints.
This modeling of the problem can be seen in three layers. At a first level, a better expansion plan is chosen, and the binary investment variables y are identified. At a second level, the worst realization (highest generation and generation curtailment costs) of uncertainties u is considered, considering the feasible scenarios (demand and generation). At a third level, taking the values of y and u as input, the vector x is determined with the operating values that optimize operating costs. Details of this modeling can be found at [18].
Works can be found addressing the modeling of power flexibility from DER, and its use for the benefit of the grid electrical system have been reported in the literature [19,20,21,22]. No studies were found considering expansion models of transmission and generation systems to address the impact of the use of ESS at the transmission level, implementing the Virtual Power Line concept, with the aim of postponing or avoiding investments in transmission infrastructure.

2.3. Contributions

This work proposes a model for planning the expansion of transmission and generation systems, taking into account Energy Storage Systems deployed at transmission level implementing Virtual Power Lines concept, Variable Renewable Energy (VRE) injection and flexibility provided at the Transmission System Operator (TSO) and Distribution System Operator (DSO) interconnection, through Demand Response.
The contributions of the paper are:
  • Battery Energy storage modeling for implementation of Virtual Power Lines, in Generation and Transmission Expansion Planning;
  • Modeling of Virtual Power Plants providing aggregated energy and power capacity to transmission nodes;
  • Modeling of the Distributed Energy Resources services at the TSO-DSO interconnection as demand response flexibility, providing energy and capacity reserve to transmission system;
  • Implementation of a net demand model associated with load duration curve stages to deal with the use of variable renewable energy.
The Table 1 presents a comparison of the works with the models and solution proposals presented in this review, as well as the proposal being made in this article, considering the characteristics of the planning models.
The rest of the paper is organized as follows: Section 3 presents the problem formulation and models proposed for deterministic approach; Section 4 presents the uncertainty modeling approach; Section 5 summarizes the solution procedures; Case studies are presented in Section 6, and Section 7 concludes this paper. This document ends with the bibliographical references used.

3. Problem Formulation - Deterministic Model

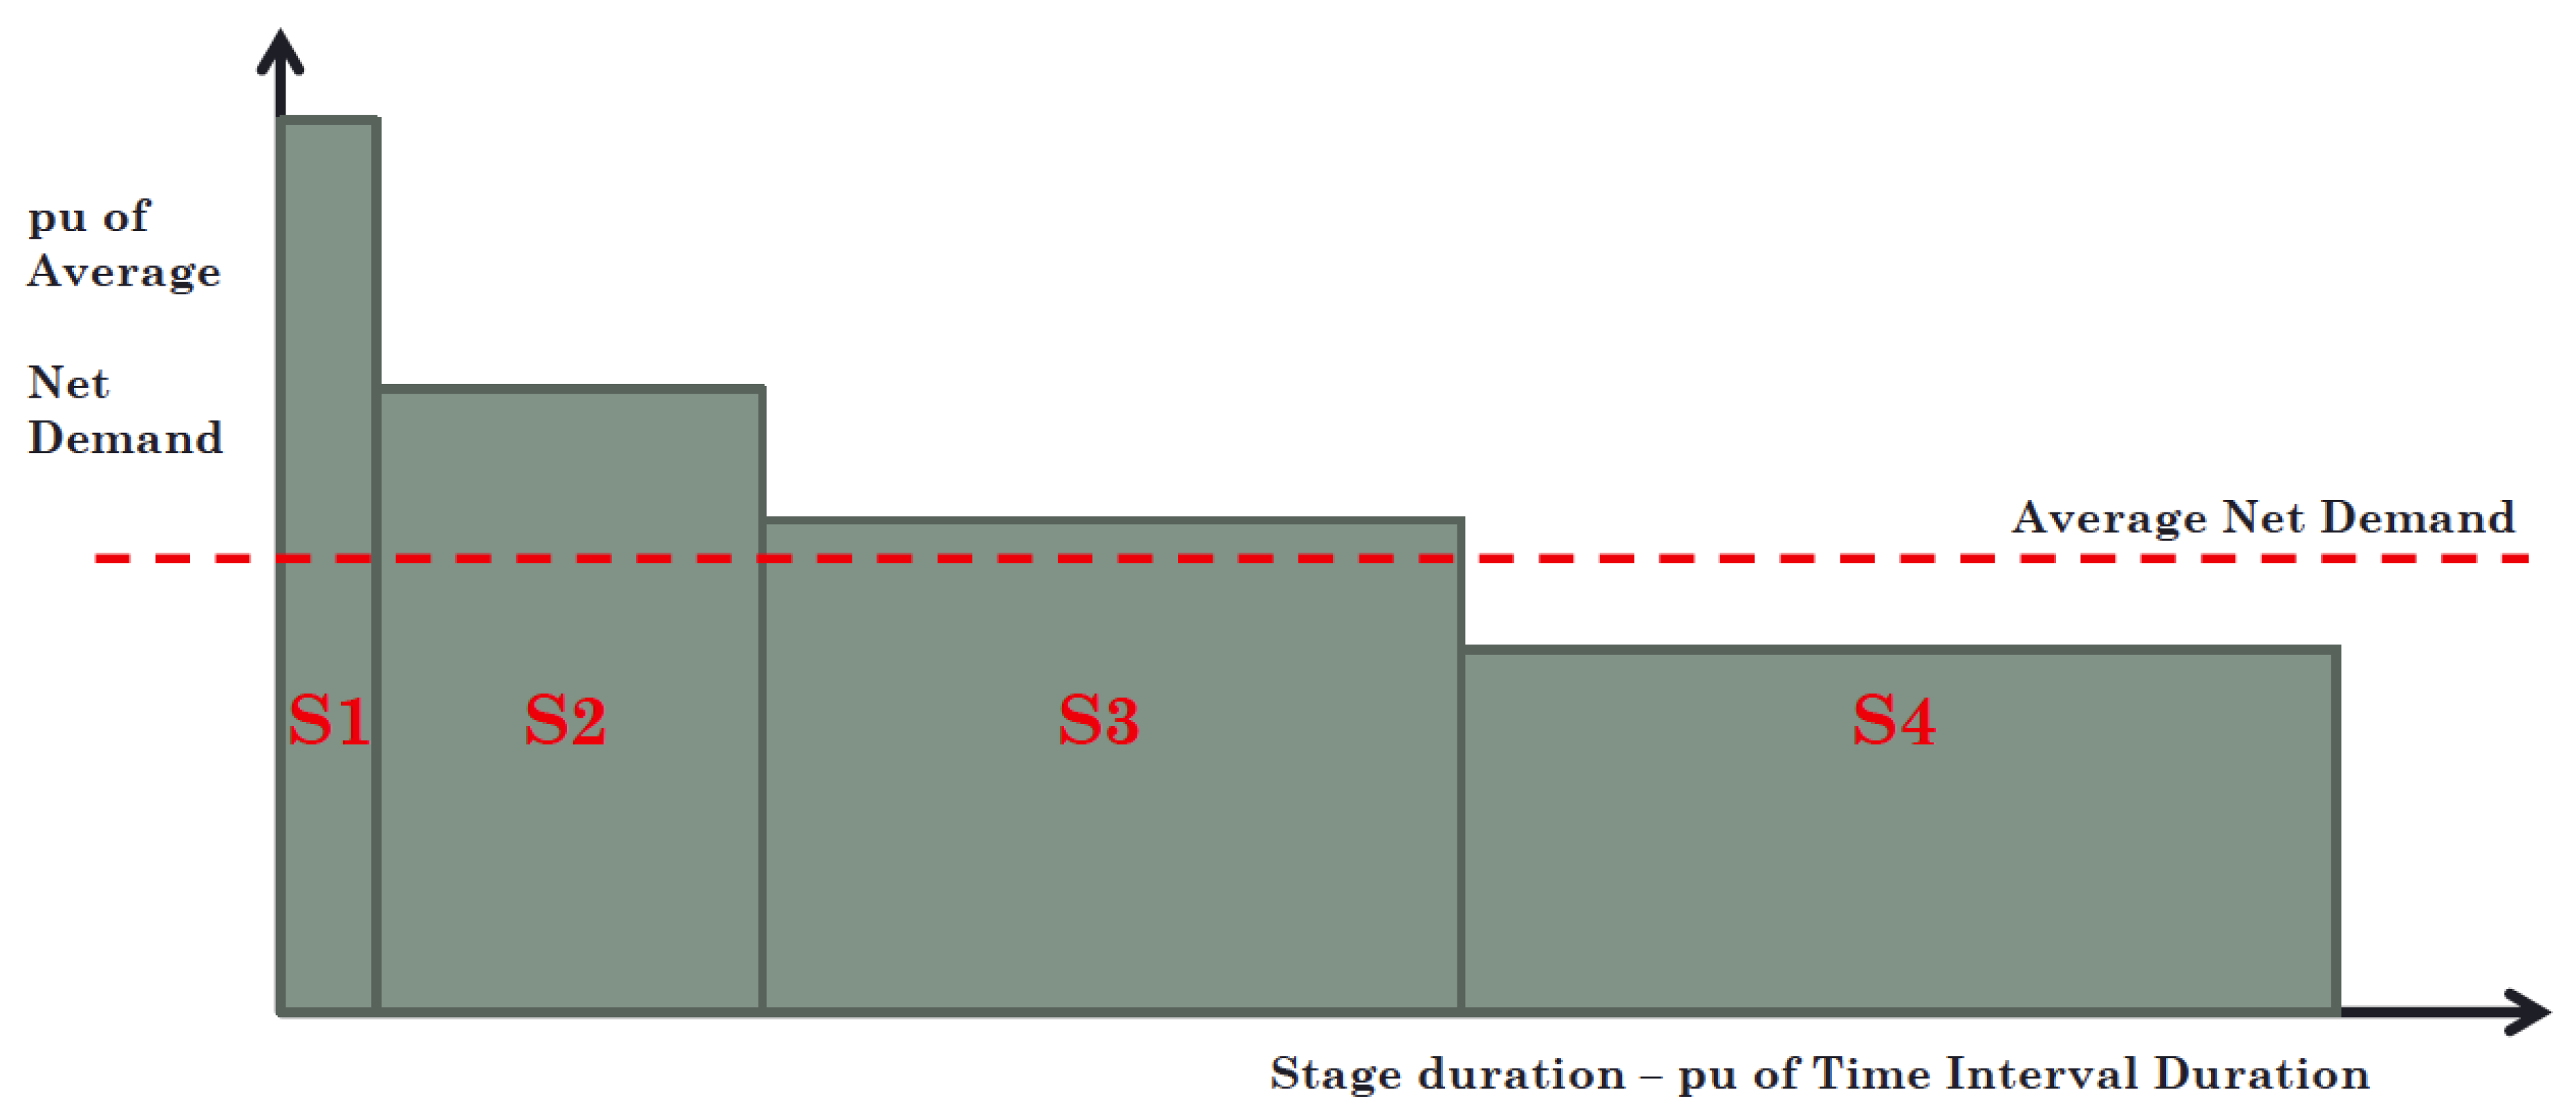
3.1. Net Demand Model

In this paper, the Transmission and Generation Expansion Planning (TGEP) proposal, considers that there are two types of demand met by the transmission system. A first type of demand, whose service planning responsibility is a function of a centralized generation expansion plan that is being carried out, with dispatchable and non-dispatchable generation, both existing and candidates for installation upon investment considered in the plan costs.
A second type of demand, which shares the use of the same transmission system, is served by Virtual Power Plants (VPP) contracted by consumers, who provide both dispatchable generation and non-dispatchable generation needed. The amount of this second type of demand must be compatible with the amount of generation provided by those VPPs.
Demands are modelled using the load duration curve, that shows the relationship between the cumulative load and the percentage of time for which that load occurs. The planning model uses the demand for a given time interval divided into stages, that are related to load block curves, that breaks down the expected load levels into discrete time blocks. Each time block of a forecasted load demand block is called a stage.
The concept of Demand is extended to Net Demand, that is the demand for electricity minus the contribution from VRE injection. Considering this net demand, the traditional demand duration curve, discretized into four average demand levels (S1, S2, S3, S4) is presented in Figure 1.
For long term planning purposes, the used Net Demand Stages model is a more coherent assessment of how much each type of generation source is more or less adequate to the behavior of a load profile. Sources with a generation profile closer to the load profile tend to be more competitive in relation to the others.
In addition, the load stages with lower demands (potential excess generation) are more suitable for signaling the VPL battery charge/discharge plan (Section 3.3), as well as contracting downward flexibility (Section 3.2). On the other hand, load stages with higher demands (potential lower generation) are more suitable for signaling the VPL battery discharge/charge plan (Section 3.3), as well as contracting upward flexibility (Section 3.2).

3.2. Flexibility

In the context of the interaction between TSO, DSOs and VPPs, in the electricity sector, upward flexibility and downward flexibility, from the point of view of the TSO, refer to the ability of DSOs and VPPs to adjust their electricity demand in response to signals from TSO [55].
Upward flexibility, from the point of view of the TSO, refers to the ability of DSOs and VPPs to decrease their electricity demand, or increase injection of distribuited generation, when there is shortage of electricity supply in the transmission network. This shortage of power can be generated by VRE sources connected to the grid, such as wind or solar power, which are subject to variability and intermittency, or due to generator outages or other factors. By reducing their demand during periods of shortage of power supply, DSOs and VPPs can help to balance the electricity grid and prevent instability. The proposal of this paper models upward flexibility as decrease in demand and VPP power injection, avoiding increase in dispatchable generation.
Downward flexibility, on the other hand, refers to the ability of DSOs and VPPs to increase their electricity demand, or decrease injection of distributed generation, when there is an excess of electricity supply in the transmission network. This can occur during periods of low demand or when there is an excess of power supply due to VRE sources connected to the grid. By increasing their demand during periods of excess of power supply, DSOs and VPPs can help to maintain grid stability and prevent curtailments and congestions. The proposal of this paper models downward flexibility as increase in demand, avoiding renewable and Non-Dispatchable generation curtailment.
Upward and downward flexibility, considering power system operation, require sophisticated communication and coordination between TSO and DSOs, as well as advanced control and monitoring technologies. The use of digital platforms and real-time data analytics can help to facilitate this interaction and enable more efficient and reliable electricity grid operation.

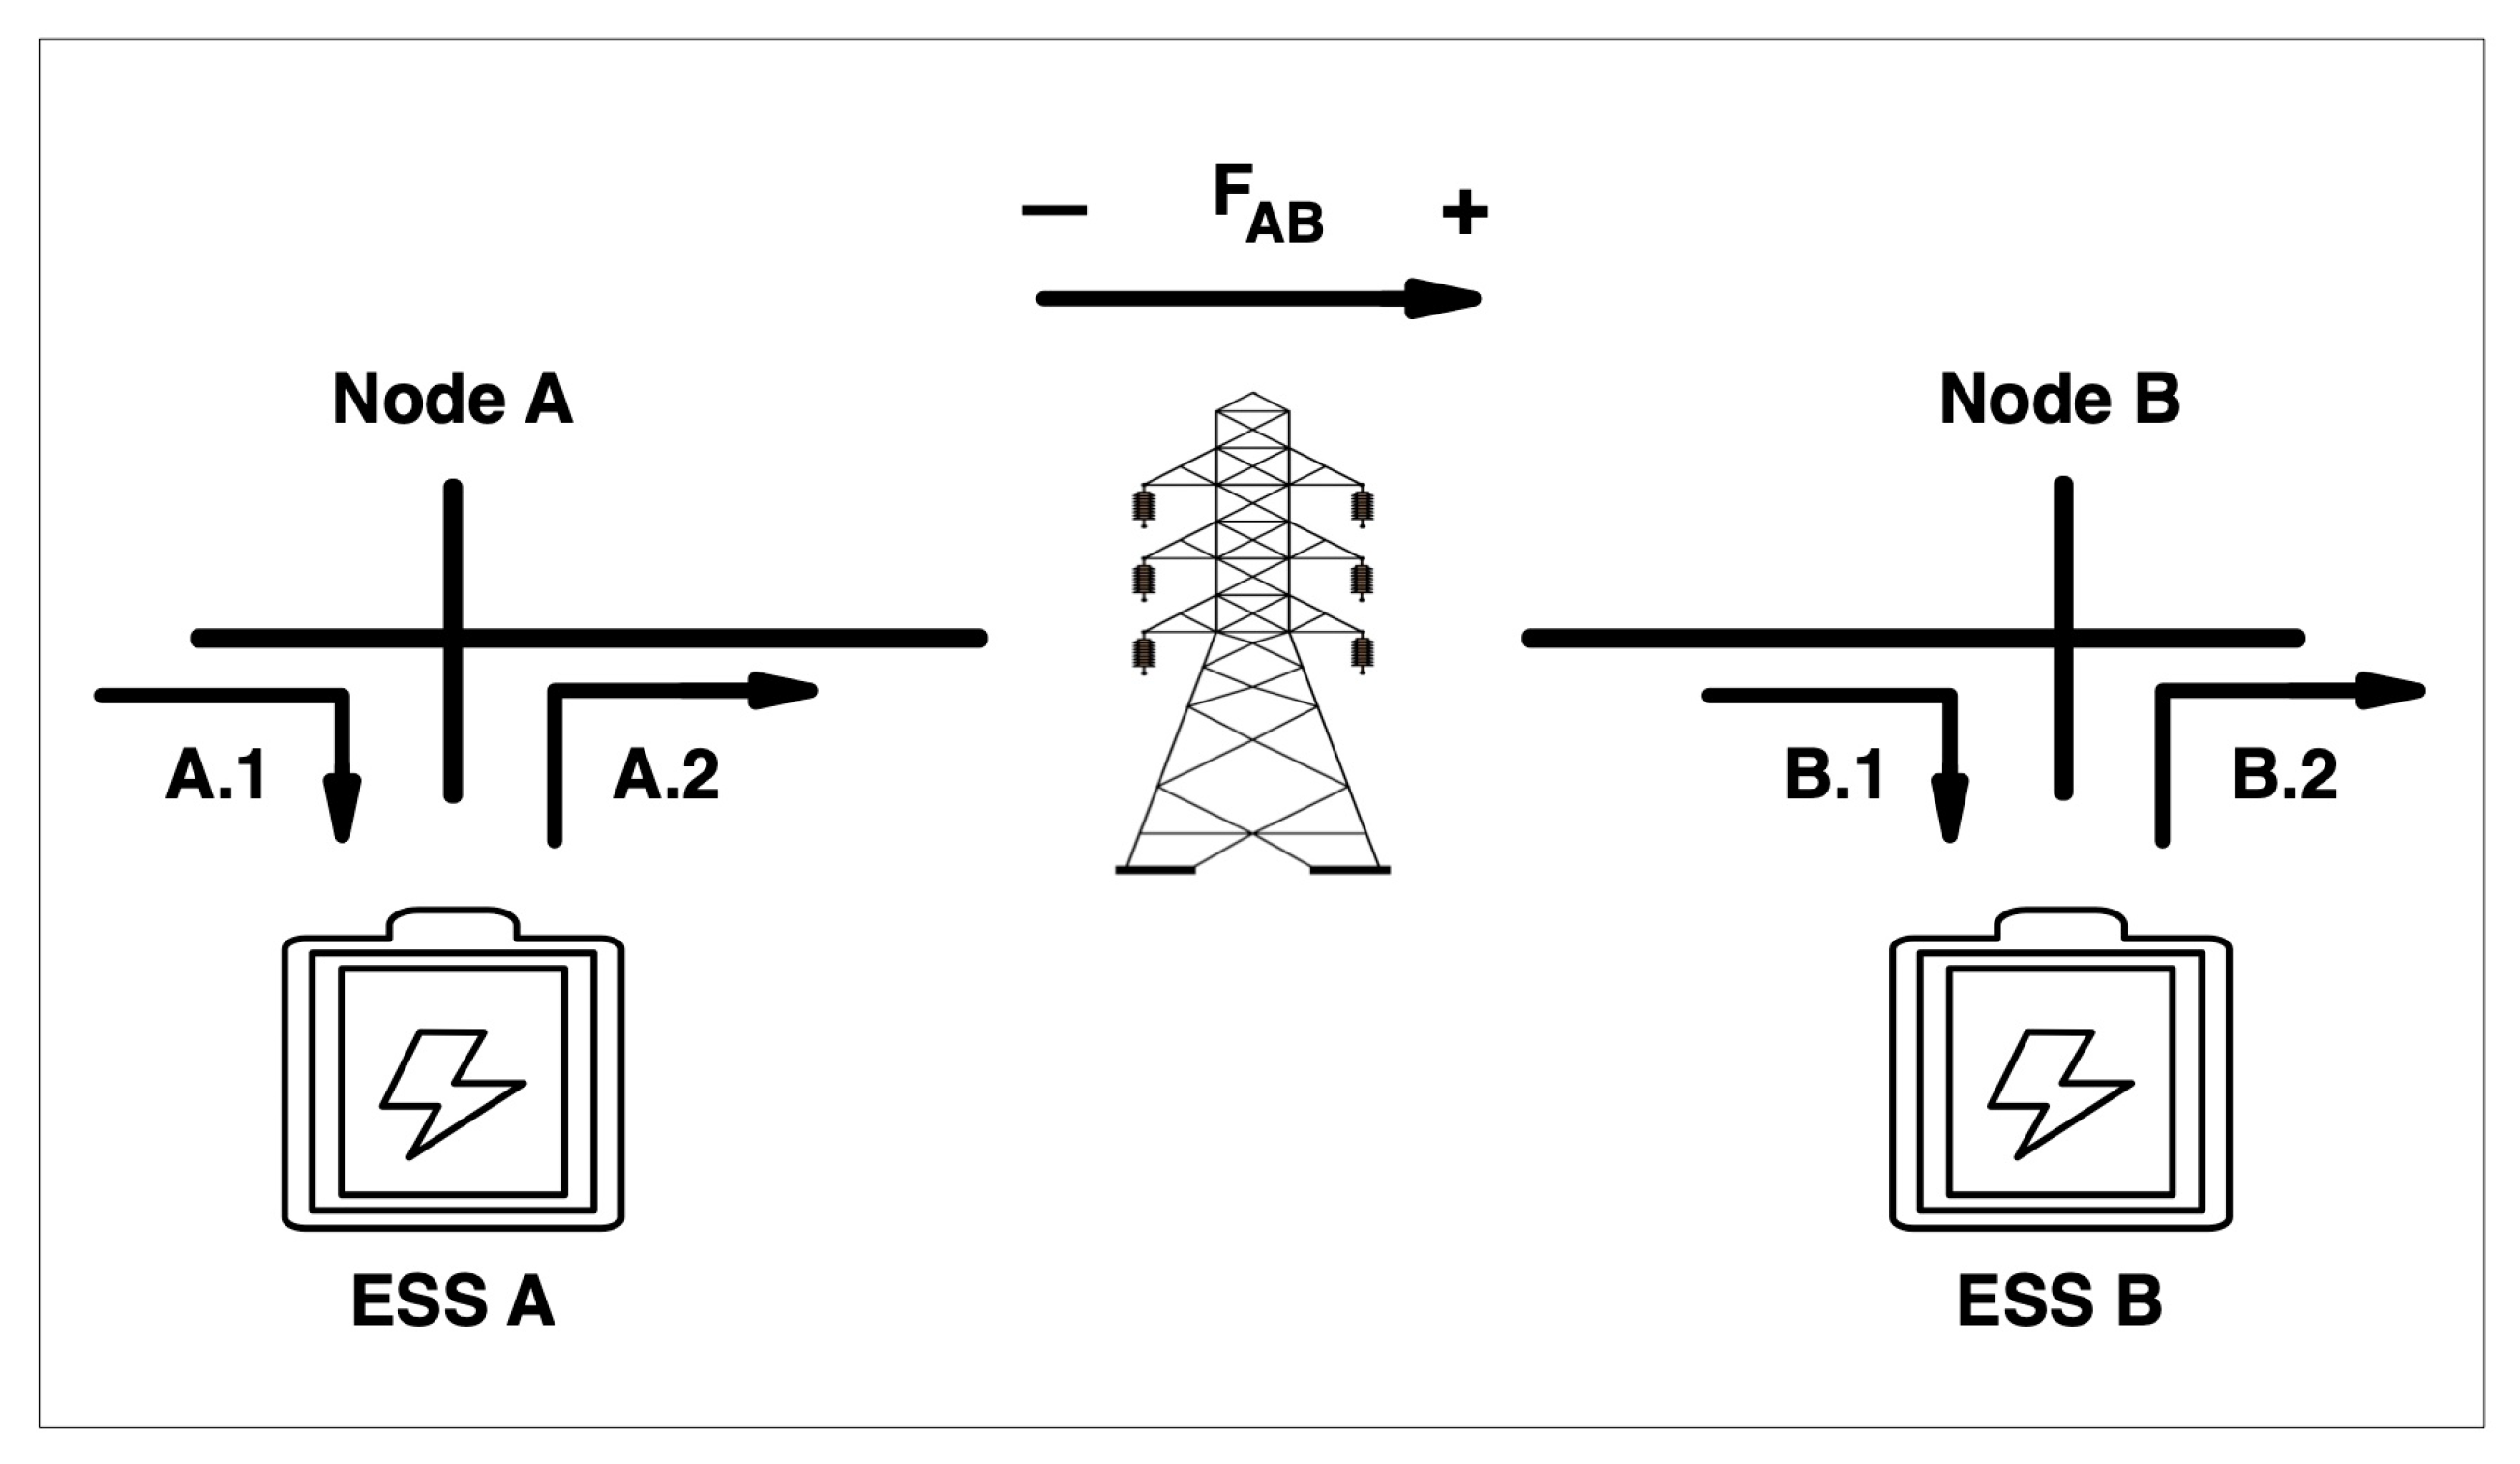
3.3. Virtual Power Lines

The concept of Virtual Power Lines (VPLs) is modeled in this paper considering as Energy Storage Systems (ESSs) that are used to defer the expansion of transmission lines by providing additional flexibility and control over the flow of electricity in the transmission system. Energy is stored during low demand stages and discharged during high demand stages. ESS used in this way, can better utilize existing transmission infrastructure and reduce or defer the need for new ou expansion of transmission lines [56,57]. This proposal model candidate virtual power lines as aggregated groups of ESS, located in multiple trasmission network nodes, with charge and discharge status compatible with hi and low availability of renewable energy, avoiding generation curtailment due to transmission congestion.
In Figure 2 a diagram is presented where the operation of an VPL can be illustrated, with the aim of describing the VPL model used in this work.
In the nodes where each end of a physical transmission line that has implemented the VPL concept is connected, in this figure called node A and node B, ESS are implemented to accumulate and discharge energy at controlled times, in this figure called ESS A and ESS B.
Each ESS unit operates permanently in charging or discharging status. In the example, in the Figure 2, the charge status of ESS A is indicated as A.1 and the discharge status as A.2, while the charge status of ESS B is indicated as B.1 and the discharge status as B.2.
The charging or discharging status of each ESS unit is controlled based on two indicators, the net demand stage, Figure 1, and the direction of power flow occurring on the transmission line.
To describe the four possible situations that an ESS unit can be in, depending on the net demand level and power flow in the transmission line, Table 2 presents the charging or discharging status of this unit for each situation.

3.4. Virtual Power Plants

Virtual Power Plants (VPPs) are defined as aggregated groups of Distributed Energy Resources (DERs), represented as generators, ESSs and demands, located in multiple transmission network nodes, each one with variable power output divided in stages with similar concept described in Section 3.1 [58].
In this paper, TGEP proposed model, it is assumed that some parties generation and associated demands are modelled as a set of VPPs that share the use of the transmissions system being planned.
In order to ensure the reliability and adequacy of the power system, dealing with an amount of Non-Dispatchable generation and uncertainties, the TGEP proposal considers procurement and dispatch of reserve capacity to handle unforeseen fluctuations in electricity supply or demand, which can arise due to various factors such as sudden changes in weather, equipment failures, or unexpected spikes in electricity consumption. This reseve capacity is contracted from those parties modelled as VPPs. The planned capacity to be contracted from the reserve market area considered as a planned cost, and at each stage that needs to be dispatched, the corresponding amount of energy cost is also computed.

3.5. Objective Function

The TGEP problem aims to minimize the total cost of investment and operation along the planning horizon. Considering the deterministic optimization, the objective function of the first implementation model is presented in (2). The objective function seeks to minimize the expansion plan investment cost and operational cost.
min t 1 1 + dr t C inv + C opr + C lc + C vrec
Where C inv is the investment cost, C opr is the operational and generation cost, C lc is the load curtailment cost and C vrec is the VRE curtailment cost.
To make investment projects with different useful life values comparable to each other, their useful life is extended to infinity, and the present value of the infinite series of installments is determined. This results in the sum of several installments, one in each period of time, brought to present value at a previously defined discount rate. The perpetuity financial model procedure used is based in [59].
Investment cost C inv , is detailed in (3). It is related to investment in new line circuits, dispatchable and non-dispatchable generation, and ESS units.
C inv = l , c IC l , t TL Circ l , c , t + cd , b IC cd , b , t D ip cd , b , t CD + cnd , b , p IC cnd , b , t ND ip cnd , b , t CND + h IC h , t ST InST h , t + l IC l , t VL InVL l , t
Operational cost C oper , is detailed in (4). It is related to power provided by dispatchable generation, reserve generation (VPP), ESSs and related to congestion of transmission lines.
C oper = vp , b , t OC vp , b , t VPR p vp , b , t , w VPRC + q vp , b , t , w VPRC + vp , b , t , s OC vp , b , t VPR p vp , b , t , s , w VPR + q vp , b , t , s , w VPR + b , t , s OC b , t D P b , t , s , w D + b , t , s OC b , t CD P b , t , s , w CD + b , t , s OC b , t FxU P b , t , s , w FxU + b , t , s OC b , t FxD P b , t , s , w FxD + b , t , s OC b , t dFxD dP F xD b , t , s , w RSP + b , t , s OC b , t dFxU dP F xU b , t , s , w RSP + h , t , s OC h , t ST p h , t , s , w STC + p h , t , s , w STD
Load curtailment cost C lc , is detailed in (5). It is related to situations of shortage of power or energy supply.
C lc = b , s OC b , t LC P b , t , s , w LC
VRE curtailment cost C vrec , is detailed in (6). It is related to situations of shortage of demand or insufficient transmission capacity.
C vrec = t 1 1 + dr t b , s OC b , t NDC P b , t , s , w NDC

3.6. Power Balance Constraints

P vp , b , t , s , w VPR + P vp , b , t , s , w VPRC + P vp , b , t , s , w VPD + P vp , b , t , s , w VPND + P b , t , s , w D + P cd , b , t , s , w CD + P cnd , b , t , s , w CND + P b , t , s , w LC + b f l , t , s , w + P b , t , s , w FxU + p h , t , s , w STD p h , t , s , w STC + dP _ FxU b , t , s , w RSP = P cnd , t , s , w NDC + ndP b , t , s . w + dP _ FxD b , t , s , w RSP + dP b , t , s RSP + P b , t , s , w FxD v , b , t , s
q vp , b , t , s , w VPR + q vp , b , t , sw VPD + q vp , b , t , sw VPND + q b , t , sw D + q cd , b , t , sw CD + q cnd , b , t , sw CND + b fQ l , t , s , w = ndQ b , t , s , w + dQ b , t , s RSP v , b , t , s

3.7. Demand Response Constraints

dP _ FxU b , t , s , w RSP dP b , t , s RSP dBand b , t , s RSP b , t , s
dP _ FxD b , t , s , w RSP dP b , t , s RSP dBand b , t , s RSP b , t , s

3.8. Reference Bar and Voltage Constraints

teta vref , t , s , w = 0 t , s
V vref , t , s , w = 1 t , s
deltaV vref , t , s , w = 0 t , s
v b , t , s , w = 1 + deltaV b , t , s , w b , t , s

3.9. Transmission Line Circuits Constraints

c Circ l , c , t Line _ MaxCirc l l , t
f l , t , s , w c LCirc _ CapP l , c l , t , s
f l , t , s , w = deltaV b l o , t , s , w deltaV b l d , t , s , w admitG l teta b l o , t , s , w teta b l d , t , s , w admitB l l , t , s

3.10. Transmission Line Circuits Constraints AC Linearized

fQ l , t , s , w = 1 + 2 deltav b l d , t , s , w admitB 0 l deltav b l o , t , s , w deltav b l d , t , s , w admitB l teta b l o , t , s , w teta b l d , t , s , w admitG l l , t , s

3.11. Transmission Line Circuits Constraints AC - Second-Order Cone Constraint

f l , t , s , w 2 + fQ l , t , s , w 2 LCirc C apVA l 2 l , t , s

3.12. Energy Storage System Constraints

ESS h , t , w = s p h , t , s , w STC p h , t , s , w STD pDur s + ESS h , t 1 . w h , t
ESS h , t , w ESS h , t , w CAP h , t
p h , t , s , w STC soc h , t , s , w . P h STMax h , t , s
p h , t , s , w STD 1 soc h , t , s , w . P h STMax h , t , s

3.13. Virtual Power Line Constraints

f l , t , s , w Sign 1 = f l , t , s , w
f l , t , s , w Sign 1 VPL _ Fij 1 _ St l , t , p , s , w M
f l , t , s , w Sign 1 M 1 VPL _ Fij 1 _ St l , t , p , s , w + VPL _ Fij 1 _ St l , t , p , s , w 0 . 001
VPL _ Carg 1 _ St l , t , s , w = Pat _ VPL _ Ind p + ( 1 VPL _ Fij 1 _ St l , t , p ) . VPL _ Fij 2 _ St l , t , p
VPL _ Carg 1 _ St l , t , s , w + Pat _ VPL _ Ind p < = 1 + VPL _ Fij 1 _ St l , t , p
f l , t , s , w Sign 2 = f l , t , s , w
f l , t , s , w Sign 2 VPL _ Fij 2 _ St l , t , p , s , w M
f l , t , s , w Sign 1 M 1 VPL _ Fij 2 _ St l , t , p , s , w + VPL _ Fij 1 _ St l , t , p , s , w 0 . 001
VPL _ Carg 2 _ St l , t , s , w = ( 1 VPL _ Carg 1 _ St l , t , s , w )
f l , t , s , w M
f l , t , s , w M

3.14. Flexibility Constraints

P b , t , s FxD iFxD b , t . p _ max b FxD b , t , s
P b , t , s FxU iFxU b , t . p _ max b FxU b , t , s

3.15. Virtual Power Plants Constraints

p vp , b , t , s , w VPD p _ max vp VPD vp , b , t , s
q vp , b , t , s , w VPD q _ max vp VPD vp , b , t , s
p vp , b , t , s , w VPR p _ max vp VPR vp , b , t , s
q vp , b , t , s , w VPR q _ max vp VPR vp , b , t , s

3.16. Power Limits Constraints

p b , t , s , w D p _ max b D b , t , s
q b , t , s , w D q _ max b D b , t , s
p b , t , s , w NDC P cnd , b , t , s , w CND b , t , s
p b , t , s , w CD p _ max b CD b , t , s
q b , t , s , w CD q _ max b CD b , t , s

4. Problem Formulation - Modeling Uncertainties

The Data-Driven Distributionally Robust Optimization (DDDRO) method has been developed to identify the worst-case probability distribution across a range of ambiguities, effectively integrating elements of Stochastic Programming (SP) and Robust Optimization (RO) [10]. This approach utilizes historical data to craft various scenarios, applying worst-case probabilities backed by a moment-based ambiguity set to establish the probability distribution. DDDRO allows for the formulation of a two-stage robust optimization problem, aiming to determine the maximum cost within an uncertainty set. As the number of scenarios grows and the problem becomes nonlinear, the complexity rises significantly. To address this, a Duality-Free Decomposition method is used, in order to transforms the bi-level (max-min) problem into two independent subproblems [60,61].
Using DDDRO to model uncertainties, the objective function presented in 2 is reorganized. The variables associated with investments are considered decision variables in the first level. In this level, the decision variables that minimize the investment costs of candidate transmission lines, dispatchable generation, planned VRE generation and VPL BESS infrastructure are optimized ( IC l , t TL , IC cd , b , t D , IC cnd , b , t ND , IC h , t ST , IC l , t VL ).
At the second level, the variables related uncertainties, net demand and candidate VRE generation are optimized ( P cnd , b , t , s , w CND , ndP b , t , s . w , ndQ b , t , s , w ), considering tha maximization, the worst realization, hi operational cost.
At the third level, the vector of operating variables is minimized ( p v , b , t , s , w VPR , q v , b , t , s , w VPR , p v , b , t , s , w VPD , q v , b , t , s , w VPD , p v , b , t , s , w VPND , q v , b , t , s , w VPND , p b , t , s , w D , q b , t , s , w D , p b , t , s , w CD , q b , t , s , w CD , p b , t , s , w ND , q b , t , s , w ND , p b , t , s , w CND , q b , t , s , w CND , p b , t , s , w NDC , p b , t , s , w FxU , p b , t , s , w FxD , iFxD b , s , w , iFxU b , s , w , dP b , t , s , w , dQ b , t , s , w , dP b , t , s , w RSP , dQ b , t , s , w RSP , p b , t , s , w LC , p h , t , s , w STD , p h , t , s , w STC , v b , t , s , w , θ ij , t , s , w ).
Details of this modeling can be found at [18].
This three level model, as presented in (60), is solved using Column and Constraint Generation as proposed in [62]. Duality-Free Decomposition method is used to transform the bi-level (max-min) problem into independent subproblems.

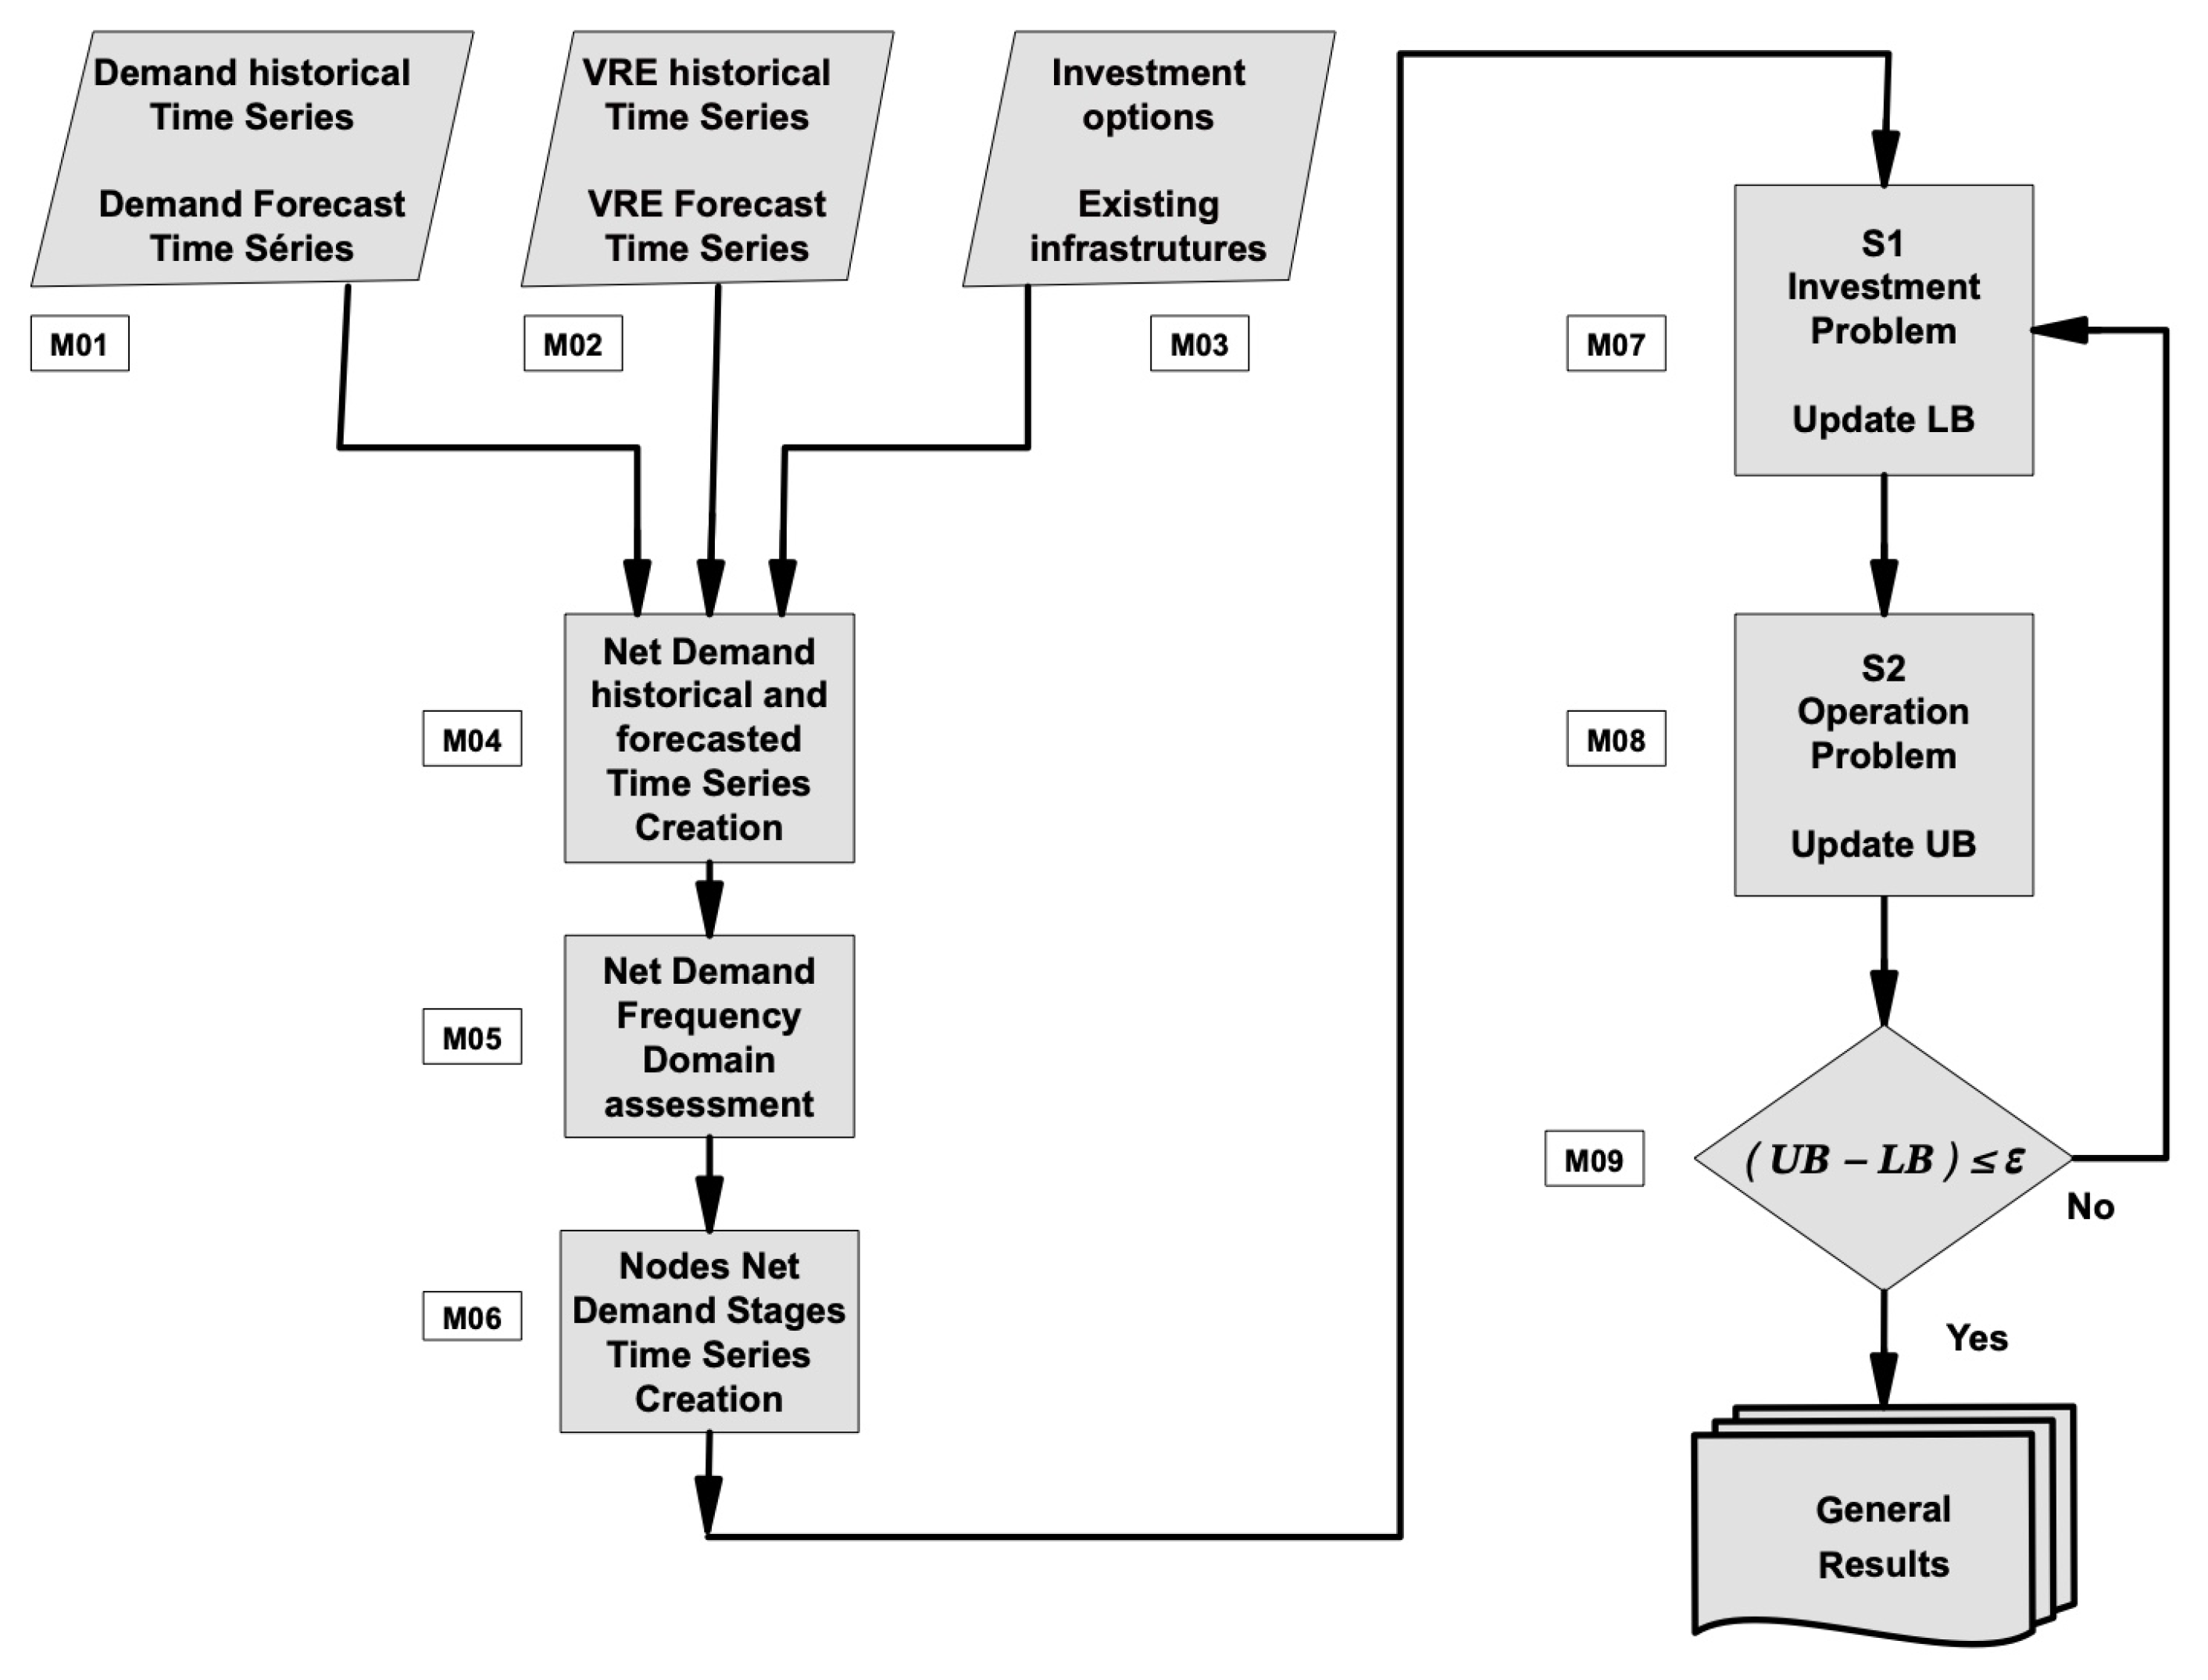
5. Solution Procedure

5.1. Deterministic Procedure

TGEP problems are considered computationally heavy to solve. These planning problems involve a large number of integer and continuous variables and constraints, especially when considering long-term planning horizons and multiple scenarios or uncertainties. The complexity increases with the size of the power system, the number of potential new generation units, and the possible expansion options for the transmission network. Solving large mixed-integer linear or nonlinear optimization problems requires sophisticated numerical algorithms and optimization techniques. As the size of the problem grows, the search space becomes larger, and it becomes more challenging to find the optimal solution within a reasonable time frame.
One approach to deal with this complexity is distributed optimization. ADMM is proposed in [63] [64], and the ability to achieve a converged solution depends on the penalty parameter tuning. Another approach is the use of decomposition, and the main methods that have been used are Benders [65] and Constraint and Column Generation (CCG), and it is considered to converge faster then Benders decomposition [66,67].
The proposed expansion model will be solved using CCG decomposition as defined in [62]:
min y c T y + η
s.t.
Ay d
η b T x l , l = 1 , . . . r
Ey + G x l h , l = 1 , . . . r
y S y
x l S x , l = 1 , . . . r
S y R n , S x R m
The decision variables of vector y of (50) are the binary variables referring to investments in transmission lines, storage, generation units and virtual power lines. These are the first-stage variables of CCG decomposition. Vector c of (46) defines the investment costs.
The decision variables of vector x l of (48) are the recourse decision variables of second-stage of CCG decomposition, related to operating conditions of the planned power system at each stage. These second-stage variables [ x 1 , x 2 , . . . , x r ] represent the CCG columns that are created at each solution procedure step.
Solution Procedure algorithm (CCG):
  • Set LB = , UB = + , k=0 and O =
  • Solve the following Master Problem:
    min y , η c T y + η
    s.t.
    Ay d
    η b T x l , l O
    Ey + G x l h , l k
    Solution: y k + 1 , η k + 1 , x 1 , . . . , x k
  • Update LB = c T y k + 1 + η k + 1
  • Solve the following Slave Problem:
    min x b T x
    s.t.
    G x l h Ey k + 1 , l k
  • Update UB = min [ UB , c T y k + 1 ]
  • If UB LB ε return y k + 1 and finish
  • Create variables x k + 1
  • Add the following constraints to Master Problem:
    Ey + G x k + 1 h
  • Update k = k + 1 and Go to Step 2

5.2. Procedure Considering Uncertainties

In order to consider uncertainties related to net demand and candidate VRE, module M08 of Figure 3 is decomposed in two problems. An upper level determines the maximum cost within an uncertainty set. The lower level, minimizes the operational costs of each scenario corresponding to an uncertainty set.
max w Ω W π w 0 min x Ω y , w b t x

5.2.1. Ambiguity Set

Probability distribution functions related to uncertain variables may not be available. As an alternative, historical data is an option to obtain an approximation of the probabilities of a scenario of interest. Historical data can be converted into data bins, where an estimated probability distribution function (E-PDF) is established from the data bins, which allows the definition of the true probability distribution function (T-PDF) within a tolerance range. In [10], a confidence uncertainty set is proposed to cover all possible probability realizations by making the most of historical data and then estimating the distribution of worst-case uncertainties for all scenarios ( Ω W ) according to the number of data bins (MD). Two norms L 1 and L are used to construct the confidence uncertainty set based on historical data, which has been proved to converge to truth probability distribution when data points increase to infinity [68]. The confidence uncertainty set can be formulated as (61) [10].
Where N historical data points are partitioned into M D bins. Data points in each sample bin, sequentially denoted as N 1 , N 2 ,…, N D , and the E-PDF can be estimated as π 1 0 = N 1 /N,…, π D 0 = N D /N.
Ψ amb = π w π w π w 0 1 = w = 1 M D π w π w 0 δ 1 π w π w 0 = max 1 w M D π w π w 0 δ w = 1 M D π w = 1 π w 0 , w = 1 , 2 , M D
The right-hand thresholds δ 1 and δ in (61) refer to tolerance coefficients associated with given confidence level and historical data. As more historical data is inserted, the uncertainty set shrinks and E-PDF gets closer to the T-PDF. If the confidence level of two norms are described as α 1 and α 2 , the tolerance coefficients can be reformulated as (62) [69].
δ 1 = M D 2 N ln 2 M D 1 φ 1 ; δ = 1 2 N ln 2 M D 1 φ

5.2.2. Duality-Free Approach

The decomposition module M08 of Figure 3 in two problems (60) is necessary to find the critical scenario of the uncertainty set that provides an upper bound (UB). New variables and constraints are added to the master-problem M07 to obtain a lower bound (LB). The master-problem and the decomposed M08 are solved iteratively ( th ) and the method stops until the relative difference between the upper and lower bounds is less than a preset convergence tolerance E .
The subproblem is a max-min bilevel problem with a structure that can be decomposed into several small subproblems without the duality information [60]. Given that between constraints associated with x and associated with w , there are no variables in common, the feasible region bounded by the variables x is disjoint with the ambiguity set Ψ amb .
For each scenario w an optimal solution x is obtained through an internal minimization problem, and this solution is fixed to an external maximization problem, to find the probability of the worst case scenario w .

6. Case Studies

This section considers two case studies to validate the proposed model to optimize the Transmission and Generation Expansion Planning process, considering Virtual Power Lines, Virtual Power Plants, Distributed Energy Injection, and Demand Response Flexibility. The implementation was programmed in Python 3.11.0, using Spyder 5.4.3, Pyomo 6.5.0 and Gurobi 10. All processing were done unsing an Apple Studio M1 64 GB. The data for historical demand and VRE generation were obtained from [70], considering the period from 01/2015 - 12/2023 related to Spain, converted to p.u. in order to be used with the two systems in Section 6.2 and Section 6.3. Files with data relating to investment, operating costs and demands used in this research can be obtained at [71].

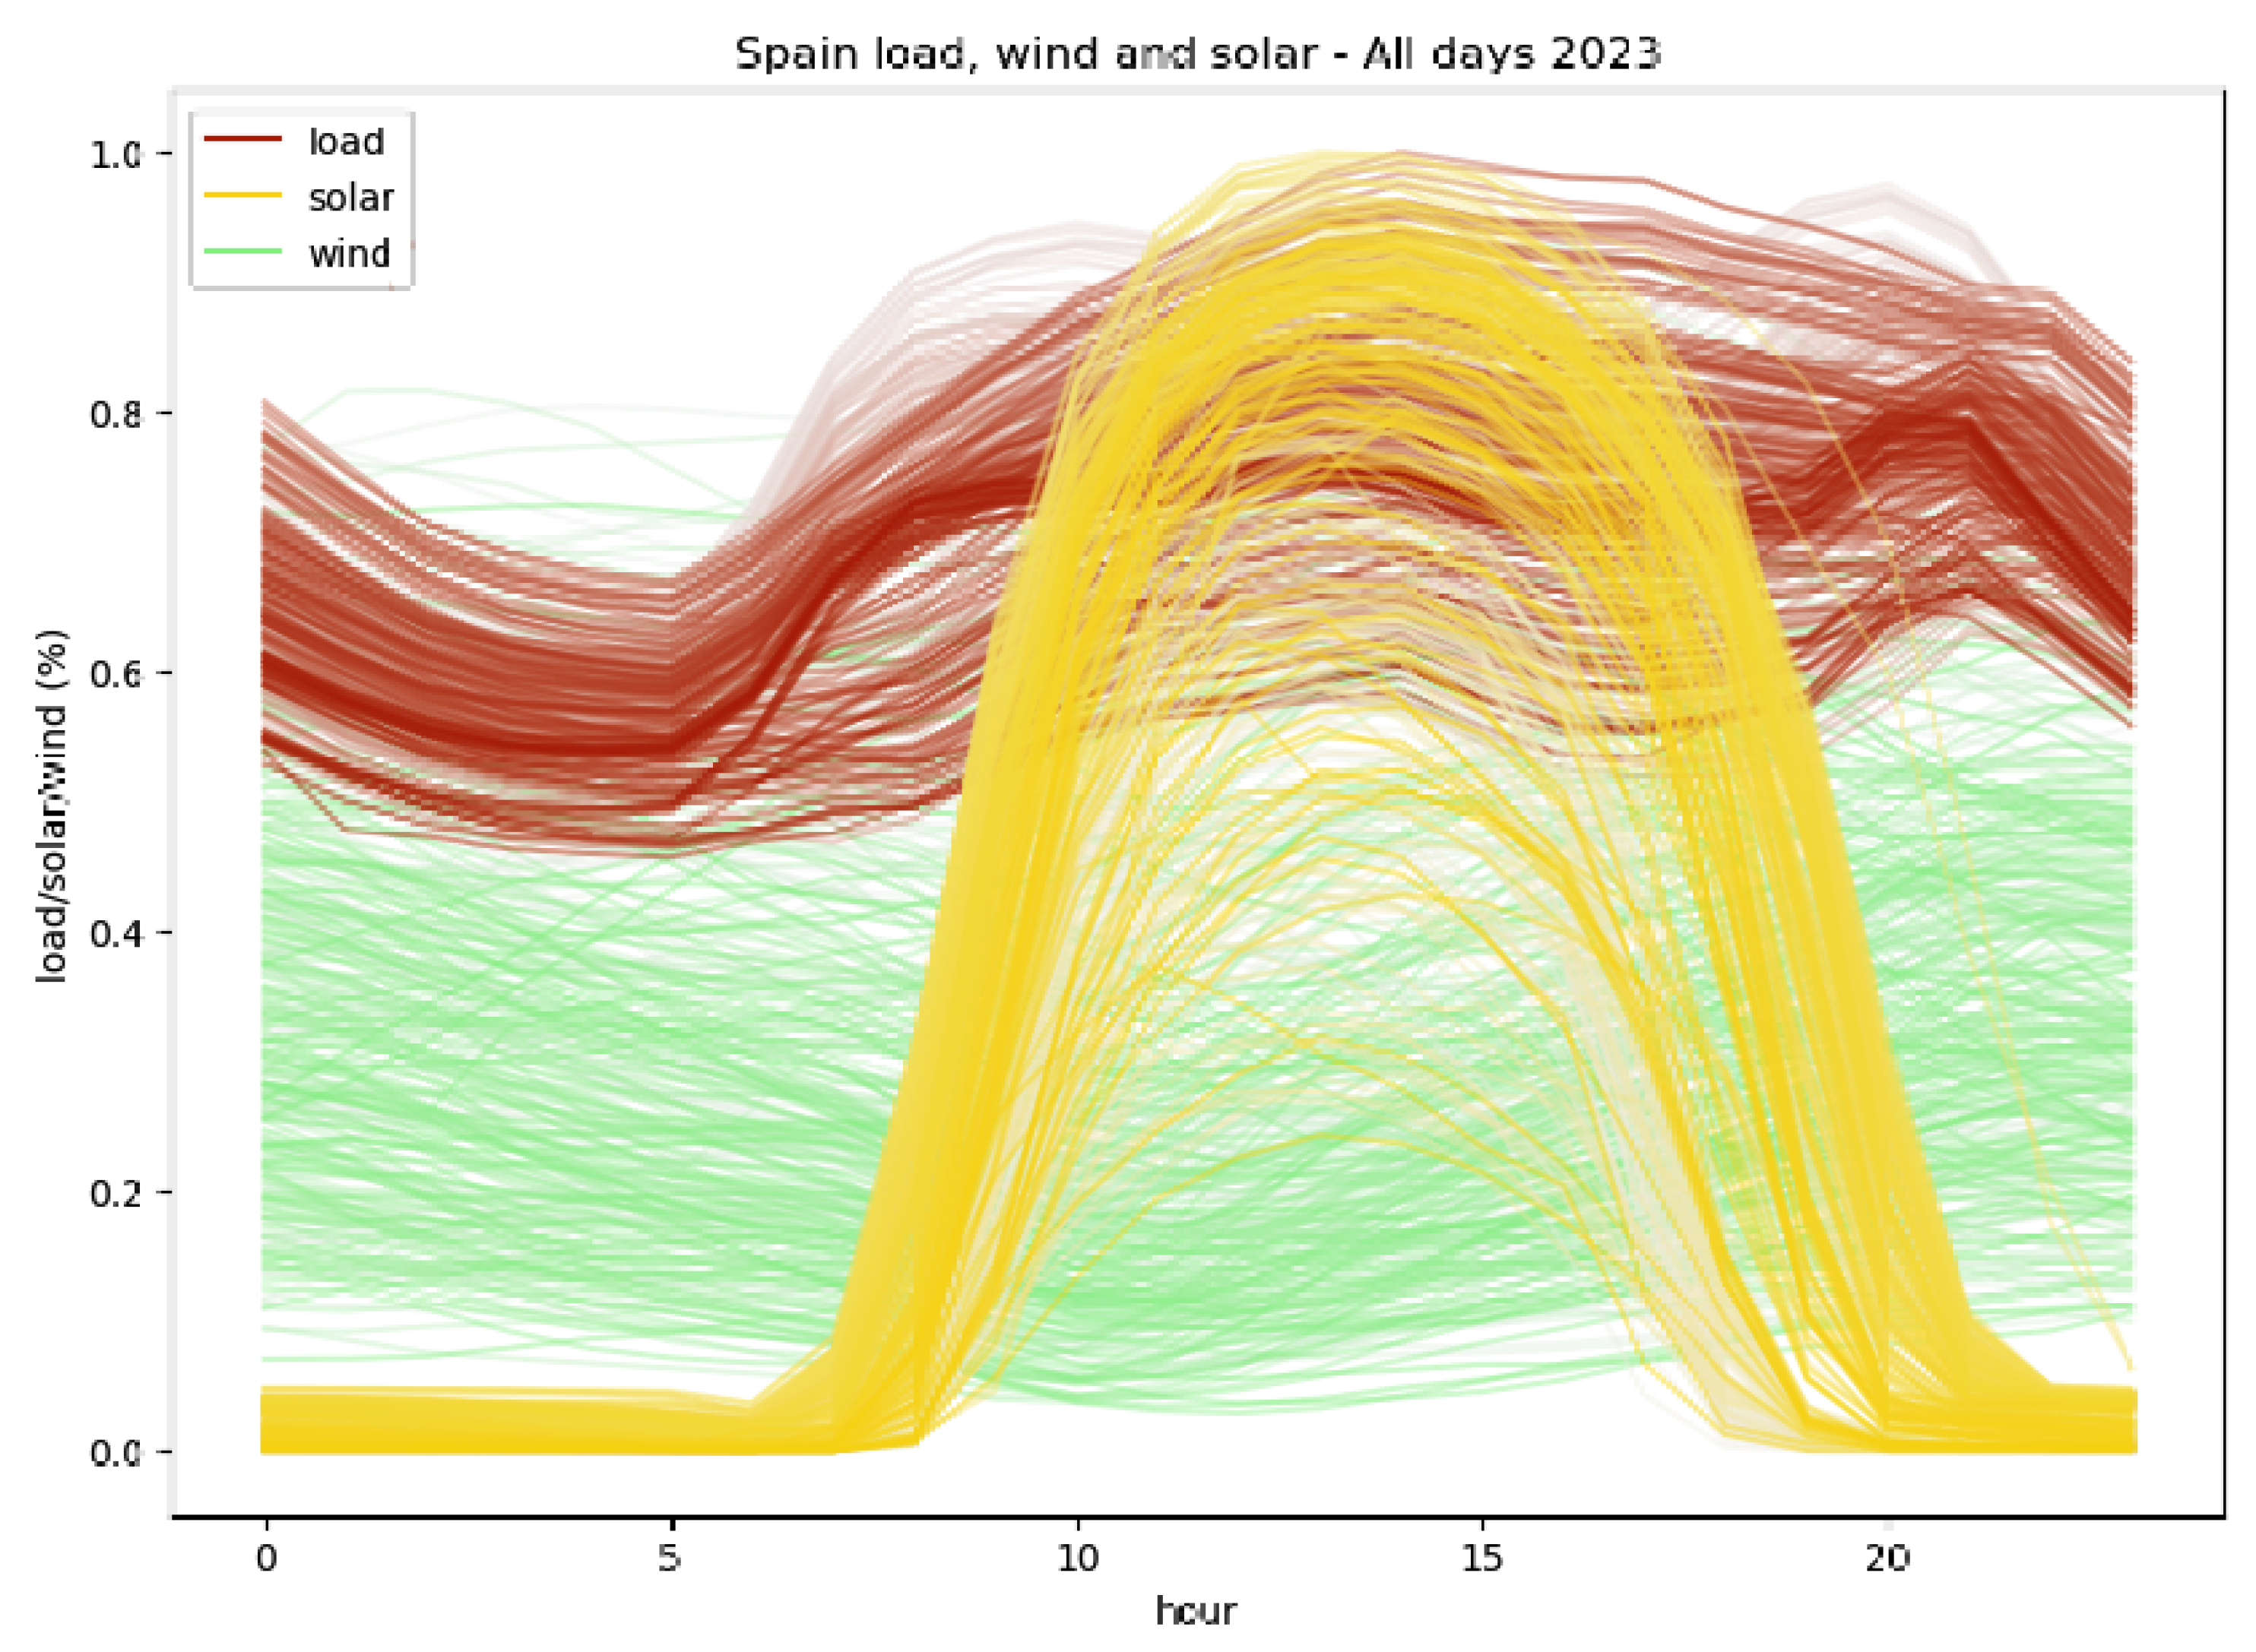
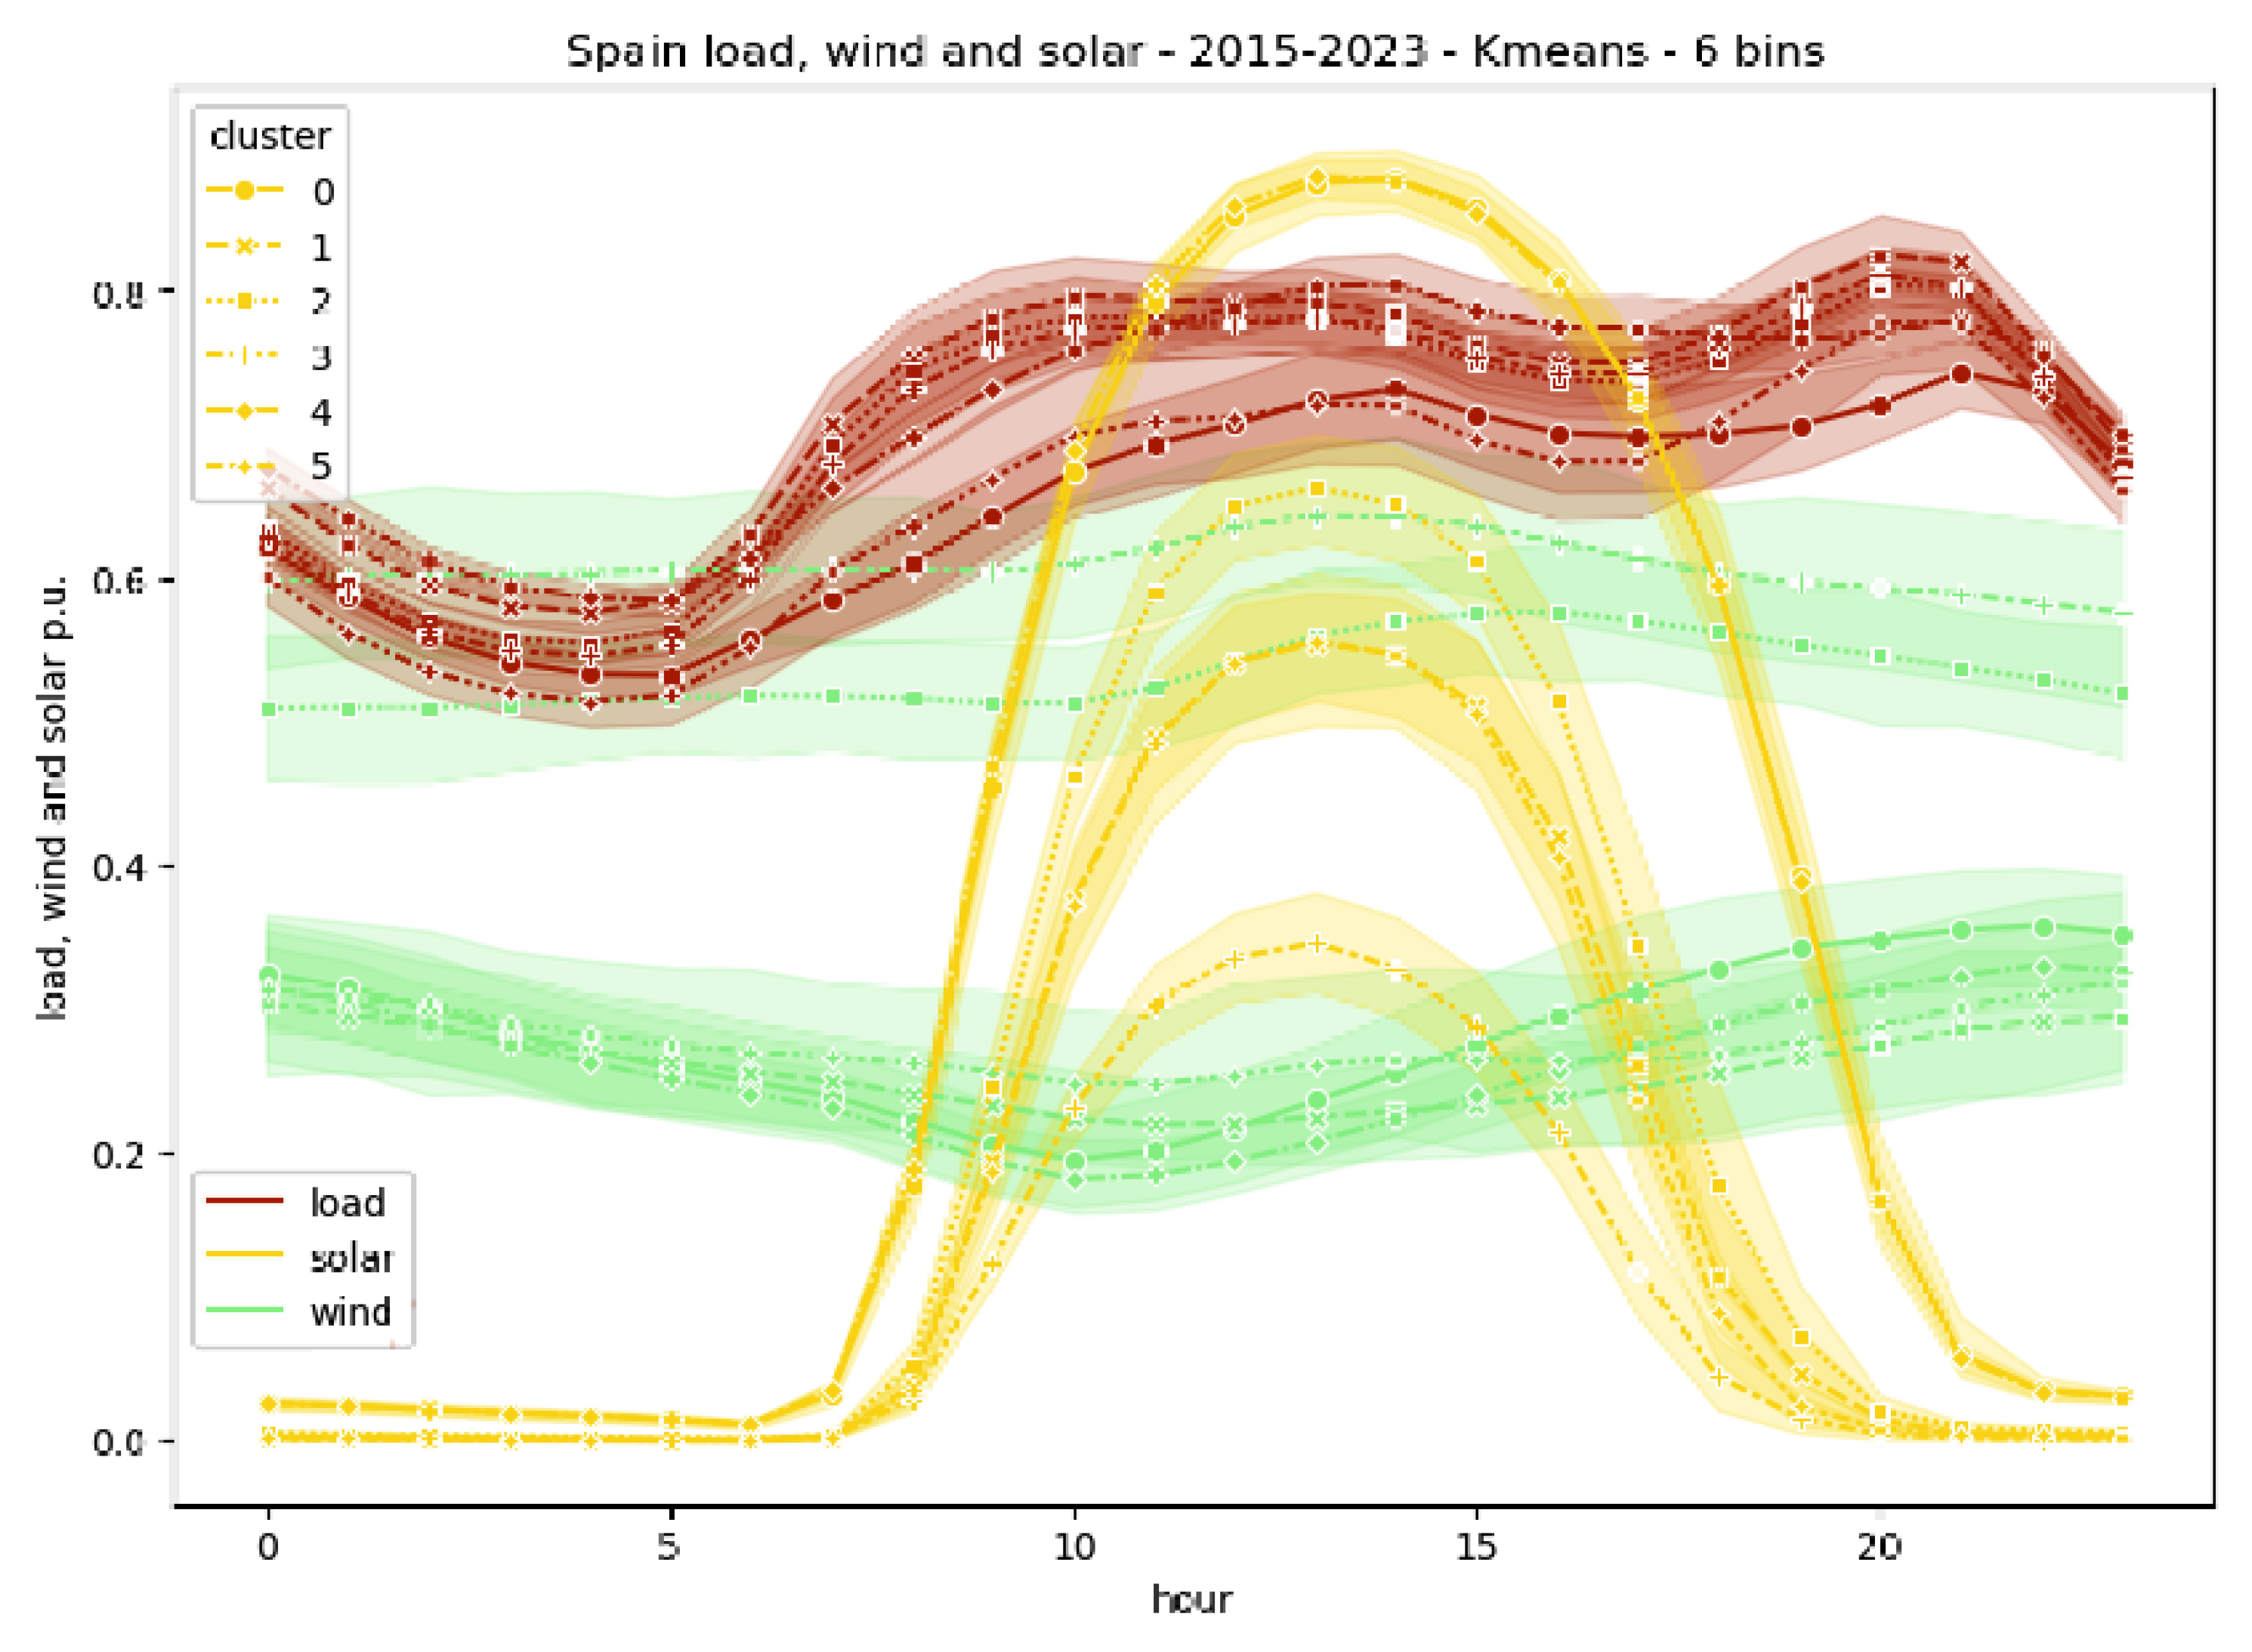
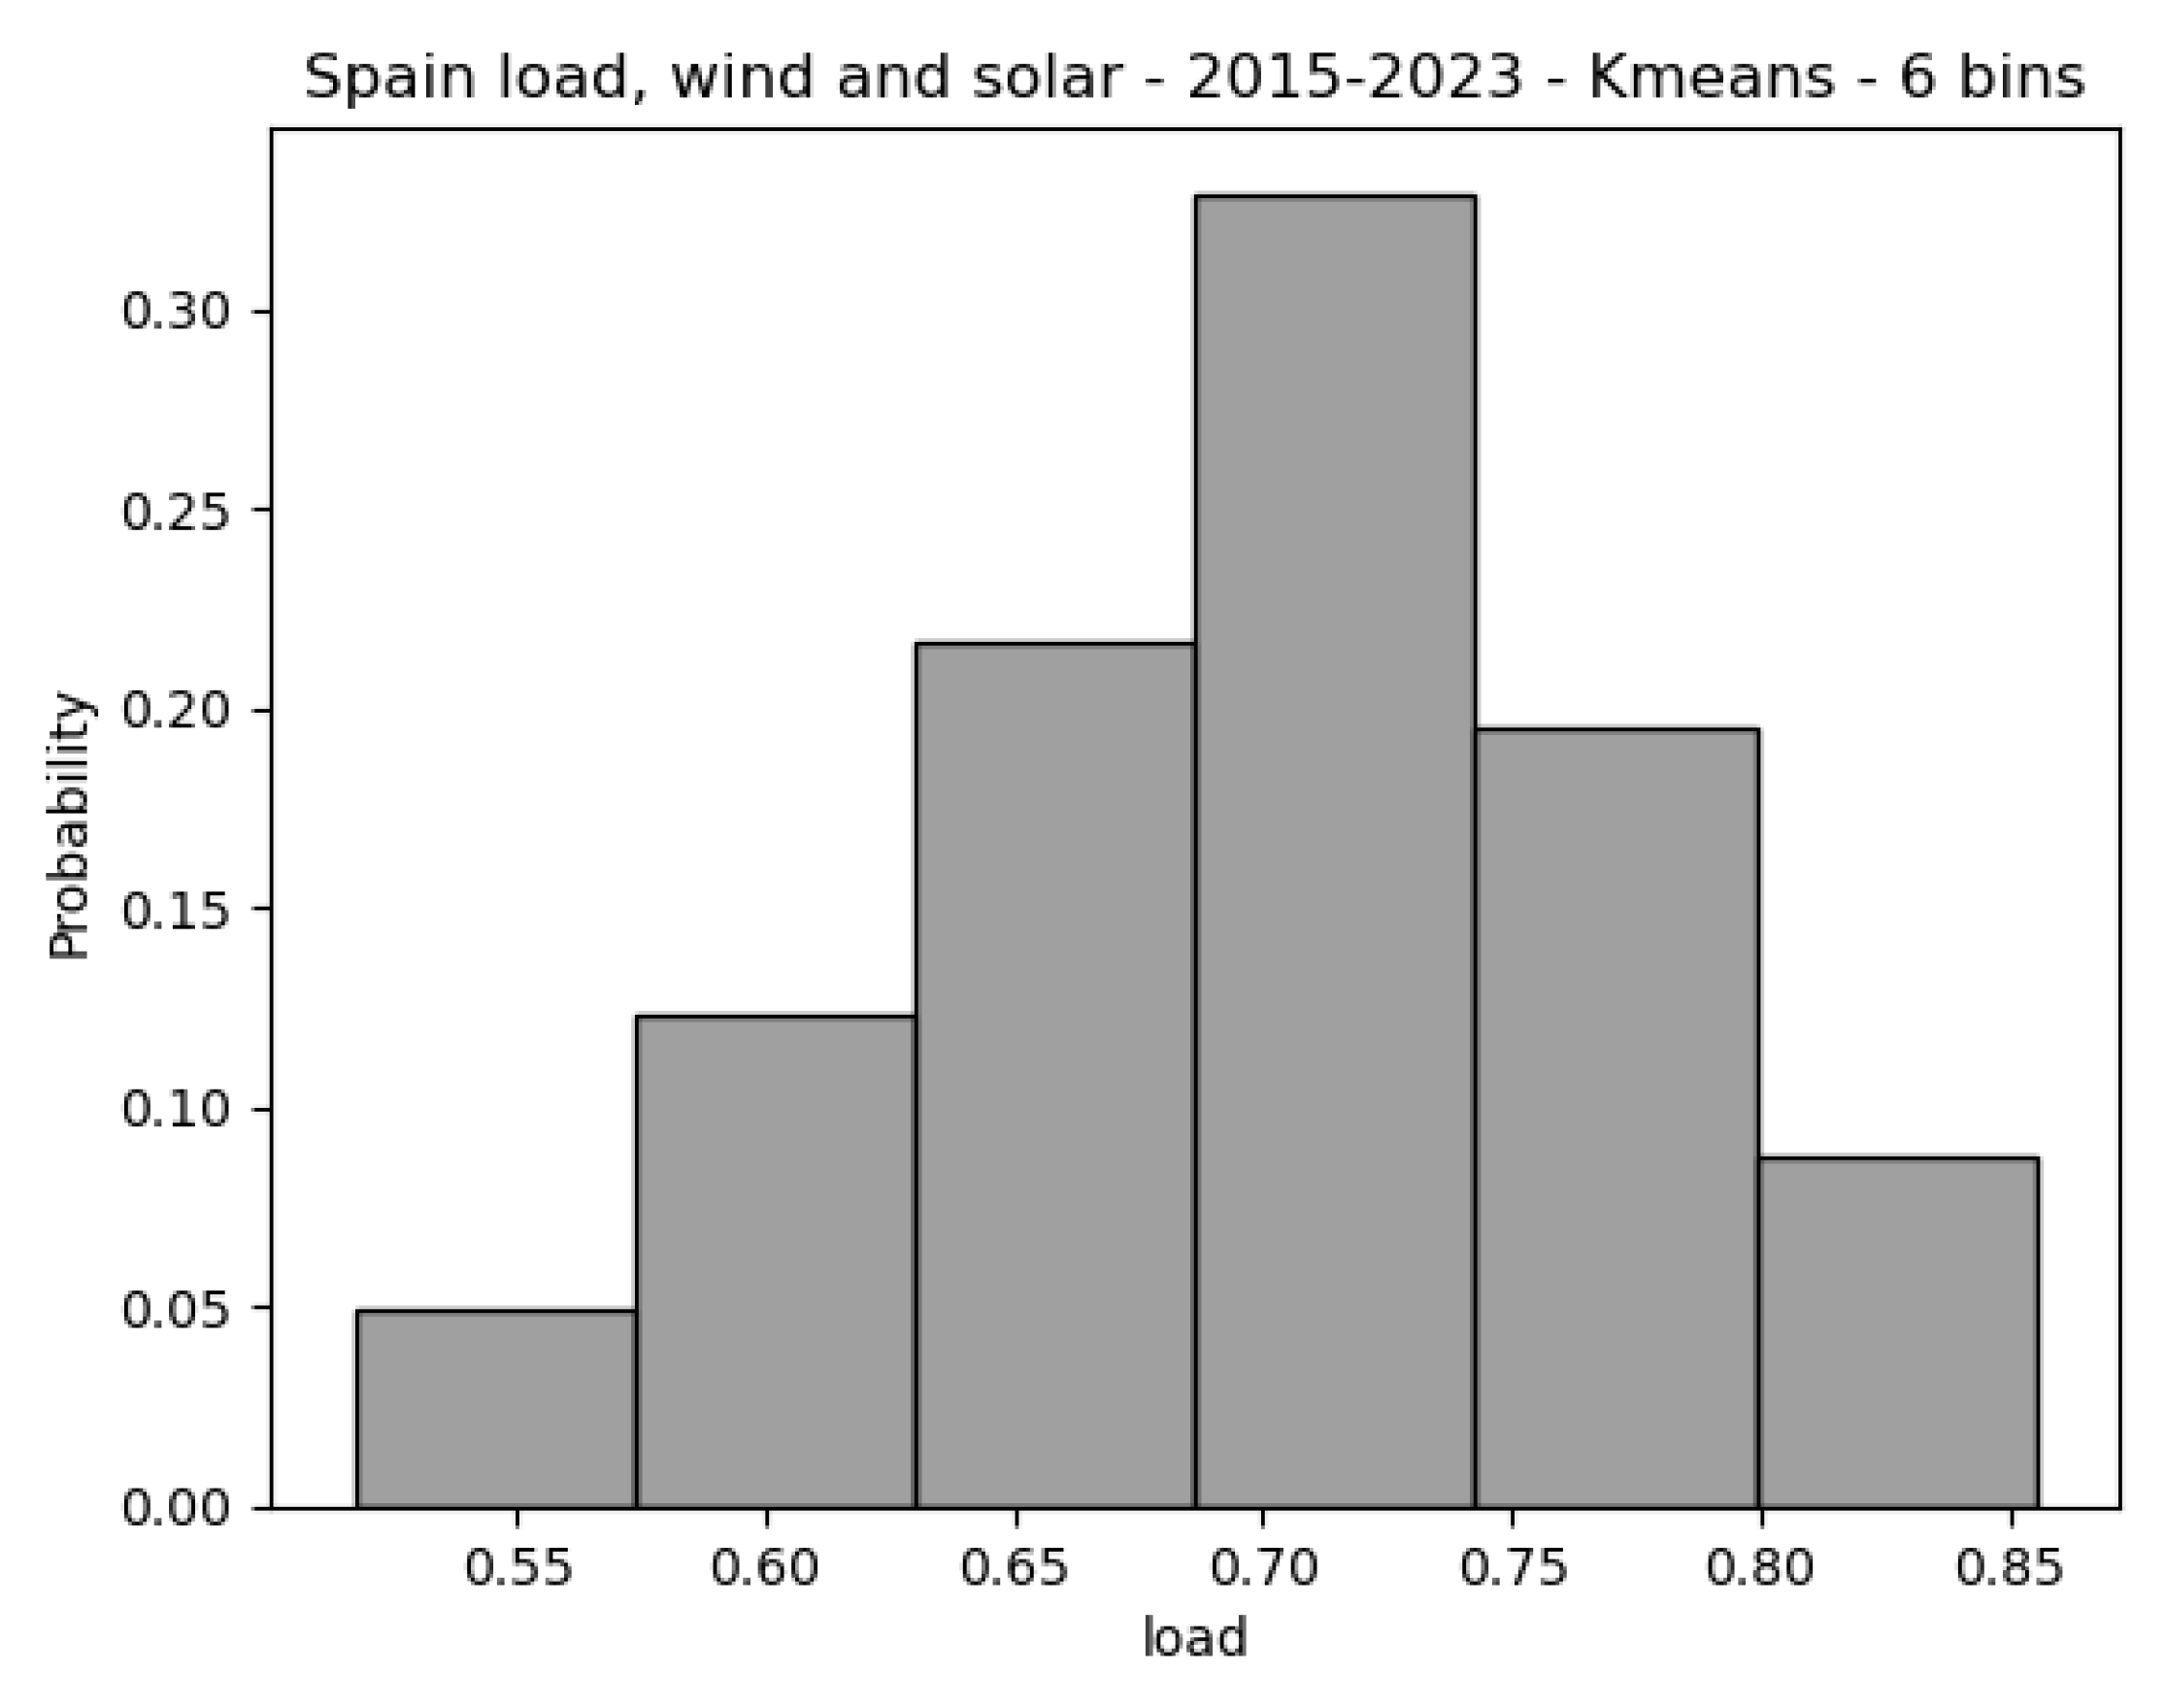
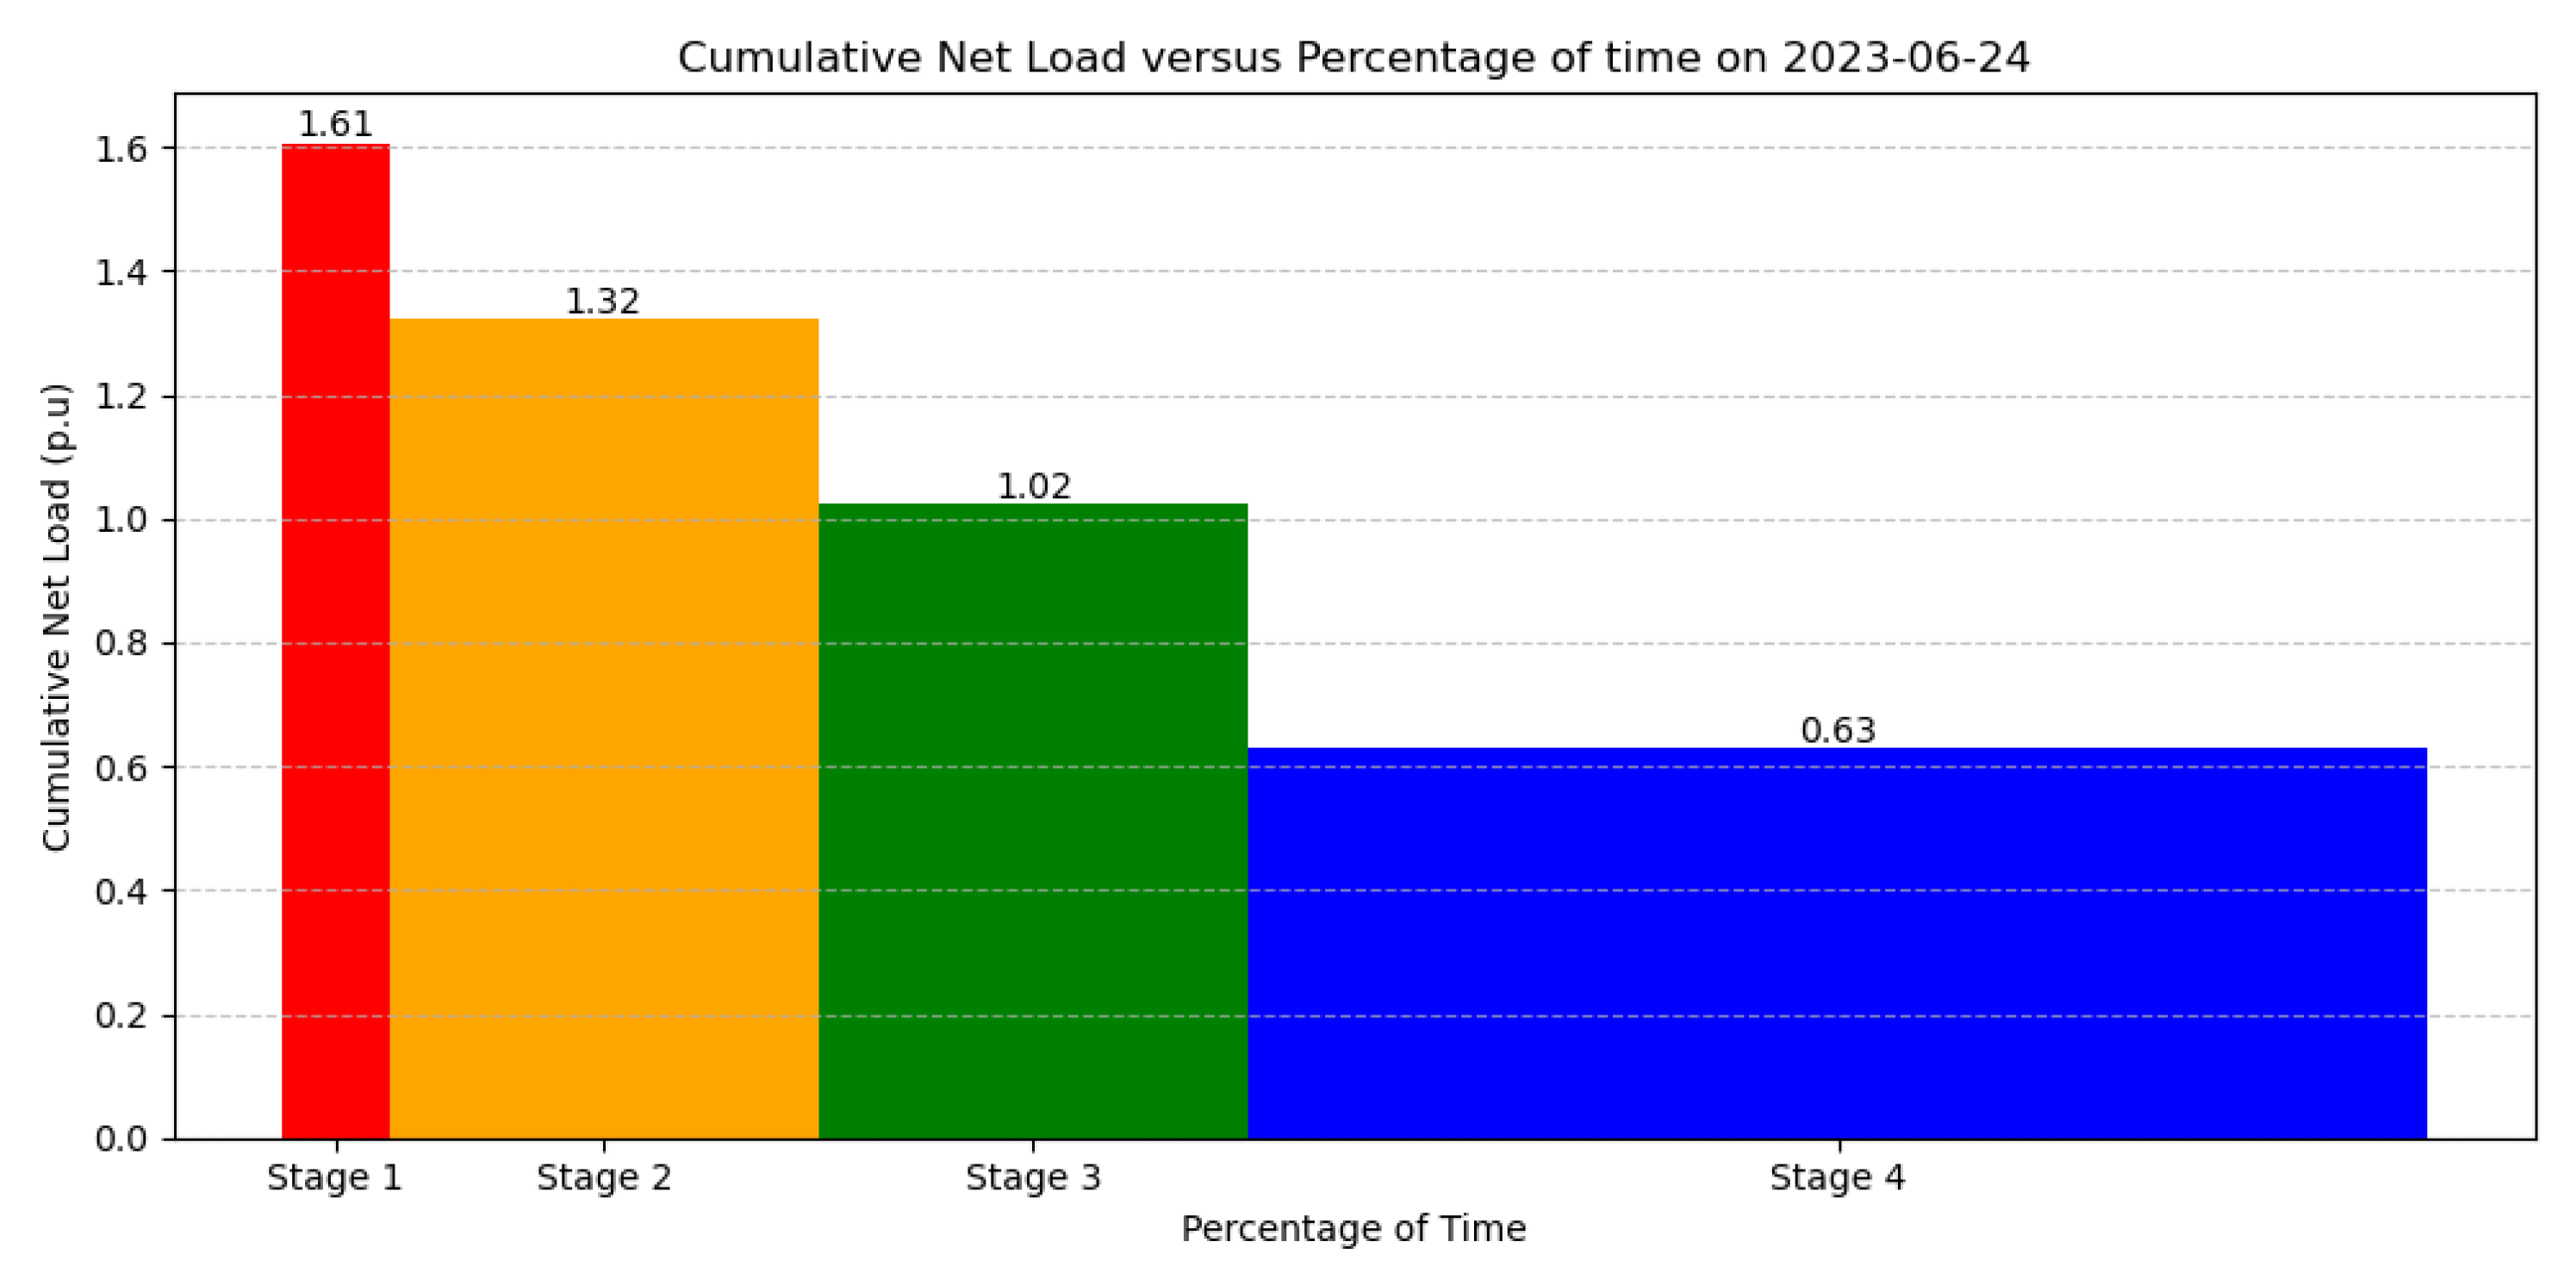
6.1. Cluster of Data Bins

Data-driven methodology can produce typical demand scenarios and related confidence uncertainty sets. Hourly historical data on VRE injection and demand power are proposed and available at [72] covering the period of one year. To use the Data Driven methodology with a greater amount of historical data, a period of nine years was considered, with fifteen-minute interval measurements, from [70], as described in Section 6. Considering the results reported in [73], the sample space was partitioned into six data bins to represent random output net demand and produce discrete probability distributions with good results.
In Figure 4 it is presented an example of the historical data that was used, presenting the historical series of average measurements of the four measurements for each hour of one of the historical years used.
Considering this historical time series, clustering methods such as K-means were employed to aggregate all data points into a representative scenario in each bin so that the estimated probability distribution is obtained by counting the frequency of data samples falling into each bin, considering the averaged metric of demand and VRE injection (wind and solar) as representative scenarios. Considering this context, Figure 5 shows six clusters (scenarios) as a function of the time of a day (15 minutes period).
Figure 6 shows the probabilities of each cluster (scenario) obtained from the clustering process.
In this proposal, Net Demands are modeled using the load duration curve, which shows the relationship between the accumulated load and the percentage of time in which this load occurs. The planning model uses Net Demand for a given time interval divided into steps, which are related to the Net Load block curves, which divide the expected Net Load levels into discrete time blocks. Each time block of a considered Net Load Demand block is called a stage.
Considering each of the six scenarios of Demand, and those of VRE injection, which are all linked in time, a procedure was carried out to generate six scenarios, still linked in time, of Net Demand. These Net Demand time series were then processed and converted to typical day stages.
Each of the stages has a duration and a value, a proportion (p.u) in relation to the average net load of the day. The sum of the product between durations and values is equal to 1, in order to keep the average daily net demand unchanged. In this case studies, it was considered four net demand stages per day, the stage corresponding to peak moments, stage number 1, was considered to have 0.05 / 1 of duration. The next two stages, with duration 0.2 / 1 each one. The last stage, corresponding to low demand moments, stage number 4, was considered to have the remaining 0.55 / 1 of duration.
Each of the stages has a duration and a value, a proportion (p.u) in relation to the average net load of the day. The sum of the product between durations and values is equal to 1, in order to keep the average daily net demand unchanged. Considering the actual time series used, Figure 7 presents an example of actual values considering Spain net demand profile.

6.2. Garver 6-Node Network

Garver 6-node Network consists of 15 right-of-ways, one isolated node, a total load of 760 MW and 152 MVAr, and a total active power generation of 1140 MW. The complete data of this network can be obtained from [74].
The candidates ESS considered are battery storage devices with a maximum charge and discharge rate of 50 MW, a round-trip efficiency of 85 %, and a usable energy storage capacity of up to 75 MWh. For the investment values and operational costs related to ESS for candidate VPL, data from case studies and projections presented in [75,76], were used.
For this first case study, three scenarios were evaluated: Scenario S1.1, considering only dispatchable generation, transmission data, and demands obtained from [74]; Scenario S1.2, considering candidate VPL using actual ESS investment and operation costs obtained from [75,76]; Scenario S1.3, considering a projected reduction in ESS investment and operation costs based in [75].

6.2.1. Garver 6-Node Network - Scenario S1.1

This scenario S1.1 has the objective to be a base case for comparisons. It is considered only dispatchable generation, existing ones and candidates. Transmission lines data, and demands are obtained from [74].
Table 3 presents the results of the expansion planning for scenario S1.1, which will be used as a base case for comparisons with other scenarios.
The summary of the results of the optimal expansion plan shows that four transmission line circuits are planned. The operation cost related to generation is related only to dispatchable generation.

6.2.2. Garver 6-Node Network - Scenario S1.2

This Scenario S1.2 aims to identify the impact of using VPL on investments in expansion of transmission infrastructure, either replacing investments or delaying investments in transmission. It is considered candidate VPL to be possible to deploy, using real ESS investment and operation costs obtained from [75,76].
Table 4 presents the results of scenario S1.2 expansion planning.
The summary of the results of the optimal expansion plan related to Scenario S1.2, when compared with the results of Scenario S1.1 shows that only two of the previous transmission line circuits are planned as investments, the investment in expansion of circuits 2-6 and 4-6 are replaced by less expensive VPL infrastructure. The operation cost related to generation is related only to dispatchable generation.

6.2.3. Garver 6-Node Network - Scenario S1.3

This Scenario 1.3 has the objective to make a sensitivity analysis on the impact of ESS cost reduction and its use as transmission investment reduction or postponement. It is considered a projected reduction in ESS investment and operation costs based in [75].
Table 5 presents the results of scenario S1.3 expansion planning.
The summary of the results of the optimal expansion plan related to Scenario S1.3, when compared with the results of Scenario S1.2 shows that only one of the previous transmission line circuits is planned as investment, the investment in expansion of circuits 2-6, 3-5 and 4-6 are replaced by less expensive VPL infrastructure. The operation cost related to generation is related only to dispatchable generation.

6.3. IEEE RTS-GMLC

The RTS-GMLC test system consists of 104 right-of-ways, 36 at 138kV and 68 at 230kV, and 16 power transformers. The RTS-GMLC proposes time series considering VRE injection, and demand, it considers one hour for day ahead data and fifteen minutes for real time data. The complete data of this network can be obtained from [72].
The candidates ESS considered are battery storage devices with a maximum charge and discharge rate of 50 MW, a round-trip efficiency of 85 %, and a usable energy storage capacity of up to 75 MWh.
For this second case study, four scenarios were evaluated: Scenario S2.1, considering only dispatchable generation, transmission data, and demands obtained from [72]; Scenario S2.2, considering candidate VPL using actual ESS investment and operation costs obtained from [75,76]; Scenario S2.3, considering a projected reduction in ESS investment and operation costs based in [75]; Scenario S2.4, considering renewable generation investment, demand response, flexibility acquired from TSO-DSO interconnection. The model was parameterized to execute a three-year expansion plan, considering an annual linear growth rate of 4.5% for both demand and VRE.
Considering the computational effort, the processing time to obtain the solution was approximately ten minutes, for each scenario considered in this case.

6.3.1. IEEE RTS-GMLC - Scenario S2.1

This scenario S2.1 has the objective to be a base case for comparisons. It is considered only dispatchable generation, existing ones and candidates. Transmission lines data, and demands are obtained from [72].
Table 6 presents the results of scenario S2.1 expansion planning.

6.3.2. IEEE RTS-GMLC - Scenario S2.2

This Scenario S2.2 aims to identify the impact of using VPL on investments in expansion of transmission infrastructure, either replacing investments or delaying investments in transmission. It is considered candidate VPL to be possible to deploy, using real ESS investment and operation costs obtained from [75,76].
Table 7 presents the results of scenario S2.2 expansion planning.
Figure 8 presents detailed information about the times when transmission line circuits are planned to be deployed.

6.3.3. IEEE RTS-GMLC - Scenario S2.3

This Scenario 2.3 has the objective to make a sensitivity analysis on the impact of ESS cost decline and its use as transmission investment reduction or postponement. It is considered a projected reduction in ESS investment and operation costs based in [75].
Table 8 presents the results of scenario S2.3 expansion planning.

6.3.4. IEEE RTS-GMLC - Scenario S2.4

This Scenario 2.4 has the objective to consider the impact of available option to use renewable generation investment, and demand response, flexibility acquired from TSO-DSO interconnection. The model was parameterized to execute a three-year expansion plan, considering an annual linear growth rate of 4.5% for both demand and VRE. It is considered that 25% of the demand has contracts to provide demand response service, and the upward and downward flexibility contracted is 30%.
Table 9 presents the results of scenario S2.4 expansion planning.
Figure 9 presents detailed information about the times when transmission line circuits are planned to be deployed. Comparing Figure 8 with Figure 9 the impact of available and used demand response flexibility on transmission line investment postponement.
In order to evaluate the impact of VPL deployment and flexibility services in electrical indicators of the grid, Table 10 presents, for each of the scenarios considered in Section 6.3, the results of the average line occupancy of all lines, the maximum LMP and average LMP of all transmission nodes. It can be observed the expected increase in the average use, with an indication that underutilization of transmission infrastructure is improved around 20% it demonstrates more rational and efficient use of transmission lines, achieved by shifting actual energy flow from situations of higher demand to situations of lower demand. Considering that the average occupancy of the lines is due to the displacement of activity to times of lower use, the reduction in line losses can also be observed.The LMP indicator, that is associated with transmission lines congestion, can be seen as improving with the more economic use of transmission lines, provided by the implementation of VPLs, as well as the use of flexibility services.

7. Conclusion

This article presents a new model for planning the expansion of a Transmission and Generation System considering the impact of Virtual Power Lines, with the investment in energy storage in the transmission system, in order to have a reduction or a postponement of investments in transmission lines, as well improving the electrical power system adequacy as a whole. The ability to contract flexibility from the TSO-DSO interconnection is modeled, in order to consider a reduction in system expansion investments, considering both, energy and capacity reserve. The formulation developed includes a linear AC-OPF model with the incorporation of reactive power modeling in the GTEP problem. In order to make the resulting problem tractable when formulated for medium-to-large scale systems, the daily time step used when computing the system operation uses the concept of a variable time net demand stage, that is obtained using the load duration curve, that shows the relationship between the cumulative load and the percentage of time for which that load occurs.
Flexibility is provided to the AC power flow transmission network model by distribution systems providing upward and downward flexibility services, related to demand response, Distributed Generation or Energy Storage Systems, aggregated as Virtual Power Plants.
A Data-Driven Distributionally Robust Optimization-DDDRO approach is proposed to consider uncertainties of demand and Variable Renewable Energy generation.
The proposed formulation has been applied to compute the GTEP for the RTS-GMLC test system that is a medium-sized system. This allowed evaluating the performance and computational time compared to calculating expansion plans determined with DC-OPF formulations.
The results obtained demonstrate an approximate 15% reduction in the total costs of the solution obtained in the test systems used. It is also demonstrated that there is an approximate 20% improvement in the efficient use of the transmission system. Finally, an improvement in the locational marginal pricing indicator of the transmission system is also evident. The proposed model supports the consideration and deployment of technologies and services to support the design of modern power systems to support the needs of a low-carbon emission context.

Funding

This research received no external funding.

Data Availability Statement

The original data presented in the study are openly available in [71].

Conflicts of Interest

The authors declare no conflicts of interest.

References

  1. Matevosyan, J.; Huang, S.H.; Du, P.; Mago, N.; Guiyab, R. Operational Security: The Case of Texas. IEEE Power and Energy Magazine 2021, 19, 18–27. [Google Scholar] [CrossRef]
  2. Spyrou, E.; Ho, J.L.; Hobbs, B.F.; Johnson, R.M.; McCalley, J.D. What are the Benefits of Co-Optimizing Transmission and Generation Investment? Eastern Interconnection Case Study. IEEE Transactions on Power Systems 2017, 32, 4265–4277. [Google Scholar] [CrossRef]
  3. Latorre, G.; Cruz, R.D.; Areiza, J.M.; Villegas, A. Classification of publications and models on transmission expansion planning. IEEE Transactions on Power Systems 2003, 18, 938–946. [Google Scholar] [CrossRef]
  4. Hemmati, R.; Hooshmand, R.; Khodabakhshian, A. Comprehensive review of generation and transmission expansion planning. IET Generation, Transmission Distribution 2013, 7, 955–964. [Google Scholar] [CrossRef]
  5. Mahdavi, M.; Sabillon Antunez, C.; Ajalli, M.; Romero, R. Transmission Expansion Planning: Literature Review and Classification. IEEE Systems Journal 2019, 13, 3129–3140. [Google Scholar] [CrossRef]
  6. El-Meligy, M.A.; Sharaf, M.; Soliman, A.T. A coordinated scheme for transmission and distribution expansion planning: A Tri-level approach. Electric Power Systems Research 2021, 196, 107274. [Google Scholar] [CrossRef]
  7. Ranjbar, H.; Hosseini, S.H.; Zareipour, H. A robust optimization method for co-planning of transmission systems and merchant distributed energy resources. International Journal of Electrical Power Energy Systems 2020, 118, 105845. [Google Scholar] [CrossRef]
  8. Abushamah, H.A.S.; Haghifam, M.; Bolandi, T.G. A novel approach for distributed generation expansion planning considering its added value compared with centralized generation expansion. Sustainable Energy, Grids and Networks 2021, 25, 100417. [Google Scholar] [CrossRef]
  9. Ranjbar, H.; Hosseini, S.H.; Zareipour, H. Resiliency-Oriented Planning of Transmission Systems and Distributed Energy Resources. IEEE Transactions on Power Systems 2021, 36, 4114–4125. [Google Scholar] [CrossRef]
  10. Zhang, C.; Liu, L.; Cheng, H.; Liu, D.; Zhang, J.; Li, G. Data-driven distributionally robust transmission expansion planning considering contingency-constrained generation reserve optimization. International Journal of Electrical Power Energy Systems 2021, 131, 106973. [Google Scholar] [CrossRef]
  11. Mohanapriya, T.; Manikandan, T.R. Congestion management of deregulated electricity market using locational marginal pricing. In Proceedings of the 2014 IEEE International Conference on Computational Intelligence and Computing Research, 2014, pp. 1–4. [CrossRef]
  12. Benders, J.F. Partitioning Procedures for Solving Mixed-variables Programming Problems. Numer. Math. 1962, 4, 238–252. [Google Scholar] [CrossRef]
  13. Conejo, A.J.; Mínguez, R.; Castillo, E.; García-Bertrand, R. Decomposition Techniques in Mathematical Programming, 1st ed.; Springer, 2006.
  14. Romero, R.; Monticelli, A. A hierarchical decomposition approach for transmission network expansion planning. IEEE Transactions on Power Systems 1994, 9, 373–380. [Google Scholar] [CrossRef]
  15. Haffner, S.L. O Planejamento da Expansão dos Sistemas Elétricos no Contexto de um Ambiente Competitivo. PhD thesis, Universidade Estadual de Campinas, Campinas, 2000.
  16. Jabr, R.A. Robust Transmission Network Expansion Planning With Uncertain Renewable Generation and Loads. IEEE Transactions on Power Systems 2013, 28, 4558–4567. [Google Scholar] [CrossRef]
  17. Chen, B.; Wang, J.; Wang, L.; He, Y.; Wang, Z. Robust Optimization for Transmission Expansion Planning: Minimax Cost vs. Minimax Regret. IEEE Transactions on Power Systems 2014, 29, 3069–3077. [Google Scholar] [CrossRef]
  18. Ruiz, C.; Conejo, A. Robust transmission expansion planning. European Journal of Operational Research 2015, 242, 390–401. [Google Scholar] [CrossRef]
  19. Xing, T.; Caijuan, Q.; Liang, Z.; Pengjiang, G.; Jianfeng, G.; Panlong, J. A comprehensive flexibility optimization strategy on power system with high-percentage renewable energy. In Proceedings of the 2017 2nd International Conference on Power and Renewable Energy (ICPRE), 2017, pp. 553–558. [CrossRef]
  20. Alvarez, E.F.; Olmos, L.; Ramos, A.; Antoniadou-Plytaria, K.; Steen, D.; Tuan, L.A. Values and impacts of incorporating local flexibility services in transmission expansion planning. Electric Power Systems Research 2022, 212, 108480. [Google Scholar] [CrossRef]
  21. Ding, Z.; Hu, Z.; Wu, J.; Peng, Q.; Zhao, H.; Huang, X. Optimal Transmission Expansion Planning Considering Demand Response Characteristics of Load Duration Curve. In Proceedings of the 2022 7th Asia Conference on Power and Electrical Engineering (ACPEE), 2022, pp. 40–44. https://doi.org/10.1109/ACPEE53904.2022.9783835. [CrossRef]
  22. Kristiansen, M.; Korpås, M.; Farahmand, H.; Graabak, I.; Härtel, P. Introducing system flexibility to a multinational transmission expansion planning model. In Proceedings of the 2016 Power Systems Computation Conference (PSCC), 2016, pp. 1–7. [CrossRef]
  23. Tejada-Arango, D.A.; Morales-España, G.; Wogrin, S.; Centeno, E. Power-Based Generation Expansion Planning for Flexibility Requirements. IEEE Transactions on Power Systems 2020, 35, 2012–2023. [Google Scholar] [CrossRef]
  24. Dehghan, S.; Amjady, N.; Conejo, A.J. A Multistage Robust Transmission Expansion Planning Model Based on Mixed Binary Linear Decision Rules—Part I. IEEE Transactions on Power Systems 2018, 33, 5341–5350. [Google Scholar] [CrossRef]
  25. Zhang, H.; Heydt, G.T.; Vittal, V.; Quintero, J. An Improved Network Model for Transmission Expansion Planning Considering Reactive Power and Network Losses. IEEE Transactions on Power Systems 2013, 28, 3471–3479. [Google Scholar] [CrossRef]
  26. Liu, J.; Bynum, M.; Castillo, A.; Watson, J.P.; Laird, C.D. A multitree approach for global solution of ACOPF problems using piecewise outer approximations. Computers & Chemical Engineering 2018, 114, 145–157. [Google Scholar] [CrossRef]
  27. Bynum, M.; Castillo, A.; Watson, J.P.; Laird, C.D. Tightening McCormick Relaxations Toward Global Solution of the ACOPF Problem. IEEE Transactions on Power Systems 2019, 34, 814–817. [Google Scholar] [CrossRef]
  28. Ghaddar, B.; Jabr, R.A. Power transmission network expansion planning: A semidefinite programming branch-and-bound approach. European Journal of Operational Research 2019, 274, 837–844. [Google Scholar] [CrossRef]
  29. Mehrtash, M.; Cao, Y. A New Global Solver for Transmission Expansion Planning With AC Network Model. IEEE Transactions on Power Systems 2022, 37, 282–293. [Google Scholar] [CrossRef]
  30. Mehrtash, M.; Hobbs, B.F.; Mahroo, R.; Cao, Y. Does Choice of Power Flow Representation Matter in Transmission Expansion Optimization? A Quantitative Comparison for a Large-Scale Test System. IEEE Transactions on Industry Applications 2024, 60, 1433–1441. [Google Scholar] [CrossRef]
  31. Palmintier, B.S.; Webster, M.D. Impact of Operational Flexibility on Electricity Generation Planning With Renewable and Carbon Targets. IEEE Transactions on Sustainable Energy 2016, 7, 672–684. [Google Scholar] [CrossRef]
  32. Chen, X.; Lv, J.; McElroy, M.B.; Han, X.; Nielsen, C.P.; Wen, J. Power System Capacity Expansion Under Higher Penetration of Renewables Considering Flexibility Constraints and Low Carbon Policies. IEEE Transactions on Power Systems 2018, 33, 6240–6253. [Google Scholar] [CrossRef]
  33. Wendelborg, M.A.; Backe, S.; del Granado, P.C.; Seifert, P.E. Consequences of Uncertainty from Intraday Operations to a Capacity Expansion Model of the European Power System. In Proceedings of the 2023 19th International Conference on the European Energy Market (EEM), 2023, pp. 1–8. [CrossRef]
  34. Ramos, A.; Alvarez, E.F.; Lumbreras, S. OpenTEPES: Open-source Transmission and Generation Expansion Planning. SoftwareX 2022, 18, 101070. [Google Scholar] [CrossRef]
  35. Domínguez, R.; Conejo, A.J.; Carrión, M. Toward Fully Renewable Electric Energy Systems. IEEE Transactions on Power Systems 2015, 30, 316–326. [Google Scholar] [CrossRef]
  36. Baringo, L.; Baringo, A. A Stochastic Adaptive Robust Optimization Approach for the Generation and Transmission Expansion Planning. IEEE Transactions on Power Systems 2018, 33, 792–802. [Google Scholar] [CrossRef]
  37. Moreira, A.; Pozo, D.; Street, A.; Sauma, E. Reliable Renewable Generation and Transmission Expansion Planning: Co-Optimizing System’s Resources for Meeting Renewable Targets. IEEE Transactions on Power Systems 2017, 32, 3246–3257. [Google Scholar] [CrossRef]
  38. Ahmadi, S.; Mavalizadeh, H.; Ghadimi, A.A.; Miveh, M.R.; Ahmadi, A. Dynamic robust generation–transmission expansion planning in the presence of wind farms under long- and short-term uncertainties. IET Generation, Transmission Distribution 2020, 14, 5418–5427. [Google Scholar] [CrossRef]
  39. Moreira, A.; Pozo, D.; Street, A.; Sauma, E.; Strbac, G. Climate-aware generation and transmission expansion planning: A three-stage robust optimization approach. European Journal of Operational Research 2021, 295, 1099–1118. [Google Scholar] [CrossRef]
  40. Backe, S.; Ahang, M.; Tomasgard, A. Stable stochastic capacity expansion with variable renewables: Comparing moment matching and stratified scenario generation sampling. Applied Energy 2021, 302, 117538. [Google Scholar] [CrossRef]
  41. Curty, M.G.; Borges, C.L.; Saboia, C.H.; Lisboa, M.L.; Berizzi, A. A soft-linking approach to include hourly scheduling of intermittent resources into hydrothermal generation expansion planning. Renewable and Sustainable Energy Reviews 2023, 188, 113838. [Google Scholar] [CrossRef]
  42. Toolabi Moghadam, A.; Bahramian, B.; Shahbaazy, F.; Paeizi, A.; Senjyu, T. Stochastic Flexible Power System Expansion Planning, Based on the Demand Response Considering Consumption and Generation Uncertainties. Sustainability 2023, 15. [Google Scholar] [CrossRef]
  43. García-Bertrand, R.; Mínguez, R. Dynamic Robust Transmission Expansion Planning. IEEE Transactions on Power Systems 2017, 32, 2618–2628. [Google Scholar] [CrossRef]
  44. Roldán, C.; Mínguez, R.; García-Bertrand, R.; Arroyo, J.M. Robust Transmission Network Expansion Planning Under Correlated Uncertainty. IEEE Transactions on Power Systems 2019, 34, 2071–2082. [Google Scholar] [CrossRef]
  45. Liang, Z.; Chen, H.; Chen, S.; Wang, Y.; Zhang, C.; Kang, C. Robust Transmission Expansion Planning Based on Adaptive Uncertainty Set Optimization Under High-Penetration Wind Power Generation. IEEE Transactions on Power Systems 2021, 36, 2798–2814. [Google Scholar] [CrossRef]
  46. Liang, Z.; Chen, H.; Chen, S.; Lin, Z.; Kang, C. Probability-driven transmission expansion planning with high-penetration renewable power generation: A case study in northwestern China. Applied Energy 2019, 255, 113610. [Google Scholar] [CrossRef]
  47. Yin, X.; Chen, H.; Liang, Z.; Zeng, X.; Zhu, Y.; Chen, J. Robust transmission network expansion planning based on a data-driven uncertainty set considering spatio-temporal correlation. Sustainable Energy, Grids and Networks 2023, 33, 100965. [Google Scholar] [CrossRef]
  48. Garcia-Cerezo, A.; Baringo, L.; Garcia-Bertrand, R. Dynamic Robust Transmission Network Expansion Planning in Renewable Dominated Power Systems Considering Inter-Temporal and Non-Convex Operational Constraints. In Proceedings of the 2022 International Conference on Smart Energy Systems and Technologies (SEST), 2022, pp. 1–6. [CrossRef]
  49. Garcia-Cerezo, A.; Baringo, L.; Garcia-Bertrand, R. Expansion planning of the transmission network with high penetration of renewable generation: A multi-year two-stage adaptive robust optimization approach. Applied Energy 2023, 349, 121653. [Google Scholar] [CrossRef]
  50. Zhang, X.; Conejo, A.J. Coordinated Investment in Transmission and Storage Systems Representing Long- and Short-Term Uncertainty. IEEE Transactions on Power Systems 2018, 33, 7143–7151. [Google Scholar] [CrossRef]
  51. Verastegui, F.; Lorca, A.; Olivares, D.E.; Negrete-Pincetic, M.; Gazmuri, P. An Adaptive Robust Optimization Model for Power Systems Planning With Operational Uncertainty. IEEE Transactions on Power Systems 2019, 34, 4606–4616. [Google Scholar] [CrossRef]
  52. Li, J.; Li, Z.; Liu, F.; Ye, H.; Zhang, X.; Mei, S.; Chang, N. Robust Coordinated Transmission and Generation Expansion Planning Considering Ramping Requirements and Construction Periods. IEEE Transactions on Power Systems 2018, 33, 268–280. [Google Scholar] [CrossRef]
  53. Yin, X.; Chen, H.; Liang, Z.; Zhu, Y. A Flexibility-oriented robust transmission expansion planning approach under high renewable energy resource penetration. Applied Energy 2023, 351, 121786. [Google Scholar] [CrossRef]
  54. Ni, F.; Nijhuis, M.; Nguyen, P.H.; Cobben, J.F.G. Variance-Based Global Sensitivity Analysis for Power Systems. IEEE Transactions on Power Systems 2018, 33, 1670–1682. [Google Scholar] [CrossRef]
  55. Fonseca, N.; Neyestani, N.; Soares, F.; Iria, J.; Lopes, M.; Antunes, C.H.; Pinto, D.; Jorge, H. Bottom-up approach to compute der flexibility in the transmission-distribution networks boundary. In Proceedings of the Mediterranean Conference on Power Generation, Transmission, Distribution and Energy Conversion (MEDPOWER 2018), 2018, pp. 1–7. [CrossRef]
  56. Nguyen, T.A.; Byrne, R.H. Evaluation of Energy Storage Providing Virtual Transmission Capacity. In Proceedings of the 2021 IEEE Power and Energy Society General Meeting (PESGM), 2021, pp. 01–05. [CrossRef]
  57. IRENA. Virtual Power Lines - Innovation Landscape Brief. IRENA International Renewable Energy 2020.
  58. Baringo, A.; Baringo, L.; Arroyo, J.M. Holistic planning of a virtual power plant with a nonconvex operational model: A risk-constrained stochastic approach. International Journal of Electrical Power and Energy Systems 2021, 132, 107081. [Google Scholar] [CrossRef]
  59. Ferreira, T.; Machado, G.; Rego, E.; Esteves, H.; Carvalho, A. Manual de Utilização do Modelo de Otimização da Expansão da Oferta de Energia Elétrica – Modelo PLANEL. https://www.epe.gov.br/sites-pt/publicacoes-dados-abertos/publicacoes/PublicacoesArquivos/publicacao-227/topico-563/NT_PR_004.22_Manual%20PLANEL.pdf, 2022.
  60. Ding, T.; Yang, Q.; Liu, X.; Huang, C.; Yang, Y.; Wang, M.; Blaabjerg, F. Duality-Free Decomposition Based Data-Driven Stochastic Security-Constrained Unit Commitment. IEEE Transactions on Sustainable Energy 2019, 10, 82–93. [Google Scholar] [CrossRef]
  61. Wang, L.; Jiang, C.; Gong, K.; Si, R.; Shao, H.; Liu, W. Data-driven distributionally robust economic dispatch for distribution network with multiple microgrids. IET Generation, Transmission & Distribution 2020, 14, 5712–5719. [Google Scholar] [CrossRef]
  62. Zeng, B.; Zhao, L. Solving two-stage robust optimization problems using a column-and-constraint generation method. Operations Research Letters 2013, 41, 457–461. [Google Scholar] [CrossRef]
  63. Erseghe, T. Distributed Optimal Power Flow Using ADMM. IEEE Transactions on Power Systems 2014, 29, 2370–2380. [Google Scholar] [CrossRef]
  64. Kar, R.S.; Miao, Z.; Zhang, M.; Fan, L. ADMM for nonconvex AC optimal power flow. In Proceedings of the 2017 North American Power Symposium (NAPS), 2017, pp. 1–6. [CrossRef]
  65. Zhang, X.; Conejo, A.J. Robust Transmission Expansion Planning Representing Long- and Short-Term Uncertainty. IEEE Transactions on Power Systems 2018, 33, 1329–1338. [Google Scholar] [CrossRef]
  66. Zhao, L.; Zeng, B. Robust unit commitment problem with demand response and wind energy. In Proceedings of the 2012 IEEE Power and Energy Society General Meeting, 2012, pp. 1–8. [CrossRef]
  67. Mahroo, R.; Kargarian, A.; Mehrtash, M.; Conejo, A.J. Robust Dynamic TEP With an Security Criterion: A Computationally Efficient Model. IEEE Transactions on Power Systems 2023, 38, 912–920. [Google Scholar] [CrossRef]
  68. Zhao, C.; Guan, Y. Data-Driven Stochastic Unit Commitment for Integrating Wind Generation. IEEE Transactions on Power Systems 2016, 31, 2587–2596. [Google Scholar] [CrossRef]
  69. Bagheri, A.; Wang, J.; Zhao, C. Data-Driven Stochastic Transmission Expansion Planning. IEEE Transactions on Power Systems 2017, 32, 3461–3470. [Google Scholar] [CrossRef]
  70. ENTSOE. Electricity generation, transportation and consumption data and information for the pan-European market. https://transparency.entsoe.eu/dashboard/show, 2024.
  71. Ferreira, F. UFPR - Data Repository. https://github.com/Falferreira/Phd_Files.git, 2022.
  72. Barrows, C.; Bloom, A.; Ehlen, A.; Ikäheimo, J.; Jorgenson, J.; Krishnamurthy, D.; Lau, J.; McBennett, B.; O’Connell, M.; Preston, E.; et al. The IEEE Reliability Test System: A Proposed 2019 Update. IEEE Transactions on Power Systems 2020, 35, 119–127. [Google Scholar] [CrossRef]
  73. Goerigk, M.; Khosravi, M. Optimal scenario reduction for one- and two-stage robust optimization with discrete uncertainty in the objective. European Journal of Operational Research 2023, 310, 529–551. [Google Scholar] [CrossRef]
  74. Rider, M.J. Planejamento da Expansão de Sistemas de Transmissão Usando os Modelos CC – CA e Técnicas de Programação Não – Linear. PhD thesis, University of Campinas, São Paulo, Brazil, 2006.
  75. Ayres, D.; Zamora, L. Renewable Power Generation Costs in 2023; IRENA, 2024; p. 211.
  76. Zobaa, A.F.; Ribeiro, P.F.; Aleem, S.H.A.; Afifi, S.N. Energy storage at different voltage levels: technology, integration, and market aspects; Vol. 111, Energy Engineering, 2018.
Figure 1. Demand duration curve of Net Demand.
Preprints 150781 g001
Figure 2. Virtual Power Line - Steps.
Preprints 150781 g002
Figure 3. Expansion Planning Proposed Methodology.
Preprints 150781 g003
Figure 4. ENTSO-E Data one year summarized.
Preprints 150781 g004
Figure 5. Clustering with Six Data BINs using K-means.
Preprints 150781 g005
Figure 6. Probabilities of Each Cluster (Scenario).
Preprints 150781 g006
Figure 7. Spain Data - Cumulative Net Load - Typical Day.
Preprints 150781 g007
Figure 8. Transmission line circuits deployment time.
Preprints 150781 g008
Figure 9. Transmission line circuits deployment time.
Preprints 150781 g009
Table 1. Comparison of the existing approaches with the proposed method.
Ref1 GEP2 TEP3 UC4 VPP5 VPL6 Flx7 Gen Flx8 DR E Flx9 DR C Flx10 T Scale11 VRE12 Cong13 AC14 DC15 Sen16 Static17 Dynamic18
[23]
[24]
[25]
[26]
[27]
[28]
[29]
[30]
[31]
[32]
[33]
[34]
[35]
[36]
[37]
[7]
[10]
[9]
[8]
[38]
[39]
[40]
[6]
[41]
[29]
[42]
[43]
[44]
[45]
[46]
[47]
[48]
[49]
[50]
[51]
[52]
[53]
[54]
Proposed model
1-Reference, 2- Generation Expansion Planning, 3-Transmission Expansion Planning, 4-Short-term Unit Commitment, 5- Virtual Power Plants, 6- Virtual Power Lines, 7- Flexibility TSO-DSO, 8- Generation Flexibility, 9- DR Energy Flexibility, 10- DR Capacity Flexibility, 11- Multi-Timescale, 12- VRE, 13- Transmission line congestion, 14- AC Power flow model, 15- DC Power flow model, 16- Sensitivity Analysis, 17- Static, 18- Dynamic
Table 2. Virtual Power Line - Battery Status.
Demand side Fij (+) Supply side Fij (-)
Hi grid usage Discharge Charge
Low grid usage Charge Discharge
Table 3. Scenario S1.1 Results.
Scenario S1.1
New Circuits VPL Disp Gen [GW] Ndisp Gen [GW] Dem Response [GW] DSO Flex [GW] Cost [M$]
2-6 - - - - - 30
2-6 - - - - - 30
3-5 - - - - - 20
4-6 - - - - - 30
- - 0.68 - - - 28.2
Total 138.2
Table 4. Scenario S1.2 Results.
Scenario S1.2
New Circuits VPL Disp Gen [GW] Ndisp Gen [GW] Dem Response [GW] DSO Flex [GW] Cost [M$]
2-6 - - - - - 30
- 2-6 - - - - 27.5
3-5 - - - - - 20
- 4-6 - - - - 27.5
- - 0.68 - - - 28.2
Total 133.2
Table 5. Scenario S1.3 Results.
Scenario S1.3
New Circuits VPL Disp Gen [GW] Ndisp Gen [GW] Dem Response [GW] DSO Flex [GW] Cost [M$]
2-6 - - - - - 30
- 2-6 - - - - 18.75
- 3-5 - - - - 18.75
- 4-6 - - - - 18.75
- - 0.68 - - - 28.2
Total 114.45
Table 6. Scenario S2.1 Results
Scenario S2.1
New Circuits VPL Disp Gen [GW] Ndisp Gen [GW] Dem Response [GW] DSO Flex [GW] Cost [M$]
15-24 - - - - - 99.8
55-56 - - - - - 39.3
59-61 - - - - - 24.9
58-60 - - - - - 14.7
- - 8.2 - - - 348
Total 526.7
Table 7. Scenario S2.2 Results.
Scenario S2.2
New Circuits VPL Disp Gen [GW] Ndisp Gen [GW] Dem Response [GW] DSO Flex [GW] Cost [M$]
- 15-24 - - - - 37.5
- 55-56 - - - - 37.5
59-61 - - - - - 24.9
58-60 - - - - - 14.7
- - 8.2 - - - 348
Total 462.6
Table 8. Scenario S2.3 Results.
Scenario S2.3
New Circuits VPL Disp Gen [GW] Ndisp Gen [GW] Dem Response [GW] DSO Flex [GW] Cost [M$]
- 15-24 - - - - 22.5
- 55-56 - - - - 22.5
- 59-61 - - - - 22.5
58-60 - - - - - 14.7
- - 8.2 - - - 338
Total 420.2
Table 9. Scenario S2.4 Results.
Scenario S2.4
New Circuits VPL Disp Gen [GW] Ndisp Gen [GW] Dem Response [GW] DSO Flex [GW] Cost [M$]
- 15-24 - - - - 37.5
- 55-56 - - - - 37.5
59-61 - - - - - 24.9
58-60 - - - - - 14.7
- - 5.05 1.1 2.05 0.615 282.76
Total 397.36
Table 10. Line usage and congestion indicator.
Scenario Average Line Usage [p.u.] Line Losses [p.u.] LMP Average [$]
S2.1 0.968 450.3 1001.3
S2.2 1.167 447.4 981.1
S2.3 1.185 443.0 731.5
S2.4 1.196 440.5 66.8
Disclaimer/Publisher’s Note: The statements, opinions and data contained in all publications are solely those of the individual author(s) and contributor(s) and not of MDPI and/or the editor(s). MDPI and/or the editor(s) disclaim responsibility for any injury to people or property resulting from any ideas, methods, instructions or products referred to in the content.
Copyright: This open access article is published under a Creative Commons CC BY 4.0 license, which permit the free download, distribution, and reuse, provided that the author and preprint are cited in any reuse.
Prerpints.org logo

Preprints.org is a free preprint server supported by MDPI in Basel, Switzerland.

Subscribe

Disclaimer

Terms of Use

Privacy Policy

Privacy Settings

© 2025 MDPI (Basel, Switzerland) unless otherwise stated