1. Introduction
The zinc oxide has good electronic, structural and optical qualities, such as a band gap value around 3.37 eV that is a wide band gap semiconductor [
1]. However, when applied in dye solar cells it is still behind oxides such as titanium oxide, in terms of photon-to –current efficiency. It is caused many times because of defects of the ZnO structure, such as porousness that are immersed with the dye, for dye cells, causing blocks of aggregations between the zinc oxide and the function groups of the dyes, such as the COO- and the –COOH [
2,
3]. The cyanide (CN) and isothiocyanate (NCS) present in the N719 favor the injection from the HOMO and LUMO from the dye to the semiconductor [
4]. The absorption time and interaction between the groups of the dye and the zinc oxide can also cause degradation and affect the overall efficiency of the cells. To overcome those problems that decrease the overall efficiency, the semiconductor is many times doped with other elements, such as tin (Sn), aluminum (Al), cobalt (Co), copper (Cu), indium (In) and many others [
5,
6,
7]. It is tested that the doping can alter the target parameters without making the main structure lose its main characteristics.
The adding, doping or combination of zinc oxide can help to improve the photovoltaic parameters of the dye solar cells. The main ones are open circuit voltage (Voc); short current density (Jsc); fill factor (FF) and efficiency (η). Overall, when the Jsc are high, the efficiency follows through. However, even with high current values, if the fill factor reduces, the efficiency also decreases, which is an indication of the stability of the cell, and the dye affects this stability. The relation between the dye and the semiconductor is decisive for improvement of these values, such as the fill factor. That is the reason why it is important to have the appropriate relation between dye and semiconductor. The dye must be non-reactive, stable and nonvolatile. Many authors research natural dyes, from plants and fruits, but metal-based ones are still predominant, such as transition metal-based dyes, like Ru, Os and Re due to properties like stability [
2,
4]. Besides the dye, the dye solar cells (DSSC) are third generation solar cells that use thin films as photoanode, using less material to create energy, a counter electrode, often platinum or graphene due to the stability, and an electrolyte to regenerate the electron that absorbs the sunlight photon. The electrolyte most used is the iodide/triiodide (I
3-/I
-).
The dye is one of the most important integrants of the DSSC, it can be natural or metal based [
8]. A Ruthenium based dye was applied for the third-generation solar cells (DSSC) in this work, which is an important use of dye, since photovoltaic solar energy is a valuable tool to impact an energy revolution worldwide.
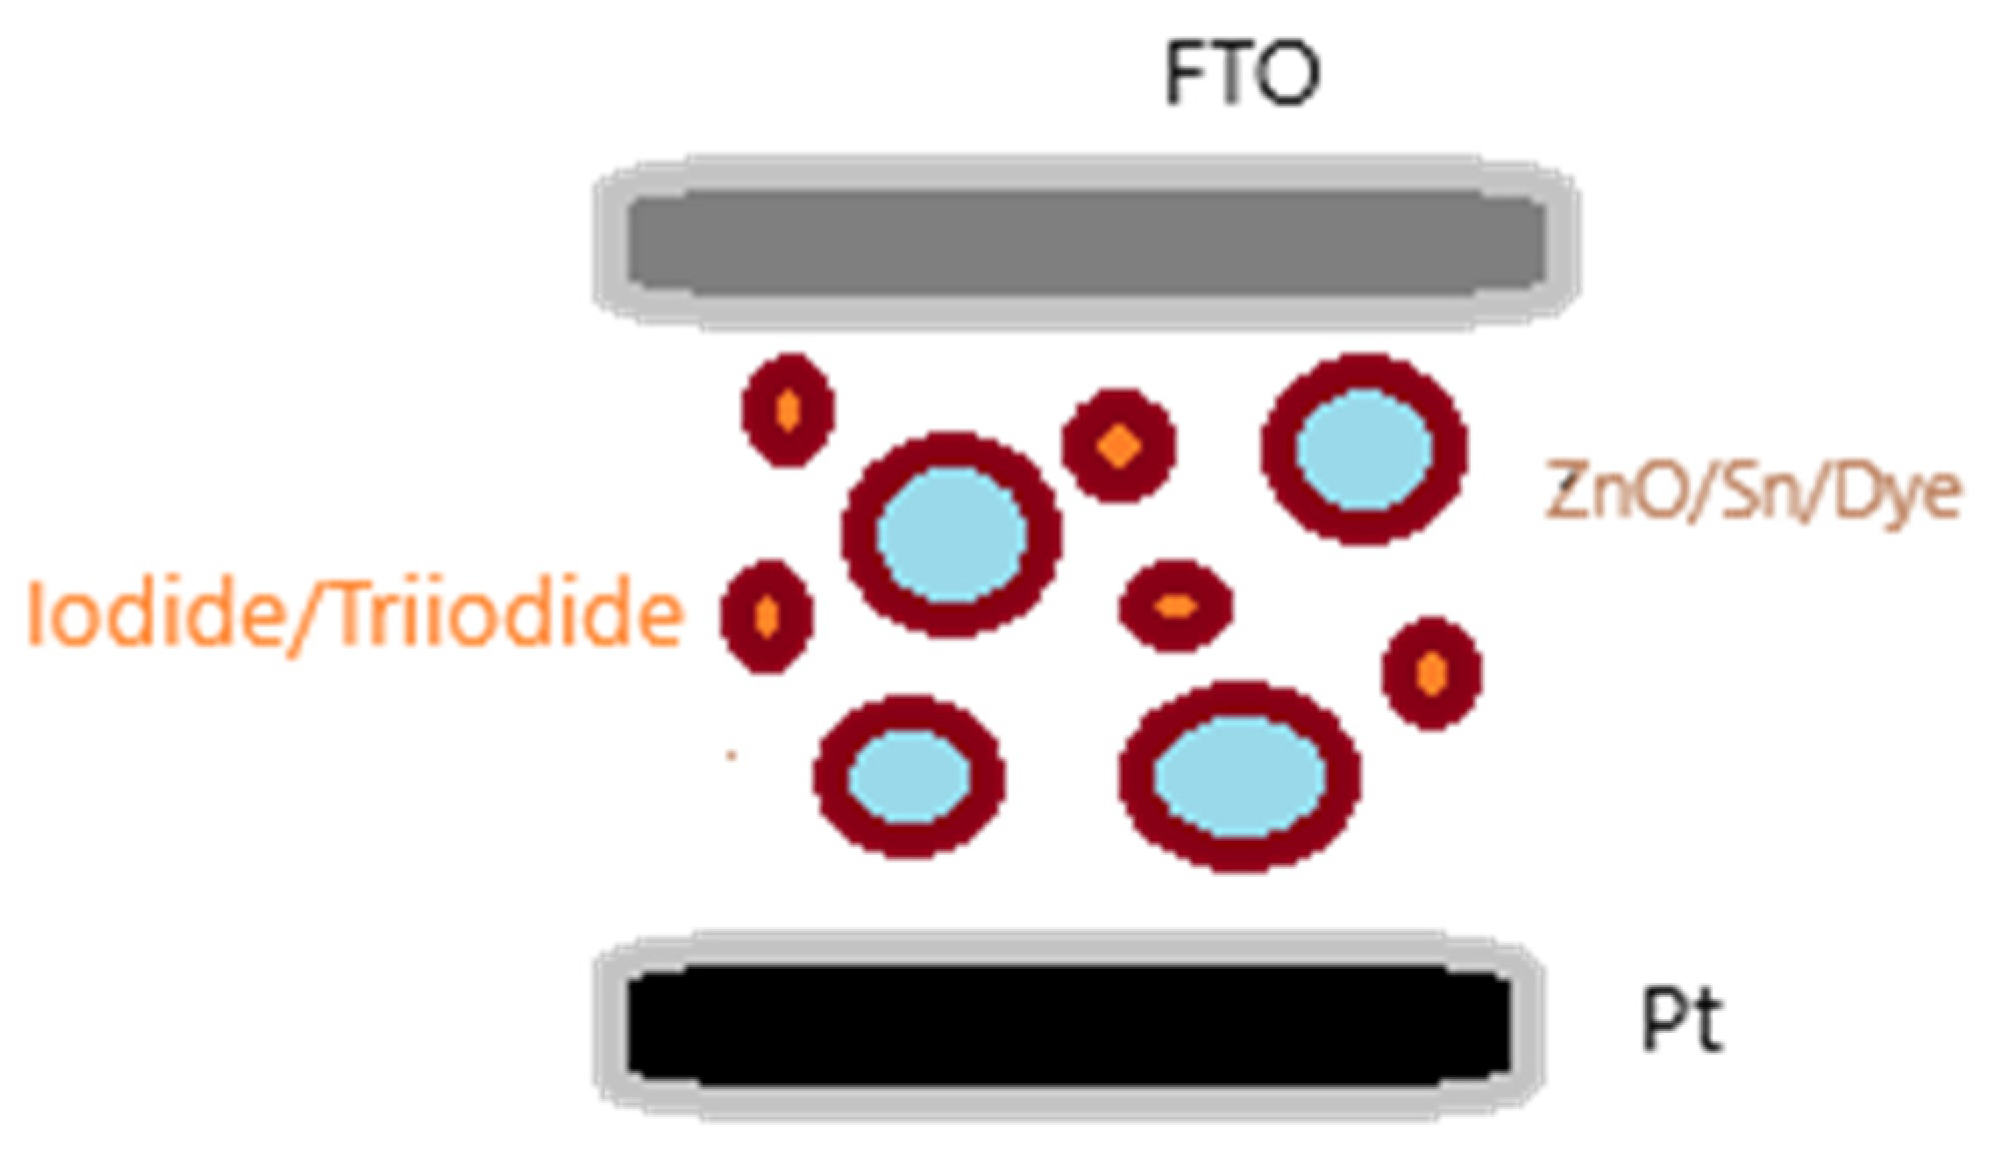
This work doped the ZnO with tin chloride with the aim to increase the efficiency in a dye solar cell, tested at different dye times, 4 and 24 hours. The scheme for the cell is descriptive in
Figure 1.
2. Materials and Methods
The reagents were used without further purification: zinc oxide, tin chloride, iodide AN-50 electrolyte, ruthenium based N719 dye, FTO (fluorine doped tin oxide) glass and platinum coated FTO glass. The N719, AN-50 and Pt glass were purchased from Solaronix. The FTO from CEQUIMICA, the ZnO from Vetec and tin chloride from Dinamica. A solution of 0.05 g ZnO in 50 mL distilled water was mixed with 3% wt of SnCl2. 2H2O, and then submitted to an ultrasound bath, for 15 minutes, to activate the solution. The solution covered a FTO glass until complete evaporation of the water at room temperature. The film coating the glass was then treated at 450° for 30 minutes. The two films were immersed on N719 dye for 4 and 24 hours. The films with the dye, at different immersion times, were placed in a sandwich structure with the platinum. The AN-50 electrolyte was injected through a hole in the Pt glass and the cell was tested.
The film was characterized using the UV-Vis spectrophotometer between 200 and 600 nm and x-ray between 20 and 70°, to attest the efficiency in the deposition of the films and to verify which zinc oxide structure was formed in the FTO glass.
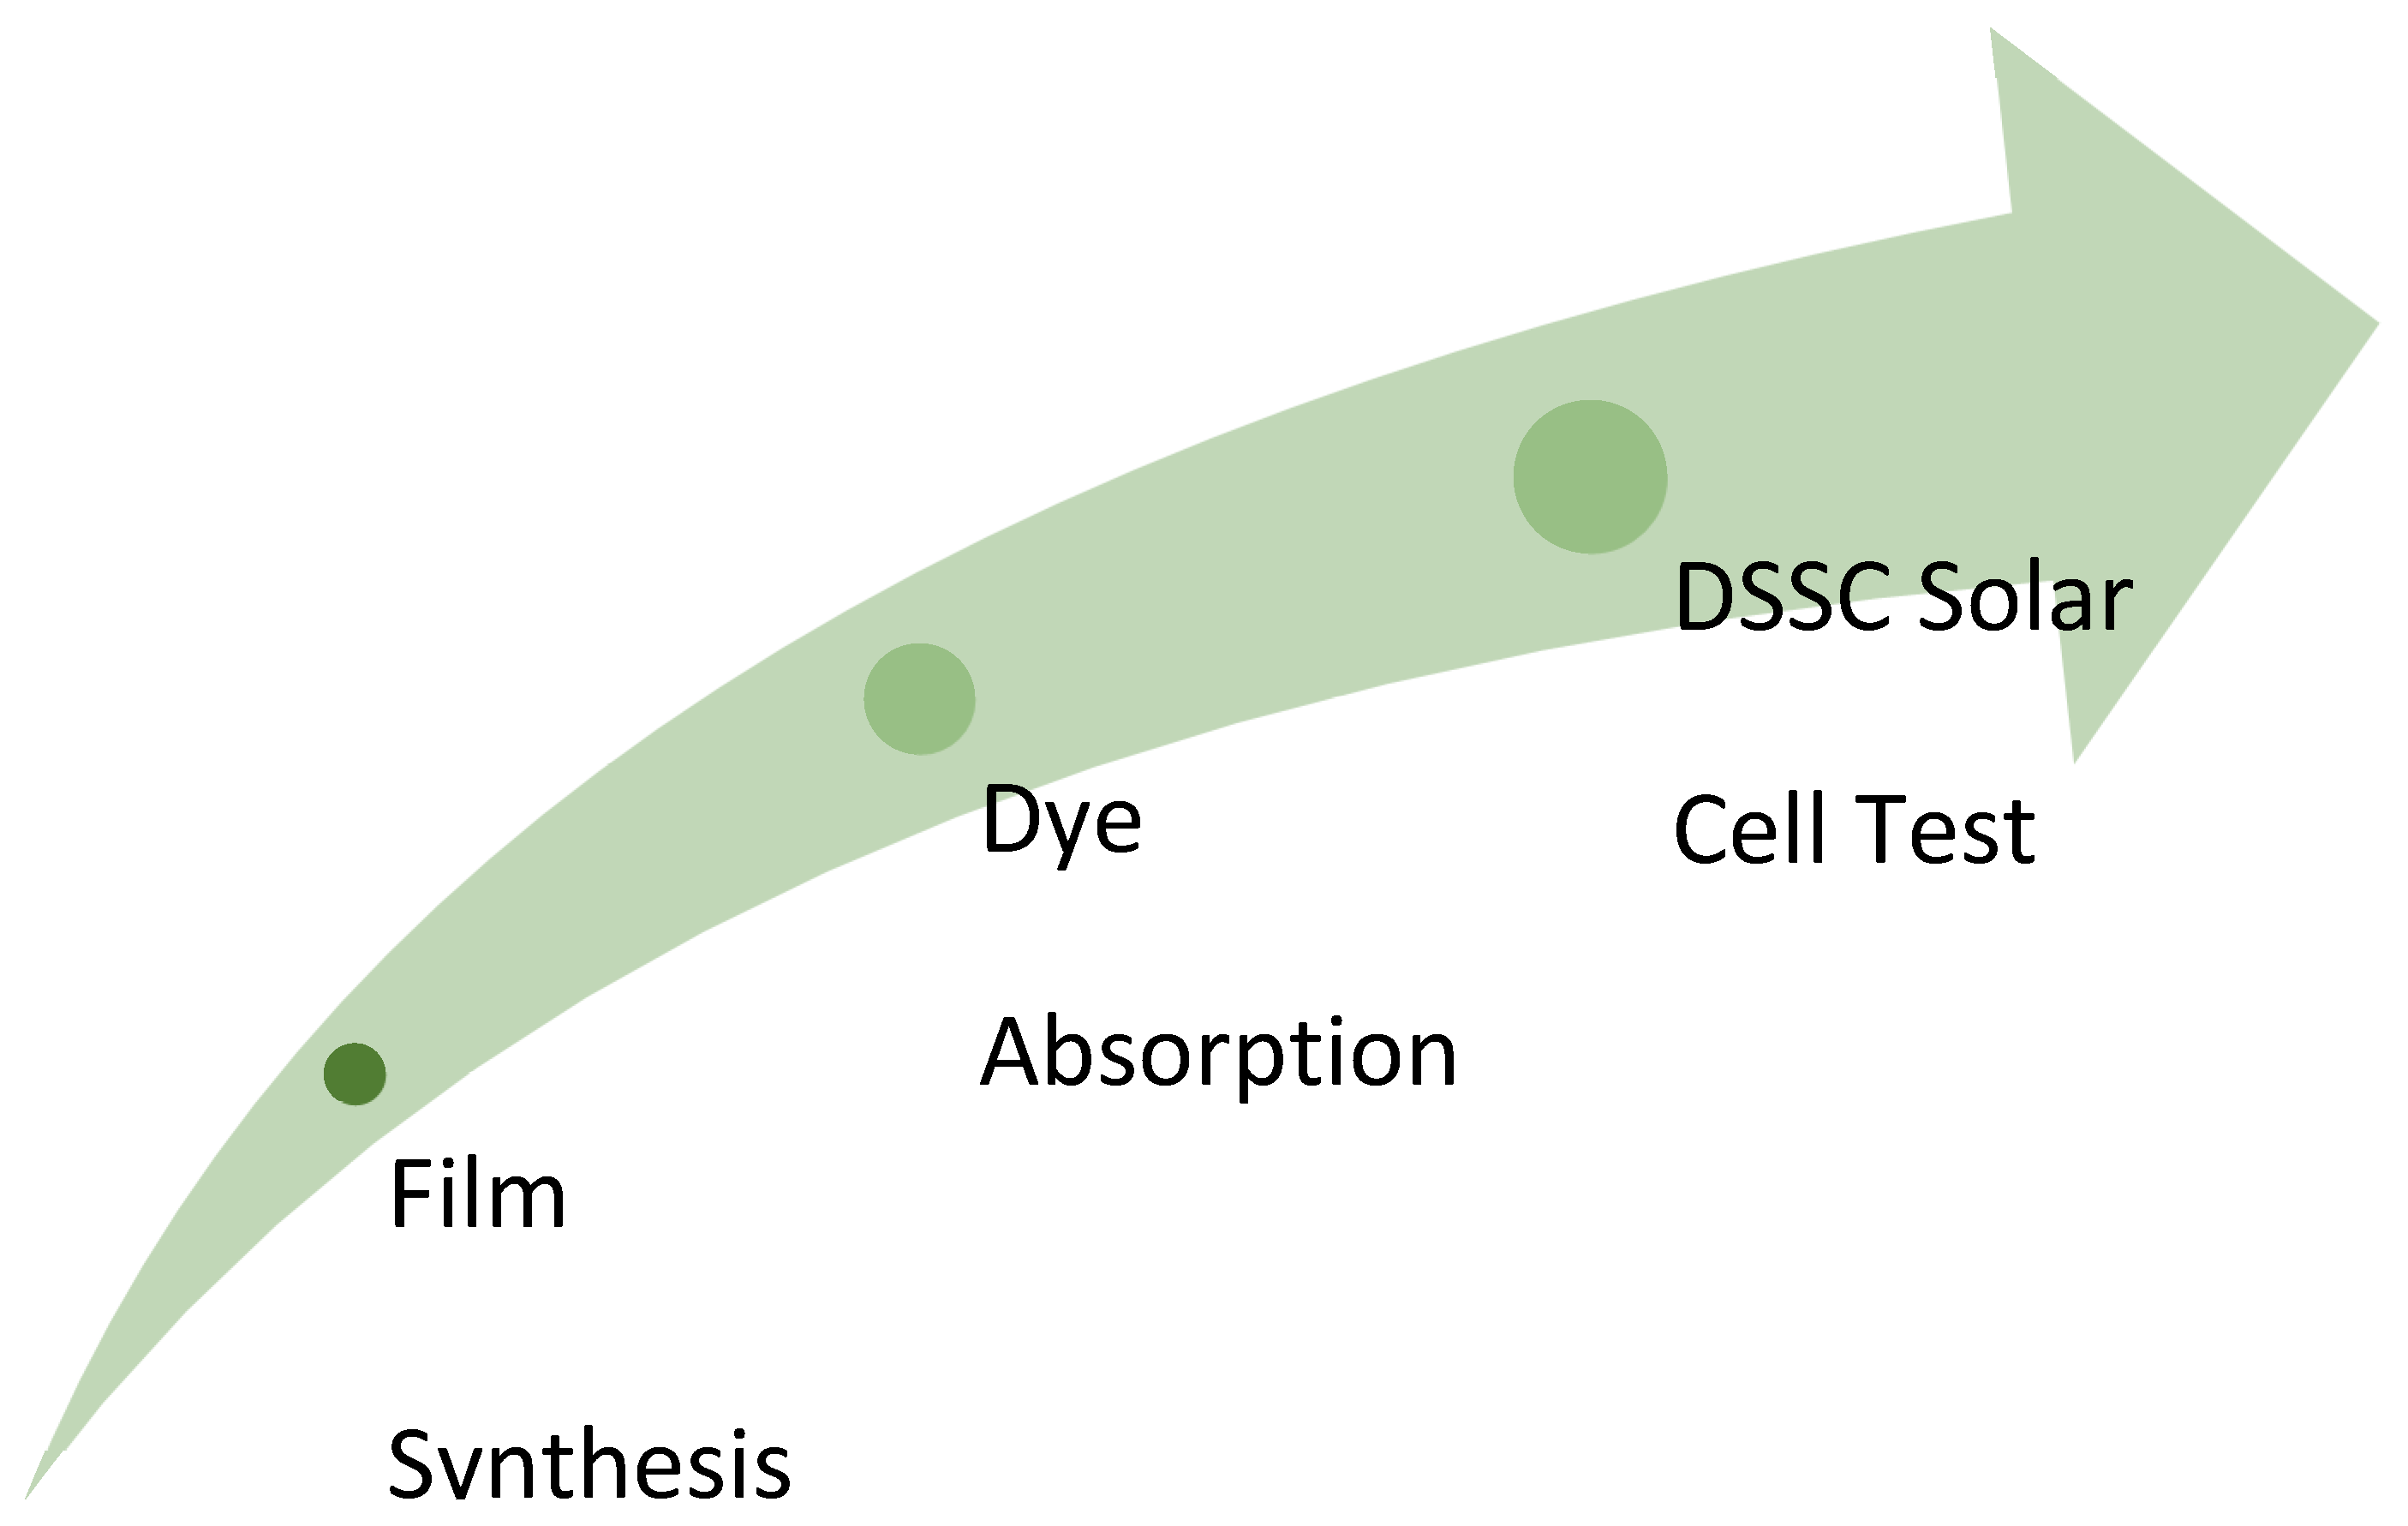
Figure 2 has the steps followed in this study.
The UV-Vis tests were performed with an Evolution One Series spectrophotometer, X-ray diffraction (XRD, DMAXB, Rigaku) with CuKα radiation did the x-ray analysis; The DSSC characterization was under 100 mW/cm2 LED illumination using anAUTOLAB (PGSTAT302N, Metrohm, Herisau, Switzerland). All the analyses were at room temperature. The dye used was based on Ruthenium, C58H86N8O8RuS2.
3. Results and Discussion
3.1. X-Ray
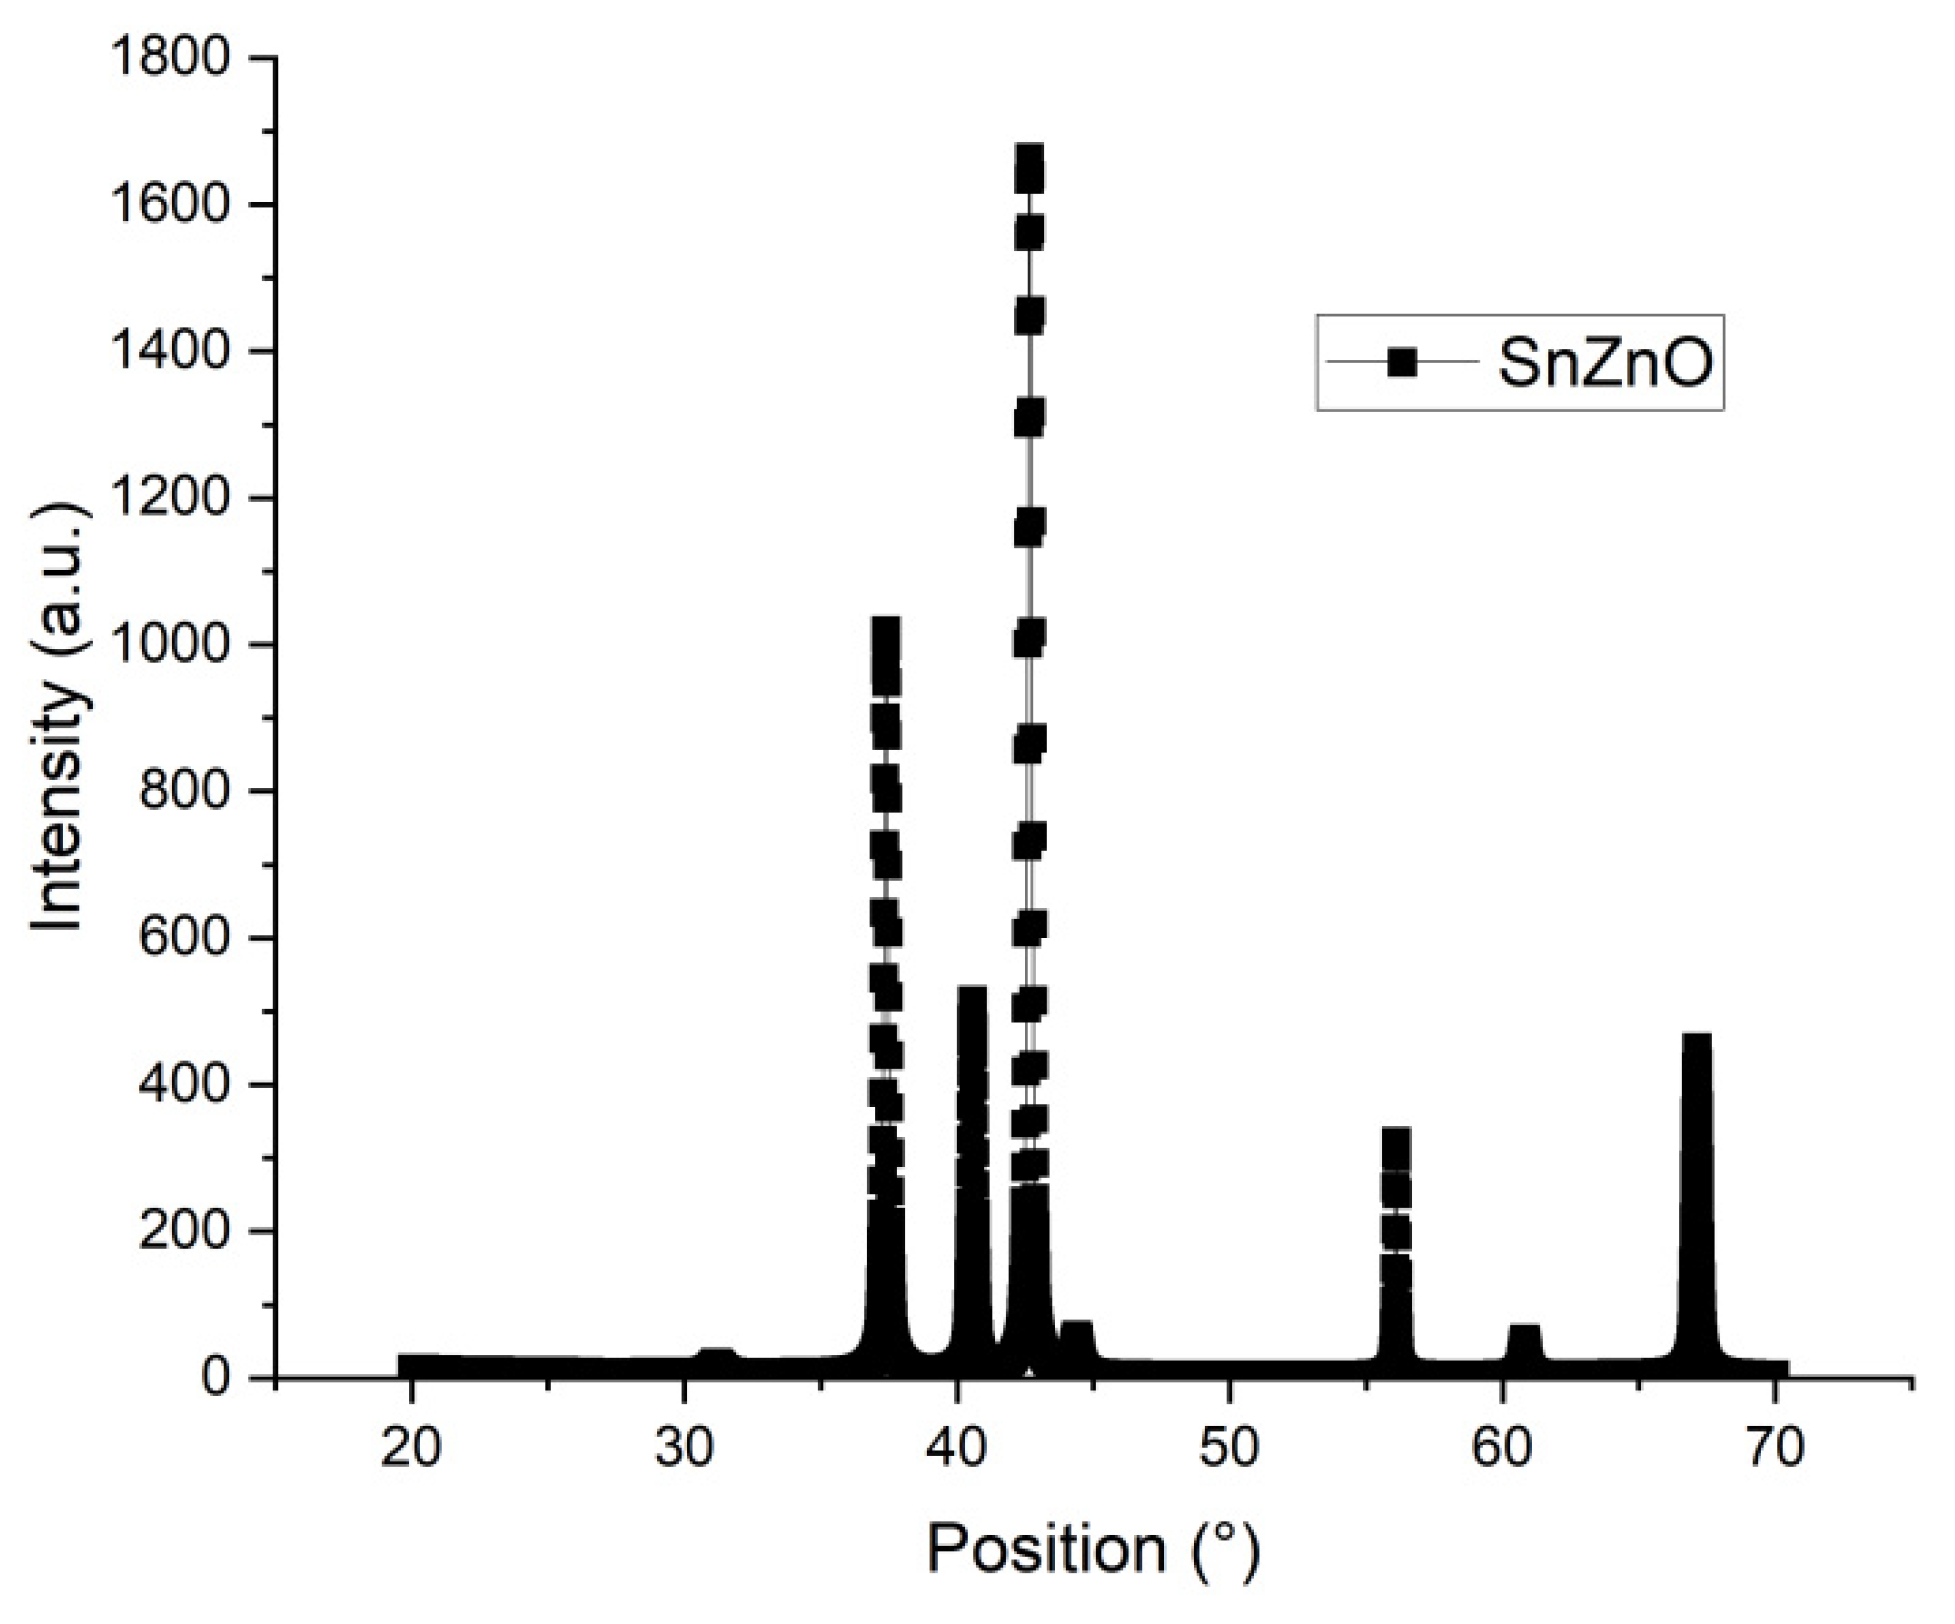
The peaks for the X-ray analysis for the tin doped zinc oxide film is illustrated in
Figure 3. It corresponds to the COD database code 2300113.
Table 1 has the position and orientation for the peaks.
According to the table, the main peaks of (100); (002) and (101) correspond to the composition of hexagonal zinc oxide, P
63mc group. That means also that the addition of 3% wt of tin chloride did not alter significantly the ZnO composition. These same peaks were observed in [
9] for the doping of ZnO with F, Cl, Al and Ga. No characteristic peaks were observed for the tin chloride, indicating that the tin did occupy the Zn or the O in the crystalline structure or were outside that same structure [
9]. The small peaks at around 31°, 44° and 61° correspond to the fluorine doped tin oxide (FTO) on which the film was deposited. The Scherrer (equation 1) calculated the average size for the structure, the equation estimated around 46.7 nm, higher than many of the crystallite sizes found in films of oxide semiconductors, but it also indicated a good crystallite quality for the film. [
10] also obtained around 44 nm for 5% doped tin in ZnO. When using the same methodology, without any additional doping was estimated around 36.39 nm [
11].
The crystallite size was estimated according to [
12].
where k is 0.9; λ is around 0.15406; β is the FWHM, full width half maximum and ɵ is the Bragg angle position (°).
The dislocation density was calculated following the formula [
10]:
where n is equal to 1 and D is the crystallite size. The value obtained was 7.55*10
-6, which indicated high quality of the film and low number of dislocations per area unit [
10]. The lattice strain was also calculated [
10] according to the formula 3, and for 3% tin chloride on zinc oxide was 0.000441.
The values for strain and dislocation are in accordance with the high values of crystallite obtained for the doping. The work on [
10] discusses that by increasing the doping of Sn, the particle size also increases. It is also notable that the methodology employed here did not use any additives, such as heat or speed from spin coating, that in general produces thinner films. The only heat used in this study was to adhere the film to the FTO glass, so it can be conductive when it is applied to the solar cell tests.
3.2. UV-Vis Studies
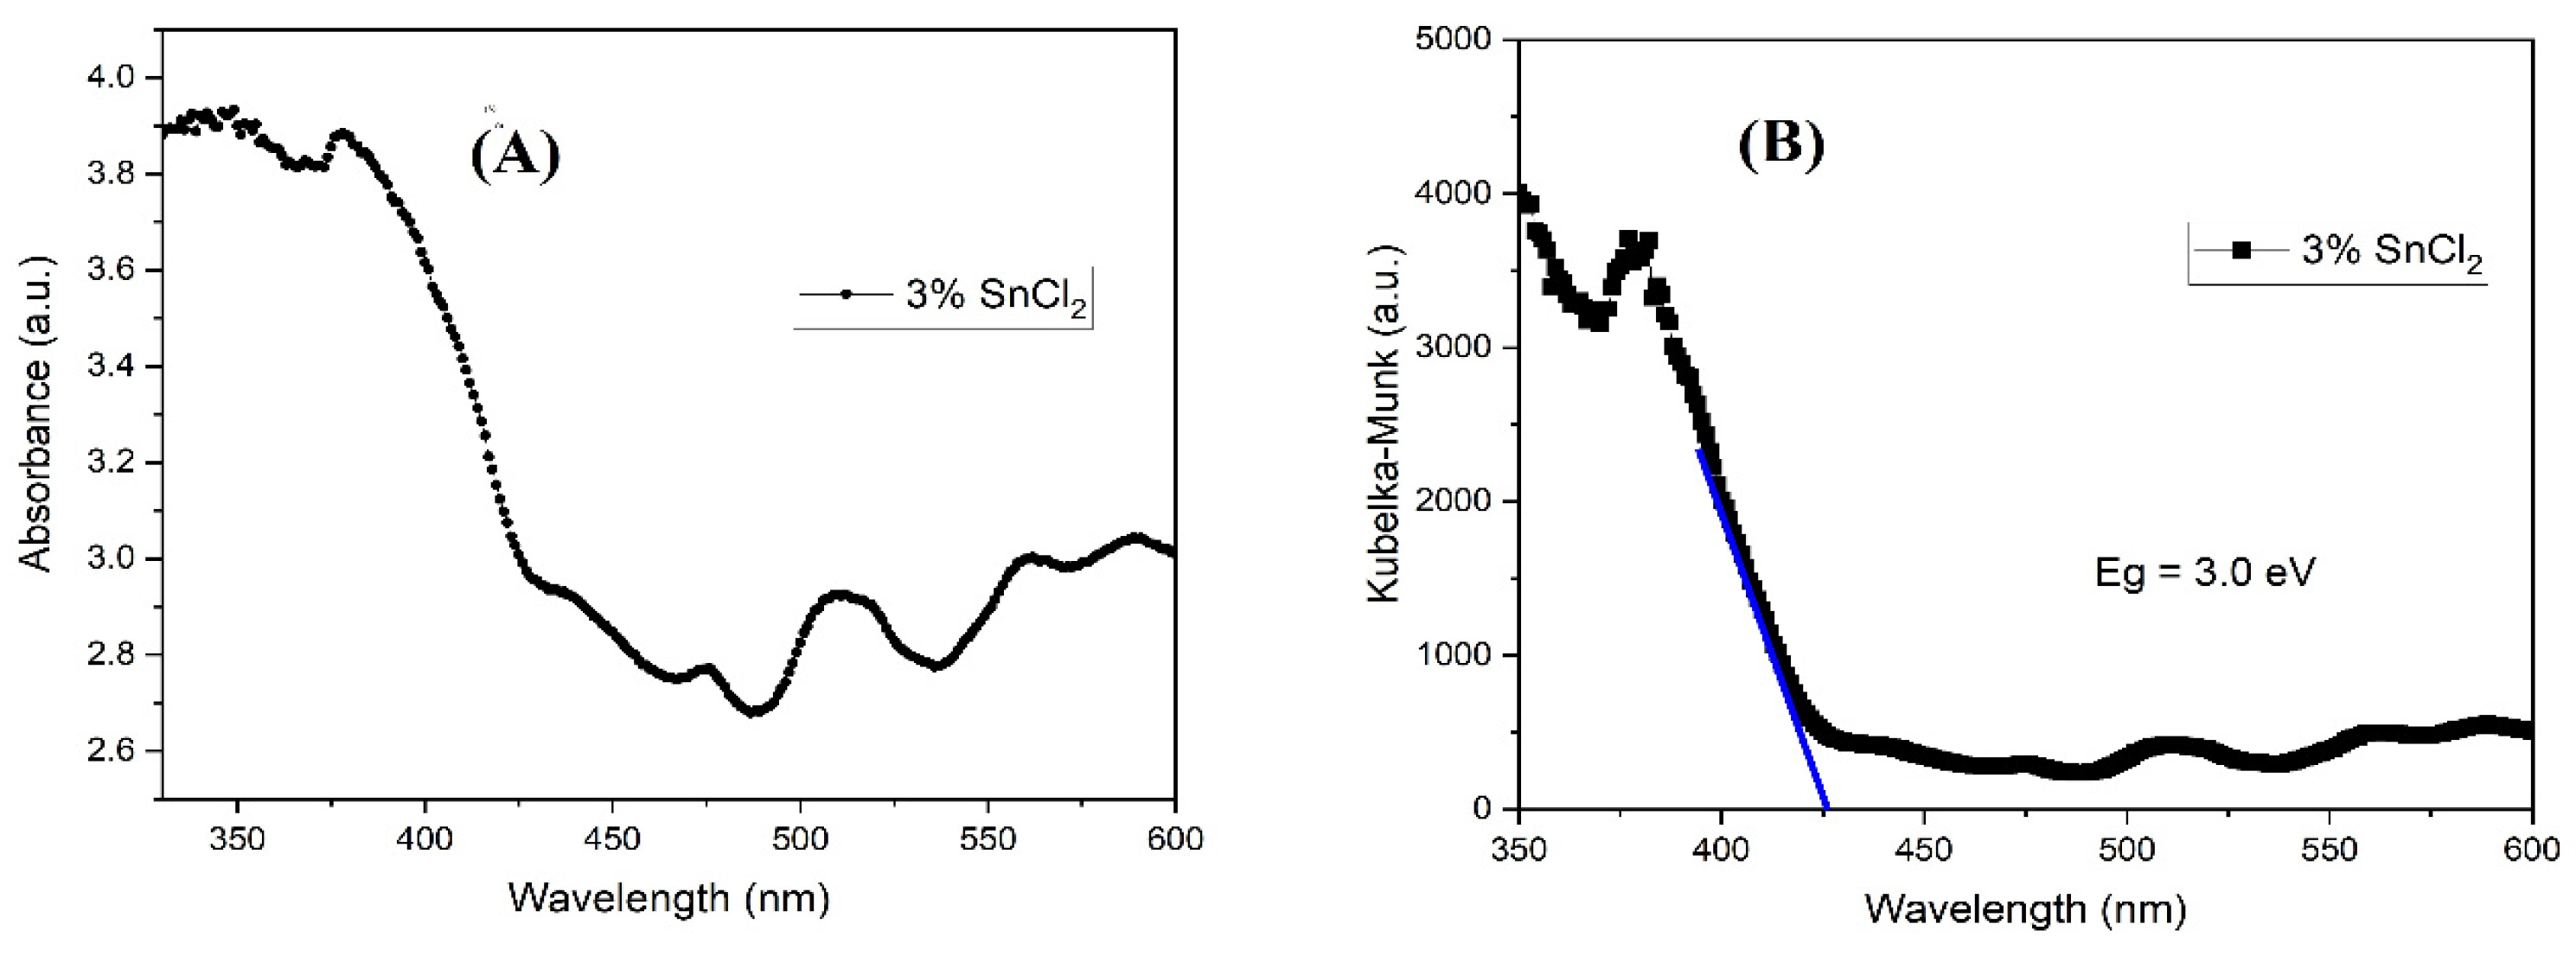
Figure 4 has the absorbance (A); Kubelka-Munk (KM) plot (B). The ultraviolet- visible tests were performed to see the peaks observed for the film of ZnO in the visible and in the ultraviolet region. The absorbance peak was around 350 nm, and some smaller ones in the visible range of the spectra. The KM estimated the band gap for the material, about 3.0 eV, that is lower than the average zinc oxide, 3.37 eV. The KM method plots in the y-axis the (F(R)(hv)
2), where the F (R) relation is described in equation 4 and hv is the photon energy. The band gap is estimated by the extension of the curve into the x-axis (wavelength). It is important, especially in solar cells that the fill has good absorbance but also that it did not absorb much energy to the point of overheating.
The band gap of the N719 dye is around 3.6 eV [14], helping the electron injection from the excited dye to the ZnO electron band, since both absorption peaks are in the same UV region, however this proximity can also increase the rate of recombination.
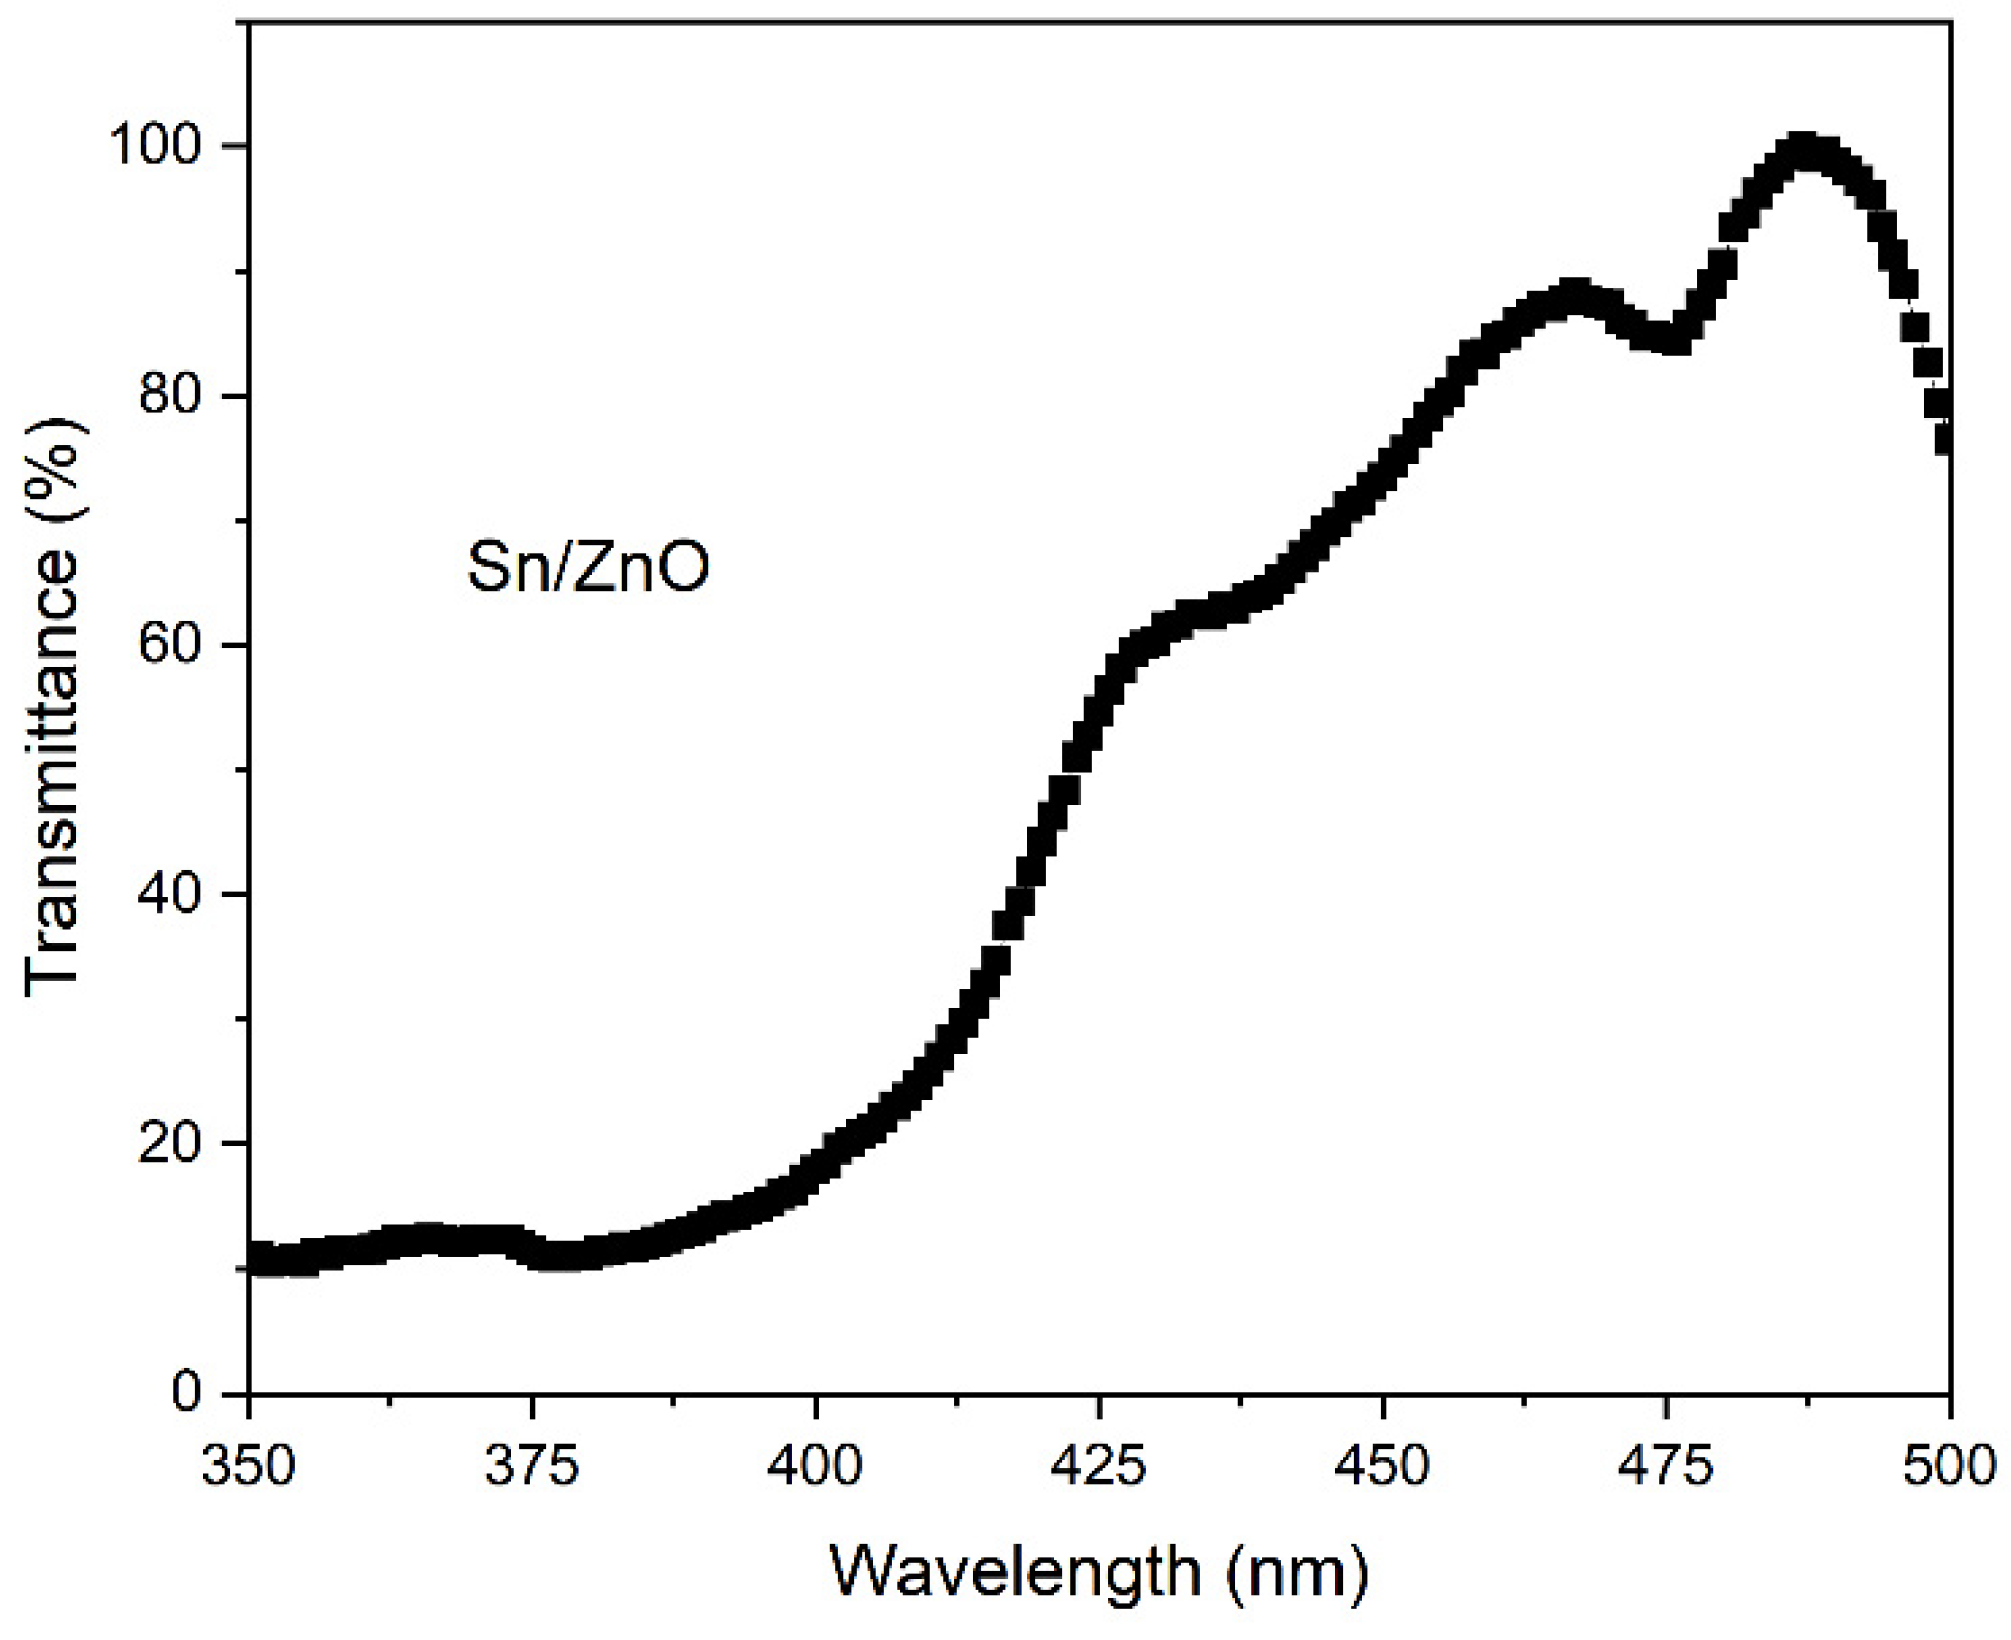
Figure 5 has the transmittance spectra for the film from the ultraviolet to the visible range of the wavelength, from 350 nm to 500 nm. It is observed that the spectra peaks at 500 nm, and lower at 350 nm (UV), that matches the absorbance spectra, with peaks at UV region [15]. Through the transmittance plot, it is also possible to observe where in the spectra the electron transitions inside the molecular structure of the zinc oxide. The doing helps to facilitate this transition reducing the distance between the transition levels.
3.3. DSSC Studies
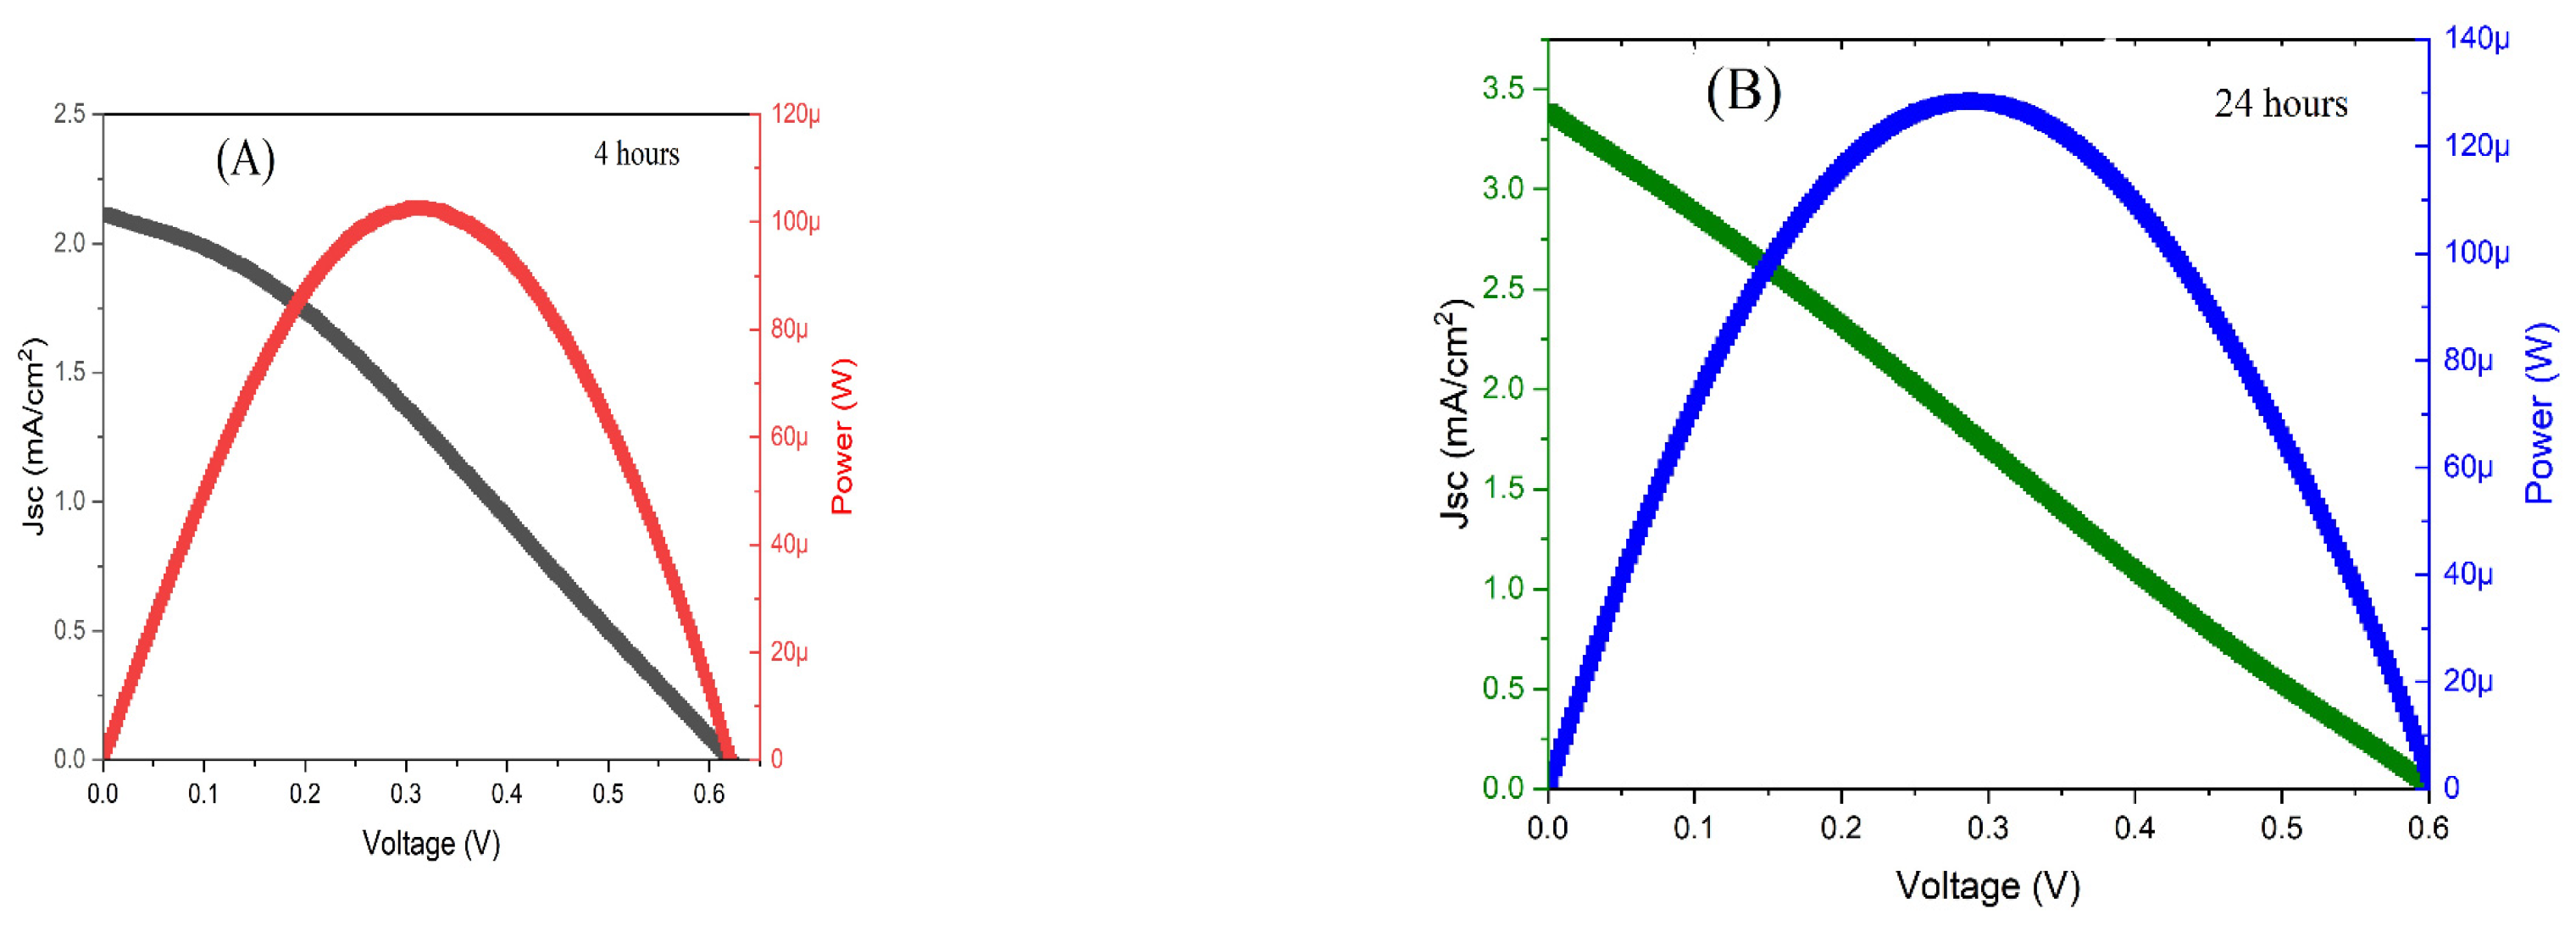
The film was used as a photoanode in a DSSC sandwiched structure. The film was immersed for 4 and 24 hours in the dye, and the following graphs have the results for the J-V-P analysis of the cells. Where J is the short current density, V is the voltage and P is the power obtained from the cells (
Figure 6).
The efficiency of the cells was calculated according to equation 5 [16]:
where Jsc is the short current density, Voc is the open circuit voltage, FF is the fill factor and Pin is the incident light (100 mW/cm
2); the fill factor indicates how close the maximum values are to the average output current and voltage and is calculated using equation 6 [16]:
where Jmax is the maximum current and V maximum is the maximum voltage output from the operating dye solar cell.
With these parameters, it is possible to calculate the parameters, such as efficiency, fill factor (FF), and Voc, open circuit voltage.
Table 2 has these values. The low fill factor is one of the main reasons that drove down the overall efficiency of the cells. It indicates that the cells have low stability, that is, the medium value of power or current obtained is lower than the maximum (100 and 130 µW). One of the ways to increase the efficiency of these cells would be to test other dye, and in consequence, another combination of dye/photoanode/electrolyte/counter electrode can offer more stability to the incident photocurrent conversion. Also, it could be tried other percentages of tin chloride in the photoanode, or other source of tin, such as tin oxide.
The levels of the occupied and unoccupied electrons are the same for both tested cells, which explains why the open circuit voltages are very close for both cells, 0.6 V and 0.63V. The increase in the dye time also increased the efficiency, mainly because the current value also went up from 2.11 to 3.38 mA/cm
2, that is higher than the pure ZnO at 1.4 mA/cm
2 [
11]. It indicated that the electron injection was higher from the excited dye to the conduction band of the Sn/ZnO. The presence of the tin chloride possibly reduced the formation of agglomerates between the ZnO and the Ru groups, however the efficiency was still low due to the fact that the presence of the acidic groups reduced the activity of the zinc oxide [17].
Table 2 has a comparison value for the efficiency from this study and parallel studies with dye solar cells. In some cases, the authors were testing new natural dyes [16,18] and also testing ZnO doped with Co [19] and Al [17], in dye solar cells.
The open circuit voltage depends on the ZnO and the other components of the cell, the counter electrode, the dye and the electrolyte. Since all the components were the same, the Voc did not significantly change from one cell to the other. The high crystalline size also helped to form the charge barriers of agglomerated microstructures.
Table 3 has a comparison value for the efficiency from this study and parallel studies with dye solar cells. In some cases, the authors were testing new natural dyes [16,18] and also testing ZnO doped with Co [19] and Al [17], and organic dyes [20] in dye solar cells. In the other studies, the low values were attributed to the testing of new natural dyes or the combination between the doping element and the dye.
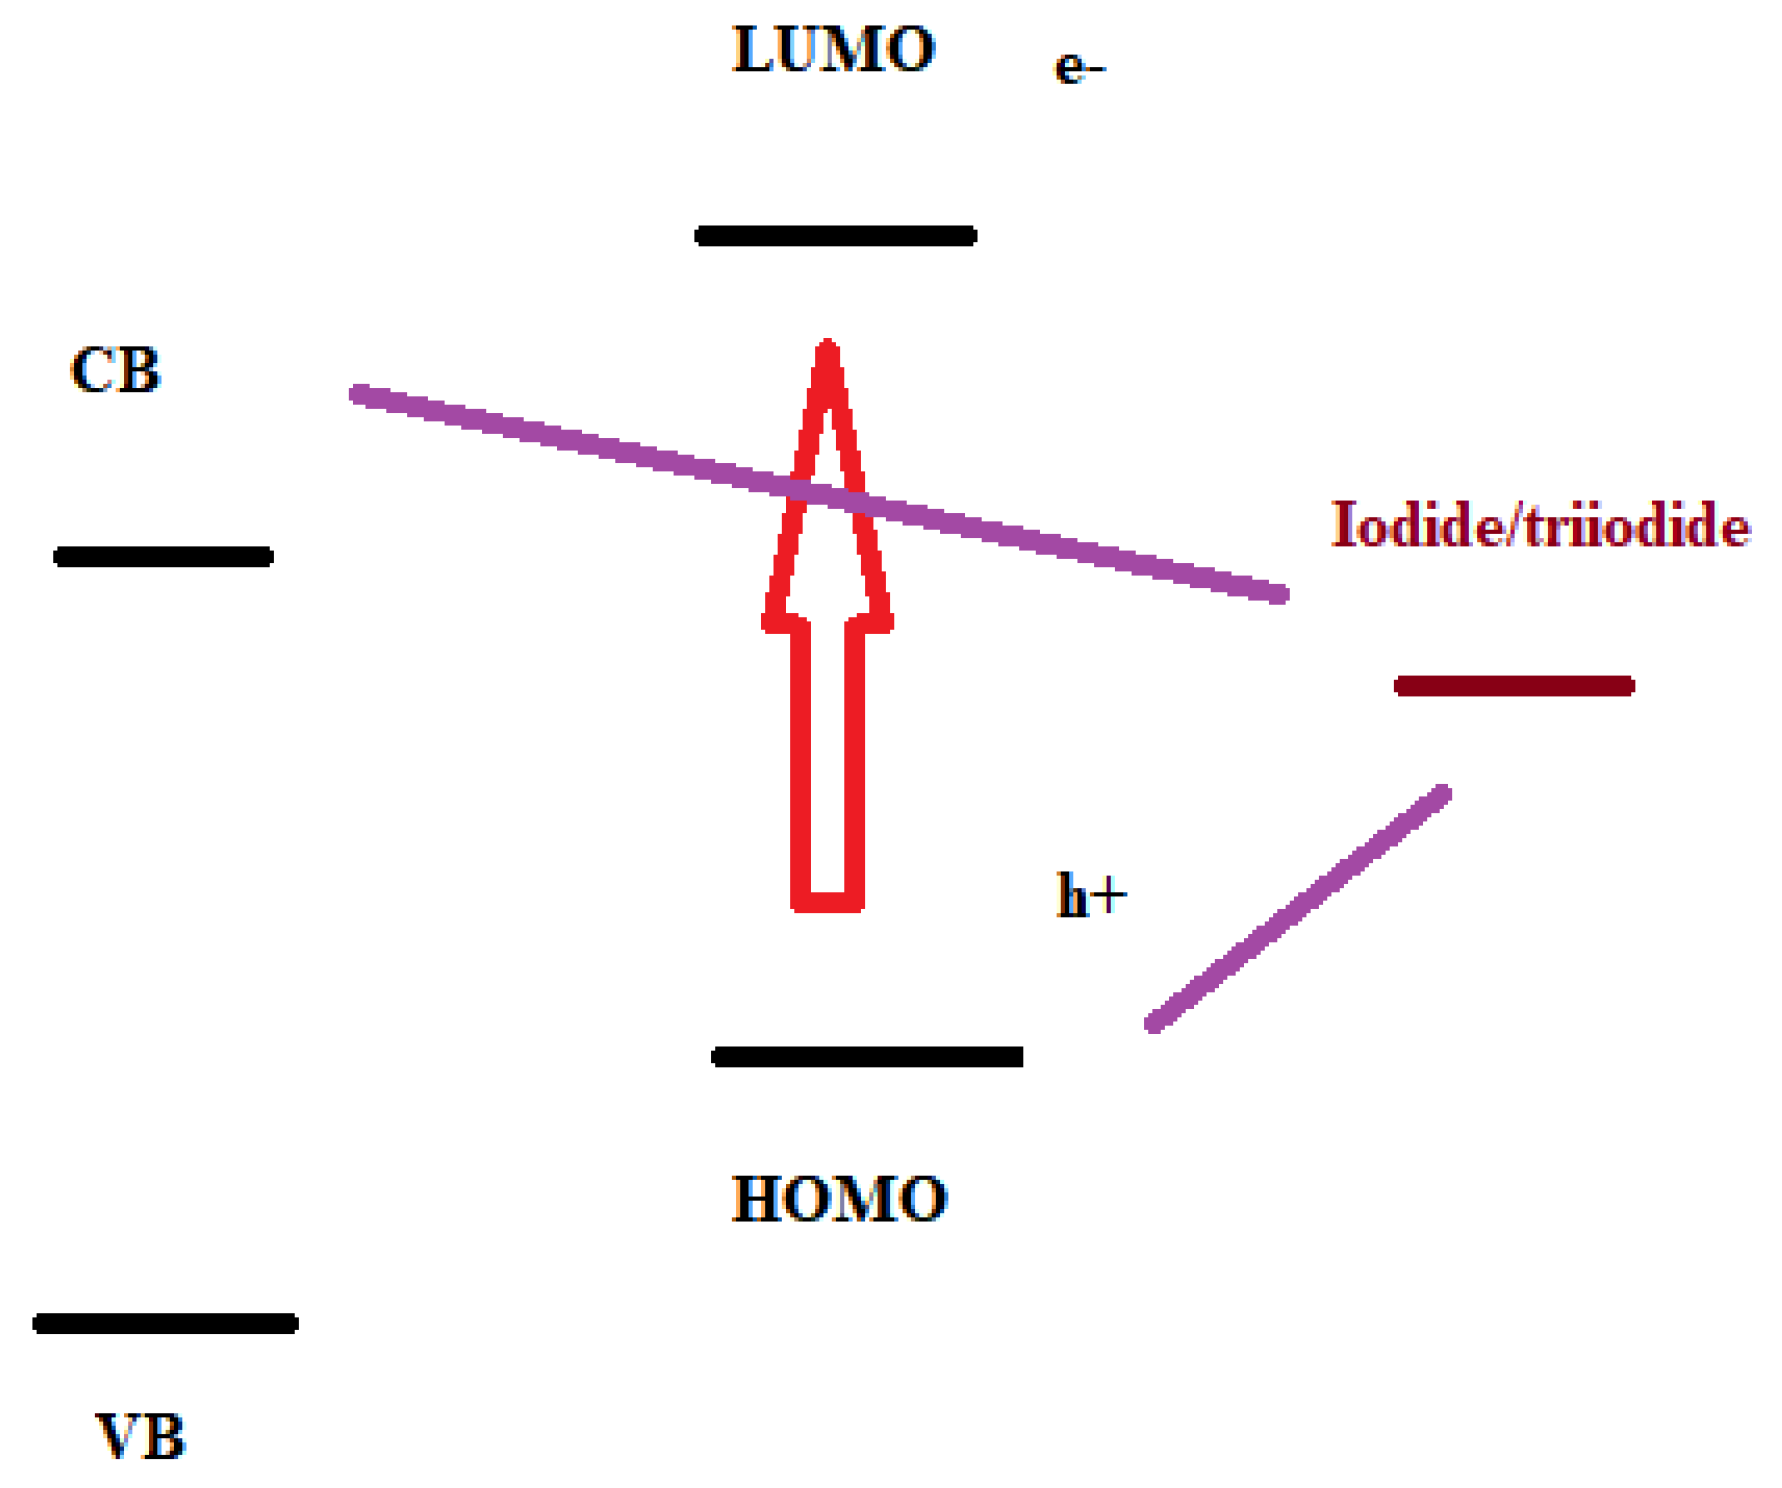
By the low efficiency values, it is possible to assume that there was a high recombination rate. This recombination happens when the excited electron, instead of going from the lower unoccupied molecular orbital (LUMO) to the conduction band of the semiconductor recombines back to regenerate the electrolyte before going through the external circuit or the electron goes from the HOMO to the iodide/triiodide (I
3-/I
-) (
Figure 7). The aim is for the increase of charge density and the decrease of recombination.
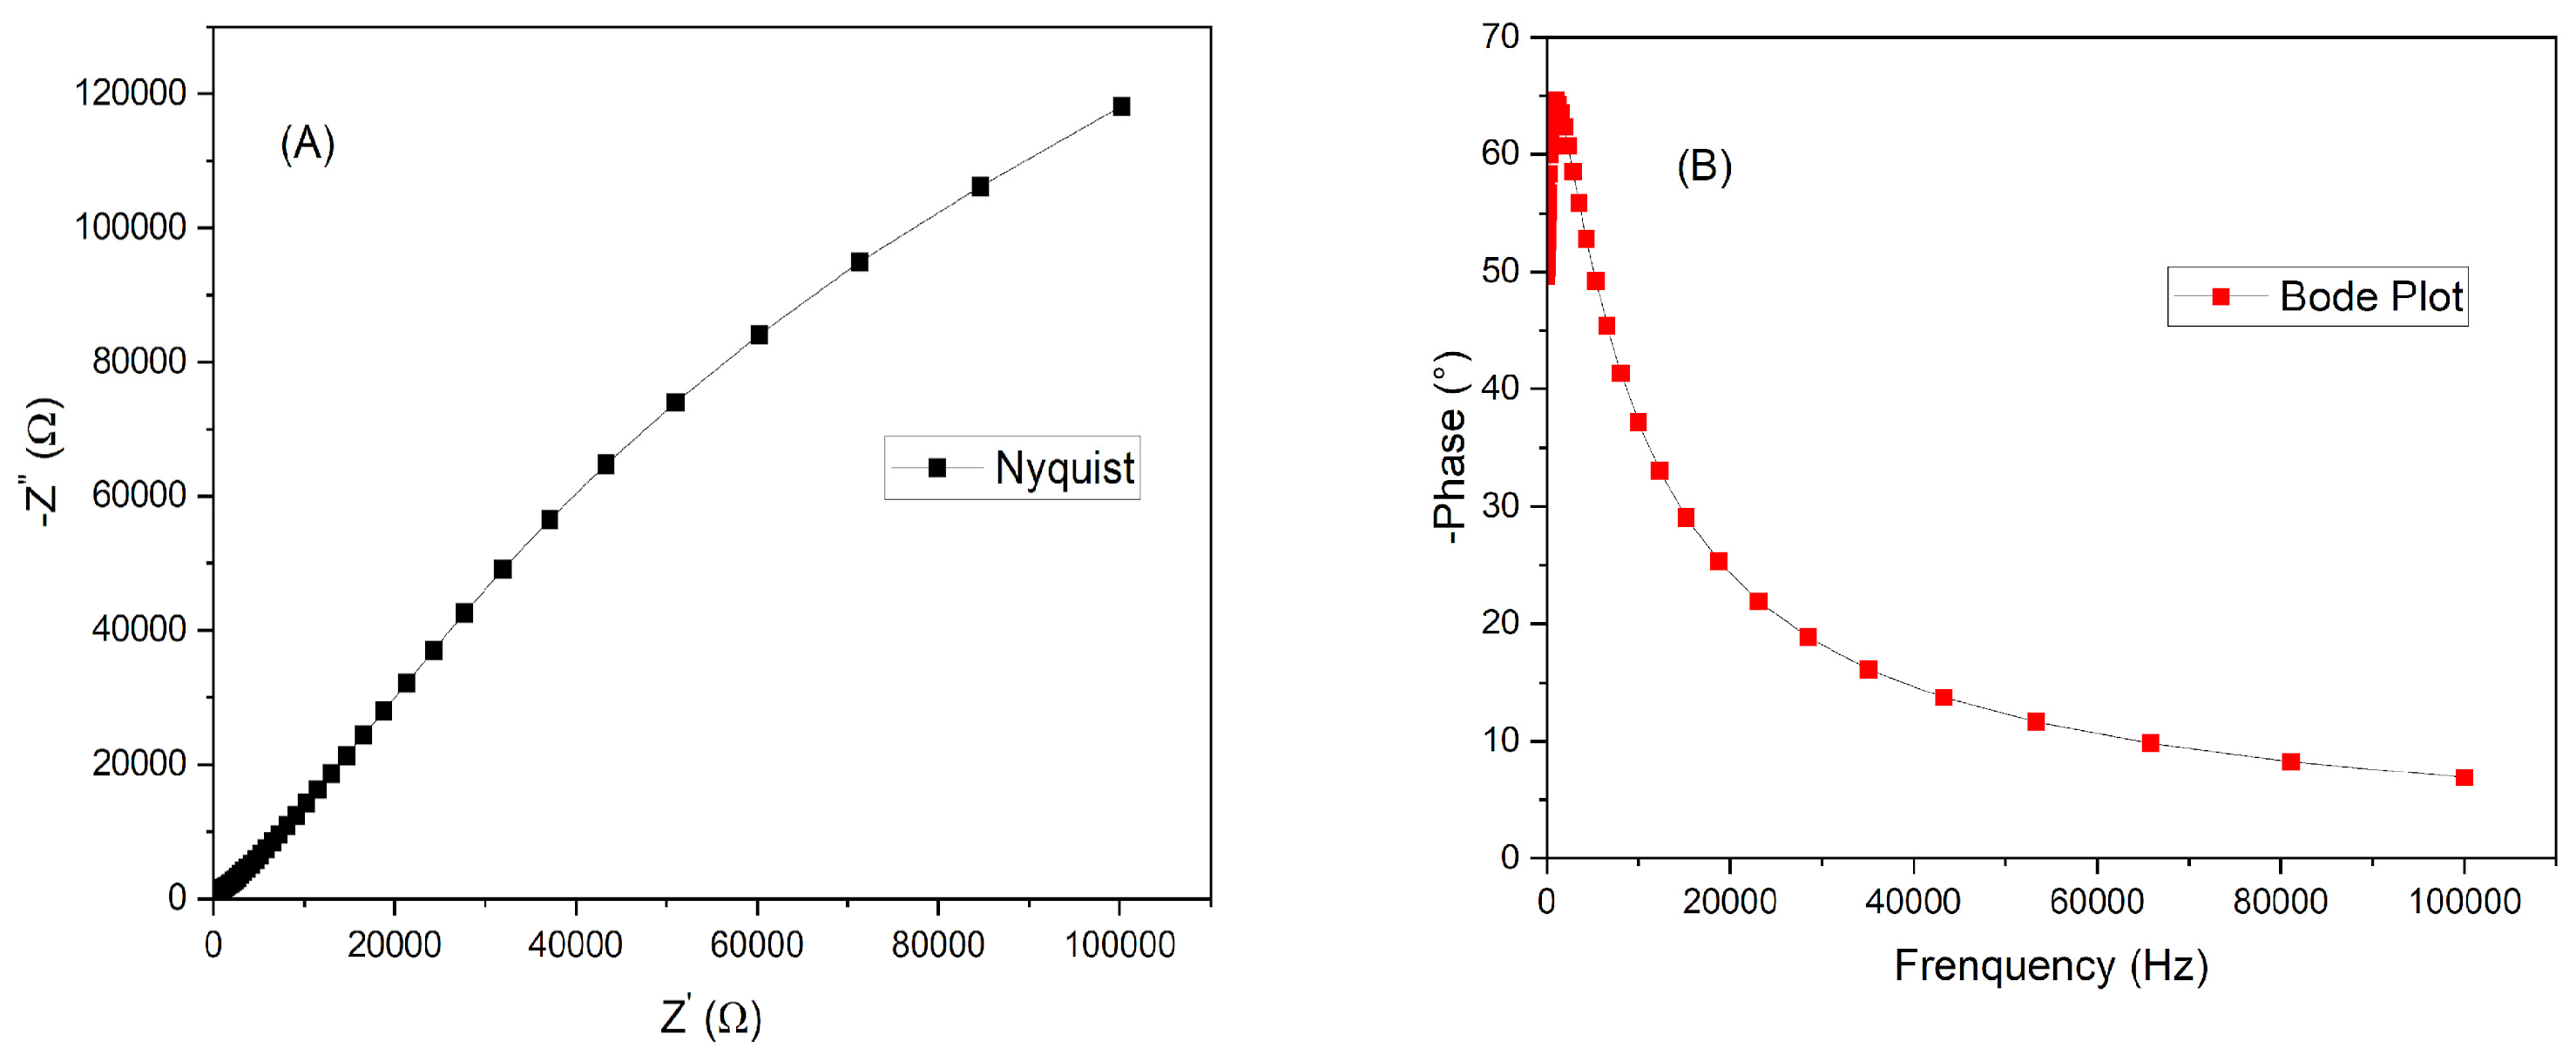
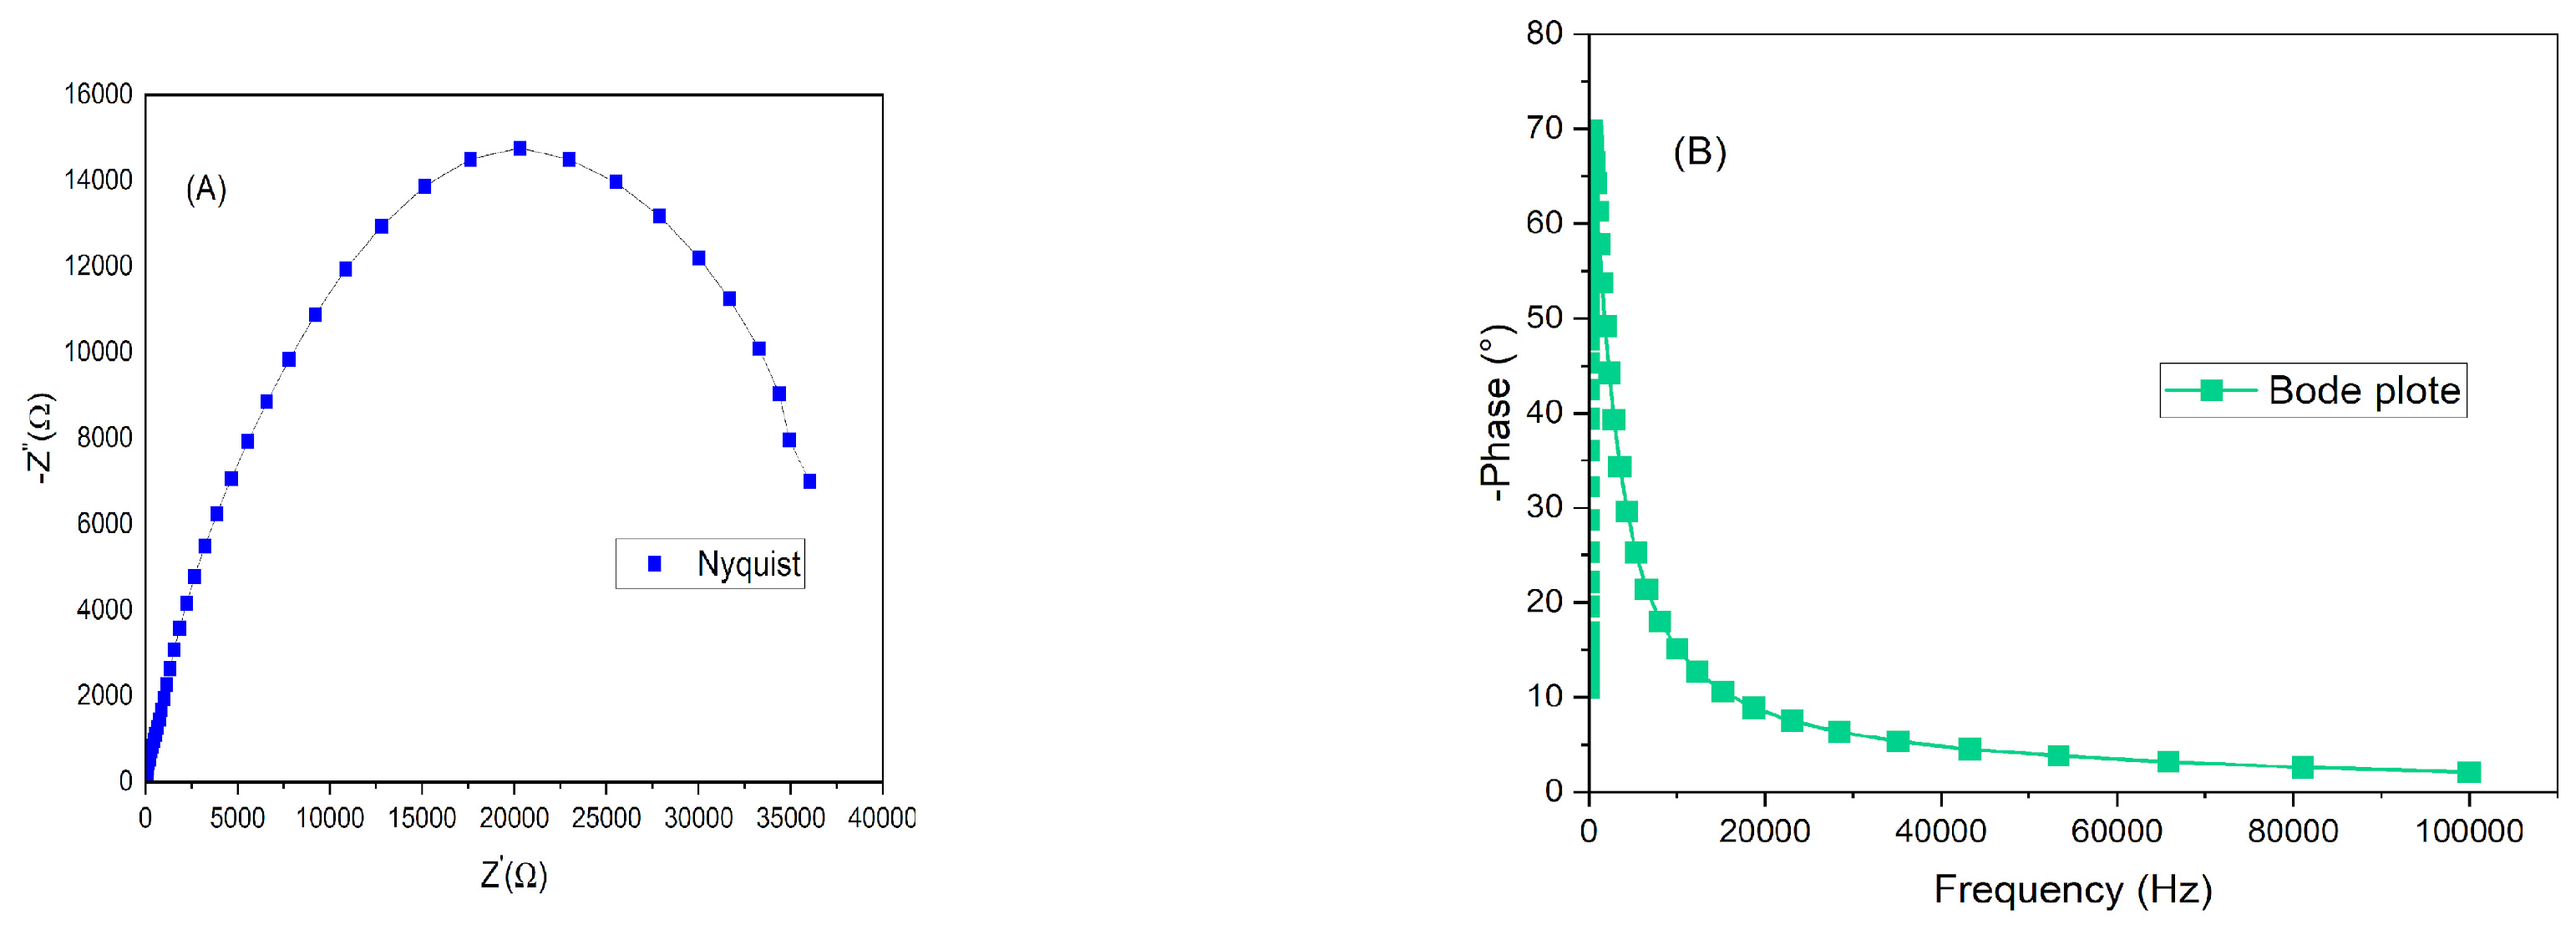
Figure 8 has the Nyquist (A) and Bode plot (B) of the solar cell assembled with film immersed for four hours on dye. It is necessary to find an optimum balance between time and the combination dye/semiconductor.
Figure 9 has the Nyquist (A) and (B) the Bode plot of the DSSC with photoanode immersed for twenty-four hours. There are three possibilities of resistance inside a DSSC cell: resistance at the photoanode/dye interface; the electrolyte or the counter electrode interface. By the Nyquist plots from both cells, it is observed that the resistance (Ω) of the cell is about 10x lower for the cell assembled with zinc oxide after it was immersed during 24 hours. This difference was enough to help to increase the current density from 2.11 to 3.38 mA/cm
2. For higher crystallite structures, higher immersion dye tends to favor the injection of photon from the dye to the ZnO, however if the time is increased, the resistance can also increase due to the formation of blockages of dye/ZnO [21]. The Bode plot reached a higher phase for the same maximum frequency. The series resistance (Rs) and shunt resistance (Rsh) were calculated for both cells. It is better to have high Rsh and lower Rs, for the electron to go through the external circuit and not to go back, recombining with the hole in the dye or the electrolyte. For four hours, the Rs was 221.15 and Rsh was 615.38 Ω/cm
2. The DSSC at 24 hours sensitized time had Rs of 172.18 and Rsh of 197.18 Ω/cm
2.
4. Conclusions
The zinc oxide semiconductor doped with tin chloride was successfully deposited on the conductor glass substrate at 450° temperature. The X-ray results showed that the doping increased the crystallite size to 46 nm, indicating high crystalline quality. The dislocation density line and the lattice strain were 7.55*10-6 and 0.000441. The main peaks were the hexagonal (100); (002) and (101). Different times were tested to evaluate the optimum dye immersion time of the semiconductor with the ruthenium-based dye. Lower immersion period is not sufficient from the zinc oxide to adsorbed dye molecules, however excessive time can create charge barriers. The study observed that the changing in the absorption time of the dye affected the parameters of the cells. The different dye times, from 4 to 24 hours, altered the overall efficiency, from 0.4 to 0.52%. It was caused mainly due to the increase of the current density of the material, from 2.11 to 3.38 mA/cm2. The resistance in the interface of the cells were also responsible for the low electron injection efficiency, as calculated by the series resistance, it was 221.15 Ω/cm2 for 4 h and 172.18 for Ω/cm2 for 24 h. For future works, it can be tried with other dye, with different reactant groups, or a different doping element into the ZnO, as also different immersion times.
Author Contributions
Conceptualization, V.F. Nunes; methodology, V.F. Nunes and F.M. Lima; software, V.F. Nunes, J.P.S. Mota and P.H.F.M Junior; validation, V.F. Nunes.; formal analysis, V.F. Nunes; investigation, V.F. Nunes.; resources, F.N.A. Freire and A.S.B. Sombra; data curation, V.F. Nunes; writing—original draft preparation, V.F. Nunes; writing—review and editing, V.F. Nunes; visualization, V.F. Nunes; supervision, F.N.A. Freire and A.S.B. Sombra.; project administration, F.N.A. Freire and A.S.B. Sombra; funding acquisition, A.S.B. Sombra. All authors have read and agreed to the published version of the manuscript.
Funding
This research was funded by CNPq, PDJ 32/2023.
Data Availability Statement
Data will be available if required.
Acknowledgments
The authors would like to thank the CNPq, funding number PDJ 32/2023 and process CNPq (Process: 402561/2007-4) Edital MCT/CNPq n◦ 10/2007.
Conflicts of Interest
The authors declare no conflicts of interest.
Abbreviations
The following abbreviations are used in this manuscript:
| DSSC |
Dye Sensitized Solar Cells |
| FF |
Fill Factor |
| Jsc |
Short circuit current density |
| Voc |
Open circuit voltage |
References
- Regmi, G.; Rijal, S.; Velumani, S. Aluminum-doped zinc oxide (AZO) ultra-thin films deposited by radio frequency sputtering for flexible Cu(In,Ga)Se2 solar cells. Memories - Materials, Devices, Circuits and Systems 5 (2023) 100064.
- Vemula, S.K.; Chelli, S.M.; Biswaas, C.; Soma, V.R.; Raavi, S.S.K. Adsorption and electron injection studies in N719 sensitized Ag−, Au− implanted and O2 annealed titania films. Optical Materials 154 (2024) 115633.
- Roy, A.; Sundaram, S.; Mallick, T.K. Effect of dye sensitization’s temperature on ZnO-based solar cells. Chemical Physics Letters 776 (2021) 138688.
- Portillo-Cortez, K.; Martínez, A. Different anchoring ligands for Ru complexes dyes and the effect on the performance of ZnO-based Dye-Sensitized Solar Cell (DSSC): A computational study. Computational and Theoretical Chemistry 1209 (2022) 113627.
- Zhuang, S.; Lu, M.; Zhou, N.; Zhou, L.; Lin, D.; Peng, Z.; Wu, Q. Cu modified ZnO nanoflowers as photoanode material for highly efficient dye sensitized solar cells. Electrochimica Acta 294 (2019) 2837.
- Dhamodharan, P.; Chen, J.; Manoharan, C. Fabrication of In doped ZnO thin films by spray pyrolysis as photoanode in DSSCs. Surfaces and Interfaces 23 (2021) 100965.
- Ge, Z.; Wang, C.; Chen, T.; Chen, Z.; Wang, T.; Guo, L.; Qi, G.; Liu, J. Preparation of Cu-doped ZnO nanoparticles via layered double hydroxide and application for dye-sensitized solar cells. Journal of Physics and Chemistry of Solids 150 (2021) 109833.
- Sharma, G.; Dawo, C.; Mulchandani, K.; Kumawat, U.K.; Singhal, R.K.; Lal, C. Revealing the photophysics of N719 dye based dye-sensitized solar cell. Optical Materials 2023, 142, 114113. [Google Scholar] [CrossRef]
- Yang, F.; Song, J.; Chen, X.; Lu, X.; Li, J.; Xue, Q.; Han, B.; Meng, X.; Li, J.; Wang, Y. Ultrasonic spray pyrolysis-induced growth of highly transparent and conductive F, Cl, Al, and Ga co-doped ZnO films. Solar Energy 228 (2021) 168–174.
- Ganesh, V.; Yahia, I.S.; Alfaify, S.; Shkir, M. Sn-doped ZnO nanocrystalline thin films with enhanced linear and nonlinear optical properties for optoelectronic applications. Journal of Physics and Chemistry of Solids 100 (2017) 115–125.
- Nunes, V.F.; Júnior, P.H.F.M.; Almeida, A.F.L.; Freire, F.N.A. Surface properties of Al2O3:ZnO thin films growth on FTO for photovoltaic application. Next Materials 2, (2024) 100069.
- Avilés-Betanzos, R.; Oskam, G.; Pourjafari, D. Low-Temperature Fabrication of Flexible Dye-Sensitized Solar Cells: Influence of Electrolyte Solution on Performance under Solar and Indoor Illumination. Energies 2023, 16(15), 5617. [Google Scholar] [CrossRef]
- Nunes, V.F.; Graça, M.P.F.G.; Hammami, I.; Almeida, A.F.L.; Freire, F.N.A. Effect of Time and Voltage on the Electrophoresis Deposition of Zinc Oxide Thin Films for Photovoltaic Applications. Appl. Sci. 2024, 14, 1202. [Google Scholar] [CrossRef]
- Nunes, V.F.; Lima, F.M.; Teixeira, E.S.; Júnior, P.H.F.M.; Almeida, A.F.L.; Freire, F.N.A. Synthesis of TiO2/ZnO photoanodes on FTO conductive glass for photovoltaic applications. Cerâmica 69 (2023) 79-86.
- Ackan, D.; Ozharar, S.; Ozugurlu, E.; Arda, L. The effects of Co/Cu Co-doped ZnO thin films: An optical study. Journal of Alloys and Compounds 797 (2019) 253e261.
- Essaki, E.S.; Deepa, G.; Vivek, P.; Devi, L.R.; Sheeba, N.L.; Sundar, S.M. Investigation on electrochemical analysis of ZnO nanoparticles and its performance for dye-sensitized solar cells using various natural dyes. Journal of the Indian Chemical Society 100 (2023) 100889.
- Das, A.; Nair, R.G. Fabrication of In2O3 functionalized ZnO based nanoheterojunction photoanode for improved DSSC performance through effective interfacial charge carrier separation. Optical Materials 122 (2021) 111784.
- Nasyori, A.; Patunrengi, I.I.; Noor, F.A. Investigate the utilization of novel natural photosensitizers for the performance of dye-sensitized solar cells (DSSCs), Investigate the utilization of novel natural photosensitizers for the performance of dye-sensitized solar cells (DSSCs).
- Das, A.; Wary, R.R.; Nair, R.G. Cu modified ZnO nanoflakes: An efficient visible light-driven photocatalyst and a promising photoanode for dye sensitized solar cell (DSSC), Solid State Sciences 104 (2020) 106290.
- Hidayat, A.; Taufiq, A.; Supardi, Z.A.I.; Jayadininggar, S.M.; Sa’adah, U.; Astarini, N.A.; Suprayogi, T.; Diantoro, M. Synthesis and characterization of TiO2/ZnO-Ag@TiO2 nanocomposite and their performance as photoanode of organic Dye-Sensitized Solar Cell. Materials Today: Proccedings 44 (2021) 3395-3399.
- Katta, V.S.; Das, A.; K. R.D.; Cilaveni, G.; Pulipaka, S.; Veerappan, G.; Ramasamy, E.; Meduri, P.; Asthana, S.; Melepurath, D.; Raavi, S.S.K. Vacancies induced enhancement in neodymium doped titania photoanodes based sensitized solar cells and photo-electrochemical cells. Solar Energy Materials & Solar Cells 220 (2021) 110843.
|
Disclaimer/Publisher’s Note: The statements, opinions and data contained in all publications are solely those of the individual author(s) and contributor(s) and not of MDPI and/or the editor(s). MDPI and/or the editor(s) disclaim responsibility for any injury to people or property resulting from any ideas, methods, instructions or products referred to in the content. |
© 2025 by the authors. Licensee MDPI, Basel, Switzerland. This article is an open access article distributed under the terms and conditions of the Creative Commons Attribution (CC BY) license (https://creativecommons.org/licenses/by/4.0/).