
Submitted:
21 May 2025
Posted:
23 May 2025
You are already at the latest version
Abstract
The paper evaluates the performance of Spathiphyllum wallisii-based DSSC with ZnO nanostruc-tured photoanode. The dye has a wider UV-vis absorption spectrum (300-365nm, 390-410nm, 412-480nm) and higher wavelengths (λ=660-680nm), with peaks at 250nm, 331nm, 406nm, 455nm, and a small peak at 667nm. It can generate power in cloudy weather or diffused solar radiation because it absorbs UV rays broadly. As an indoor plant, Spathiphyllum can generate electricity at night with artificial light. The dye's optical band gap energy and energy band position are determined by cyclic voltammetry (CV), ensuring its stability and high electron affinity for light harvesting and electron transfer from dye to semiconductor or interface. A cost-effective chemi-cal bath deposition (CBD) method deposits nanostructured ZnO on FTO-based transparent con-ducting glass. Unidirectional ZnO nanorods with hexagonal wurtzite patterns and nano steps are shown in scanning electron microscope images. The ZnO nanorod averages 3 µm in length and 200 nm in diameter. The diffused reflectance spectra (DRS) of ZnO have full reflection after 400nm, but dye anchoring reduces it to 48%. EIS was used to determine charge transfer re-sistance, total bulk resistance, and recombination loss for the fabricated DSSC using Nyquist and Bode plots. The developed DSSC's I-V and P-V curves are measured under 75 mW/cm2 simulated light source and 20 mW/cm2 light condition. The dye-sensitized cell converts visible light to electricity efficiently at 1.2% and 0.6% with respective light sources. This paper evaluates the structural, morphological, optical, and electrochemical attributes of the dye and dye-sensitized solar cells to determine their suitability.
Keywords:
DSSC
; nanostructured ZnO
; uv-vis spectroscopy
; cyclic voltammeter
; electrochemical impedance spectra
; HOMO-LUMO position
; current-voltage characteristics
1. Introduction
Spathiphyllum wallisii, locally known as peace lily, a shadow loving plant grows well in a damp and dark environment. The leaf of this plant contains a distinct type of chlorophyll pigment which can absorb photon from visible rays, uv rays and diffused sunlight also. This plant's chlorophyll pigment extract is used to photo-sensitize ZnO-based dye-sensitized solar cell (DSSC). Top-to-bottom stacking of transparent conductive oxide (TCO) substrate, photo-anode, dye, electrolyte, and carbon-coated cathode makes up DSSC [1]. TCO substrate supports the transparent covering of the cell and electron collection point. FTO and ITO are the most popular TCO used in DSSC as they have transparency of about 85% and different rating of resistance from 7 ohm/sq unit to 20ohm/sq unit (Sigma Aldrich). Photo-anode serves as the back bone of the cell and functioned as collecting and transporting of excited photoelectrons from the dye to the TCO. Well-known semiconductor materials for the creation of photovoltaic cells include titanium dioxide and zinc oxide. However, due to their wide band gap, these SMOs do not absorb light in the visible spectrum. Therefore, these semiconductor metal oxides (SMO) should be anchored with a photo sensitizer that can capture light in the visible spectrum, or between 300 and 2000 nm, where the sun emits light. The thermodynamic analysis demonstrates that the photon-to-electricity conversion occurs most effectively when the photosensitizer absorbs emitted photons with wavelengths below 820 nm. The best dye for solar conversion should, therefore, have entire visible spectrum absorption. Although the photon-to-electron conversion efficiency of nanostructured TiO2 is higher, the electron transfer rate of pure TiO2 is low. The result is a decrease in system efficiency due to the high number of interface recombination reactions involving the SMO, dye, and electrolyte [2-6]. The current generated by recombination is referred to as the dark current [5]. ZnO is also treated as photoanode material when it is synthesized as nanostructure and that can provide a straight path for the flow of electrons, hence, enhancing electron mobility and longevity [7-9]. A variety of techniques are available for producing nanostructured ZnO. In this case, a straightforward and economical wet CBD method is utilized to grow nanostructured ZnO directly over TCO [10]. The primary benefit of the semiconductor's nanorod or nanowire-shaped structure is unidirectional electron flow when the circuit is closed. During exposure to sunlight, dye molecules sensitized in semiconductor metal oxides (SMO) are excited and transfer one electron into the SMO's conduction band. In reduction, the electrolyte provides one electron for dye regeneration. The regeneration of the electrolyte occurs through oxidation, wherein it accepts a single electron provided by the counter electrode and subsequently recovers conduction band electrons upon the completion of the circuit by an external load [9]. Thus, the efficiency of the DSSC depends on each part of the cell [11-15].
Photosensitizing properties of the dyes play an important role for DSSC as they can enhance the light absorption criteria. Metal complex sensitizers, organic sensitizers, and natural sensitizers are the three types of dye sensitizers employed in the DSSC production procedure. Because of the stability of complex excited states and the long-term chemical stability of oxidized-Ru-n, Ru-bipyridyl complexes have been demonstrated to be good photo-sensitizers [16]. The technique used for the preparation of Ruthenium (II) based and organic sensitizers is sophisticated and costly. Natural dyes are abundant in nature and highly cost-effective in comparison to others. Some natural dyes are compatible with each other and exhibit better photon absorbance quality. A variety of pigments, including anthocyanin, betalains, chlorophyll, and others, are present in plant-based dyes derived from a variety of sources [17-23]. In this paper, the authors have evaluated the performance of chlorophyll-containing natural dye extracted from the leaf of Spathiphyllum wallisii. The molecular structure, anchoring groups, redox characteristics of the electrolyte, band positions of each component of the DSSC, and driving force energy are the critical dye characteristics that impact its stability and efficacy as a dye sensitizer in DSSC [10].
The electrolyte is an essential component of the DSSC. Electrolyte aids in dye electron regeneration and act as an ion convey medium for positive ion transfer to the counter electrodes when the dye is oxidized by transferring electrons to the conduction band of the SMO. The organic solvent in the liquid electrolyte has exceptional interfacial contact properties and a high ionic conductivity. The characteristics of the electrolyte affect the stability and long-term performance of the DSSC [24].
Another essential part of the DSSC, the counter electrode has a high catalytic activity as well as a high electronic conductivity. It transports the electrons to the redox mediator after collecting them from the external circuit. With the oxidized electrolyte diffusing in its direction, the electrolyte is regenerated. The counter electrode must have high electrical conductivity for effective charge transfer. To accelerate the reduction reaction, the counter electrode has to function as a catalyst [25].
Here, the DSSC is made using nanostructured ZnO that is directly grown on the FTO glass as a photo anode using a quick and affordable chemical bath deposition process, and Spathiphyllum as a natural dye sensitizer. No literature is available for DSSC made up of this dye and ZnO photo anode. For this solar cell, the electrical performance metrics are assessed. Section 2 explains the layer-wise experimental process for the fabrication of DSSC, and Section 3 presents some experimental findings and discussions made on the stability and effectiveness of the cell.
2. Materials and Methods
2.1. Synthesis of nanostructured ZnO over FTO glass
Zinc oxide (ZnO) films are synthesized on fluorine-doped tin oxide (FTO) substrates using the CBD method. Here, FTO is used since previous research has shown that FTO is more effective than indium tin oxide (ITO) [10, 26]. The FTOs are dried in an oven kept at 70 °C after a thorough cleaning process before being used in future tests. The cleaned FTO substrate is put into a beaker with 40 ml of a solution containing 0.1 molar Zn(NO3)2.6H2O and 2 ml of a solution containing 28% NH4OH in double-distilled water. For 2 hours at 80 °C on a hot plate, zinc oxide (ZnO) is created by a direct growth process on a fluorine-doped tin oxide (FTO) substrate. To bring the substrate's pH back to 7 after the deposition procedure, it was removed from the solution and washed with de-ionized water. The ZnO-coated fluorine-doped tin oxide (FTO) substrate is dried in an oven at 70 degrees Celsius, then annealed at 450 degrees Celsius for two hours in a vacuum chamber. The flowchart and a schematic of the synthesis procedure together are described in [10]. The shape of the ZnO's surface changes depending on how long it's incubated on a heated plate. FESEM and X-ray diffraction (XRD) analysis of the samples are used to evaluate the surface morphology of the manufactured ZnO. Equations (1) and (2) demonstrate the Scherrer and tangent formulas, which can be used to calculate the size of the crystallite (D) and lattice strain (ε) for a hexagonal wurtzite ZnO structure [27-28].
Equations (3) and (4) are used to determine the wurtzite structure's lattice parameters, denoted as a and c, respectively [29-30].
2.2. Extraction of chlorophyll-based natural dye
Spathiphyllum wallisii has chlorophyll in its leaves. Initially, it was unknown which type of chlorophyll it has. Thus, the extraction has made both using a polar solvent like ethanol and a non-polar solvent as di-ethyl-ether. Using the following method chlorophyll is extracted from the leaves. Using a mortar, fresh Spathiphyllum wallisii leaves are crushed into a paste before being placed in an ultrasonic cleaner set to 'degas' mode for 15 minutes at 30°C and 37 Hz frequency. After being centrifuged at 2500 rpm for 30 minutes, the samples are segregated according to their hue. By filtering and centrifuging the juices at 13,000 rpm for 20 minutes, all of the solid residues were removed. A pH meter is used to determine the acidity level of the extracted dye. The ZnO-coated FTO that was produced is dipped into the solution and allowed to sit for 24 hours at 25 degrees Celsius. Figure 1 shows the extraction of dye from the Spathiphyllum leaves and photo anode dipped with the dye.
.
2.2.1. Evaluation of Photosensitization characteristics of extracted dye
The photosensitization characteristics of the extracted dye are evaluated through certain experiments.
UV-vis spectroscopy
According to the available research, four distinct chlorophyll pigment types (types A, B, C, and D) exist. Photosynthesis relies heavily on both type A and B. Chlorophyll's molecular structure is a porphyrin ring coordinated to a magnesium atom. Chlorophyll A and B are structurally identical except that chlorophyll A possesses a methyl group (CH3), in the chlorine ring while chlorophyll B has an aldehyde group (CHO), in the same position. Blue-green light is reflected by chlorophyll A, but violet-blue and orange-red light (430-660nm) is absorbed by it. Chlorophyll B can reflect orange-red light while absorbing only violet-blue light (between 450 and 650 nm in wavelength). Chlorophyll A is only slightly soluble in nonpolar solvents, but it dissolves completely in di-ethyl-ether. Polar solvents like ethanol and methanol have a high solubility for chlorophyll B. Figure 2 depicts the structure of both types of chlorophyll.
The extracted dye undergoes various tests to assess its photosensitizing abilities. Analyzed using UV-vis spectroscopy to determine its light absorbance properties at different wavelengths. The Tauc’s plot is designed to determine the approximate bandgap energy. By equation 5, Tauc's plot, which incorporates the quantity (αhv)2 on the y-vertex and the x-axis, is characterized by the presence of hv (light energy), can be obtained by extrapolating the linear region to the zero-absorbance bandgap energy [32]. The absorbance coefficient, denoted as α, is obtained from UV-vis spectroscopy in this case.
Using equation (6), the photon's optical bandgap energy, Egopt can be determined [33, 34].
The symbols stand for Plank's constant (h), the speed of light (c), and the wavelength of maximum absorbance (λonstate), respectively.
To generate an electron-hole pair after photon absorption, the photon energy Egopt must be greater than the energy of the semiconductor band gap Eg. When the energy is less than the band gap energy, no absorption takes place. For low-energy light, the material is transparent. Although a single electron-hole pair will be created if the energy of the incident photon is greater than the band gap, this is not always the case. Within a substance, the leftover photon energy is converted to heat. Therefore, it is preferred to choose semiconductors with a band gap energy that permits efficient absorption of the maximum possible proportion of the solar spectrum.
Cyclic Voltammetry measurement:
A cell's ability to generate photocurrent is proportional to the efficiency with which it transfers electrons from dye to SMO. For efficient hole transport, it is necessary for the dye that its valence band to be positioned higher than the position of the conduction band of SMO and the dye's conduction band should be below the dye's valence band position for efficient electron transport. With this configuration, electron transport from the dye to the SMO is enhanced, recombination loss is reduced, and cell stability is enhanced [25]. A cyclic voltammeter can be used to determine the dye's redox characteristics. As an oxidation reaction, the highest occupied molecular orbital (HOMO) requires energy to remove an electron from a molecule of dye. The energy required for the introduction of an electron to a dye molecule distinguishes the lowest unoccupied molecular orbital (LUMO), which is associated with a reduction reaction. The energy difference between the dye's HOMO and LUMO levels represents its band gap [35]. Cyclic voltammeter readings have been taken using the three-leads technique [CH Instrument 1120A]. The working electrode is made of platinum, and a platinum wire with a radius of 1.5 mm is being considered for the counter-electrode. The reference electrode was Ag/AgCl2, and the supporting electrolyte was 0.1M Tetra butyl ammonium perchlorate in a nitrogen environment. To get the colors out, acetonitrile is utilized as a solvent. The investigation is performed at a temperature of 25°C and a scanning rate of 100mV/Sec.
Using this experiment the identification of oxidation and reduction peaks are achieved and the positions of HOMO and LUMO within the energy band can be established. These analyses will reveal whether or not the dye will remain stable and function properly in solar cells.
Initially, Rehm-Weller [25] proposed the mechanism of photo-induced electron transfer. The procedure described enables the determination of the driving force (G°) associated with the transfer of energy between a donor and an acceptor, as represented by equation (7).
2.3. Fabrication of DSSC
DSSC is created using the photoanode and natural dye by stacking the layers. The ZnO photoanode is immersed in the chlorophyll dye extract for 24 hours. The electrolyte employed in this study is the I-/I-3 redox pair, while the counter electrode utilized carbon-coated FTO. Silver paste is employed to extract the electrical contacts from the solar cell that has been fabricated.
Following the creation of solar cells, a solar simulator with a consistent light intensity of 100mW/cm2 and 25mW/cm2 is employed to analyze the efficiency of DSSC. The DSSC's performance is assessed based on short circuit current density (Isc), open circuit voltage (Voc), fill factor (FF), and photo conversion efficiency (η). The fill factor (FF) of a solar cell is the ratio of the maximum power (Pm) generation to the product of short circuit current density (Isc) and open circuit voltage (Voc). This parameter is crucial for assessing the efficiency of a solar cell. Equation (8) defines the efficiency (η) of DSSC as the quotient of the maximum energy output of the DSSC divided by the total light energy (Pin) that is incident on the entire surface area of the solar cell.
3. Results and Discussion
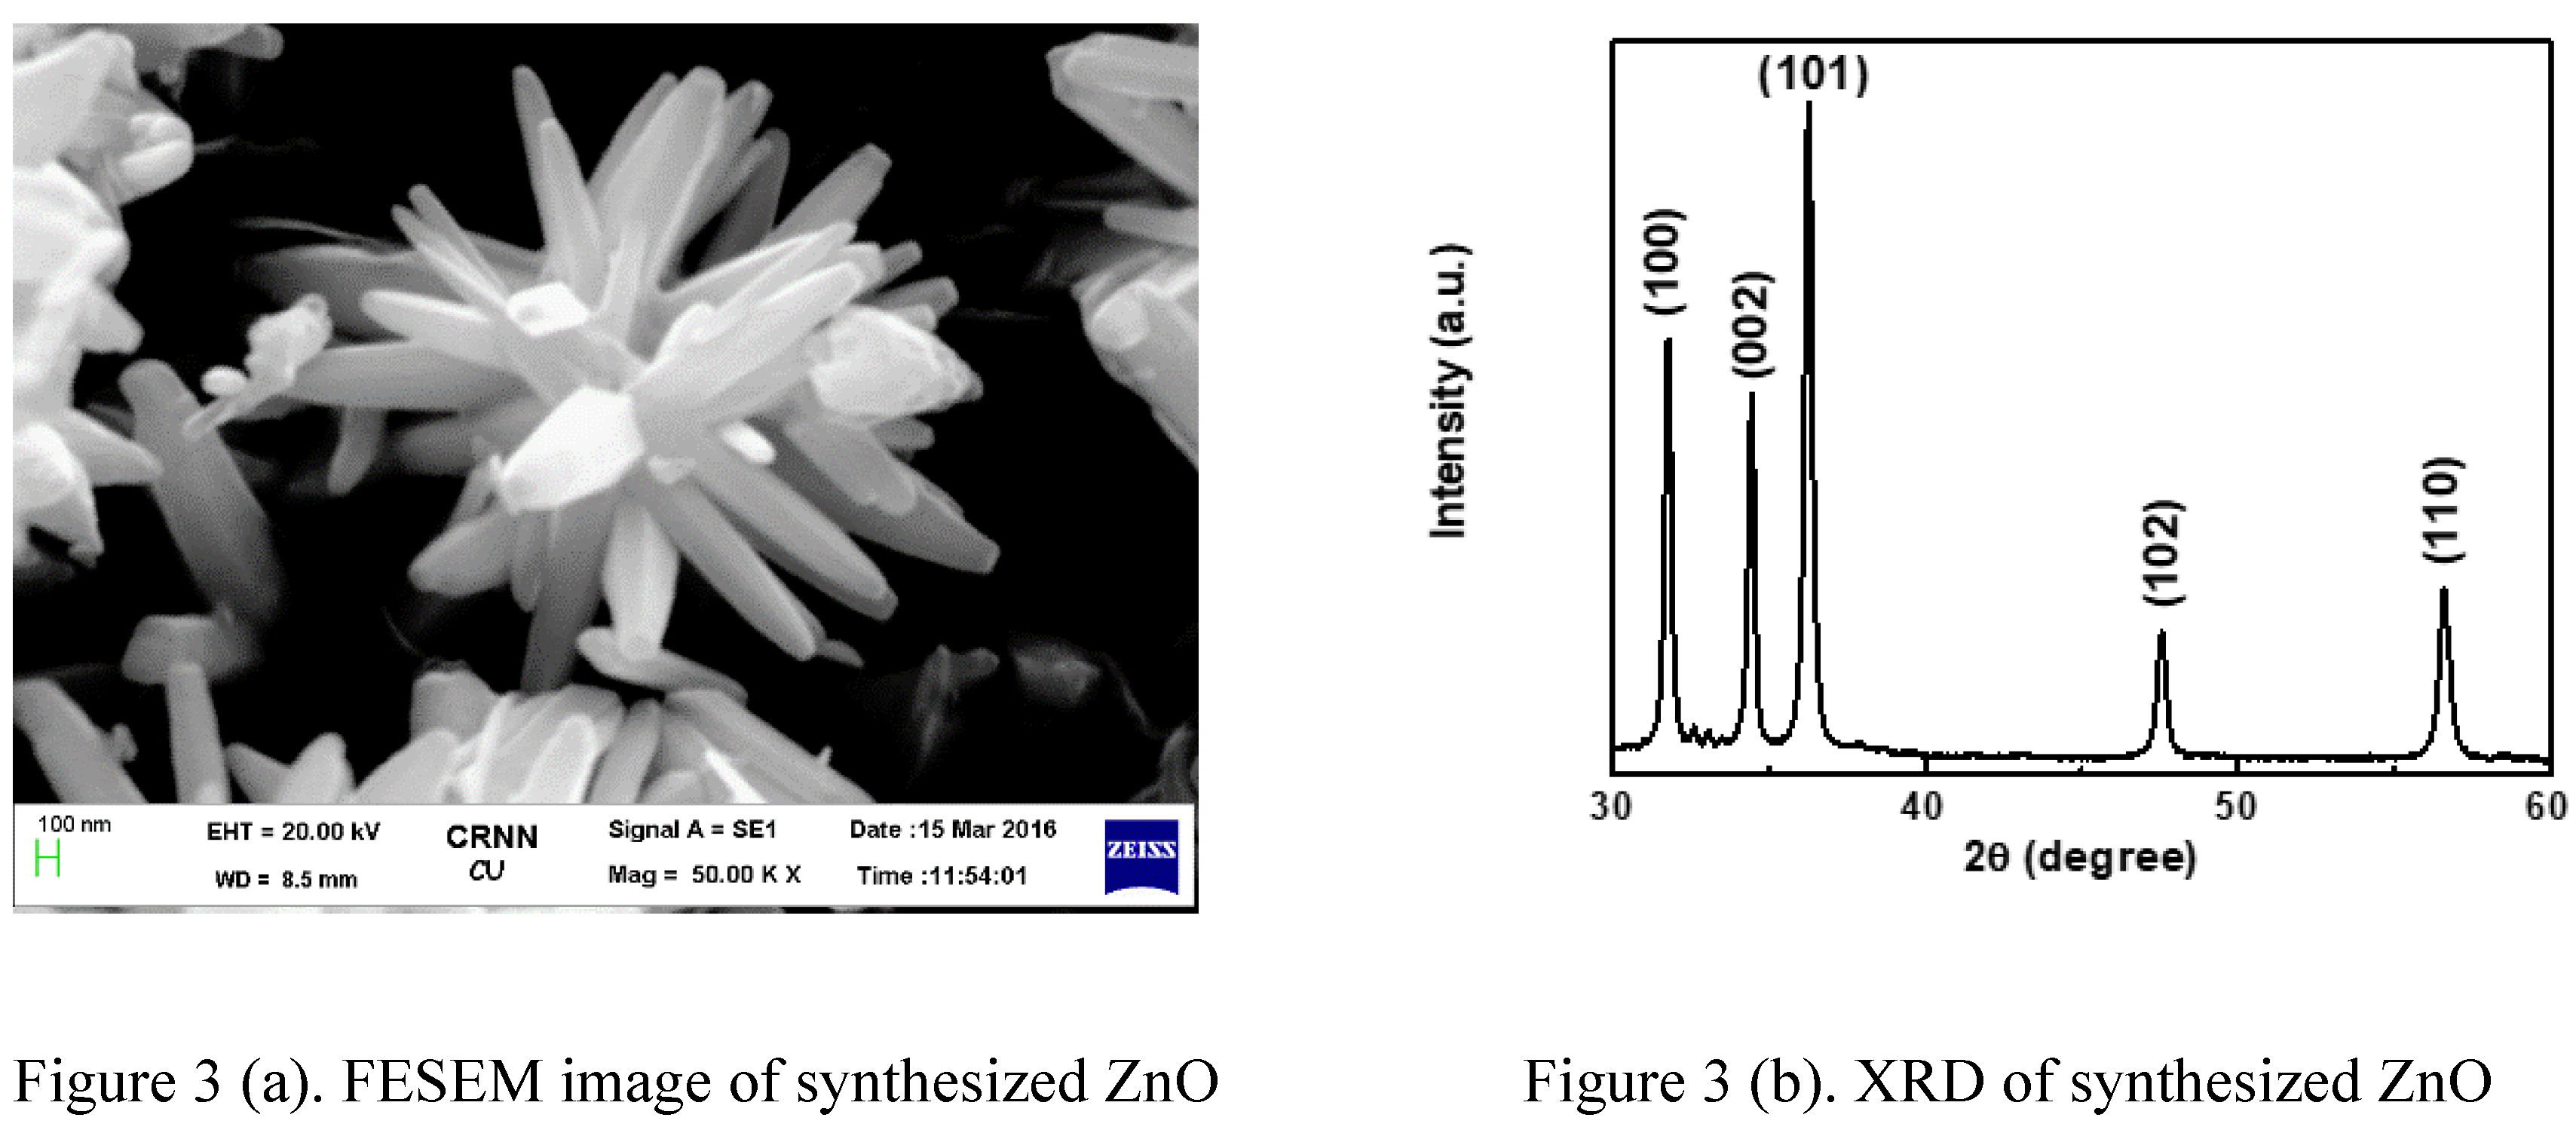
3.1. Structure of synthesized ZnO
FESEM images of nanostructured ZnO incubated for 2 hours on a hot plate are shown in Figure 3(a). The Nanorod type of nanostructure is shown here. ZnO nanorods have an average length of 3 µm and a width of 300 nm, and they are slanted in different directions. XRD was used to evaluate the crystalline structure of the ZnO particles, and the design is shown in Figure 3(b). The observed structure exhibits a characteristic of hexagonal wurtzite structure of ZnO configuration (JCPDS card no. 75-1526).
The average crystallite measurement (D) is 45 nm, the average lattice strain (ε) is 0.1829, and the lattice constants that have been computed are a = 0.3667nm and c = 0.5288nm when the three main peaks are at (101), (100), and (002). The crystalline measurement is comparable to the average thickness of the nanorod.
 |
3.2. Photosensitizing characteristics of the extracted dye from Spathiphyllum
In UV-Vis Spectroscopy, the chlorophyll dye from Spathiphyllum has broad absorption bands at lower wavelengths (λ=300-365nm, 390-410nm, and 412-480nm) and higher wavelengths (λ=660-680nm) and also have peaks at uv range of 250nm and 331nm, at visible light range of 406nm, 450nm and at higher wavelength a small peak is visible at 667nm. Zinc oxide (ZnO) demonstrates complete light reflection beyond a 400nm wavelength. The presence of dye in a ZnO film reduces diffuse reflectance spectroscopy (DRS) to 48% as the dye absorbs light. Figure 4 compares the UV-vis spectral data of dye with DRS. The absorption peaks of dye in the diffuse reflectance spectra (DRS) of zinc oxide film have shifted from 250nm to 280nm, 331 nm to 355 nm, 455 nm to 466 nm, and 667 nm to 703 nm, as illustrated in Figure 4. Altering these peaks decreases the band gap energy of the dye, allowing electrons to move in dimmer light. Hence able to generate power at low light conditions. The Tauc's plot is shown in Figure 5.
The photon energy required to deplete an electron from the dye molecule is 3.28eV, as shown in Tauc’s plot. Equation (7) was used to determine the dye's optical bandgap, which is 3.01 eV.
Oxidation and reduction peaks are identified using the Cyclic Voltammeter. The HOMO and LUMO positions of the dye within the energy band can be determined. The analyses will determine if the dye will maintain stability and function effectively in solar cells. Figure 6 displays the redox reaction for the dye. The reaction is irreversible, as indicated by the relationship ia>>ic. Dye molecules undergo oxidation at their anodic potential and revert to their original form after the reduction process. Upon oxidation, the molecule bound to the working electrode's surface undergoes a complete transformation, resulting in an irreversible response. Ferrocene is a recognized reference with a value of -4.4 eV at absolute vacuum. The HOMO and LUMO energy levels of the dyes are determined in equations (9) and (10) [35].
The literature [36] states that the conduction band edge of ZnO is (-4.26 eV), and the band gap energy determines the valence band edge to be (-7.38 eV). A band gap energy of about 3.12 eV, an electron affinity of about 4.26 eV, and a work function of about 5.3 eV characterize the synthesized ZnO nanorod. The HOMO and LUMO position of the synthesized dye are (-5.12 eV) and (-3.42 eV) respectively. So, the bandgap energy from the CV analysis of the dye is 1.7 eV. The dye also shows that less driving force energy of 0.84 eV is required for transfer of electrons from dye to SMO. Figure 7 depicts the energy band positions of all the layers of the fabricated DSSC using Spathiphyllum dye and the movement of electrons from one layer to other. It is shown that from the favorable positions of the energy band, electrons can easily transport, and hence all the layers are in stable positions, and fabricated DSSC is also stable.
3.3. Electrochemical Impedance Spectra (EIS) analysis of the cell
It characterizes material and interface electrochemical properties i.e., physical and chemically dependent electrode processes and complex interfaces. Nyquist plots of faradic impedance spectra (Zreal vs Zimg) show the dye's electron transfer resistivity. Developed cells undergo EIS analysis to illustrate this behavior. Figures 8 (a) and (b) show the cell and equivalent circuit Nyquist plots that best fit EIS spectra. Due to the RC parallel circuit, the cell Nyquist plot has two semicircles and a sloped straight line. Redox reactions at the cathode-electrolyte interface (parallel circuit of R2 and C2), photoanode-dye-electrolyte interface (parallel circuit of R3 and C3), and I-/I Warburg dispersion method (R4) initiate semicircles and straight lines at high, medium, and low frequencies. The initial spectral shift from baseline indicates FTO substrate sheet resistance (R1). R2 and R3 are charge transfer resistance, while C2 and C3 are interface redox reaction chemical capacitance. Table 1 has cell parameters. In Figure 8(a) and Table 1, the charge transfer resistance (R3) is slightly higher, indicating faster electron transport in ZnO-dye interfaces and longer electron lifetime. Using charge transfer resistance (R3) and chemical capacitance (C3), Equation (11) estimates electron lifetime ().
It shows that the prepared dye-sensitized solar cell has a longer electron lifetime of 1.058 ms. The Nyquist plot semicircle diameter determines the cell's bulk resistance. Compare the DSSC Nyquist plot [37]. The Bode plot has magnitude and phase plots [Figures 8(c) and 8(d)]. Zabs and frequency plot in Figure 8(c) shows bulk resistance variation with frequency. The frequency ranges from 10Hz to 10 KHz. Under 0.5V potential bias and 10Hz frequency, Spathiphyllum dye cell exhibit bulk resistance of 130 Ω. Figure 8(d) shows a phase-frequency plot of the electron transference frequency at the ZnO-dye-electrolyte interface. In this particular dye cell, the peak is shifted to a lower frequency, which means that the charge recombination rate is lower. As a result, the photo conversion efficiency and electron lifetime are both increased.
3.4. Photoconversion Efficiency
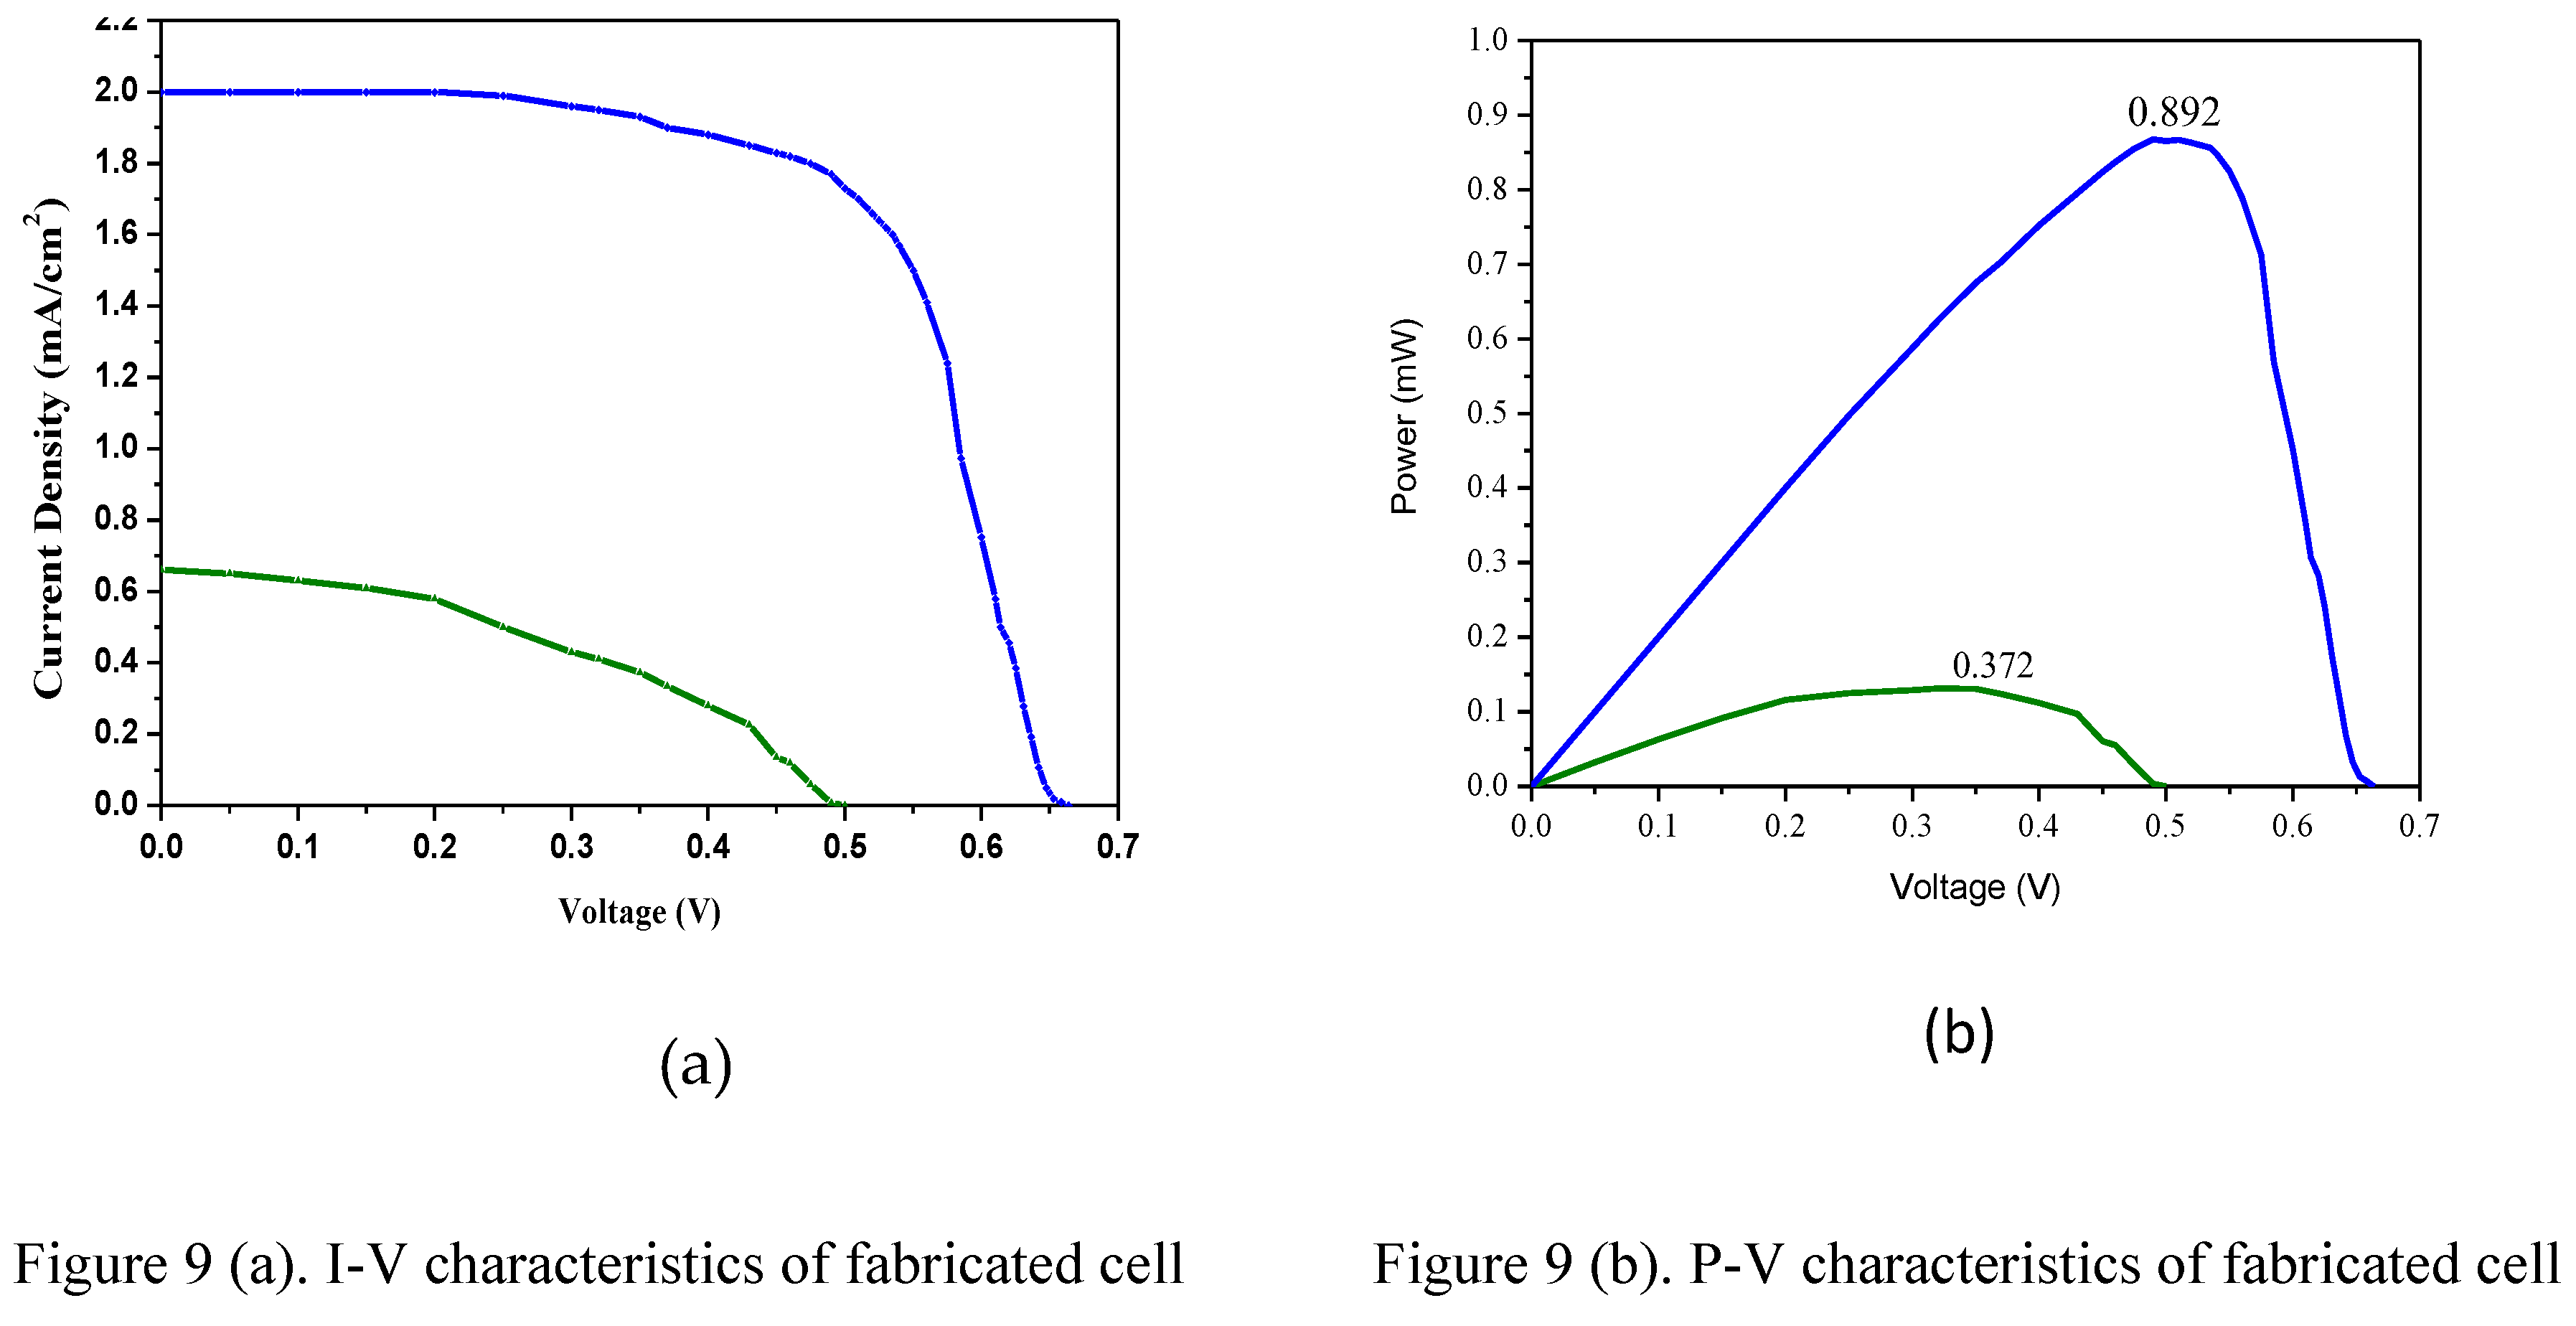
The effectiveness of the manufactured cell is evaluated by calculating the fill factor and efficiency (η) using the I-V and P-V parameters. Cell efficiency is achieved by generating maximum power from the cell using input light sources of 75mW/cm2 and 20mW/cm2 (diffused light) from a solar simulator.
Figure. 9 represents the I-V and P-V curves of dye-sensitized cells with different light energies. It displays the performance comparison at two different input light energy levels: 75mW/cm2 and 20mW/cm2, respectively. the performance parameters for the fabricated DSSC are open circuit voltage, short circuit current density, voltage at maximum power, current at maximum power and fill factor for these two cases. The cell exhibits parameters of 0.66V, 2.01 mA/cm2, 0.516V, 1.73 mA/cm2, and 0.68 respectively under bright light source conditions, and 0.5V, 0.66 mA/cm2, 0.365V, 0.33 mA/cm2 and 0.39 under low light source conditions. An electric conversion efficiency of 1.2% is achieved with a bright light source of 75mW/cm2, while a 0.6% efficiency is observed with a low light source of 20mW/cm2 is used.
 |
Natural dyes are inexpensive and readily accessible in nature, but their primary drawback is their low efficiency. If it is possible to extract an effective natural dye from nature and utilize it to generate power under low light conditions, with relatively higher efficiencies, at a low cost and with a relatively simple fabrication process, it would be a significant accomplishment.
4. Conclusions
A DSSC is fabricated by utilizing a ZnO nanostructure photo-anode combined with a natural dye extracted from Spathiphyllum wallisii. The ZnO nanostructure is produced through a cost-effective chemical bath deposition method. The FESEM image displays a wurtzite hexagonal structure of ZnO nanorods oriented in various directions. The UV-Vis spectroscopy analysis indicates that the dye absorbs light in a wide spectrum, including UV rays (λ = 300-365nm, 390-410nm) and the visible range (λ = 412-480nm). The cyclic voltammetry results validate the dye's stability and lend credence to the favorable HOMO and LUMO locations with lower bandgap energy of 1.7 eV. As the driving force energy requirement is lower (0.84eV) for the dye, the electrons can be easily transported from the dye to the SMO. The EIS analysis shows that the fabricated DSSC is stable, with an extended electron lifetime of 1.058ms, a characteristic seldom observed in natural dye-sensitized solar cells. The cell's performance is confirmed through I-V and P-V characteristics. It demonstrates a photo conversion efficiency of 1.2% under normal bright Sun input light conditions and 0.6% efficiency under low light conditions. The cell is capable of producing energy from both natural indoor light and ultraviolet (UV) rays on overcast days. Consequently, this natural dye will be used more frequently in the production of DSSC.
Future Scope: Utilizing low-cost technology and a simple carbon-coated counter electrode, the DSSC is constructed from the recently discovered natural dye Spathiphyllum waillisii. A photo anode made of composite materials and a counter electrode made of graphene can increase efficiency.
Acknowledgments
Authors are thankful to NIT Durgapur for Cyclic Voltammetry measurement and FESEM scanning and XRD. The authors are also thankful to CAMP, CMERI-CSIR lab for I-V and P-V measurements and Dr. B. C. Roy Engineering College, Durgapur for UV-Vis spectroscopy.
Conflicts of Interest
Authors declare that there is no conflict of interest among the authors.
References
- Michael Graetzel, Mohammad K. Nazeeruddin, Brian O'Regan, Photovoltaic cells US 5350644 A, Sep 27, 1994,.
- M. R. Hoffmann, S. T. Martin, W. Choi, and D. W. Bahnemann, Environmental applications of semiconductor photocatalysis, Chemical Reviews, 95 (1995), 69–96. [CrossRef]
- T. Ganesh, H.M. Nguyen, R.S. Mane, N. Kim, D.V. Shinde, S.S. Bhande, M. Naushad, K.N. Hui, S.H. Han, Promising ZnO based DSSC performance using HMP molecular dyes of high extinction coefficient, Dalton Trans. 43(2014), 11305–11308. [CrossRef]
- C. Longo and M.-A. Paoli, Journal of the Brazilian Chemical Society, Dye-sensitized solar cells: a successful combination of materials, 14 (2003), no. 6, pp. 889–901. [CrossRef]
- Afifiand, M. K.Tabatabaei, Efficiency Investigation of Dye-Sensitized Solar Cells Based on the Zinc Oxide Nanowires, Orient journal of chemistry, 30(2014), 155-160. [CrossRef]
- C.Y. Jiang, X.W. Sun, G.Q. Lo, D.L. Kwong, Improved dye-sensitized solar cells with a ZnO-nano flower photo anode, Appl. Phys. Lett. 90, 2007, 263501. [CrossRef]
- G. Calogero, G. Marco, S. Cazzanti, Efficient dyesensitized solar cells using red turnip and purple wild Sicilian prickly pear fruits, International Journal of Molecular Sciences, 11(2010), 254–267. [CrossRef]
- J. Gong, J. Liang, K. Sumathy, Review on dye Sensitized solar cells (DSSCs): Fundamental concepts and novel materials, Renewable and Sustainable Energy Reviews, 16(2012), 5848–5860, http://www.sciencedirect.com/science/article/pii/S136403211200319X.
- N. M. Gomez-Ortiz, I. A. Vazquez-Maldonado, A. R. Perez-Espadas, G. J. Mena- Rejon, J. A. Azamar-Barrios, G. Oskam, Dye-sensitized solar cells with natural dyes extracted from achiote seeds, Sol. Energy Mater. Sol. Cells, 94(2010), 40–44. [CrossRef]
- D Sinha, D De and A Ayaz , Performance and Stability Analysis of Curcumin Dye as a Photo Sensitizer used in Nanostructured ZnO based DSSC. SpectrochimicaActa (2018) 193:467-474. [CrossRef]
- D. Sinha, D. De, D. Goswami, A. Ayaz, Fabrication of DSSC with Nanostructured ZnO Photo Anode and Natural Dye Sensitizer, Materials Today: Proceedings, 2018,Vol 5, no. 1, pp. 2056-2063. [CrossRef]
- M. H. Lai, M.W. Lee, G. J. Wang, M. F. Tai, Photovoltaic Performance of New-Structure ZnO-nano rod Dye Sensitized Solar Cells, Int. J. Electrochem. Sci. (2011), 6:2122–2130, http://www.electrochemsci.org/papers/vol6/6062122.
- M H K Taft, and S M Sadeghzadeh, Dye sensitized solar cell efficiency improvement using TiO2/nano-diamond nano composite, Sådhanå (2018) 43:113 Indian Academy of Sciences. [CrossRef]
- L H Phuoc, Enhancement of ethanol-sensing properties of ZnO nanoplates by UV illumination, Bull. Mater. Sci. (2019) 42:72, Indian Academy of Sciences. [CrossRef]
- V Balaprakash, P Gowrisankar, R Rajkumar and S Sudha, Preparation and characterization of aluminum doped zinc oxide (AZO) nano-rods, Sadhana (2018) 43:86 Indian Academy of Sciences. [CrossRef]
- M Chandrasekharam, S Rao, T A M Suresh, M Raghavender, G Rajkumar, M Srinivasu and P Y Reddy, High spectral response heteroleptic ruthenium (II) complexes as sensitizers for dye sensitized solar cells. J. Chem. Sci., 2011, Vol. 123, No. 1, pp. 37–46. Indian Academy of Sciences.
- H. Hug, M. Bader, P. Mair, T. Glatzel, Biophotovoltaics: Natural pigments in dye-sensitized solar cells, Applied Energy, 115(2014), 216–225. [CrossRef]
- S. Furukawa, H. Iino, T. Iwamoto, K. Kukita, S. Yamauchi, Characteristics of dye-sensitized solar cells using natural dye, Thin Solid Films, 518(2009), 526–529. [CrossRef]
- A.C. Nwanya, P.E. Ugwuoke, P.M. Ejikeme, O.U. Oparaku, F.I. Ezema, Jathropha Curcas and Citrus Aurantium Leaves Dye Extract for Use in Dye Sensitized Solar Cell with TiO2 Films, Int. J. Electrochem. Sci. 7(2012), 11219–11235, http://www.electrochemsci.org/papers/vol7/71111219.pdf.
- H. Chang, M.J. Kao, T. L Chen, C. H. Chen, K. C. Cho and X. R Lai, Characterization of Natural Dye Extracted from Wormwood and Purple Cabbage for Dye-Sensitized Solar Cells, International Journal of Photoenergy, Hindawi, 159502 (2013). [CrossRef]
- D. Sengupta, B. Mondal, K. Mukherjee, Visible light absorption and photo-sensitizing properties of spinach leaves and beetroot extracted natural dyes, Spectrochimica Acta, 148(2015), 85–92. [CrossRef]
- R. Syafinara, N. Gomesha, M. Irwantoa, M. Fareqa, Y. M. Irwan, Potential of Purple Cabbage, Coffee, Blueberry and Turmeric as Nature Based Dyes for Dye Sensitized Solar Cell (DSSC), Energy Procedia 79(2015), 799 – 807. [CrossRef]
- S. Suresh, M. Kandasamy, S. Karthick Kumar, S. Murugesan, 2015, Photovoltaic performance of curcumin as sensitizer in a solid-state solar cell, OptikElsevier, 126 (2015) 3366–3370. [CrossRef]
- Afifiand, M. K.Tabatabaei, Efficiency Investigation of Dye-Sensitized Solar Cells Based on the Zinc Oxide Nanowires, Orient journal of chemistry, 30(2014), 155-160. [CrossRef]
- D. Rehm and A. Weller, Kinetics of Fluorescence Quenching by Electron and H-Atom Transfer. Isr. J. Chem., 1970, 8:259–271. [CrossRef]
- Sima, C. Grigoriu, and S. Antohe, “Comparison of the dye-sensitized solar cells performances based on transparent conductive ITO and FTO,” Thin Solid Films, vol. 519, no. 2, pp. 595–597, 2010.
- K J Chen, T H Fang, F Y Hung, L W Ji, S J Chang, S J Young and Y J Hasio The Crystallization and Physical Properties of Al doped ZnO nanoparticles. Appl. Surf. Sci. 2008, 254; 5791-5795, https://doi.org/. [CrossRef]
- L Alexander and HP Klug, Determination of crystallite size with the X-ray spectrometer, J. Appl. Phys. 1950, 21:137-142. [CrossRef]
- C Suryanarayana and M G Norton X-rayDiffraction: A Particle Approach, 1998, Plenum Press, New York, ISBN 978-1-4899-0148-4.
- Sengupta, B. Mondal, K. Mukherjee 2017 Genesis of flake-like morphology and dye-sensitized solar cell performance of Al doped ZnO particles: a study, J. Nanopart. Res.19:100. [CrossRef]
- Bysu’s study material on Chorophyll structure: https://byjus.com/biology/chlorophyll-structure.
- N. T. R. N. Kumara, P. Ekanayake, A. Lim, Md. Iskandar and L. C. Ming, Study of the Enhancement of Cell Performance of Dye Sensitized Solar Cells Sensitized With Nepheliumlappaceum (F: Sapindaceae), J. of Solar Energy Engineering, ASME, 135 (2013), 031014. [CrossRef]
- M. Mohamed, A.H. Eichborn, S.H. Eichborn, Measurement and prediction of electronic properties of discotic triphenylenes and phtalocianines, ECS Transactions, vol. 25(2010), 1-10. [CrossRef]
- P.I. Djurovich, E.I. Mayo, S.R. Forrest, M.E. Thompson, Measurement of the lowest unoccupied molecular orbital energies of molecular organic semiconductors Organic Electronics, Organic Electronics,10(2009), 515–520. [CrossRef]
- L. Leonat, G. Sbarcea, I. V. Branzoi, Cyclic voltammetry for energy level estimation, U.P.B. Sci. Bull., Series B, 75(2013), https://www.scientificbulletin.upb.ro/rev_docs_arhiva/full982_152789.pdf.
- J L Bredas, R Silbey, D S Boudreux and R R Chance, Chain-length dependence of electronic and electrochemical properties of conjugated systems: polyacetylene, polyphenylene, polythiophene, and polypyrrole, J. Am. Chem. Soc. 1983, 105:6555. [CrossRef]
- C P Hsu, K M Lee, J T W Huang, C Y Lin, C H Lee, L P Wang, S Y Tsai and K C Ho, EIS analysis on low temperature fabrication of TiO2 porous films for dye-sensitized solar cells. Electrochim. Acta, 2008, 53:7514-7522. [CrossRef]
Figure 1.
The dye extracted from Spathiphyllum leaves.
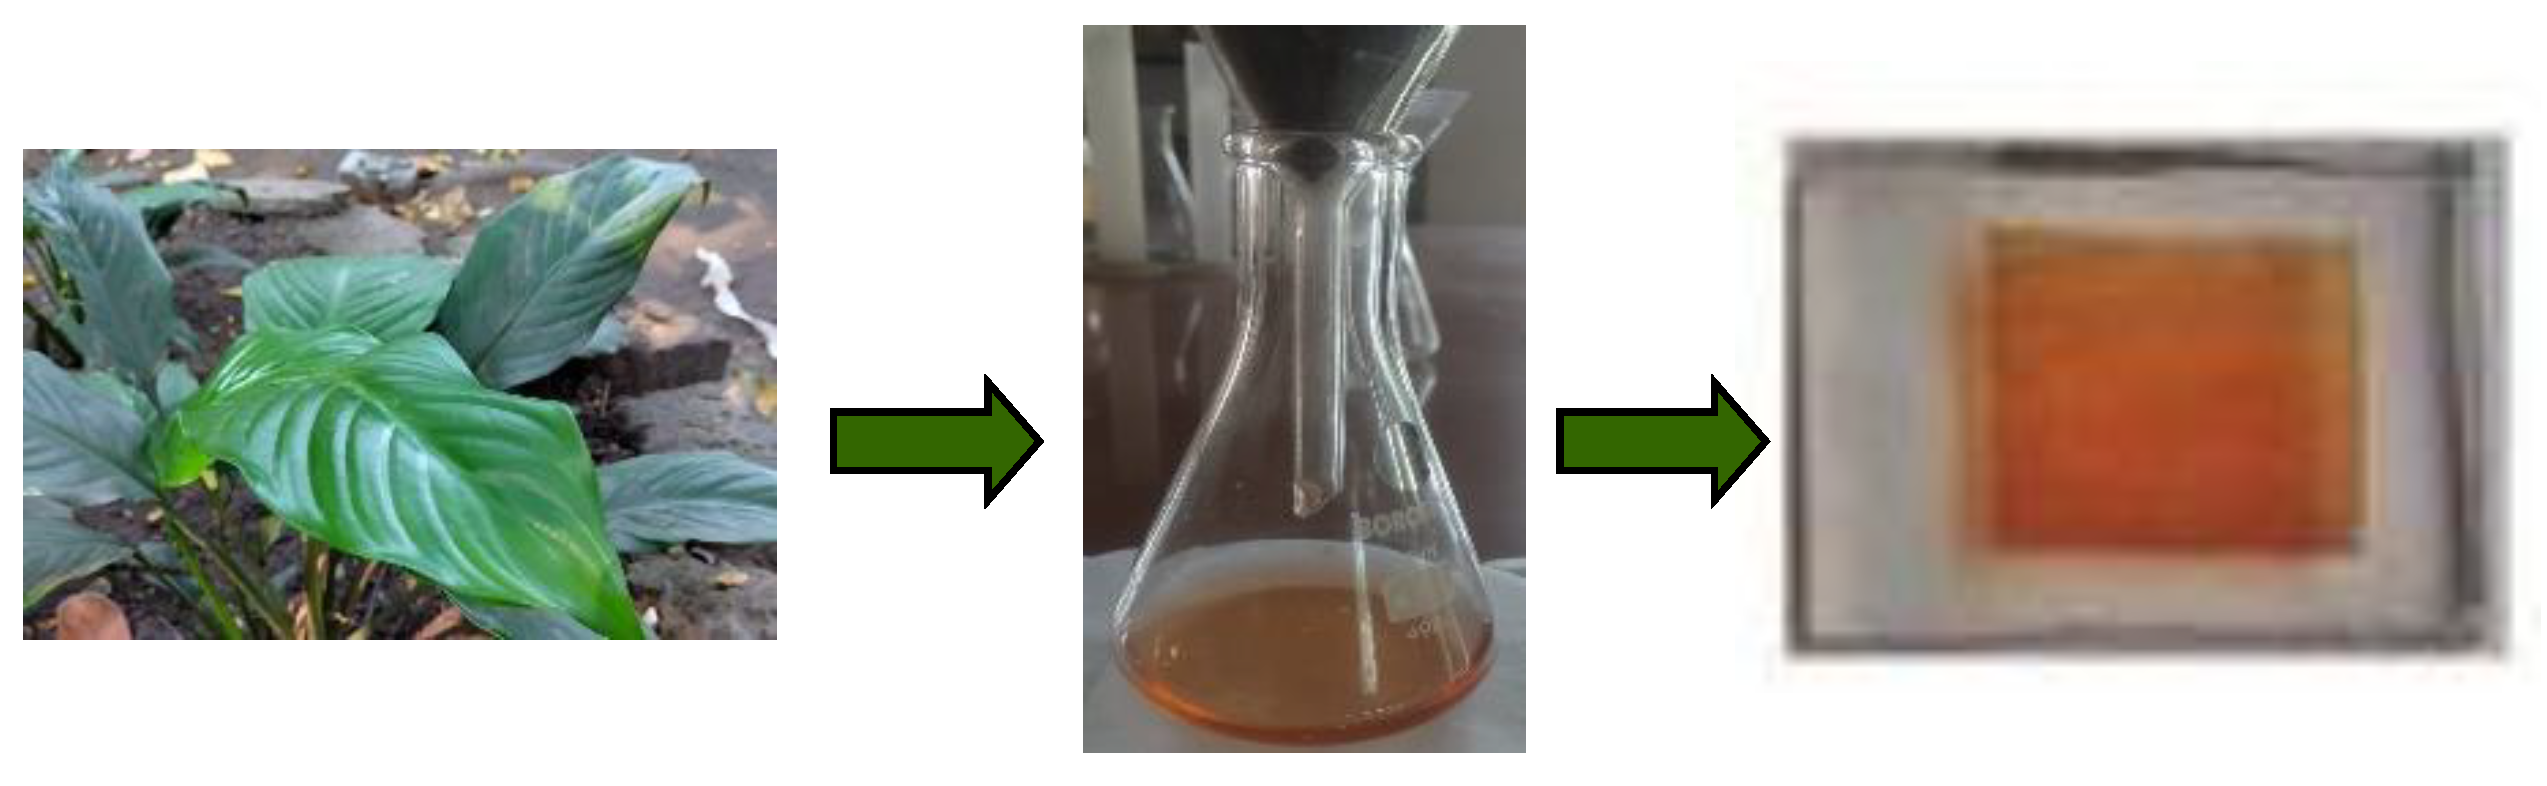
Figure 2.
Structure of (a) Chlorophyll A and (b) Chlorophyll B [31].
Figure 2.
Structure of (a) Chlorophyll A and (b) Chlorophyll B [31].
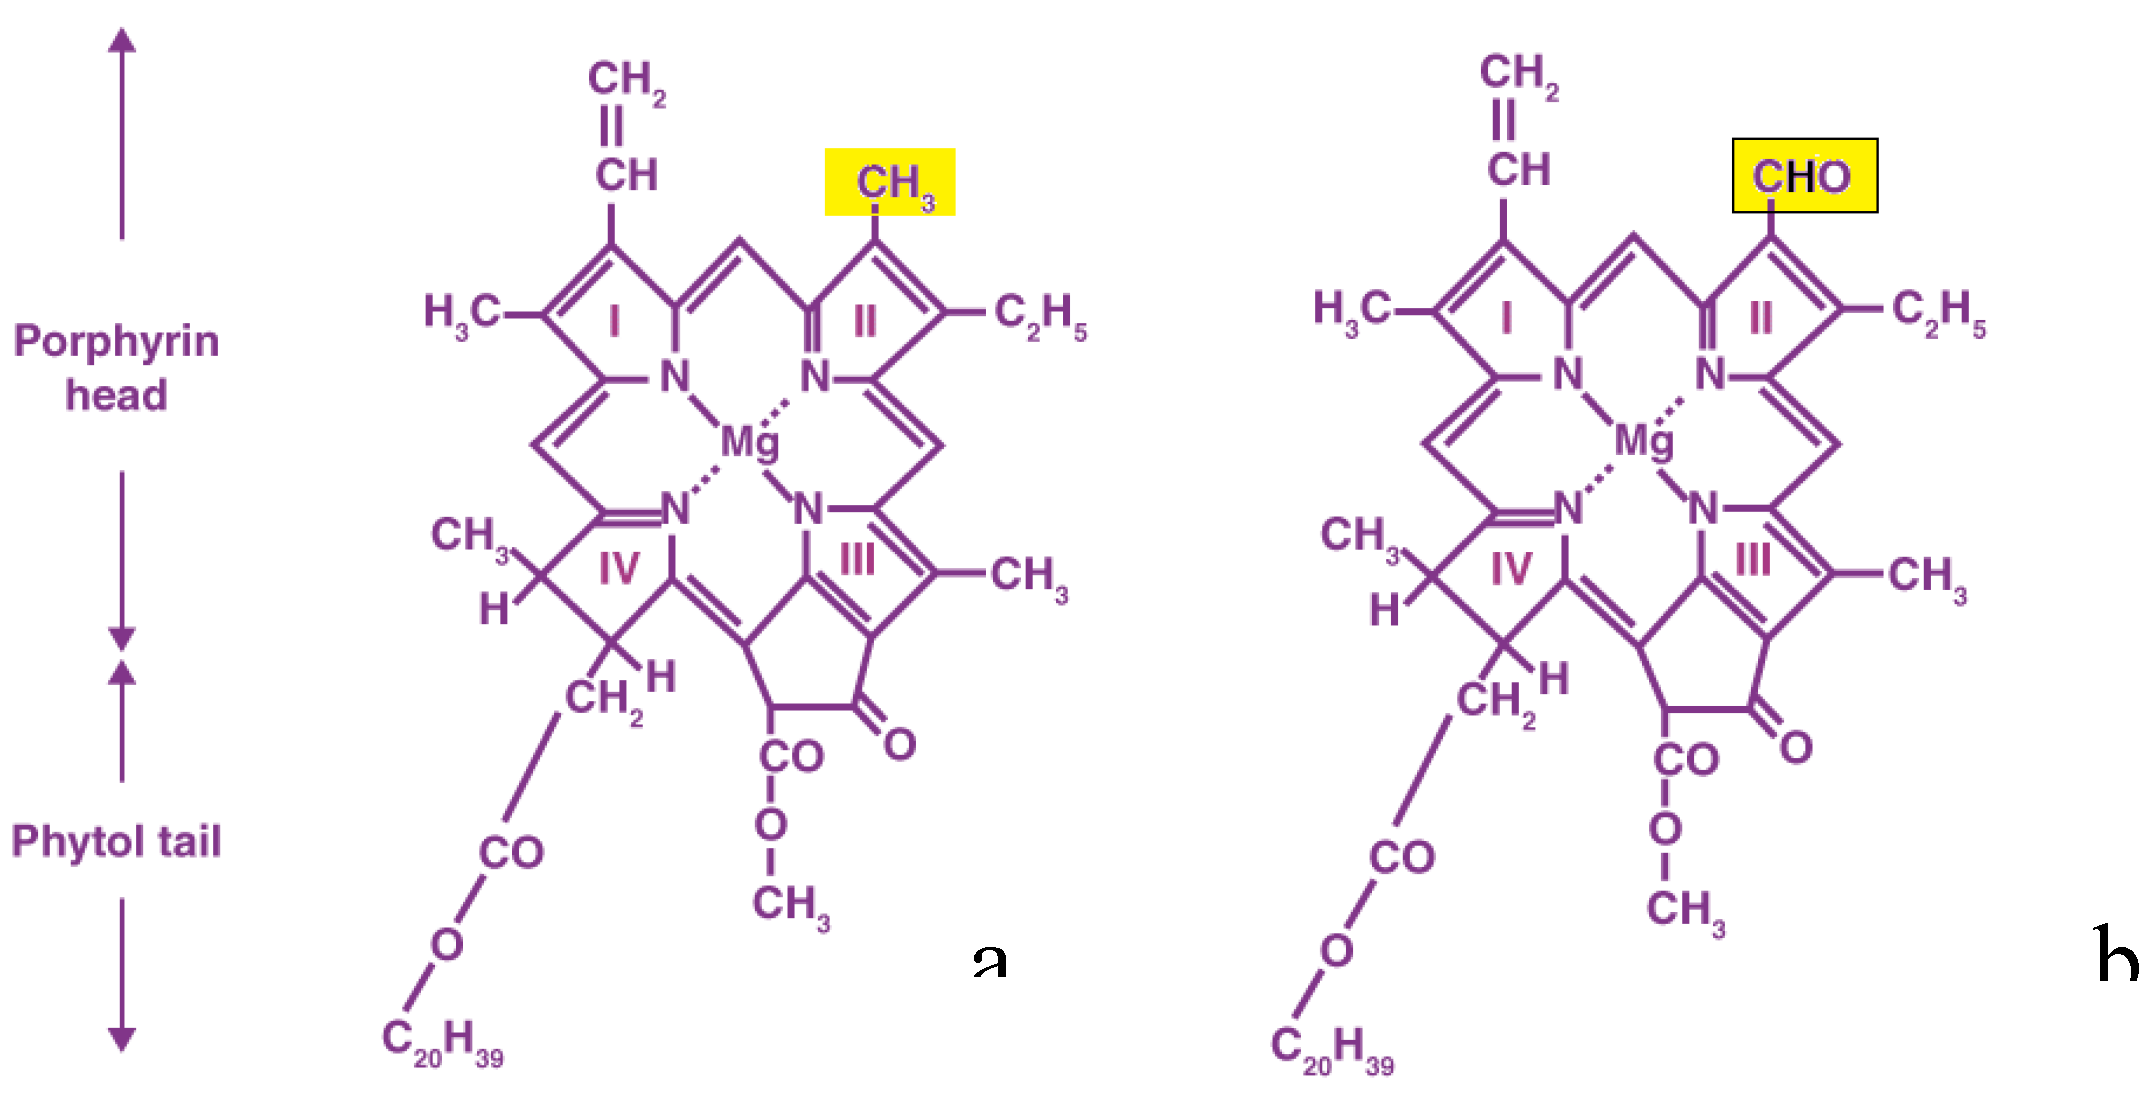
Figure 4.
UV Vis and DRS spectrum of dye.
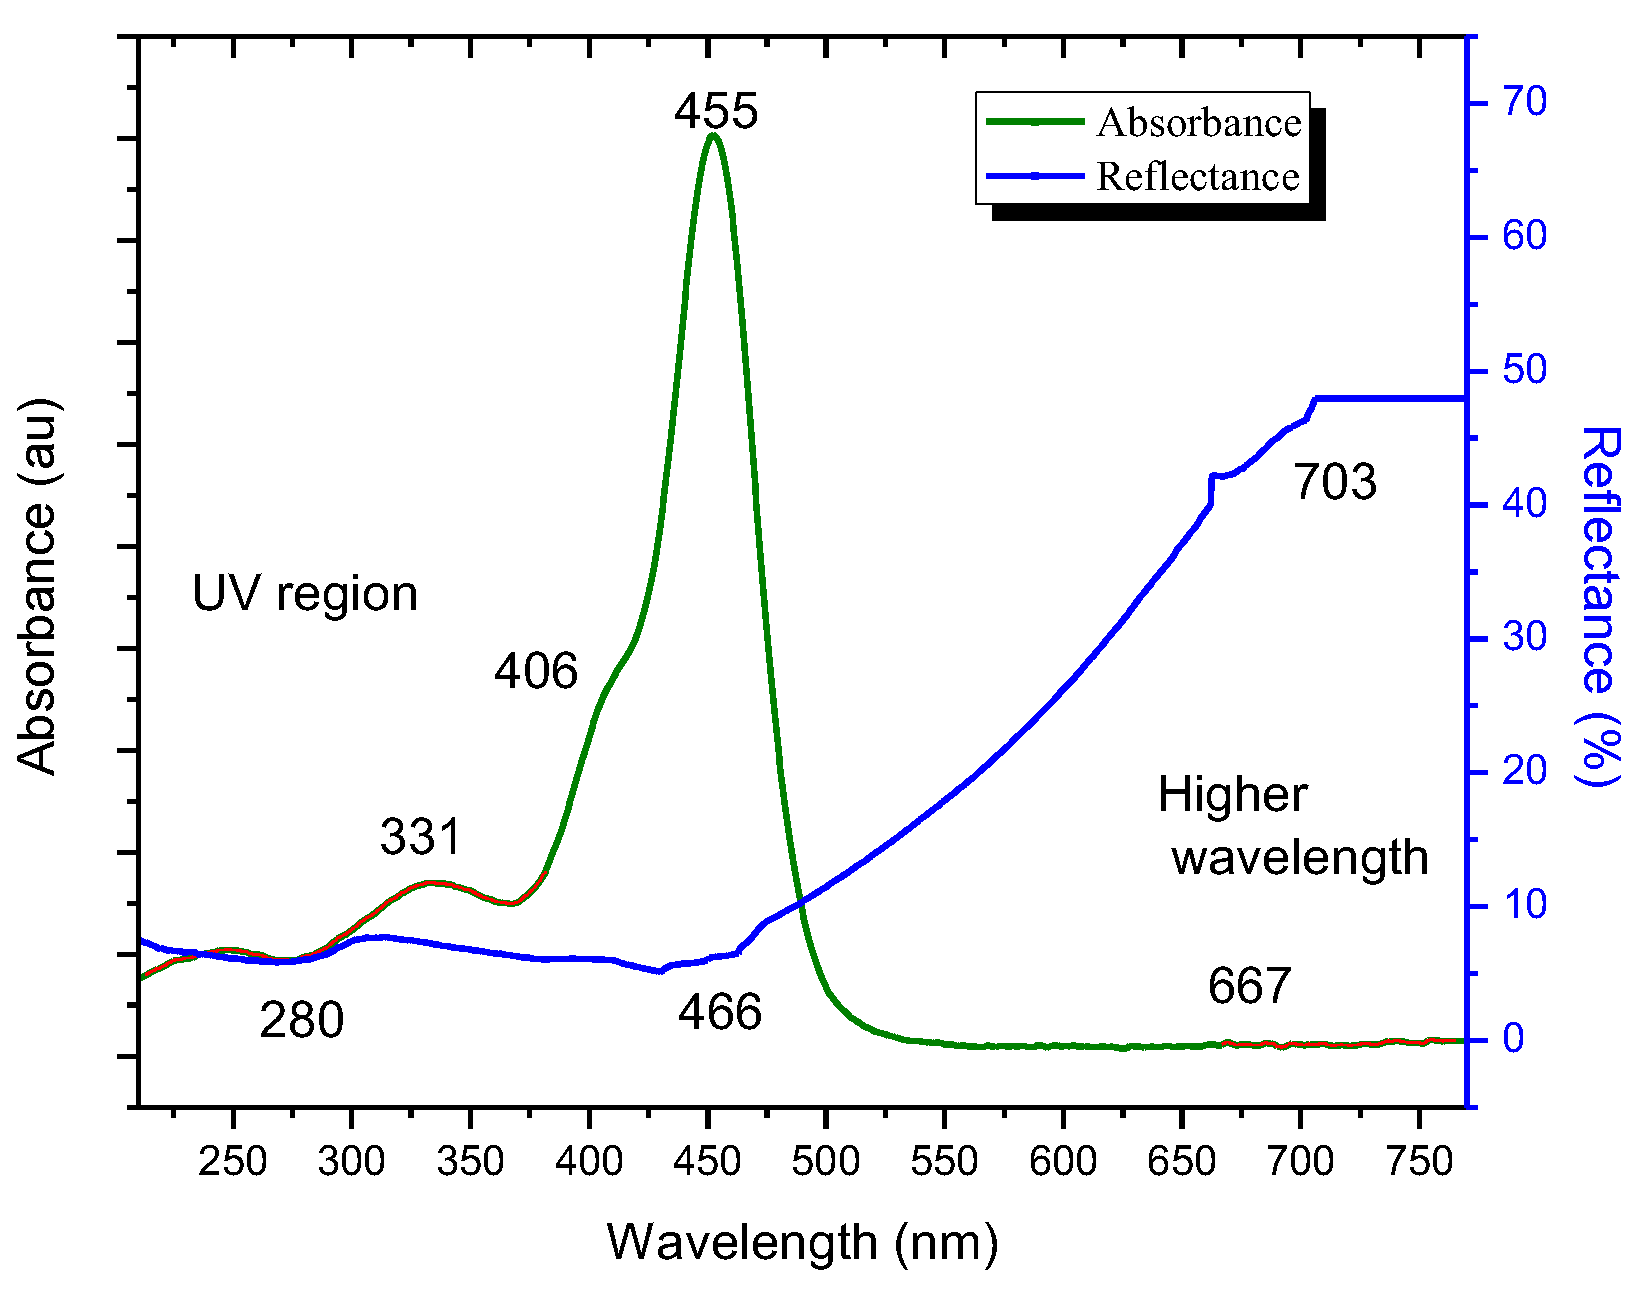
Figure 5.
Tauc’s Plot of the synthesized dye.
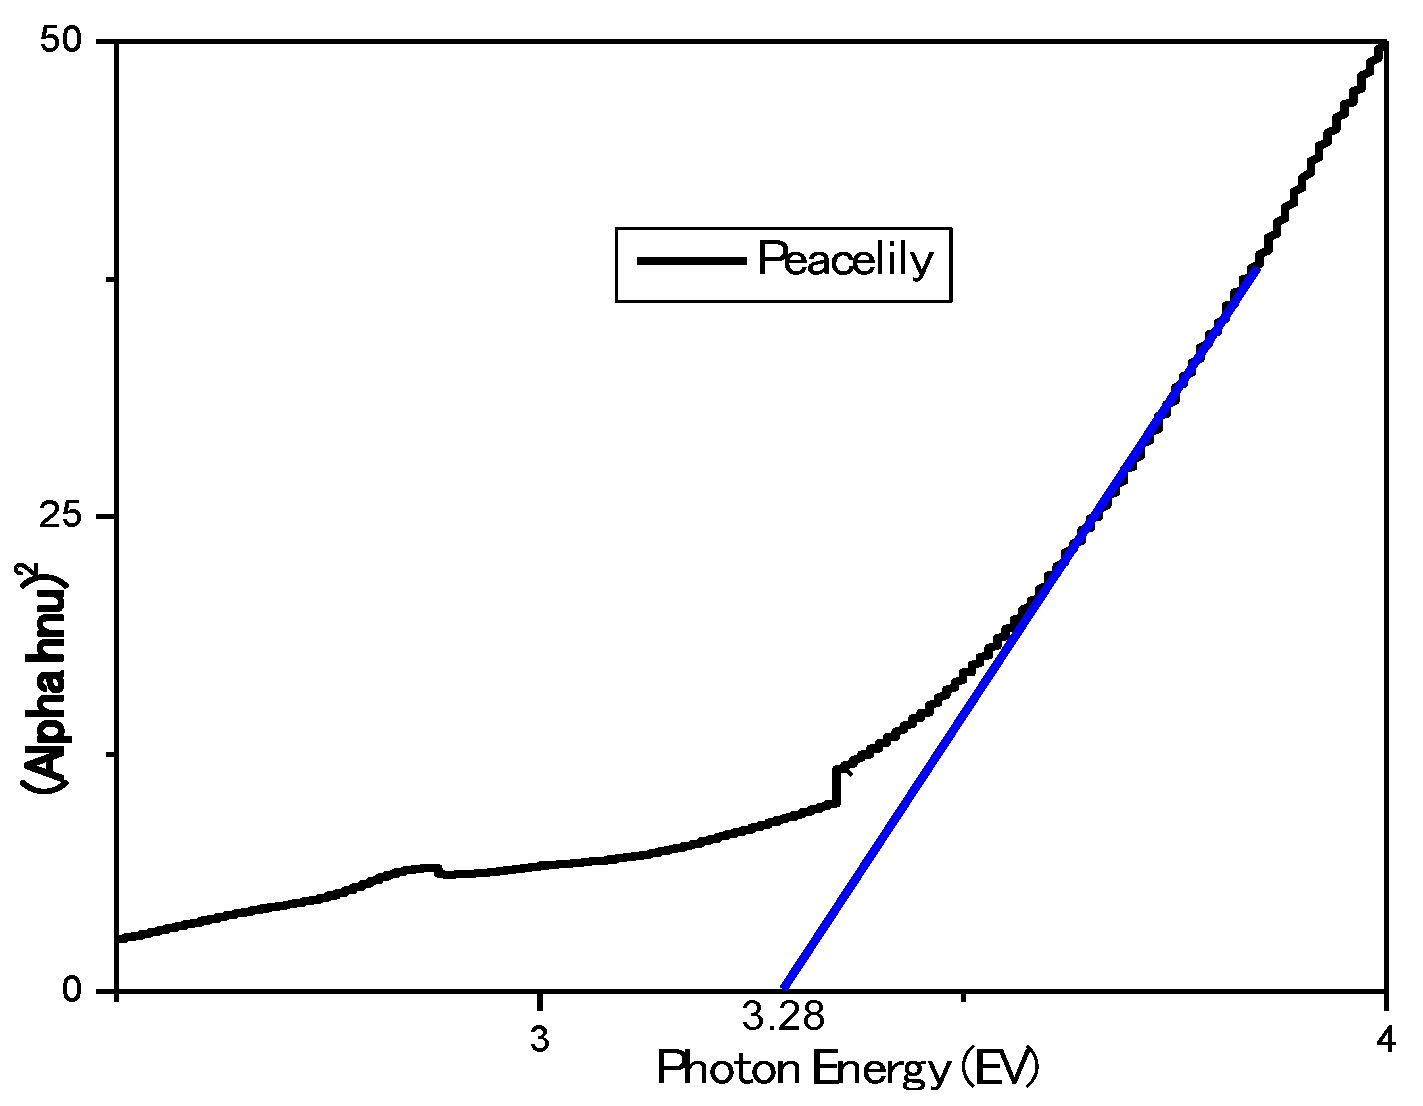
Figure 6.
Cyclic voltammetry of synthesized dye from Spathiphyllum.
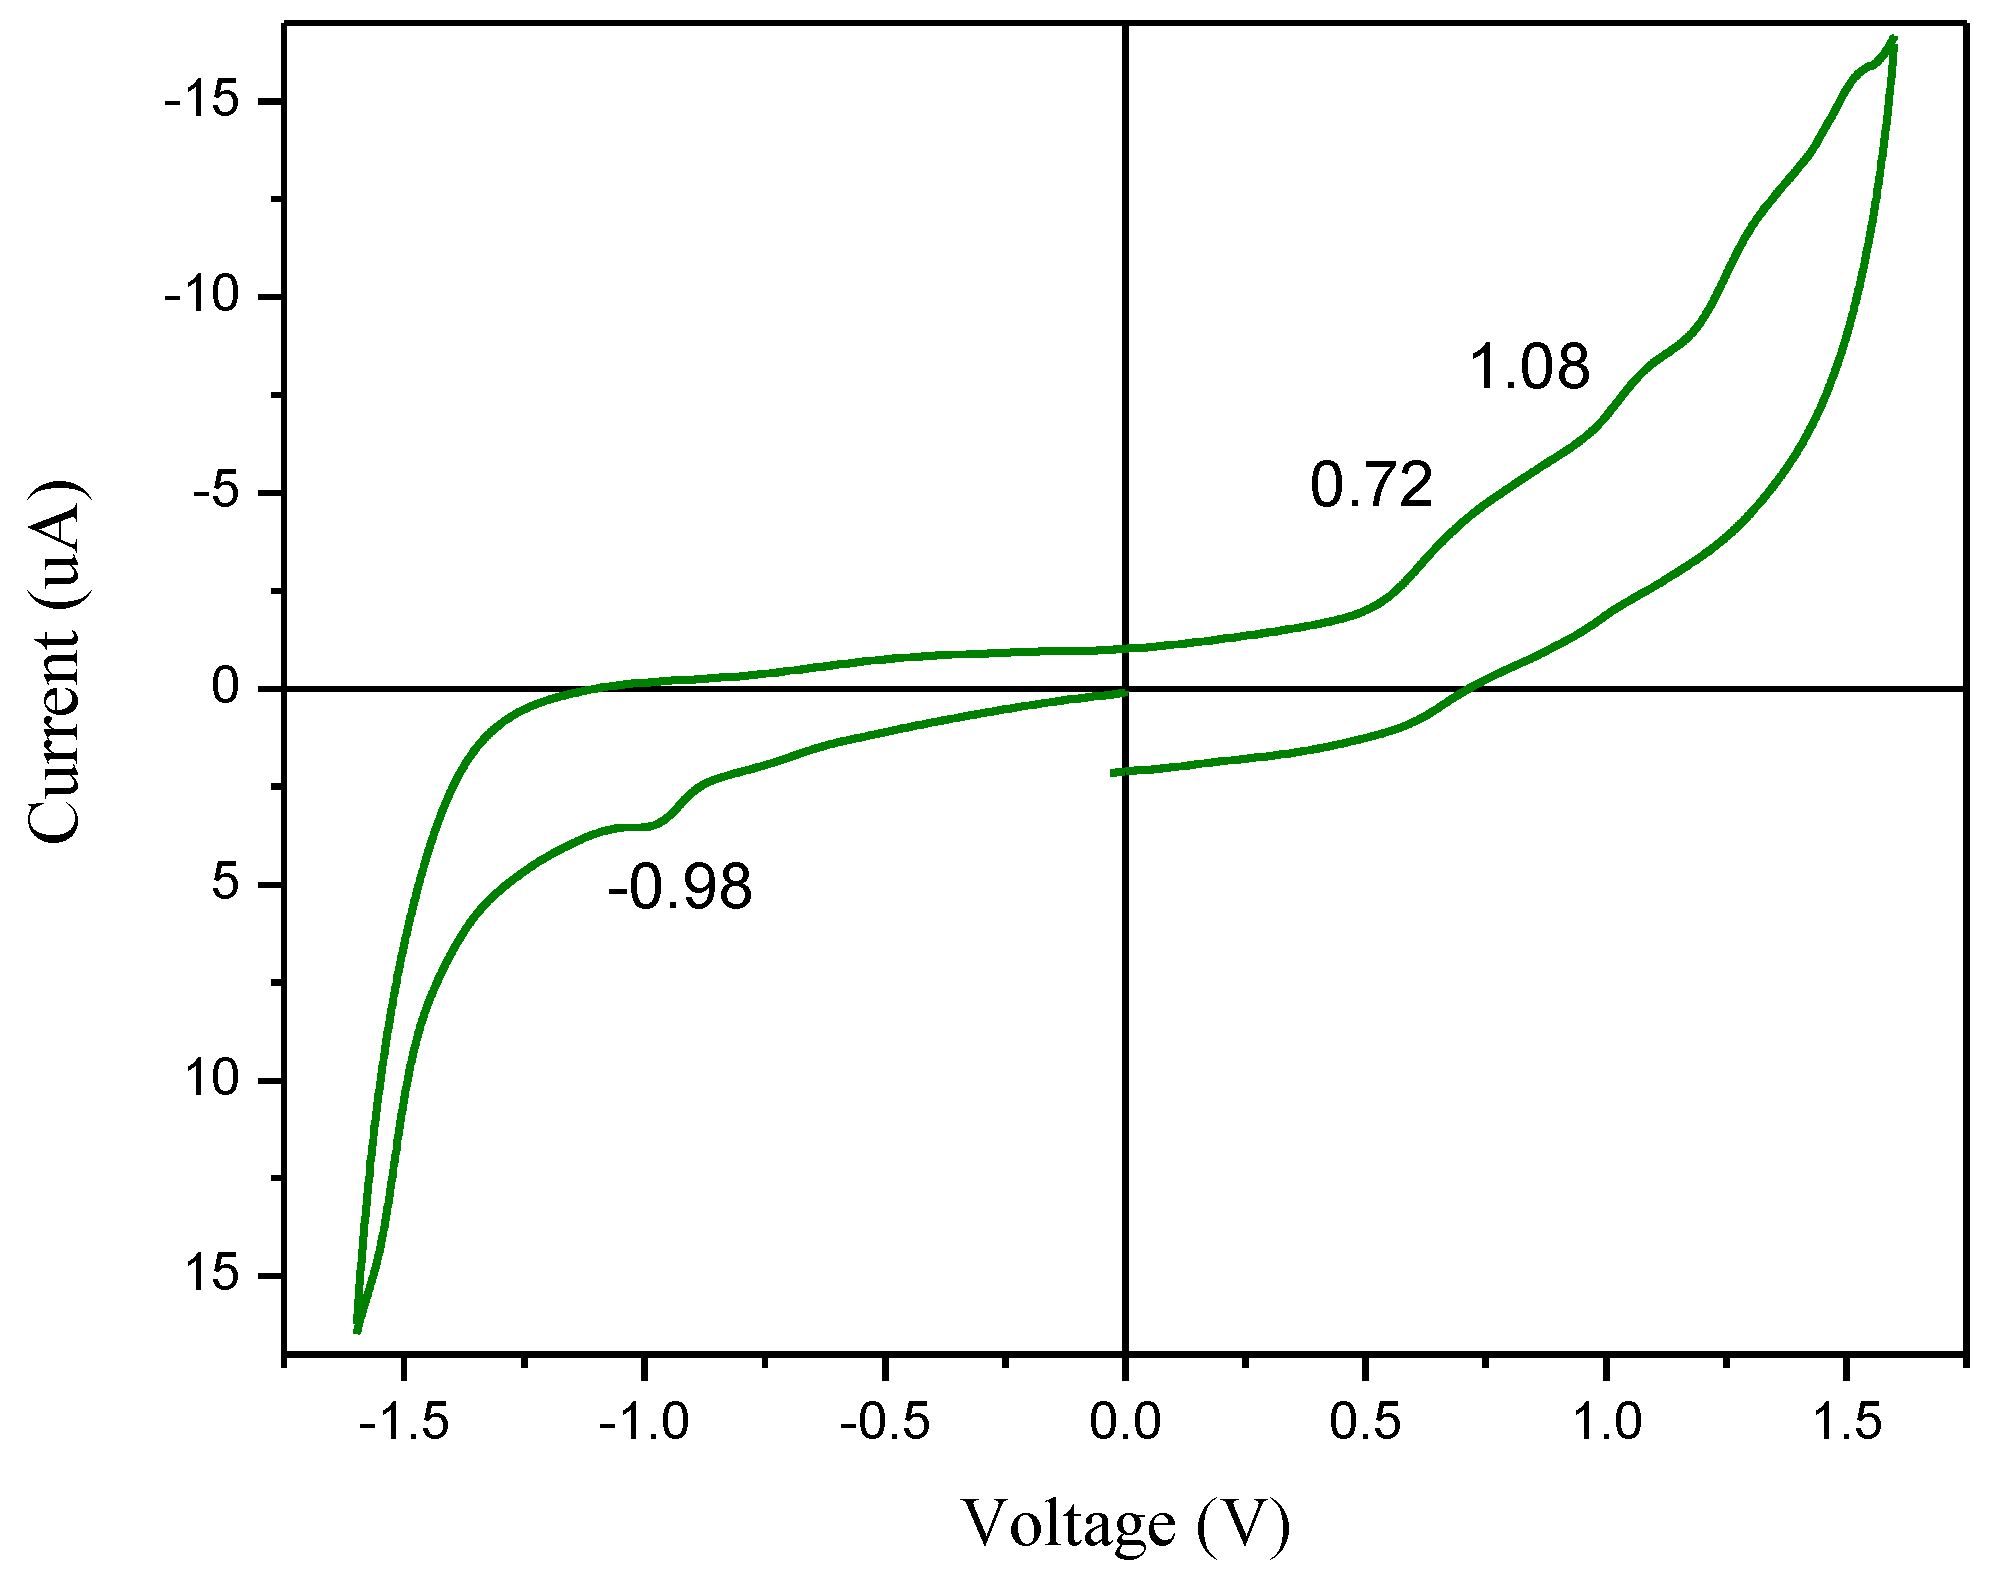
Figure 7.
Energy band diagram of all the layers of the fabricated DSSC using Spathiphyllum dye.
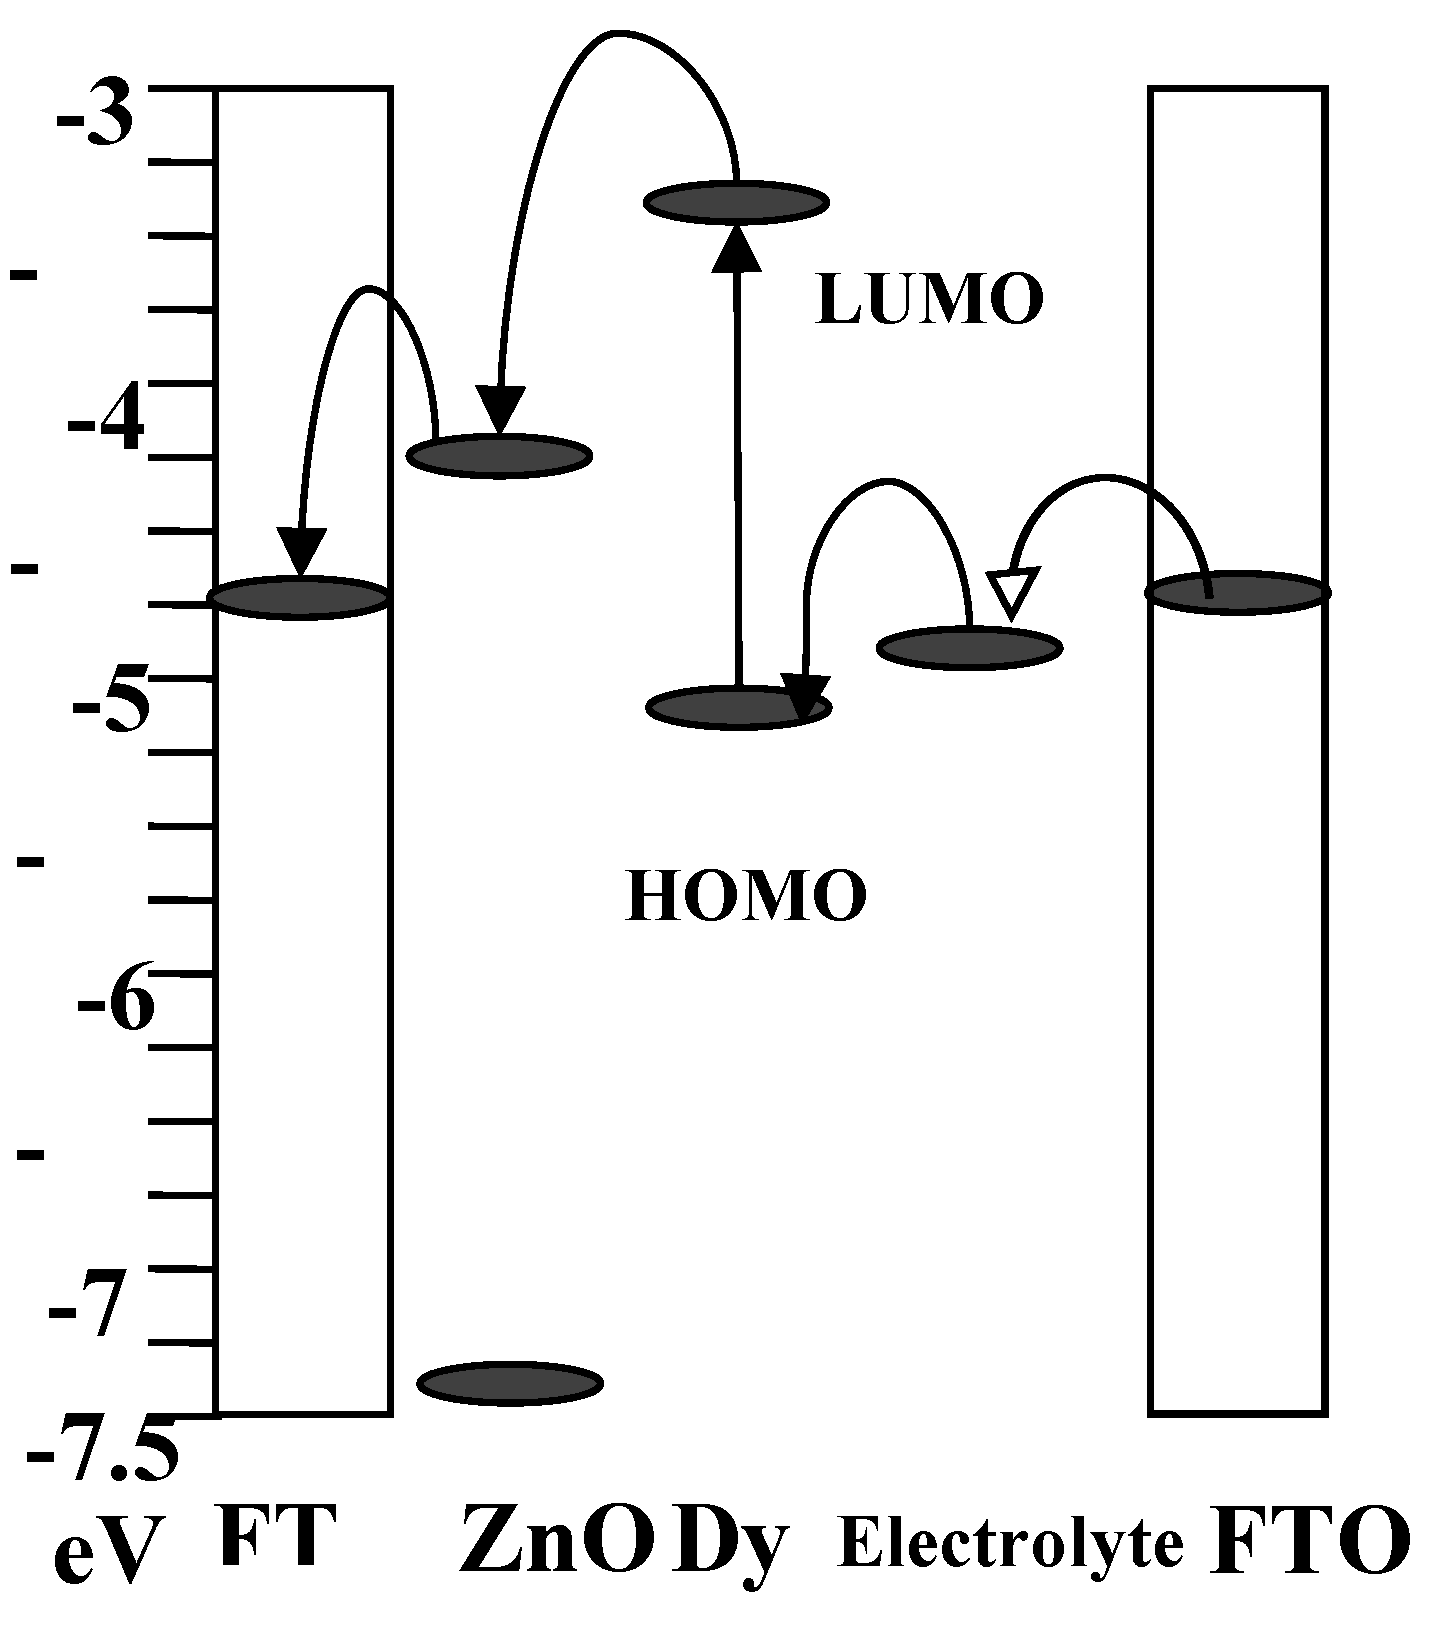
Figure 8.
(a) Nyquist plot of the DSSC (b) Equivalent circuit diagram using the best-fitting Nyquist plot (c) Bode with magnitude plot; (d) Bode with phase plot.
Figure 8.
(a) Nyquist plot of the DSSC (b) Equivalent circuit diagram using the best-fitting Nyquist plot (c) Bode with magnitude plot; (d) Bode with phase plot.
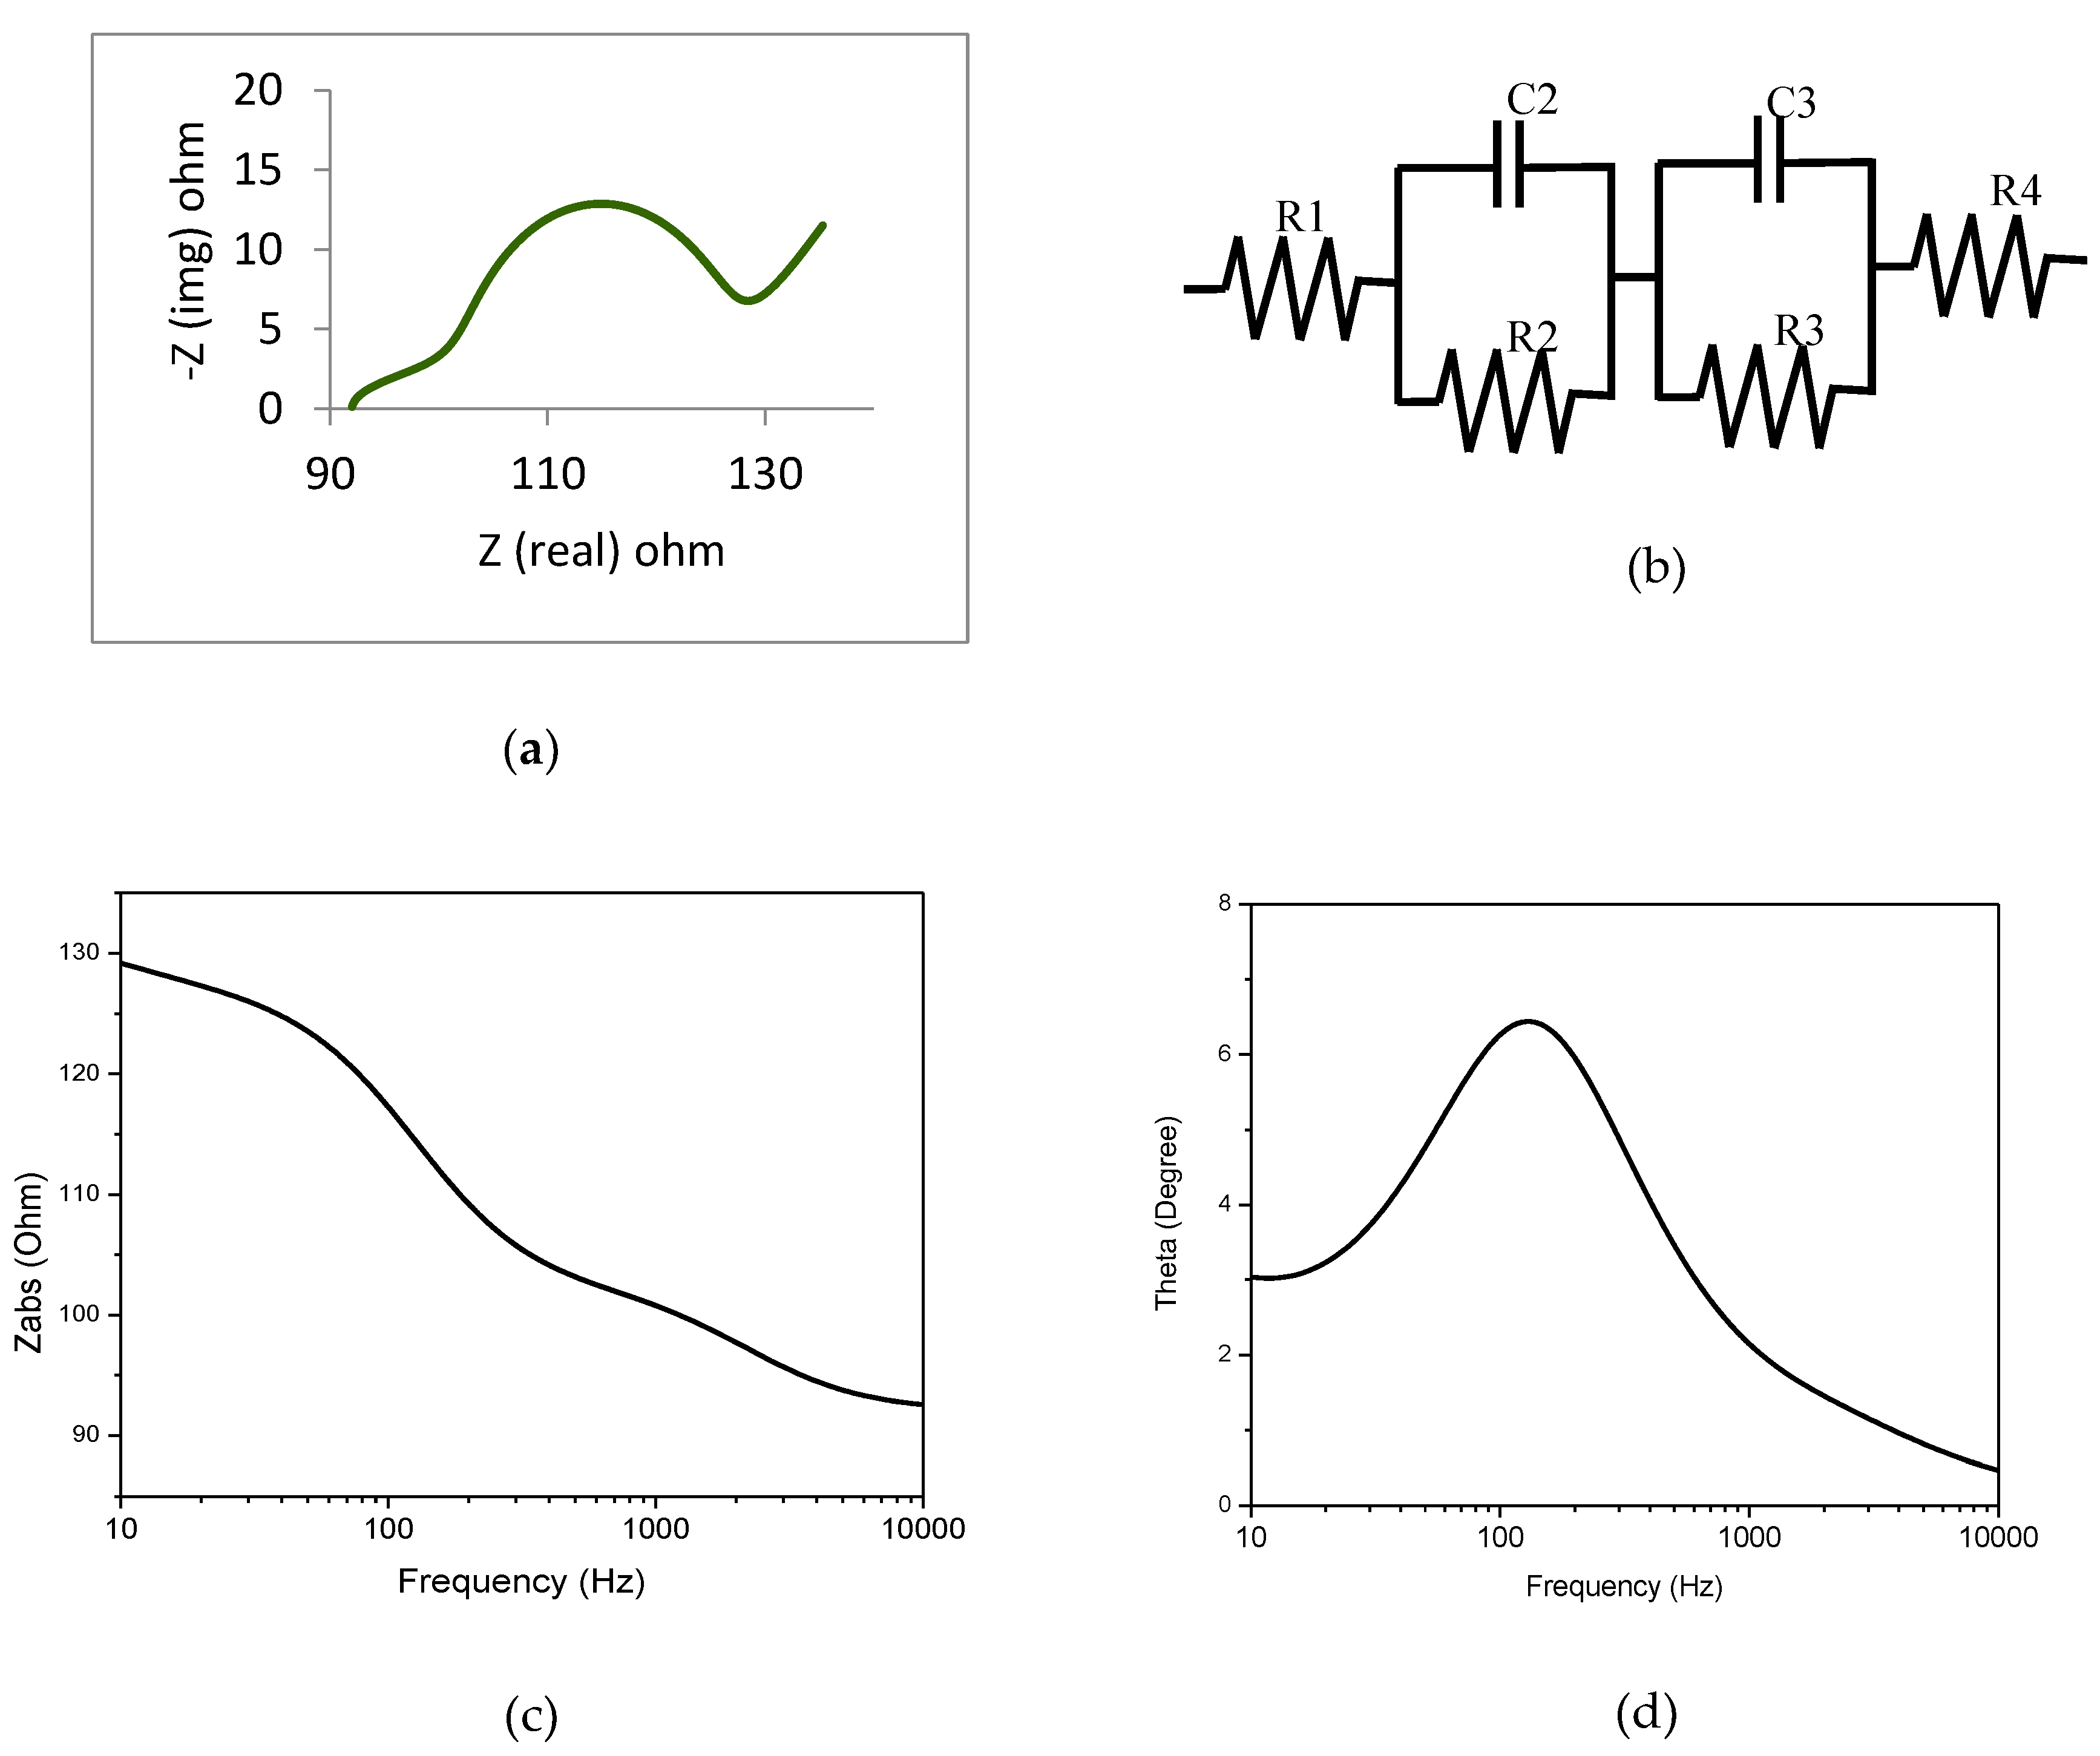

Table 1.
The equivalent circuit parameters for the Nyquist plot.
| Dye | R1(Ω) | R2(Ω) | R3(Ω) | C2(Ω) | C3(Ω) | R4(Ω) | Electron lifetime (ms) |
|---|---|---|---|---|---|---|---|
| Spathiphyllum wallisii | 90.9 | 52.3 | 88.28 | 2.48E-6 | 11.993E-6 | 97.3 | 1.058 |
Disclaimer/Publisher’s Note: The statements, opinions and data contained in all publications are solely those of the individual author(s) and contributor(s) and not of MDPI and/or the editor(s). MDPI and/or the editor(s) disclaim responsibility for any injury to people or property resulting from any ideas, methods, instructions or products referred to in the content. |
© 2025 by the authors. Licensee MDPI, Basel, Switzerland. This article is an open access article distributed under the terms and conditions of the Creative Commons Attribution (CC BY) license (http://creativecommons.org/licenses/by/4.0/).
Copyright: This open access article is published under a Creative Commons CC BY 4.0 license, which permit the free download, distribution, and reuse, provided that the author and preprint are cited in any reuse.


