
Submitted:
26 February 2025
Posted:
27 February 2025
You are already at the latest version
Abstract
This paper examines the diversity of financial instruments available to family farms across different regions globally, highlighting the challenges and opportunities these instruments present. Family farms, which play a crucial role in global food security and rural economies, often face unique financial constraints and risks that necessitate specialized financial solutions. The study analyses various financial products, including traditional loans, microfinance, grants, insurance schemes, and innovative digital financial tools, assessing their accessibility, effectiveness, and impact on farm sustainability and growth. By comparing case studies from diverse geographical contexts, the paper identifies best practices and common pitfalls in the financial support systems for family farms. Furthermore, the research underscores the importance of tailored financial instruments that address the specific needs of family farms, advocating for policies that enhance financial inclusion and resilience. Findings: The findings suggest that a multifaceted approach, which incorporates a mix of financial instruments and supportive policies, is essential for fostering the sustainability and development of family farms worldwide. The research proposes several innovative financial instruments aimed at stimulating and supporting family women within the context of circular economy initiatives. In general, the conclusions highlight the role and importance of financial instruments in supporting the transformative potential of family farms and in fostering their sustainable and inclusive growth. Practical Implications: The practical implications of the research highlight the transformative potential of family farms through innovative financial instruments and outline actionable steps for investors, decision-makers, and other stakeholders to capitalize on these opportunities. By embracing innovation, collaboration, and sustainable business practices, family farms can contribute to a more resilient, efficient, and inclusive ecosystem. Originality/Value: The originality and value of this research lie in its holistic approach to addressing pressing challenges at the intersection of technology, sustainability, finance, and the circular economy. It focuses on innovative financial instruments, practical applications, and multidisciplinary-oriented tools for supporting sustainable family farms, contributing to the objectives of sustainable development.
Keywords:
Financial Instruments
; Family Farms
; Sustainability
; Collaborative Economy
Introduction
In December 2011, the sixty-sixth session of the United Nations General Assembly decided to designate 2014 as the “International Year of Family Farming.” The resolution “encourages member states to undertake activities at the national level and to develop programs in support of the International Year of Family Farming.”
Therefore, it is crucial to identify in the specialized scientific literature the definition of family farming and similar terms used, as well as the contributions family farming makes to: employment and income generation, climate or market risk management, diversification, adaptation of production to territorial diversity and climate change, local democracy (governance), natural resource management.
Moreover, it is important to understand the innovative financial instruments that support family farms and the role family farming plays in the agricultural policies of various countries.
Family farming is one of the main forms of agricultural organization worldwide. In practice, it is implemented through a multitude of concrete forms identifiable in agricultural holdings. Without a standardized and operational definition, this term is infrequently used in many regions—mainly for linguistic reasons. For example, in English, “smallholder agriculture” is a common reference but is not fully comparable—this ambiguity leads to confusion and highlights the need for a clear definition proposal.
The diversity of rural economies (especially mountain economies) reflects the extreme heterogeneity of economies and societies. Between slash-and-burn agriculture, similar to practices of the first sedentary human groups, and agriculture that is almost entirely automated in certain high-tech regions (or high-tech enclaves disseminated elsewhere globally), the differences in capital intensity, market integration, artificialization, and productivity levels are immense.
Definitions used by FAO
Foundational Definition: Family farming is “a means of organizing activities specific to agriculture, forestry, fish production, pastoralism, and aquaculture, managed and operated by a family and relying primarily on family capital and labor, including both women and men. The family and the farm are interconnected, co-evolve, and combine economic, environmental, social, and cultural functions.”
Statistical Definition: “A family farm is an agricultural holding managed and operated by a household, where the agricultural labor is primarily provided by members of that household.”
Literature Review
The financial instruments available to family farms have been the focus of extensive research, particularly given their pivotal role in global food security and rural development. This chapter synthesizes the existing literature on the accessibility, effectiveness, and sustainability of diverse financial products tailored to family farms, emphasizing their implications for growth, resilience, and inclusion.
Family Farms and Financial Constraints
Family farms constitute the backbone of rural economies and are integral to achieving food security (Lowder, Skoet, & Raney, 2016). However, they face distinctive financial challenges, including limited access to credit, high exposure to climatic and market risks, and often inadequate institutional support (Deininger & Byerlee, 2011). These constraints necessitate specialized financial solutions that are not only accessible but also address the unique risk profiles of family farms (Hazell et al., 2010).
Traditional Financial Instruments: conventional financial products, such as loans and grants, have long been the cornerstone of agricultural financing. Studies have shown that while traditional loans remain critical for farm investments, their accessibility is often hindered by stringent collateral requirements and high interest rates (Karlan et al., 2014). Grants, often provided by governments or international donors, are effective in fostering initial investments but may lack sustainability in the absence of continued support (FAO, 2020).
Microfinance and Insurance Schemes: microfinance has emerged as a transformative tool for smallholder and family farms, enabling access to credit for those excluded from traditional banking systems (Morduch, 1999). Similarly, agricultural insurance schemes have been increasingly advocated to mitigate risks related to weather variability and market fluctuations. However, uptake remains limited due to high premiums and lack of awareness (Barnett, Barrett, & Skees, 2008).
Innovative Financial Tools and Digital Solutions: recent advancements in financial technology have introduced innovative tools such as mobile-based banking, peer-to-peer lending, and blockchain-enabled transactions (Zhang & Liu, 2020). These tools enhance financial inclusion by lowering transaction costs and improving accessibility for remote rural areas. Studies highlight the potential of these innovations to improve cash flow management and foster resilience against economic shocks (Demirgüç-Kunt et al., 2018).
Case Studies: Regional Perspectives: comparative analyses of financial support systems across regions reveal significant variability in their effectiveness and implementation. For instance, Europe’s Common Agricultural Policy (CAP) provides a robust framework for grants and subsidies, whereas sub-Saharan Africa relies more heavily on microfinance and community-based savings groups (Pingali, Ricketts, & Sahn, 2015). Best practices identified in these contexts include the integration of local knowledge with financial products and the fostering of public-private partnerships.
Financial Instruments for Women and the Circular Economy: targeted financial instruments aimed at empowering women farmers and supporting circular economy initiatives have gained traction in recent years. Research suggests that gender-sensitive financial products, such as tailored microloans and capacity-building grants, significantly enhance productivity and social equity (World Bank, 2021). The circular economy framework further emphasizes sustainability by promoting resource efficiency and waste reduction in farming practices (Geissdoerfer et al., 2017).
Policy Implications and Future Directions: the literature underscores the importance of integrating financial instruments with supportive policies to ensure their effectiveness. Tailored policies that address the specific needs of family farms—including tax incentives, risk-sharing mechanisms, and capacity-building programs—are critical for fostering long-term sustainability (OECD, 2019). Furthermore, the role of stakeholder collaboration, including governments, private investors, and NGOs, is repeatedly highlighted as essential for scaling successful financial solutions.
The experts of literature reviewed underscores the transformative potential of financial instruments in addressing the unique challenges of family farms. By adopting a multifaceted approach that combines traditional, innovative, and inclusive financial tools with enabling policies, stakeholders can unlock the growth and resilience of family farms. Future research should continue to explore the intersection of technology, sustainability, and finance to support the evolving needs of these vital agricultural actors.
Methodology of the Research
In order to underpin the research methodology, the classical observation and examination instruments, research methods based on the basic principles of scientific research, namely: “competence, objectivity, truth, methodical, demonstration, correlation, evaluation of results, utility and psychomoral” (Ristea and Franc, 2013). It will use procedures based on factual analysis, intensive documentation at the level of domestic and international literature, using the databases and the scientific material existing in the endowment of the libraries of specific institutes in Romania and internationally.
The methodology of the paper has as direct instruments the collection of data and information from the literature and from the existing practice in public and private institutions, but especially scientific articles published on specialized research networks (Research Gate, Academia.edu, etc.), articles published in different journals, relevant books in the field of reference, legislation, analyses and studies, official documents of various tax bodies, tax documents and interactive database of the National Bank of Romania, other relevant sources identified at the libraries: CCFM, Romanian Academy, INCE, IEN, BNR, National Library, INS, etc. Moreover, we analysed the documents using the comparative, analytical, descriptive method, the nonparticipative and participatory observation, the use of a set of information sources, the collection of financial data in the established databases. Also, the paper will be based on annual reports, publications, consolidated statistical data provided by the National Bank of Romania, the European Central Bank (ECB), the International Settlement Bank (BRI), the European Commission, OECD, published annually, data to be processed in order to be able to provide a general and analytical picture of the most important changes taking place in the European Union as a whole, but also globally - considered to be representative of the understanding of the phenomena studied, and especially in Romania.
The information support of the research was provided by the monographs, books, scientific papers, materials of the scientific conferences, the research scientific papers, as well as other materials, which are presented in the scientific papers and publications on the official pages of national and international research institutes, international financial institutions (research centres), etc.
Results and Discussions
The analysis of the available data suggests that the effective implementation of a diverse set of financial tools can significantly contribute to enhancing the sustainability and growth of family farms. These results emphasize the need for tailored financial instruments that specifically address the unique challenges faced by family farms, particularly those led by women, and support their integration into the circular economy. The study further highlights the importance of aligning these financial instruments with supportive public policies to ensure a comprehensive and efficient approach to rural development. By leveraging such tools, family farms can be better equipped to face economic and environmental challenges while fostering long-term resilience and sustainability.

Table 1.
Characteristics of the main forms of agriculture. Source: May 2015 / Family Farming Around the World / ©AFD.
Table 1.
Characteristics of the main forms of agriculture. Source: May 2015 / Family Farming Around the World / ©AFD.
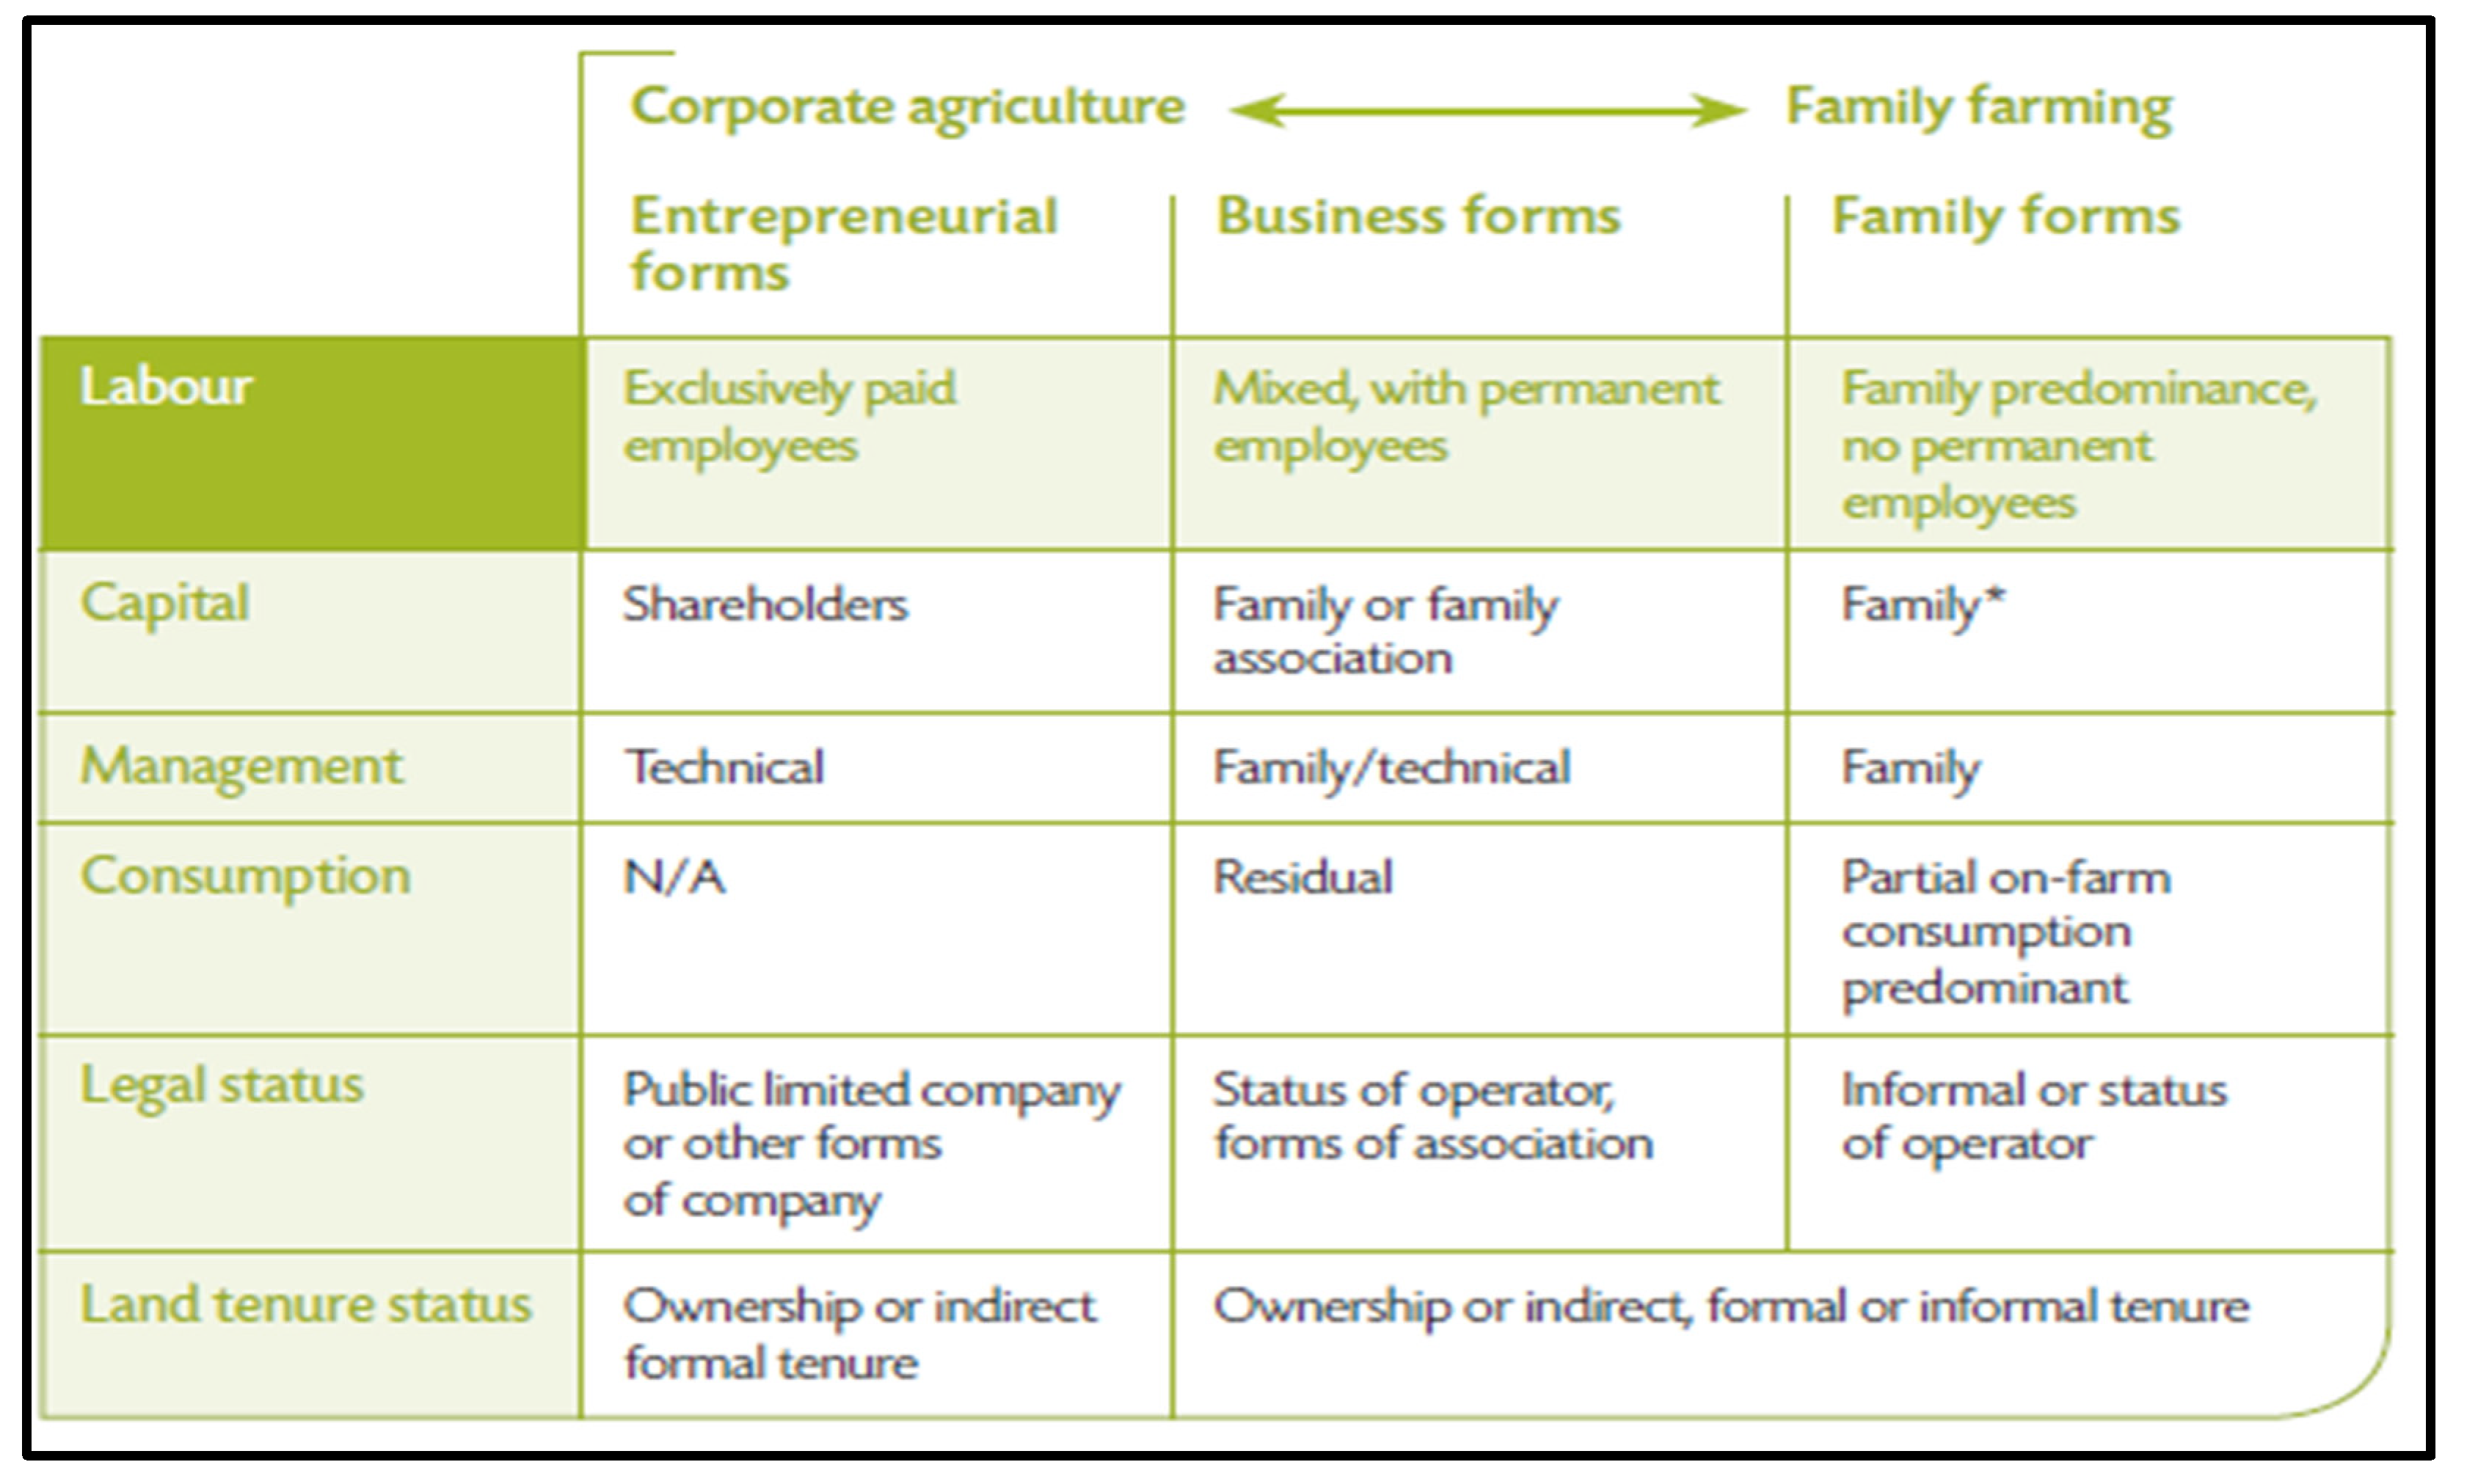
Table 2.
Analysis of some definitions of the peasant “concept”. Source: May 2015 / Family Farming Around the World / ©AFD.
Table 2.
Analysis of some definitions of the peasant “concept”. Source: May 2015 / Family Farming Around the World / ©AFD.
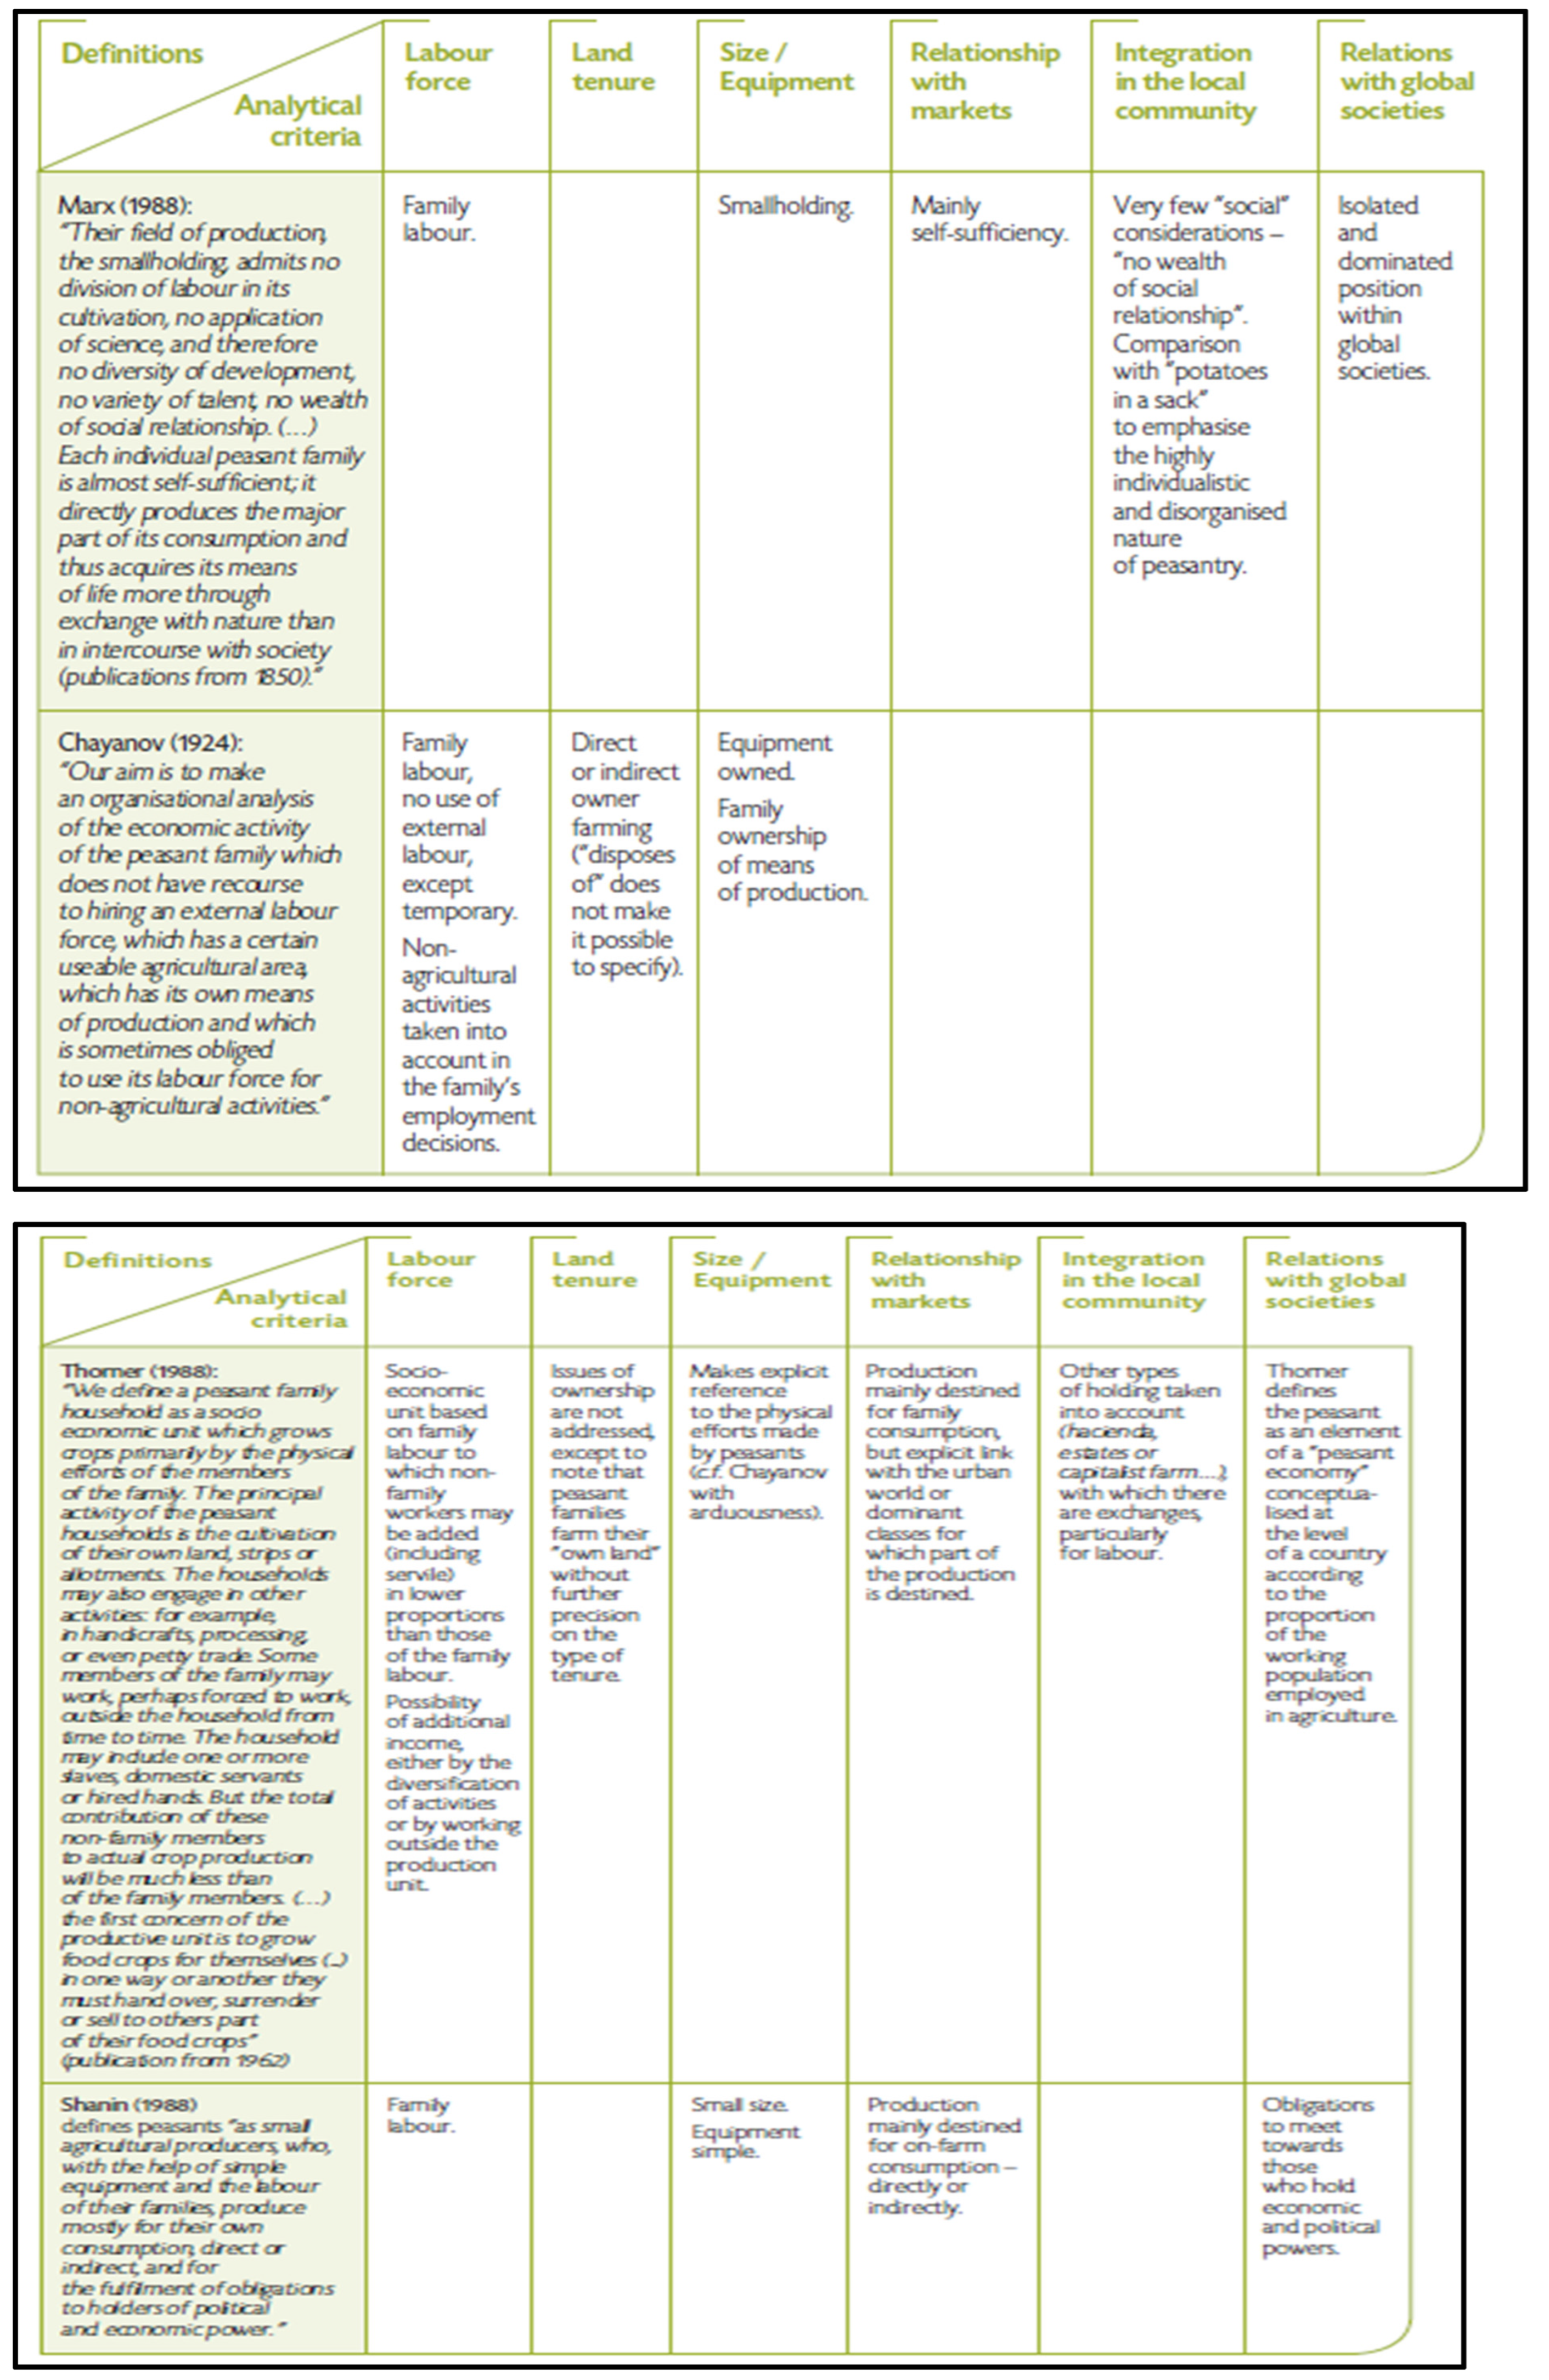

Table 3.
Criteria used to identify family farms. Source: May 2015 / Family Farming Around the World / ©AFD.
Table 3.
Criteria used to identify family farms. Source: May 2015 / Family Farming Around the World / ©AFD.
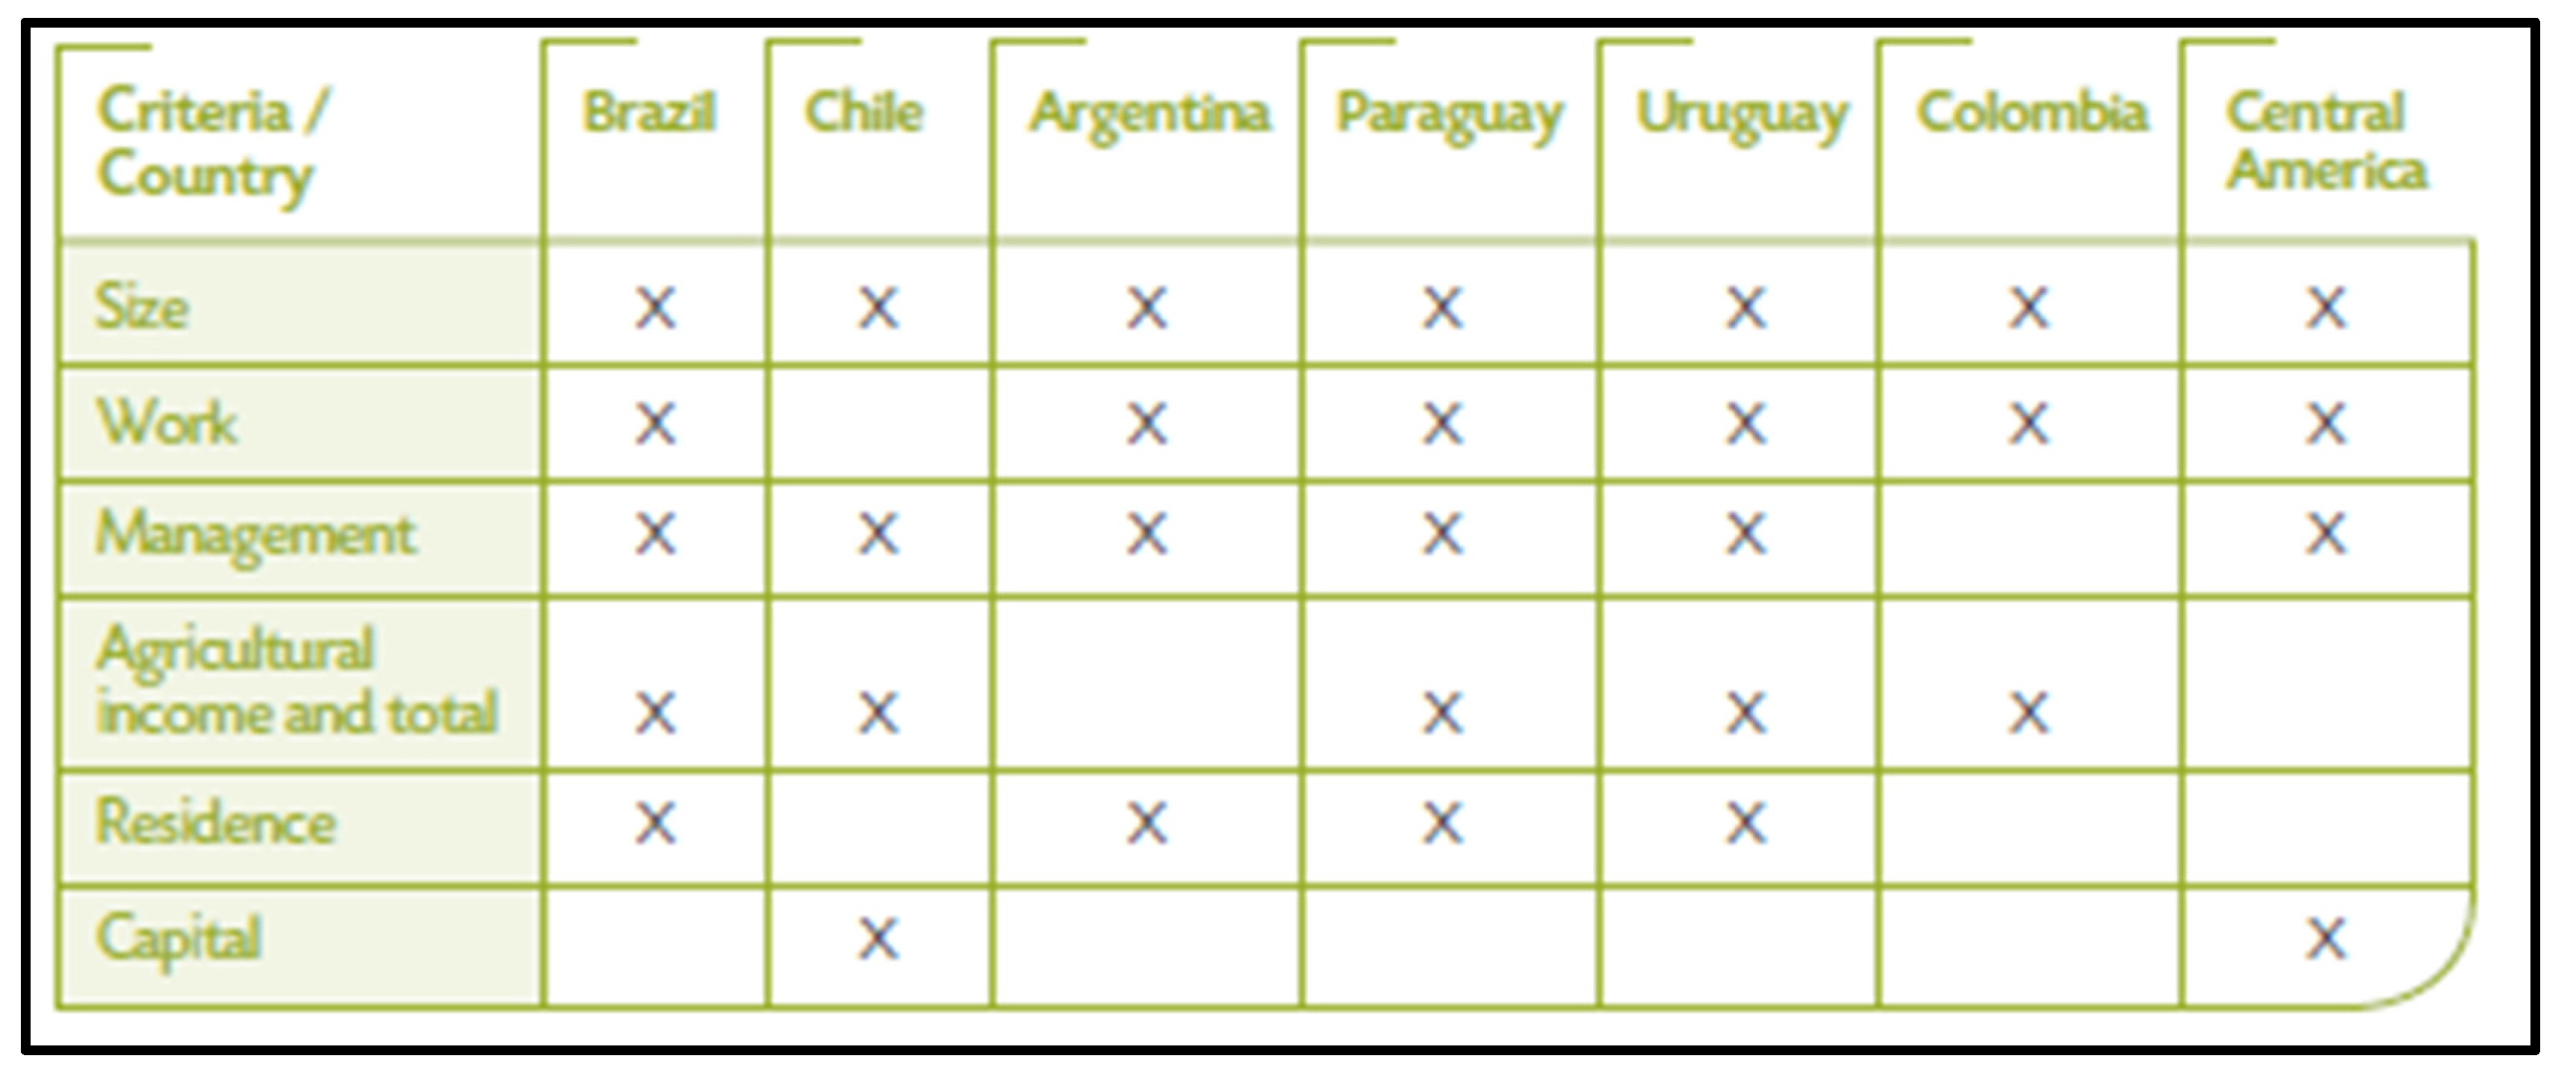
Table 4.
The main differentiation criteria for family farming and possible methods. Source: May 2015 / Family Farming Around the World / ©AFD.
Table 4.
The main differentiation criteria for family farming and possible methods. Source: May 2015 / Family Farming Around the World / ©AFD.

The Agricultural Population
The agricultural population today stands at 2.6 billion people, representing nearly 40% of the world’s population. This includes 1.3 billion active workers, making agriculture the largest industry in the world, far surpassing all other industrial and service sectors, which are much more segmented and specific. The role of agriculture in global activity varies considerably depending on the regions of the world and their stage in the economic transition process.
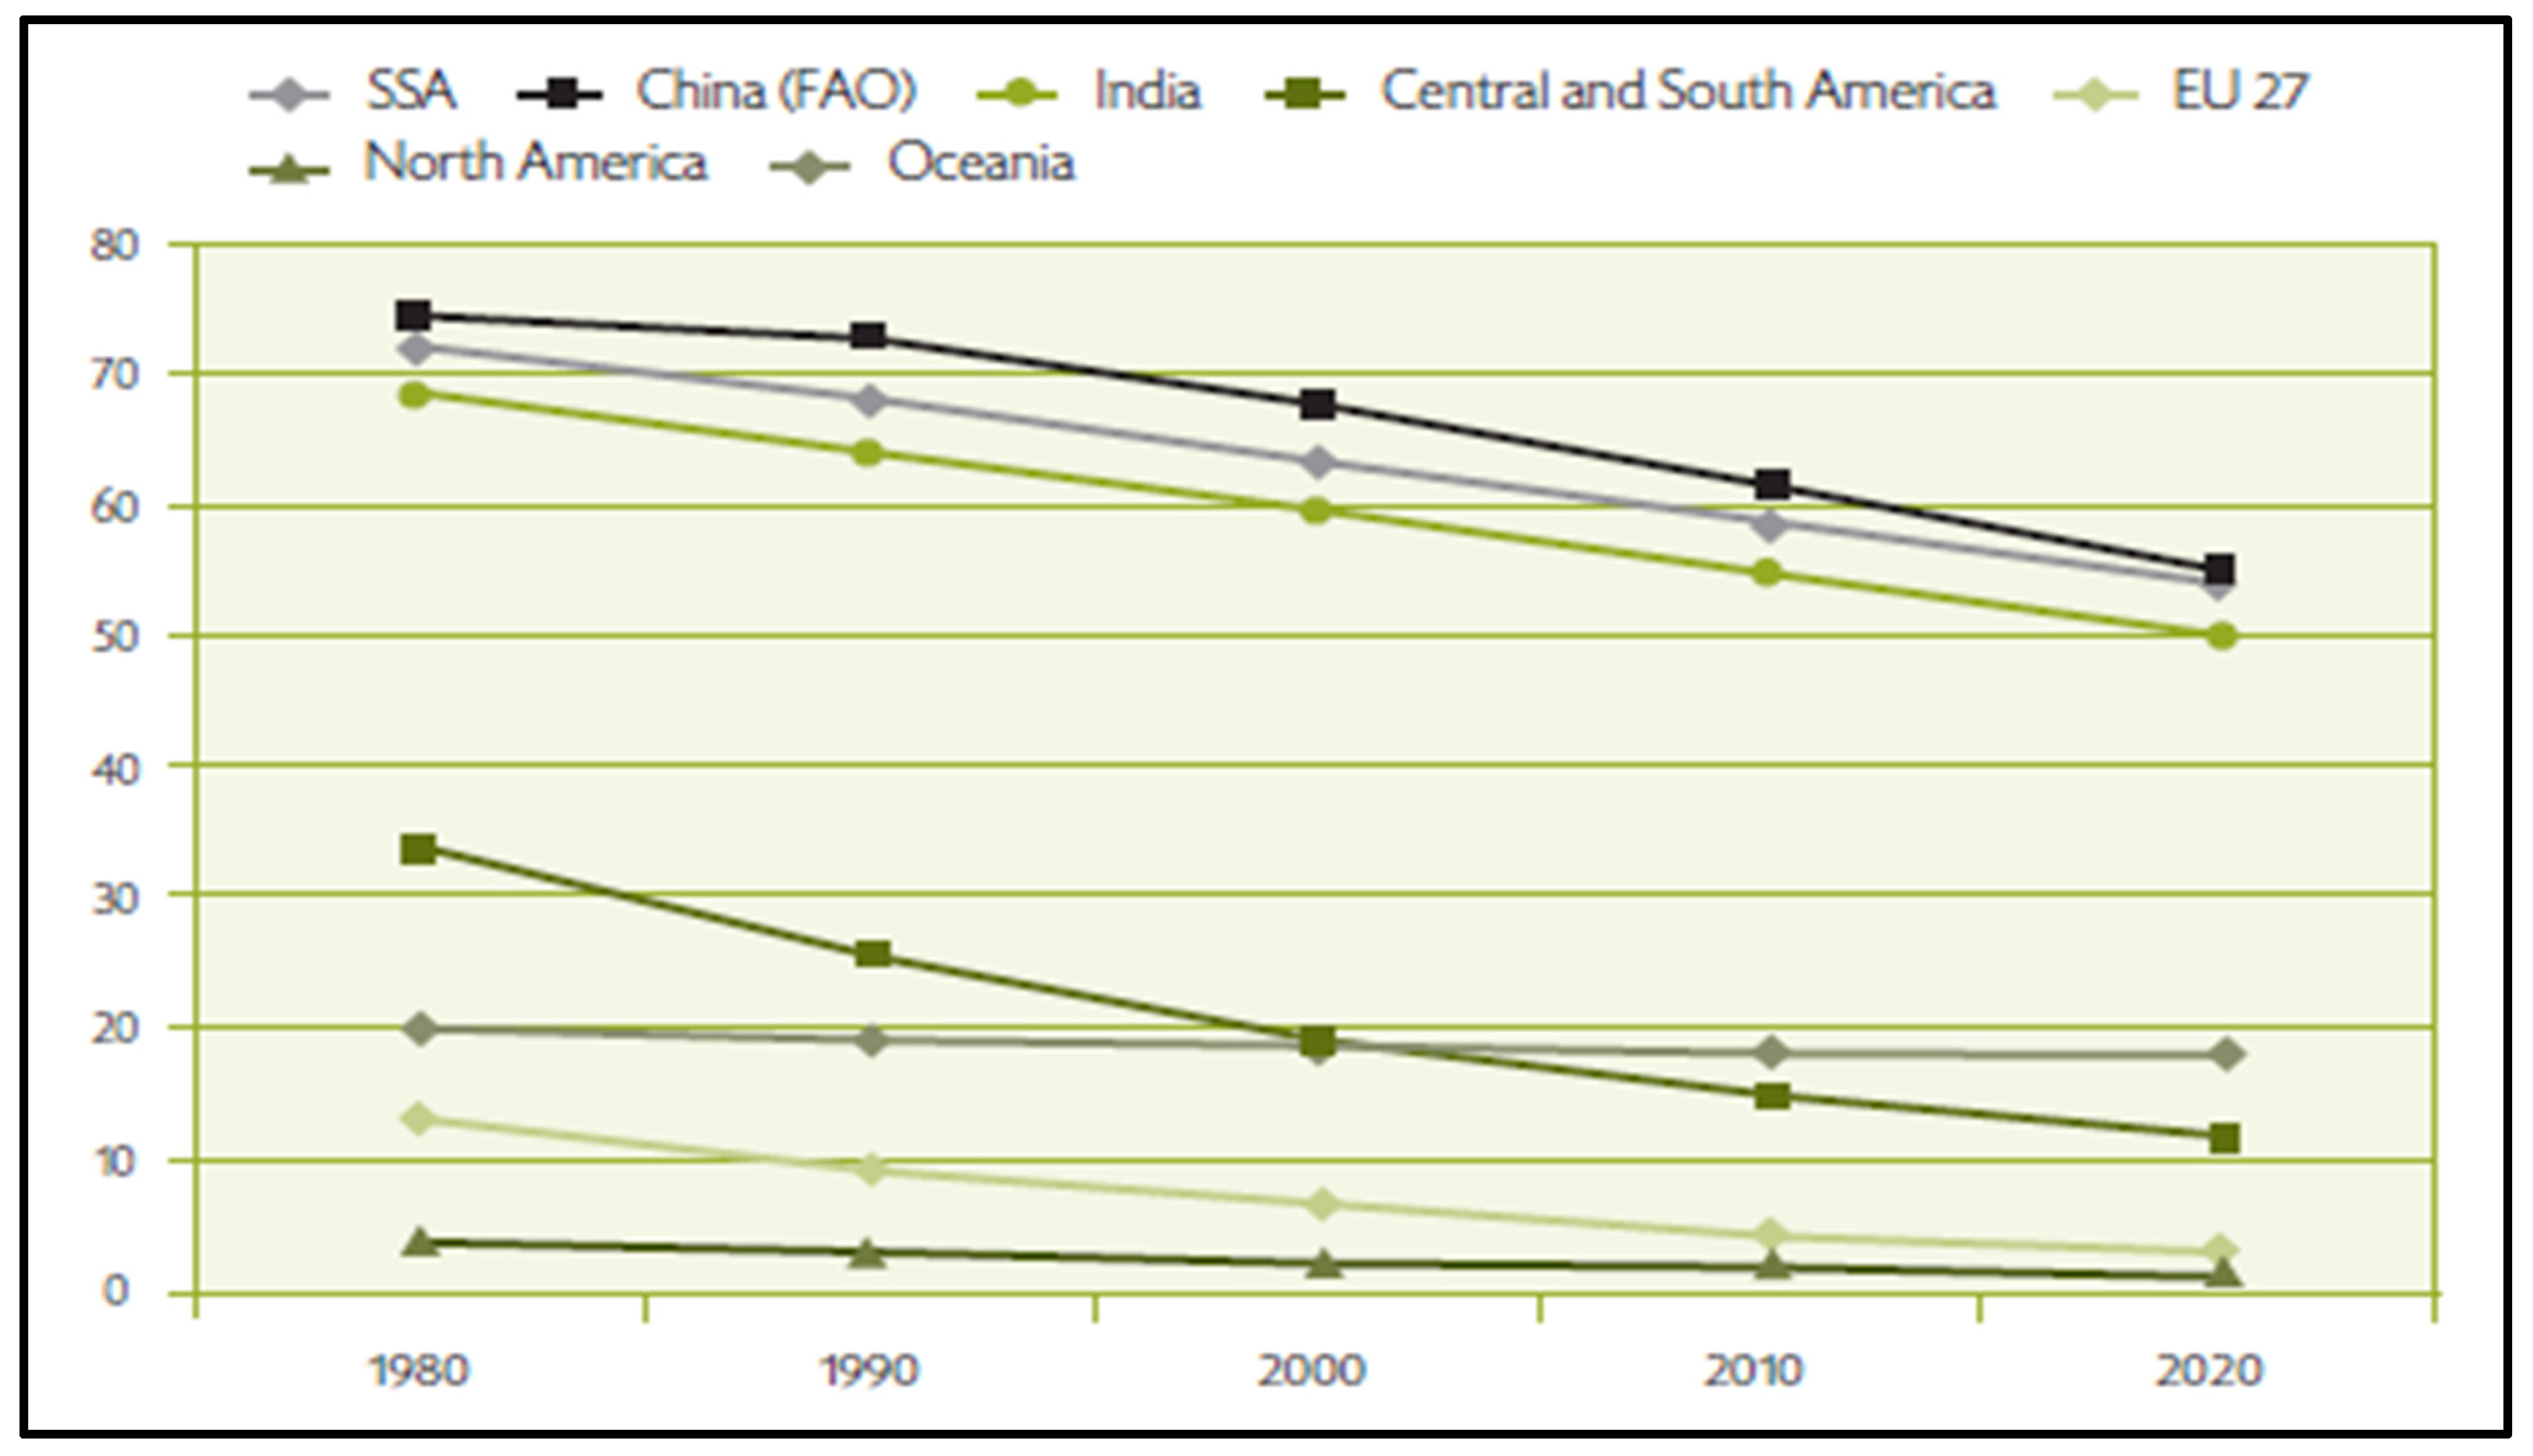
In Europe and North America, the first regions to initiate structural transformation, the proportion of active agricultural workers has fallen below 5%. However, the situation is much more contrasted in the rest of the world (see Figure 1).
The number of active agricultural workers in Latin America has decreased by a factor of 2.5 since 1980 (-56%), whereas Sub-Saharan Africa (SSA) and Asia, particularly India and China, have experienced a much slower decline (between -15% and -20%). These regions continue to maintain a high proportion of active agricultural workers (between 55% and 65%).
As a result, and due to the demographic weight of the vast Asian continent, agricultural workers are overwhelmingly concentrated in Asia (see Chart 2): 78% of the global total, or over one billion workers, including 497 million in China, 267 million in India, and 258 million in other Asian countries. With 15% of active workers (203 million), SSA is the second-largest agricultural region, while the “weight” of the rest of the world accounts for only 7% of the global total (83 million active workers).
Figure 2.
Geographical breakdown of agricultural workers in 2010. Source: FAOSTAT.

Agricultural Censuses
Agricultural censuses are the traditional source of information on agrarian structures. In addition to recurring issues related to the lack of data, it is often difficult to make comparisons due to differences in the definitions of units or observation classes for distribution (e.g., farm size areas). The FAO conducts a regulated exercise to compile and compare census data provided by countries: the World Census of Agriculture (FAO, 2010 and 2012b).
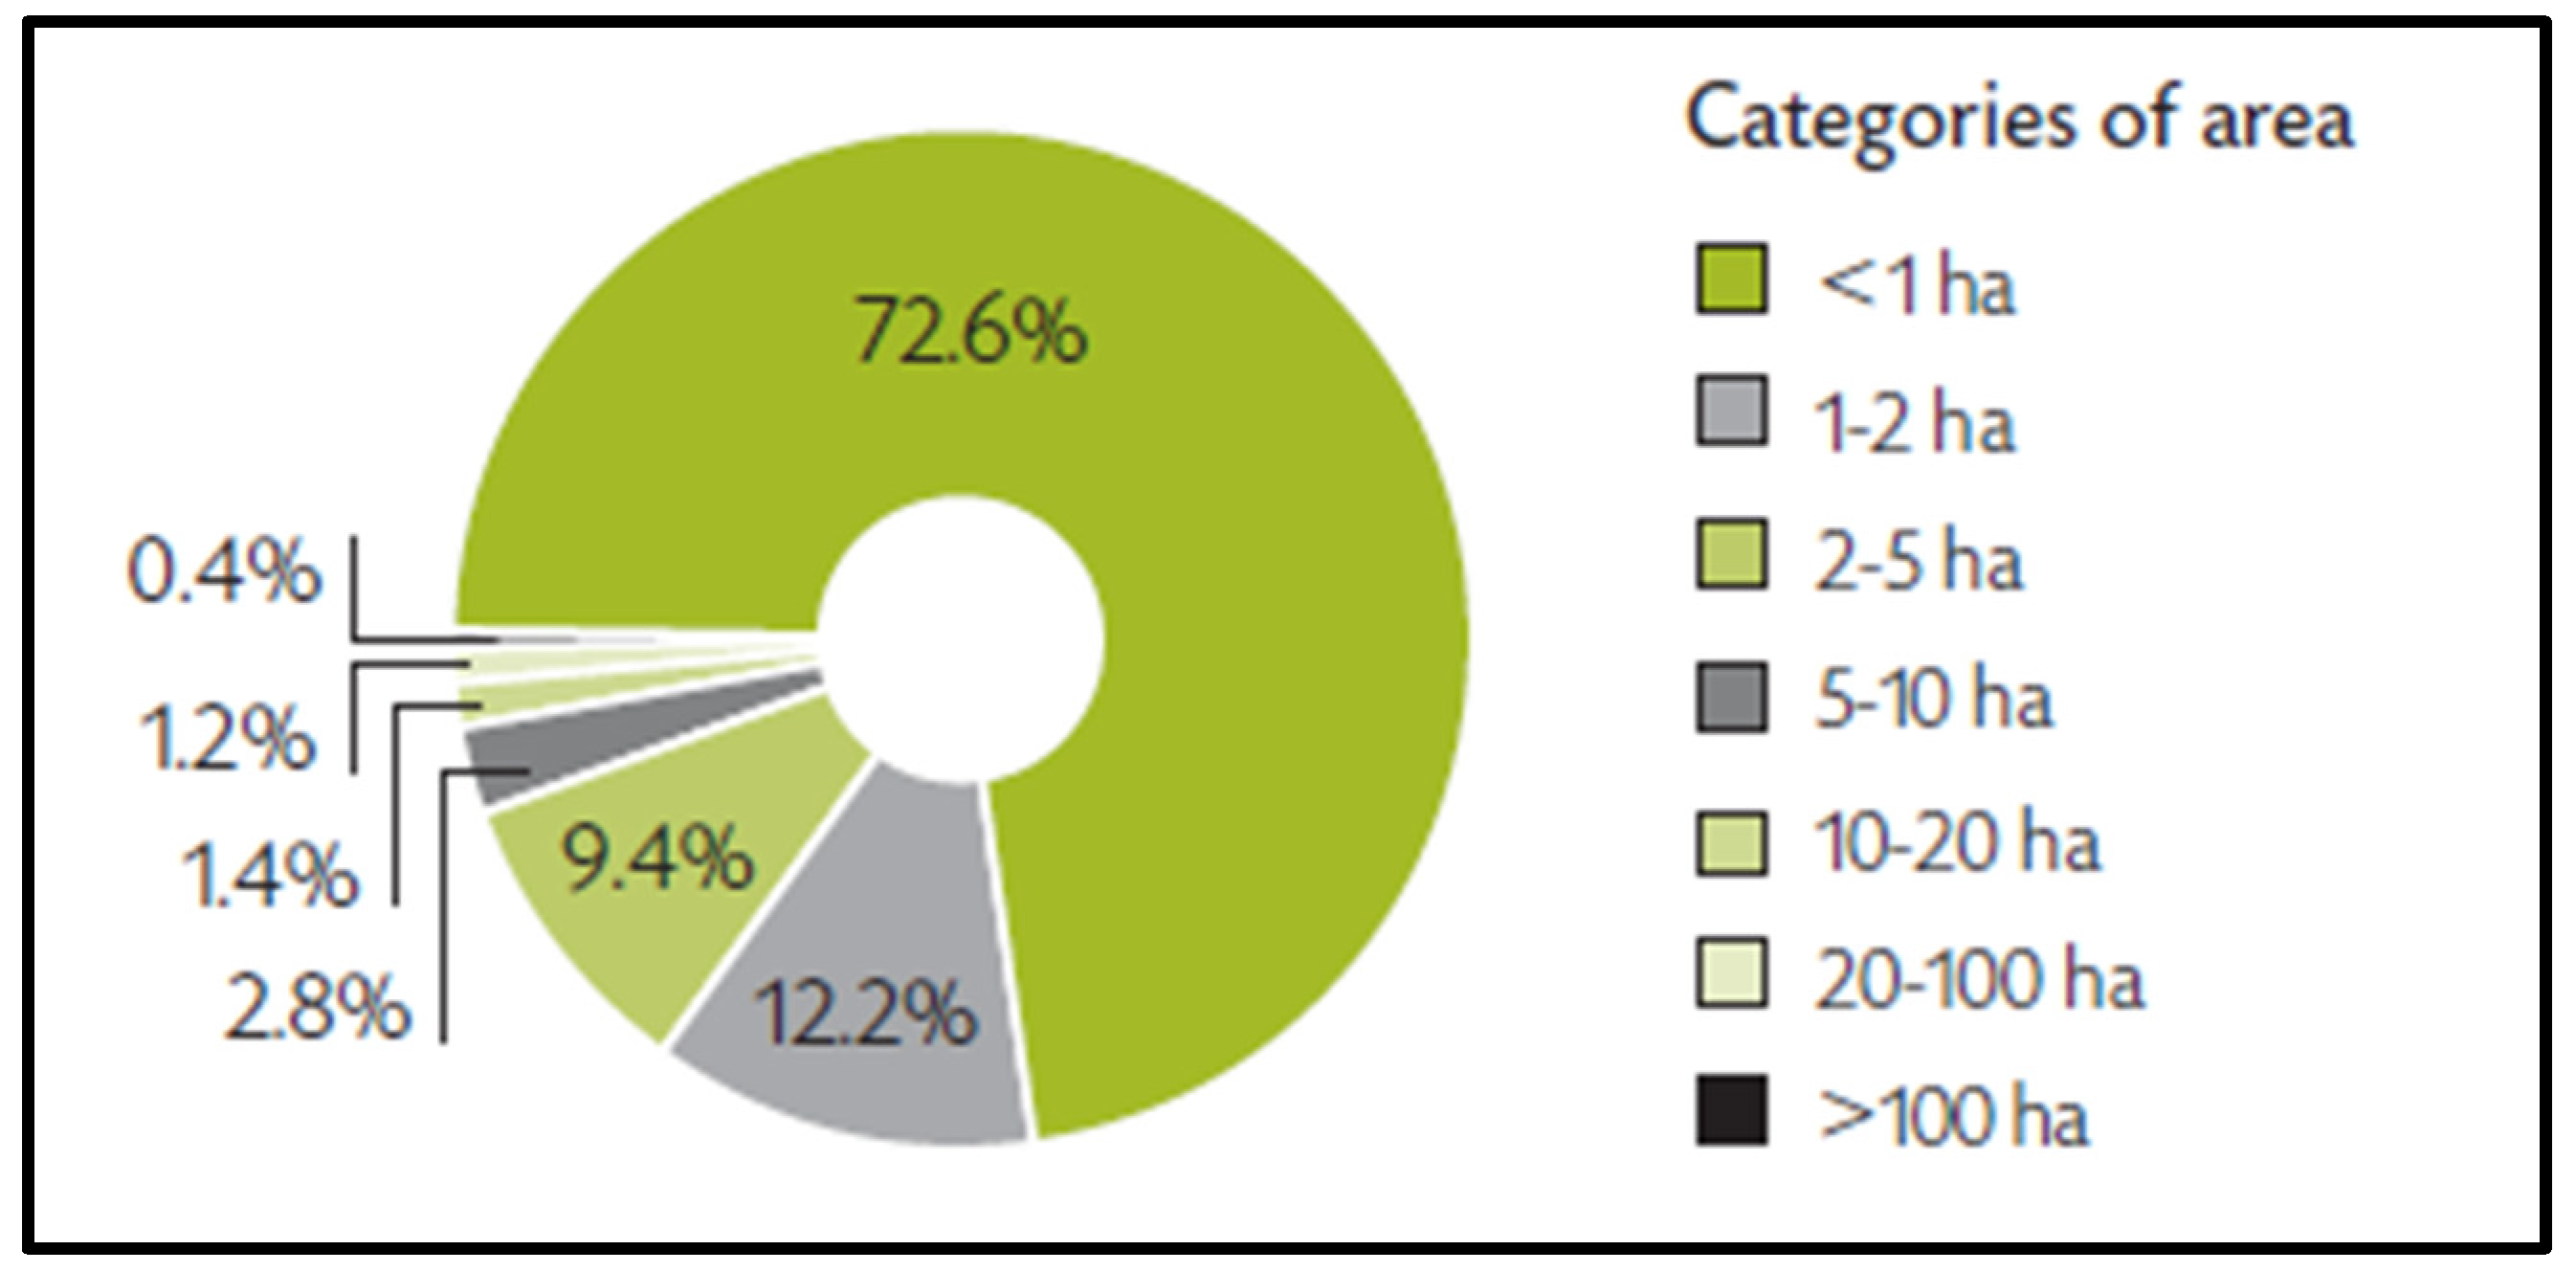
Figure 3.
Breakdown of Agricultural Holdings by Size Categories. Source: FAO 2010 World Census of Agriculture (81 de țări).
Figure 3.
Breakdown of Agricultural Holdings by Size Categories. Source: FAO 2010 World Census of Agriculture (81 de țări).
Their Geographic Distribution
Their geographic distribution might seem meaningless due to the extent of missing information. However, their distribution by size provides an extremely useful picture of the world’s agricultural structures (see Chart 3). Approximately 73% of identified holdings operate on less than 1 hectare (316 million); 85% are under 2 hectares, and 94% are under 5 hectares.
Consequently, the vast majority of active agricultural workers globally—93% of whom are located in Asia and Africa—work on very small holdings (see Chart 4). Holdings larger than 10 hectares are predominantly found in the Americas (50% of the regional total in the North and 40% in the South), Europe (only 20%), and Oceania (represented here primarily by New Zealand).
Figure 4.
Breakdown of the Total Number of Holdings in a Region by Size Class. Source: FAO 2010 World Census of Agriculture (81 de țări).
Figure 4.
Breakdown of the Total Number of Holdings in a Region by Size Class. Source: FAO 2010 World Census of Agriculture (81 de țări).
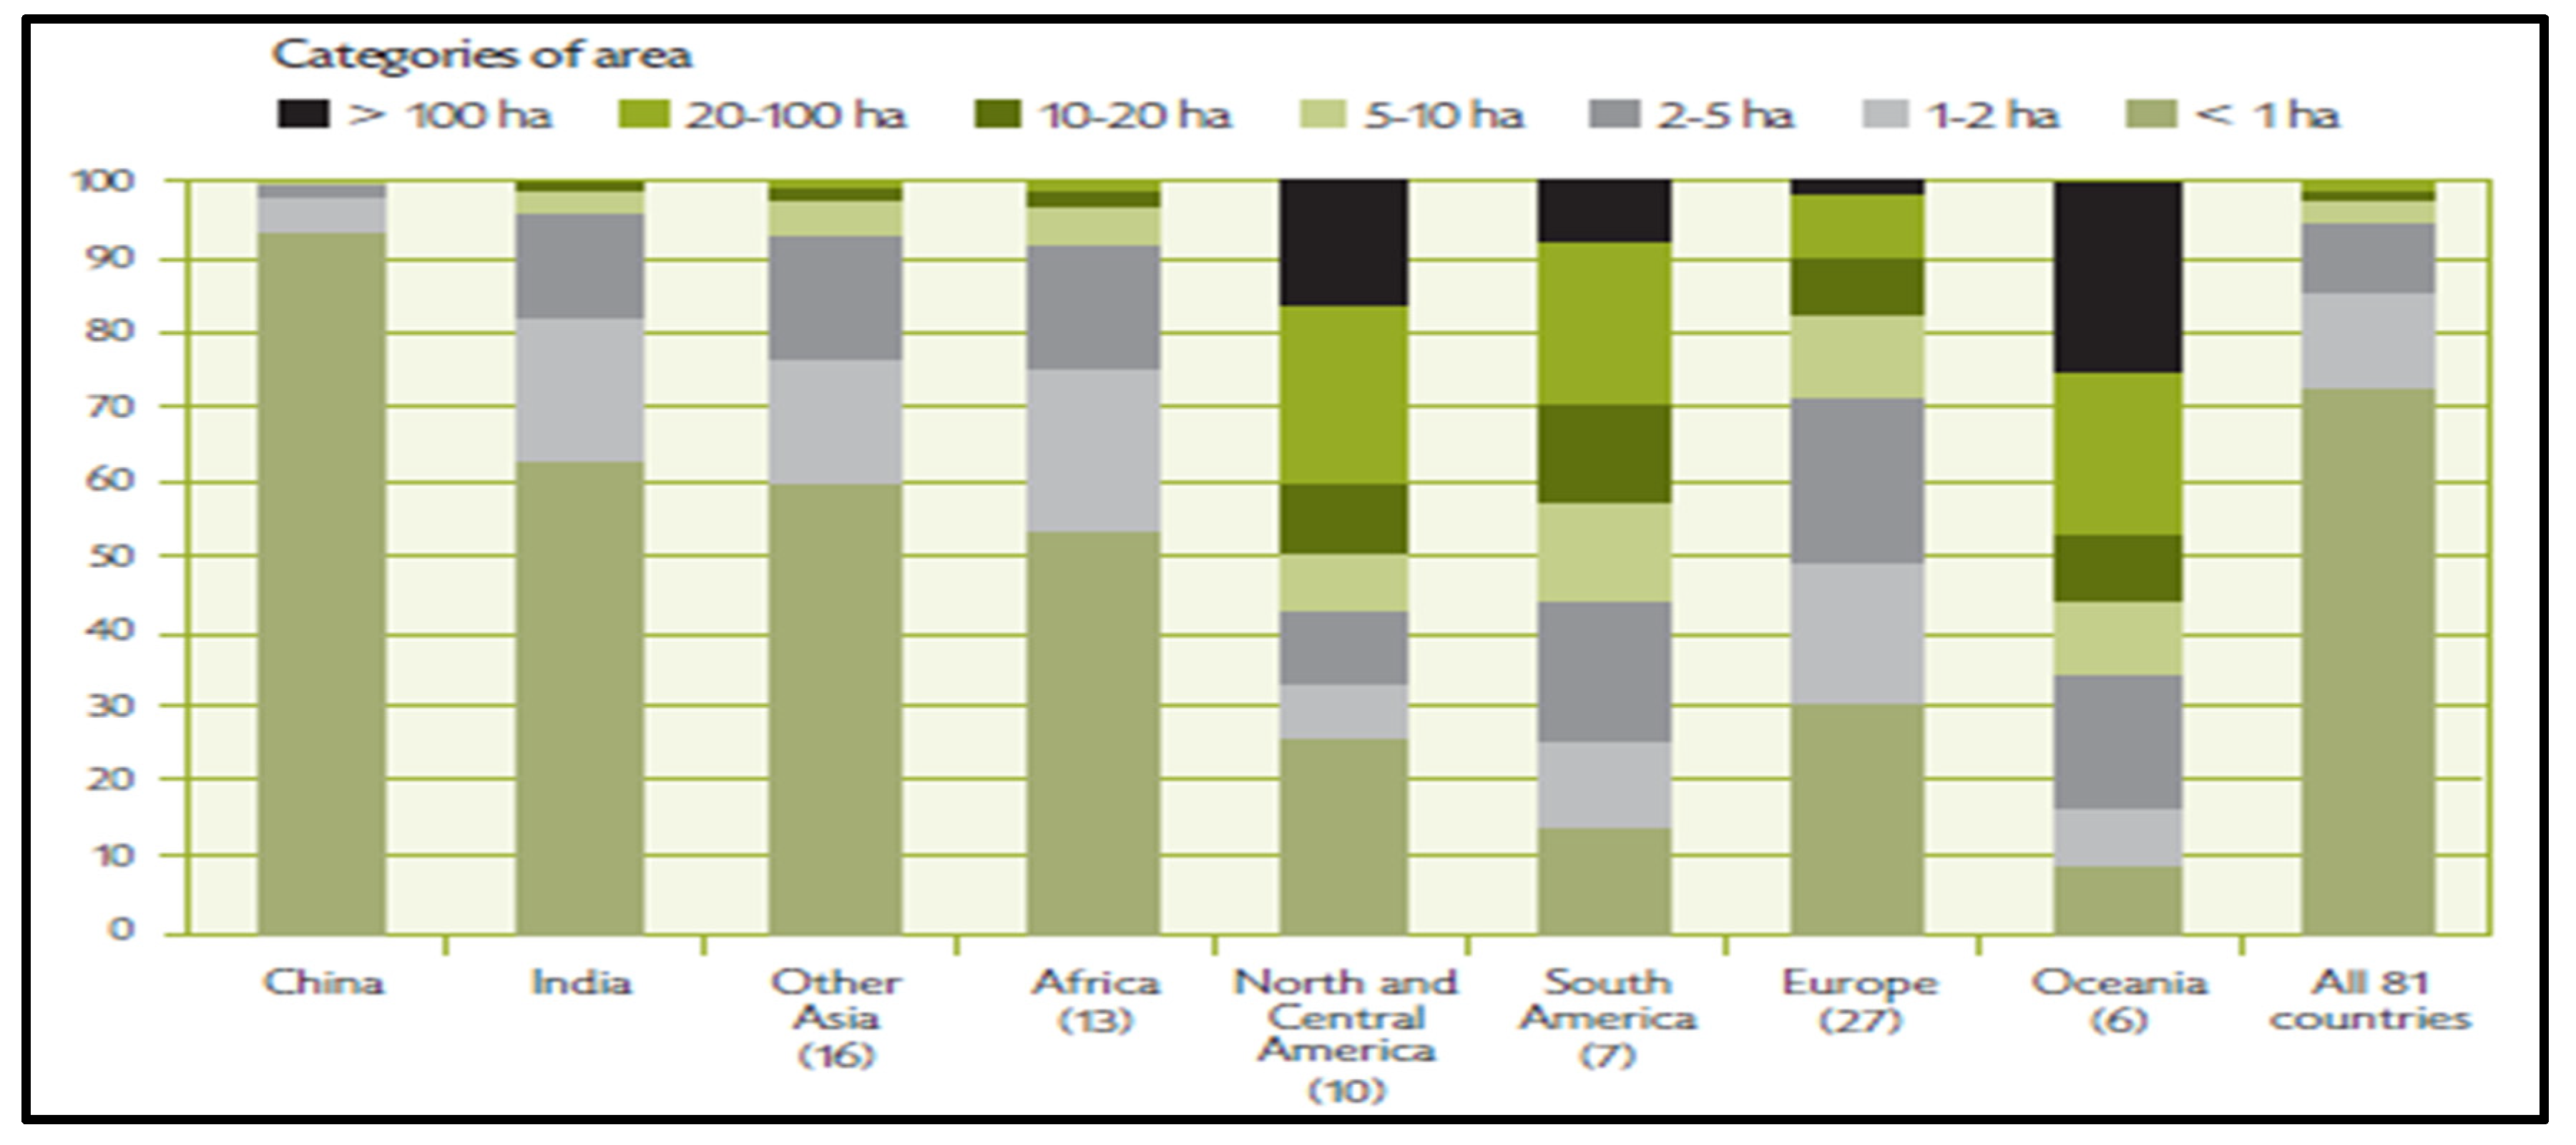
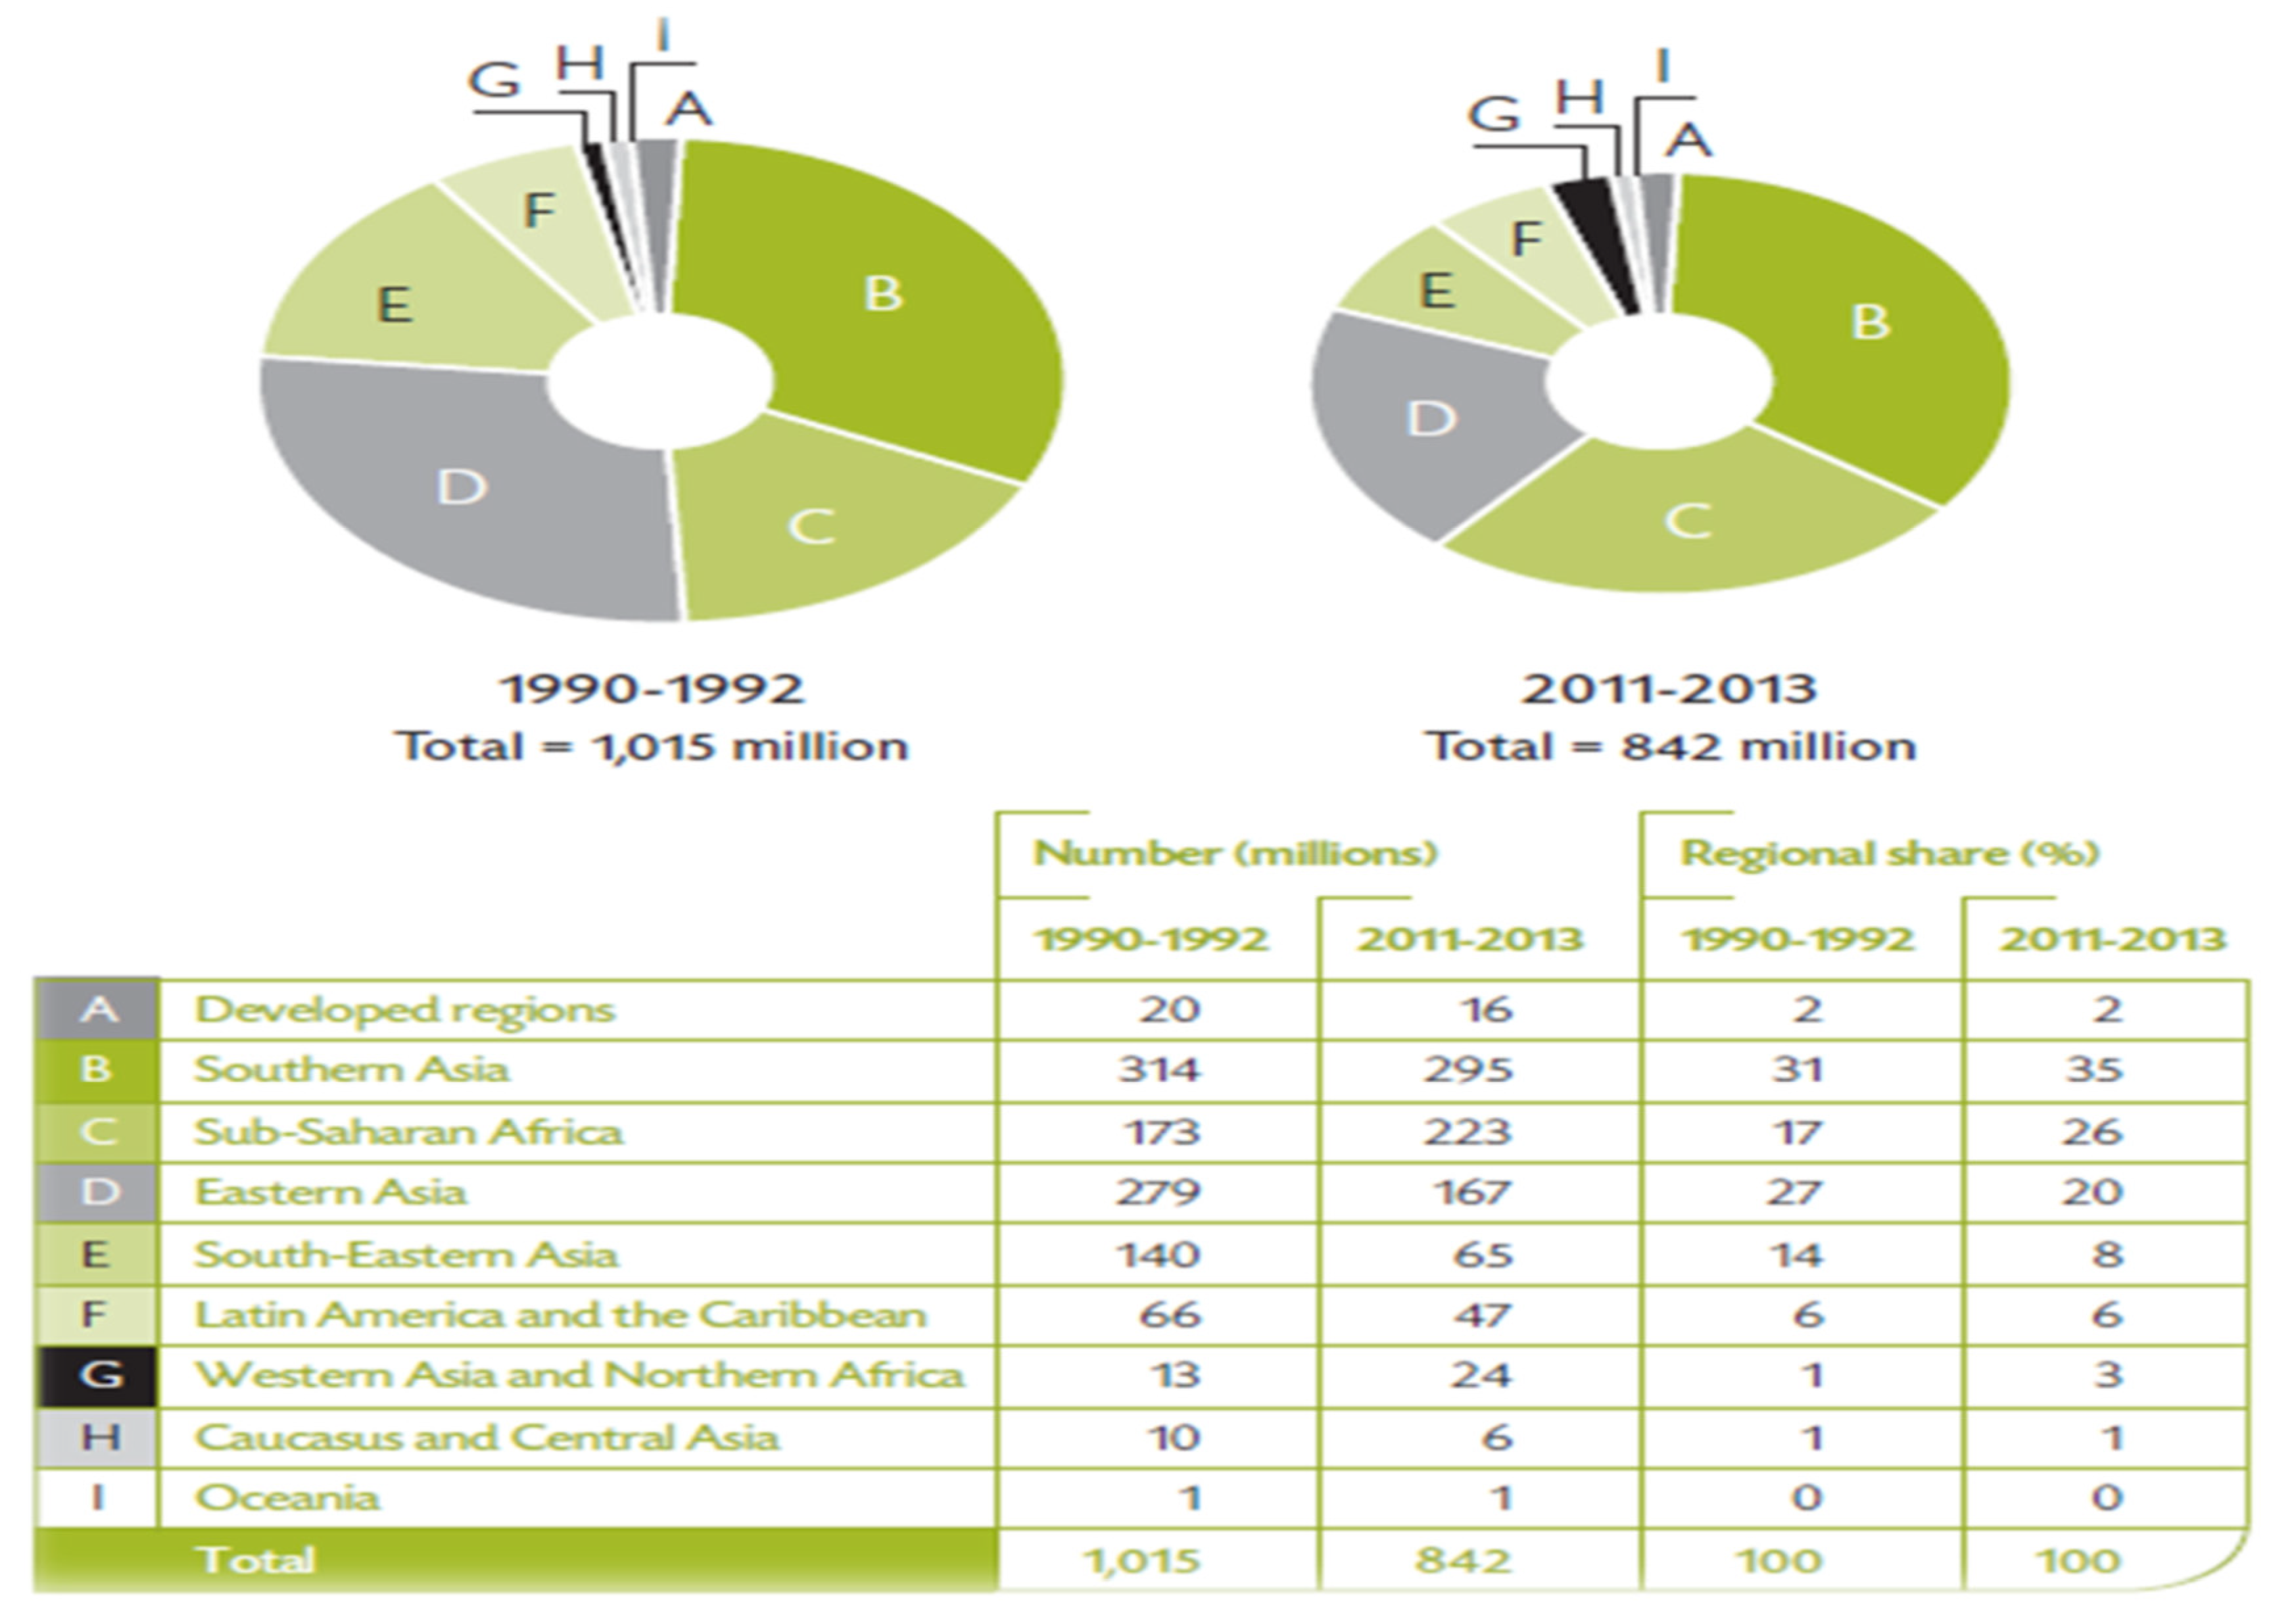
Figure 5.
Trend in the number of undernourished people in the major regions of the world. Source: FAO (2013a).
Figure 5.
Trend in the number of undernourished people in the major regions of the world. Source: FAO (2013a).
Family Farms and Natural Resources
Do family farms contribute to the degradation or conservation of nature? Is the environmental impact greater or lesser than that of corporate farms? These questions, which are of particular importance today, often lead to partisan and passionate positions.
Family farm organizations, particularly producer organizations, rural associations, and farmer unions, along with their allies (universities, national and international NGOs), frequently argue that family farms ensure responsible management of natural resources, as their conservation ensures the sustainability of the production unit. Family farms, whose location and production intensity do not essentially depend on market signals, would thus seem to pay more attention to the environmental implications of their activities than corporate farms. Large producer organizations, however, do not share this analysis and often associate environmental degradation with family agriculture, citing the inefficiency of the latter’s techniques. Family farming can also generate diffuse pollution, which is difficult to address due to its geographical dispersion. This is, for example, the case with effluents from artisanal palm oil extraction, which are discharged into rivers in the Gulf of Guinea countries, while effluents from industrial oil mills must be treated according to national legislation. However, artisanal extraction continues to be key to olive oil development outside the supply areas of oil mills, as farmers have no other outlets for their production. Indeed, the issue of environmental impact is largely embedded in official representations of the causes of degradation and its assessment.
Figure 6.
Relative position of technical systems concerning their environmental impact and their dependence on agro-supply. Sourcea: May 2015 / Family Farming Around the World / ©AFD.
Figure 6.
Relative position of technical systems concerning their environmental impact and their dependence on agro-supply. Sourcea: May 2015 / Family Farming Around the World / ©AFD.
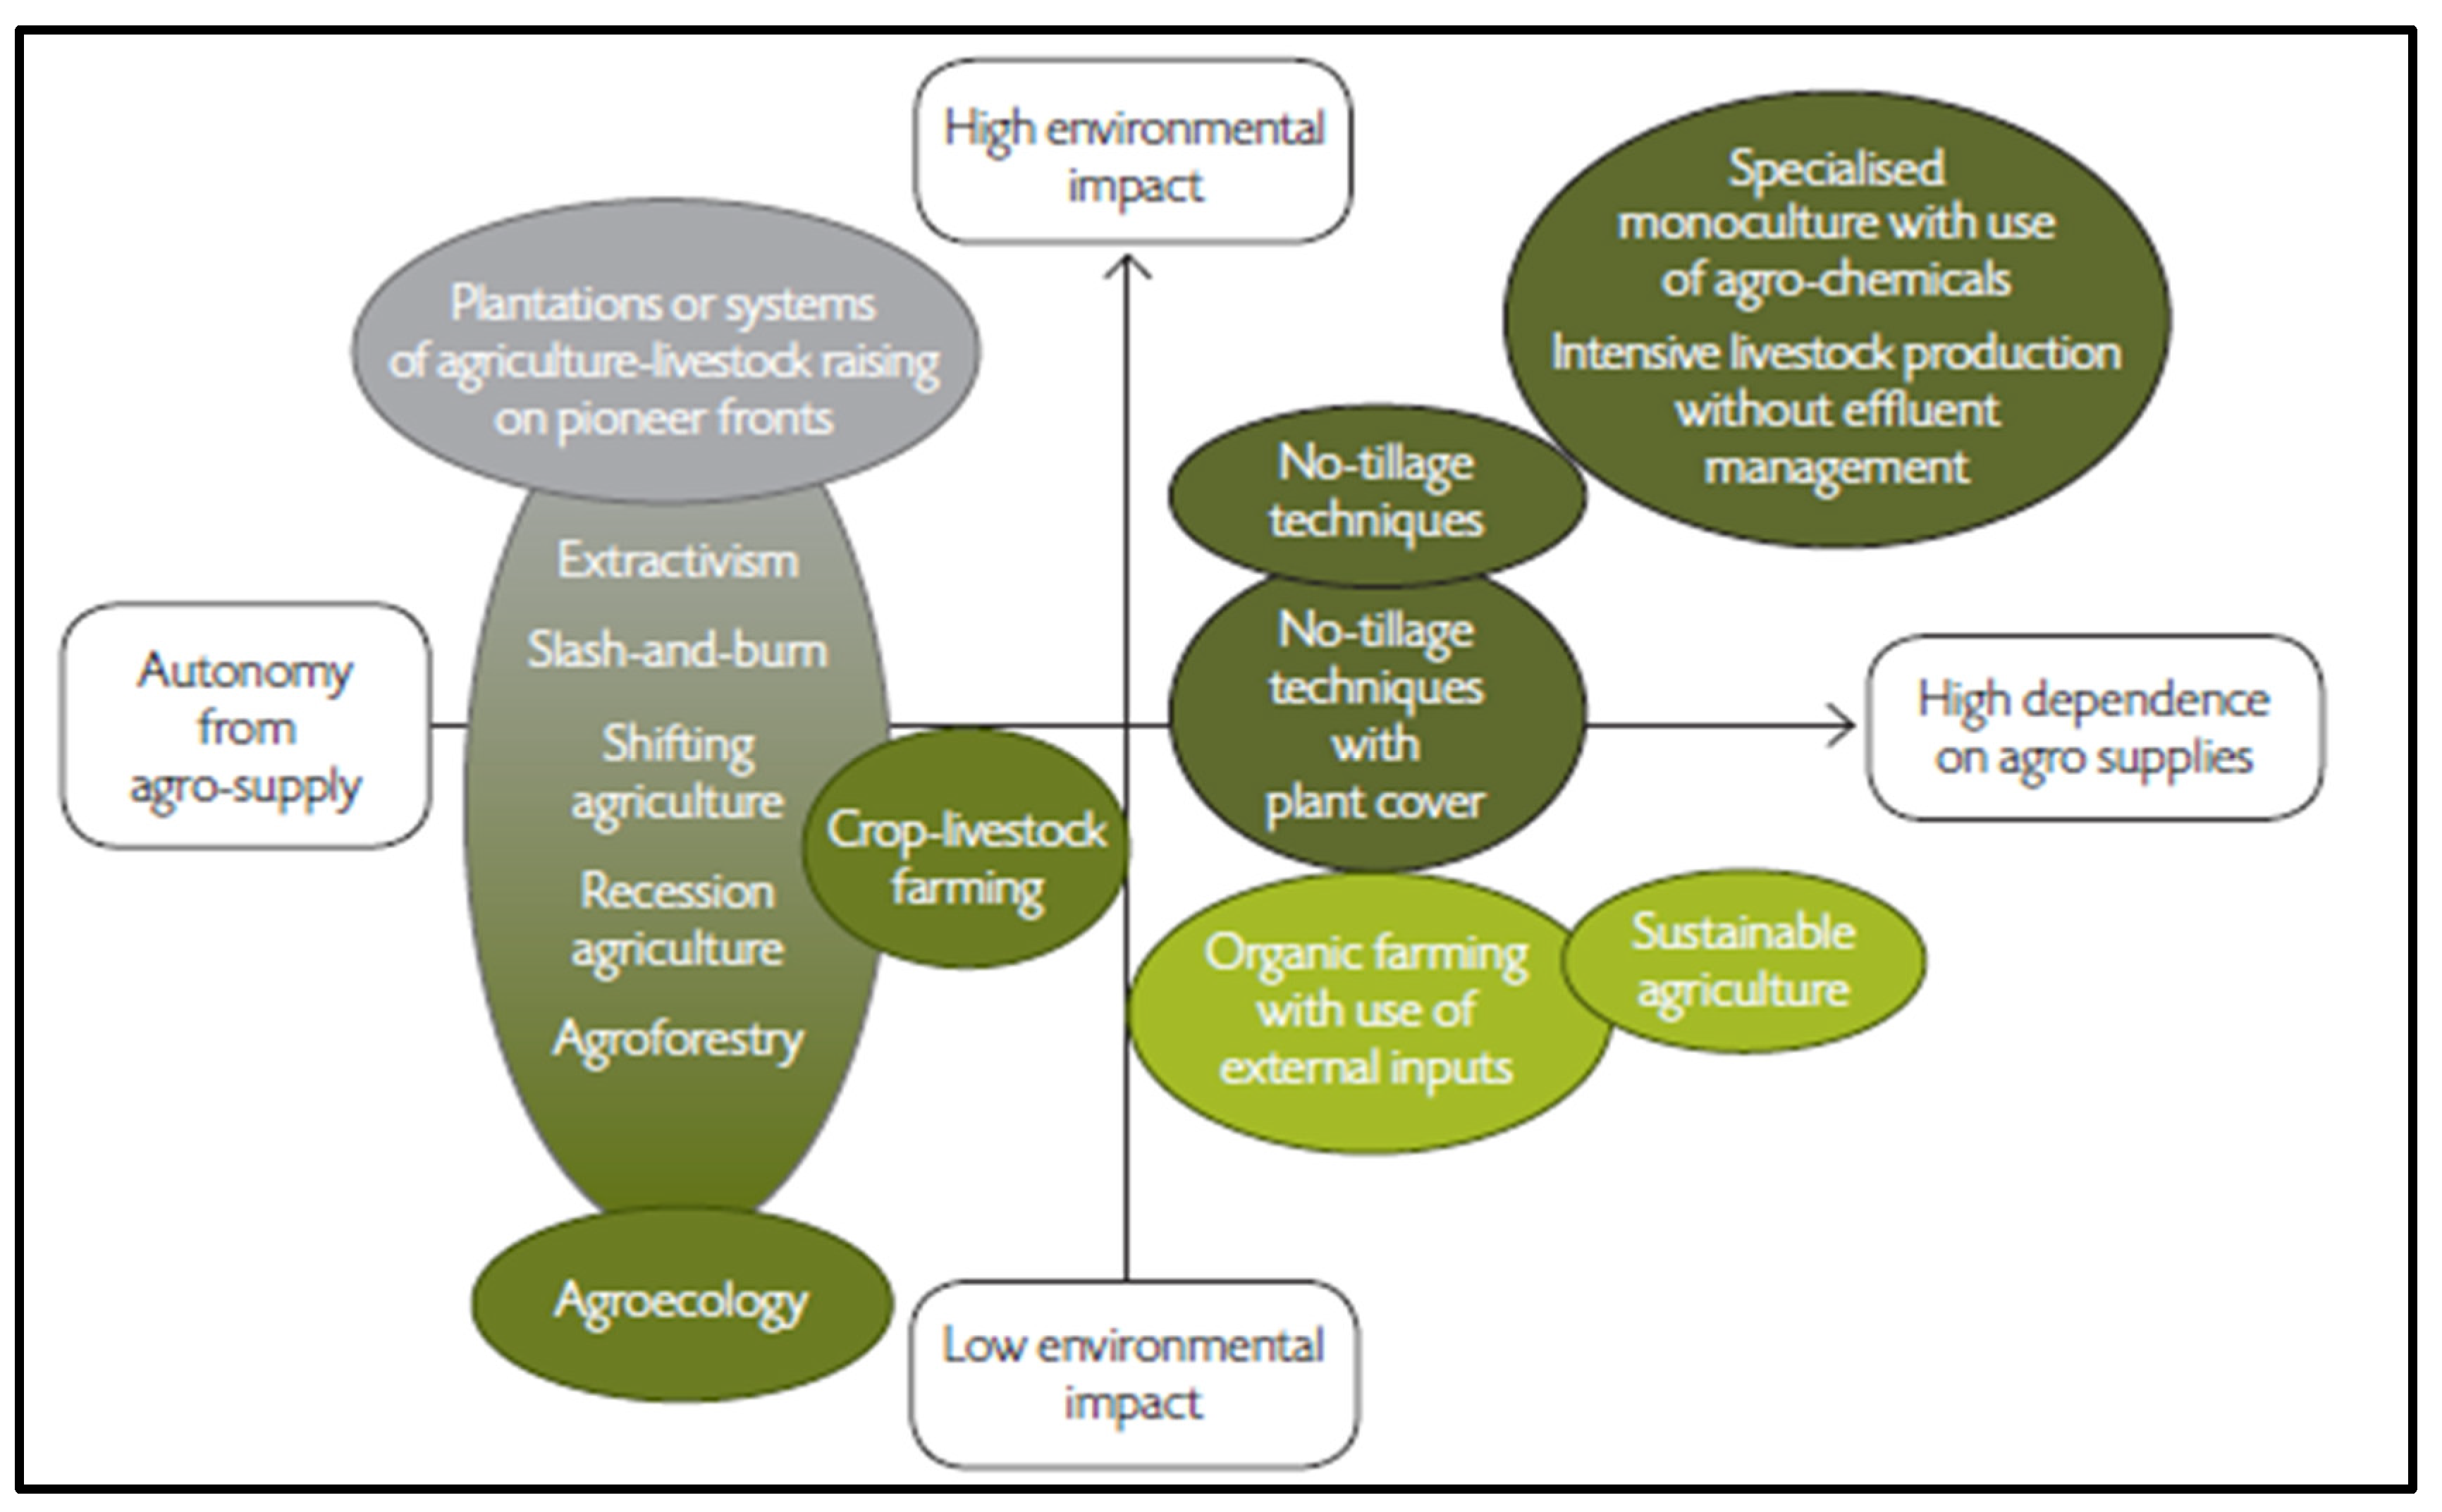
Figure 7.
Climate change and climate finance. Source: www.iberdrola.com.
Figure 7.
Climate change and climate finance. Source: www.iberdrola.com.
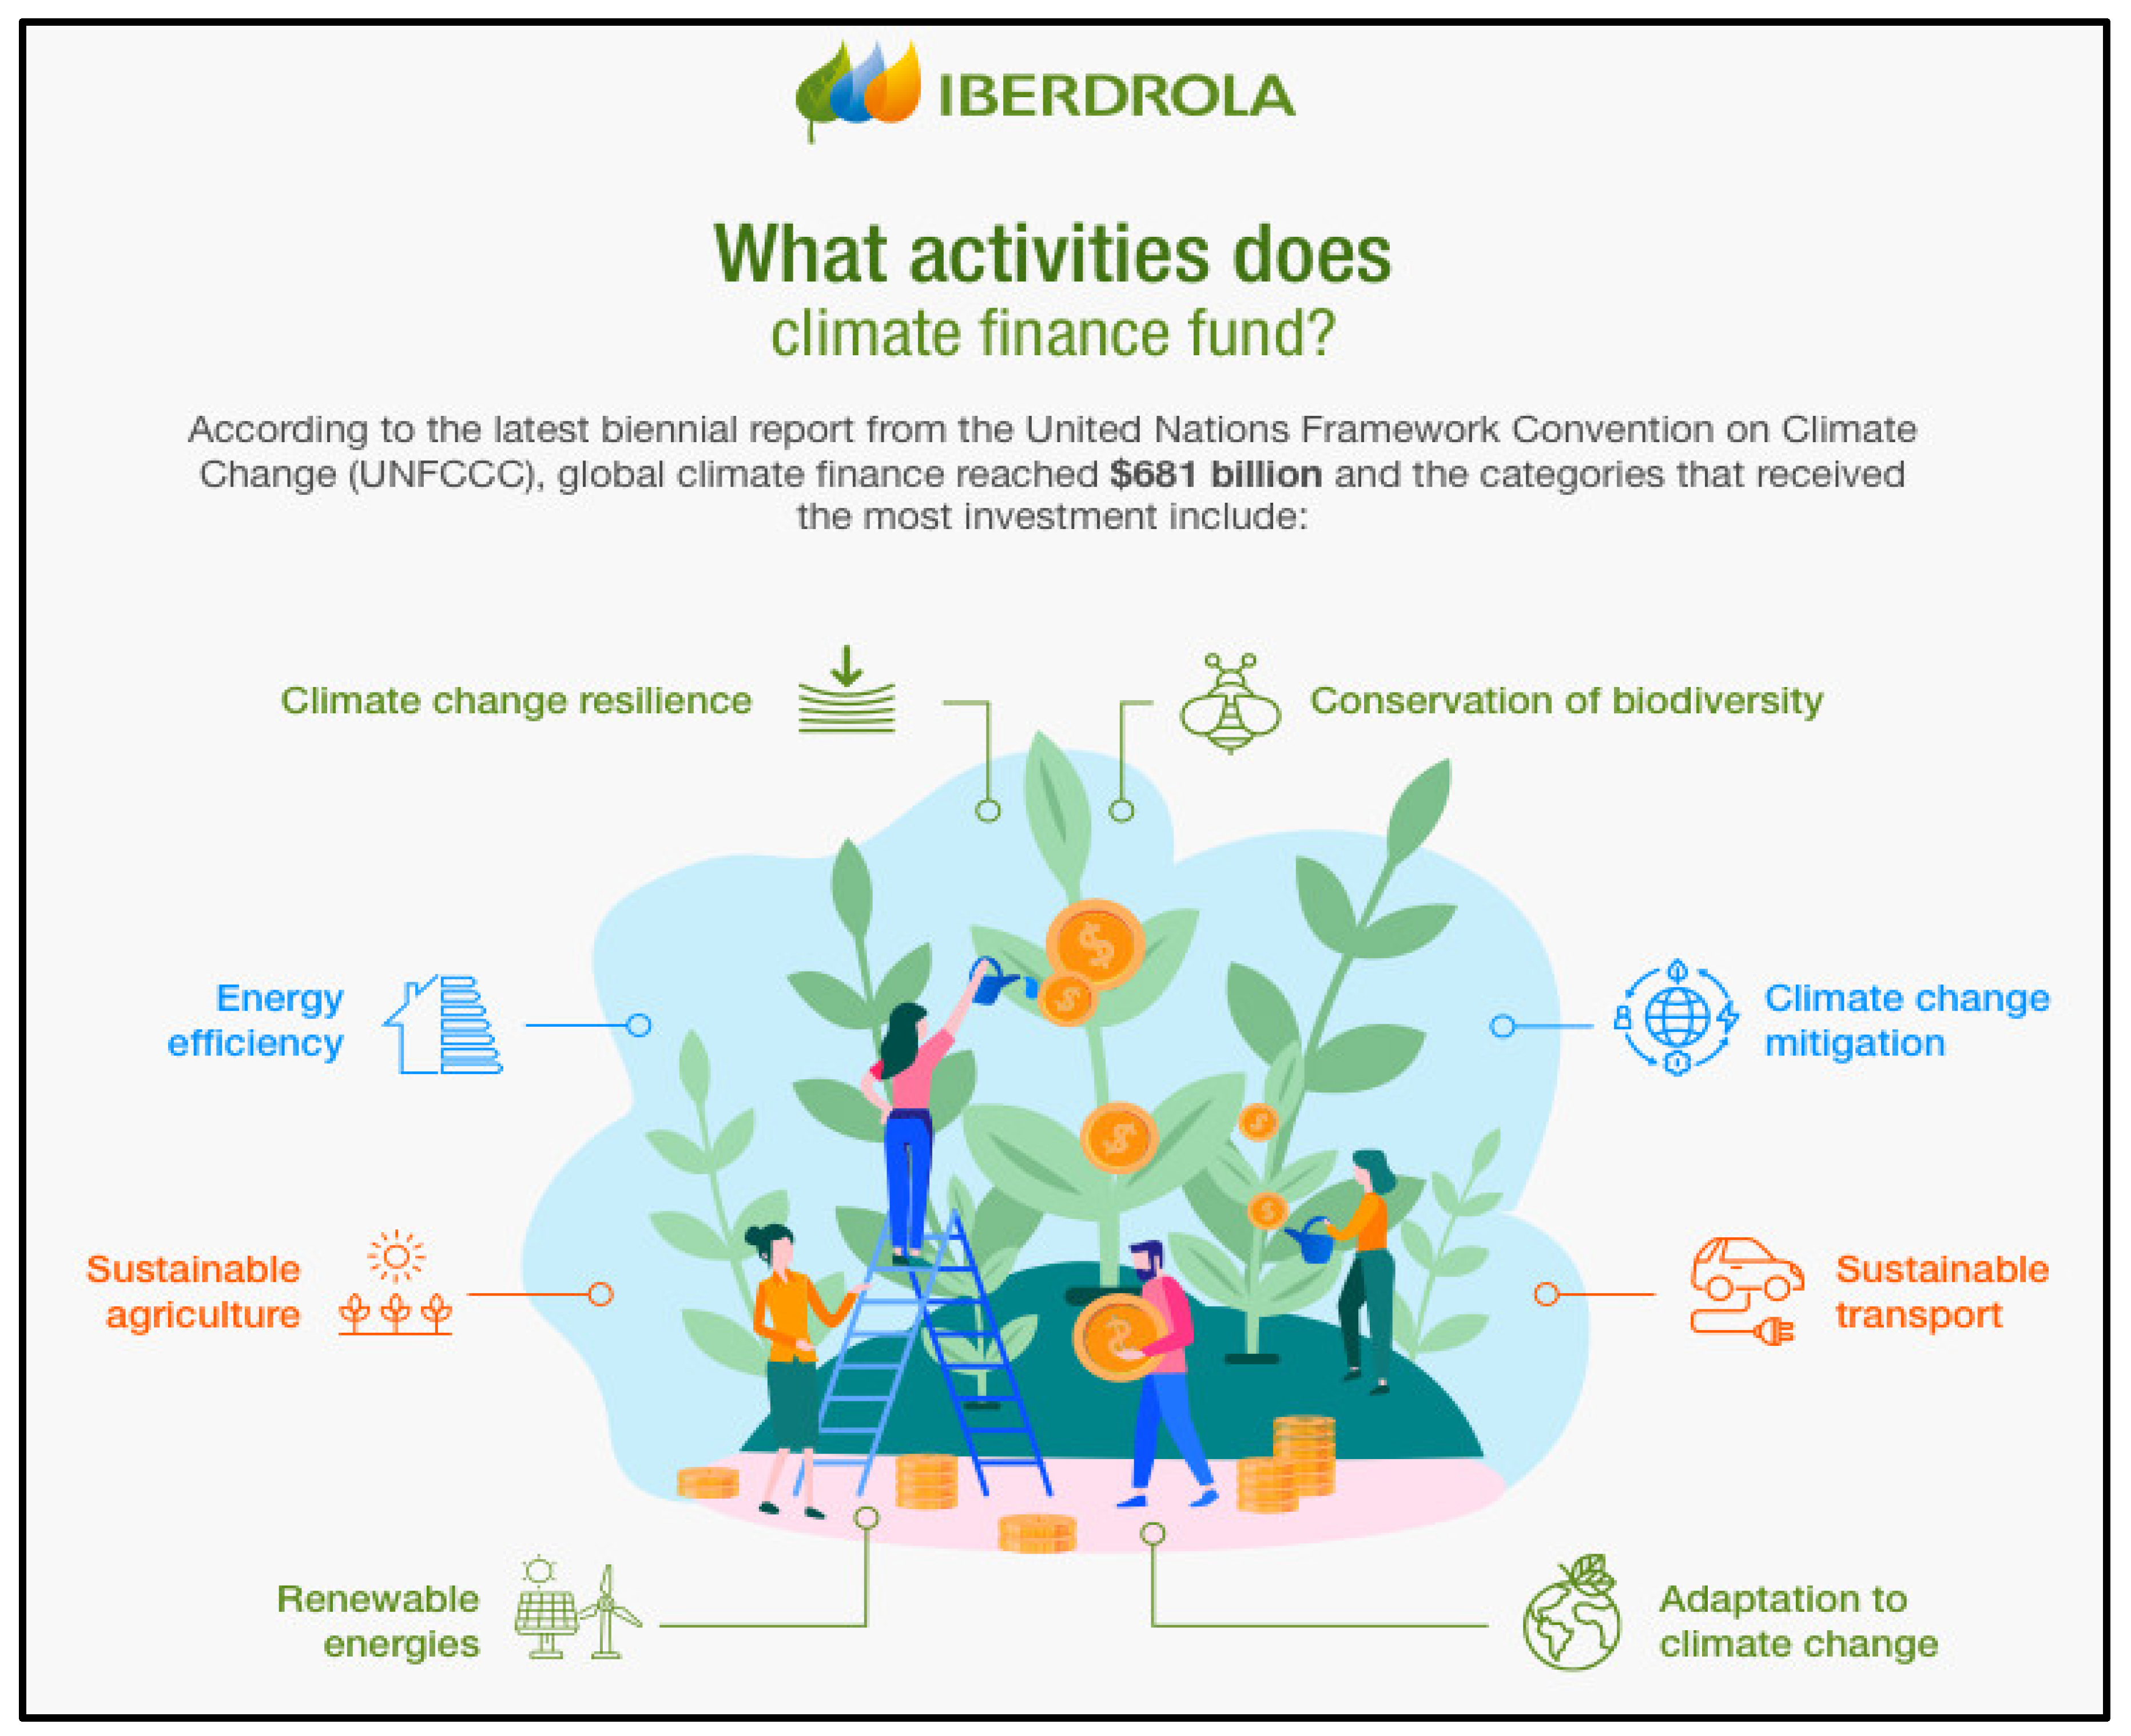
It is very important to take urgent action to combat climate change and assess its impact, including in the policy of innovative financial instruments.
Figure 8.
Climate finance provided and mobilized for developing countries, 2016–2019 (billions of dollars). Source: Organisation for Economic Co-operation and Development, 2021. Climate Finance provided and mobilised by developed countries: aggregate trends updated with 2019 data. Paris: OECD.
Figure 8.
Climate finance provided and mobilized for developing countries, 2016–2019 (billions of dollars). Source: Organisation for Economic Co-operation and Development, 2021. Climate Finance provided and mobilised by developed countries: aggregate trends updated with 2019 data. Paris: OECD.
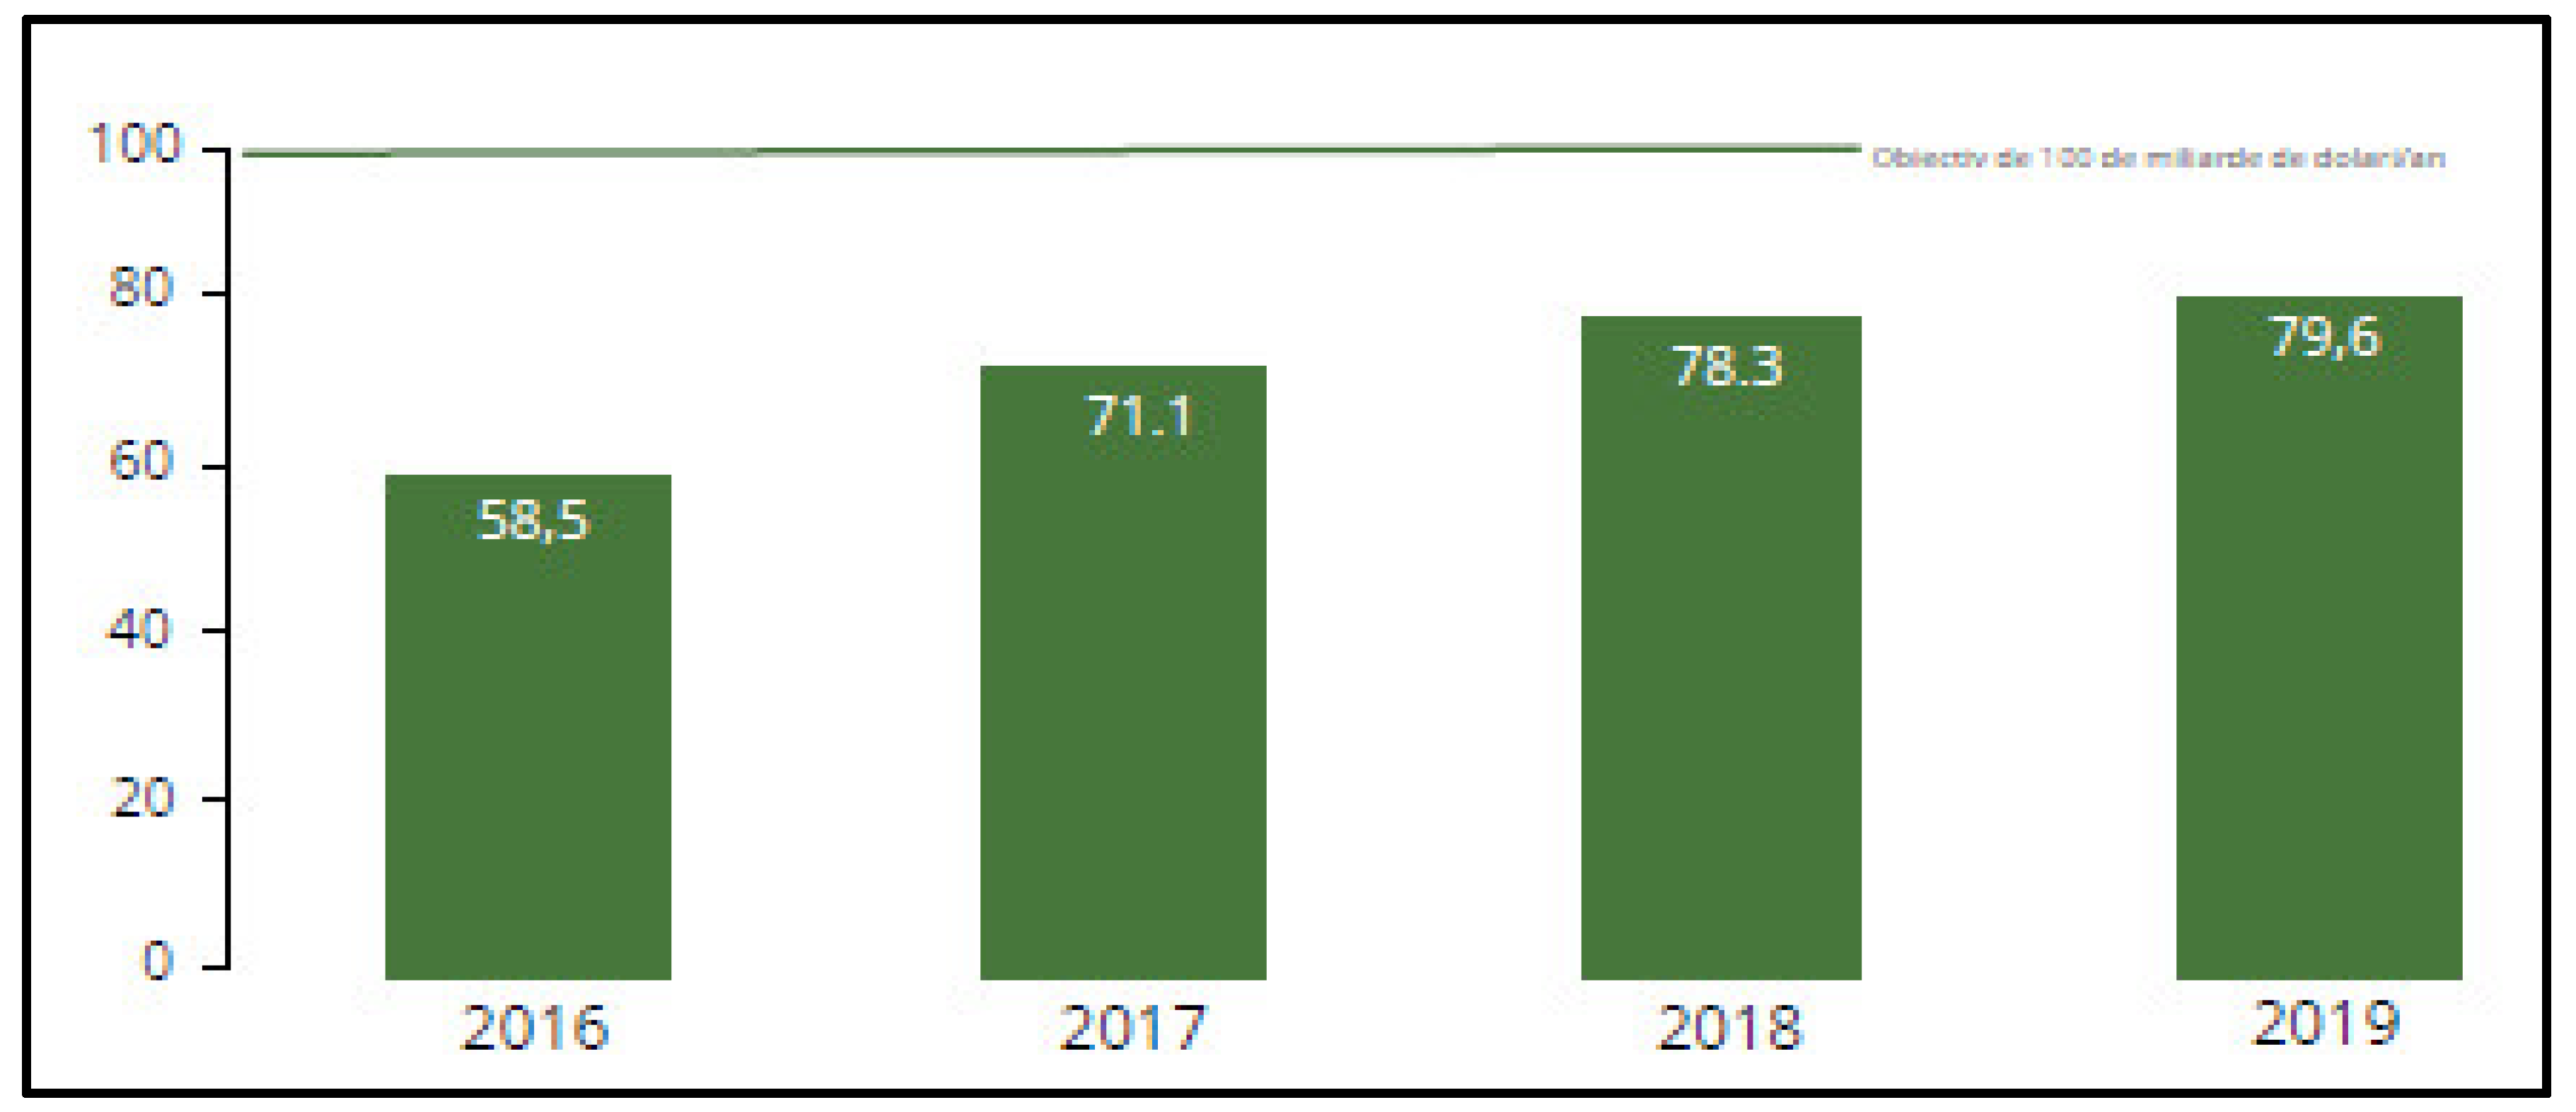
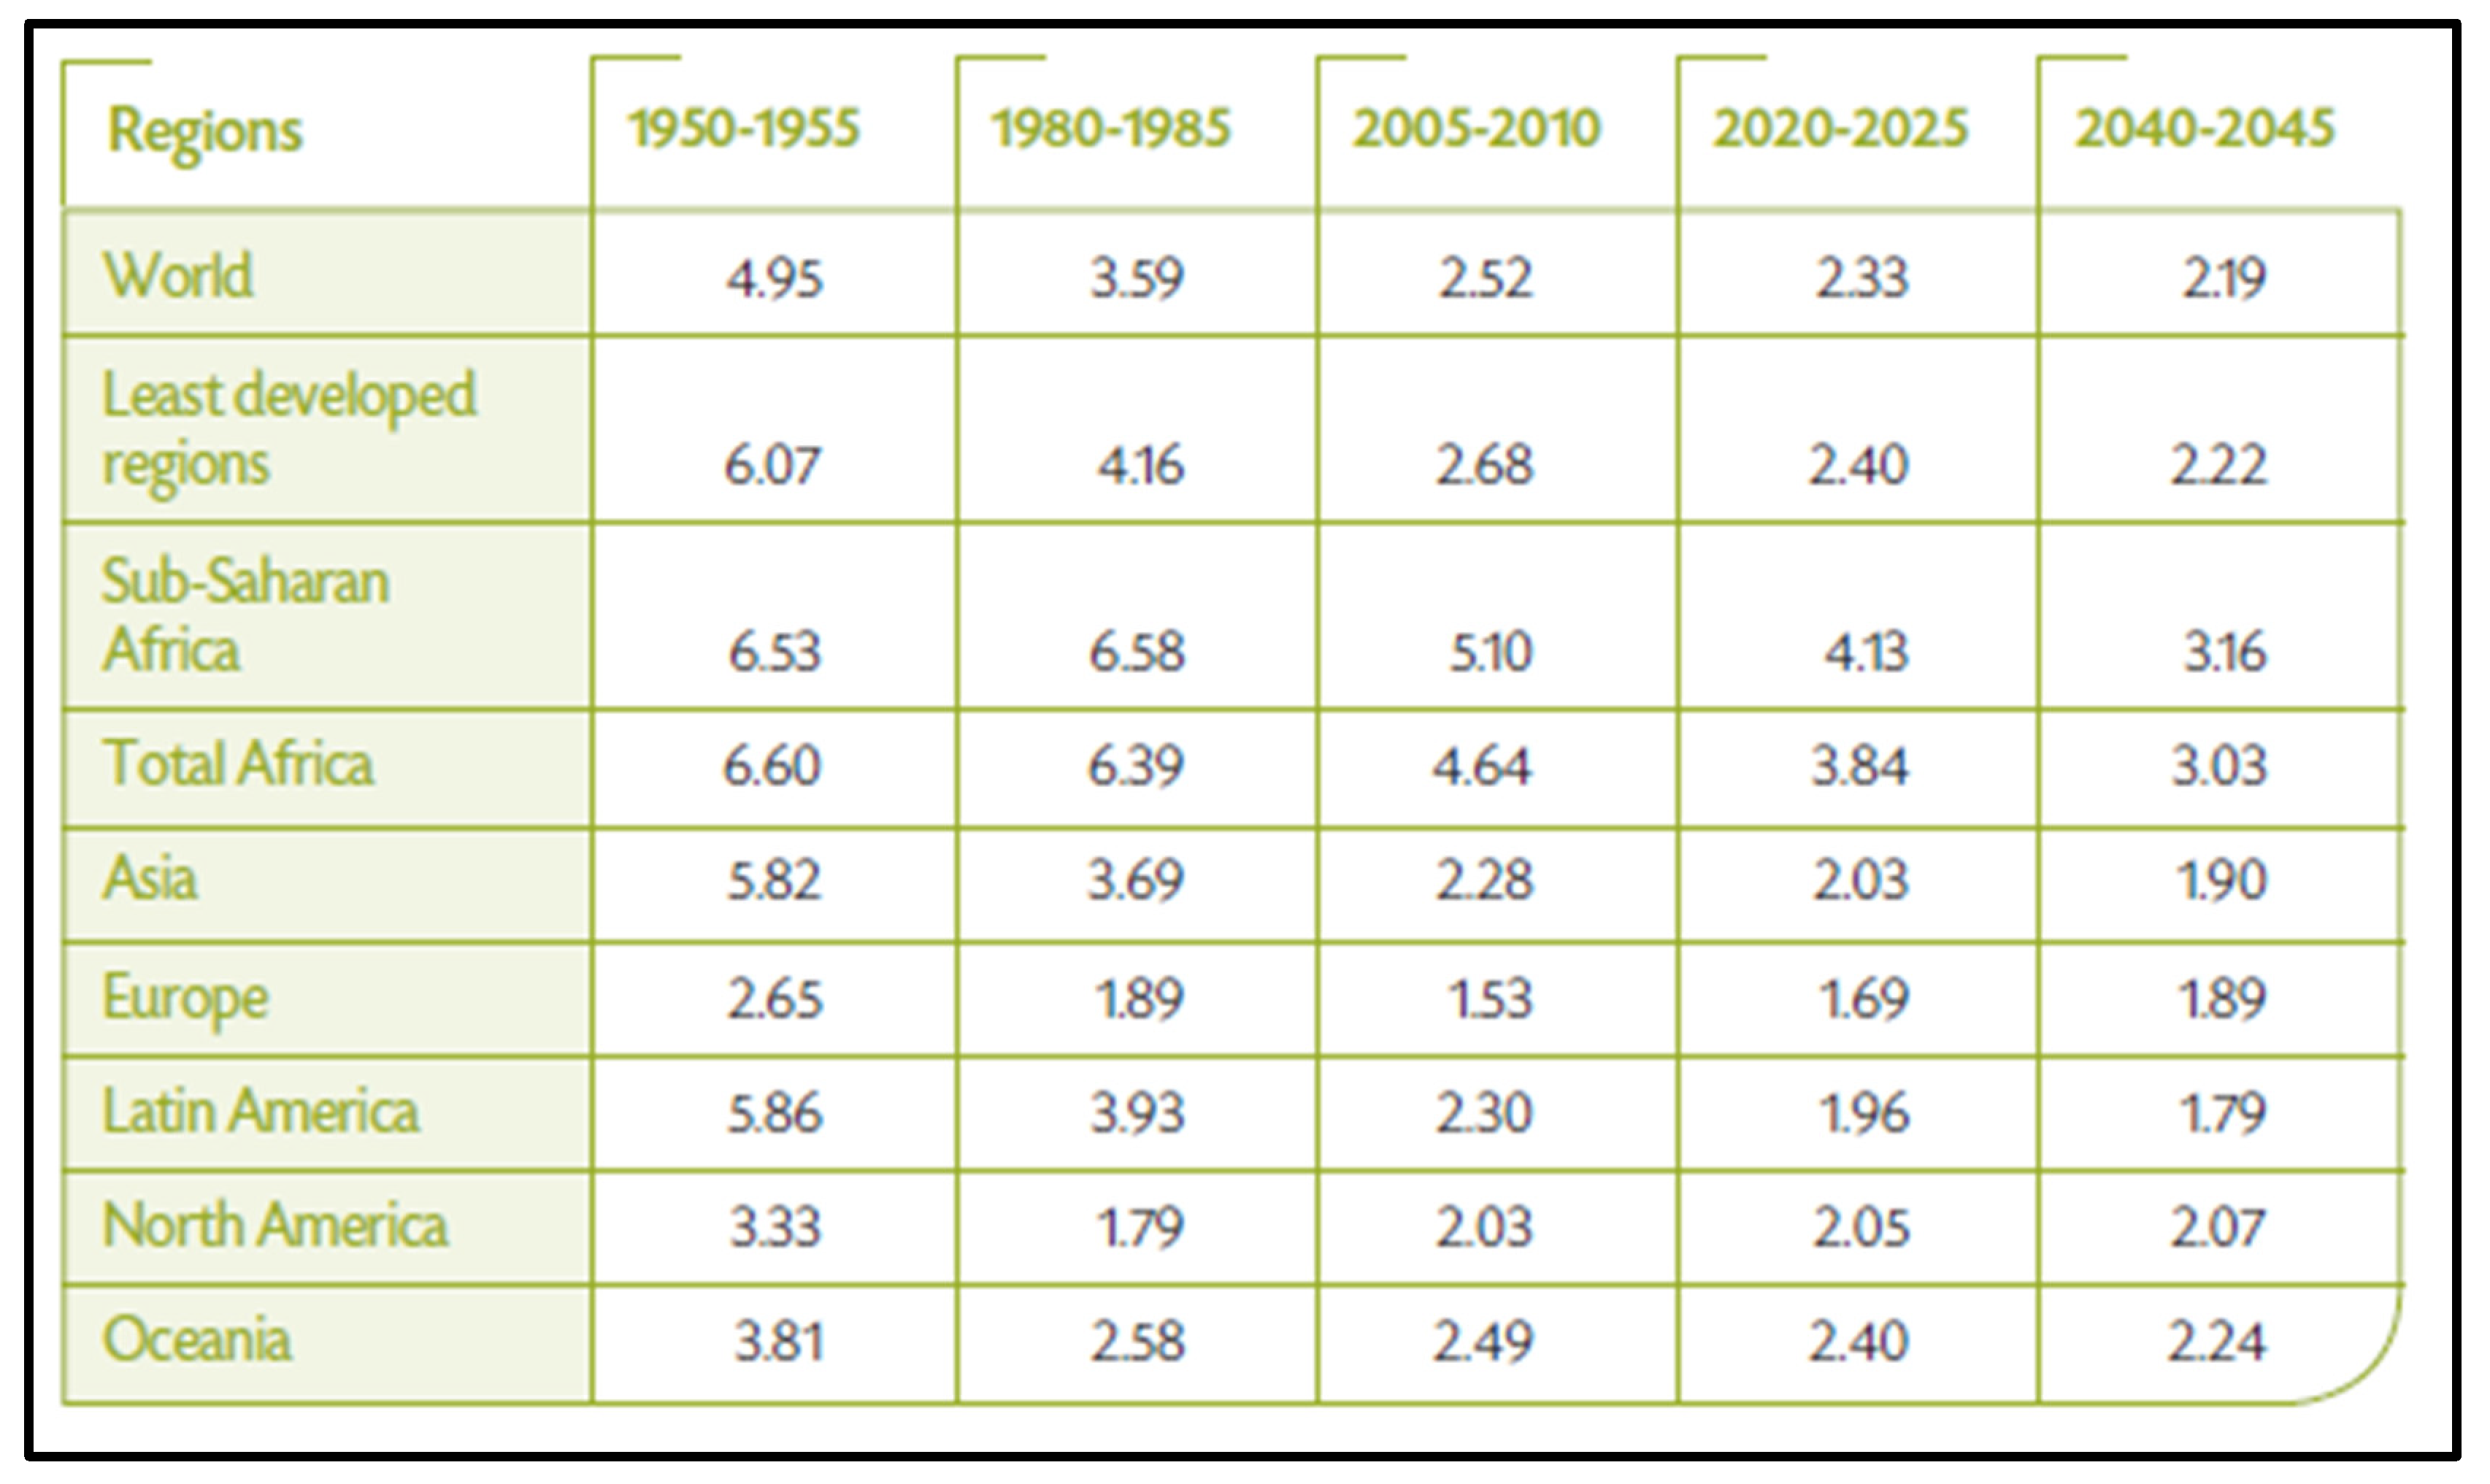
Table 5.
Children per woman by major world region and major period. (average estimate for the last two columns). Source: http://esa.un.org/wpp/Excel-Data/fertility.htm.
Table 5.
Children per woman by major world region and major period. (average estimate for the last two columns). Source: http://esa.un.org/wpp/Excel-Data/fertility.htm.
Eurostat published an analysis regarding the share of family farms in the EU for the year 2020. According to the statistics, 93% of the 9.1 million farms in the EU were family-run. Family farms are dominant in the agricultural structure in terms of the number of holdings, labor recruitment, and, to a lesser extent, the area of land cultivated. In Romania, 99% of all farms were family-run four years ago (in 2020).
In the European Union, in 2020, there were 9.1 million farms, with the overwhelming majority of them (about 93%) being classified as family farms (i.e., farms run by families where 50% or more of the agricultural labor force was provided by family members). Family farms dominate the agricultural structure in the EU in terms of the number of holdings, their contribution to agricultural employment, and, to a lesser extent, the area of land they cultivate and the value of the production generated, according to data published by Eurostat (https://ec.europa.eu/eurostat/web/products-eurostat-news/w/ddn-20231024-2).
99% of the farms in Romania are family-run. Nearly 6 in 10 farms (about 57%) were managed solely by the owner and family members. For another 36% of farms, family contributions accounted for at least 50% of the total labor.
The majority of agricultural land used in 2020 was managed by family farms (about 61% of the 157.4 million hectares in use), the majority of total agricultural labor (nearly 78%), a majority of animal farms (nearly 55%), and standard production (about 56%).
Family farms accounted for at least 80% of all farms in all EU countries, except for Estonia (65%) and France (58%). The EU countries with the highest shares of family farms were Greece, Romania, and Poland (all with about a 99% share of all farms).
Figure 9.
Specific characteristics of the programming periods 2014-2020, respectively 2021-2027.
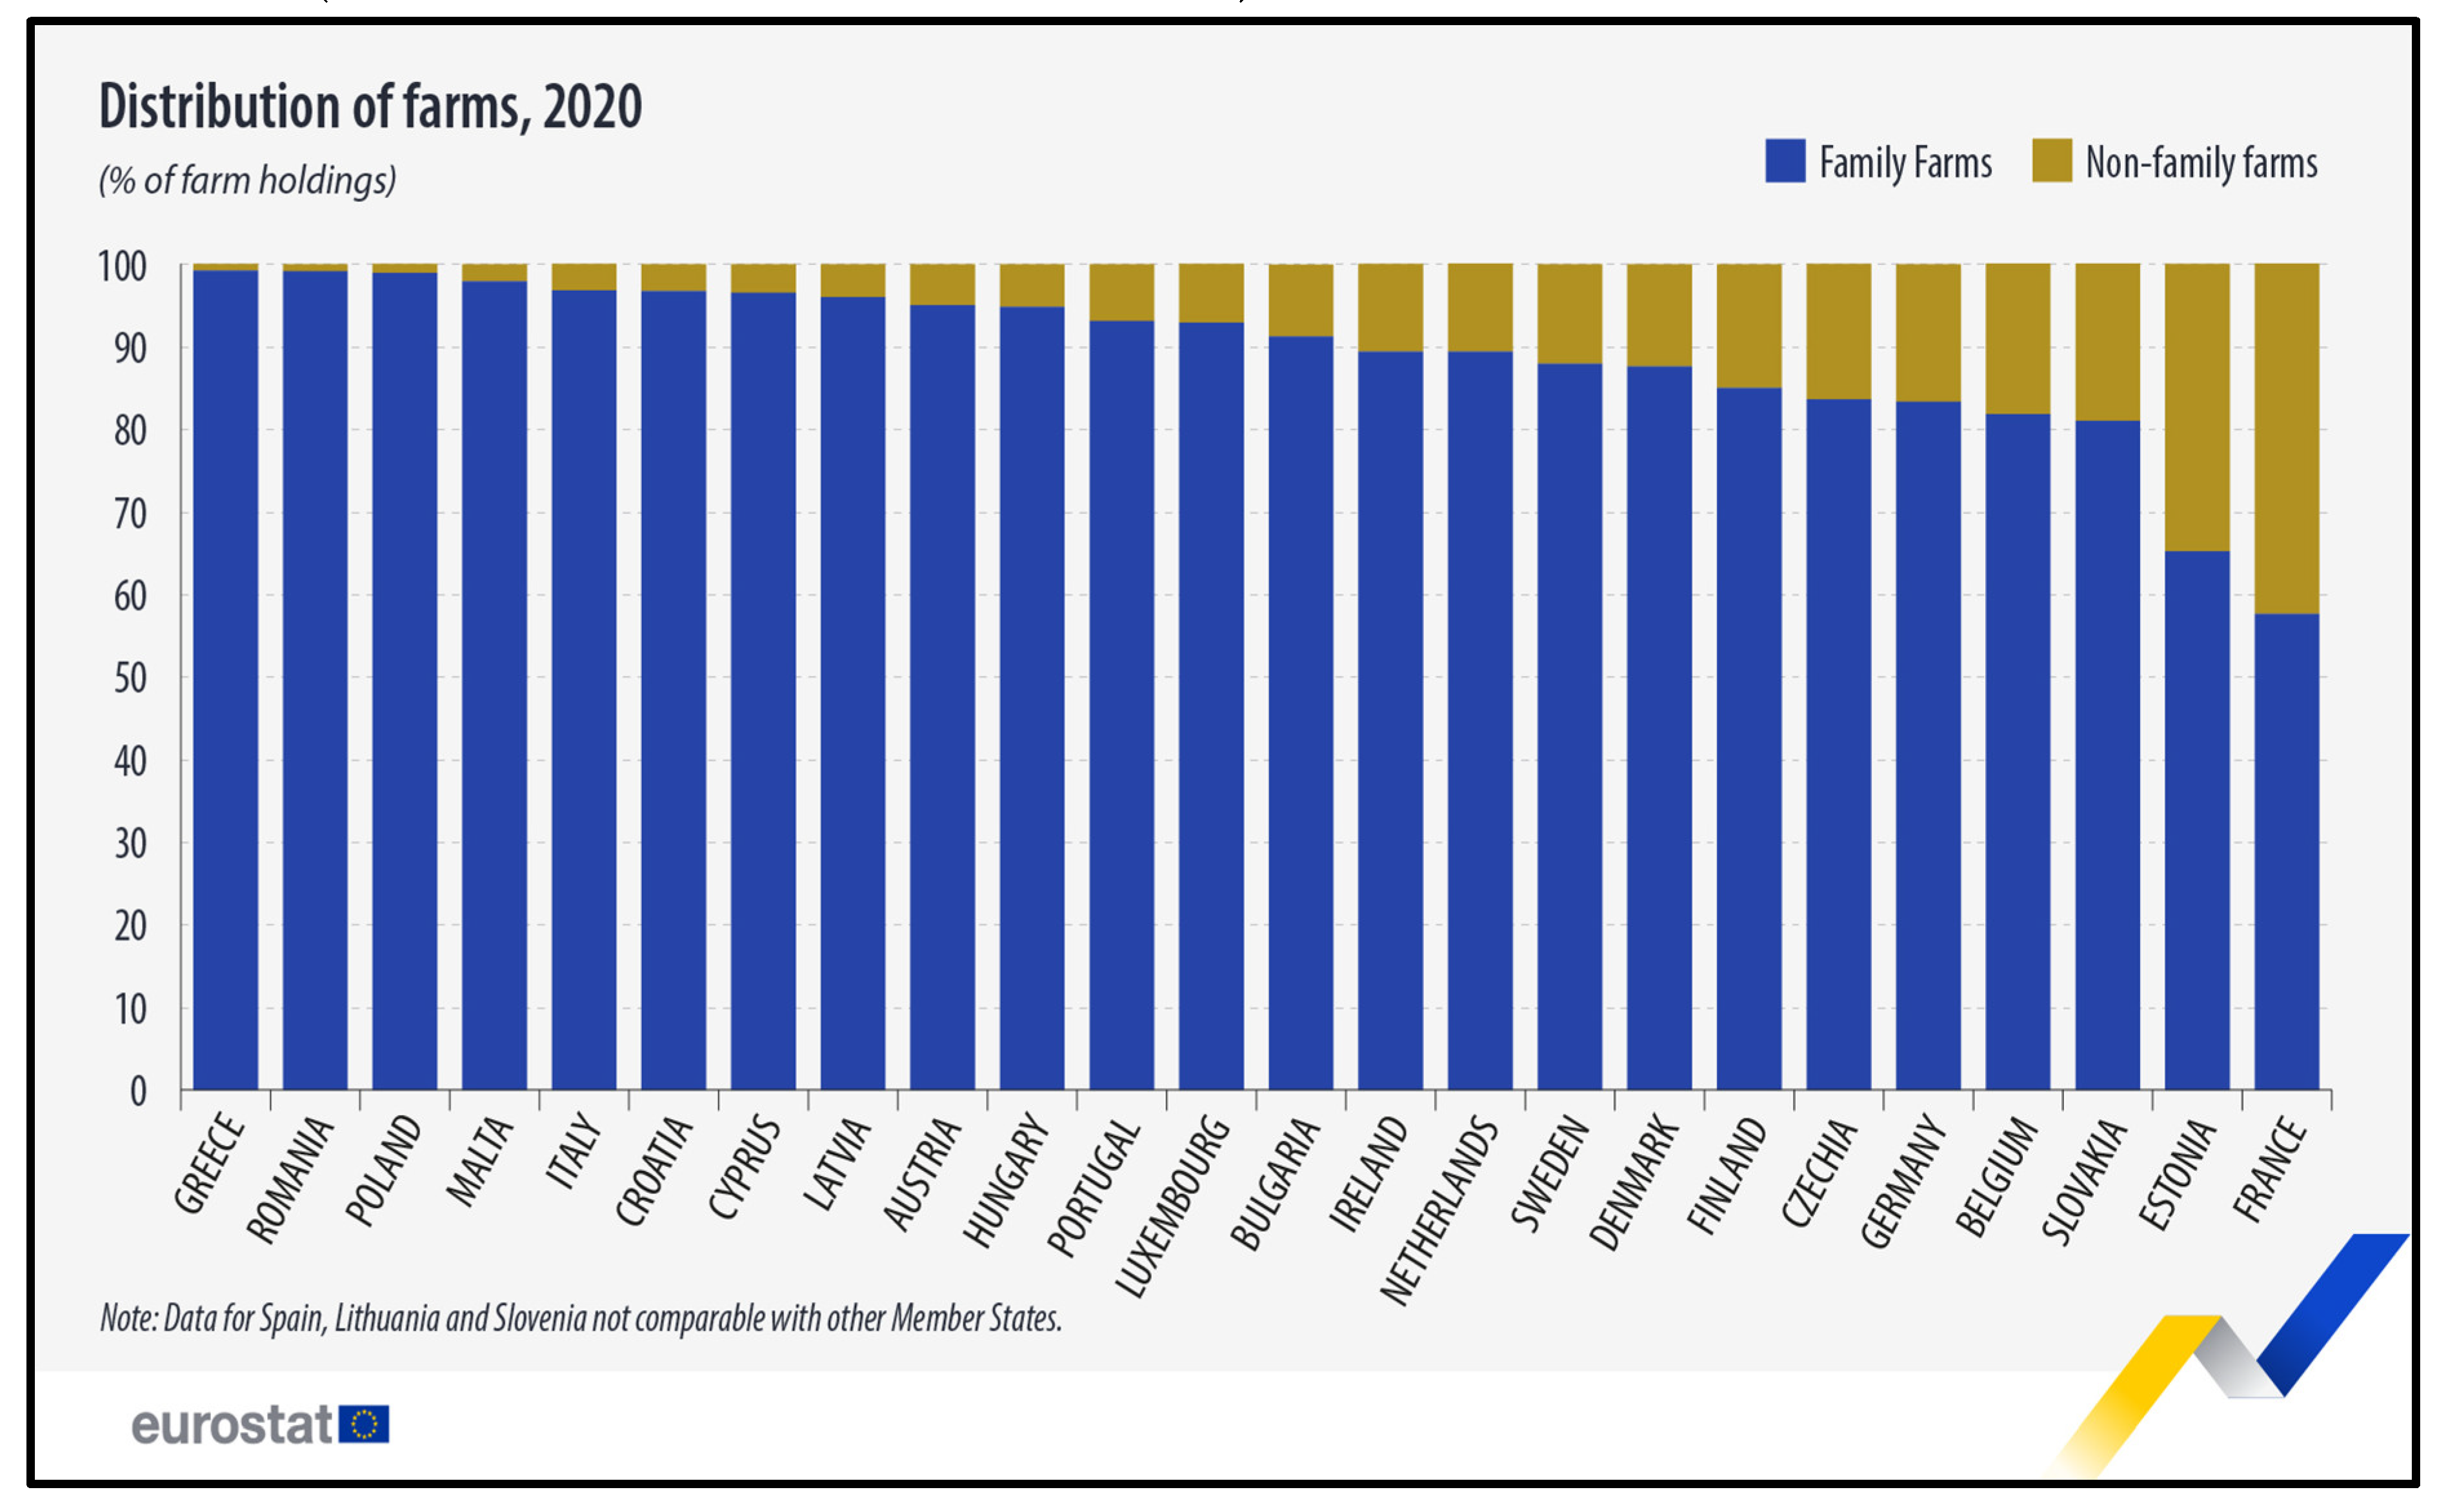
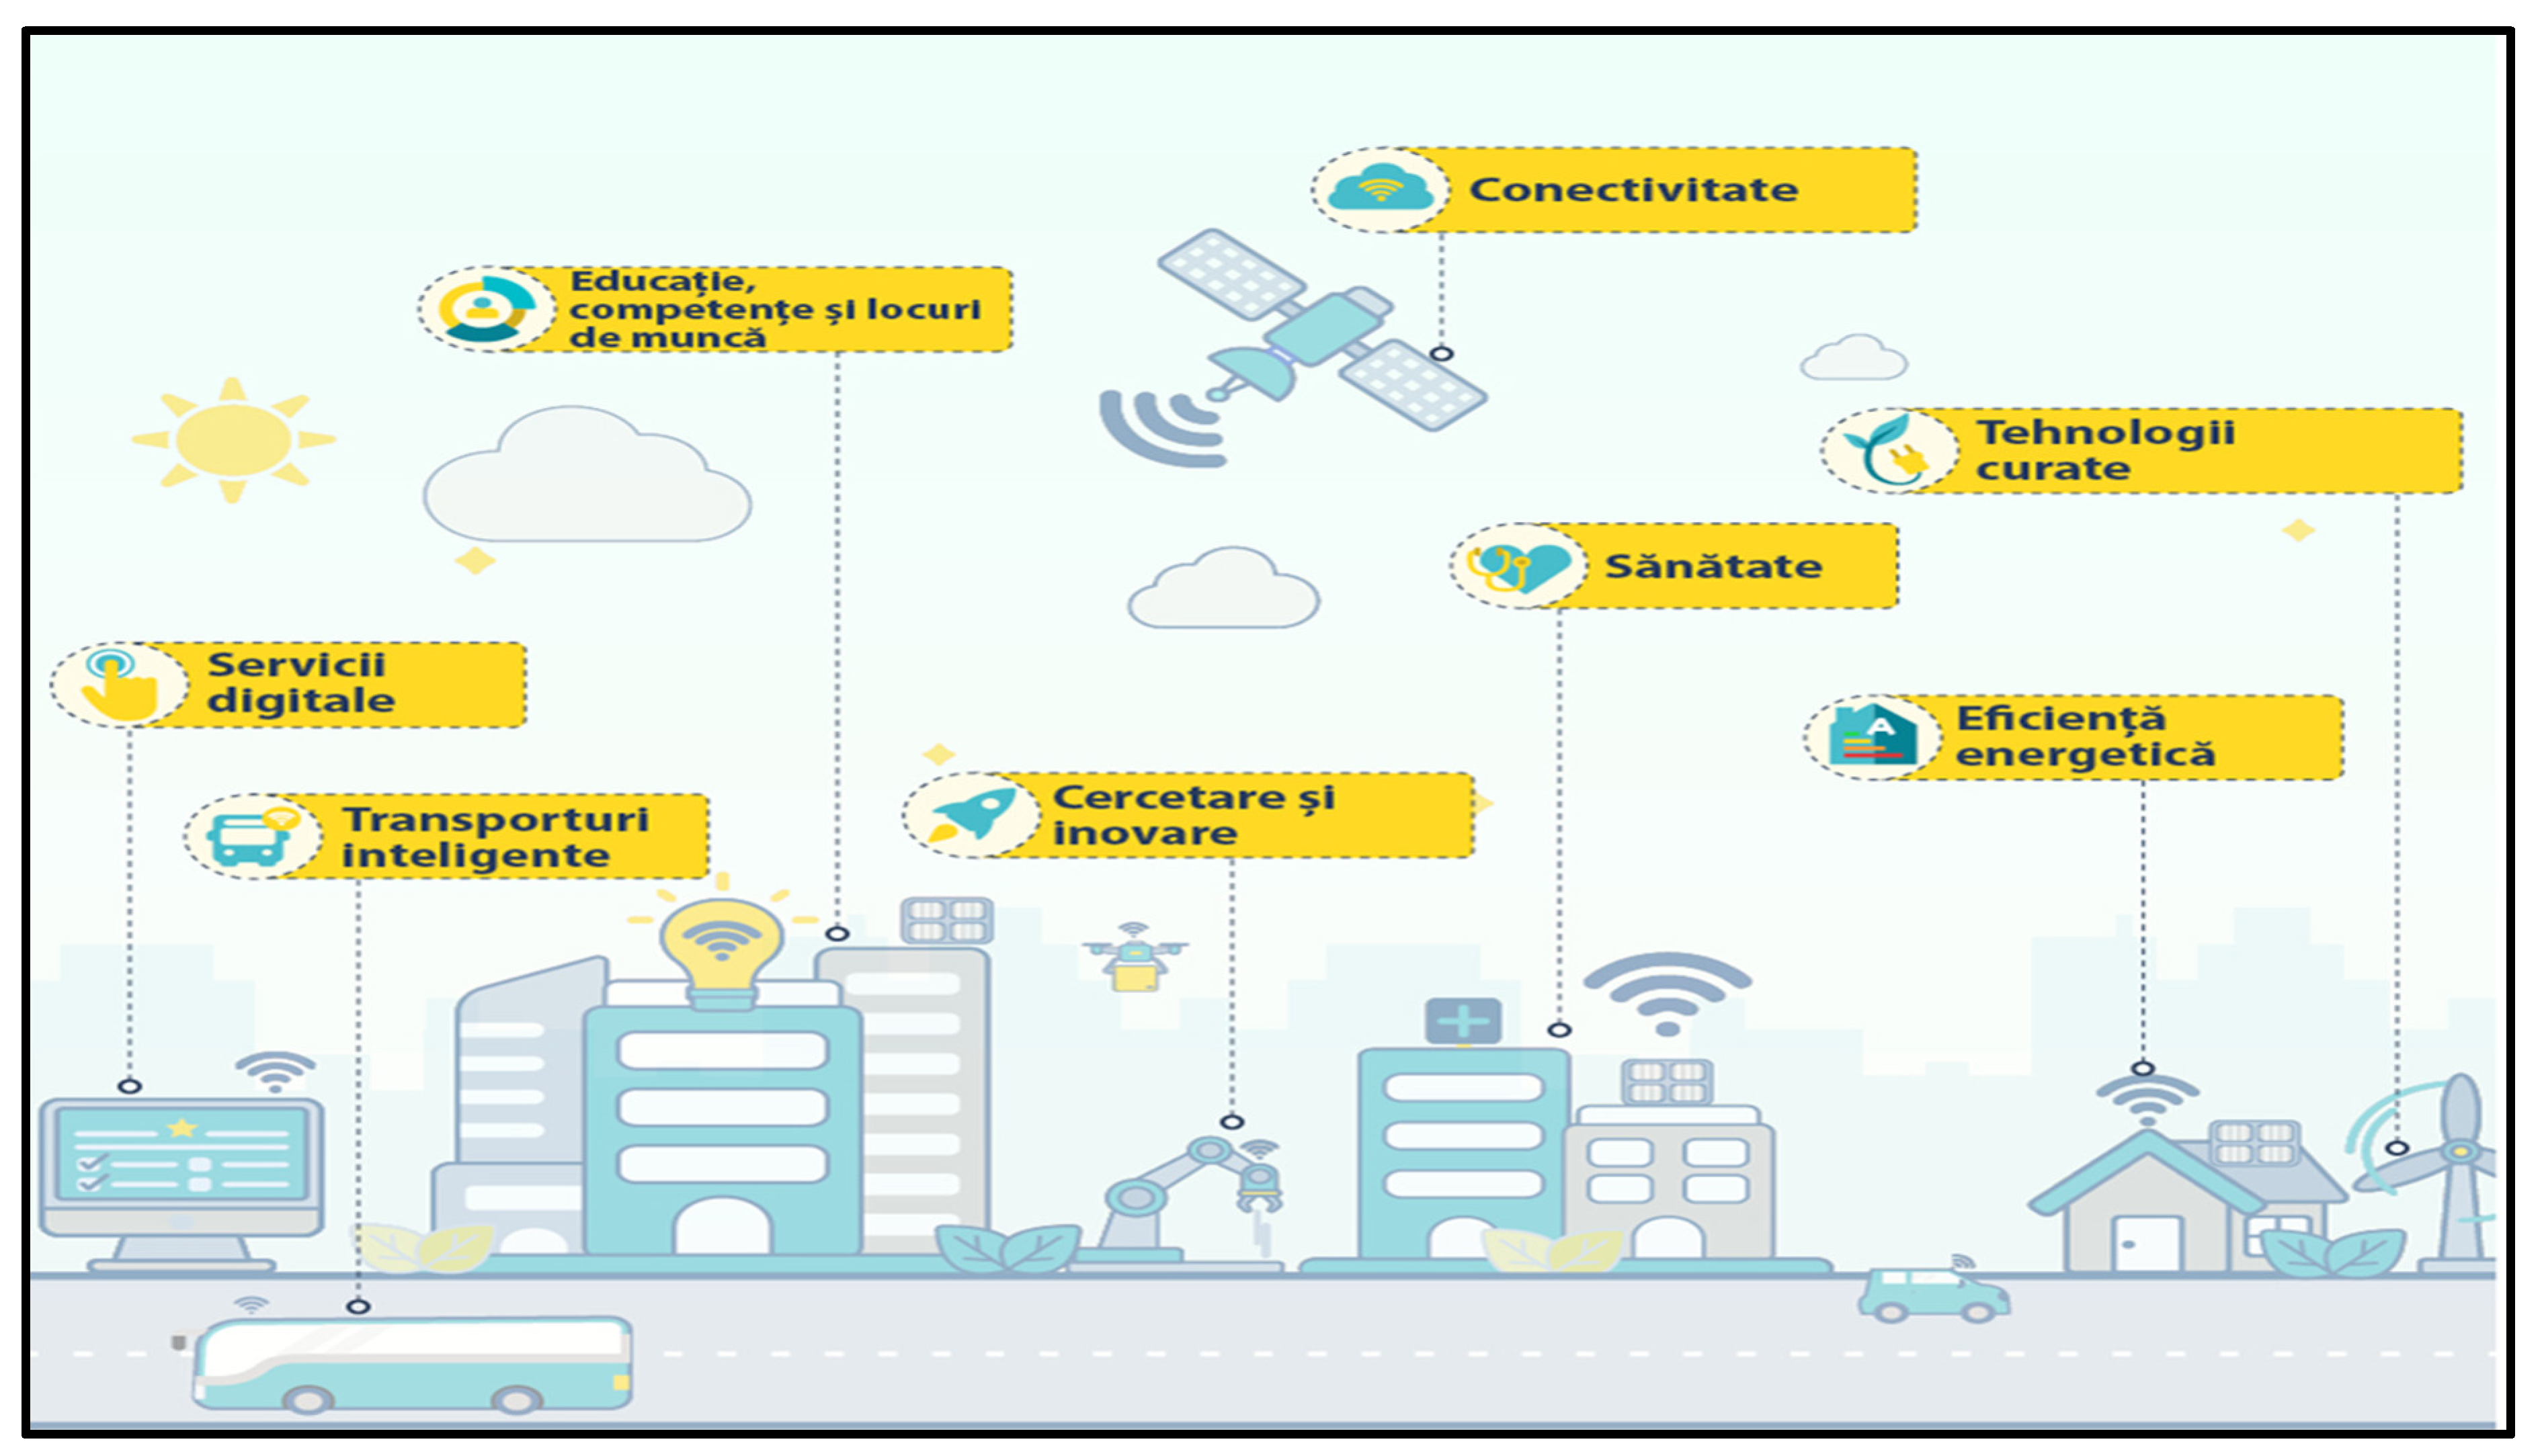
Figure 10.
Prezentarea domeniilor prioritare incluse în Planurile de redresare și reziliență la nivel național în perioada 2021-2025. Source: Data processing by the European Commission, 2020.
Figure 10.
Prezentarea domeniilor prioritare incluse în Planurile de redresare și reziliență la nivel național în perioada 2021-2025. Source: Data processing by the European Commission, 2020.
Relevant for defining the mechanism of Innovative Financial Instruments for Family Farms at the local level are the financial indicators of the population (primary and derived), and as an example, I mention:
Indicator: Financial Indebtedness Ratio of the Population (involved in family-type farms)
Symbol: Cip
Degree of synthesis: Derived indicator
Data source: Financial Accounts – BNR and Statistical Yearbook
Calculation formula: Cip = DTP / POP (1)
Explanation of the notation above:
DTP = total financial debts of the population, regardless of type (bank or non-bank), instrument, and institution, recorded at the end of the year.
POP = total population: a group of individuals united by citizenship ties and by establishing residence within the state’s territory, in relation to which the latter exercises its sovereign power. It represents the entire dataset from which a sample is selected, and with which the auditor wants to formulate conclusions, statistically evaluated at the end of the year, according to the data in the Statistical Yearbook.
Economic significance: The indicator highlights the financial debt per capita, the population’s borrowing capacity, which primarily depends on the quality of the financial system and the income level and purchasing power of the population. The indicator can be calculated either by stock or flow (debts incurred during the year).
Utility in economic analysis: It allows for an overall analysis, as well as by types of indebtedness (through derived detailed indicators) of the population’s borrowing capacity and enables a comparative analysis over time or space.
Use within the study: the indicator can be correlated with other generic indicators of savings and financial indebtedness of the population involved in family farms, as well as with specific indicators of the population’s financial condition. Additionally, the indicator can be integrated into the network of indicators evaluating the financial condition of the population involved in family-type farms, highlighting their interconnections and co-determinations in the perspective of a complex synthetic evaluation indicator.
Relevant for defining Innovative Financial Instruments for Family Farms at the local level are the financial indicators of the population (primary and derived), and as an example, I mention:Indicator: Financial Indebtedness Ratio of the Population (involved in family-type farms)
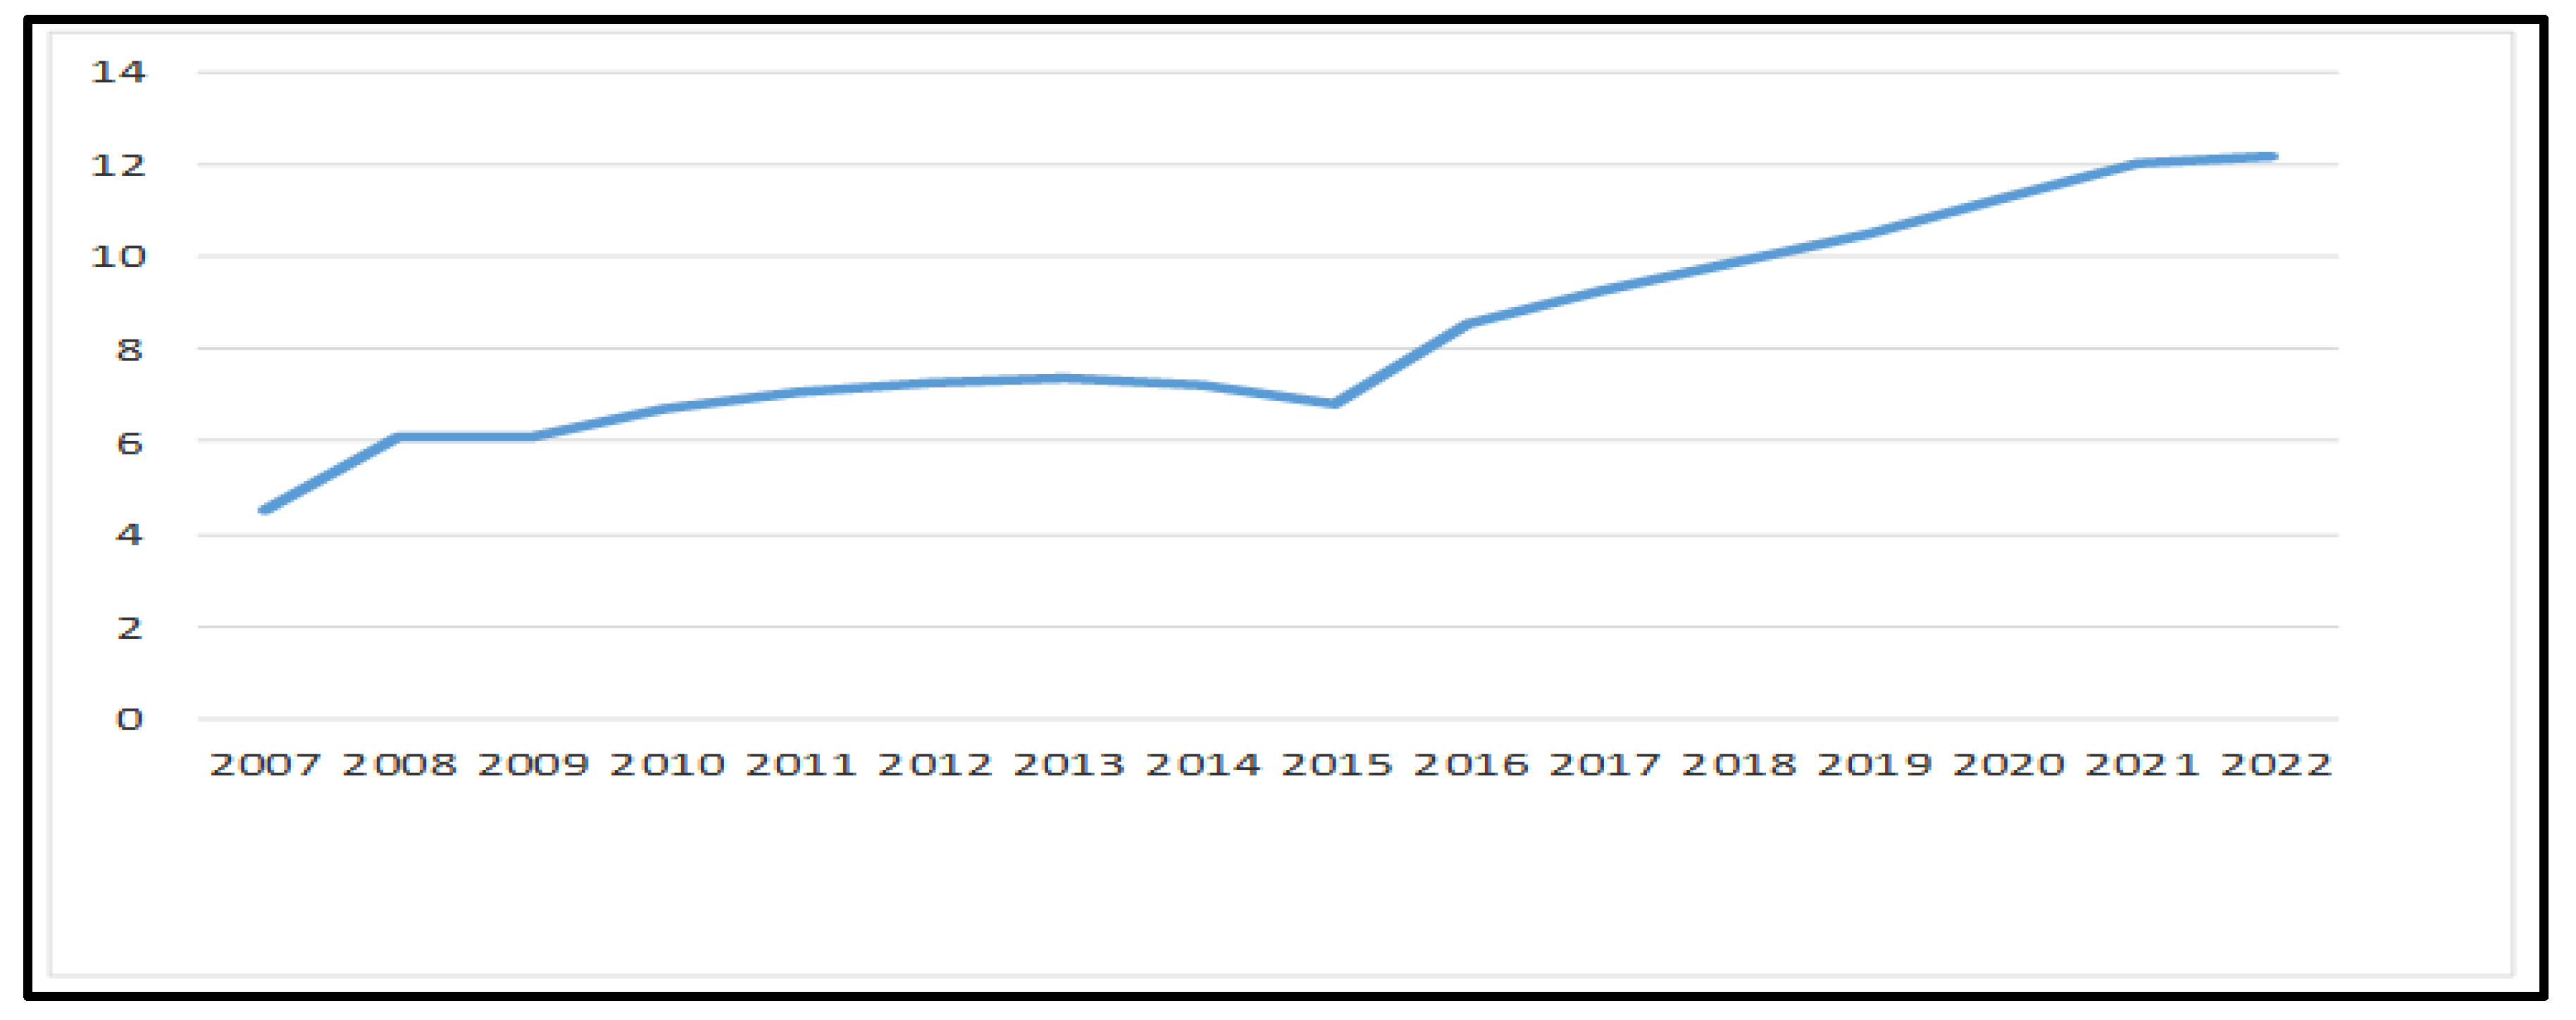
Table 6.
Evolution of the indebtedness ratio in the period 2007 – 2022.
| indicator | 2007 | 2008 | 2009 | 2010 | 2011 | 2012 | 2013 | 2014 | 2015 | 2016 | 2017 | 2018 | 2019 | 2020 | 2021 | 2022 |
| DTP th.lei | 101479 | 137544 | 137835 | 151112 | 158433 | 163460 | 165072 | 161484 | 151870 | 189838 | 205594 | 219986 | 233185 | 249,508 | 265831 | 267293 |
| POP th loc | 22562 | 22542 | 22516 | 22481 | 22434 | 22391 | 22346 | 22298 | 22242 | 22223 | 22215 | 22197 | 22175 | 22142 | 22047 | 21943 |
| Cip th lei/loc | 4,50 | 6,10 | 6,12 | 6,72 | 7,06 | 7,30 | 7,39 | 7,24 | 6,83 | 8,54 | 9,25 | 9,91 | 10,52 | 11,27 | 12,05 | 12,18 |
Figure 11.
Evolution of the population’s debt ratio during the period 2007 – 2022. Source: Own processing based on data published by the National Bank of Romania (from National Financial Accounts 2007 - 2021 and monthly bulletins from 2007 - 2023) and the National Institute of Statistics (Statistical Yearbook of Romania, 2007 - 2022 editions, Monthly Statistical Bulletin, 2007 - 2023, Press Releases), Financial Stability Report, 2007-2022 editions, BNR, Bucharest.
Innovative Financial Instruments for Family Farms at the Global Level
Microfinance
Financial instruments in the form of small loans provided to farmers for purchasing agricultural inputs, equipment, or infrastructure improvements. Special microcredit programs are developed by international financial institutions to provide farmers with adequate financial resources. For example, the International Fund for Agricultural Development (IFAD) provides microloans in developing countries.
Agribusiness Venture Capital (VC)
Innovative financial instruments in the form of venture capital investments in agricultural start-ups and innovative farms. For example, investments in agri-tech (agricultural technology) offer innovative solutions for family farms (Finca and other financial institutions).
Crowdfunding Platforms
Innovative financial instruments in the form of fundraising through small contributions from a large number of people, often through online platforms. For example, platforms like Kiva offer family farmers funding opportunities via crowdfunding.
Index-Based Insurance
Innovative financial instruments in the form of agricultural insurance that rely on indices (such as precipitation or temperature) to determine compensation, instead of directly assessing losses. A relevant example is Swiss Re and other companies that offer index-based insurance products for small farmers.
Green Bonds
Innovative financial debt instruments issued to finance projects with environmental benefits, including sustainable agricultural projects. For example, the World Bank issues green bonds that can finance environmentally friendly agricultural projects.
Impact Investment Funds
Funds that invest in agricultural projects with social and environmental objectives, in addition to financial returns. An example is impact funds supporting sustainable agriculture and small farmers.
Innovative Financial Instruments for Family Farms at the European Level
Subsidies and European Funds
Innovative financial instruments in the form of grants and non-repayable funding granted to family farmers through programs like the Common Agricultural Policy (CAP). Examples: The European Agricultural Fund for Rural Development (EAFRD) provides financial support for the modernization of family farms.
Guarantee Financial Instruments
Innovative financial instruments in the form of credit guarantees for loans granted to farmers, aiming to reduce the risk for financial institutions providing loans. For example, the Progress Microfinance Initiative provides guarantees and microloans to family farmers.
Social Bonds
Innovative financial instruments in the form of bonds issued to finance projects with a positive social impact, including rural development and support for family farms. An example is bonds issued by the European Investment Bank (EIB) for sustainable agricultural projects.
Payments for Ecosystem Services (PES)
Innovative financial instruments in the form of direct payments to farmers for the maintenance and improvement of ecosystem services, such as biodiversity and water quality. Examples: Ecosystem services payment schemes implemented in countries such as Germany and France.
Innovative Financial Instruments for Family Farms at the European Level
Rural Development Bonds
Innovative financial debt instruments aimed at financing rural development and sustainable agriculture. For example: Bonds issued by governments or European financial institutions for rural development projects.
Public-Private Co-Financing Programs (PPP)
Initiatives involving collaboration between the public and private sectors to finance agricultural projects. Examples: Partnerships between national governments and commercial banks or agri-tech companies to support family farms, such as the “Farmer Program” in Romania.
Innovative financial instruments for family farms range from microfinance and crowdfunding platforms to index-based insurance and impact funds at the global level. In Europe, subsidies, financial guarantees, social bonds, and public-private co-financing programs play a crucial role in supporting family farms and sustainable agriculture. These instruments are essential to ensure the economic viability and environmental sustainability for small farmers.
This paper highlighted the diversity and complexity of the financial instruments available for family farms at the global level, analysing their challenges and opportunities. Family farms are essential for global food security and rural economic development, but they face specific financial constraints that require tailored solutions.
Conclusions
Diversity of financial instruments, as there is a wide range of financial products available for family farms, from traditional loans and microfinance to grants, insurance schemes, and innovative digital financial instruments.
Accessibility to these instruments varies significantly depending on the region and specific context of each farm. The effectiveness of these innovative financial instruments depends on their adaptation to the specific needs of farmers.
Financial instruments have a direct impact on the sustainability and growth of family farms, contributing to their resilience in the face of economic and climate risks.
Case studies analysed identified best practices in the implementation of financial instruments but also common pitfalls, such as the complexity of application processes or lack of financial literacy among farmers.
Public policies play a crucial role in enhancing financial inclusion and resilience for family farms. Government support and public-private partnerships are essential for developing effective and accessible financial instruments.
Personal Recommendations
Development and promotion of microfinance: an appropriate financial instrument for family-type farms. Promote microfinance as a viable solution for small farms, focusing on simplifying access procedures and providing financial education for farmers.
Creation of Public-Private Partnerships: encourage partnerships between governments, financial institutions, and non-governmental organizations to develop and implement innovative financial instruments.
Adaptation of financial instruments to local realities: develop tailored financial solutions that respond to the specific needs of family farms in various regions, considering local economic and social contexts.
Promotion of the collaborative economy: integrate the concepts of the collaborative economy in the development of financial instruments for family farms to promote sustainability and resource efficiency.
Education and training for farmers: implement financial education and training programs to increase farmers’ capacity to access and effectively use available financial instruments.
Support for technological innovation: support technological innovations in agriculture through dedicated funding and partnerships with agri-tech companies to improve the productivity and sustainability of family farms.
Therefore, innovative financial instruments play a crucial role in supporting family farms, contributing to their sustainable and inclusive development. By adapting instruments to the specific needs of farmers and implementing effective support policies, the resilience and economic growth of family farms can be stimulated globally and in Europe.
Research Limitations
The accessibility and effectiveness of financial instruments are highly dependent on the geographical context. Variations in regional policies, economic conditions, and institutional structures could limit the generalizability of the findings to other regions with different socio-economic landscapes.
A significant limitation identified in the case studies was the lack of financial literacy among farmers. While financial instruments are available, their effective use is often hindered by insufficient knowledge and understanding, which could lead to ineffective application or underutilization.
The complexity of application processes for many financial instruments remains a barrier for farmers, particularly small-scale family farmers who may not have the resources or support to navigate intricate procedures. This limitation needs to be addressed for the instruments to be truly accessible.
Data availability and quality, the research relied on existing data and case studies, which may not always be representative of the full spectrum of family farms. The availability and quality of data on family farms, particularly in developing countries, could limit the depth of analysis.
Future Research Directions
Future research should explore the impact of emerging digital financial instruments, such as mobile-based financing solutions and blockchain technology, on the sustainability and growth of family farms. These innovations could potentially lower barriers to access, especially in remote regions.
Given the critical role of financial literacy in the adoption and success of financial instruments, further research should investigate effective financial education programs tailored to family farmers. This could help enhance the uptake and optimal use of available resources.
Future studies could conduct cross-regional comparisons to assess how different financial instruments perform across diverse agricultural landscapes and socio-economic contexts. Understanding the regional differences could lead to the development of more context-specific instruments and policies.
Future research could focus on identifying and evaluating successful public-private partnership models that have effectively supported the adoption of financial instruments by family farms. This could help in creating replicable models for other regions and countries.
Longitudinal studies on the long-term impact of various financial instruments on the sustainability, economic growth, and climate resilience of family farms are needed. These studies could provide deeper insights into the evolving role of financial tools in rural development and farming communities.
Final Conclusion
The research underscores the pivotal role of innovative financial instruments in fostering the sustainability and growth of family farms worldwide. These instruments, ranging from traditional loans and microfinance to digital solutions and insurance schemes, hold immense potential for enhancing the resilience of family farms, especially in the face of economic and climate-related challenges. However, their effectiveness is highly dependent on their adaptation to the specific needs of farmers, as well as on the accessibility of these instruments across different regions and contexts.
While the study identifies best practices in the implementation of these financial tools, it also highlights key barriers such as the complexity of application processes and the lack of financial literacy among farmers, which may limit their successful utilization. Public policies and government support are integral in creating an enabling environment that encourages financial inclusion and promotes effective public-private partnerships for the development of these instruments.
In conclusion, to ensure the long-term sustainability of family farms, it is essential to continue innovating financial instruments that are accessible, tailored, and integrated into broader policy frameworks. Addressing the identified challenges and fostering collaboration between governments,
References
- Barnett, B. J., Barrett, C. B., & Skees, J. R. (2008). Poverty traps and index-based risk transfer products. World Development, 36(10), 1766-1785.
- Deininger, K., & Byerlee, D. (2011). The rise of large farms in land-abundant countries: Do they have a future? World Development, 39(3), 311-321.
- Demirgüç-Kunt, A. , Klapper, L., Singer, D., Ansar, S., & Hess, J. (2018). The global Findex database 2017: Measuring financial inclusion and the fintech revolution. World Bank.
- FAO. (2020). Agricultural finance and the role of financial instruments in enhancing productivity. Food and Agriculture Organization.
- Geissdoerfer, M., Savaget, P., Bocken, N. M., & Hultink, E. J. (2017). The circular economy—A new sustainability paradigm? Journal of Cleaner Production, 143, 757-768.
- Hazell, P., Poulton, C., Wiggins, S., & Dorward, A. (2010). The future of small farms: Trajectories and policy priorities. World Development, 38(10), 1349-1361.
- Karlan, D., Osei, R., Osei-Akoto, I., & Udry, C. (2014). Agricultural decisions after relaxing credit and risk constraints. Quarterly Journal of Economics, 129(2), 597-652.
- Lowder, S. K., Skoet, J., & Raney, T. (2016). The number, size, and distribution of farms, smallholder farms, and family farms worldwide. World Development, 87, 16-29.
- Morduch, J. (1999). The microfinance promise. Journal of Economic Literature, 37(4), 1569-1614.
- OECD. (2019). Enabling rural innovation through improved financial instruments. Organization for Economic Cooperation and Development.
- Pingali, P., Ricketts, K., & Sahn, D. (2015). Agriculture, food systems, and nutrition: Meeting the challenge of improving nutrition outcomes in developing countries. Food Policy, 56, 1-7.
- World Bank. (2021). Gender in agriculture: Closing the productivity gap.
Figure 1.
Trend in the share of active agricultural workers in the total active population. Source: FAOSTAT, 2022.
Figure 1.
Trend in the share of active agricultural workers in the total active population. Source: FAOSTAT, 2022.
Disclaimer/Publisher’s Note: The statements, opinions and data contained in all publications are solely those of the individual author(s) and contributor(s) and not of MDPI and/or the editor(s). MDPI and/or the editor(s) disclaim responsibility for any injury to people or property resulting from any ideas, methods, instructions or products referred to in the content. |
© 2025 by the authors. Licensee MDPI, Basel, Switzerland. This article is an open access article distributed under the terms and conditions of the Creative Commons Attribution (CC BY) license (http://creativecommons.org/licenses/by/4.0/).
Copyright: This open access article is published under a Creative Commons CC BY 4.0 license, which permit the free download, distribution, and reuse, provided that the author and preprint are cited in any reuse.


