
Submitted:
26 February 2025
Posted:
27 February 2025
You are already at the latest version
Abstract
The HVOF (High Velocity Oxy-Fuel) thermal spraying method is widely used in surface engineering to produce coatings with high hardness, low porosity and high crack resistance. Composite coatings with particles of chromium carbide (Cr₃C₂) in a nickel-chromium alloy (NiCr) matrix are used in demanding operating conditions, such as the energy and transport sectors. The study aims to compare the microstructure, micro-mechanical and tribological properties and corrosion resistance of two types of coatings: Cr₃C₂-25(Ni20Cr)-10(Ni) and Cr₃C₂-25(Ni20Cr), deposited by the HVOF method on a ductile cast iron substrate. Particular attention is paid to the influence of nickel (Ni) particles on the microstructure, mechanical properties, wear resistance and corrosion in the context of improving the service life of coatings. The study included microstructure analysis using light microscopy (LM) and scanning electron microscopy (SEM), as well as chemical and phase composition analysis in micro-areas using EDS and XRD techniques. The results show that the Cr₃C₂-25(Ni20Cr) coating enriched with Ni particles was characterised by a compact structure with low porosity and high hardness. Its microstructure consists of large, partially melted Ni particles and fine carbide particles (Cr₃C₂ and Cr₇C₃) embedded in the NiCr matrix, some of which reach submicron sizes. Performance tests, including indentation tests (HIT, EIT, KIC) as well as scratch and corrosion resistance tests, confirmed that the presence of Ni particles increases the coating's resistance to cracking, wear and corrosion. As a result, these coatings are characterised by higher operational durability, making them more effective in difficult working conditions.
Keywords:
Cr3C2-NiCr coating
; HVOF spraying
; microstructure
; instrumented indentation
; corrosion test
1. Introduction
The HVOF (High Velocity Oxygen Fuel) technology is one of the most advanced methods of producing protective coatings, combining high process efficiency with excellent properties of the obtained materials [1,2,3]. When this method is used, powder particles are deposited in a partially melted state at speeds of up to approximately 900m/s, which makes it possible to obtain dense, fine-grained coatings with high hardness and excellent adhesion to the substrate. An additional advantage of HVOF is the minimal impact of the process on the substrate microstructure and the possibility of obtaining coatings of considerable thickness. One of the key advantages of HVOF technology is its ability to produce ceramic and cermet coatings with various chemical and phase compositions [4,5,6]. This makes it a competitive alternative to other thermal spraying methods, especially in applications requiring high resistance to abrasion, high temperature and corrosion [7,8]. Moreover, this technique is distinguished by the possibility of applying coatings in situ, for example in boiler systems, which gives it an advantage over CVD or PVD methods [9]. Chromium carbide (Cr₃C₂) coatings with a nickel-chromium (NiCr) matrix produced by the HVOF method are widely used in the energy, transport, petrochemical and marine industries [10,11,12]. They are distinguished by high hardness, structural stability at elevated temperatures (up to 870°C) and resistance to abrasion, erosion and corrosion [13,14]. The characteristic microstructure of these coatings, characterised by low porosity (a few percent) and uniform distribution of fine-grained Cr₃C₂ particles in the NiCr matrix, is crucial for their excellent mechanical and tribological properties. The nickel-chromium matrix provides protection against corrosion, while chromium carbide is responsible for resistance to mechanical wear [15,16]. Partial decarburisation of Cr₃C₂ occurs during the HVOF process, which leads to the formation of secondary carbide phases such as Cr₇C₃ and Cr₂₃C₆. The presence of these phases increases the surface smoothness and abrasion resistance, but may also limit the fracture toughness, especially in the case of smaller carbide particles [17,18,19,20]. The introduction of nano-structured Cr₃C₂-NiCr coatings enables further improvement of tribological properties due to increased content of grain boundaries in the microstructure, which translates into higher hardness and strength. However, the larger surface area to grain volume ratio in nano-structured powders promotes more intensive distribution of the Cr₃C₂ phase, which may negatively affect fracture toughness. In recent years, research has focused on modifying the composition of ceramic powders by introducing metal and nonmetal admixtures, such as Cr, Co, B or Ni, as well as utilizing intermediate layers and additional coating processes. These activities help to limit the decarburisation of Cr₃C₂, increasing the abrasion resistance and at the same time minimising the susceptibility to brittle fracture [21,22,23,24,25,26,27]. Thanks to these solutions, it is possible to further improve the performance properties of coatings. The corrosion properties of coatings in aggressive environments, such as NaCl, H₂SO₄ solutions or alkaline environments, have been widely studied [28,29,30]. A key factor influencing their electrochemical behaviour is the microstructure, which includes the presence of pores, micro-cracks and macro-cracks that favour electrolyte penetration. These phenomena can lead to the initiation of galvanic corrosion, degradation of the coating and weakening of the substrate.
The aim of this study is to investigate the correlation between the microstructure, mechanical and tribological properties and corrosion resistance of (Cr₃C₂-NiCr+Ni) composite coatings produced by the HVOF method on a ductile cast iron substrate. In response to the growing demand for innovative coatings with improved tribological properties, the analysis of their behaviour in the context of wear and corrosion processes is a significant contribution to the development of advanced surface protection technologies.
2. Materials and Methods
2.1. Materials
The substrates were plates made of ductile iron EN-GJS-500-7 with the following chemical composition given in Table 1, and characterised by the following mechanical properties given in Table 2. The substrate samples had the dimensions of 100x15x5mm3. Prior to spraying, the surface of the substrates was sandblasted with loose corundum of 20 mesh granulation to improve the mechanical adhesion of coatings to substrate. The parameter of the substrate surface roughness Ra amounted to 30 µm. Coatings: Cr3C2-NiCr and (Cr3C2-NiCr+Ni) were applied by supersonic flame spraying from carbide powder with the following composition: Cr3C2-25NiCr (75wt% Cr3C2-25wt% NiCr) with a grain size of -45+15µm (Diamalloy 3004 Salzer-Metco, Pfattikon, Switzerland) on a ductile cast iron substrate. Fig. l shows an example of the carbide powder morphology (75%Cr3C2-25%NiCr) intended for the spraying process. The chemical composition of the powder at Point 1 is shown in Figure 1b. The (Cr₃C₂-NiCr+Ni) coating was obtained by introducing into the carbide powder 10 wt.% of Ni particles with nominal particle size distribution of -75+45 µm (Metco 56CNS, Oerlicon Metco). The volume composition of the powder mixture used to create the composite coating was as follows: 67.5 wt.% Cr3C2-22.5 wt.% NiCr-10 wt.% Ni.
2.2. Coating Deposition
A supersonic spray system, HV-50 HVOF System at Plasma System SA company (Siemianowice, Silesia, Poland) was used to spray the coatings. The system uses a mixture of aviation kerosene and oxygen as fuel for the spraying process. The coating application parameters are listed in Table 3. The average thickness of the applied coating was 250 µm.
2.3. Microstructure Characterisation
For testing of the microstructure and chemical composition of the coating/substrate- type system a light microscope (LM) Axio Observer Zm1 by Zeiss (LM, Jena, Germany) and a Scios DualBeam FEI scanning electron microscope (SEM), (Thermo Fisher Scientific, Waltham, MA, USA) were used. Phase composition analyses were carried out on a diffractometer X’Pert Pro Panalytical (Malvern Panalytical Ltd., Cambridge, UK) in the angular range of 20-90° with CuK radiation. After such measurements, the obtained spectra were subjected to preliminary numerical processing using “EVA” software, which consisted in cutting off the background and reducing noise using the Fourier transform. Phase identification was carried out with the help of ICDD database. Based on Rietveld analysis of XRD data with the use of GSAS/EXPGUI set of software phase composition was derived. The average crystallite size was calculated from the Scherrer formula upon taking into account the instrumental broadening. The composition of the surface layer of as-coated specimens was detected by X-ray diffraction (XRD) (Rigaku Co., Japan) with CuKα (λ=1.54056 Å) in small steps of 2Ѳ = 0.02°. The average crystal size of the phases in the coated layer was calculated using Debye-Scherrer equation [31]. The carbide coating porosity was measured using X-ray computed tomography on a Pheonix Nanotom X-ray nanotomograph (GE Sensing & Inspection Technologies GmbH, Frankfurt, Germany), equipped with AxioVision image analysis software. The tests were conducted for ten areas in the coating. The analysis of the coating surface topography and determination of surface roughness parameters: Ra (arithmetical mean deviation from the mean line) and Rz (the maximum roughness height based on the measured 10 highest profile peaks) were measured on a LEXT OLS 4100 confocal laser microscope from OLYMPUS Corporation (Tokyo, Japan). The surface roughness parameters of the coatings were determined for three measurement lines for each type of coating. Three-dimensional images and their analysis allowed for precise understanding of the geometric structure of the surfaces tested.
2.4. Mechanical and Tribological Properties
The tests of micro-mechanical properties, including measurements of microhardness, Young’s modulus and fracture toughness, were performed on a multifunctional measuring platform Micro Combi Tester, Switzerland from CSM Instruments. The values of HIT and EIT and KIC were determined on the basis of sample indentation (cross-section of coating/substrate-type samples) using a Vickers diamond indenter. The forces and penetration depths of the blade during the loading and unloading cycle were continuously recorded during the measurements. The maximum load value for measuring hardness and Young’s modulus was 1 N, the loading and unloading speed was 2 N/min, the time of maintaining the maximum load was 10 s, and the contact force was 0.03 N. For each cycle, the dependencies of the indenter load on the penetration depth were determined. The analysis of micro-mechanical properties was based on the Oliver and Pharr method, according to which the microhardness (HIT) and Young’s modulus (EIT) were calculated from the indentation curve (Figure 2). The microhardness was measured using a matrix layout consisting of 15 test points on the cross-section of the coating (Figure 2). The measurement positions were precisely determined using a special “Visual Advanced Matrix” module thanks to the integrated light microscope.
The fracture toughness was determined by determining the KIC parameter i.e., the critical value of the stress concentration ratio by direct measurement of the length of cracks that formed in the corners as a result of the penetration of the Vickers indenter under a given load: 5, 10, 15 and 20 N (the load and unload speed was 40 N/min, the maximum load holding time was 10 s, and the contact force was 0.03 N). For this purpose, the crack lengths and the lengths of the indentation diagonals were determined using the integrated light microscope (Tables: 7, 8). Three indentations were made in each coating/substrate-type sample at a given load. After determining the total length of the cracks, the type of cracks was identified, taking into account the length ratio l/a. If the l/a ratio is > 1.5, the Anstis formula is used [32]. To determine the critical value of the stress concentration ratio, it is necessary to know the Young’s modulus and hardness of a given material.
Anstis formula:
KIC = 0.5 (1)
where:
P – indenter load [N],
HV – Vickers hardness,
E – Young’s modulus of elasticity [MPa],
c=a+l – total crack length [m].
The tests of adhesion of coatings to the substrate and determination of other mechanical types of damage such as: the indenter penetration depth, cracks and the onset of delamination in the scratch path/scratch path profile were carried out by means of a scratch test using a Rockwell C-type diamond indenter with a radius of curvature of 100 µm at a constant load of: 5, 10, 15, 20 and 25 N and progressive load of: 0.03-30 N, using a multifunction measuring platform (Micro-Combi Tester, Switzerland) equipped with Anton Paar scratch test heads according to the standard [33]. The tests were carried out on the cross-sectioned samples embedded in resin (Durofast hard epoxy resin) and then polished in a standard way as metallographic samples. The scratch test is done under the constant load and the indenter moves from the substrate through the coating into the resin where the sample is embedded. The scratch test parameters are presented in Table 4. Two scratches were made on each sample to confirm the repeatability of the measurement results. The acoustic emission signal was recorded during the tests. In addition, microscopic analyses of the scratches were performed, which also made it possible to determine the strength of the coating and its resistance to destruction (cracking). The penetration depths of the indenter Pd were the parameters measured during the test. The damage to the coating/substrate system was detected and assessed through direct microscopic observation of the resulting scratch using light and scanning microscope. The normal force at which damage occurs is called the critical load. The critical load causing cohesive and adhesive cracks was determined; these cracks determine the quality of the coating-substrate bond.
In addition, after the scratch test, the projected area of cone-shaped fracture in the coating was determined: Acn=Lx.Ly for the constant load scratch force, determining the cohesion of the coatings and even the wear resistance of the coatings was measured by an light microscope.
The coefficient of friction was also measured in a scratch test on a multifunctional platform using a friction table and the same indenter as in the adhesion test with a progressive load applied on the penetrator (Rockwell C-type diamond indenter with a radius of curvature of 100 µm) with a linearly increasing pressure force applying load from 0 to 30 N on the penetrator. The scratch length was 1.4 mm and the indenter speed was 1.2 mm/min. During the measurement, the following parameters were recorded: applied force, friction force, friction coefficient and scratch depth.
2.5. Corrosion Test
In order to determine the corrosion resistance of the tested coatings, the corrosion tests were performed in iron (III) chloride solution (in accordance with the standard ASTM A 923, Test Method C) to simulate accelerated corrosion conditions of the coated material. For comparative purposes, the corrosion resistance of ductile iron samples (substrate) was determined. The samples for corrosion tests had the following dimensions: 15x15mm2. The sample have been suitably protected so that corrosion only affects the coated surface. The corrosion solution was prepared by dissolving 55.1 g of iron chloride (FeCl3 x 6H2O) and 6.6 g of sodium nitrate (NaNO3) in 600 ml of distilled water, which corresponded to a concentration of about 5% FeCl3 and 1% NaNO3 by weight. The samples were immersed in a solution (250 ml per sample) at a constant temperature of 45°C for 24 hours. After the exposure, the samples were cleaned of corrosion products, dried and weighed to an accuracy of ± 0.1 mg using an electronic balance. The average corrosion rate (Vc) was determined using the formula:
Vc = [g/m2day] (2)
where:
Δm - difference in sample mass before and after corrosion test [g],
S - sample area [m2],
t - duration of corrosion test [day].
After the calculations were performed, the samples were observed using light and scanning microscopy to assess the integrity of the coatings, the amount and intensity of corrosion changes, and the spread of subcoating corrosion. In order to analyse the phase composition of corrosion products, X-ray tests were performed using a diffractometer X’Pert Pro Panalytical (Malvern Panalytical Ltd., Cambridge, UK) in the angular range of 20-90° with CuK radiation.
3. Results and Discussion
The microstructure of the composite coating (Cr₃C₂-NiCr+Ni) sprayed onto a ductile cast iron substrate by the HVOF method (Figure 3) reflects the typical characteristics of the thermal spraying process. Carbide powder particles undergo intense plastic strain, forming layered, flattened grains. Fine chromium carbide particles of various sizes embedded in a nickel-chromium matrix were identified in the microstructure of the coating. Partially melted nickel particles were also observed, which became flattened and elongated parallel to the coating surface upon contact with the substrate. The coating demonstrates the ability to effectively fill substrate irregularities, which, in cross-section, reveals a solid mechanical connection resulting from the applied HVOF technology. The analysed microstructure showed the presence of small amounts of oxides, pores and micro-cracks. The oxides tend to accumulate locally within the coating or around partially melted nickel (Ni) particles. The characteristic properties of these oxides, such as high hardness, brittleness and a lower coefficient of thermal expansion compared to the matrix, may contribute to the initiation and propagation of micro-cracks in the coating structure.
The observations performed using scanning electron microscopy (SEM) and spectrometric analysis (EDS) for the (Cr₃C₂-NiCr+Ni)/ductile iron coating system showed significant refinement of chromium carbide grains – from about 40 μm in the initial state to 0.5–2.5 μm after the spraying process. This phenomenon was observed both in the coating itself and at the coating-substrate interface (Figure 4).
The results of phase analysis of the composite coating (Cr3C2-NiCr+Ni), performed by X-ray diffraction (XRD), is shown in Figure 5. In addition to the Cr₃C₂ phase, the Cr₇C₃ phase was identified in the tested coating, formed as a result of partial decomposition of Cr₃C₂ under the action of a high-temperature spray jet acting on the powder grains, which is also characteristic of coatings without the participation of metallic particles [34]. The proportion of Cr₇C₃ phase was 8.3%, which indicates a low degree of decomposition of Cr₃C₂ carbide. Additionally, intermetallic phases such as NiCr (29.2%) and small amounts of Ni₃Cr (3.3%) were detected in the composite coating. The diffraction lines of these phases showed no broadening, suggesting a low level of elastic-plastic deformation in their structure. Although the Cr₃C₂ phase is characterised by higher microhardness and almost twice as high elastic modulus as observed in Cr₇C₃, the presence of Cr₇C₃ in the NiCr matrix, resulting from the partial decomposition of Cr₃C₂, can favourably modify the microstructure of the coating. As a result, this increases its resistance to cracking and wear. The Cr₇C₃ phase is characterised by high crack resistance, with KIC value in the range of 2.64–4.53MPa m¹/² [35]. Moreover, the measured values of the average crystallite sizes of the individual phases indicate the nanocrystalline nature of the composite coating, which may limit crack propagation. The refinement of the coating microstructure elements increases the cohesion between the hard carbide particles and the binder phase, which helps to improve its ductility. The presence of carbides such as Cr₇C₃ and Cr₂₃C₆ further enhances the wear resistance of the coating, combining key properties resulting from both the fine-grained structure and the specific carbide characteristics. This combination of features makes the coating more resistant to mechanical loads and wear processes in demanding operating conditions.
Bottom of the form
Figure 6 shows an image of the surface roughness measurement site, obtained using a confocal laser microscope for the Cr₃C₂-NiCr+Ni coating at 200× magnification, along with a three-dimensional image of the surface of this coating. The image analysis enabled a precise examination of the geometric structure of the coating surface. The results of roughness parameter measurements, such as Ra and Rz, for the composite coating (Cr₃C₂-NiCr+Ni) are summarised in Table 5. For comparison, the average roughness values Ra and Rz for the standard Cr₃C₂-NiCr coating were 4.8 ±1.1 μm and 26.9 ±4.9 μm, respectively [34]. The greater surface roughness of the composite coating is primarily due to its composite structure. This is likely a result of the crystallization process of hemispherical nickel (Ni) particles and their island-like arrangement in the coating matrix. The presence of distinct sharp peaks on these particles further contributes to the roughness. The larger the dimensions of the Ni particles, the more they affect the geometric properties of the coating surface. These factors are important when interpreting scratch test results, particularly in the context of their influence on adhesion and coating wear rate. It is also worth noting that such a surface topography of the coating may contribute to improving its abrasion resistance. The average porosity of Cr₃C₂-NiCr [34] and (Cr₃C₂-NiCr+Ni) coatings sprayed onto ductile cast iron, determined from tomographic measurements, was 3.6 ±0.8% and 2.4 ±0.6%, respectively. The relatively low porosity of composite coatings is mainly due to the large surface area occupied by partially melted nickel (Ni) particles, which create a compact structure of the material.
The results of microhardness and Young’s modulus tests for the coating system (Cr₃C₂-NiCr+Ni)/ductile cast iron are presented in Table 6. The coatings containing nickel (Ni) particles were characterised by lower hardness and Young’s modulus values compared to coatings without metallic particles [34]. This is due to the presence of soft Ni particles in the coating microstructure, which results in a reduction of both hardness and stiffness. The average HIT and EIT values for the standard Cr₃C₂-NiCr coating system were 10.9 ± 1.97 GPa and 203.77 ± 11.91 GPa, respectively, while for the composite coating system (Cr₃C₂-NiCr+Ni), they were 7.70 ± 2.42 GPa and 191.69 ± 18.58 GPa, respectively. The highest hardness values were observed in the central part of the cross-section of the coatings, at a distance of approximately 100 µm from the substrate. Maximum values of Young’s modulus were also recorded in this area, which can be attributed to the strain hardening effect occurring during the spraying process, better coating cohesion and significant refinement of carbide grains. In the areas containing Ni particles the lowest microhardness and Young’s modulus values were observed, which results from the fact that the nickel particles are softer than the matrix. In general, the microhardness of Cr₃C₂-NiCr and (Cr₃C₂-NiCr+Ni) coatings tends to increase with distance from the substrate/coating interface. The variation in hardness values can be attributed to changes in the chemical and phase composition of the carbide coating. The reduction in hardness near the coating/substrate interface and the weakened cohesion between the metallic particle and the matrix may be the result of decarburisation and oxidation processes of some alloying elements occurring during thermal spraying and cooling of the material from the molten state to ambient temperature.
The fracture toughness results for Cr3C2-NiCr and (Cr3C2-NiCr+Ni) coatings are presented in Table 7 and Table 8 together with images of indentations made during indentation microhardness measurements, which were used to determine the crack lengths and indentation diagonals. Based on the obtained values of instrumental microhardness (HIT) and the modulus of elasticity (EIT), the critical fracture toughness coefficient (KIC) was calculated. The results presented in Table 7 and Table 8 confirm that Young’s modulus significantly influences the coating’s fracture toughness. However, when assessing this property, the hardness and porosity of the coating are equally important. The fracture toughness coefficient of the coating without Ni particles (Cr₃C₂-NiCr) at a load of 10–20 N was in the range of 2.4–0.8M Nm³/², whereas for the (Cr₃C₂-NiCr+Ni) composite coating at a load of 5–15 N it ranged from 3.2 to 1.9 MNm³/² in the matrix and from 1.8 to 1.2 MNm³/² in the areas containing Ni particles. Higher values of KIC for composite coatings at lower loads (5–15 N), resulting from shorter cracks and a higher modulus of elasticity to hardness ratio (E/H), indicate an increased capacity for plastic strain compared to coatings without metallic particles. The presence of metallic particles (Ni) helps improve the plasticity of the coating, which limits crack propagation. In addition, higher KIC values may result from the lower porosity of the composite coatings. The measurements of the fracture toughness coefficient for composite coatings showed greater variability of the results, which is a consequence of their inhomogeneous microstructure. It is also important that the process of decarburisation and dissolution of Cr₃C₂ during spraying leads to the the formation of a submicron-sized phase, which affects the mechanical properties of the matrix and thus increases its crack resistance [36]. The analysis of the results of microhardness (HIT), Young’s modulus (EIT) and fracture toughness coefficient (KIC) measurements in cross-sections of coating systems shows that the introduction of metallic particles locally reduces the hardness of the coating, which results in a reduction of its susceptibility to brittle fracture. The metal particles, constituting a soft phase compared to the brittle chromium carbide grains, promote plastic strain of the coating. This makes it possible to obtain coatings that combine high hardness with improved plasticity, which consequently increases their resistance to wear and cracking. Reducing the microhardness of the coating is also associated with a reduction in the modulus of elasticity, which further improves the coating’s ability to undergo plastic strain. It is worth emphasising that the fracture toughness of the coatings depends not only on their mechanical properties, but also on the morphological parameters of the microstructure. The key factors include the content of Ni particles, their size and shape, the strength of the adhesive bond between Ni particles and the NiCr matrix, as well as the magnitude of internal stresses that can lead to decohesion of these particles [37].
Figure 7 and Figure 8 show the scratch trace in the (Cr₃C₂-NiCr+Ni)/ductile iron and Cr₃C₂-NiCr/ductile cast iron coating systems under the application of constant and progressive loads. The analysis of the results showed that the scratch penetration depth depends on the type of load applied and the coating microstructure. During the scratch test, parallel measurements of the scratch penetration depth were performed, which allowed for the assessment of the resistance of the tested coating systems to scratching and plastic strain. The results of penetration depth measurements for various coating systems are summarised in Table 9. These data enable a comparison of the behaviour of standard Cr₃C₂-NiCr and composite (Cr₃C₂-NiCr+Ni) coatings, indicating a significant influence of the presence of metallic particles on the scratch characteristics. In the case of coatings with the addition of metallic particles, more favourable values of the indenter penetration depth were observed during the scratch test, which indicates their higher scratch resistance in comparison to coatings without these particles. Analysis of the results showed that with the increase of load, the indenter penetration depth gradually increases in all tested coating systems. The coatings enriched with metallic particles showed better tribological properties, as confirmed by the smaller indenter penetration depth in the load range tested. The presence of hard carbide phases and other nickel-based phases effectively limits the propagation of micro-damages and micro-cuts, minimising tears along the resulting cracks.
Such structural properties contribute to improved abrasion resistance, which makes coatings with the addition of metallic particles more resistant to intense mechanical loads and wear processes occurring in operating conditions requiring high mechanical strength [36].
The assessment of the adhesion of the coating to the substrate was performed based on the analysis of microscopic scratch images obtained during tests carried out at progressive loads in the range of 0.03–30 N and at constant loads of 5, 10, 15, 20 and 25 N. The obtained scratch images of the tested coating systems are presented in Figure 7 and Figure 8. The scratch trace on the cross-section of the (Cr₃C₂-NiCr+Ni)/ductile cast iron coating system indicates that the cracks propagate mainly in the areas containing nickel (Ni) particles. Due to their plasticity, Ni particles take over the propagation of cracks, extinguishing the energy of their spreading.
This process occurs by inhibiting the movement of the crack and deflecting its direction, which helps to increase the mechanical resistance of the coating. During the scratch test with progressively increasing load, different damage mechanisms were observed in the cross-sections of the coating systems. The cohesive cracks dominated in the coatings devoid of metallic particles and propagated parallel to the substrate-coating interface, inside the coating itself. For the coatings containing metallic particles, the cracks occurred primarily at the metallic particle/matrix interface but did not propagate further into the coating microstructure. The presence of Ni particles plays a key role in limiting crack growth, which significantly improves the mechanical integrity of the coating. These particles act as plastic buffers that capture and reduce local stresses in places where cracks could develop. In this way, they increase the resistance of the coating to mechanical damage, such as scratches and delamination. In the case of the (Cr₃C₂-NiCr+Ni)/ductile cast iron coating system, the calculated Acn (projected area of the cone) values increased with the increasing load in the range of 10–20 N (Table 10). This result confirms the good scratch bond strength of this system in the tested load range. The characteristic cone-shaped fractures occurred within the coating and suggested a cohesive damage mechanism in the coating/substrate system at loads in the range of 10–20 N. This means that the damage initiated in this load range developed mainly within the coating itself, indicating its high structural integrity and resistance to detachment from the substrate. Larger cracks were observed around the scratch in the coating system containing metallic particles (Ni) at a maximum load of 25 N. This phenomenon led to delamination of the coating from the substrate, which indicates an adhesive damage mechanism under these loading conditions.
The addition of Ni particles significantly increases the mechanical strength of the coatings by improving their scratch resistance and delaying the initiation of adhesive damage mechanisms. In composite coatings, the delamination moment shifts towards higher loads, which indicates increased structural strength compared to coatings without the Ni particles added [33]. Additionally, based on microscopic images obtained after the scratch tests, a detailed analysis of the proportions of different forms of damage in the tested coating system was performed. The identified damage types included no cracks, cohesive cracks and adhesive cracks as illustrated in Annex A to ISO 27307:2015(E) [33]. The adhesive cracks occurred at the coating interface: for the Cr₃C₂-NiCr/ductile cast iron system at a load of 20 N and for the (Cr₃C₂-NiCr+Ni)/ductile cast iron system at 25 N. The cohesive cracks occurred inside the coating: for Cr₃C₂-NiCr/ductile cast iron above 5 N and for (Cr₃C₂-NiCr+Ni)/ductile cast iron above 10N. The results show that the type of coating and load affect the type of damage, which emphasises the need to optimise the composition and microstructure of coatings in order to increase their durability and mechanical resistance.
The evolution of the friction coefficient during the scratch test of the coating surface at a progressive load (0.03-30N) over a length of 1.4 mm is shown in Figure 9. The coatings demonstrated similar tribological characteristics, but clear fluctuations in the friction coefficient were observed depending on the phase composition. For the composite coating (Cr₃C₂-NiCr+Ni), the fluctuations ranged from 0.09 to 0.55, with an average value of 0.31, while for the Cr₃C₂-NiCr coating the fluctuations were in the range of 0.11–0.59, with an average friction coefficient of 0.30. The reduction in the amplitude of friction coefficient fluctuations for the composite coating was due to the presence of Ni particles, which, through more frequent contact with the indenter, increased the friction resistance, which resulted in a slight increase in the average friction coefficient to 0.31. The Ni particles, being a metallic material, contributed to increased friction and intensified wear of the coating, which was associated with increased roughness of its surface. The higher surface roughness of the composite coating could also contribute to its higher wear resistance, because the indenter deformed or crushed the micro-irregularities on the surface during the test, leading to friction force fluctuations. In contrast, the Cr₃C₂-NiCr coating showed a lower friction coefficient, which was probably due to its higher hardness and lower surface roughness. The friction coefficient values for the coatings tested were significantly lower than for the ductile iron substrate (µ = 0.40), which confirms the improvement of the tribological properties of the coated cast iron.

Table 12.
Basic results from the corrosion resistance test of the tested materials: ductile cast, Cr₃C₂-NiCr/ductile cast iron and (Cr₃C₂-NiCr+Ni)/ductile cast iron.
Table 12.
Basic results from the corrosion resistance test of the tested materials: ductile cast, Cr₃C₂-NiCr/ductile cast iron and (Cr₃C₂-NiCr+Ni)/ductile cast iron.
| Materials |
Surface Area [mm2] |
Weight Before Test [g] |
Weight After Test [g] |
Mass Loss [g] |
Corrosion Rate [g/m2doba] |
| Ductile cast iron | 102 | 25.44750 | 25.42659 | 0.02091 | 205.65 |
| Cr3C2-NiCr/ductile iron | 109 | 25.48380 | 25.47234 | 0.01146 | 105.14 |
| (Cr3C2-NiCr+Ni)/ductile iron | 113 | 27.21759 | 27.21132 | 0.00627 | 55.49 |
The corrosion of the coatings tested was mainly due to the selective dissolution of the metal matrix (NiCr), which exhibits higher anodicity compared to chromium carbide particles. The microscopic observations of cross-sections of the coating systems: (Cr₃C₂-NiCr+Ni)/ductile cast iron and Cr₃C₂-NiCr/ductile cast iron (Figure 10, Figure 11) after exposure to corrosive environment revealed significant differences in their resistance. For the composite coatings (Cr₃C₂-NiCr+Ni), the corrosion process was selective, concentrating on nickel particles. The formation of dark deposits on the Ni particles and cracks parallel to the coating/substrate interface were observed. For the coatings without the addition of metallic particles (Cr₃C₂-NiCr), local clusters of pits, numerous cracks perpendicular to the interface and complete delamination of the coating from the substrate occurred. The increased porosity of the Cr₃C₂-NiCr coating accelerated the corrosion process by creating electrochemical potential differences between the corrosion pores and the matrix, which led to intensified material degradation. Microscopic examination of the surface of the composite coating (Cr₃C₂-NiCr+Ni) after exposure to a corrosive environment revealed the presence of volumetric corrosion areas and micro-cracks that facilitated the penetration of the corrosive solution. As a result, the pits were gradually filled with corrosion products, which led to further degradation of the coating structure.
The analysis of the chemical composition of corrosion products on the cross-section (Figure 12a) and surface (Figure 12b) of the (Cr₃C₂-NiCr+Ni)/ductile cast iron coating system using EDS revealed the presence of carbon, oxygen, chromium, nickel, iron, and chlorine, suggesting the formation of complex layers of corrosion products.
The X-ray diffraction (XRD) tests of the phase composition of the composite coating revealed the presence of Cr₃C₂ and Cr₇C₃ and a small amount of nickel oxide (NiO). After exposure to corrosive environment, the intensity of the peaks associated with the carbide phase decreased, indicating partial degradation of this phase. Moreover, the lack of peaks characteristic of the NiCr phase suggests its complete transformation into NiO (Figure 13a). The (Cr₃C₂-NiCr+Ni) composite coating showed superior corrosion resistance, which was attributed to its ability to form protective layers of corrosion products, such as NiO, that filled the pores and limited further degradation of the material. In turn, for the Cr₃C₂-NiCr coating (Figure 13b), the dominant chemical compounds on the surface were iron oxide (Fe₃O₄) and Ni-Cr-Fe oxide (NiCrFeO₄), which formed as a result of the coating delamination process. The interfacial corrosion at the coating-substrate interface, supported by electrochemical potential differences, promoted the formation of galvanic micro-cells, which led to intensified degradation. The analysis of the corrosion test carried out in iron chloride solution shows that the corrosion mechanisms in the coating systems tested are complex. Porosity, interphase boundaries, carbide distribution in the metal matrix and oxide inclusions play a key role in the corrosion process. The (Cr₃C₂-NiCr+Ni) composite coatings demonstrate higher corrosion resistance due to their ability to form protective layers of corrosion products, which results in limiting further degradation of the material.
4. Conclusions
Based on the contacted research and results odf the analysis, the following conclusions have been formulated:
- The composite coating (Cr₃C₂-NiCr+Ni), deposited by the HVOF method, is characterised by a compact, layered microstructure without visible discontinuities at the coating-substrate interface. The microstructural composition includes elongated, plastically deformed Ni-Cr alloy particles, fine Cr₃C₂ particles (0.5–2.5µm), and partially melted nickel particles with a flattened morphology. The phase analysis showed the presence of Cr₇C₃ and Ni₃Cr phases, which strengthen the nickel-chromium matrix. The small degree of decomposition of Cr₃C₂ to Cr₇C₃ (8.3%) indicates the high chemical stability of the carbide during the spraying process.
- The modification of the coating composition by adding nickel particles improves its mechanical, tribological and corrosion properties. The reduction of microhardness (HIT) and the modulus of elasticity (EIT) increases the plasticity of the coating, limiting crack propagation and delaying the delamination process, which improves its structural integrity. The presence of nickel particles strengthens the coating thanks to synergistic interaction with Cr₃C₂, resulting in increased resistance to mechanical wear and scratches. The coating also demonstrates improved corrosion resistance due to the formation of protective oxide layers (NiO).
- (Cr₃C₂-NiCr+Ni) coatings deposited on cast iron substrates by the HVOF method are an effective solution for applications requiring high mechanical strength, resistance to cracking, wear and corrosion. The synergistic effect between hard chromium carbide particles and ductile nickel particles ensures high operating efficiency, especially in environments exposed to intense mechanical and corrosive impacts.
Author Contributions
Conceptualization, M.K.; Methodology, M.K. and L.B.; Investigation, M.K. and L.B; Formal analysis, M.K. and L.B; Writing- original draft preparation, M.K. and L.B; Writing- review and ending, M.K.; Visualization, M.K. and L.B; All authors have read and agreed to the published version of the manuscript.
Funding
This research was funded by subsidy of the Department of Non-Ferrous Metals of AGH University of Krakow (contract No. 1616.180.006).
References
- Davis, J.R. Handbook of Thermal Spray Technology; ASM International, Davis, USA, 2004.
- Pawlowski, L. The Science and Engineering of Thermal Spray Coatings; JohnWiley & Sons: New York, NY, USA, 2008. [Google Scholar]
- Straffelini, G.; Federici, M. HVOF cermet coatings to improve sliding wear resistance in engineering systems. Coatings. 2020, 10, 886–897. [Google Scholar] [CrossRef]
- Xie, M.; Zhang, S.; Li, M. Comparative investigation on HVOF sprayed carbide-based coatings, Appl. Surf. Sci. 2013, 273, 799–805. [Google Scholar] [CrossRef]
- Reddy, N.C.; Kumar, B.S.A.; Reddappa, H.N.; Ramesh, M.R.; Koppad, P.G.; Kord, S. HVOF sprayed Ni3Ti and Ni3Ti+(Cr3C2+20NiCr) coatings: Microstructure, microhardness and oxidation behavior. J. Alloys Compd. 2018, 736, 236–245. [Google Scholar] [CrossRef]
- Kunioshi, C.T.; Correa, O.V.; Ramanathan, L.V. High temperature oxidation and erosion-oxidation behaviour of HVOF sprayed Ni-20Cr, WC-20Cr-7Ni and Cr3C2-Ni-20Cr coatings. Surf. Eng. 2006, 22, 121–127. [Google Scholar] [CrossRef]
- V. Matikainen,V.; Bolelli, G.; Koivuluoto, H.; Sassatelli, P.; Lusvarghi, L.; Vuoristo, P. Sliding wear behaviour of HVOF and HVAF sprayed Cr3C2-based coatings, Wear. 2017, 388–389, 57–71.
- Bolelli, G.; Berger, L.M. ; Borner,T.; Koivuluoto, H.; Matikainen,V.; Lusvarghi, L.; Lyphout, C.; Markocsan, N.; Nylen, P.; Sassatelli, R.; Trache, R.; Vuoristo, P. Sliding and abrasive wear behaviour of HVOF- and HVAF-sprayed Cr3C2-NiCr hardmetal coatings. Wear.
- Formanek, B.; Szymański, K.; Szczucka-Lasota, B. New generation of protective coatings intended for the power industry, J. Mater. Proces. Technol. 2005, 164-165, 850–855. [Google Scholar] [CrossRef]
- Berger, L.M. Application of hardmetals as thermal spray coatings. Int. J. Refract. Met. Hard Mater. 2015, 49, 350–364. [Google Scholar] [CrossRef]
- Jin, D.; Yang, F.; Zou, Z.; Gu, L.; Zhao, X.; Guo, F.; Xiao, P. A study of the zirconium alloy protection by Cr3C2–NiCr coating for nuclear reactor application. Surf. Coat. Technol. 2016, 287, 55–60. [Google Scholar] [CrossRef]
- Venkatesh, L.; Pitchuka, S.B.; Sivakumar, G.; Gundakaram, R.C.; Joshi, S.V.; Samajdar, I. Microstructural response of various chromium carbide based coatings to erosion and nano impact testing. Wear. 2017, 386, 72–79. [Google Scholar] [CrossRef]
- Matthews, S.; Berger, L.M. Long-term compositional/microstructural development of Cr3C2-NiCr coatings at 500°C, 700°C and 900°C. Int. J. Refract. Met. Hard Mater. 2016, 59, 1–18. [Google Scholar] [CrossRef]
- Singh, H.; Kaur, M.; Prakash, S. High-temperature exposure studies of HVOF-Sprayed Cr3C2- 25(NiCr)/(WC-Co) Coating. J. Therm. Spray Technol. 2016, 25, 1192–1207. [Google Scholar] [CrossRef]
- Varis, T.; Suhonen, C.; Calonius, O.; Cuban, J.; Pietola, M. Optimization of HVOF Cr3C2–NiCr fatigue performance NiCr coating for increase. Surf. Coat.Technol. 2016, 305, 123–131. [Google Scholar] [CrossRef]
- Prudenziati, M.; Gazzadi, G.C.; Medici, M.; Dalbagni, G.; Caliari, M. Cr3C2-NiCr HVOF-sprayed coatings: microstructure and properties versus powder characteristics and process parameters. J. Therm. Spray Technol. 2010, 19, 541–550. [Google Scholar] [CrossRef]
- Matthews, S. Carbide dissolution/carbon loss as a function of spray distance in unshrouded/shrouded plasma sprayed Cr3C2-NiCr coatings. J. Therm. Spray Technol. 2015, 24, 552–569. [Google Scholar] [CrossRef]
- Li, C.; Ji, G.; Wang,Y. ; Sonoya,K. Dominant effect of carbide rebounding on the carbon loss during high velocity oxy-fuel spraying of Cr3C2-NiCr. Thin Solid Films. 2002, 419, 137–143. [Google Scholar] [CrossRef]
- Yuan, J.; Ma, Ch.; Yang, S.; Yu, Z.; Li, H. Improving the wear resistance of HVOF sprayed WC- Co coatings by adding submicron-sizedWC particles at the splats’ interfaces. Surf. Coat. Technol. 2016, 285, 17–23. [Google Scholar] [CrossRef]
- Roy, M.; Pauschitz, A.; Bernardi, J.; Koch, T.; Franek, F. Microstructure and mechanical properties of HVOF sprayed nanocrystalline Cr3C2-25(Ni20Cr) coating. J. Therm. Spray Technol. 2006, 15, 372–381. [Google Scholar] [CrossRef]
- Chen, J.; Zhao, X.; Zhou, H.; Chen, J.; An, Y.; Yan, F. Microstructure and tribological property of HVOF sprayed adaptive NiMoAl–Cr3C2–Ag composite coating from 20°C to 800°C. Surf. Coat. Technol. 2014, 258, 1183–1190. [Google Scholar] [CrossRef]
- Zhang, Y.; Chong, K.; Liu, Q.; Bai, Y.; Zhang, Z.; Wu, D.; Zou, Y. High-temperature tribological behavior of thermally-treated supersonic plasma sprayed Cr3C2-NiCr coatings. Int. J. Refract. Met. Hard Mater. 2021, 95, 105456. [Google Scholar] [CrossRef]
- Picas, J. A.; Punset, M.; Manergues, E.; Martin, E.; Baile, M.T. Microstructural and tribological studies of as-sprayed and heat-treated HVOF Cr3C2–CoNiCrAlY coatings with a CoNiCrAlY bond coat. Surf. Coat. Technol. 2015, 268, 317–324. [Google Scholar] [CrossRef]
- He, B.; Zhang, L.; Yun, X.; Wang, J.; Zhou, G.; Chen, Z.; Yuan, X. Comparative study of HVOF Cr3C2–NiCr coating with different bonding layer on the interactive behavior of fatigue and corrosion. Coatings. 2022, 12, 307–324. [Google Scholar] [CrossRef]
- Janka, L.; Norpoth, J.; Trache, R.; Berge, L.M. Influence of heat treatment on the abrasive wear resistance of a Cr3C2–NiCr coating deposited by an ethene-fuelled HVOF spray process. Surf. Coat. Technol. 2016, 291, 444–451. [Google Scholar] [CrossRef]
- Gariboldi, E.; Rovatti, L.; Lecis, N.; Mondora, L.; Mondora, G.A. Tribological and mechanical behaviour of Cr3C2–NiCr thermally sprayed coatings after prolonged aging. Surf. Coat. Technol. 2016, 305, 83–92. [Google Scholar] [CrossRef]
- Mazaheri, Y.; Malmir, R.; Jalilvand, M.M.; Sheikhi, M.; Heidarpour, A. Mechanical properties and tribological performance of A356/Cr3C2-NiCr surface composite developed by high-velocity oxy- fuel and post friction stir processing treatment. Surf. Interfaces 2022, 28, 101627. [Google Scholar] [CrossRef]
- Wang, K.; Hong, S.; Wei, Z.; Hu, N.; Cheng, J.; Wu, Y. Long-term corrosion behavior of HVOF sprayed Cr3C2-NiCr coatings in sulfide-containing 3.5 wt.% NaCl solution. J. Mater. Res. Technol. 2021, 15, 3122–3132. [Google Scholar] [CrossRef]
- Zavareh, M.A; Sarhan, A.A.D.; Bushroa, A.R.; Basirun, W.J. The tribological and electrochemical behavior of HVOF-sprayed Cr3C2-NiCr ceramic coating on carbon steel. Ceram. Int. 2015, 41, 5387–5396. [Google Scholar] [CrossRef]
- Magnani, M.; Suegama, P.H.; Espallargas, N.; Fugivara, C.S.; Dosta, S.; Guilemany, J.M.; et al. Corrosion and wear studies of Cr3C2-NiCr-HVOF coatings sprayed on AA7050 T7 under cooling. J. Therm. Spray Technol. 2009, 18, 353–363. [Google Scholar] [CrossRef]
- Hassanzadeh-Tabrizi, S.A. Precise calculation of crystallite size of nanomaterials: A review. J. Alloys and Compounds. 2023, 986, 171914. [Google Scholar] [CrossRef]
- Anstis, G.; Chantikul, P.; Lawn, B.; Marshall, D. A Critical Evaluation of Indentation Techniques for Measuring Fracture Toughness: I, Direct Crack Measurements. J. Am. Ceram. Soc. 1981, 64, 533–538. [Google Scholar] [CrossRef]
- ISO 27307:2015 Thermal spraying -Evaluation of adhesion/cohesion of thermal sprayed ceramic coatings by transverse scratch testing.
- Ksiazek, M.; Łyp-Wrońska, K. m: HVOF-sprayed (Cr3C2-NiCr+Co) composite coating on ductile cast iron, 2024; 17. [CrossRef]
- Hirota, K.; Mitani, K.; Yoshinaka, M.; Yamaguchi, O. Simultaneous synthesis and consolidation of chromium carbides (Cr3C2, Cr7C3 and Cr23C6) by pulsed electric-current pressure sintering. Mater. Sci. Eng. A 2005, 399, 154–160. [Google Scholar] [CrossRef]
- Konopka, K.; Maj, M.; Kurzydłowski, K.J. Studies of the effect of metal particles on the fracture toughness of ceramic matrix composites. Mater. Character. 2003, 51, 335–340. [Google Scholar] [CrossRef]
- Bartolome, J.F.; Beltran, J.I.; Gutierrez-Gonzalez, C.F.; Moya, J.S.; Pecharroman, C.; Munoz, M.C. Influence of Ceramic–Metal Interface Adhesion on Crack Growth Resistance of ZrO2–Nb Ceramic Matrix Composites. Acta Mater. 2008, 56, 3358–3366. [Google Scholar] [CrossRef]
Figure 1.
SEM/EDS of Cr3C2-25(Ni20Cr) coating powder.
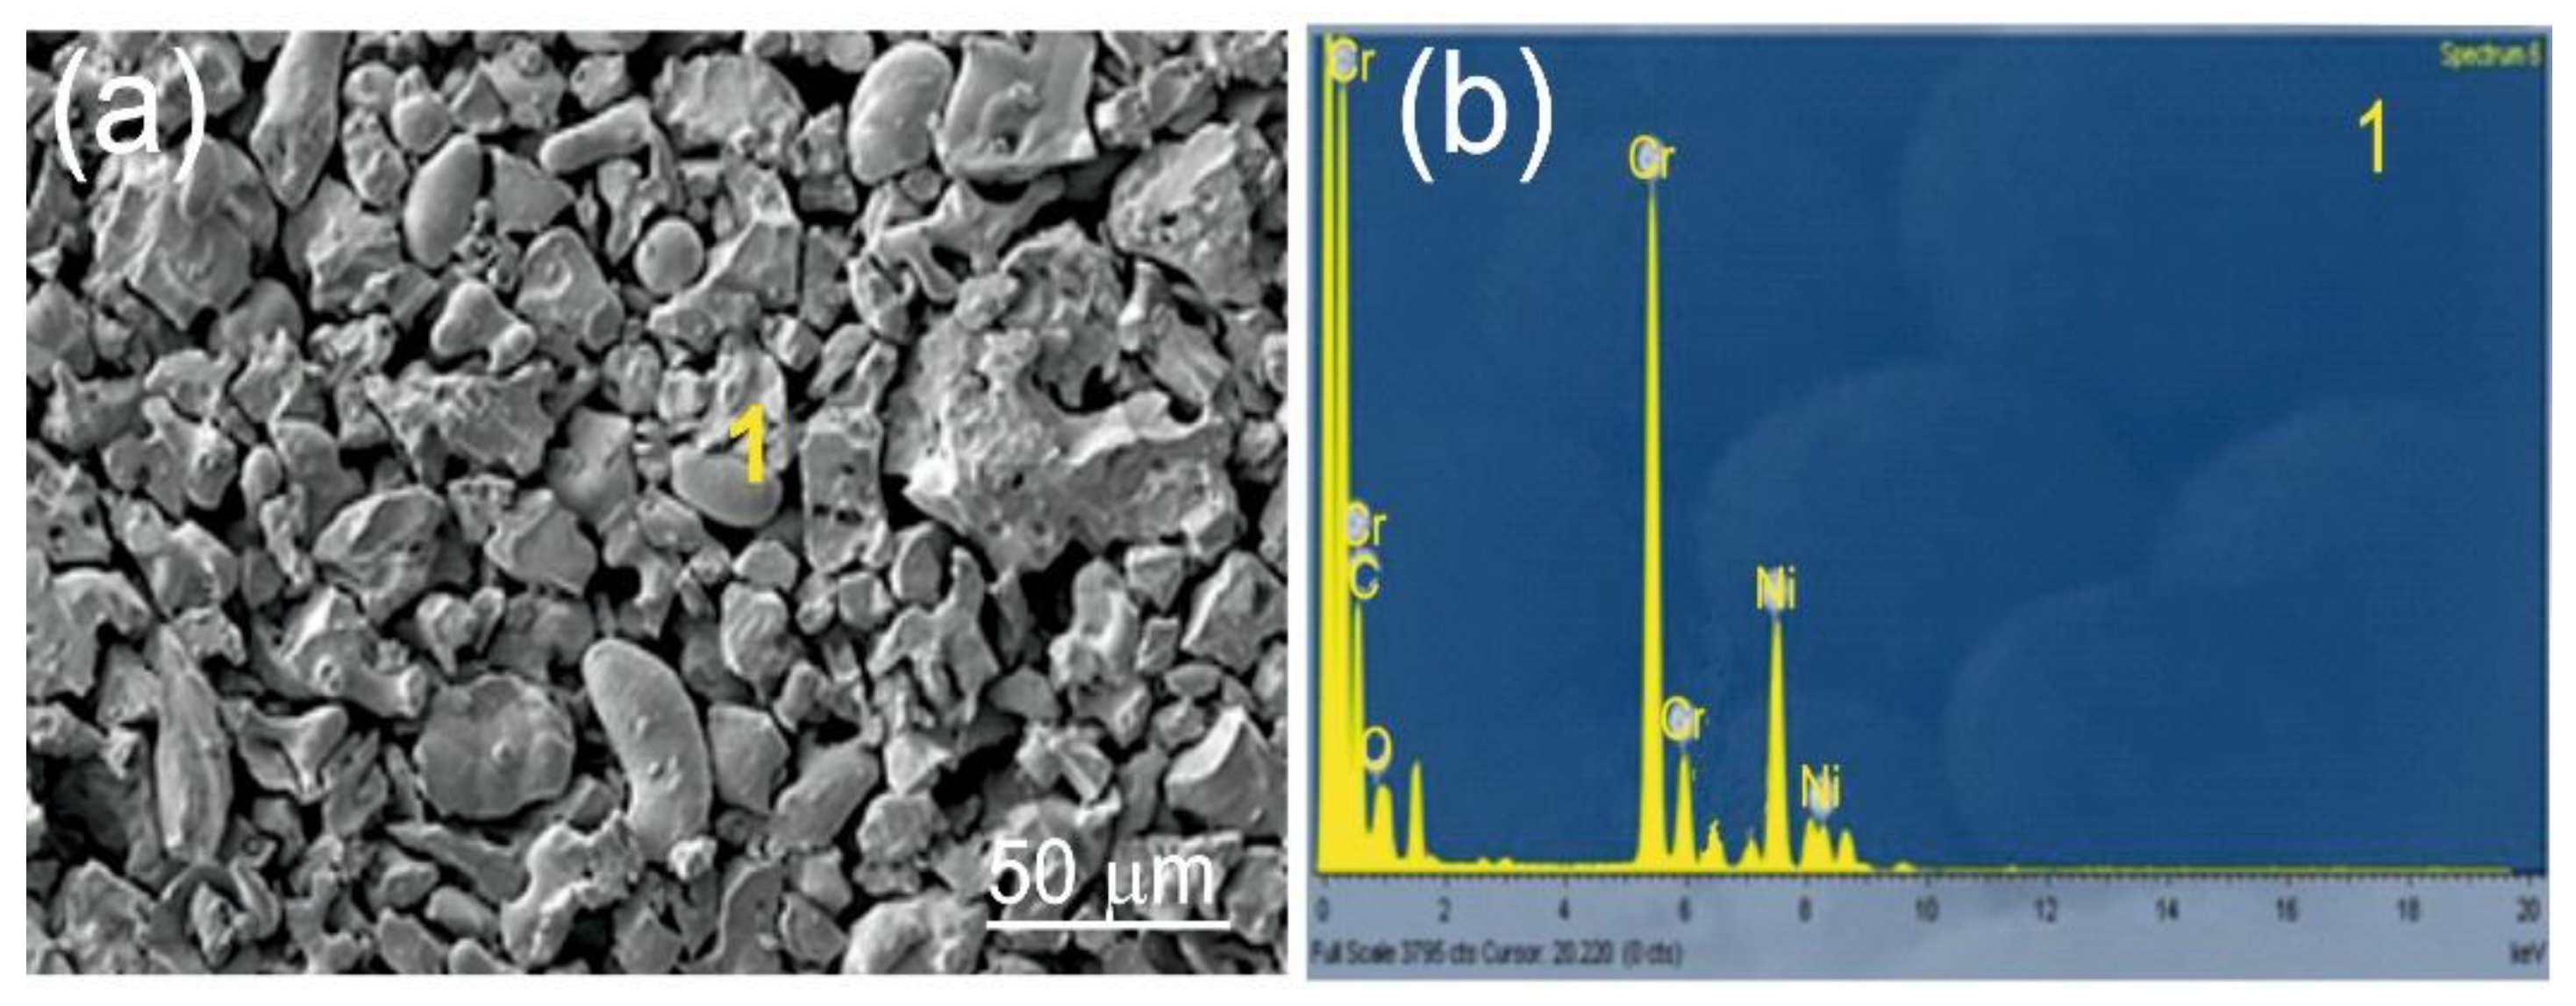
Figure 2.
Measurement of microhardness (HIT) using a matrix distribution on the cross-section of the coating and the loading-depth curve of indentation in the matrix of the (Cr₃C₂-NiCr+Ni)/ductile cast iron system.
Figure 2.
Measurement of microhardness (HIT) using a matrix distribution on the cross-section of the coating and the loading-depth curve of indentation in the matrix of the (Cr₃C₂-NiCr+Ni)/ductile cast iron system.
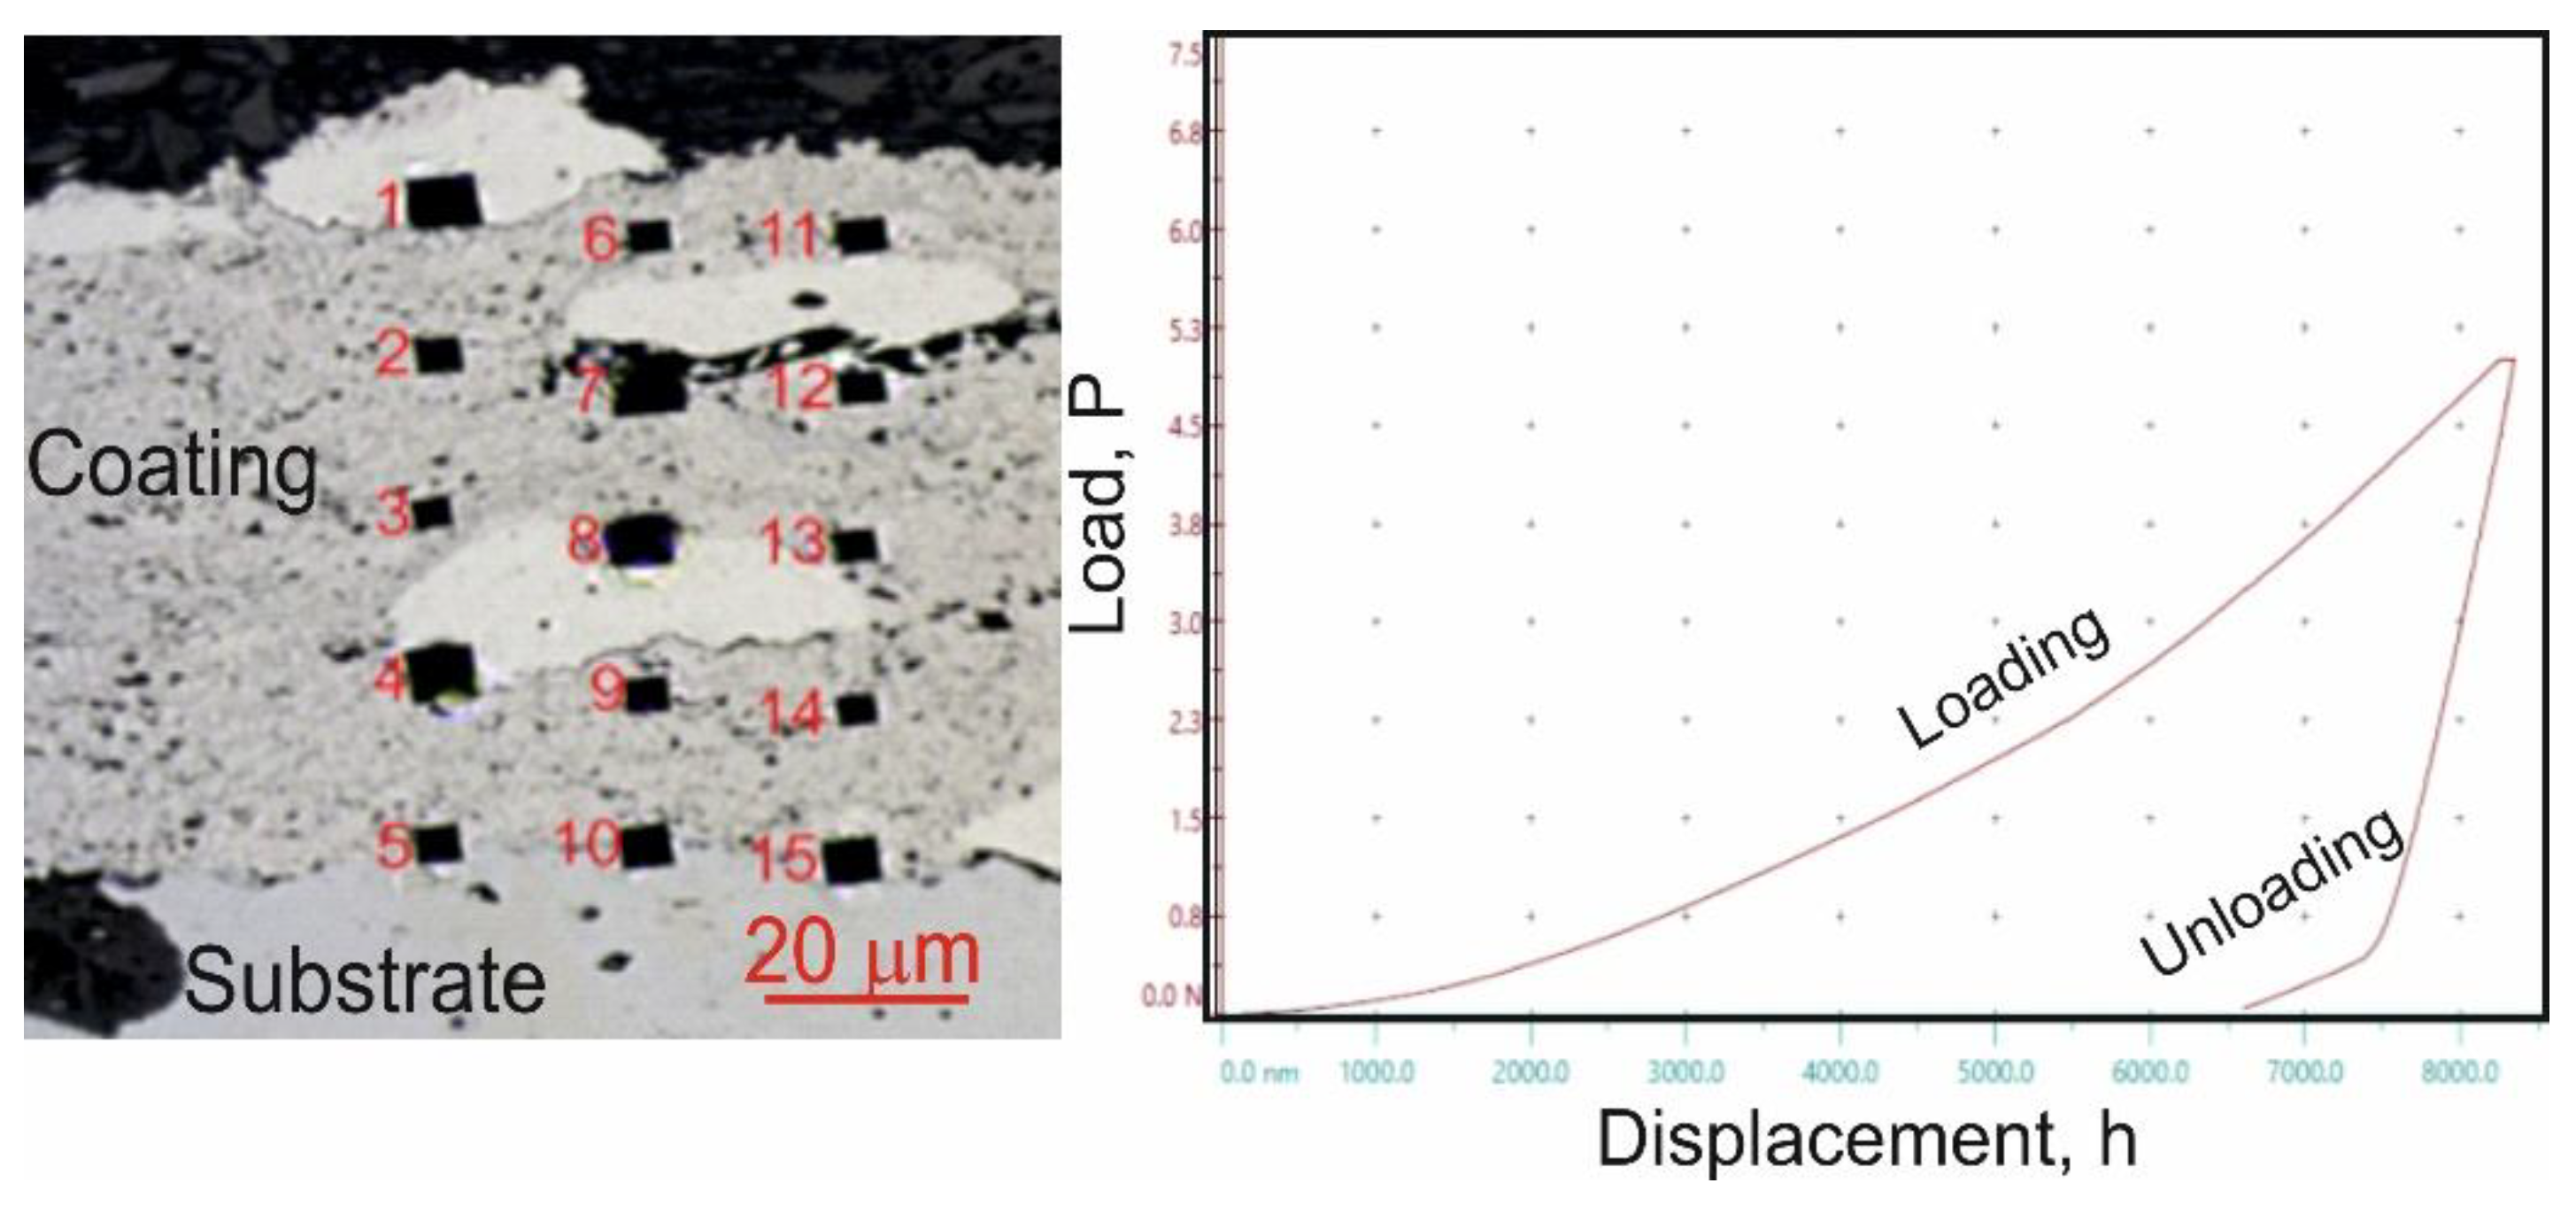
Figure 3.
Cross-sectional microstructures of the (Cr₃C₂-NiCr+Ni)/ductile cast iron system at (a) low and (b) high magnifications.
Figure 3.
Cross-sectional microstructures of the (Cr₃C₂-NiCr+Ni)/ductile cast iron system at (a) low and (b) high magnifications.
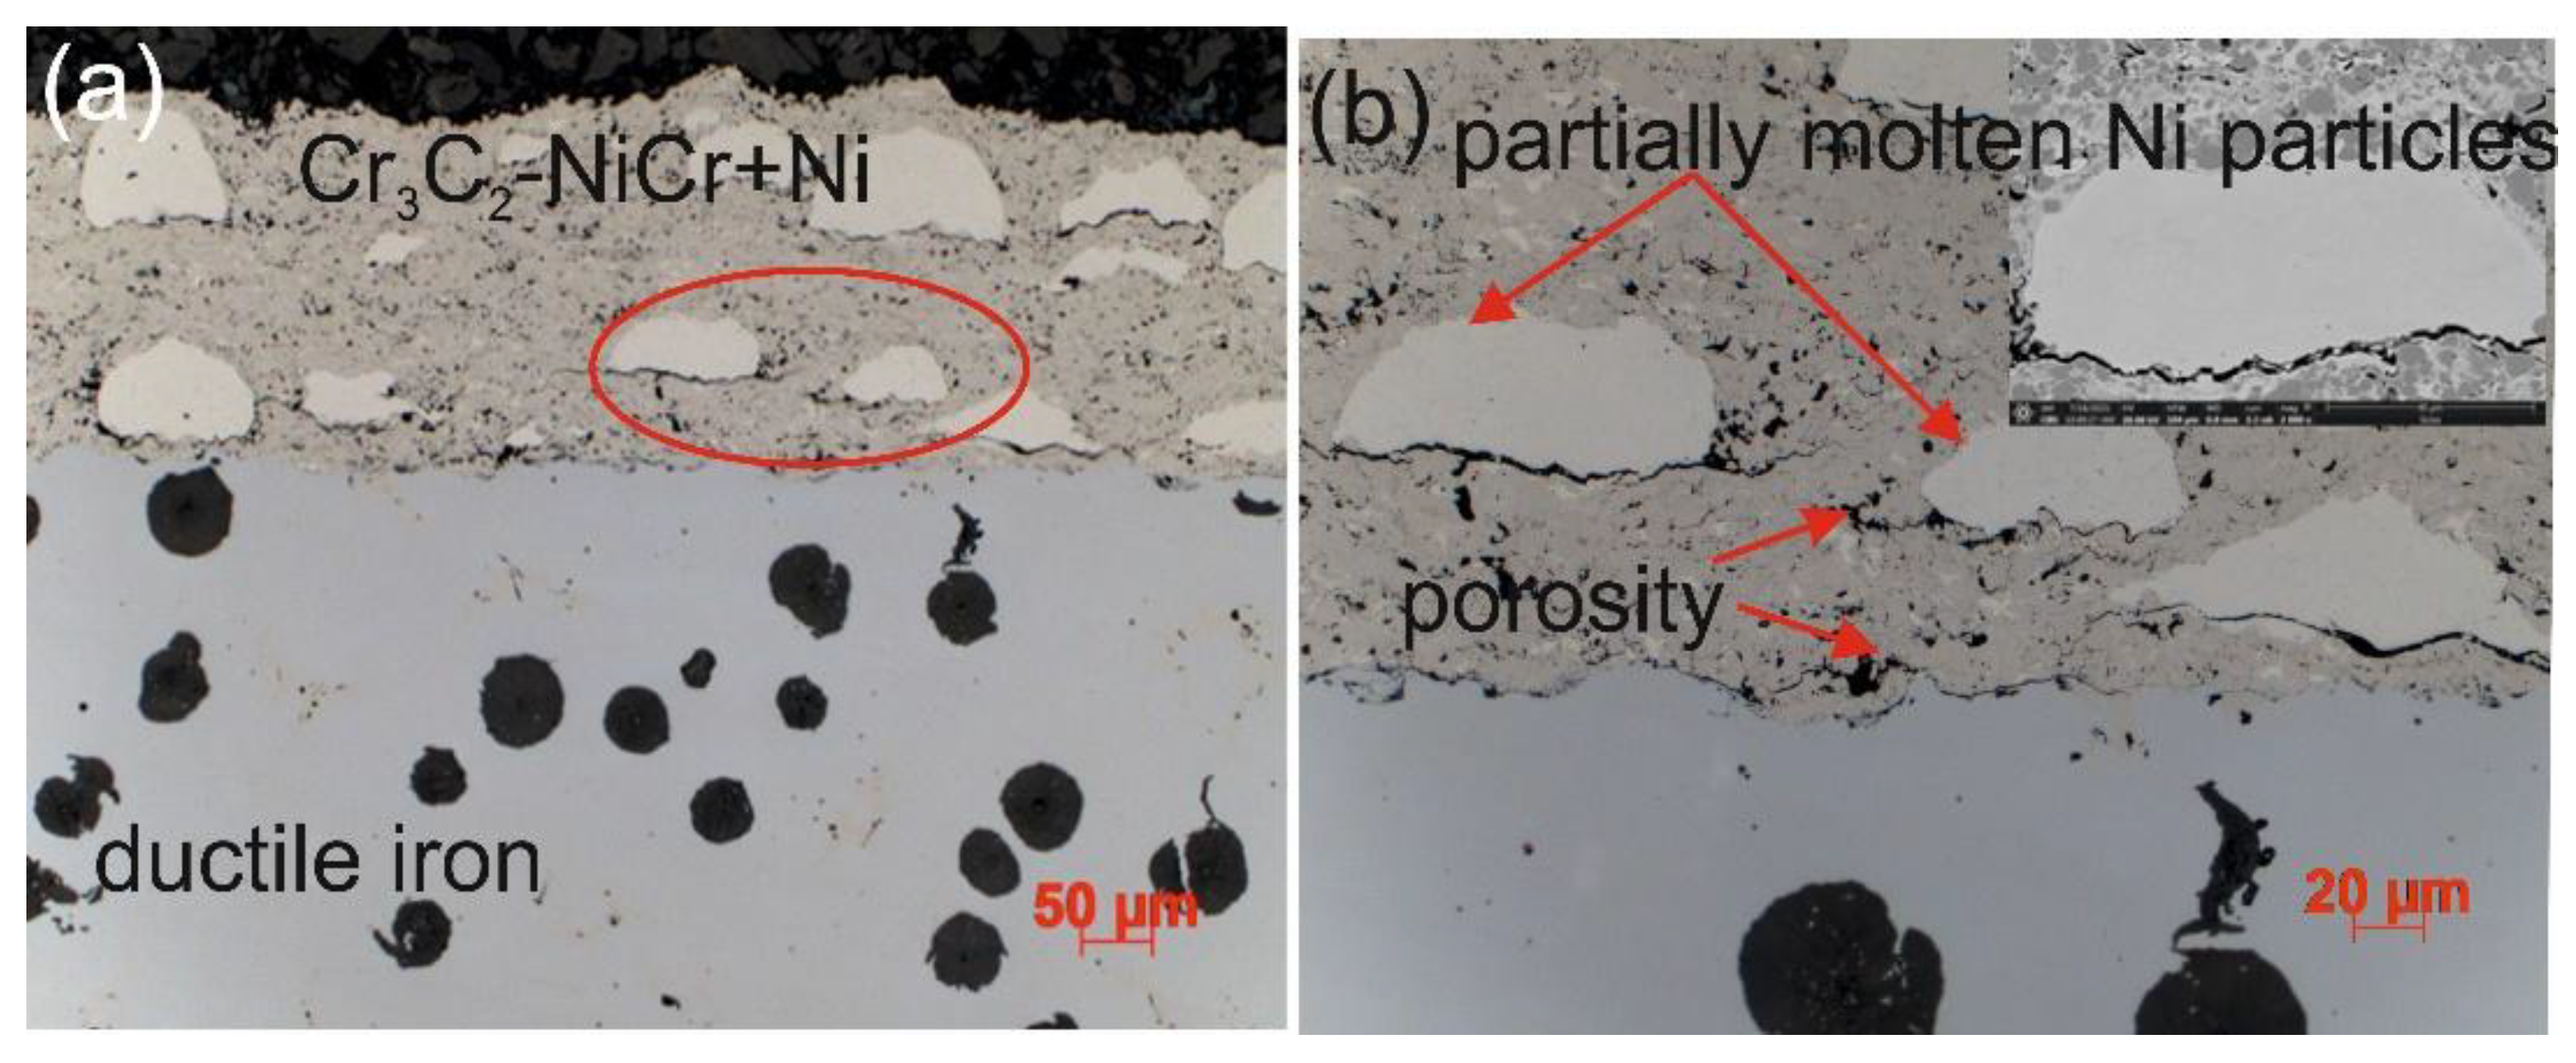
Figure 4.
(a) Cross-sectional SEM micrographs of the (Cr₃C₂-NiCr+Ni)/ductile cast iron system with EDS spectra taken from the marked points 1, 2, and 3 (b) linear distribution of Cr, Ni, C, O, and Fe concentrations, and (c) elemental mapping of Cr, Ni, C, O, and Fe from the interface region.
Figure 4.
(a) Cross-sectional SEM micrographs of the (Cr₃C₂-NiCr+Ni)/ductile cast iron system with EDS spectra taken from the marked points 1, 2, and 3 (b) linear distribution of Cr, Ni, C, O, and Fe concentrations, and (c) elemental mapping of Cr, Ni, C, O, and Fe from the interface region.
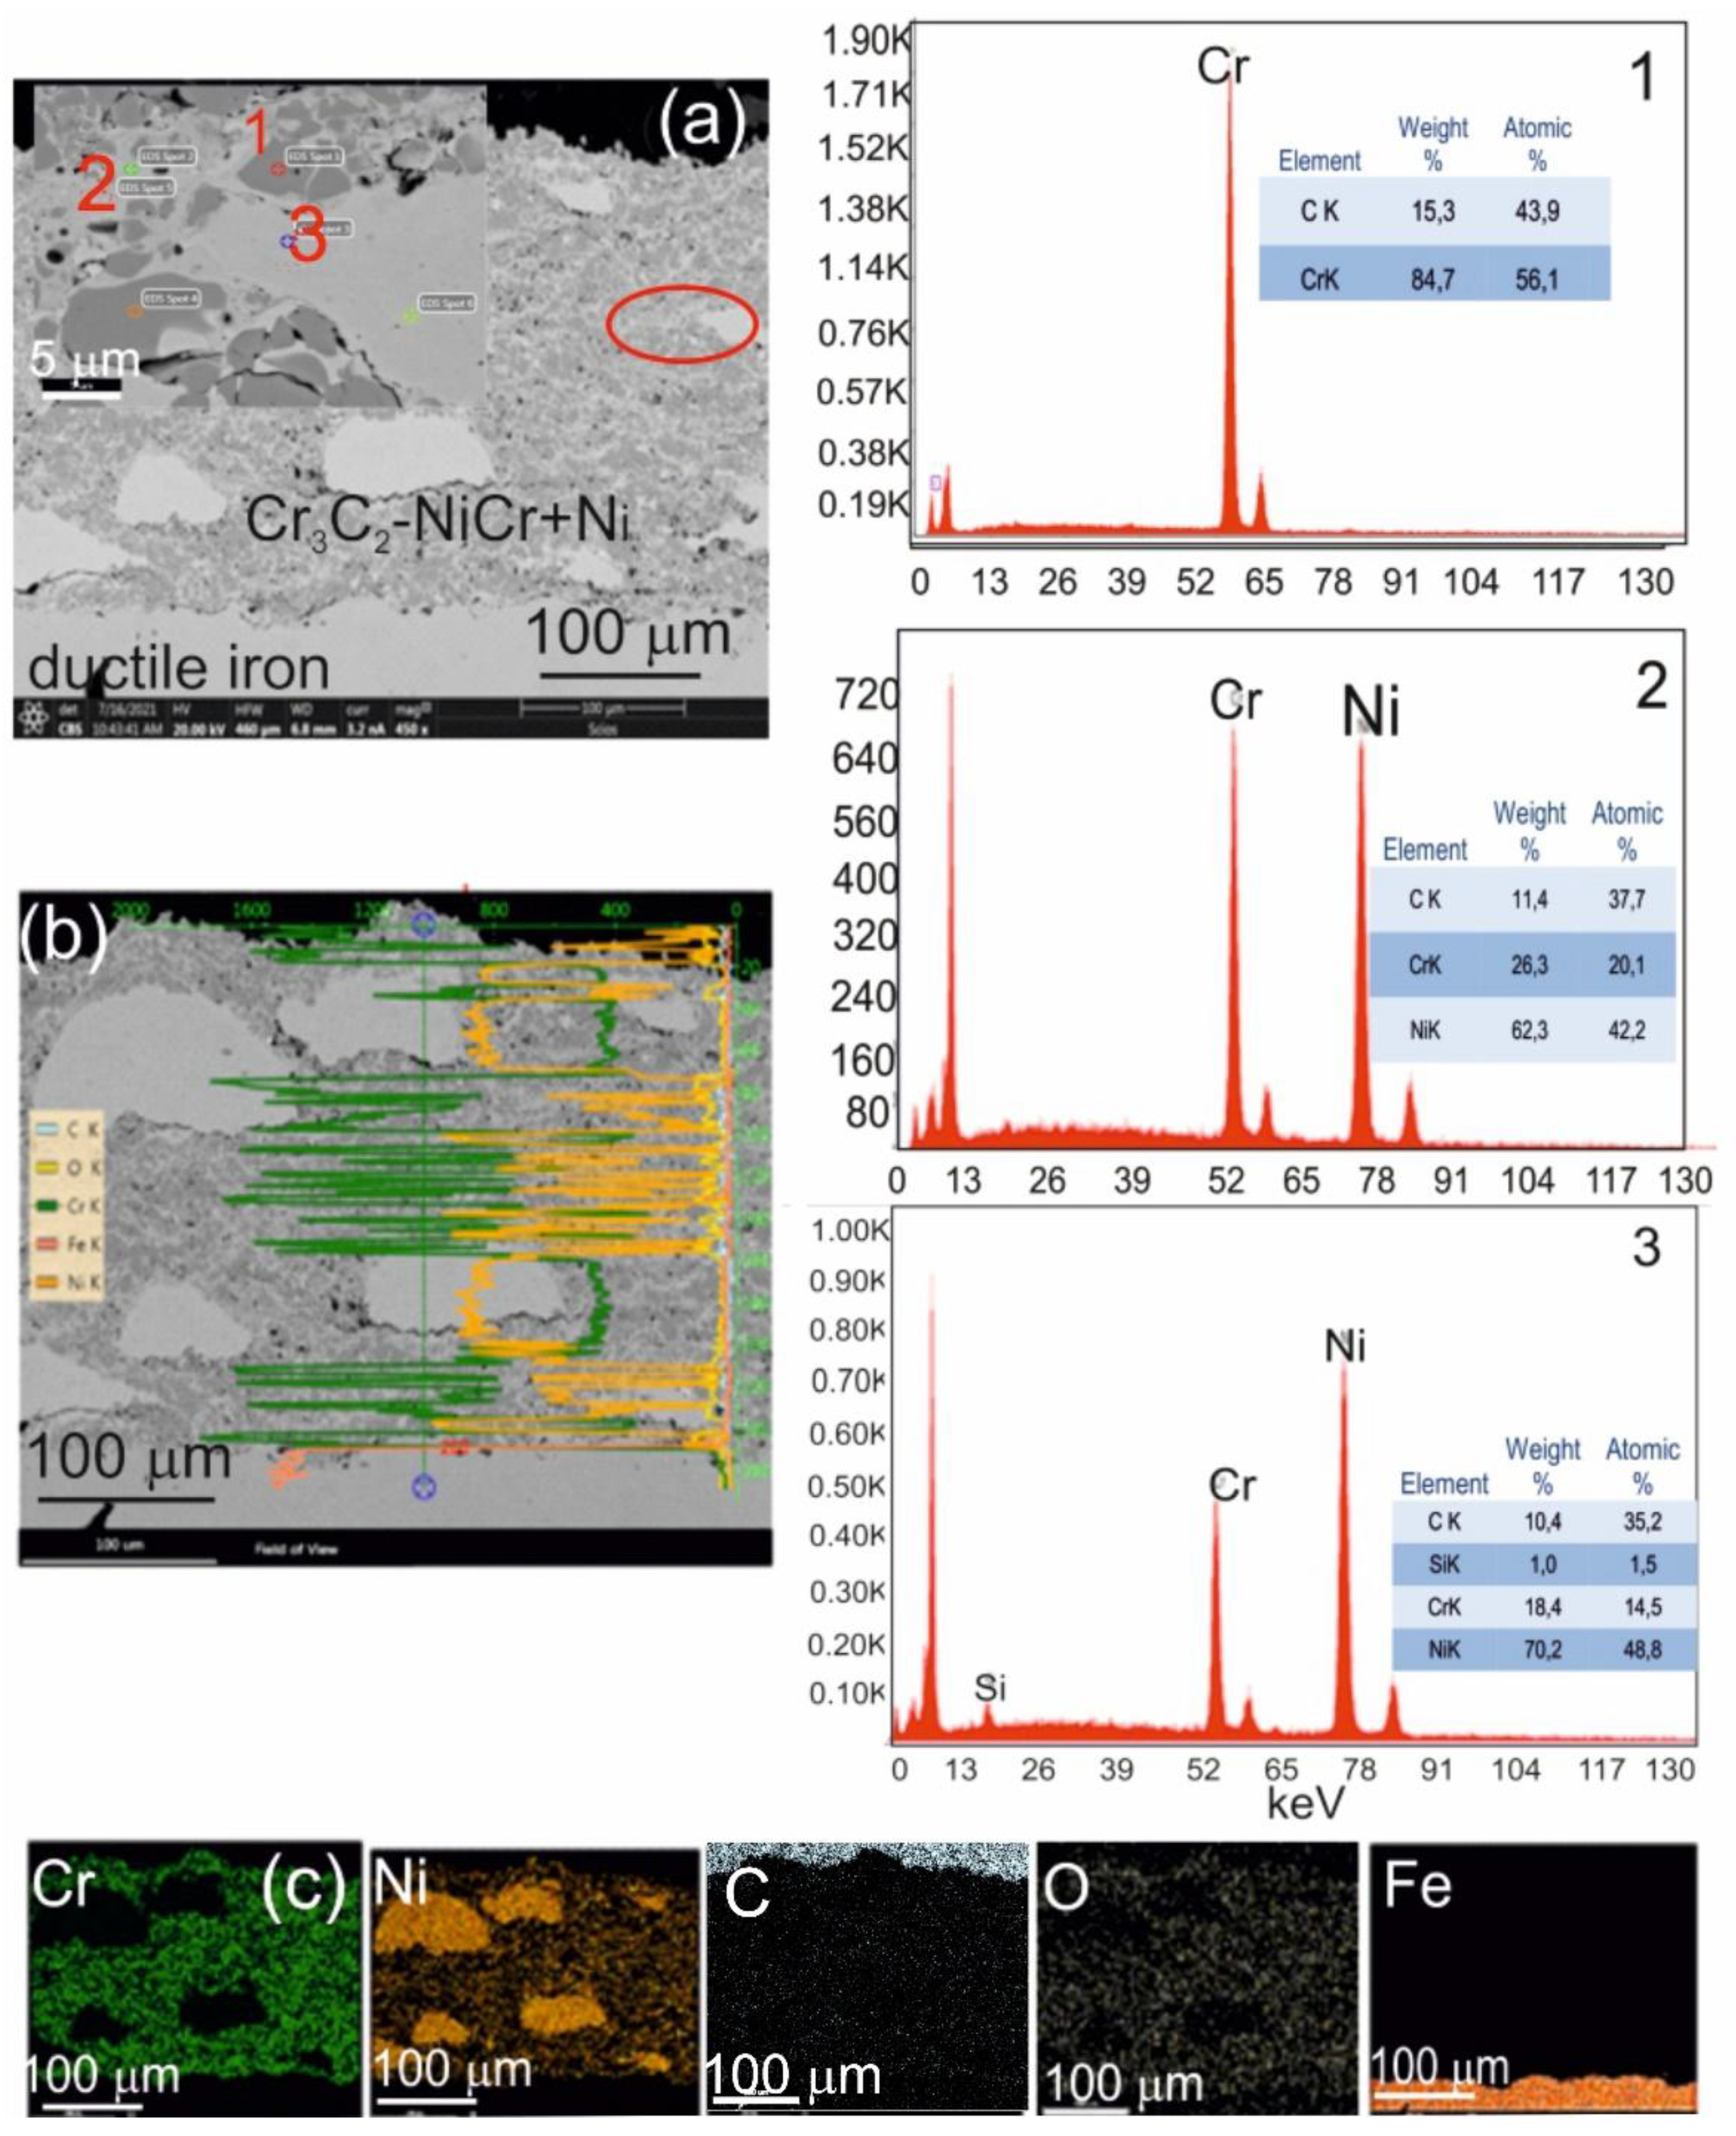
Figure 5.
XRD pattern of the (Cr3C2-NiCr+Ni) coating.
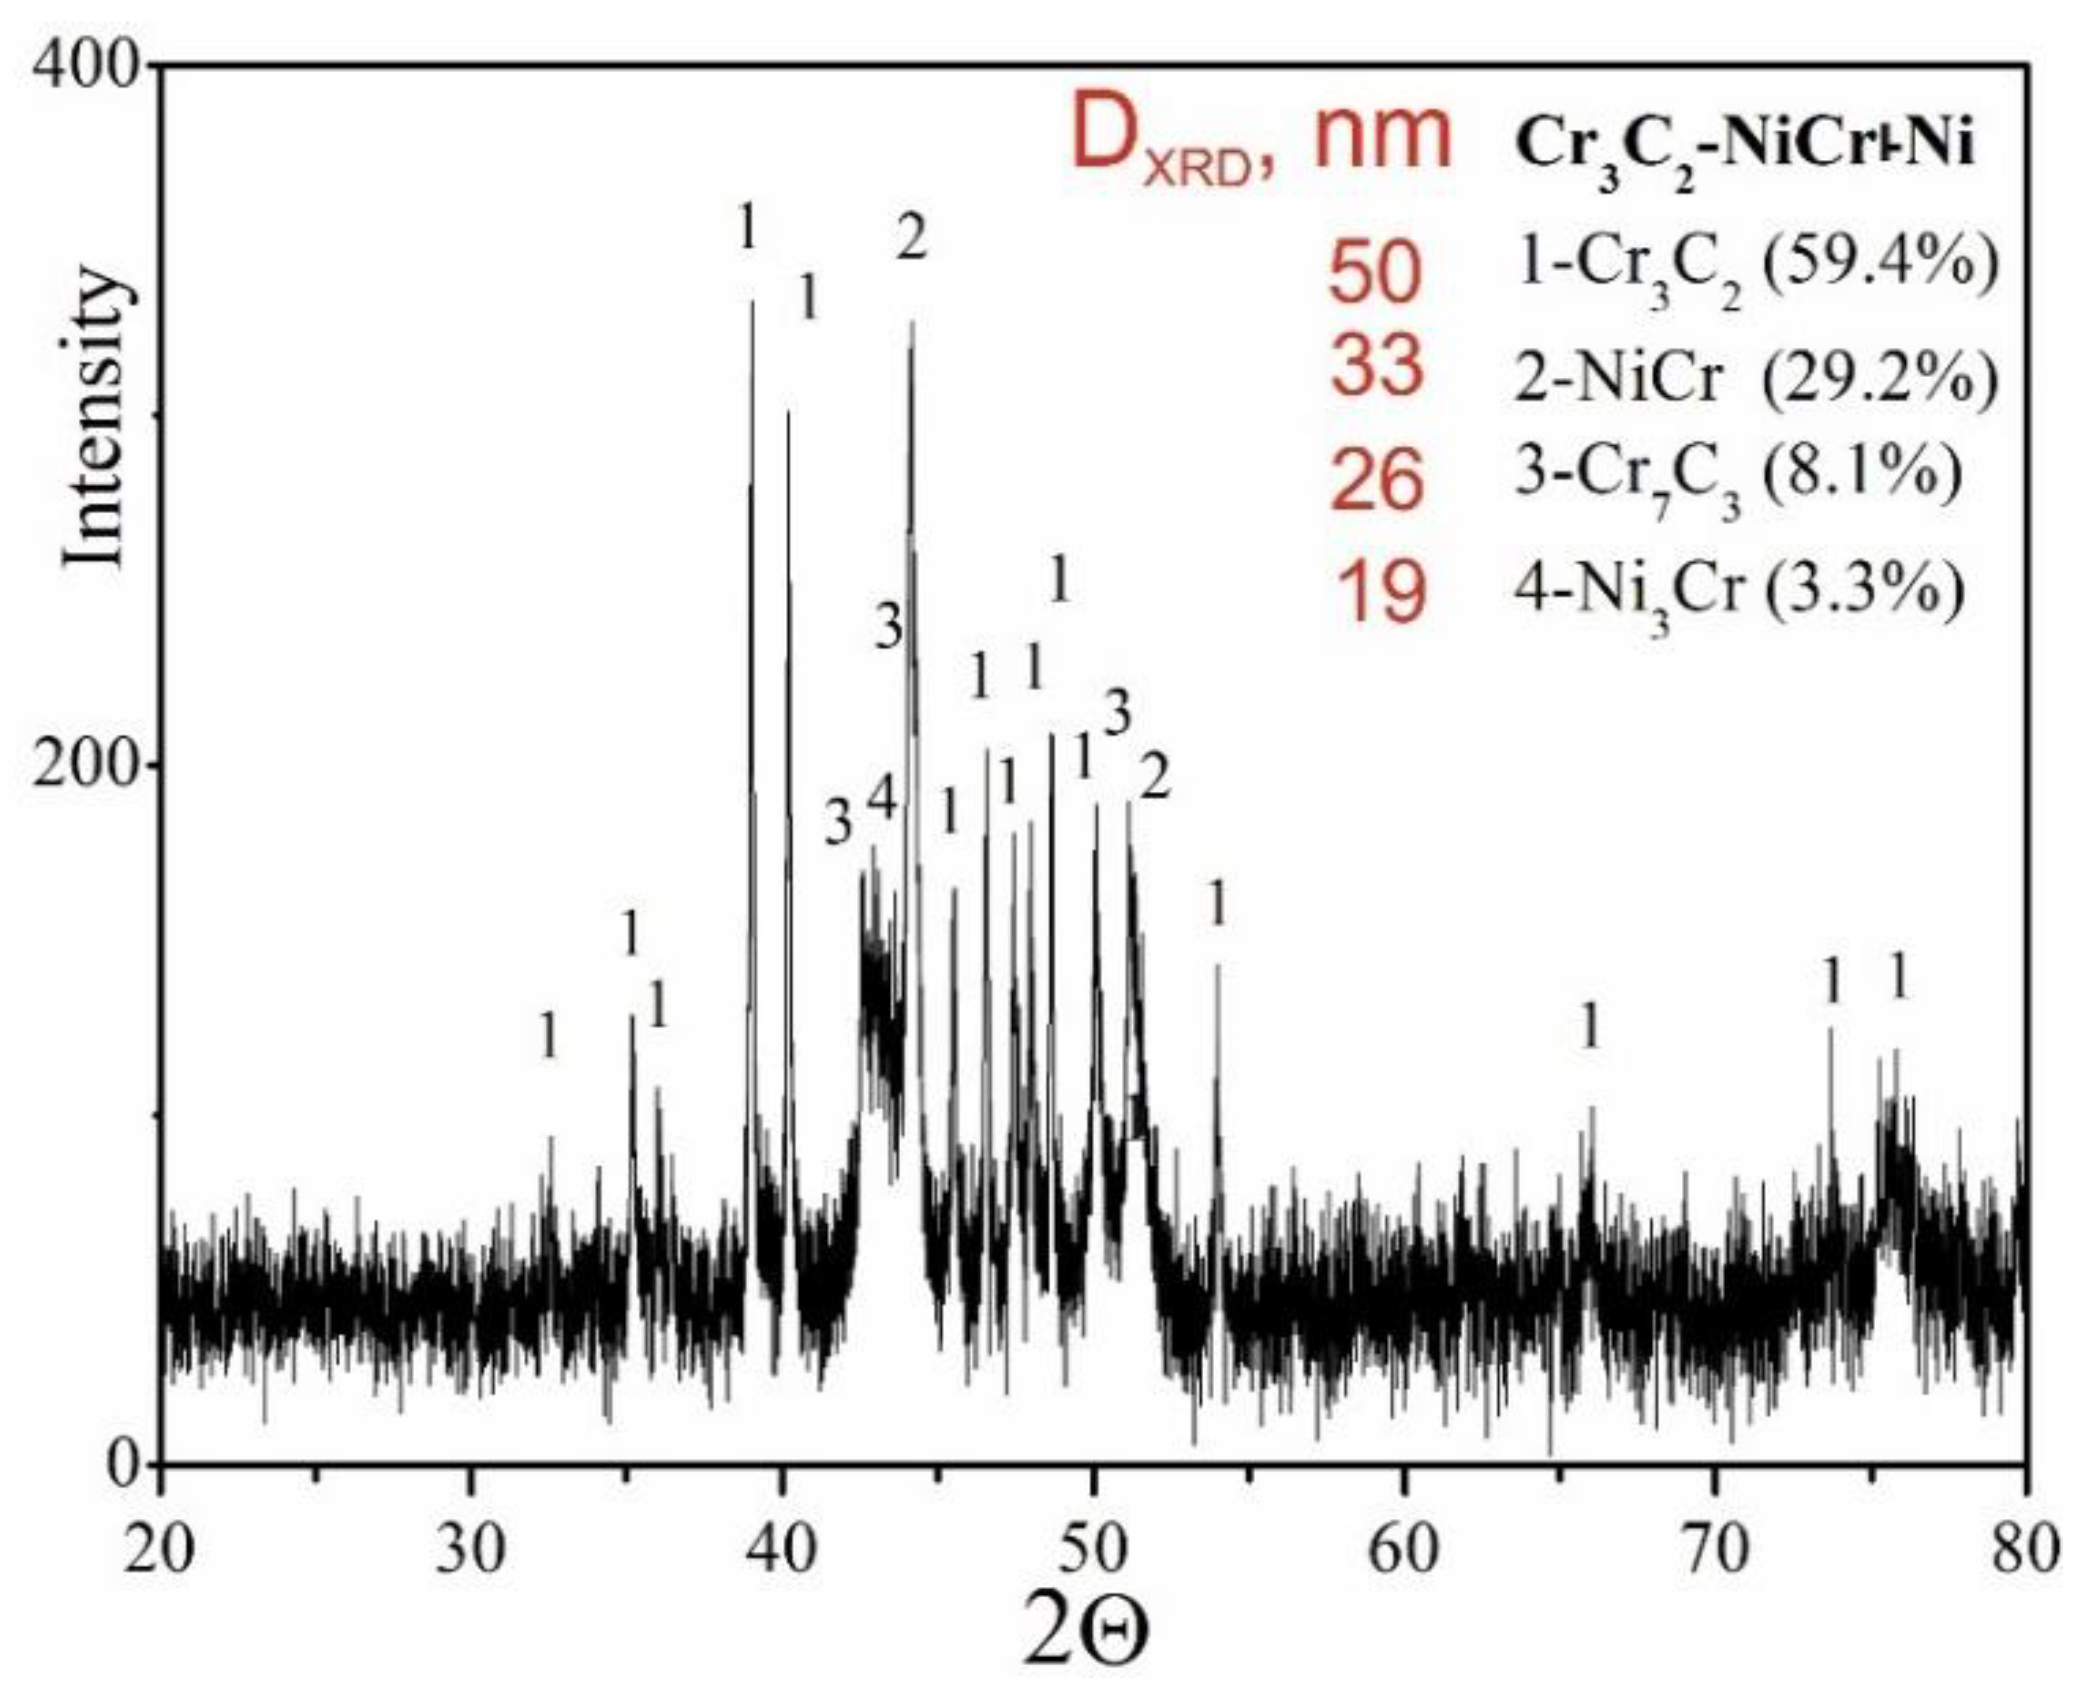
Figure 6.
3D view of the surface of the (Cr₃C₂-NiCr+Ni) coating recorded using a confocal laser scanning microscope.
Figure 6.
3D view of the surface of the (Cr₃C₂-NiCr+Ni) coating recorded using a confocal laser scanning microscope.
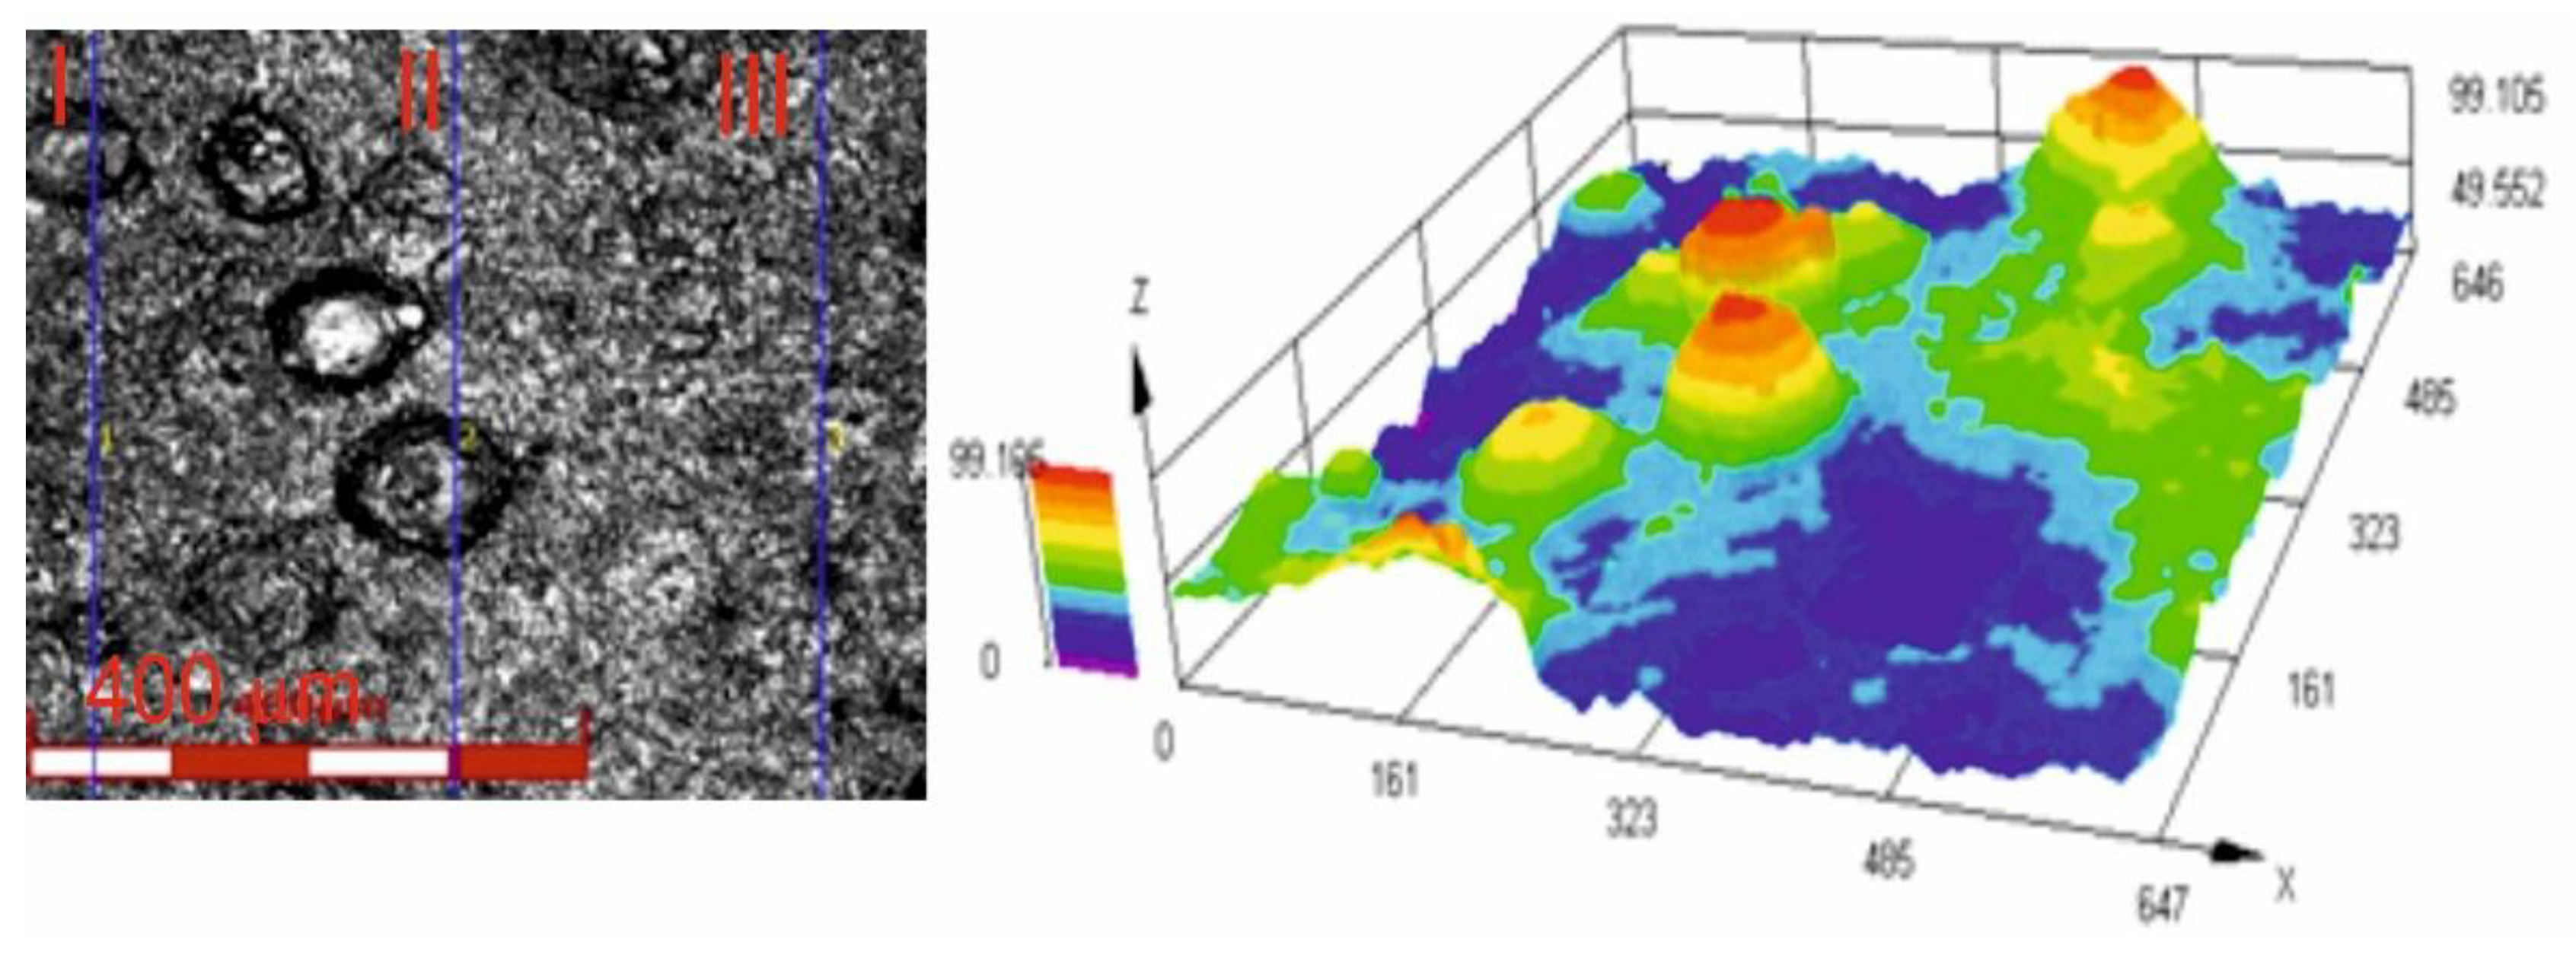
Figure 7.
LM/SEM micrographs showing cone-shaped fractures occurring during the scratch bond strength test under progressive loading (0.03–3 N) for the following coating systems: (a) (Cr₃C₂-NiCr+Ni)/ductile cast iron and (b) Cr₃C₂-NiCr/ductile cast iron.
Figure 7.
LM/SEM micrographs showing cone-shaped fractures occurring during the scratch bond strength test under progressive loading (0.03–3 N) for the following coating systems: (a) (Cr₃C₂-NiCr+Ni)/ductile cast iron and (b) Cr₃C₂-NiCr/ductile cast iron.
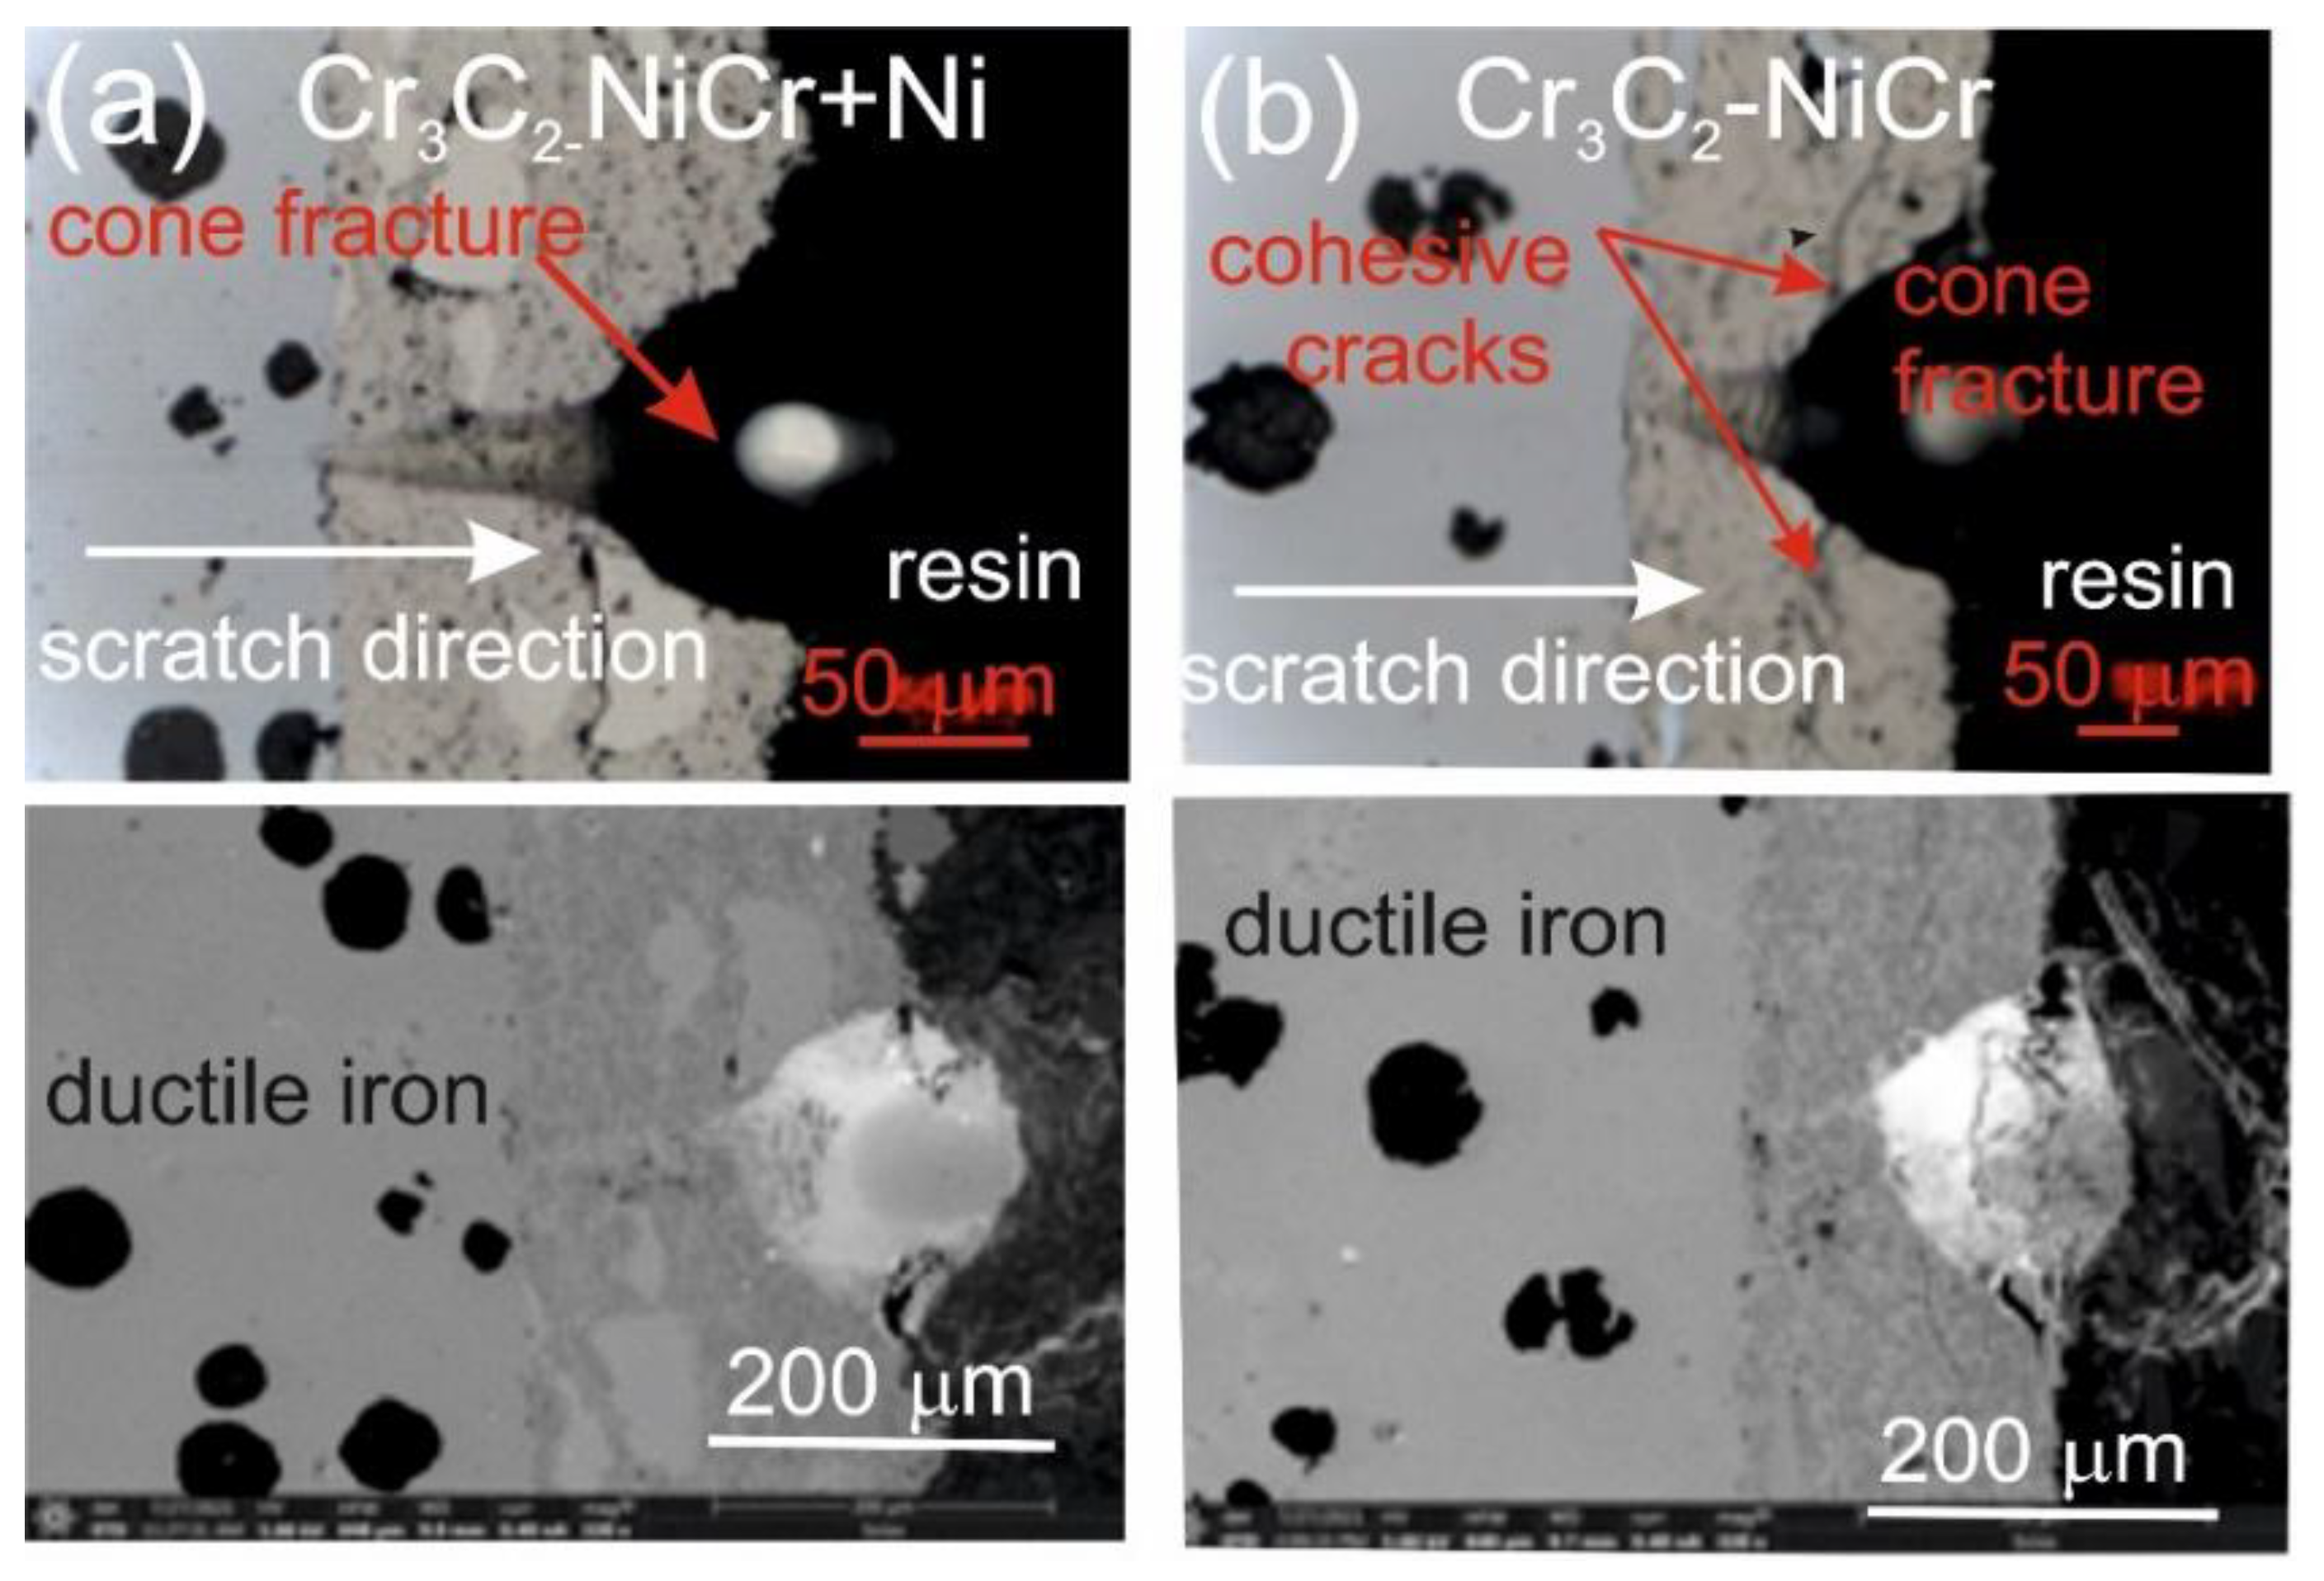
Figure 8.
LM/SEM micrographs showing cone-shaped fractures occurring during the scratch bond strength test under constant loads of 5, 10, 15, 20, and 25 N for the (Cr₃C₂-NiCr+Ni)/ductile cast iron coating system.
Figure 8.
LM/SEM micrographs showing cone-shaped fractures occurring during the scratch bond strength test under constant loads of 5, 10, 15, 20, and 25 N for the (Cr₃C₂-NiCr+Ni)/ductile cast iron coating system.
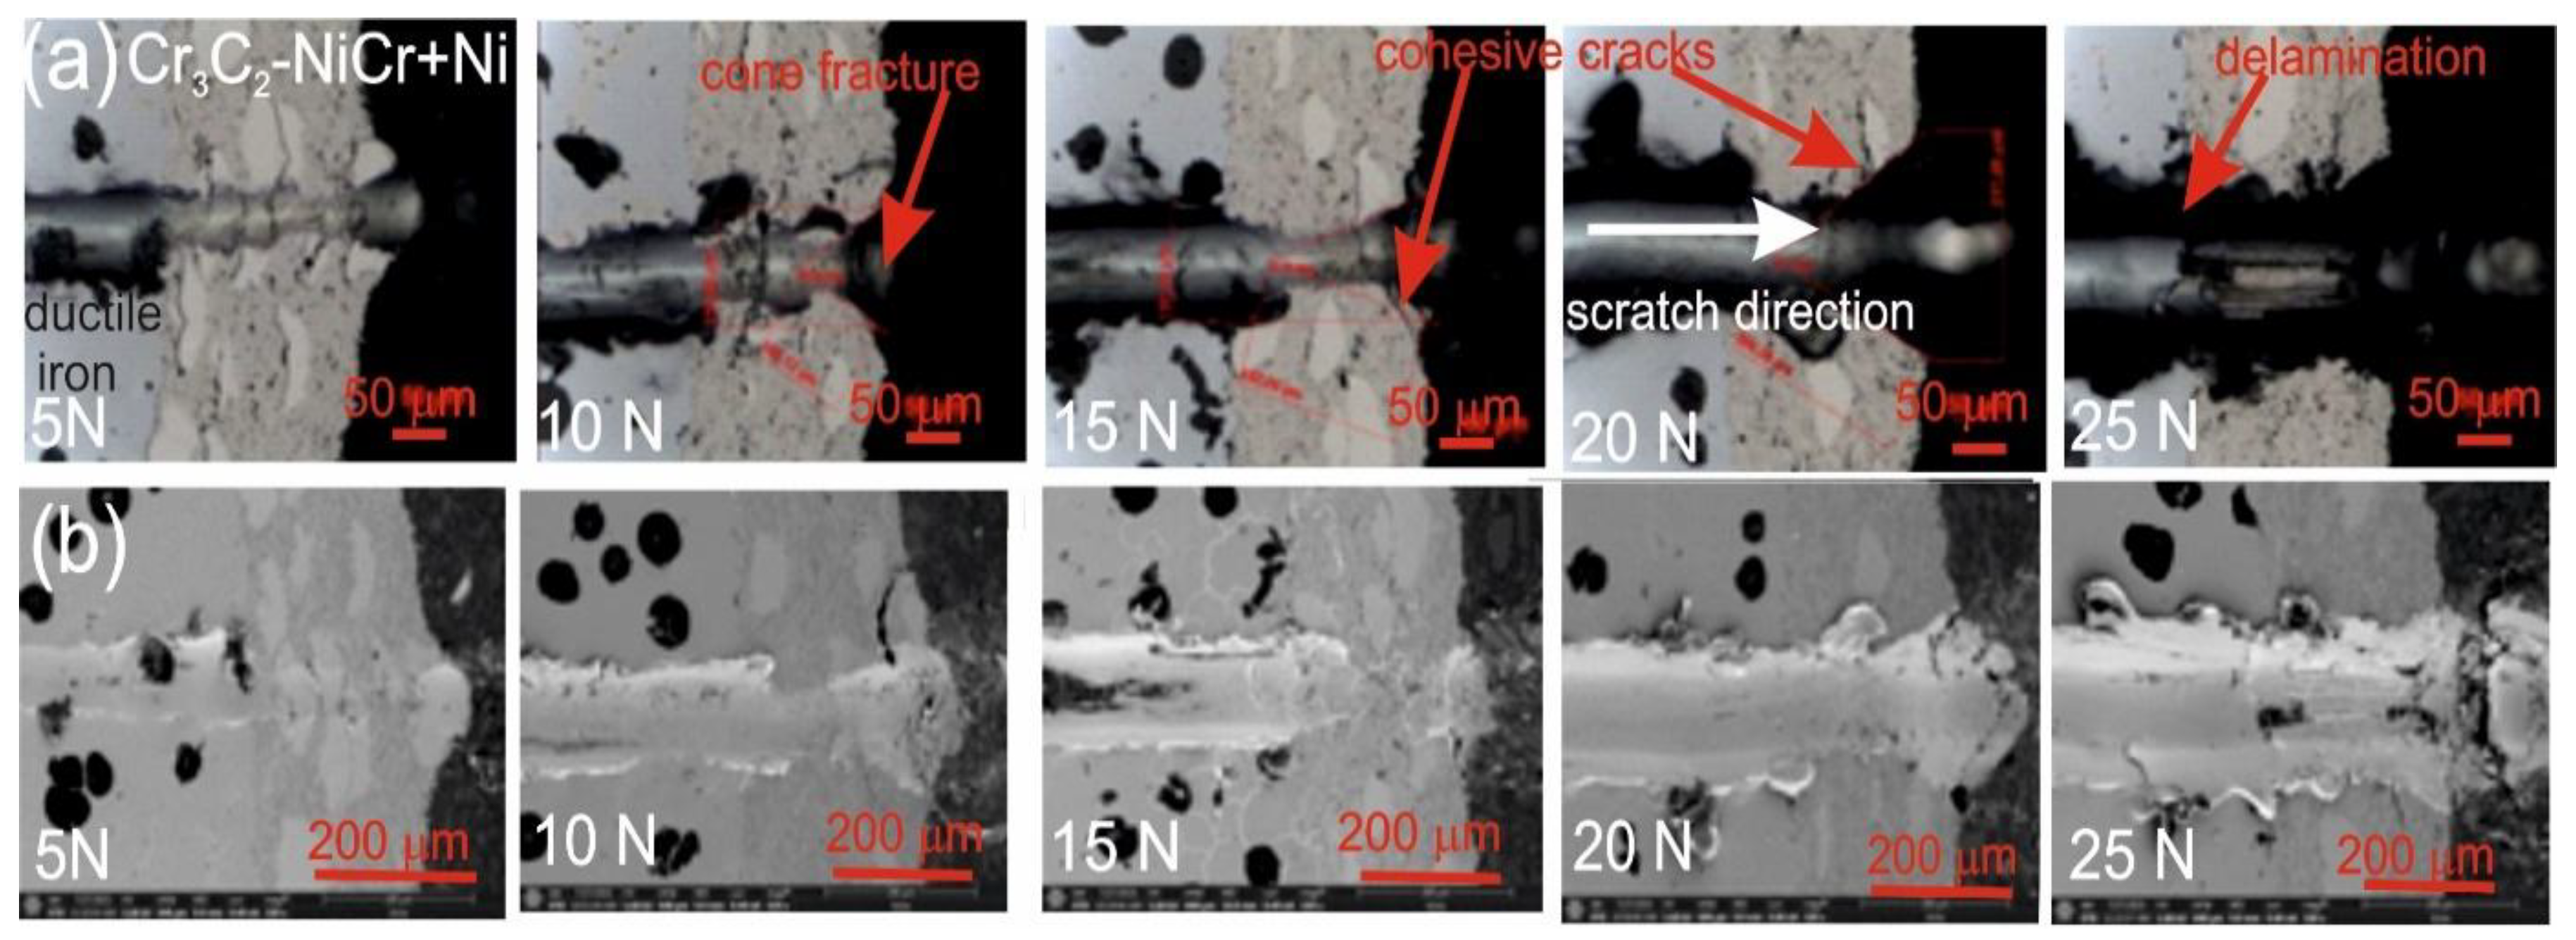
Figure 9.
Variation of the friction coefficient with sliding distance for the following coatings: (Cr₃C₂-NiCr+Ni), Cr₃C₂-NiCr, and ductile cast iron, along with optical micrographs of the wear track after the scratch test.
Figure 9.
Variation of the friction coefficient with sliding distance for the following coatings: (Cr₃C₂-NiCr+Ni), Cr₃C₂-NiCr, and ductile cast iron, along with optical micrographs of the wear track after the scratch test.
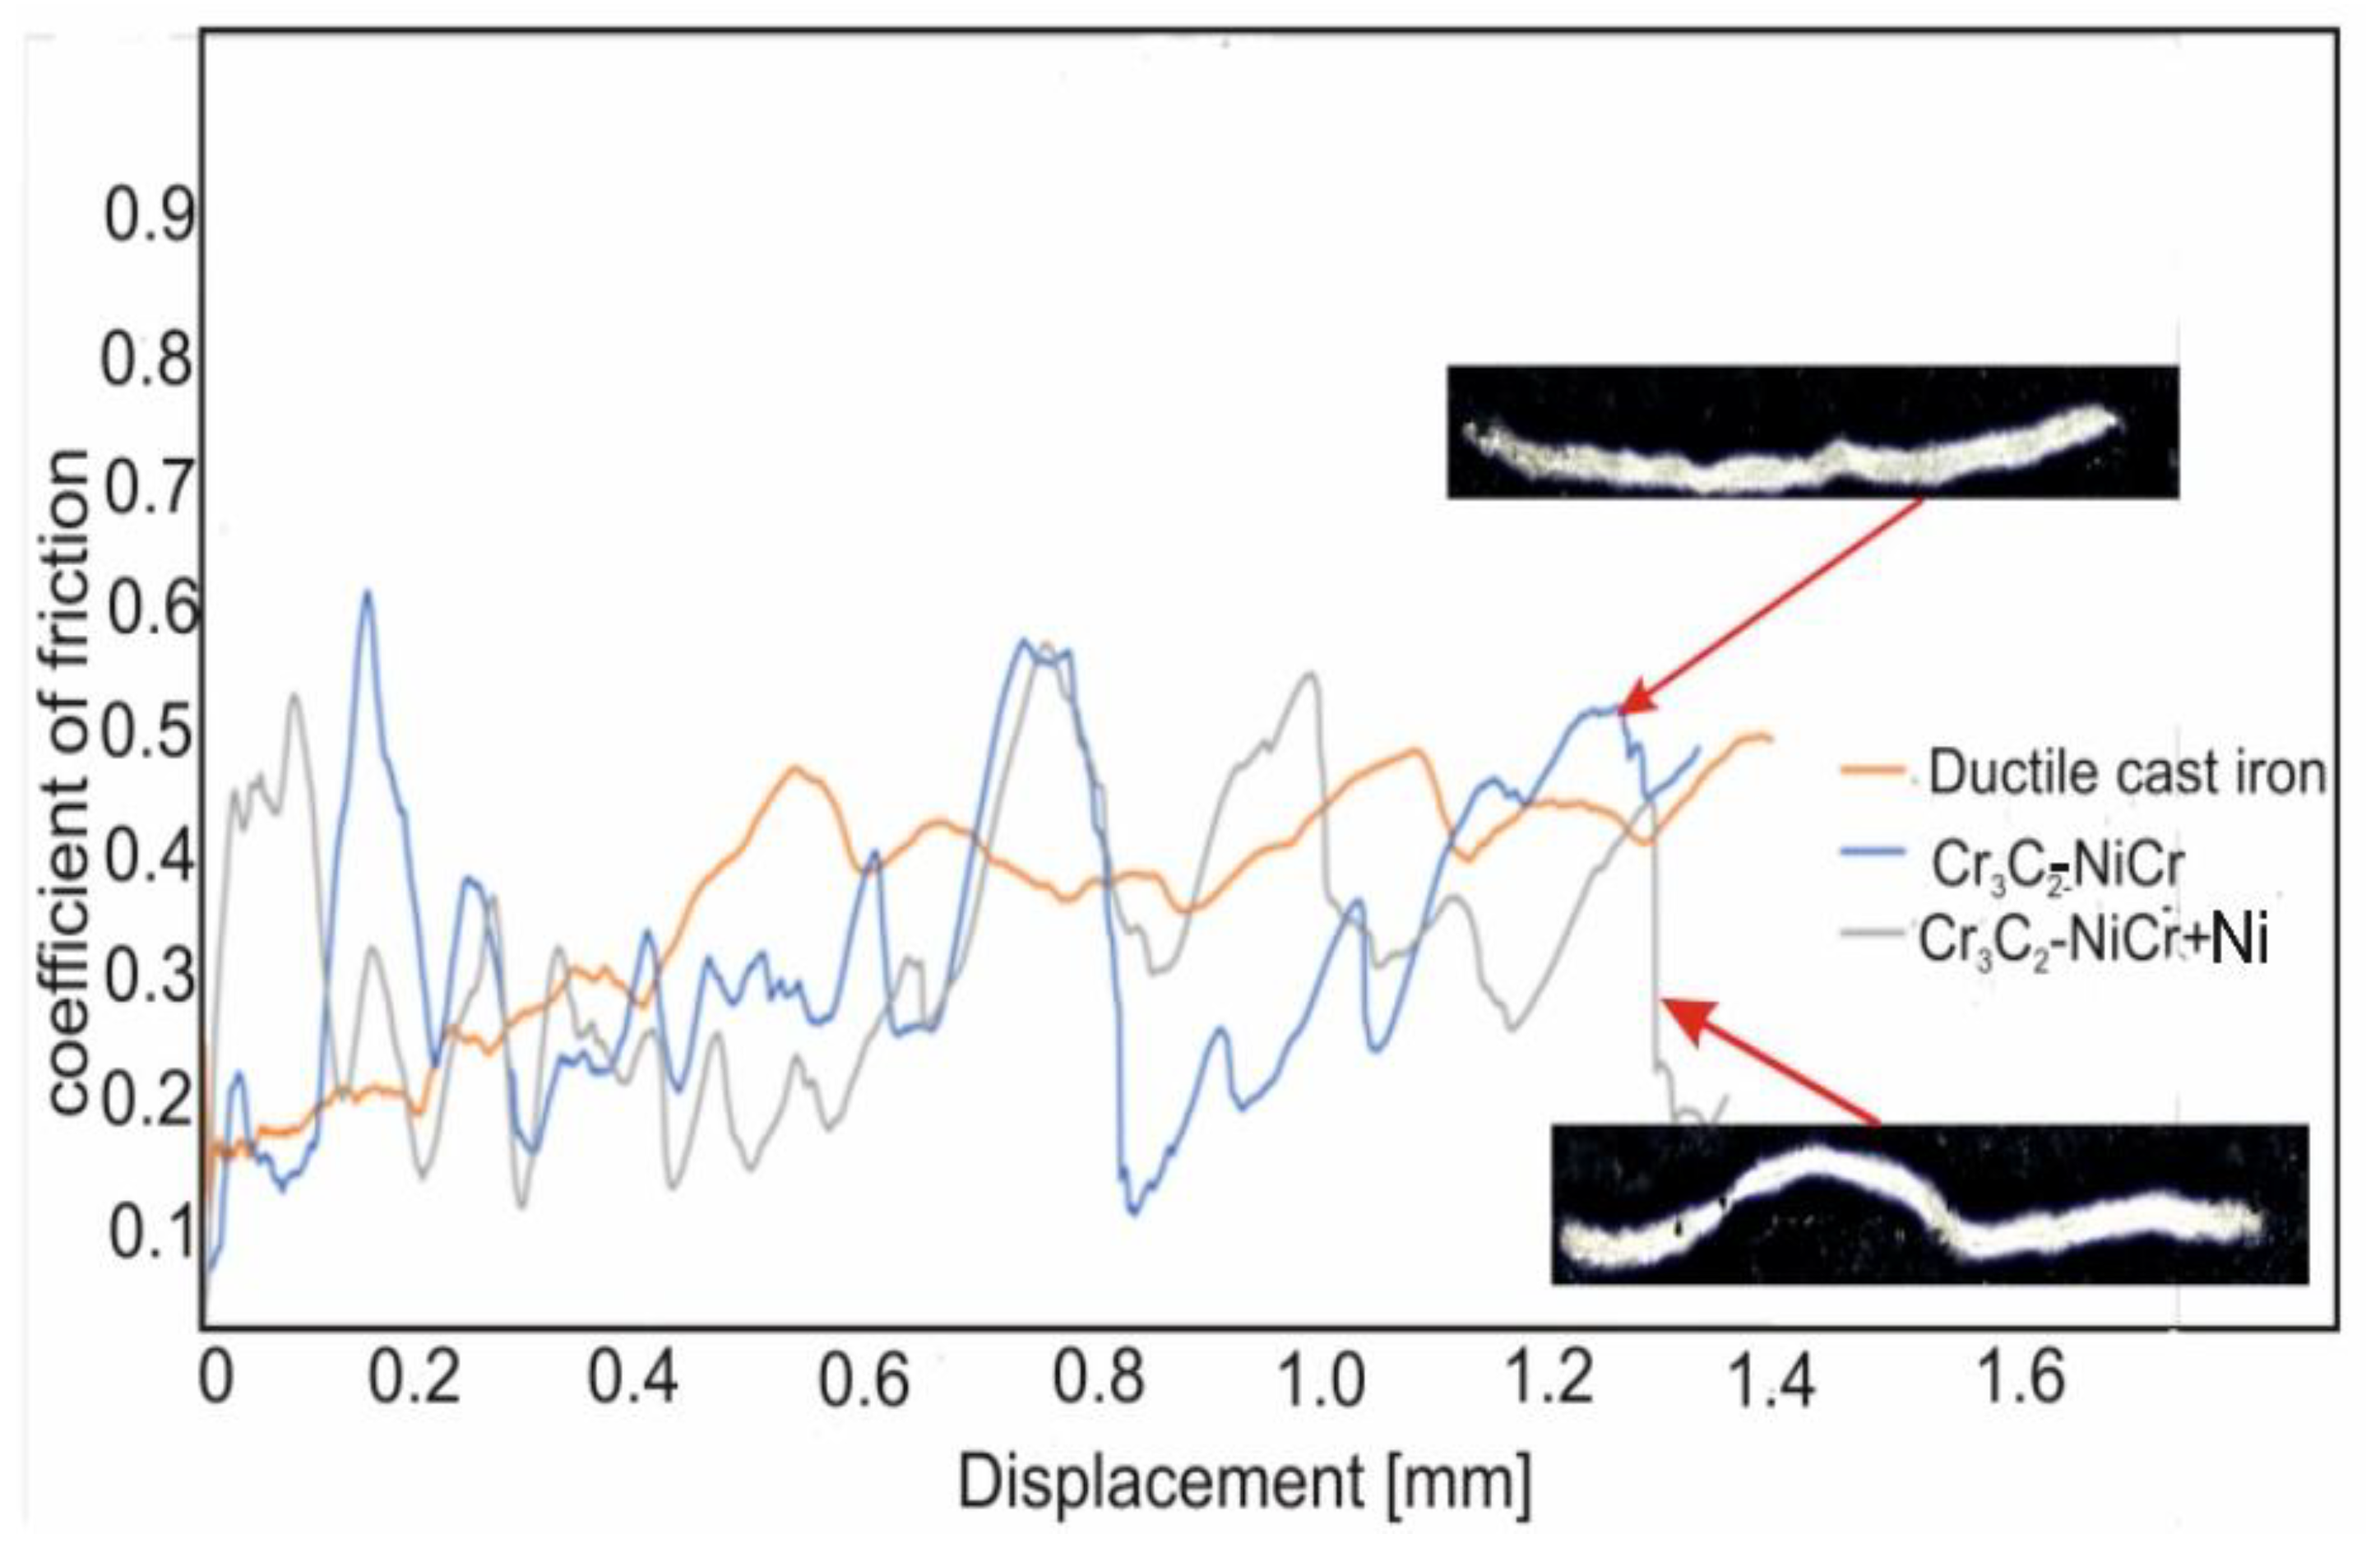
Figure 10.
Cross-sectional LM micrographs of the corroded (Cr₃C₂-NiCr+Ni)/ductile cast iron specimen after corrosion testing in an iron chloride solution.
Figure 10.
Cross-sectional LM micrographs of the corroded (Cr₃C₂-NiCr+Ni)/ductile cast iron specimen after corrosion testing in an iron chloride solution.
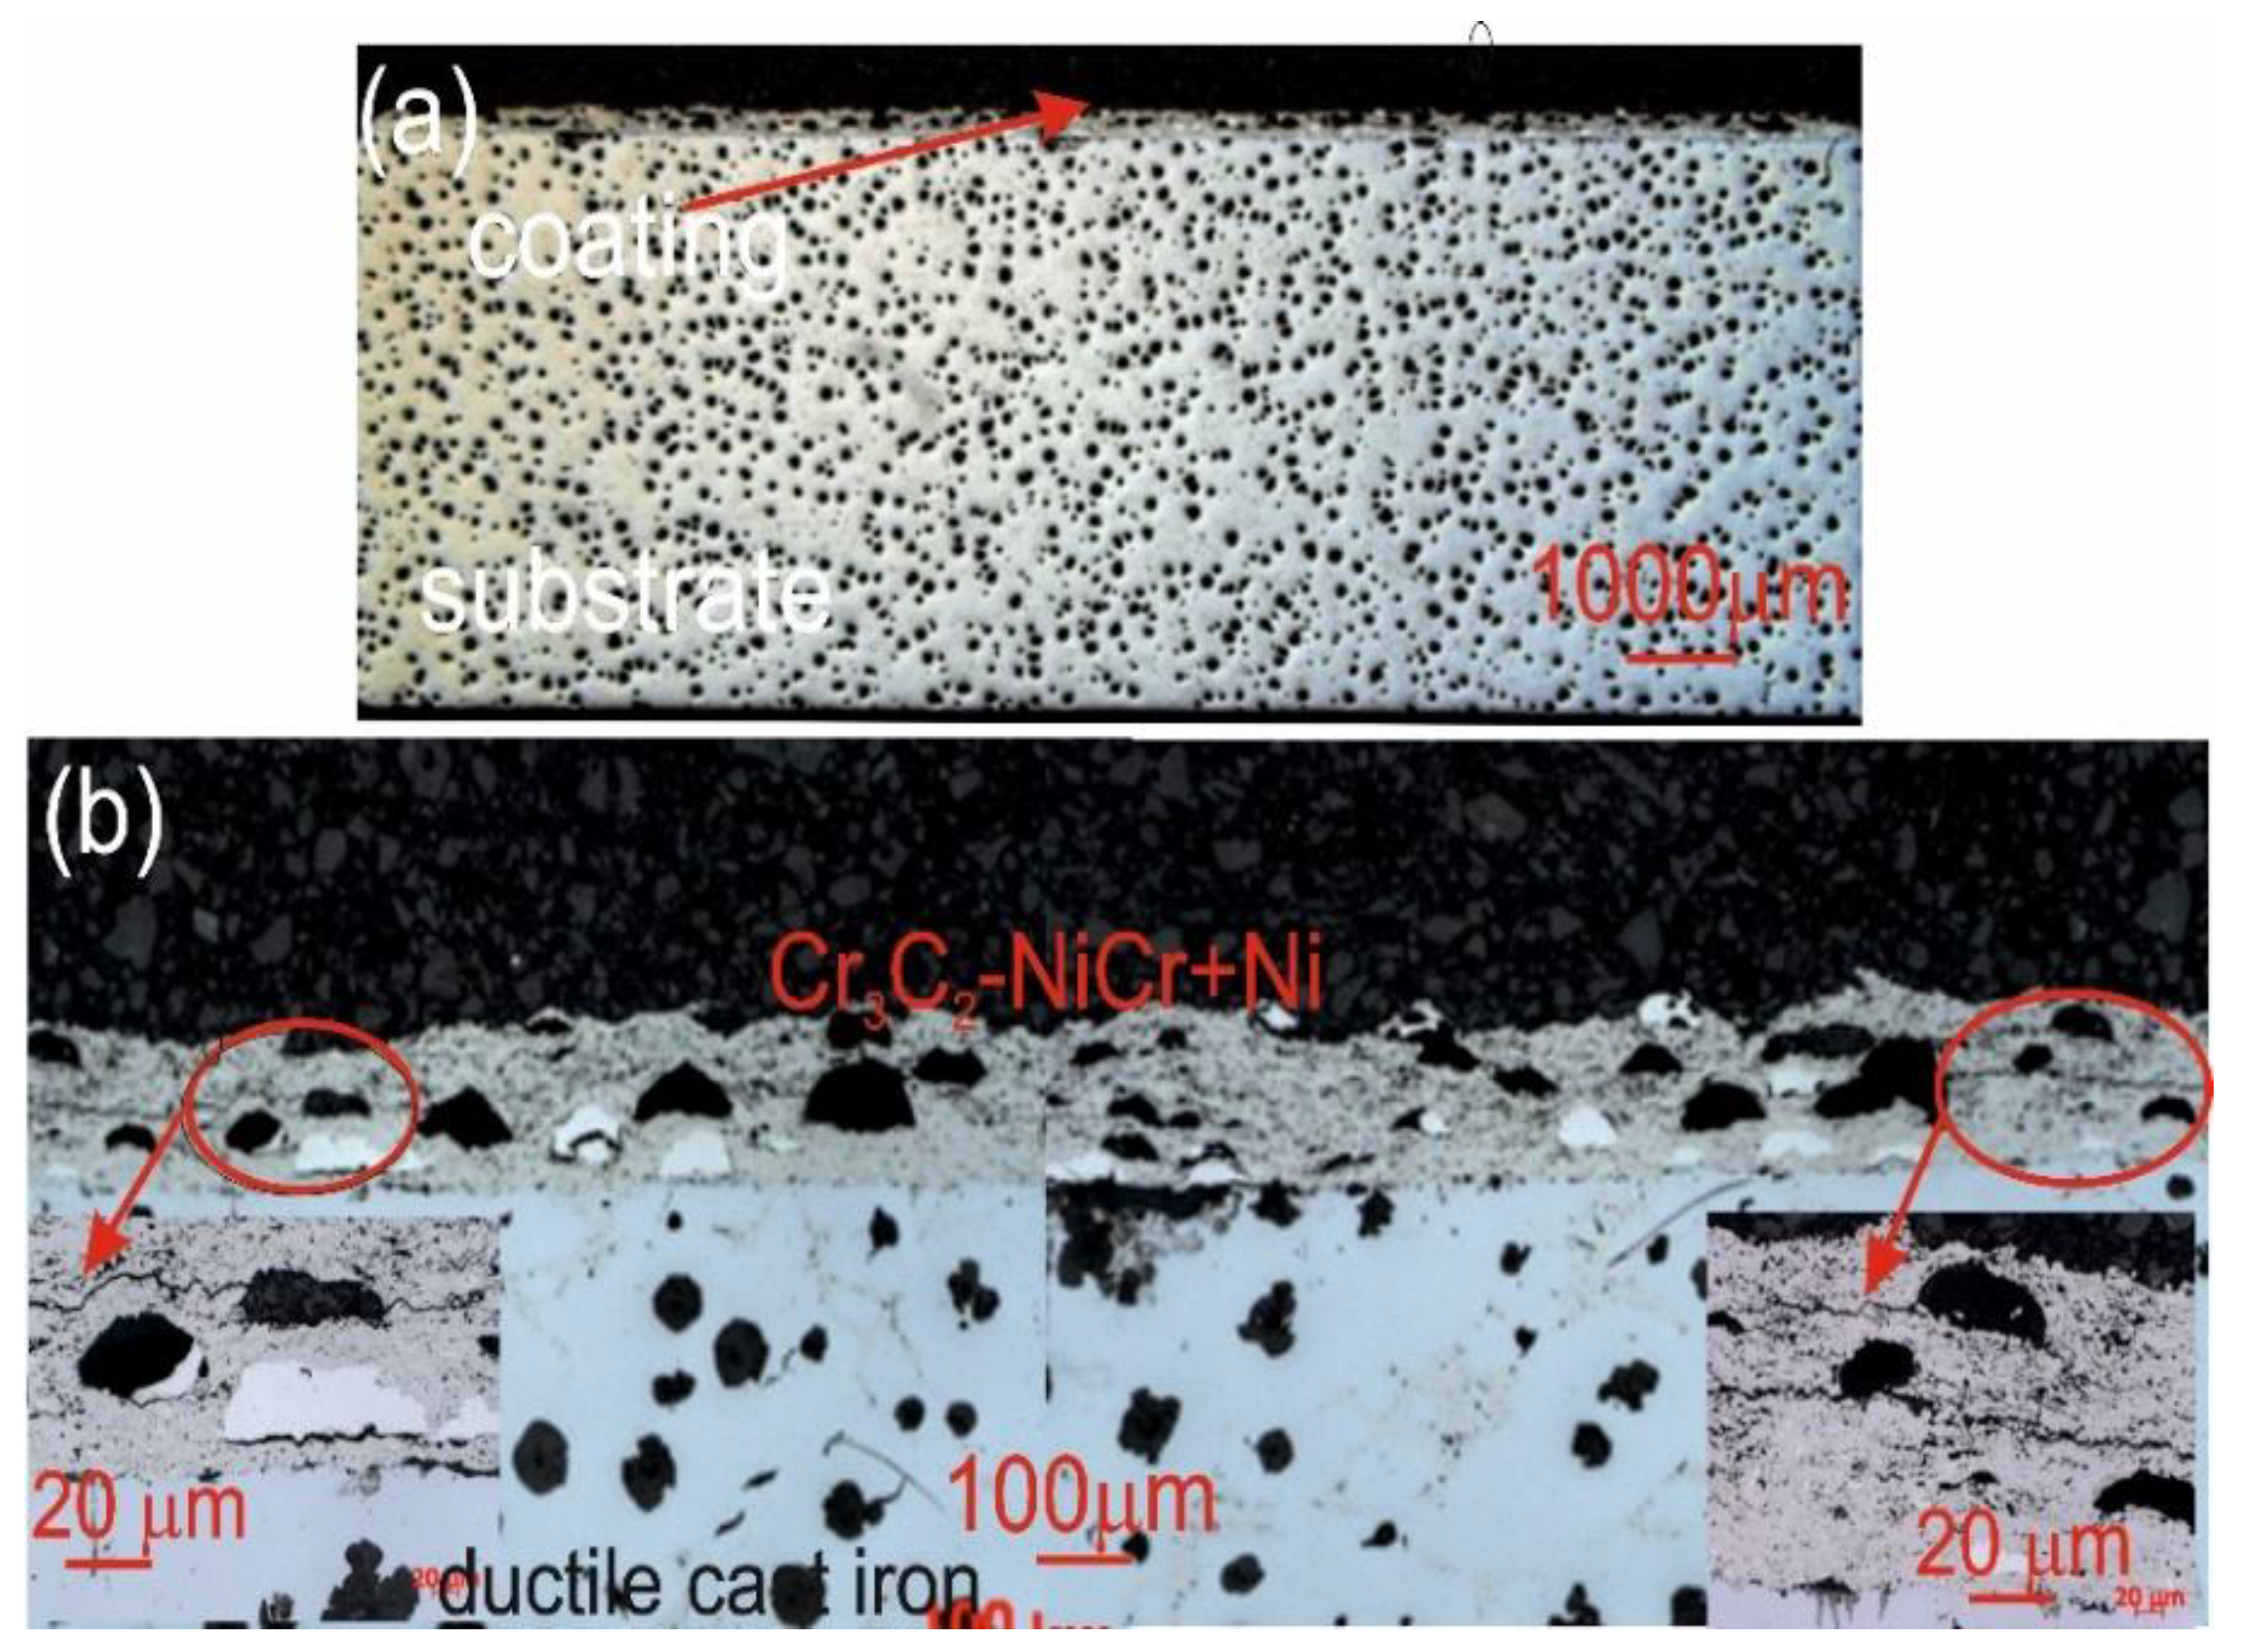
Figure 11.
Cross-sectional LM micrographs of the corroded Cr₃C₂-NiCr/ductile cast iron specimen after corrosion testing in an iron chloride solution.
Figure 11.
Cross-sectional LM micrographs of the corroded Cr₃C₂-NiCr/ductile cast iron specimen after corrosion testing in an iron chloride solution.
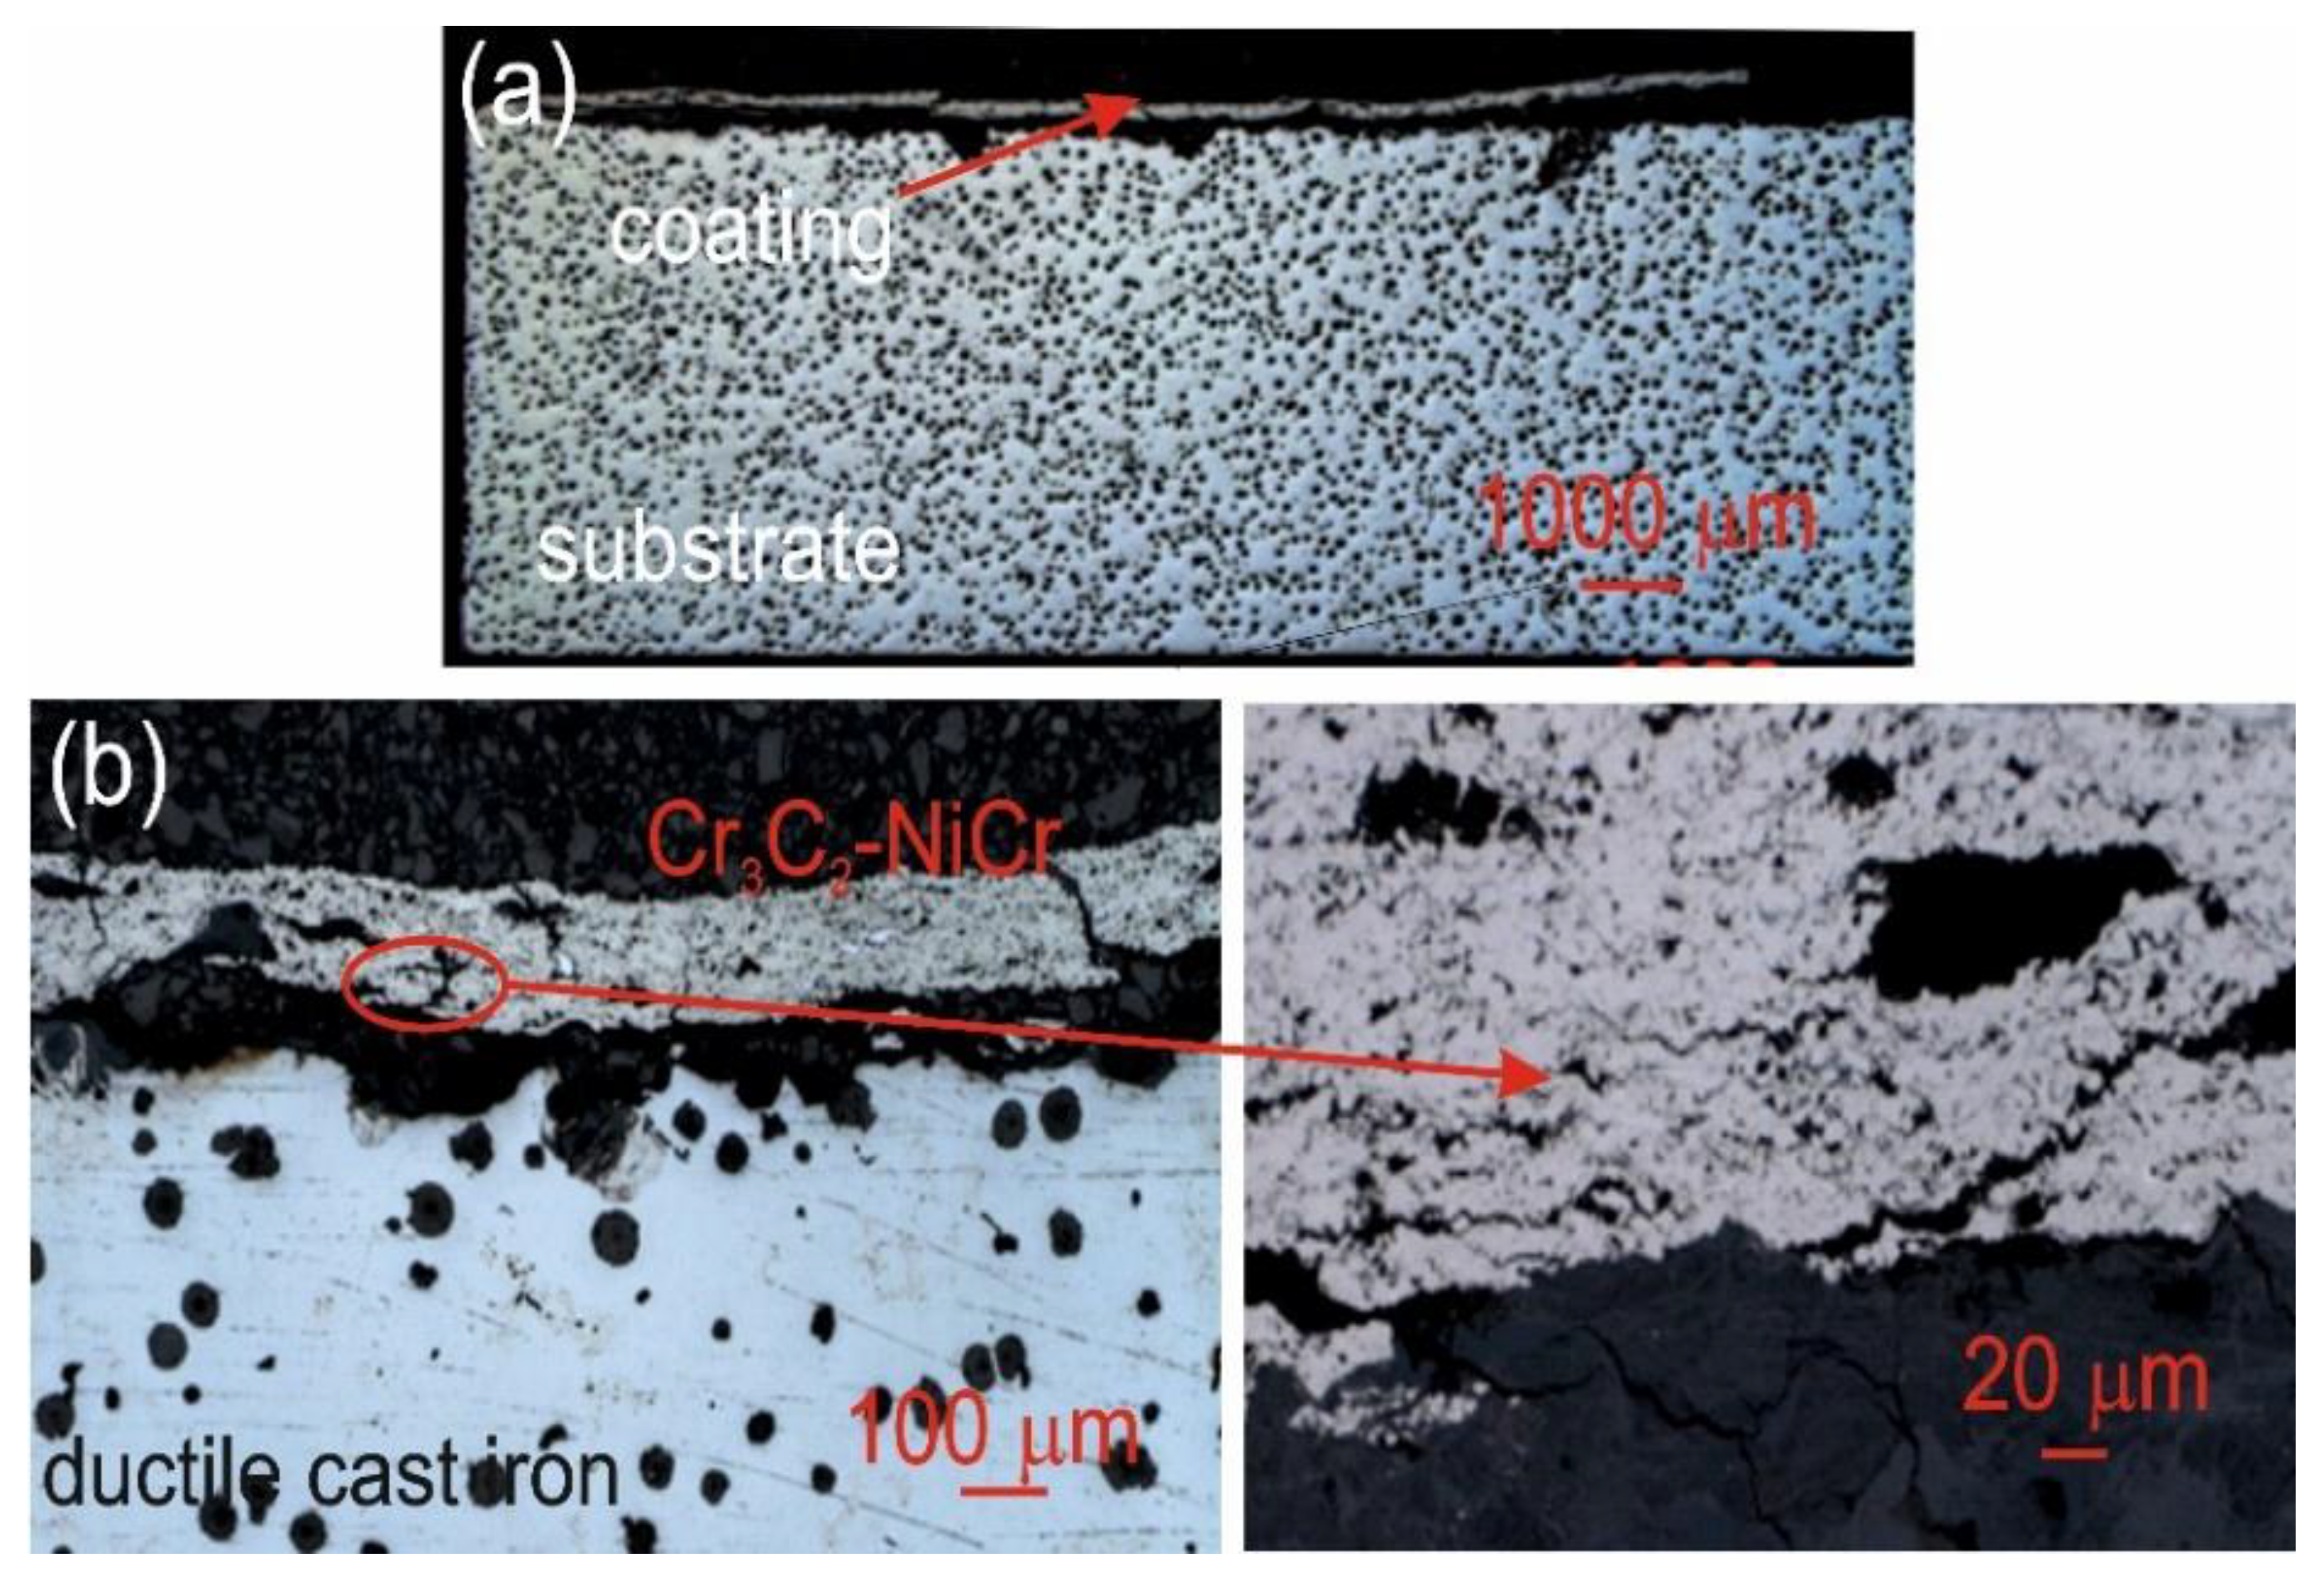
Figure 12.
SEM micrographs and corresponding EDS elemental mapping of a corroded (Cr₃C₂-NiCr+Ni)/ductile cast iron specimen after corrosion testing in an iron chloride solution: (a) cross-sectional image, (b) surface image.
Figure 12.
SEM micrographs and corresponding EDS elemental mapping of a corroded (Cr₃C₂-NiCr+Ni)/ductile cast iron specimen after corrosion testing in an iron chloride solution: (a) cross-sectional image, (b) surface image.
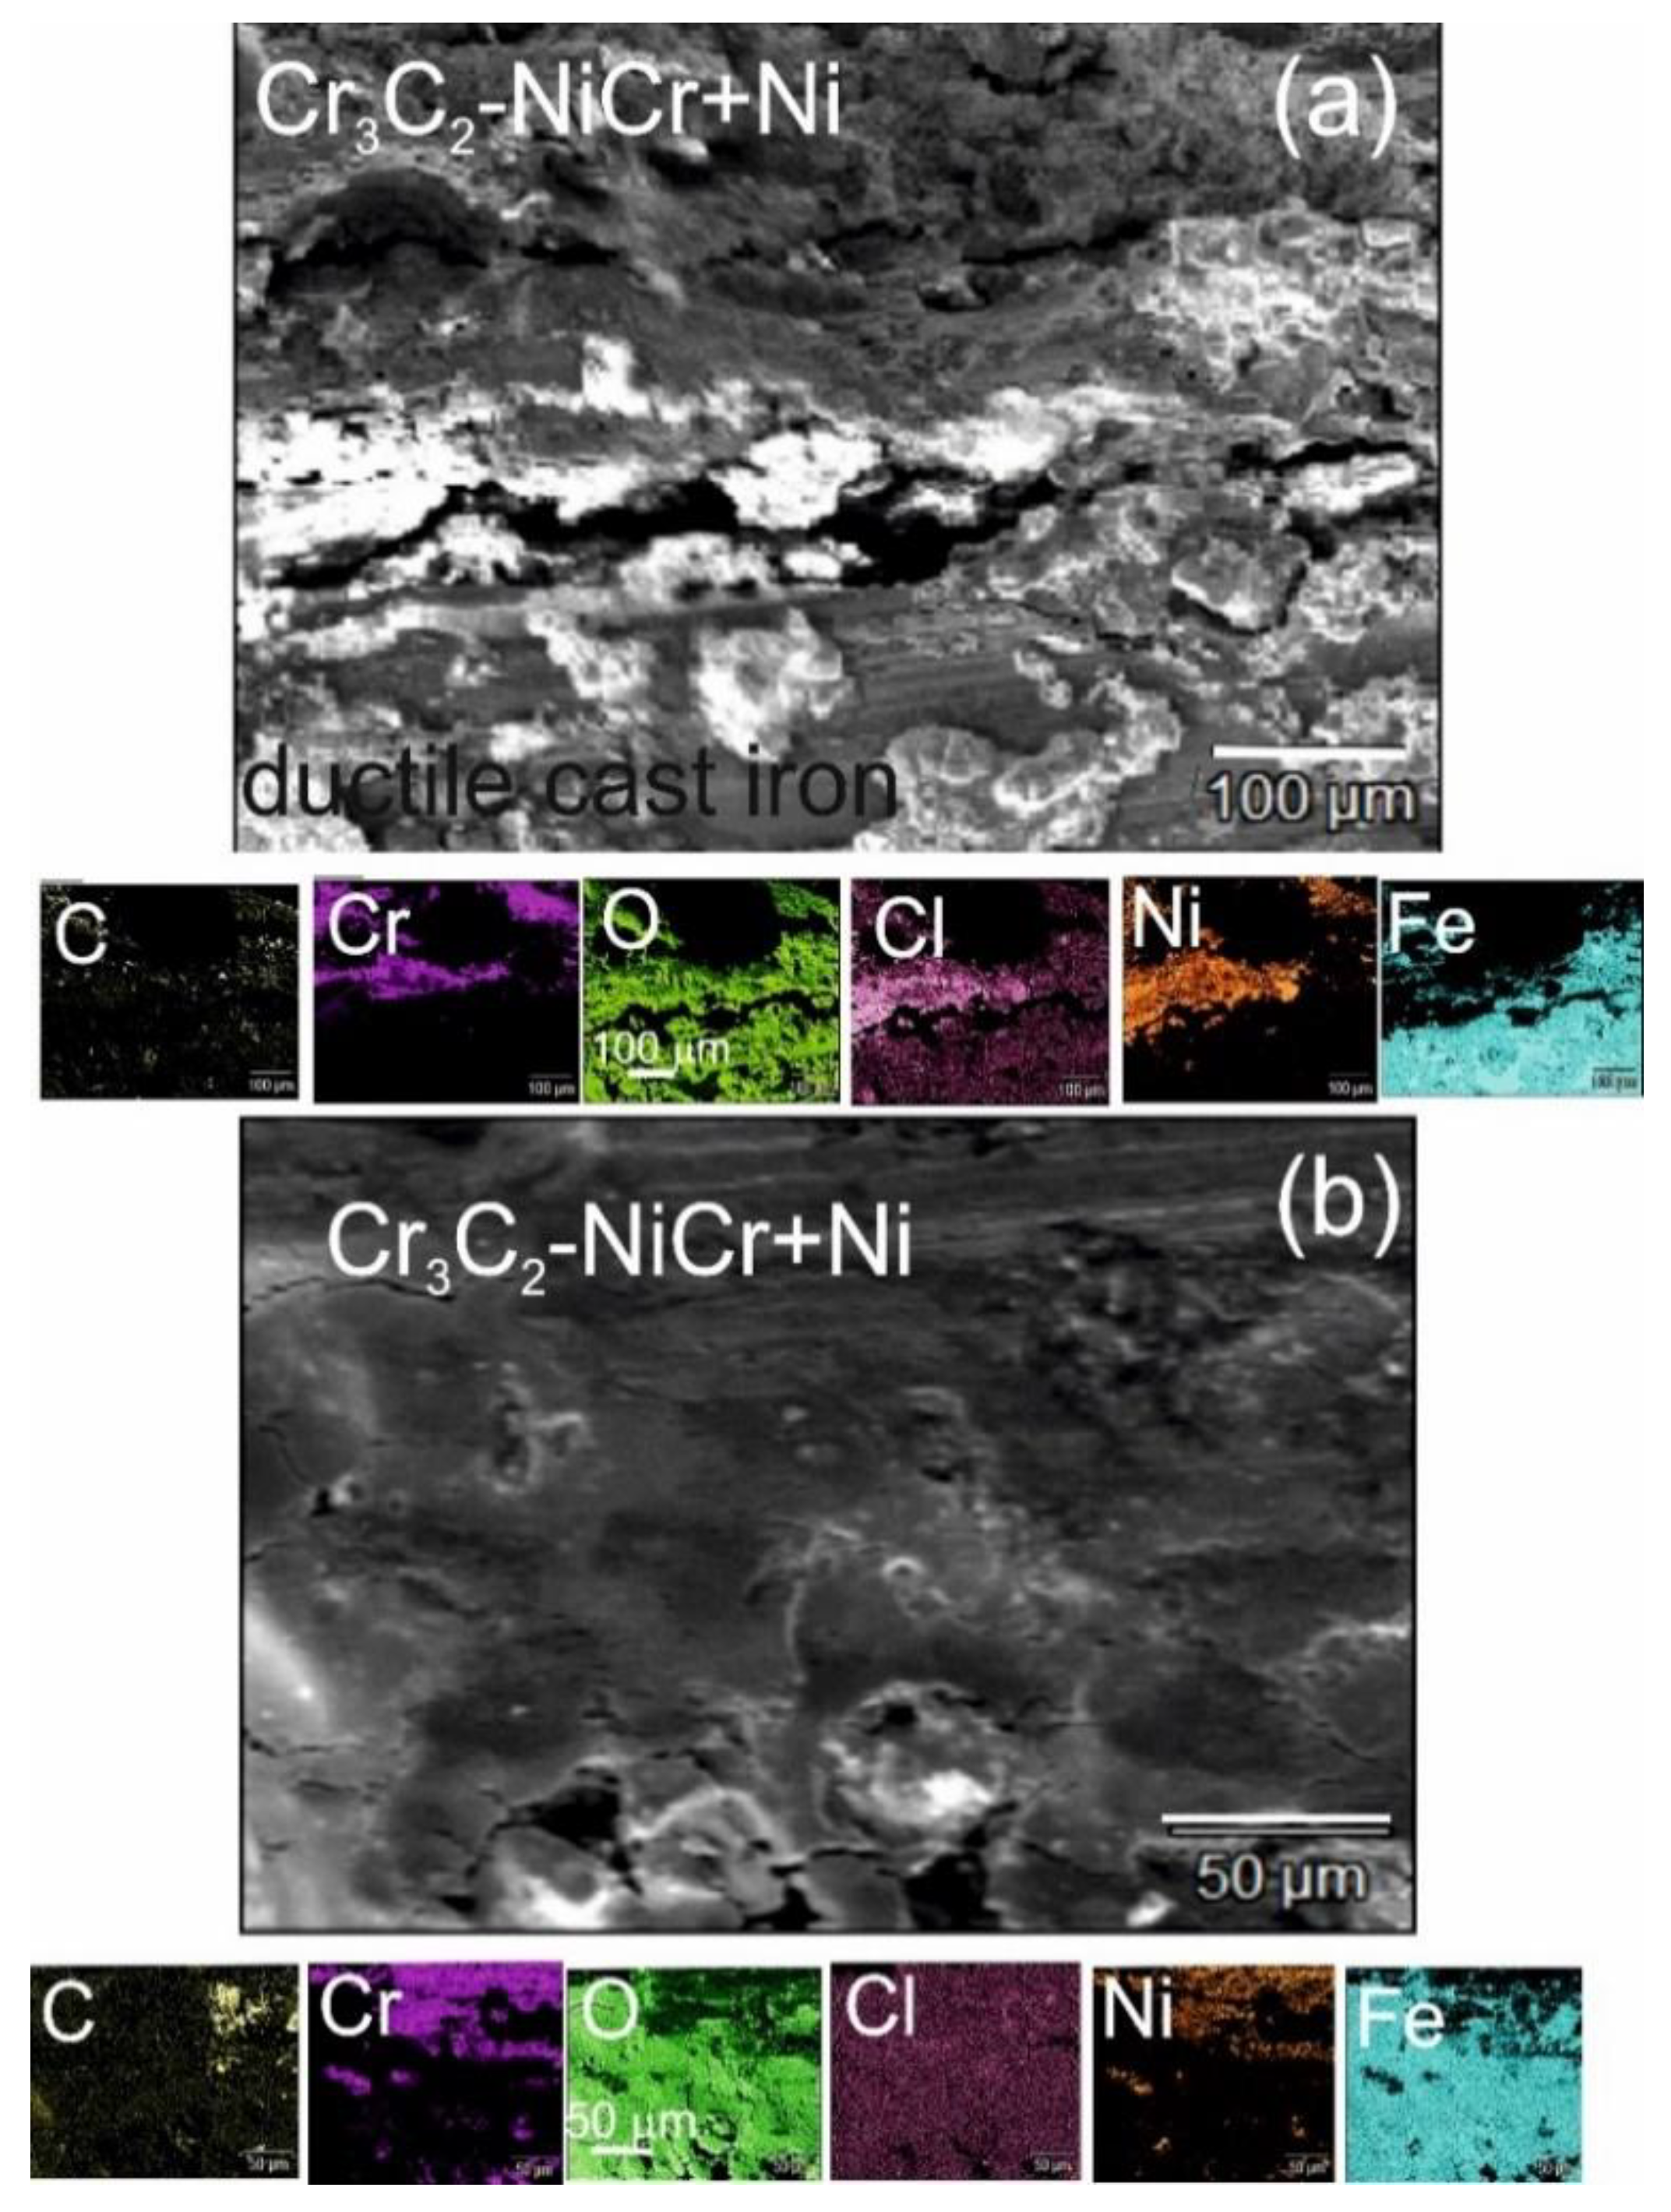
Figure 13.
XRD analysis of corroded specimens after corrosion testing in an iron chloride solution: (a) (Cr₃C₂-NiCr+Ni)/ductile cast iron, (b) Cr₃C₂-NiCr/ductile cast iron.
Figure 13.
XRD analysis of corroded specimens after corrosion testing in an iron chloride solution: (a) (Cr₃C₂-NiCr+Ni)/ductile cast iron, (b) Cr₃C₂-NiCr/ductile cast iron.
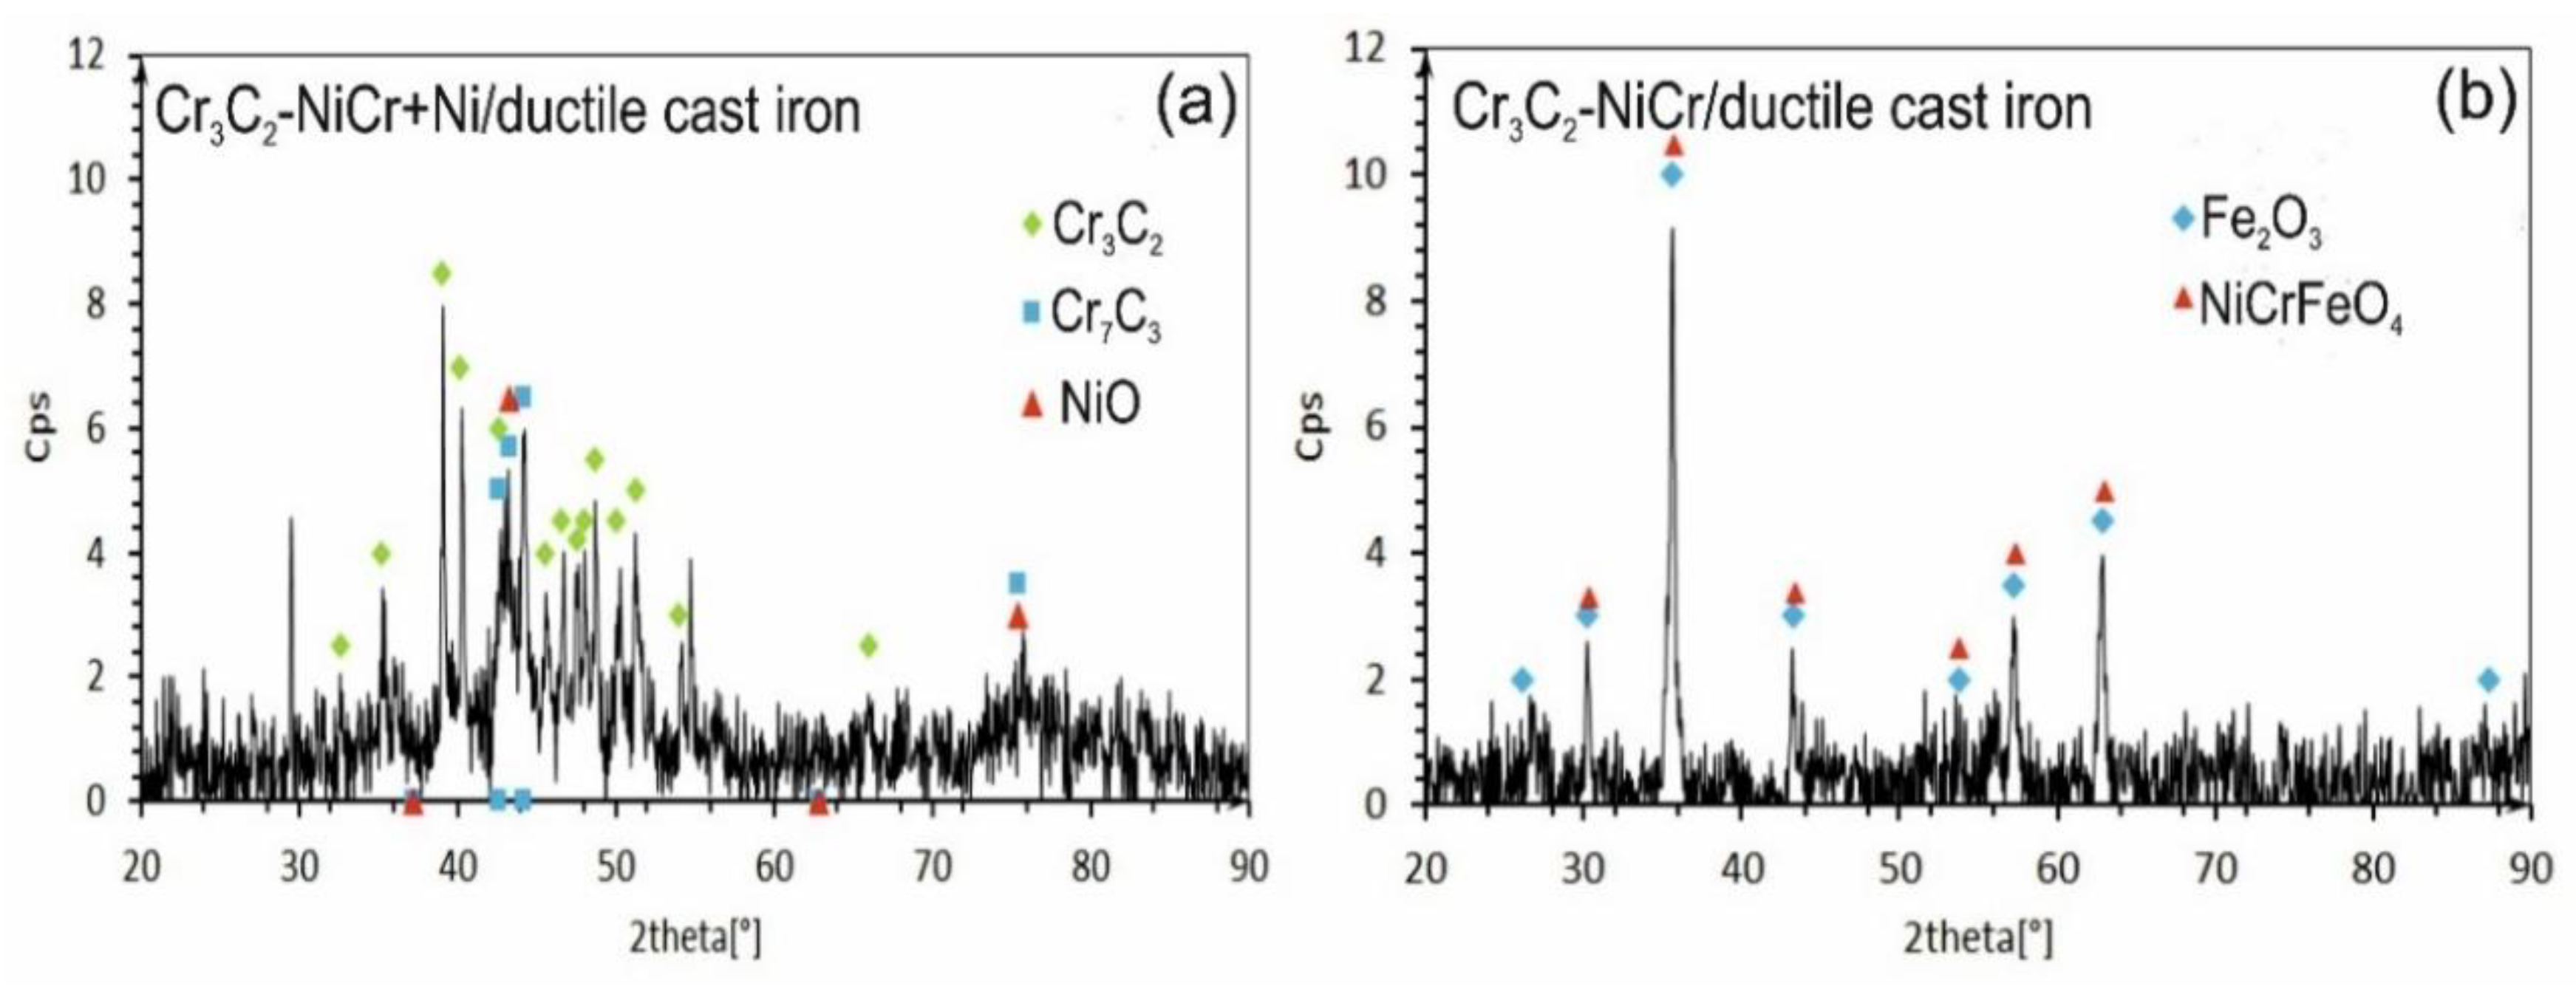
Table 1.
Chemical composition of EN-GSJ-500-7.
| Chemical Composition, wt.% | |||||||||
| C | Si | Mn | P | S | Cr | Ni | Mg | Cu | Fe |
| 3.61 | 2.29 | 0.45 | 0.045 | 0.009 | 0.03 | 0.01 | 0.057 | 0.75 | rest |
Table 2.
Mechanical properties of EN-GSJ-500-7.
|
Tensile Strength (MPa) |
Conventional Yield Point (MPa) |
Elongation (%) |
Hardness Elastic Modulus (HB) (GPa) |
| 500 | 340 | 7 230 | 169 |
Table 3.
HVOF spraying parameters of as sprayed Cr3C2-NiCr coatings.
| Gun Movement Speed (mm/s) | Oxygen (l/min) |
Kerosene (l/h) |
Powder Feed Rate (g/min) | Powder Feed Gas (l/min) | Spraying Distance (mm) |
| 583 | 850 | 24 | 65 | Nitrogen, 9.5 | 370 |
Table 4.
Scratch test parameters.
| Intender | Scratch Mode |
Load [N] |
Scratch Length [mm] | Scratch Speed [mm/s] |
| Rockwell C, 100 µm |
Continuous load | 5, 10, 15, 20, 25 | 1.4 | 1.2 |
| Progressive load | 0.03-30 | 0.35 | 1.2 |
Table 5.
Surface roughness rarameters Ra, Rz for (Cr3C2-NiCr+Ni) composite coating.
| Coating | Measuremet | Ra [µm] | Rz [µm] |
| (Cr3C2-NiCr+Ni) | 1 | 9.7 | 41.6 |
| 2 | 14.7 | 69.8 | |
| 3 | 7.9 | 37.3 | |
| Average value [µm] | 10.8±3.5 | 49.6±17.6 |
Table 6.
Indentation hardness (HIT) and Young’s modulus (EIT) values of the (Cr3C2-NiCr+Ni)/ductile cast iron coating system.
Table 6.
Indentation hardness (HIT) and Young’s modulus (EIT) values of the (Cr3C2-NiCr+Ni)/ductile cast iron coating system.
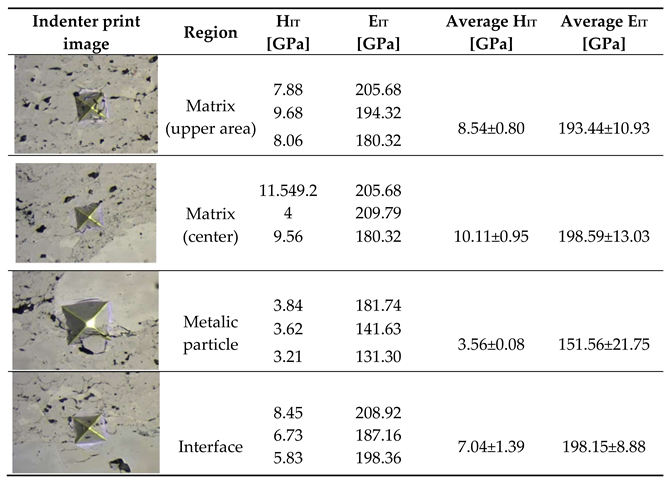
Table 7.
Indentation fracture toughness measurements of the Cr3C2-NiCr coating under loads of 5, 10, 15, and 20 N.
Table 7.
Indentation fracture toughness measurements of the Cr3C2-NiCr coating under loads of 5, 10, 15, and 20 N.
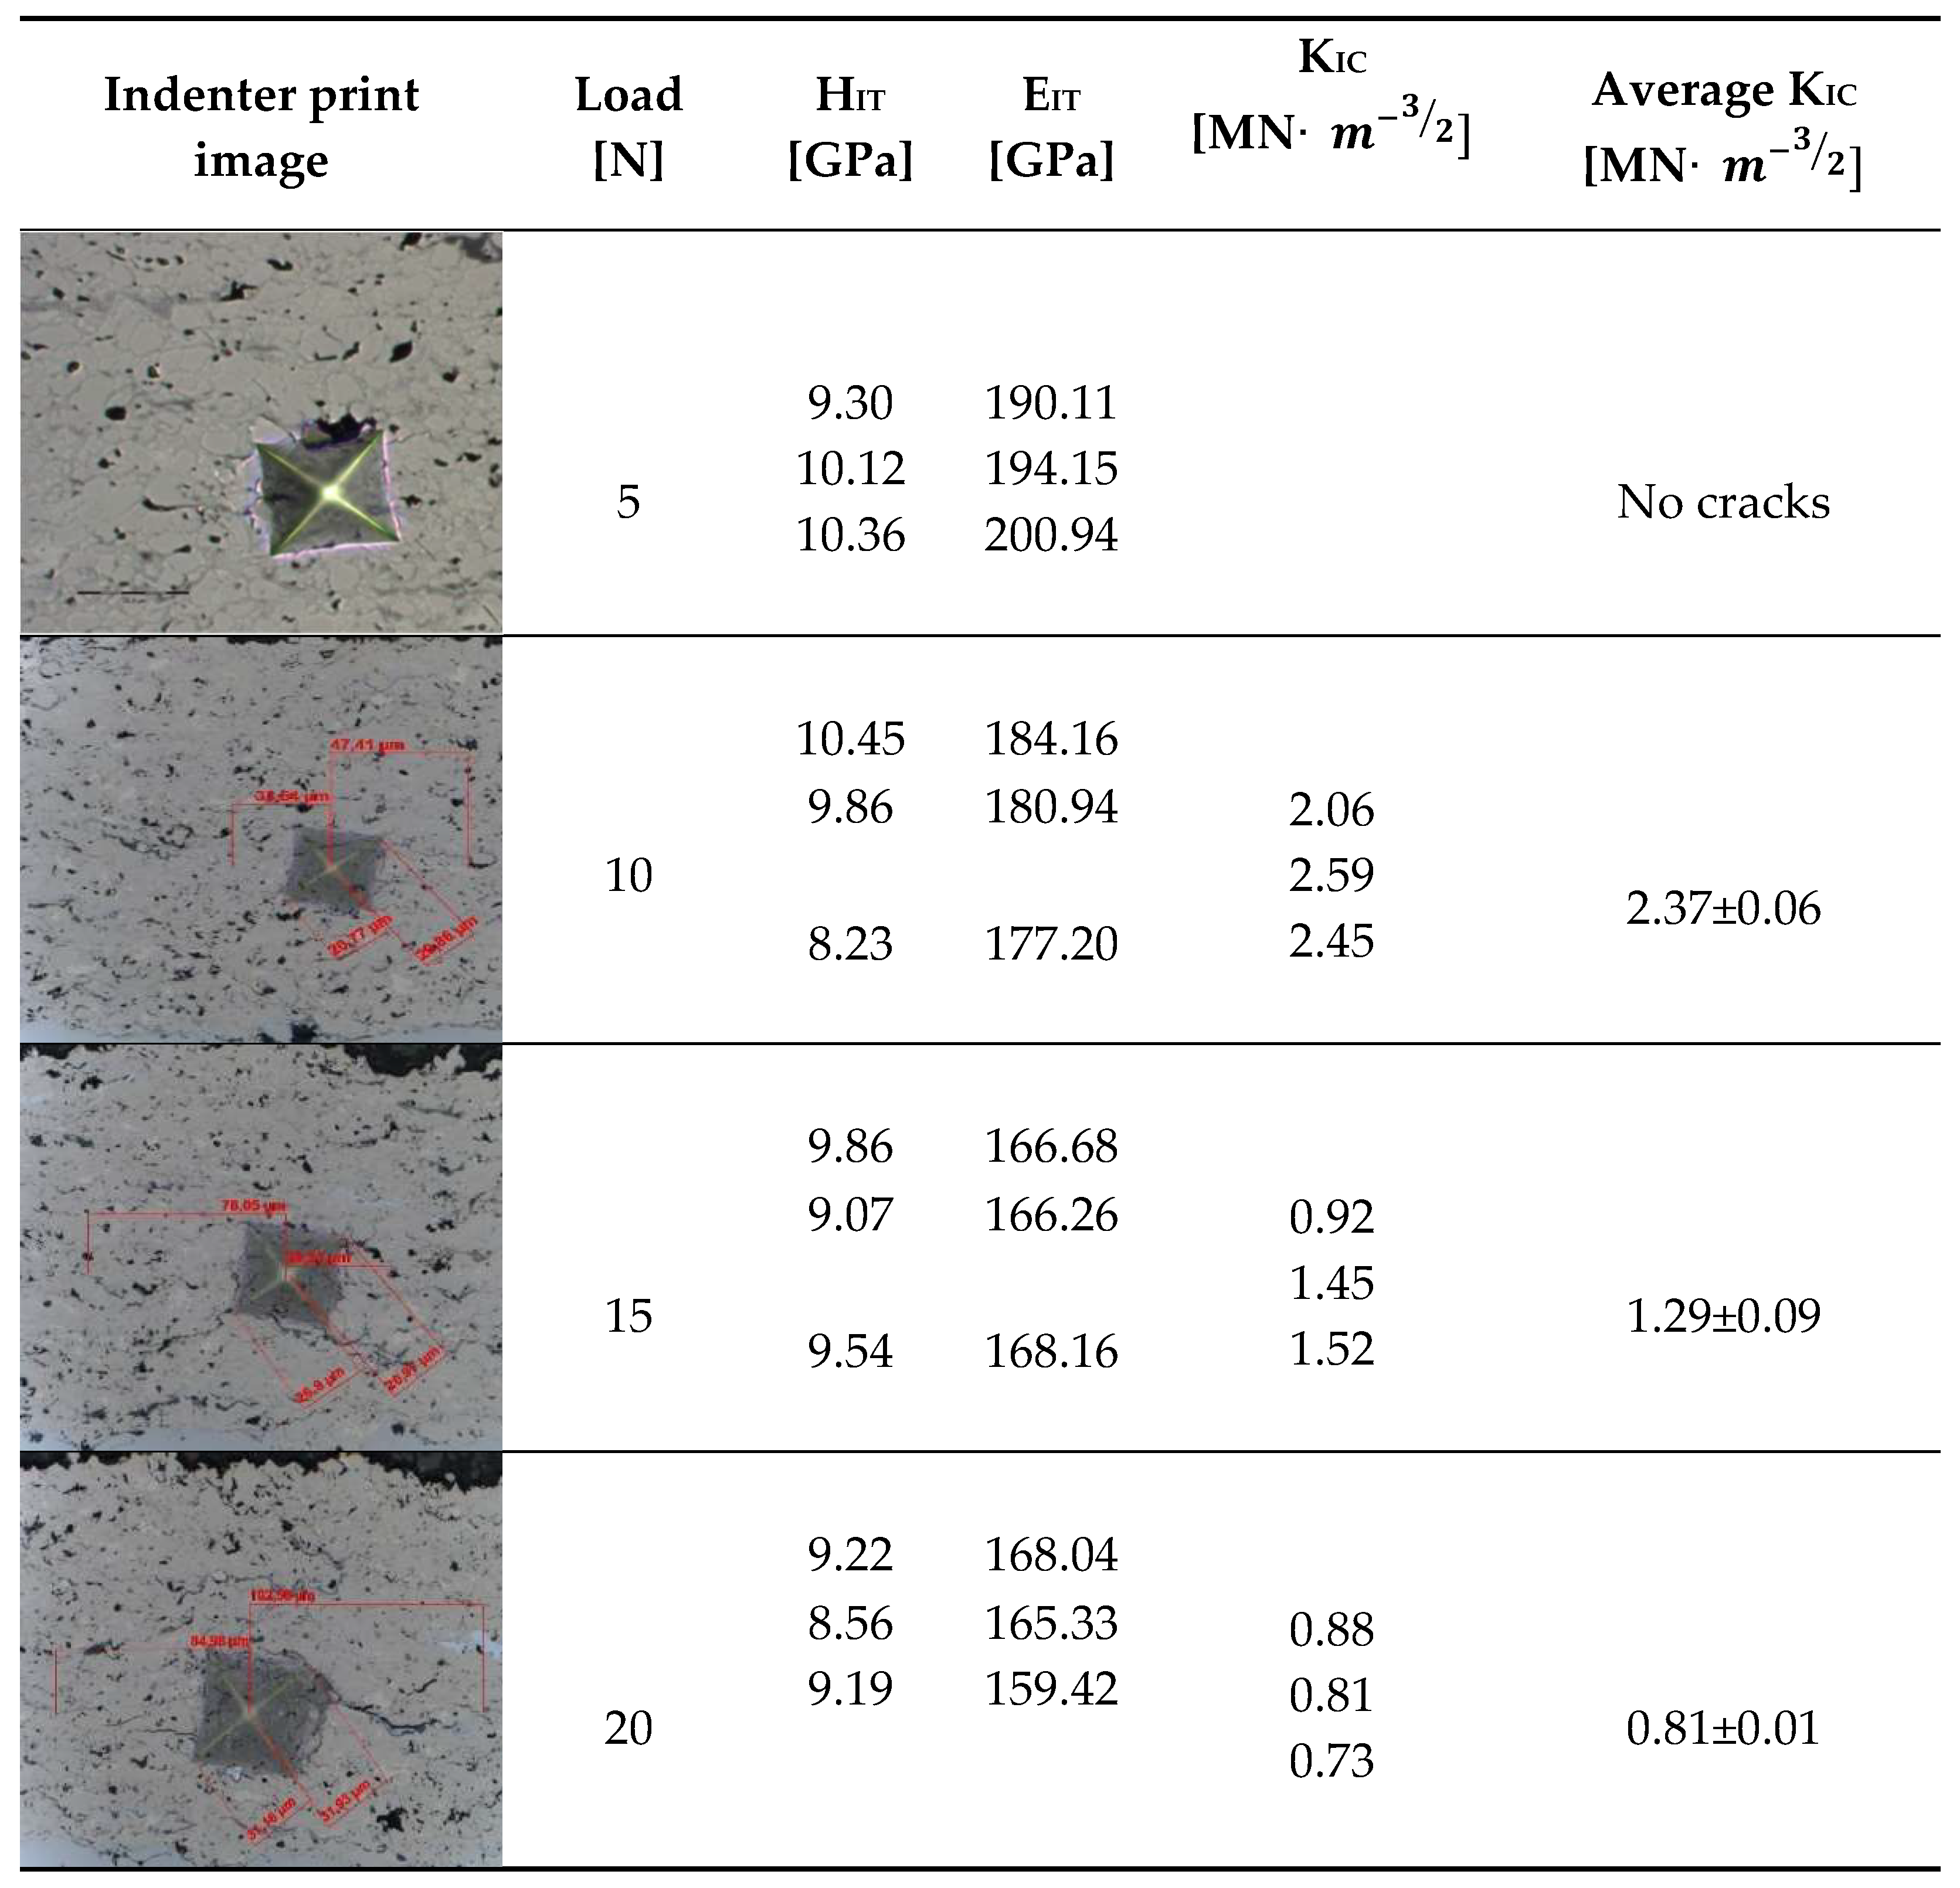
Table 8.
Indentation fracture toughness measurements of the (Cr3C2-NiCr+Ni) coating under loads of 5, 10, and 15 N.
Table 8.
Indentation fracture toughness measurements of the (Cr3C2-NiCr+Ni) coating under loads of 5, 10, and 15 N.
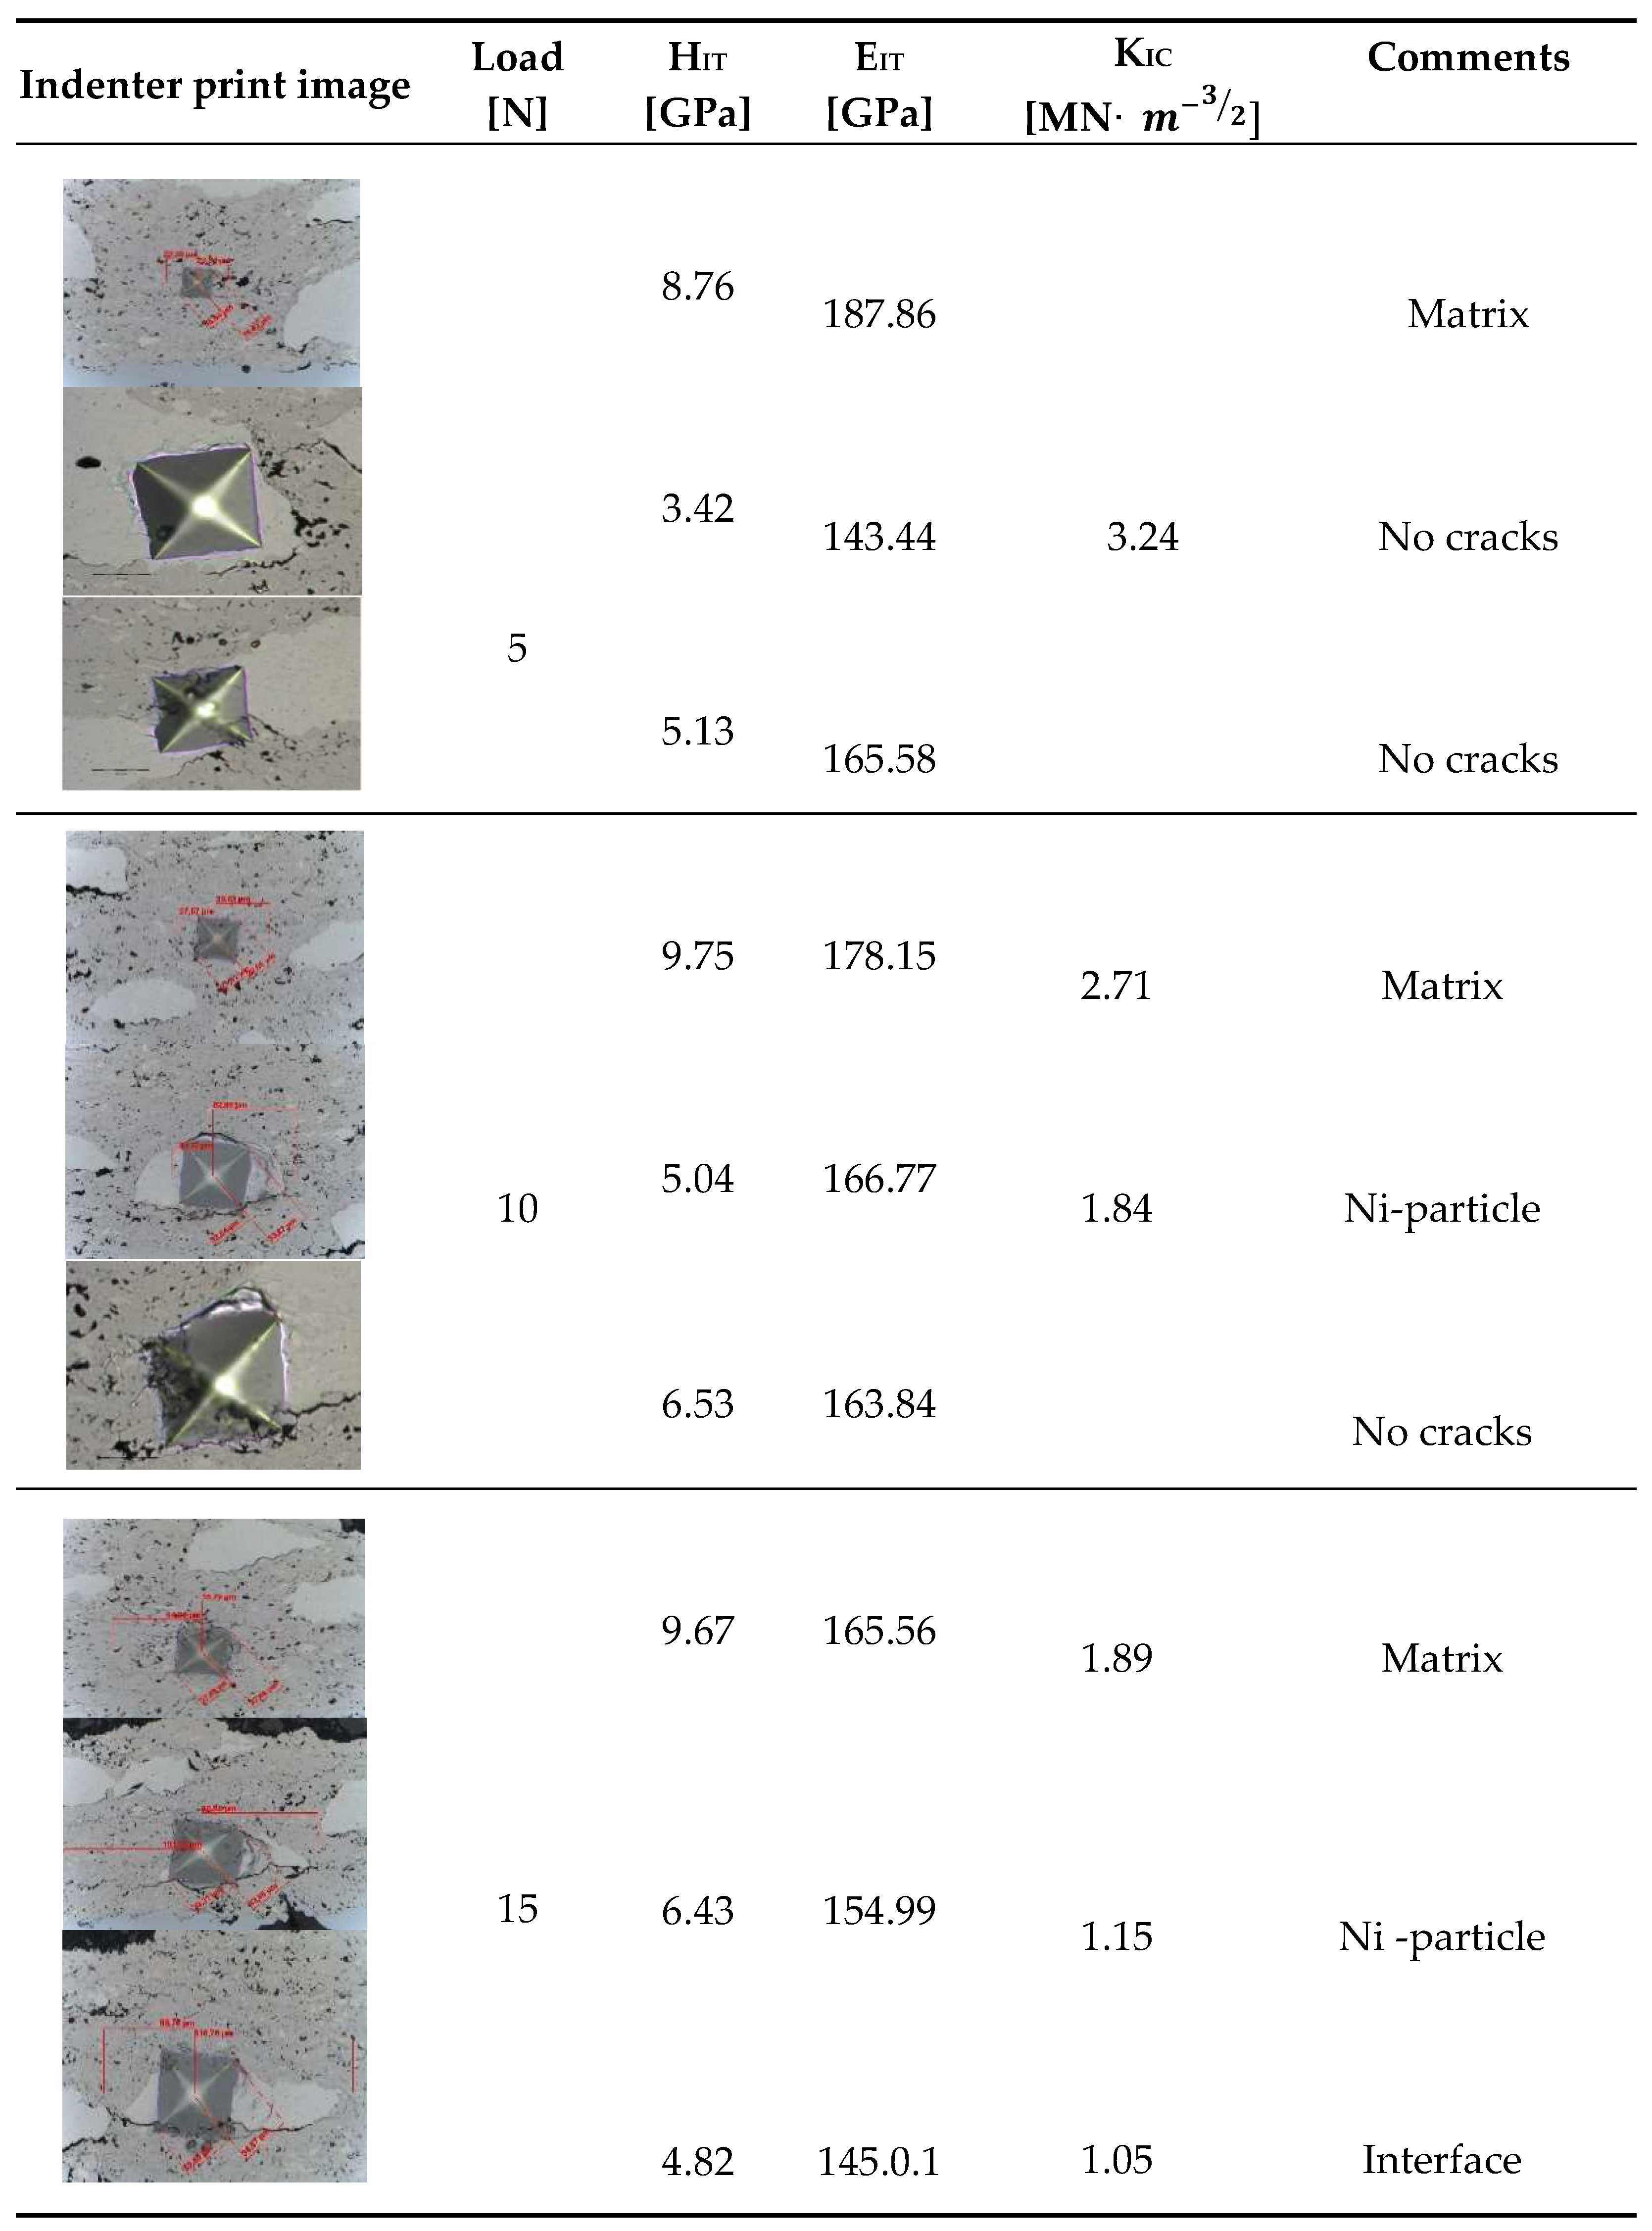
Table 9.
Penetration depth measurements in the scratch path under constant and progressive loading for Cr3C2-NiCr/ductile cast iron [33] and (Cr3C2-NiCr+Ni)/ductile cast iron systems.
Table 9.
Penetration depth measurements in the scratch path under constant and progressive loading for Cr3C2-NiCr/ductile cast iron [33] and (Cr3C2-NiCr+Ni)/ductile cast iron systems.
| Coating System | Load [N] | |||||||
| 5 | 10 | 15 | 20 | 25 | 0.03-30 | |||
| Depth Penetration Pd [µm] | ||||||||
| Cr3C2-NiCr/ductile cast iron |
8 | 15 | 22 | 34 | 48 | 37 at approx. 25N | ||
| (Cr3C2-NiCr+Ni)/ductile cast iron | 7 | 14 | 21 | 30 | 46 | 41 at approx. 25 N | ||
Table 10.
Averaged scratch bond test results of the (Cr3C2-NiCr+Ni)/ductile cast iron coating system.
Table 10.
Averaged scratch bond test results of the (Cr3C2-NiCr+Ni)/ductile cast iron coating system.
| Coating System |
Load [N] |
Lx [µm] |
Ly [µm] |
Acn x10-3 [mm2] |
|
(Cr3C2-NiCr+Ni)/ductile cast iron |
5 | - | - | - |
| 10 | 104.12 | 110.46 | 11.51 | |
| 15 | 182.58 | 117.38 | 21.43 | |
| 20 | 206.29 | 217.28 | 44.82 | |
| 25 | delamination |
Table 11.
Percentage of the characteristic form of failure under constant load (no cracks, cohesive cracks, adhesive cracks) according to the standard: ISO 27307:2015 Thermal spraying-Evaluation of adhesion/cohesion of thermal sprayed ceramic coatings by transverse scratch testing [33].
Table 11.
Percentage of the characteristic form of failure under constant load (no cracks, cohesive cracks, adhesive cracks) according to the standard: ISO 27307:2015 Thermal spraying-Evaluation of adhesion/cohesion of thermal sprayed ceramic coatings by transverse scratch testing [33].
| Coating System |
Load [N] |
No crack [%] |
Cohesive crack [%] |
Adhesive crack [%] |
Maximum load at which cohesive cracks appears | Maximum load at which adhesive cracks appears |
|
Cr3C2-NiCr/ductile cast iron |
5 | 85 | 15 | 0 | over 5 N | |
| 10 | 70 | 30 | 0 | |||
| 15 | 50 | 50 | 0 | |||
| 20 | 0 | 0 | 100 | delamination | ||
|
(Cr3C2-NiCr+Ni)/ductile cast iron |
5 | 100 | 0 | 0 | ||
| 10 | 90 | 10 | 0 | over 10 N | ||
| 15 | 80 | 20 | 0 | |||
| 20 | 50 | 50 | 0 | |||
| 25 | 0 | 0 | 100 | delamination |
Disclaimer/Publisher’s Note: The statements, opinions and data contained in all publications are solely those of the individual author(s) and contributor(s) and not of MDPI and/or the editor(s). MDPI and/or the editor(s) disclaim responsibility for any injury to people or property resulting from any ideas, methods, instructions or products referred to in the content. |
© 2025 by the authors. Licensee MDPI, Basel, Switzerland. This article is an open access article distributed under the terms and conditions of the Creative Commons Attribution (CC BY) license (https://creativecommons.org/licenses/by/4.0/).
Copyright: This open access article is published under a Creative Commons CC BY 4.0 license, which permit the free download, distribution, and reuse, provided that the author and preprint are cited in any reuse.


