
Submitted:
25 February 2025
Posted:
26 February 2025
You are already at the latest version
Abstract
Natural gas-diesel dual-fuel (NDDF) engines can reduce harmful emissions while maintaining diesel-like efficiency. However, under low-load conditions, they suffer from high methane (CH4) emissions, reduced combustion stability, and lower thermal efficiency. To address and improve these issues, this study numerically investigates the effects of injection pressure (32, 50, 90, and 126 MPa) and nozzle hole diameter (NHD, 110-230 μm) on dual-fuel combustion. 25%, 50%, and 75% natural gas energy fraction (NGEF) conditions are simulated for dual-fuel cases, and fully diesel-fueled conditions are also studied. Results at 50% and 75% NGEF indicate that increasing injection pressure significantly improves thermal efficiency while reducing CH4 and soot emissions. Furthermore, at 75% NGEF, NHD reduction from 230 to 150 μm provides more stable combustion rates, higher thermal efficiency and lower CH4 emissions. At 75% NGEF, the combination of 126 MPa injection pressure and 150 μm NHD reduces CH4 emissions by 77% and increases thermal efficiency by 9.8% compared to the baseline case (32 MPa and 230 μm). This study demonstrates that optimal combinations of injection pressure and NHD can significantly improve low-load issues in NDDF engines.
Keywords:
dual-fuel
; engine
; natural gas
; diesel
; injection pressure
; nozzle hole diameter
; efficiency
; emission
; greenhouse gas
1. Introduction
Internal combustion engines (ICEs) have been widely used to power on-road, non-road, and marine vehicles. Due to their fuel economy and reliability, diesel engines are particularly preferred in heavy-duty applications among ICEs. However, diesel combustion produces high levels of soot and nitrogen oxides (NOX) emissions and diesel engines significantly contribute to greenhouse gas (GHG) emissions [1,2]. Furthermore, the sulfur content of heavy fuel oil used in marine diesel engines leads to sulfur oxides (SOX) emissions [3]. Considering the adverse effects of exhaust emissions and GHG [2,4], regulations have gradually been introduced to limit these pollutants [5,6,7]. Tightening emission regulations and decarbonisation targets require the adoption of advanced combustion technologies, alternative fuel usage, and exhaust after treatment systems in diesel engines [8,9,10,11]. Among the emerging sustainable and cleaner power technologies, NDDF combustion represents a promising alternative [9,12]. NDDF engines produce significantly lower exhaust emissions and GHG compared to conventional diesel engines while maintaining diesel-like efficiency [10,11,12].
Dual fuel engines can be operated with different fuel combinations; however, this study focuses on NDDF combustion. In this combustion strategy, diesel fuel is used to ignite a natural gas-air mixture in the cylinder. Because natural gas and air are premixed, combustion temperatures of these engines are considerably lower than those in conventional diesel engines. The reduced combustion temperatures provide a significant decrease in NOX emissions [10,11]. An increase in premixed fuel ratio also leads to a substantial decrease in soot emissions [10]. Furthermore, carbon dioxide (CO₂) emissions can be reduced by up to 30% compared to conventional diesel engines because natural gas has a higher hydrogen-to-carbon ratio than diesel fuel [12,13]. Finally, since natural gas contains no sulfur, SOX emissions decrease as NGEF increases. In brief, NOX, soot, SOX, and CO2 emissions can be simultaneously reduced in NDDF engines under high NGEF conditions. However, an increase in NGEF also introduces several challenges in NDDF engines particularly under low load conditions. These issues are significantly related to the poor combustion properties of natural gas [14,15]. Natural gas commonly contains over 90% CH4, and CH4 has much lower flame propagation speed, burning rate and chemical reactivity compared to higher hydrocarbons and liquid fuels [13]. The combustion characteristics of natural gas and increased premixed fuel ratio lead to decreased combustion stability and thermal efficiency under high NGEF and low load conditions [16]. Additionally, combustion control becomes increasingly challenging due to reduced diesel fuel [17]. Consequently, issues including high CH4 emissions, low thermal efficiency, and reduced combustion stability emerge as main challenges in NDDF engines under low load conditions [10,11].
Researchers have extensively investigated the effects of operating parameters on NDDF combustion to address the low load issues [10,11,18]. These studies demonstrate that diesel injection conditions significantly influence combustion performance and emission characteristics. Therefore, the effects of injection conditions have become a key area of focus in NDDF engine studies [19,20,21]. Among various injection parameters, such as injection timing, spray angle, and nozzle number, injection pressure is particularly critical. It significantly influences fuel injection velocity, mass flow rate, atomization, evaporation, and mixture formation [22,23]. As injection pressure increases, spray penetration increases and the time required for mixture formation and ignition decreases [22,23]. A shorter ignition delay and higher combustion rates reduce unburned hydrocarbon (UHC) emissions and improve thermal efficiency at elevated injection pressures. Despite these benefits, higher injection pressures cause several challenges in NDDF engines. For example, higher NOX emissions and maximum pressure rise rates (MPRR) are observed at elevated injection pressures [24]. Because excessive MPRR levels result in increased noise and vibration in ICEs, these levels must remain within defined operating limits. Furthermore, researchers report an increase in cyclic variations at elevated injection pressures under low-load and high NGEF conditions [19,21]. The cyclic variations arise from fluctuations in operating parameters, and these variations are expected to be minimal for stable and reliable operation [21]. In brief, an increase in injection pressure significantly improves thermal efficiency and reduces CH4 emissions. However, some low load issues persist and problems associated with higher injection pressure have emerged in NDDF engines.
Injection conditions play a significant role in the low-load and high injection pressure issues of NDDF engines. Therefore, the injection conditions should be examined. The diesel fuel mass per cycle in an NDDF engine is lower than in a fully diesel-fueled engine, proportional to the NGEF value. Furthermore, the fuel mass per cycle under low-load conditions is 3 to 4 times lower than under high-load conditions. As a result, diesel fuel mass and injection duration decrease to significantly lower levels in NDDF engines. Because diesel fuel has a higher chemical reactivity, the reduced amount of diesel fuel is rapidly burned out following injection. When diesel fuel is consumed, the remaining natural gas burns at lower rates. The reduction in combustion rates decreases thermal efficiency and increases CH4 emissions. However, an increase in injection pressure improves injection conditions and enhances combustion rates. While these improvements enhance thermal efficiency and reduce CH4 emissions, they also contribute to increased NOX emissions and MPRR values. Additionally, injection durations further decrease at elevated injection pressures, introducing challenges in injection and combustion control. Zhang et al. [25] reported that fluctuations in injection parameters such as injected fuel mass, injection rate, and timing are relatively higher at shorter injection durations. The increased fluctuations in injection conditions and lower combustion stability are significant causes of increased cyclic variations in NDDF engines. To improve these issues, lower NHD values can be implemented in NDDF engines. A reduction in NHD value decreases fuel mass flow rates and increases injection durations at the same injection pressure and fuel mass per cycle. By reducing injection rate, the rapid consumption of diesel fuel can be delayed, allowing better control over combustion rates. Moreover, studies [13,26] have shown that even small amounts of higher hydrocarbons significantly improve natural gas combustion characteristics. An increase in injection duration can provide the required time for better mixture formation between diesel spray and natural gas-air mixture. Therefore, an investigation is essential to find an optimal combination of injection pressure and NHD in an NDDF engine.
Although smaller NHD values promise potential improvements in NDDF engines, the effects of NHD variation have not been investigated in detail. Only a limited number of studies have considered NHD variation; however, none have specifically focused on the effects of NHD variation. For example, Zheng et al. [27] conducted experiments using two different injectors under varying injection pressures. In addition to NHD variation, the number and arrangement of nozzle holes differ between the injectors. In another study, Lee [17] numerically investigated the effects of NHD variation at 80% NGEF condition. However, to maintain a constant injection duration, injection pressures were adjusted simultaneously. As a result, these studies do not isolate the specific effects of NHD variation. Additionally, various NHD values have been used in NDDF engines [21,28,29]. However, the specific impact of NHD variation remains unclear due to simultaneous variations in multiple injection and operating parameters. Consequently, there is a clear need to explain the effects of NHD variation on NDDF combustion. To fill this research gap, this study numerically investigates the effects of injection pressure and NHD variations on NDDF combustion under low-load conditions. Simulations are conducted using a numerical model of a single cylinder heavy-duty engine. The injection parameters for each operating condition are estimated using a spray box model. Dual fuel combustion simulations are performed under 25%, 50%, and 75% NGEF conditions. Additionally, fully diesel fueled conditions (0% NGEF) are simulated for comparisons. The effects of injection pressure and NHD are separately discussed under each NGEF condition. Subsequently, optimal combinations of injection pressure and NHD are described. Finally, the study presents key findings, including MEP variations, CH4- NOX relationships, peak and baseline efficiencies and GHG emissions.
2. Simulation Methodology and Matrix
2.1. Numerical Model of Engine
A numerical model of a single cylinder heavy-duty engine is constructed using ANSYS Forte software. Specifications and operating conditions of the engine are shown in Table 1 [29,30]. The engine has a single diesel injector positioned axisymmetrically and six nozzle holes are located around the injector tip with a 60-degree interval. Therefore, the combustion chamber is modeled as a 60-degree sector as illustrated in Figure 1.
Simulations are performed between inlet valve closure (IVC) and exhaust valve opening (EVO). Natural gas and air are assumed to form a homogeneous mixture at IVC and diesel fuel is directly injected into the combustion chamber. Natural gas is simulated using a mixture of 96% methane, 3.2% ethane, and 0.8% propane by mass, while diesel fuel is represented by heptane.
The turbulent flow in combustion chamber is simulated using Re-Normalization Group (RNG) k-ε model [31]. A dual fuel chemical mechanism (DFM) is coupled with ANSYS Forte chemistry solver. The DFM is constructed using the natural gas mechanism presented by Healy et al. [32] and the diesel mechanism presented by Wang et al. [33]. These chemical mechanisms are reduced and combined using ANSYS Chemkin. The DFM consists of 116 species and 633 reactions. Diesel spray is simulated using the solid cone spray model and the Kelvin-Helmholtz and Rayleigh-Taylor (KH-RT) breakup models [31]. The Radius-of-Influence (ROI) collision and discrete multi-component (DMC) vaporization models are utilized for droplet collision and evaporation simulations [31]. Diesel fuel mass per cycle is set at 66.2 mg, 49.7 mg, 34.8 mg, and 18.1 mg, for 0%, 25%, 50%, and 75% NGEF conditions, respectively. NGEF is calculated using Equation (1), where mNG and mdiesel represent the masses of natural gas and diesel fuel, respectively. LHVNG and LHVdiesel indicate the lower heating values of natural gas and diesel fuel.
A grid independence study is conducted using three grids consisting of approximately 220000 (grid 1), 252000 (grid 2), and 290000 (grid 3) cells. The results are presented in Figure 2. Based on the analysis, the grid with approximately 252000 cells is selected for the study.
2.2. Numerical Model of Spray Box
Since injection parameters significantly influence combustion characteristics, a spray box model is employed to estimate their values for each operating condition. A disc-shaped constant volume chamber, with a diameter of 114 mm and a height of 28 mm, is modeled in ANSYS Forte, as shown in Figure 3. Diesel fuel is injected through a single nozzle hole positioned within the constant volume chamber. The model simulates spray formation, atomization, and evaporation; however, combustion is not considered. The nozzle discharge coefficient and the spray angle are assumed to be 0.8 and 16 degrees, respectively.
The spray box model uses diesel fuel mass, normalized injection velocity profile, and injection duration as initial conditions to estimate the injection properties, such as injector sac volume pressure, injection velocity, and injection rate. To maintain constant injection pressure while NGEF and NHD change, normalized injection velocity profiles and injection durations must be calculated. When calculating normalized injection velocity profiles for varying NGEF and NHD conditions, the relationships between injection parameters must be considered. A fuel injection velocity profile consists of three regions: a rise to maximum rate, injection at the maximum rate, and a fall at the end of injection [34,35,36]. These regions are determined by needle movement characteristics of the injector. When the needle inside the injector lifts, sac volume pressure increases and injection starts [8]. If injection duration is sufficient, sac pressure reaches its maximum value. Finally, the needle drops to its seat, the sac volume pressure drops, and injection ends [8]. Throughout these processes, the pressure difference between sac volume and combustion chamber determines the injection velocity. The pressure difference and nozzle hole area determine the injection rate. Therefore, sac volume pressure, injection velocity, and injection rate curves show similar characteristics. These curve characteristics change in a specific way when an injection condition changes. For example, a change in fuel mass under the same injection conditions affects the injection duration without altering the rising and falling curve characteristics [34,35,36]. As injected fuel mass decreases, the maximum rate region narrows. Additionally, when the injected mass further decreases, only rising and falling regions can constitute the injection curve [36]. On the other hand, a variation in NHD under the same injection pressure does not change the sac volume pressure and maximum injection velocity, but it changes the injection rate [37,38]. As NHD changes, the rising and falling characteristics of injection velocity curve remain unchanged. A reduction in NHD at constant injection pressure decreases the injection rate and extends injection duration. As a result, rising and falling parts of the velocity curve move apart from each other, and maximum velocity region widens. These relationships between injection parameters are maintained during normalized injection velocity calculations. Furthermore, spray simulations are repeated until the curve characteristics and pressure values are aligned. Thus, the effects of injection pressure, NHD, and NGEF variations can be separately investigated.
2.3. Simulation Matrix
The operating conditions in Table 1 constitute the baseline cases. Under baseline conditions, the sac volume pressure is calculated as 32 MPa. To analyze the effects of injection pressure, simulations are performed with 32, 50, 90, and 126 MPa. Furthermore, the effects of NHD variation are studied by reducing the diameter from 230 μm to 150 μm with 20 μm intervals. Table 2 presents the simulation conditions performed under 0%, 25%, 50%, and 75% NGEF. Additionally, NHD values of 130 and 110 μm are simulated at 75% NGEF with injection pressures of 90 and 126 MPa. As a result, a total of 84 combustion simulations are conducted.
3. Results and Discussions
3.1. Validation of the Numerical Models
This section presents the results of spray and combustion simulations under baseline conditions. Simulation results are compared with available experimental data in Figure 4 and Figure 5. Fuel mass flow rates and total injected mass values used in baseline conditions are shown in Figure 4a. Since the experimental injection rate curve is unavailable, simulation results cannot be directly compared under baseline conditions. However, as shown in Figure 5, simulation results agree well with experiments, when using the presented injection rate profiles. Moreover, the difference between peak injection mass flow rate values in this study and the measurements presented by Yousefi et al. [39] is less than 20%. Additionally, the observed changes in injection rate curves are consistent with studies investigating fuel mass variation under constant injection pressure [34,35,36]. In addition to the baseline conditions, spray simulations are performed at injection pressures of 50, 90, and 126 MPa. Results are compared with experimental data obtained at 50 [40,41], 90 [38,42], and 126 MPa [40,41] injection pressure conditions. Figure 4b compares the fuel mass flow rate at 126 MPa injection pressure. The green lines present the simulations performed under the experimental conditions. The difference between estimated mass flow rate values and experimental data [40] is less than 5%. Similar comparisons at 50 MPa and 90 MPa confirm the spray box model’s accuracy in estimating injection conditions. Once the spray model is validated at each injection pressure, its results serve as a reference for other cases at the same pressure. For example, maximum velocity and sac volume pressure at 126 MPa remain unchanged as NGEF and NHD vary. Figure 4b compares the injection velocity values from this study and from the validation study. The velocity values in Figure 4b are obtained under operating conditions of 0% NGEF-230 μm NHD (Op.Con.1), 0% NGEF-150 μm NHD (Op.Con.2), 75% NGEF-230 μm NHD (Op.Con.3), and 75% NGEF-150 μm NHD (Op.Con.4). Injection velocity comparisons show that the maximum injection velocity remains consistent as NGEF and NHD change. Additionally, at very short injection durations, injection ends before velocity curve reaches the maximum value. Injection curves of 75% NGEF almost reach maximum velocity when NHD is reduced to 150 μm at 126 MPa injection pressure.
The results of the combustion simulations under baseline conditions are presented in Figure 5. Cylinder pressure and emission results are compared with experimental data [29,30]. The difference between the cylinder pressures in simulations and experiments is less than 2%, as shown in Figure 5a. These results show that the numerical model accurately predicts ignition delay and peak pressure values. Additionally, under baseline conditions, the brake mean effective pressure (BMEP) remains at 4.05 bar, which is equivalent to 20% engine load [29]. In accordance with experiments, mean effective pressure (MEP) values remain within a 2% range under baseline conditions. Figure 5b shows comparisons of NOX, CH4 and soot emissions. To align the scale with NOX emissions, CH4 values are divided by 10, while soot values are multiplied by 100. As NGEF increases, NOX and soot emissions decrease. The numerical model accurately captures this trend, showing good agreement with measurements, with differences generally below 10% [29]. Since soot emission data is unavailable for 75% NGEF, only the numerical result of 0.7 mg/kWh is presented. Measurements from Guo et al. [29] under mid-load conditions show that the 0.7 mg/kWh value is quite reasonable. Despite reductions in NOX and soot, CH4 emissions increase at higher NGEF conditions. Under 25% and 75% NGEF conditions, CH4 values show good agreement with experiments with differences below 10%. However, CH4 is slightly underestimated by approximately 20% at 50% NGEF. These results indicate that the numerical model is capable of performing combustion and emission simulations under each NGEF condition.
3.2. Effects of Injection Pressure
The effects of injection pressure on combustion and emission characteristics are discussed in this section. Simulations are conducted using injection pressures of 32, 50, 90, and 126 MPa, while all other operating parameters remain the same as baseline conditions. The effects of injection pressure variation under 0% and 25% NGEF conditions are presented in Figure 6 and Figure 7. An increase in injection pressure results in a greater pressure difference between injector sac volume and cylinder, which leads to higher injection velocities. Since NHD remains constant, injection mass flow rates increase with rising injection pressure, as shown in Figure 6b. As a result, diesel injection is completed in a shorter duration. The increase in injection velocity and mass flow rates leads to earlier and more rapid heat release as shown in Figure 6a. CA50, the crank angle at which half of the chemical heat is released, is a useful parameter for analyzing combustion rate changes. Figure 7a,c show CA50 values are close to 7 crank angle (CA) degrees under baseline conditions. As injection pressure increases, CA50 values shift toward 0 CA degrees. This shift indicates a significant increase in heat release rates (HRR). However, an excessive increase in heat release before top dead center (TDC) leads to elevated pressure values in compression stroke, causing higher compression work [43]. Additionally, while higher pressure values are observed between 0 and 20 CA degrees, slightly lower pressure values occur beyond 20 CA degrees at elevated injection pressures as shown in Figure 6. Consequently, when injection pressure increases to 90 MPa and 126 MPa under 0% and 25% NGEF conditions, MEP values decrease as shown in Figure 7b,d. Furthermore, higher HRR values correspond to increased MPRR levels as presented in Figure 7a,c. The MPRR values are estimated to be 6 and 7.5 bar under 0%, and 25% NGEF baseline conditions. These values agree with experimental data from Yousefi et al. [24], which defines the MPRR limit as 13 bar for the simulated engine. As the injection pressure increases to 90 MPa and 126 MPa, MPRR values exceed the limit. In brief, higher injection pressure values do not provide substantial improvement in combustion performance under 0% and 25% NGEF conditions.
The effects of injection pressure on emissions under 0% and 25% NGEF conditions are compared in Figure 7b,d. Additionally, estimated soot emissions are shown in Table 3. Results agree with previous studies [19,24], which indicate that higher injection pressure values lead to a decrease in CH4 and soot emissions. The decrease in soot emissions reaches 90% when injection pressure increases to 126 MPa. Although CH4 emissions are not a major pollutant under fully diesel fueled conditions, their values are provided for consistency in presentation. In contrast to improvements in soot and CH4 emissions, NOX emissions increase by approximately 90% at 126 MPa injection pressure compared to baseline conditions. As a result, elevated injection pressure values reduce soot and CH4 emissions at the expense of a significant increase in NOX emissions.
The effects of injection pressure under 50% and 75% NGEF conditions are presented in Figure 8 and Figure 9. As injection pressure increases, injection velocity and mass flow rates increase, and injection duration decreases. As a result, higher combustion rates and increased cylinder peak pressures are observed, as shown in Figure 8. Unlike 0% and 25% NGEF, an increase in MEP values is observed at elevated injection pressures, as shown in Figure 9b,d. Several factors contribute to this improvement. First, as shown in Figure 9a,c, CA50 values are significantly delayed under baseline conditions compared to 0% and 25% NGEF. When the CA50 value is approximately 5-7 CA degrees, MEP values generally reach their maximum. An increase in injection pressure shifts CA50 values toward 5-7 CA degrees. For example, when injection pressure increases from 32 to 126 MPa, CA50 value shifts from 13 to 7 CA degrees under 75% NGEF conditions. Furthermore, in addition to higher peak pressures, cylinder pressures remain higher during expansion stroke due to an increased combustion rate and greater total heat release at elevated injection pressures. As a result, MEP values improve up to 4.6% and 6.7% compared to baseline cases under 50% and 75% NGEF, respectively. Additionally, MPRR values remain below the 13-bar limit under 75% NGEF. However, the highest MPRR values are observed under 50% NGEF at elevated injection pressures.
The improvements in combustion performance under 50% and 75% NGEF conditions are accompanied by a reduction in CH4 and soot emissions. At 126 MPa injection pressure, soot emissions are estimated to be 0.25 and 0.15 mg/kWh under 50% and 75% NGEF conditions, respectively. Additionally, CH4 emissions decrease from 20.5 g/kWh to 6.3 g/kWh under 75% NGEF conditions. However, NOX emissions increase with a rise in injection pressure, as shown in Figure 9b,d. At 126 MPa injection pressure, NOX emissions are estimated to be 10.0, 8.6, 9.7, and 6.5 g/kWh under the 0%, 25%, 50%, and 75% NGEF conditions, respectively. These results indicate that NOX emissions at 75% NGEF are significantly lower than at 0%, 25%, and 50% NGEF. In summary, an increase in injection pressure improves combustion performance and reduces CH4 and soot emissions under 50% and 75% NGEF conditions. Injection pressures of 90 and 126 MPa are particularly critical, as they result in excessive MPRR values under 50% NGEF. On the other hand, 75% NGEF conditions experience a NOX increase up to 80% compared to the baseline, although it remains lower than other NGEF conditions.
Finally, changes in injection rate curves under high NGEF conditions require careful consideration. A comparison of Figure 6 and Figure 8 reveals that maximum injection rates at 75% NGEF are lower than observed at other NGEF conditions. At 75% NGEF, injection duration decreases by up to 2.6 CA degrees at elevated injection pressures. Due to shortened injection durations, fuel injection ends before the injection rate curve reaches its maximum value, as shown in Figure 8b. Furthermore, a comparison of injection velocity values in Figure A1 (in Appendix A) shows that most of the fuel is injected at a lower injection velocity compared to the maximum value. These results indicate that excessively short injection durations limit the benefits of an increase in injection pressure. Additionally, under high NGEF and low-load conditions, combustion performance and emission characteristics are highly sensitive to injection conditions. However, Lee et al. [17] reported that cyclic variations in injection conditions become more pronounced as injection durations shorten. Consequently, cyclic variations are more pronounced where the combustion is highly sensitive to injection conditions. Therefore, it is important to reduce the cyclic variations in injection conditions for improving combustion stability.
3.3. Effects of NHD Variations
This section discusses the effects of NHD variation on combustion performance and emission characteristics. The results are sequentially presented for NGEF conditions ranging from 0% to 75%. Figure 10 presents cylinder pressures for injection pressures of 32 MPa and 126 MPa at varying NHD values. Additionally, Figure 11 presents CA50, MEP, MPRR, and emission results for all injection pressure conditions. Reducing NHD, which corresponds to a smaller nozzle exit area, lowers mass flow rates, as shown in Figure 10b. Because diesel fuel mass per cycle is constant, injection duration increases. The reduction in mass flow rate does not significantly delay the ignition timing. However, lower mass flow rates lead to a reduction in HRR, as shown in Figure 10a. As a result of this reduction, cylinder pressures decrease and CA50 values are delayed, as shown in Figure 11a. The decrease in cylinder pressure is more pronounced at injection pressures of 32 MPa and 50 MPa. A decrease in HRR also leads to a reduction in MPRR values, as shown in Figure 11c. Furthermore, Figure 11b shows the normalized MEP values according to the baseline condition. MEP comparison indicates that MEP values decrease as NHD decreases. Additionally, while a few operating conditions show slight improvements in MEP, most result in a decline. On the other hand, a reduction in NHD leads to a decline in NOX emissions under 32, 50, and 90 MPa injection pressures. However, Figure 11d indicates that NOX emissions remain almost constant as NHD decreases at 126 MPa injection pressure. These NOX values exceed EURO 7 and IMO limits [5,6]. Finally, soot emissions generally rise as NHD decreases. The relative increase in soot emissions reaches up to 20% at 32 MPa and 50 MPa injection pressures. However, a reduction in NHD at 90 MPa and 126 MPa leads to an increase in soot emissions up to 60%. Additionally, Dallmann et al. [44] report that soot emissions account for 40-50% of fine particulate matter (PM) emissions. Therefore, it can be said that soot emissions are higher than Euro 7 limits (8 mg/kWh). In brief, the results show that combinations of injection pressure and NHD considered in the study provide limited improvement in combustion performance compared to baseline conditions. The results also show that MPRR levels and NOX emissions can be reduced with a reduction in NHD.
The effects of NHD variation under 25% NGEF conditions are similar to those observed at 0% NGEF. First, in most 25% NGEF cases, MEP decreases, while only a few operating conditions show slight improvement in MEP. The magnitude of the decrease in MEP is limited compared to 0% NGEF. MEP ranges between -2.5% and +1.4% of the baseline condition. As discussed in the previous section, the use of 90 and 126 MPa injection pressures leads to excessive MPRR values under 25% NGEF conditions. To achieve MPRR levels below 13 bar, NHD values must be reduced to 190 μm or lower at 90 and 126 MPa. Similar to 0% NGEF, a reduction in NHD increases soot emissions and decreases NOX emissions. NOX values range between 3.8-8.6 g/kWh, while CH4 emissions range between 4.1-6.3 g/kWh. NOX emissions are higher than the limits specified in EURO 7 and IMO [5,6]. IMO does not regulate CH4 emissions; however, FuelEU Maritime [7] classifies CH4 emissions as methane slip, setting a limit of 3.1% of the fuel mass. At 25% NGEF, CH4 emissions range between 2.6-3.5% of the fuel mass, which is close to 3.1% criterion; however, they are higher than EURO 7 limits. Additionally, soot emissions exceed EURO 7 regulatory limits at 32 and 50 MPa injection pressures but remain slightly below the limits at 90 and 126 MPa. In summary, at 25% NGEF, NOX and soot emissions are higher than that at 50% and 75% NGEF, while UHC emissions remain similar. Since 25% NGEF does not offer a significant advantage, the results are briefly discussed.
Finally, it can be noted that injection durations reach excessive values under 0% and 25% NGEF conditions when NHD is reduced to 150 μm at lower injection pressures. For example, at 0% NGEF with a 50 MPa injection pressure and a 150 μm NHD, the injection duration extends to 19 CA degrees. Since high-load injection durations can be 3 to 4 times longer than low-load conditions, reducing NHD to 150 μm may not be reasonable at lower NGEF and fully diesel fueled conditions.
Although NHD variation leads to similar changes in combustion characteristics under 0%, 25%, and 50% NGEF conditions, some of the effects significantly differ under 50% NGEF. Smaller NHD values lead to lower injection flow rates, HRR, and peak pressures. However, the decrease in cylinder pressures is limited compared to 0% and 25% NGEF conditions, as shown in Figure 12. Limited reductions in cylinder pressures are related to the change in CA50 values. At 50% NGEF, the delay in CA50 values caused by NHD reduction is smaller than at 0% and 25% NGEF, as shown in Figure 13a. Since natural gas contributes to heat release in NDDF combustion, a reduction in diesel mass flow rate has a smaller effect on CA50 values. As NHD decreases from 230 μm, MEP values vary within a range of approximately 2%. In contrast to 0% and 25% NGEF, MEP values are generally higher than the baseline condition, with only one case leading to a loss in MEP, as shown in Figure 13b. At 50% NGEF, the highest MEP levels are obtained at NHD values of 230 μm and 210 μm. Further reductions in NHD do not result in additional MEP improvements. MEP improvement depends more on injection pressure than NHD values at 50% NGEF. However, 210 and 230 μm NHD values lead to excessive MPRR levels at 90 and 126 MPa injection pressures, as shown in Figure 13c. To maintain acceptable MPRR levels at 90 MPa, 190 μm or lower NHD values must be used. A further reduction to 150 μm is required at 126 MPa. Furthermore, the reduction in NHD leads to a decline in NOX emissions at 90 and 126 MPa injection pressures. Conversely, NOX emissions increase as NHD decreases at 32 and 50 MPa injection pressures, as shown in Figure 13d. Finally, CH4 and soot emissions generally increase as NHD decreases. Soot emissions range between 7.1-7.3, 1.8-3.2, 0.6-1.1, and 0.3-0.6 mg/kWh at injection pressures of 32, 50, 90, and 126 MPa, respectively. A comparison with EURO 7 and IMO Tier 3 standards shows that NOX emissions are higher than those limits [5,6]. However, at 90 and 126 MPa injection pressures, soot emissions remain significantly lower than EURO 7 and IMO limits. Finally, CH4 emissions are higher than EURO 7, but they are very close to 3.1% criterion of FuelEU [5,7]. CH4 values range from 2.4 to 3.5% of the fuel mass.
The effects of NHD variation under 75% NGEF conditions are presented in Figure 14, Figure 15 and Figure 16. Compared to lower NGEF conditions, the effects of NHD variation differ significantly under 75% NGEF. First, Figure 14 and Figure A1 (in Appendix A) indicate that injection durations decrease to very short values and injection mass flow rates are lower than those in other NGEF conditions. Because of the lower fuel mass, injection completes before sac volume pressure and injection velocity reach their peaks. When NHD decreases, injection duration increases. This allows sac pressure and injection velocity to reach higher values, as shown in Figure A1. Reducing NHD improves combustion by increasing injection velocity, which enhances atomization, spray penetration, and combustion rate. On the other hand, a smaller NHD reduces the injection rate, which causes a decline in HRR. In brief, reducing NHD under 75% NGEF conditions leads to opposing effects in injection conditions. These changes occur simultaneously with NHD reduction, and their combined effects determine the injection conditions and combustion characteristics.
The opposing effects in injection conditions create specific impacts on combustion and emission characteristics at 75% NGEF. Figure 14a indicates that the reduction in NHD leads to a limited decrease in cylinder peak pressure values at 32 MPa injection pressure. However, in contrast to other NGEF conditions, at injection pressures of 50, 90, and 126 MPa, cylinder peak pressure values remain nearly the same as NHD decreases. Additionally, slightly higher cylinder pressures are observed during expansion stroke beyond peak pressure region. Higher cylinder pressures result in higher MEP values, as shown in Figure 15b. MEP values increase to a peak as NHD decreases, then start to decline. Several factors contribute to the increase in MEP. First, improved injection conditions compensate for the reduction in HRR caused by a lower fuel mass flow rate. Particularly, at 90 and 126 MPa injection pressures, the decline in HRR is minimal. The delay in CA50 values is observed to be less than 1 CA degree between NHD values of 150 μm and 230 μm, as shown in Figure 15a. The limited decrease in CA50 and HRR explains the similar cylinder peak pressure values in Figure 14b. Furthermore, it is observed that combustion durations between CA50 and CA90 (90% heat release) decrease as NHD decreases at 90, and 126 MPa injection pressures. Figure A2 (in Appendix A) presents CA90 values. The reduction in CA90 indicates that higher combustion rates are maintained for a longer period. Increased injection durations lead to this improvement in combustion rates. This is because an increase in injection duration delays the diesel fuel consumption duration. This delay provides the required time for better mixture formation between natural gas-air mixture and diesel spray. The diesel spray contains more chemically active species, including higher hydrocarbons and active radicals formed during diesel combustion. Additionally, the presence of these species significantly improves the poor combustion characteristics of natural gas. As a result, a reduction in NHD delays the rapid consumption of diesel fuel, provides better mixture formation and prevents the deterioration of combustion rates. These improvements in combustion rates result in higher cylinder pressure values beyond peak pressure region at 90 and 126 MPa injection pressures. Cylinder temperature (Figure 16a) and CH4 mass fraction (Figure 16b) comparison support the discussed findings. When NHD decreases from 230 μm to 150 μm there is no significant delay or reduction in combustion. Furthermore, as NHD decreases from 230 μm to 150 μm, cold regions in the cylinder become significantly smaller. Additionally, CH4 mass fraction images presented in Figure 16b indicate that at 0 CA degree, CH4 burns in a larger zone under 230 μm NHD and 126 MPa injection conditions. However, images at 37 CA degrees show that more CH4 is burned under 150 μm NHD and 126 MPa injection conditions. These images show that combustion rates deteriorate after a rapid combustion stage at 230 μm NHD, while the 150 μm NHD case maintains combustion rates.
To determine the NHD value that maximizes MEP, simulations are conducted with 130 and 110 μm at 90 and 126 MPa injection pressures. However, a further reduction in NHD from 150 μm leads to a decrease in MEP values, as shown in Figure 15b. As previously discussed, the injection conditions of 126 MPa and 230 μm increase MEP by 6.7% under 75% NGEF. In addition to this, NHD reduction further improves MEP up to 9.8% compared to the baseline. Moreover, this improvement is achieved while MPRR remains below 11 bar as shown in Figure 15c. Along with improvements in combustion performance, the use of smaller NHD values further reduces CH4 emissions. In the best case, the combination of 150 μm NHD and 126 MPa injection pressure reduces CH4 emission to 4.7 g/kWh. Figure 16b presents CH4 emission regions at EVO. In-cylinder images at 145 CA indicate the isovolumes of CH4 mass fractions. When injection pressure increases from 32 MPa to 126 MPa, CH4 emissions remain in three regions: the axis region, near the cylinder wall, and the crevice region. As NHD decreases from 230 to 150 μm, CH4 emissions in these regions are further reduced. The 4.7 g/kWh CH4 emission value at 126 MPa and 150 μm exceeds the EURO 7 limits. However, this value is equivalent to 2.7% of total fuel mass and it is lower than Fuel EU methane slip regulation [7]. Soot emissions are estimated to range between 0.1-0.2 mg/kWh at 90 MPa and 126 MPa injection pressures. Soot emission levels indicate that NDDF engines can meet EURO 7 and IMO regulations without requiring an exhaust aftertreatment device such as a diesel particulate filter (DPF). Moreover, at the same injection pressure, NOX emissions under 75% NGEF conditions are significantly lower than at other NGEF levels. However, even at 75% NGEF, NOX emissions exceed EURO 7 and IMO regulatory limits. In brief, results indicate that the low-load issues, including reduced thermal efficiency, high CH4 emissions, and lower combustion stability can be significantly improved with an optimal injection pressure and NHD combinations.
In addition to improvements in combustion and emission characteristics, NHD reduction may reduce cyclic variations reported under high injection pressure and high NGEF conditions in NDDF engines. A smaller NHD improves combustion stability and enhances control over combustion. This reduces combustion sensitivity to variations in operating conditions. Moreover, fluctuations in injection conditions caused by the injection system decrease at smaller NHD values. This is because, with longer injection durations, cyclic differences in the injection system have a reduced impact on sac volume pressure, injection velocity, and mass flow rate.
3.4. Evaluation of Simulated Matrix
This section presents the results of optimal injection pressure and NHD combinations, MEP variations, NOX - CH4 relationships, thermal efficiency, and GHG comparisons. The results of 0%, and 25% NGEF conditions indicate that no clear combination exists. Since MEP values vary within a narrow range, different combinations of injection pressure and NHD can be selected based on priorities such as MPRR values, NOX, and soot emissions. At 50% NGEF, the 90 MPa injection pressure and 190 μm NHD condition yields an MEP value close to the maximum, along with significantly lower soot and CH4 emissions. Additionally, similar to 0% and 25% NGEF, there are also several other viable combinations. Unlike 0%, 25%, and 50% NGEF conditions, a clear operating region emerges under 75% NGEF. The combination of 126 MPa injection pressure and 150 μm NHD conditions provides the highest MEP value along with considerably lower soot and CH4 emissions. Soot emissions comply with IMO and EURO 7 limits, while CH4 emissions meet FuelEU standards under these operating conditions.
Another important result is shown in Figure 17a, which presents the normalized MEP results for all simulated cases in the study. The differences between maximum and minimum MEP values are estimated to be 4.5%, 4%, 6%, and 13% under 0%, 25%, 50%, and 75% NGEF conditions, respectively. These results indicate that at high NGEF conditions, injection parameters significantly affect the engine performance. Additionally, MEP comparisons reveal that combustion stability is highly sensitive under low-load and high-NGEF conditions. Figure 17b represents CH4 and NOX relationship under varying NGEF conditions. CH4 is only formed during diesel fuel combustion at 0% NGEF conditions because there is no premixed natural gas. Therefore, CH4 values are quite low under 0% NGEF conditions. On the other hand, NOX emissions are significantly influenced by injection pressure and NHD. NOX values vary over a wide range. As NGEF increases, NOX emissions decrease, and CH4 emissions increase. Under 25% and 50% NGEF conditions, CH4 emissions change within a small range, while NOX changes substantially. However, under 75% NGEF conditions, CH4 values vary over a wide range and they correlate with NOX emissions. As CH4 decreases, NOX emissions increases. The lowest CH4 emissions are observed under conditions with higher NOX emissions. In brief, a clear trade-off emerges under 75% NGEF conditions.
Thermal efficiency values estimated within closed-cycle region (IVC-EVO) are compared in Figure 18. Baseline results are compared with the cases that provide the highest thermal efficiency at each NGEF. Under 0% and 25% NGEF conditions, the total fuel energy remains constant, and power outputs are similar. As expected, the thermal efficiency values remain nearly identical. To achieve the same power output, additional fuel is required under 50% and 75% NGEF conditions due to lower thermal efficiency. However, Figure 18 shows that the same level of efficiency as conventional diesel engines can be achieved at high NGEF conditions through the implementation of optimal injection pressure and NHD combinations. Finally, total GHG emissions are compared for the baseline and highest ITE cases, as shown in Figure 19. In the baseline cases, NDDF combustion reduces CO2 emissions compared to fully diesel fueled conditions, by 3%, 9%, and 21% under 25%, 50%, and 75% NGEF conditions, respectively. However, under baseline conditions, even a 21% decline in CO2 does not lead to an overall reduction in GHG emissions. In fact, this case increases the total GHG emissions. CH4 has a global warming potential 28 times higher than CO2 emissions [45]. Therefore, when CH4 emissions are converted to CO2-equivalent using a factor of 28, total GHG emissions at 75% NGEF are 80% higher than those at 0% NGEF. In accordance with this result, Sagot et al. [46] reported a 30% increase in total GHG emissions in a dual-fuel engine operating at low load. The total GHG at the highest ITE case of 75% NGEF is about 13% higher than that of 0% NGEF. Further reductions in CH4 emissions are necessary to benefit from GHG emissions reduction potential of natural gas.
4. Conclusions
This study numerically investigates the effects of injection pressure and NHD variation in an NDDF engine operating at low-load. Simulations are performed with injection pressures of 32, 50, 90, and 126 MPa while the engine operates under 0%, 25%, 50%, and 75% NGEF conditions. Furthermore, NHD effects are analyzed by varying NHD from 230 to 110 μm in 20 μm intervals. Results show that the effects of injection pressure and NHD variation on combustion performance and emissions vary across different NGEF conditions. The main conclusions can be listed as follows:
- An increase in injection pressure causes a decrease in MEP values because of excessively advanced combustion under 0% and 25% NGEF conditions. Additionally, a reduction in NHD from 230 μm to 150 μm does not improve MEP values. Although a substantial improvement in engine performance is not observed, optimal values of injection pressure and NHD can provide significant reductions in MPRR values, NOX, and soot emissions.
- Unlike at 0% and 25%, MEP improves by up to 4.6% under 50% NGEF conditions. MEP values increase with a rise in injection pressures. However, no additional improvement is observed as NHD decreases. The highest MPRR levels are observed under 50% NGEF conditions. At higher injection pressures and larger NHD values, MPRR exceeds the allowable limit. Therefore, a combination of higher injection pressures and smaller NHD values is preferable. In this way, compliance with MPRR limit and soot regulations can be achieved.
- The effects of injection pressure and NHD variation differ between 75% NGEF and others. The baseline CA50 value is delayed significantly at 75% NGEF depending on reduced combustion rates. An increase in injection pressure substantially improves the combustion rates, MEP values, and efficiency at 75% NGEF. When injection pressure increases from 32 MPa to 126 MPa, MEP increases by 6.7%. However, injection durations are further shortened under high NGEF, high injection pressure, and larger NHD conditions. These shortened injection durations introduce challenges in combustion control and stability.
- At 75% NGEF and injection pressures of 90 and 126 MPa, reducing NHD values increases injection duration and velocity. This improves the mixing between premixed natural gas-air and diesel spray. As a result, reducing NHD from 230 μm, further enhances engine performance. MEP increases with decreasing NHD up to a certain point, then it declines. The highest MEP is achieved with the combination of 126 MPa and 150 μm. Improvement in MEP reaches 9.8% compared to baseline. Under these conditions, the thermal efficiency is equivalent to that of a diesel engine. This improvement also results in a 77% reduction in CH4 emissions. This value is equivalent to 2.7% of fuel mass and it is lower than Fuel EU methane slip value of 3.1%. Moreover, PM emission regulations are met without requiring a DPF system. Additionally, MPRR values are lower than the limit. Finally, this condition results in the lowest total GHG emissions among the NDDF cases considered in this study.
- Finally using smaller NHD values at 75% NGEF enhances combustion control and stability. CA90 values and CH4 mass fraction images indicate that combustion rates are more stable at lower NHD values. Additionally, relative MEP changes indicate that combustion performance is highly sensitive to injection parameters under high NGEF conditions. Therefore, results indicate the need for more precise injector control to achieve stable operation. The use of smaller NHD is also advantageous in this regard as it increases injection durations.
Author Contributions
Conceptualization, M.D. and S.E.; methodology, M.D. and S.E; validation, M.D.; resources, S.E.; writing—original draft preparation, M.D.; writing—review and editing, M.D. and S.E.; visualization, M.D.; supervision, S.E. All authors have read and agreed to the published version of the manuscript.
Funding
This research received no external funding.
Data Availability Statement
The original contributions presented in the study are included in the article, and further inquiries can be directed to the corresponding author.
Conflicts of Interest
The authors declare no conflicts of interest.
Appendix A
Figure A1.
Injection conditions at 126 MPa injection pressure: (a) sac volume pressure at 0% NGEF; (b) sac volume pressure at 75% NGEF, (c) injection velocity at 0% NGEF; (d) injection velocity at 75% NGEF; (e) mass flow rate at 0% NGEF; (f) mass flow rate at 75% NGEF.
Figure A1.
Injection conditions at 126 MPa injection pressure: (a) sac volume pressure at 0% NGEF; (b) sac volume pressure at 75% NGEF, (c) injection velocity at 0% NGEF; (d) injection velocity at 75% NGEF; (e) mass flow rate at 0% NGEF; (f) mass flow rate at 75% NGEF.
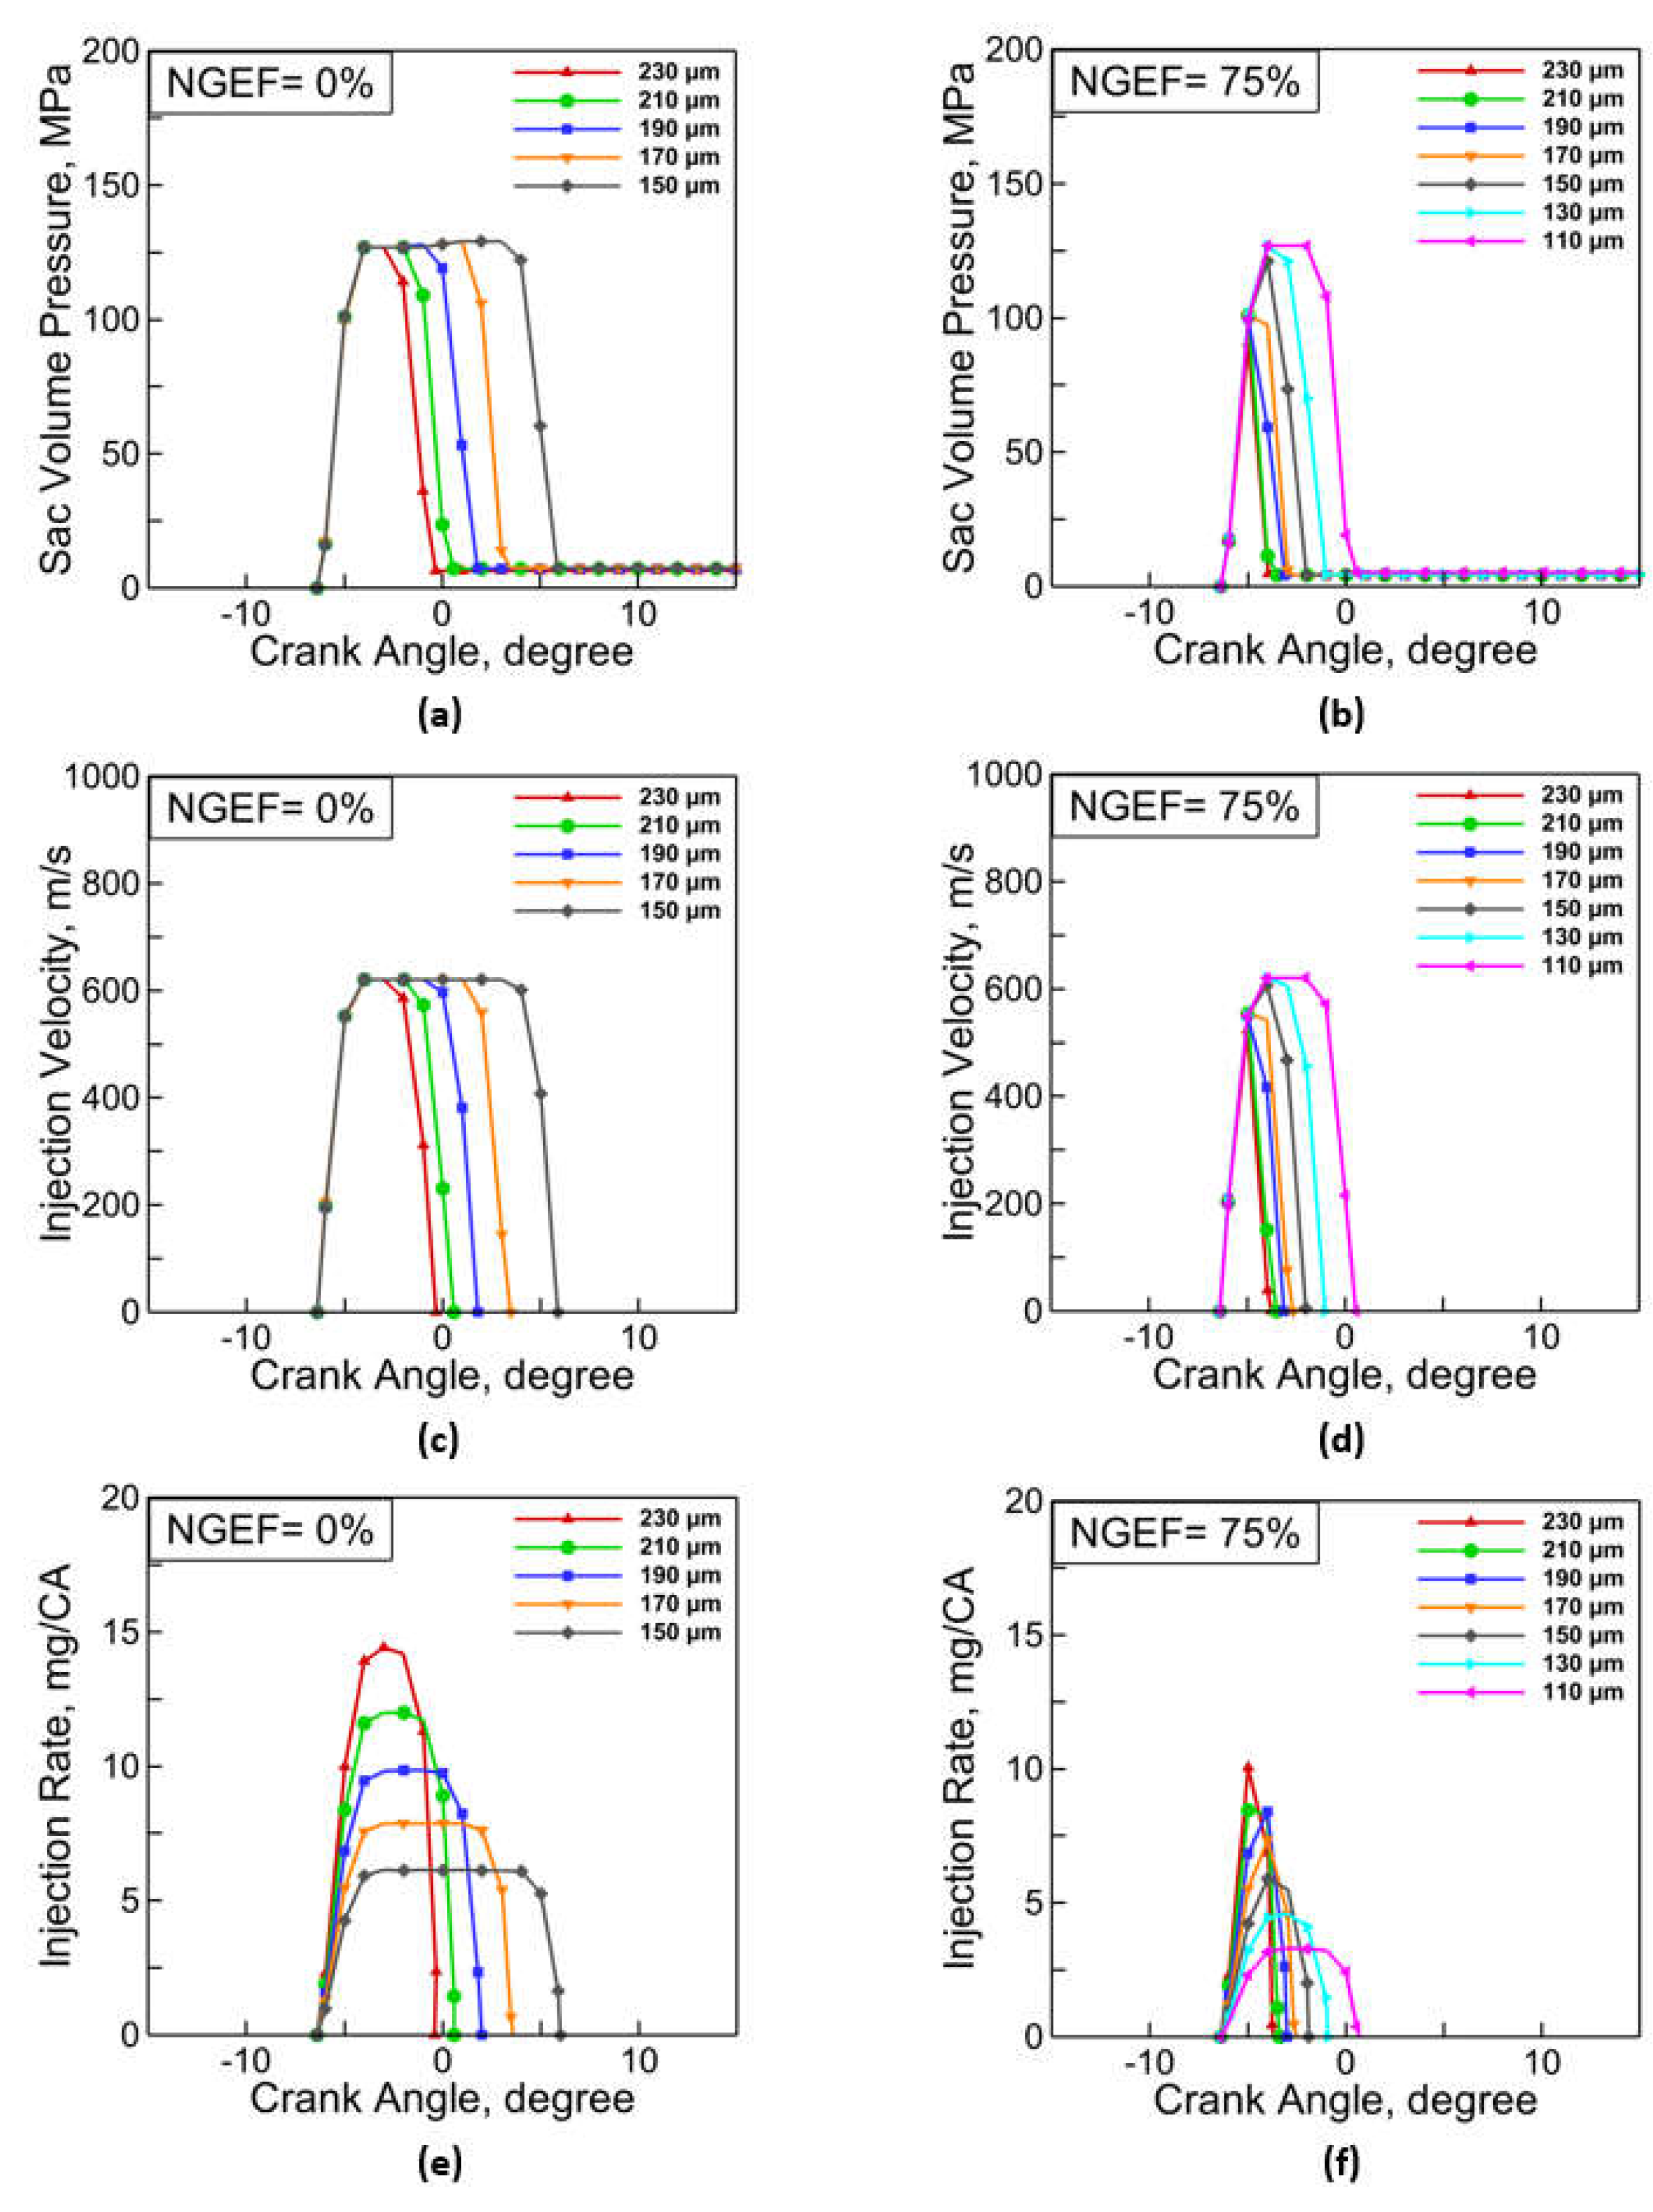
Figure A2.
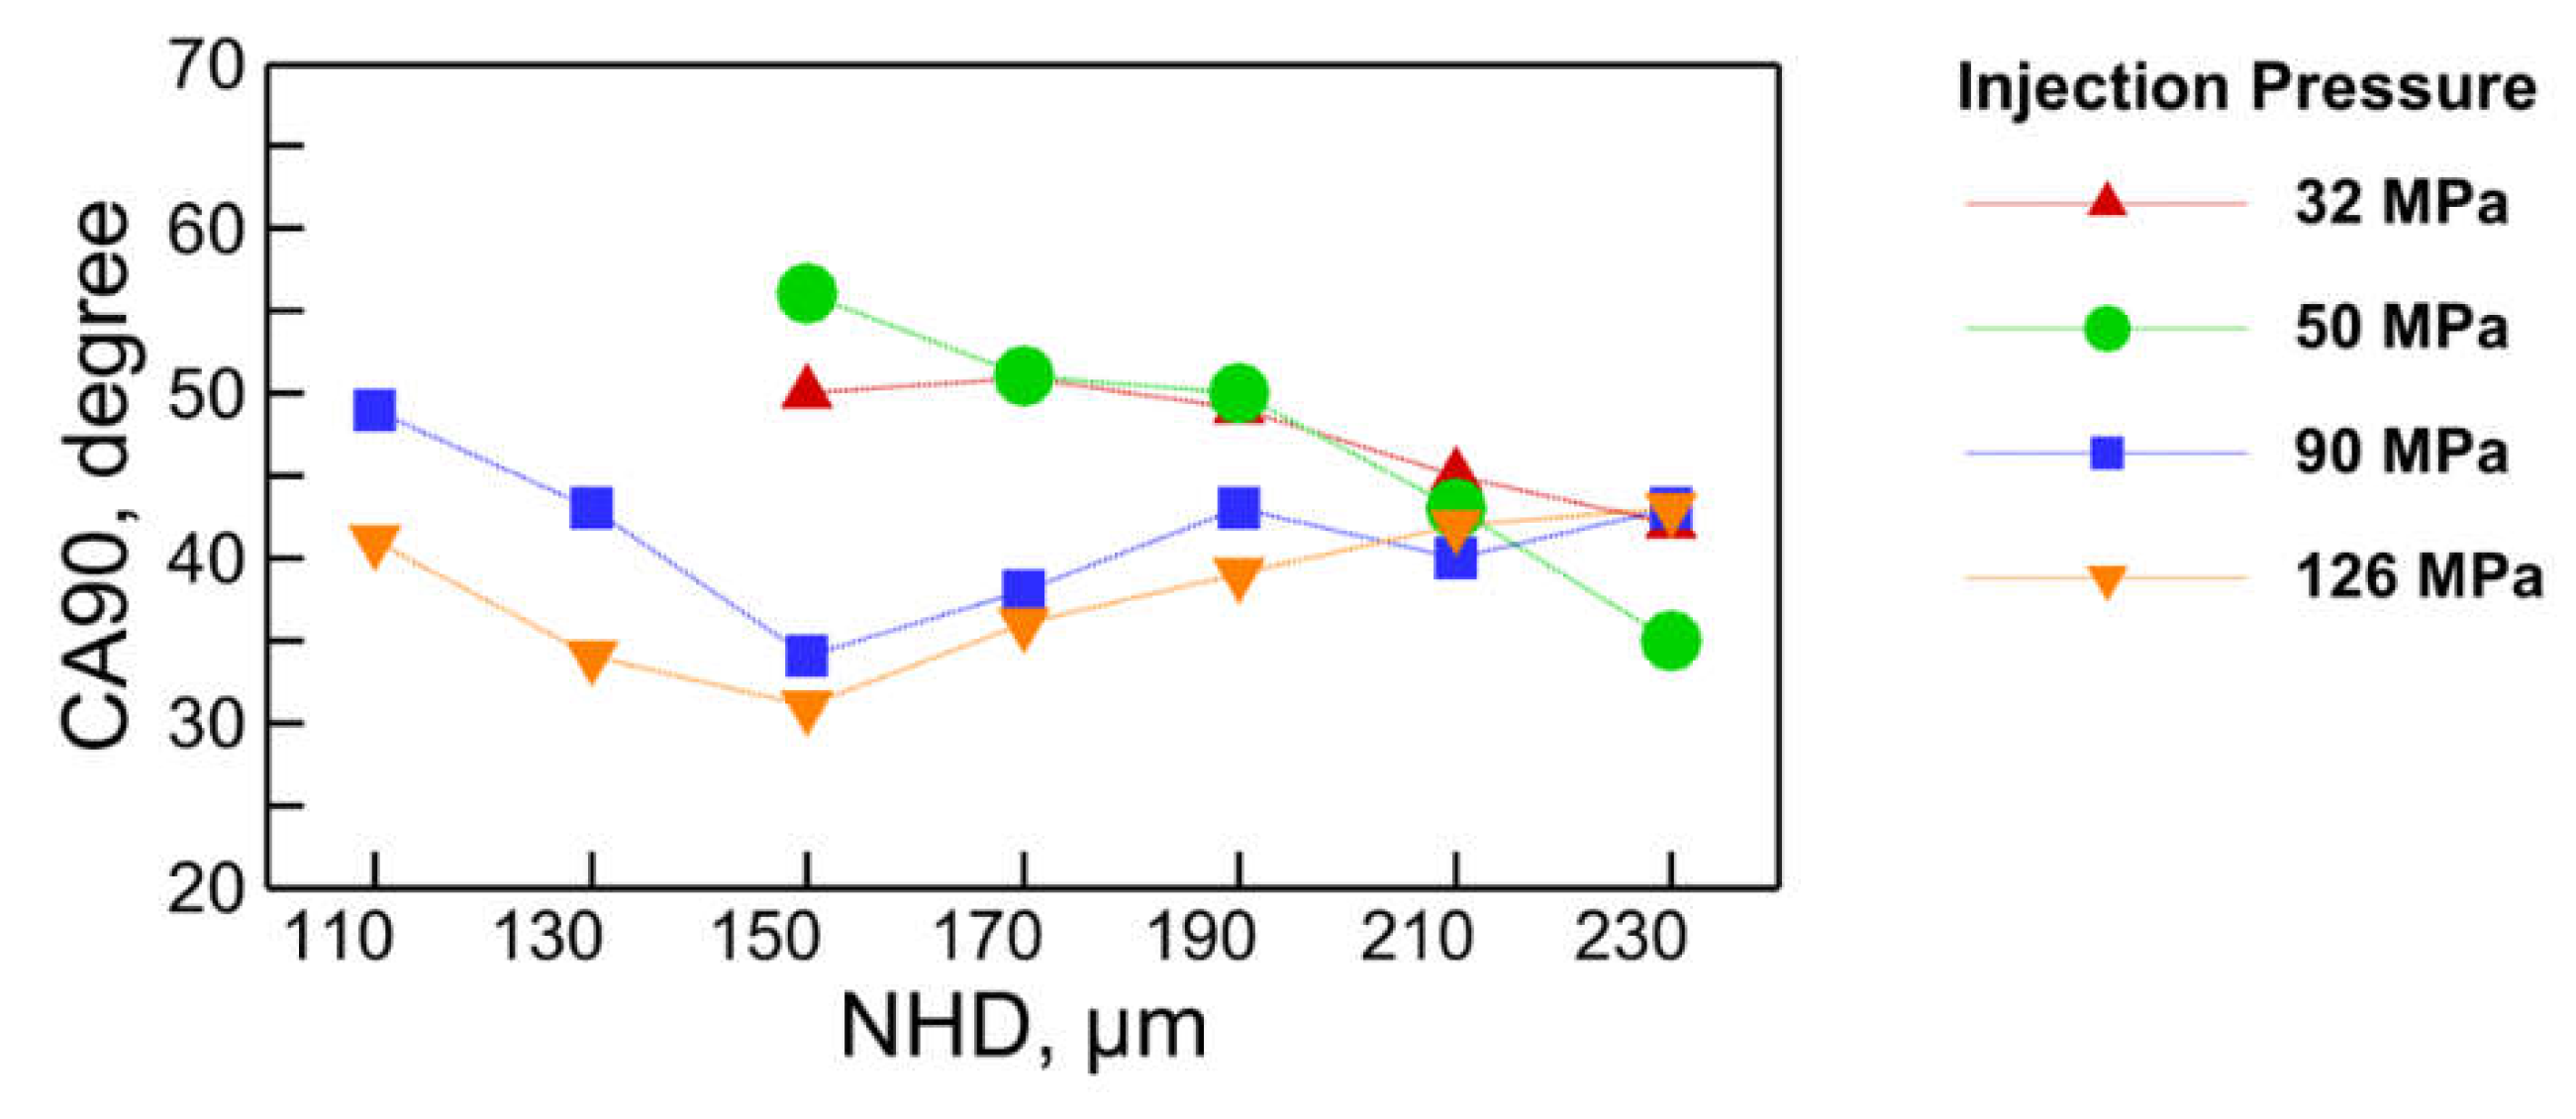
CA90 values at 75% NGEF.
References
- Reşitoğlu, İ.A.; Altinişik, K.; Keskin, A. The Pollutant Emissions from Diesel-Engine Vehicles and Exhaust Aftertreatment Systems. Clean Technol. Environ. Policy 2015, 17, 15–27. [Google Scholar] [CrossRef]
- Endresen, Ø.; Eide, M.; Dalsøren, S.; Isaksen, I.; Sørgård, E.; Corbett, J.; Winebrake, J. International Maritime Shipping: Environmental Impacts of Increased Activity Levels. In Globalisation, Transport and the Environment; 2010; pp. 161–184. ISBN 978-92-64-07919-9. [Google Scholar]
- Corbett, J.J.; Fischbeck, P.S.; Pandis, S.N. Global Nitrogen and Sulfur Inventories for Oceangoing Ships. J. Geophys. Res. Atmospheres 1999, 104, 3457–3470. [Google Scholar] [CrossRef]
- Sydbom, A.; Blomberg, A.; Parnia, S.; Stenfors, N.; Sandström, T.; Dahlén, S.E. Health Effects of Diesel Exhaust Emissions. Eur. Respir. J. 2001, 17, 733–746. [Google Scholar] [CrossRef] [PubMed]
- Dornoff, J.; Rodríguez, F. Euro 7: The New Emission Standard for Light- and Heavy-Duty Vehicles in the European Union. 2024. [Google Scholar]
- Ni, P.; Wang, X.; Li, H. A Review on Regulations, Current Status, Effects and Reduction Strategies of Emissions for Marine Diesel Engines. Fuel 2020, 279, 118477. [Google Scholar] [CrossRef]
- Fuel EU Maritime. REGULATION (EU) 2023/1805 OF THE EUROPEAN PARLIAMENT AND OF THE COUNCIL of 13 September 2023 on the Use of Renewable and Low-Carbon Fuels in Maritime Transport, and Amending Directive 2009/16/EC. 2009; Vol. 188. [Google Scholar]
- Tolley, A. Heavy-Duty Vehicles and Powertrains: Future Internal Combustion Engine Systems and Technologies. In Alternative Fuels and Advanced Vehicle Technologies for Improved Environmental Performance; Elsevier; pp. 291–351. ISSN 978-0-323-90979-2.
- Curran, S.; Onorati, A.; Payri, R.; Agarwal, A.K.; Arcoumanis, C.; Bae, C.; Boulouchos, K.; Dal Forno Chuahy, F.; Gavaises, M.; Hampson, G.J.; et al. The Future of Ship Engines: Renewable Fuels and Enabling Technologies for Decarbonization. Int. J. Engine Res. 2024, 25, 85–110. [Google Scholar] [CrossRef]
- Agarwal, A.K.; Singh, A.P.; Maurya, R.K. Evolution, Challenges and Path Forward for Low Temperature Combustion Engines. Prog. Energy Combust. Sci. 2017, 61, 1–56. [Google Scholar] [CrossRef]
- Reitz, R.D.; Duraisamy, G. Review of High Efficiency and Clean Reactivity Controlled Compression Ignition (RCCI) Combustion in Internal Combustion Engines. Prog. Energy Combust. Sci. 2015, 46, 12–71. [Google Scholar] [CrossRef]
- AEsoy, V.; Magne Einang, P.; Stenersen, D.; Hennie, E.; Valberg, I. LNG-Fuelled Engines and Fuel Systems for Medium-Speed Engines in Maritime Applications; 30 August 2011; pp. 2011-01–1998.
- Karim, G.A. Dual-Fuel Diesel Engines, 1st ed.; Taylor & Francis Group: London, UK, 2015; ISBN 978-1-4987-0309-3. [Google Scholar]
- Cui, Z.; Liu, Y.; Zhang, X.; Zhou, Q.; Yang, H.; Lu, M.; Tian, J. Visualization Study on the Ignition and Combustion Characteristics of Methane/Hydrogen Ignited by Diesel. Fuel 2024, 372, 132215. [Google Scholar] [CrossRef]
- Tripathi, G.; Dhar, A. Performance, Emissions, and Combustion Characteristics of Methane-Diesel Dual-Fuel Engines: A Review. Front. Therm. Eng. 2022, 2, 870077. [Google Scholar] [CrossRef]
- Liu, J.; Zhao, W.; Zhang, X.; Ji, Q.; Ma, H.; Sun, P.; Wang, P. Optimizing Combustion and Emissions in Natural Gas/Diesel Dual-Fuel Engine with Pilot Injection Strategy. Therm. Sci. Eng. Prog. 2024, 48, 102418. [Google Scholar] [CrossRef]
- Lee, S.; Kim, C.; Lee, S.; Lee, J.; Kim, J. Diesel Injector Nozzle Optimization for High CNG Substitution in a Dual-Fuel Heavy-Duty Diesel Engine. Fuel 2020, 262, 116607. [Google Scholar] [CrossRef]
- Wei, L.; Geng, P. A Review on Natural Gas/Diesel Dual Fuel Combustion, Emissions and Performance. Fuel Process. Technol. 2016, 142, 264–278. [Google Scholar] [CrossRef]
- Liu, J.; Yao, A.; Yao, C. Effects of Diesel Injection Pressure on the Performance and Emissions of a HD Common-Rail Diesel Engine Fueled with Diesel/Methanol Dual Fuel. Fuel 2015, 140, 192–200. [Google Scholar] [CrossRef]
- Yalong, L.; Bo, W.; Cong, W.; Zhi, J.; Binyang, W. The Effect of Ignition Diesel Injection Conditions on the Combustion Process of Natural Gas Engine. Appl. Therm. Eng. 2023, 235, 121452. [Google Scholar] [CrossRef]
- Bonfochi Vinhaes, V.; McTaggart-Cowan, G.; Munshi, S.; Shahbakhti, M.; Naber, J.D. Experimental Studies of Low-Load Limit in a Stoichiometric Micro-Pilot Diesel Natural Gas Engine. Energies 2022, 15, 728. [Google Scholar] [CrossRef]
- Baumgarten, C. Mixture Formation in Internal Combustion Engines; Heat and mass transfer; Springer: Berlin, Germany, 2006; ISBN 978-3-540-30835-5. [Google Scholar]
- Wang, X.; Li, H.; Li, G.; Fan, J.; Bai, H.; Gao, Y.; Huo, H. Effect of Injection Pressure on Low-Temperature Fuel Atomization Characteristics of Diesel Engines under Cold Start Conditions. Int. J. Multiph. Flow 2024, 172, 104712. [Google Scholar] [CrossRef]
- Yousefi, A.; Guo, H.; Birouk, M.; Liko, B. On Greenhouse Gas Emissions and Thermal Efficiency of Natural Gas/Diesel Dual-Fuel Engine at Low Load Conditions: Coupled Effect of Injector Rail Pressure and Split Injection. Appl. Energy 2019, 242, 216–231. [Google Scholar] [CrossRef]
- Zhang, Z.; Xu, C. Study on Influencing Factors and Laws of Fuel Injection Consistency of Common Rail Injector. J. Phys. Conf. Ser. 2021, 2097, 012001. [Google Scholar] [CrossRef]
- Yoon, M.; Choi, M.; Kang, K.; Oh, C.; Park, Y.; Choi, G. Effects of N-Heptane/Methane Blended Fuel on Ignition Delay Time in Pre-Mixed Compressed Combustion. Energies 2022, 15, 4081. [Google Scholar] [CrossRef]
- Zheng, J.; Hao, Z.; Wang, D.; Di, Y.; Peng, H.; Wu, T.; Miao, X. Effect of Double-Layer Hole Nozzle with Narrow Spray Angle on Combustion and Emissions in Dual-Fuel Natural Gas Engine. Fuel 2022, 314, 123090. [Google Scholar] [CrossRef]
- Hariharan, D.; Rajan Krishnan, S.; Kumar Srinivasan, K.; Sohail, A. Multiple Injection Strategies for Reducing HC and CO Emissions in Diesel-Methane Dual-Fuel Low Temperature Combustion. Fuel 2021, 305, 121372. [Google Scholar] [CrossRef]
- Guo, H.; Neill, W.S.; Liko, B. An Experimental Investigation on the Combustion and Emissions Performance of a Natural Gas–Diesel Dual Fuel Engine at Low and Medium Loads. In Proceedings of the Volume 1: Large Bore Engines; Fuels; Advanced Combustion; American Society of Mechanical Engineers, Houston, TX, USA, 8 November 2015; p. V001T03A005. [Google Scholar]
- Li, Y.; Li, H.; Guo, H.; Li, Y.; Yao, M. A Numerical Investigation on Methane Combustion and Emissions from a Natural Gas-Diesel Dual Fuel Engine Using CFD Model. Appl. Energy 2017, 205, 153–162. [Google Scholar] [CrossRef]
- ANSYS®Academic Research Forte Theory Manual.
- Healy, D.; Kalitan, D.M.; Aul, C.J.; Petersen, E.L.; Bourque, G.; Curran, H.J. Oxidation of C1−C5 Alkane Quinternary Natural Gas Mixtures at High Pressures. Energy Fuels 2010, 24, 1521–1528. [Google Scholar] [CrossRef]
- Wang, H.; Jiao, Q.; Yao, M.; Yang, B.; Qiu, L.; Reitz, R.D. Development of an N-Heptane/Toluene/Polyaromatic Hydrocarbon Mechanism and Its Application for Combustion and Soot Prediction. Int. J. Engine Res. 2013, 14, 434–451. [Google Scholar] [CrossRef]
- Gao, Z.; Li, G.; Xu, C.; Li, H.; Wang, M. A Calculation Method and Experiment Study of High-Pressure Common Rail Injection Rate with Solenoid Injectors. Sci. Prog. 2021, 104, 00368504211026157. [Google Scholar] [CrossRef]
- Salvador, F.J.; Gimeno, J.; De La Morena, J.; Carreres, M. Using One-Dimensional Modeling to Analyze the Influence of the Use of Biodiesels on the Dynamic Behavior of Solenoid-Operated Injectors in Common Rail Systems: Results of the Simulations and Discussion. Energy Convers. Manag. 2012, 54, 122–132. [Google Scholar] [CrossRef]
- Xu, J.; Fan, L.; Chen, C.; Lu, G.; Li, B.; Tu, T. Study on Fuel Injection Stability Improvement in Marine Low-Speed Dual-Fuel Engines. Appl. Therm. Eng. 2024, 253, 123729. [Google Scholar] [CrossRef]
- Kang, S.; Lee, S.; Hong, D.; Bae, C. Effects of Nozzle Orifice Diameter and Hole Number on Diesel Combustion and Engine Performance. Int. J. Automot. Technol. 2022, 23, 481–494. [Google Scholar] [CrossRef]
- Tanner, F.X.; Reitz, R.D. Scaling Aspects of the Characteristic Time Combustion Model in the Simulation of Diesel Engines. March 1 1999; pp. 1999-01–1175.
- Yousefi, A. A Numerical Study of the Combustion of a Natural Gas/Diesel Dual-Fuel Engine under Low to High Load Conditions. 2018.
- Soruşbay, C.; Ergeneman, M.; İmren, A.; Çalık, A.T. Experimental and Numerical Air Flow and Spray Dynamics Investigation in Internal Combustion Engines; İstanbul, Türkiye, 2008; p. 38.
- İmren, A. THE FULL OPERATING CYCLE MODELING OF HEAVY-DUTY DIESEL ENGINES. Ph.D. Thesis, Istanbul Technical University, İstanbul, Türkiye, 2010. [Google Scholar]
- Chan, M.; Das, S.; Reitz, R.D. Modeling Multiple Injection and EGR Effects on Diesel Engine Emissions. 1 October 1997; 972864. [Google Scholar]
- Baek, H.-M.; Jung, G.-S.; Vuong, Q.D.; Lee, J.-U.; Lee, J.-W. Effect of Performance by Excessive Advanced Fuel Injection Timing on Marine Diesel Engine. Appl. Sci. 2023, 13, 9263. [Google Scholar] [CrossRef]
- Dallmann, T.R.; Onasch, T.B.; Kirchstetter, T.W.; Worton, D.R.; Fortner, E.C.; Herndon, S.C.; Wood, E.C.; Franklin, J.P.; Worsnop, D.R.; Goldstein, A.H.; et al. Characterization of Particulate Matter Emissions from On-Road Gasoline and Diesel Vehicles Using a Soot Particle Aerosol Mass Spectrometer. Atmospheric Chem. Phys. 2014, 14, 7585–7599. [Google Scholar] [CrossRef]
- U.S. EPA Importance of Methane. Available online: https://www.epa.gov/gmi/importance-methane (accessed on 31 January 2025).
- Sagot, B.; Giraudier, G.; Decuniac, F.; Lefebvre, L.; Miquel, A.; Thomas, A. On-Board Measurement of Emissions on a Dual Fuel LNG Powered Cruise Ship: A Sea Trial Study. Atmospheric Environ. X 2025, 25, 100313. [Google Scholar] [CrossRef]
Figure 1.
60-degree sector model of the combustion chamber.
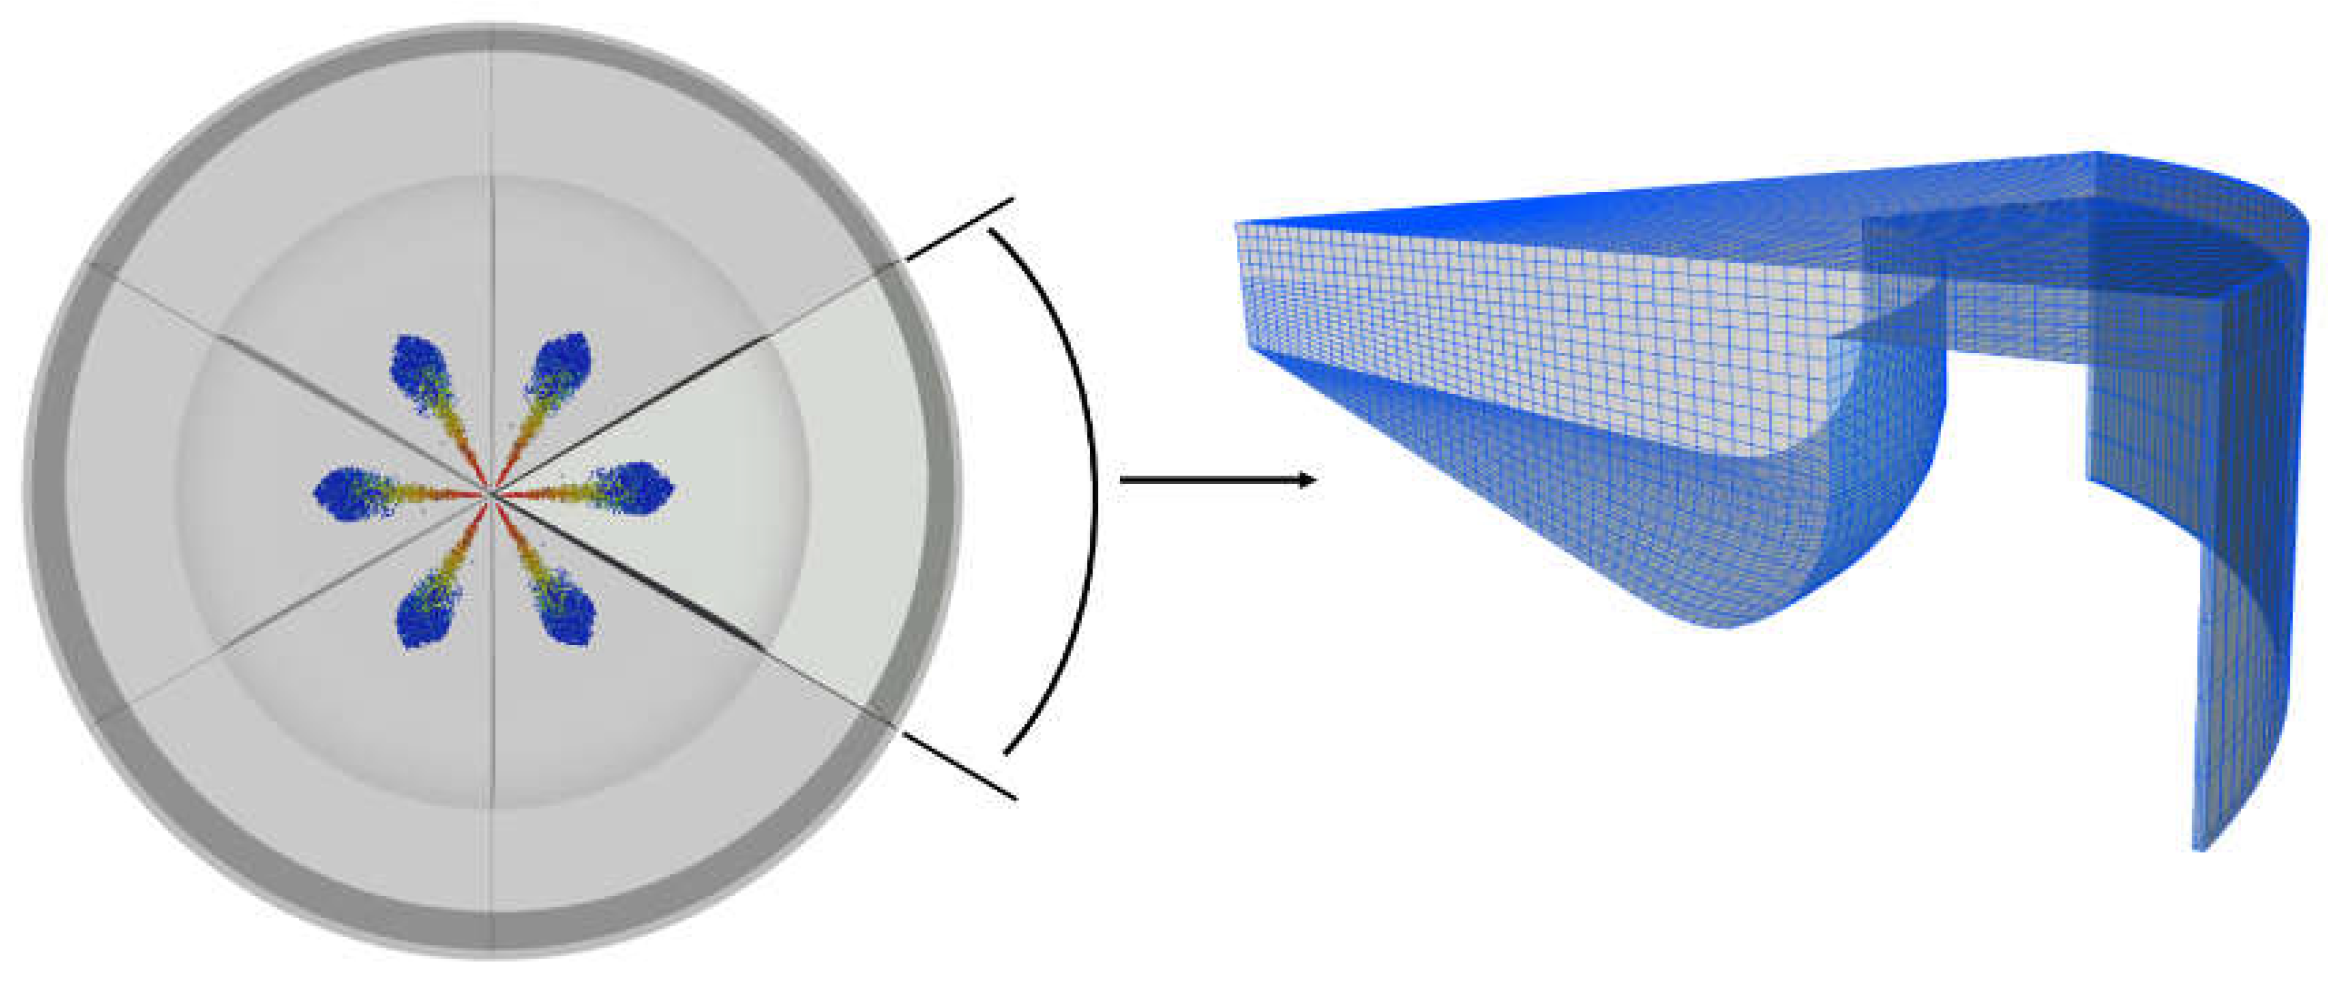
Figure 2.
Grid independence study under conditions: (a) 0% NGEF and (b) 75% NGEF.
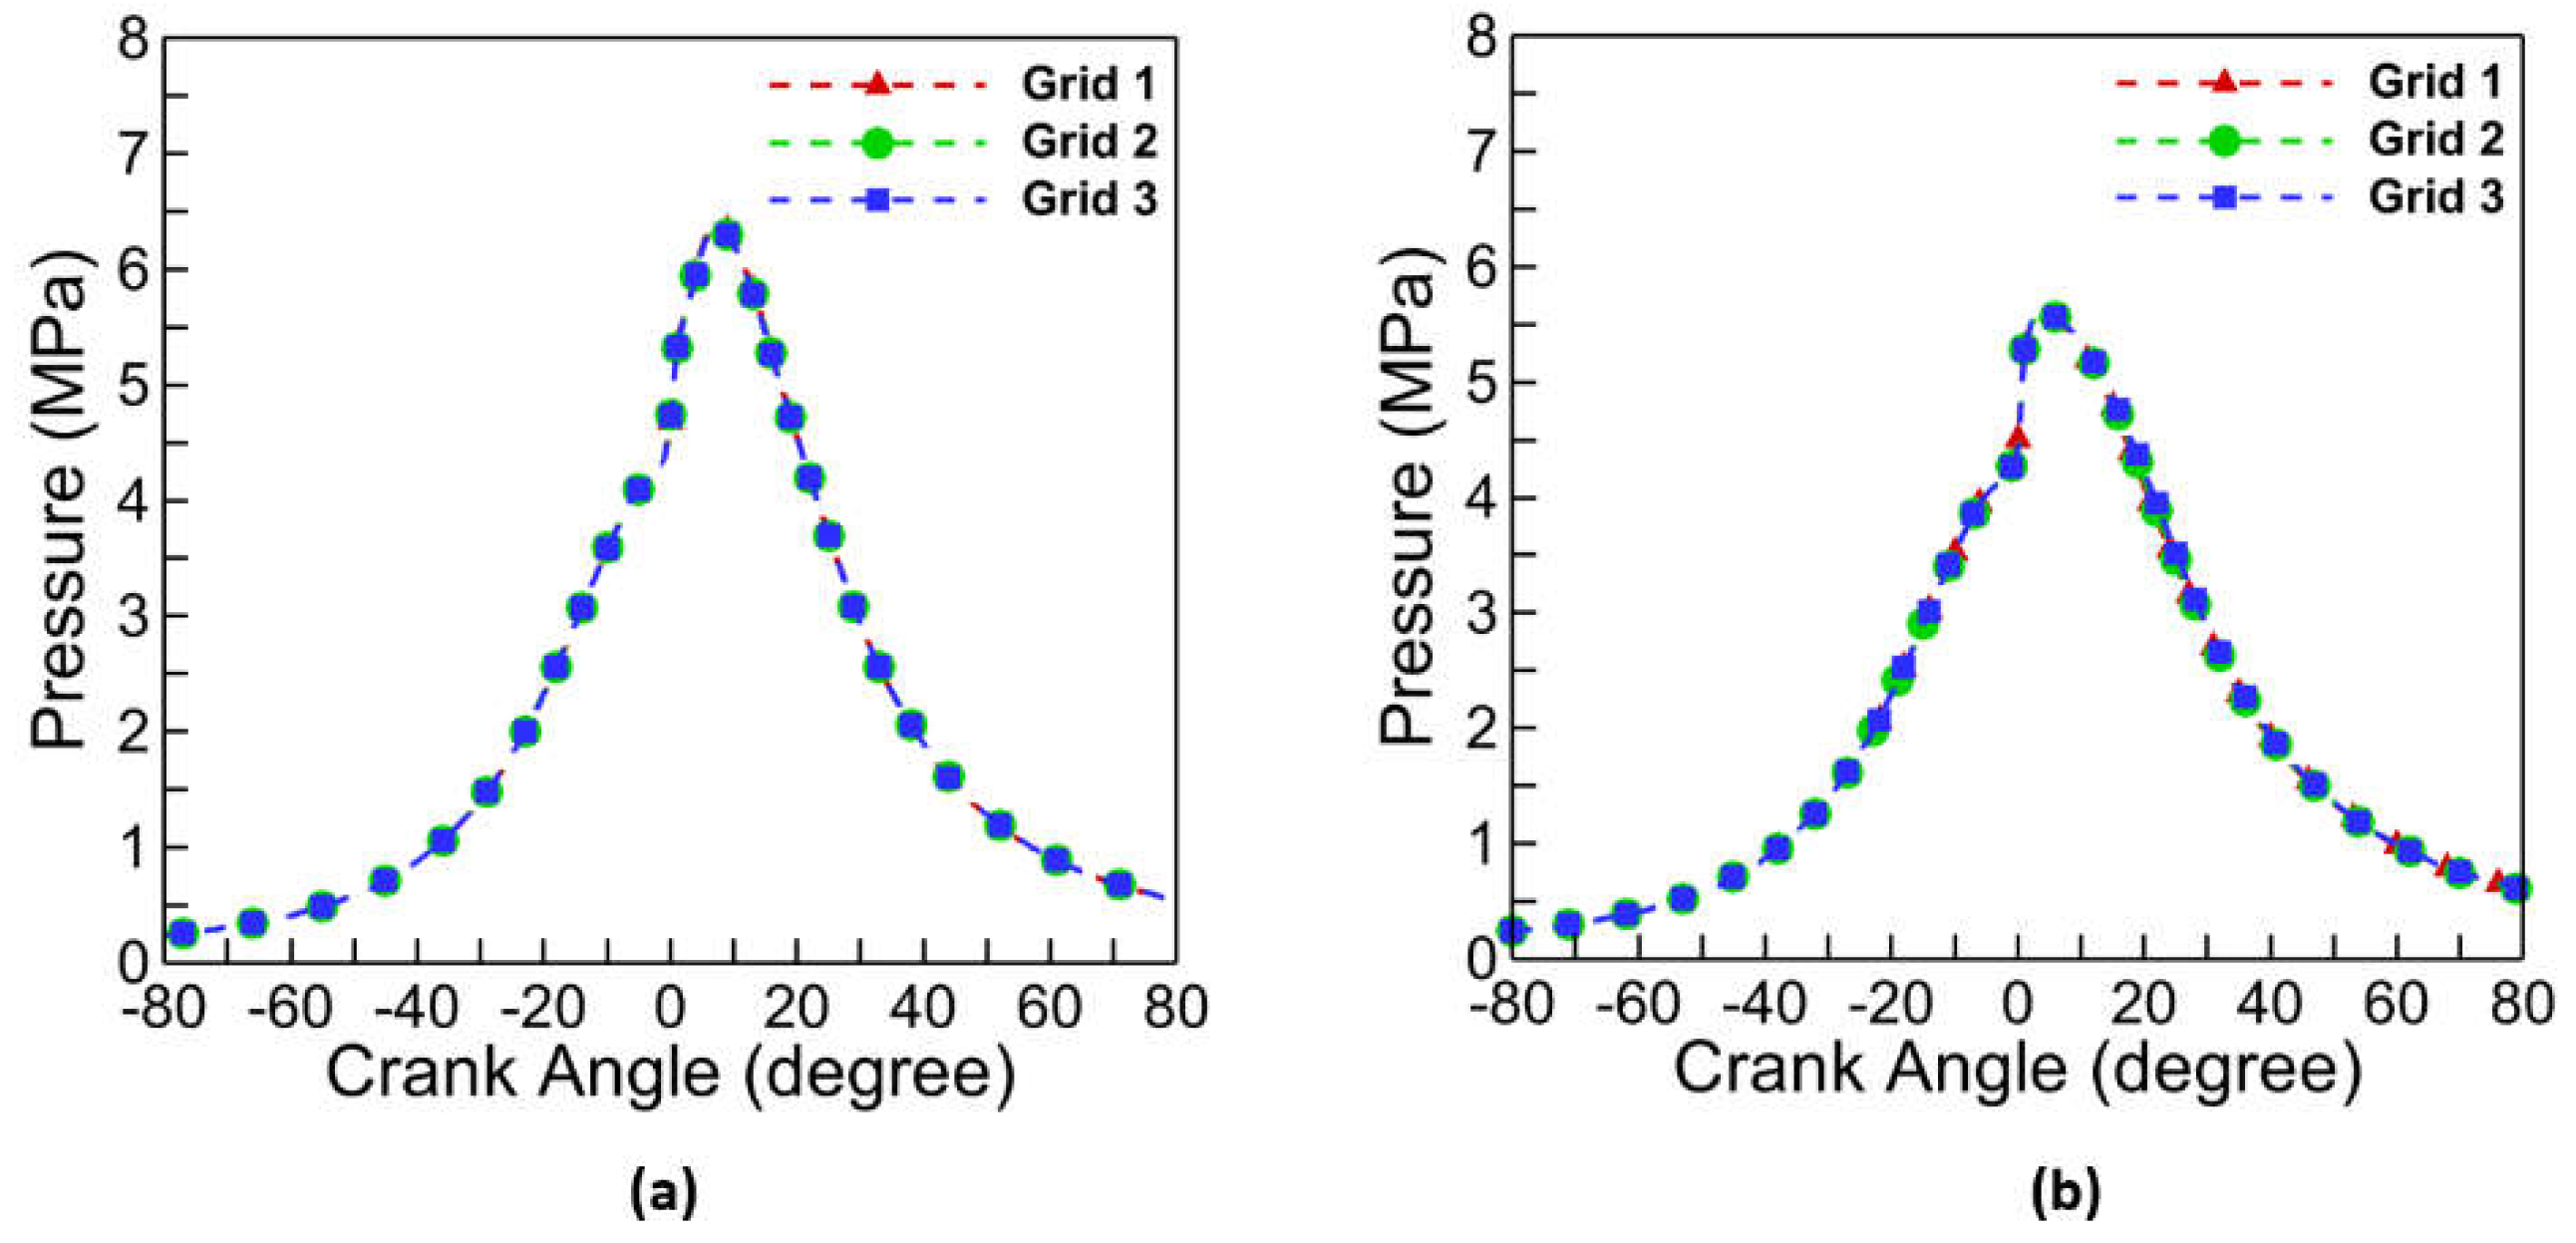
Figure 3.
Spray box model.
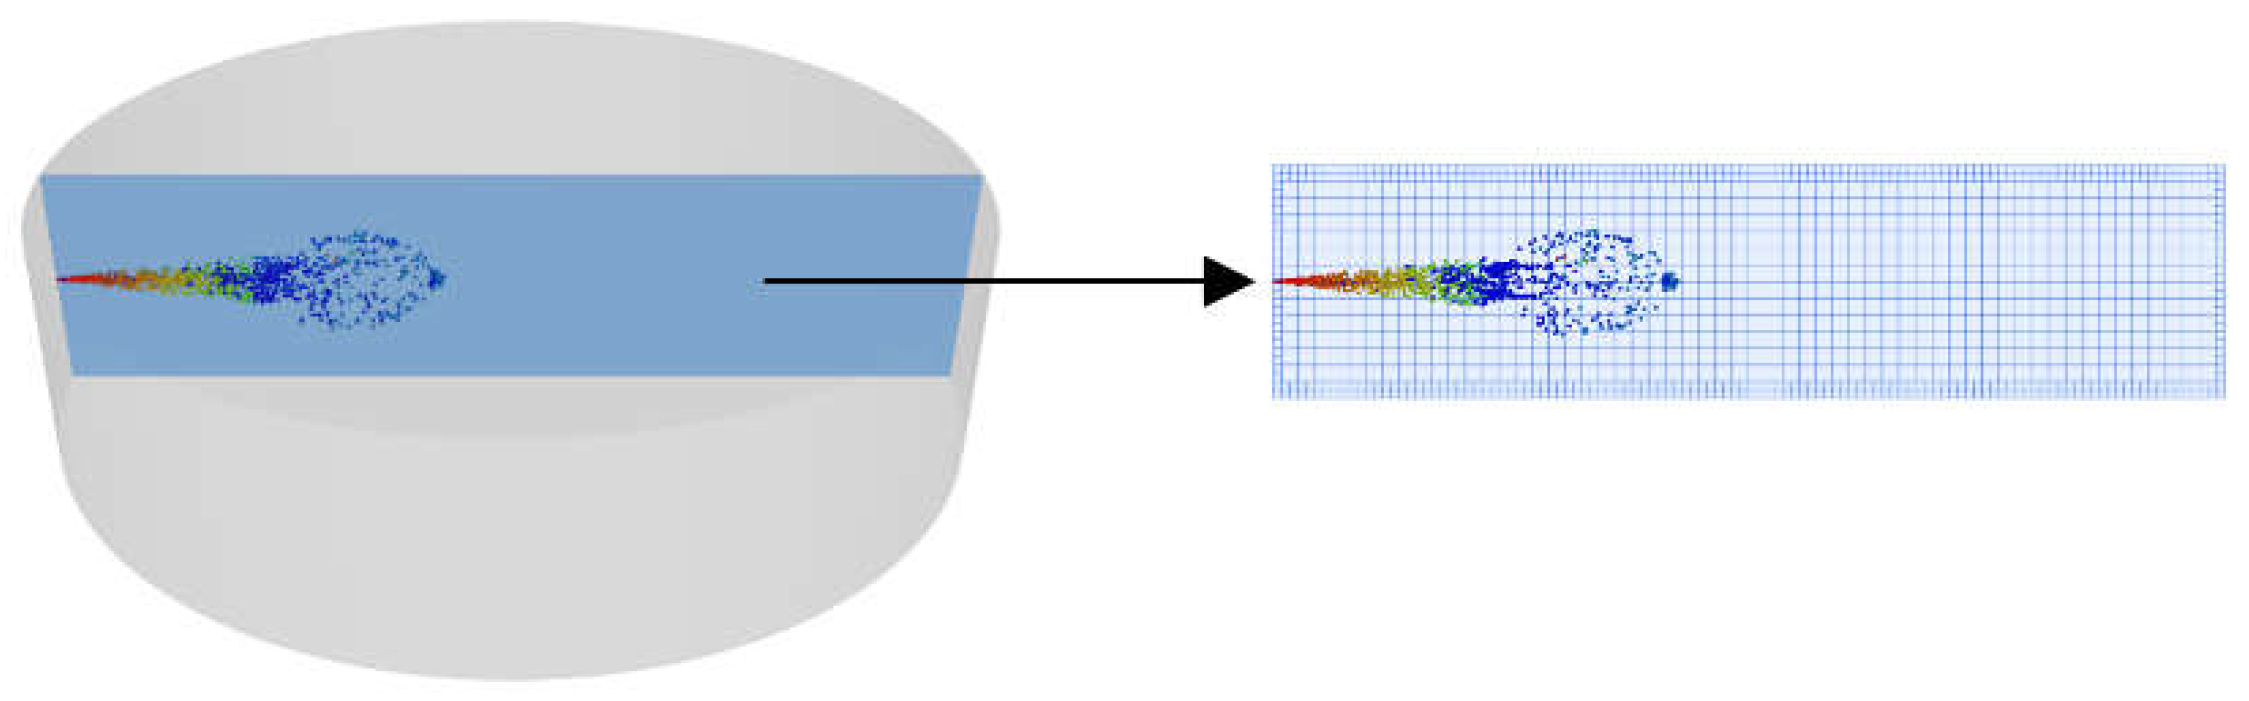
Figure 4.
Spray simulation results: (a) Fuel injection mass flow rates and total injected fuel mass values under baseline conditions; (b) Comparison of injection mass flow rates and velocity values at 126 MPa injection pressure. *Experimental data are obtained from Soruşbay et al. [40], **Simulation results under experimental conditions.
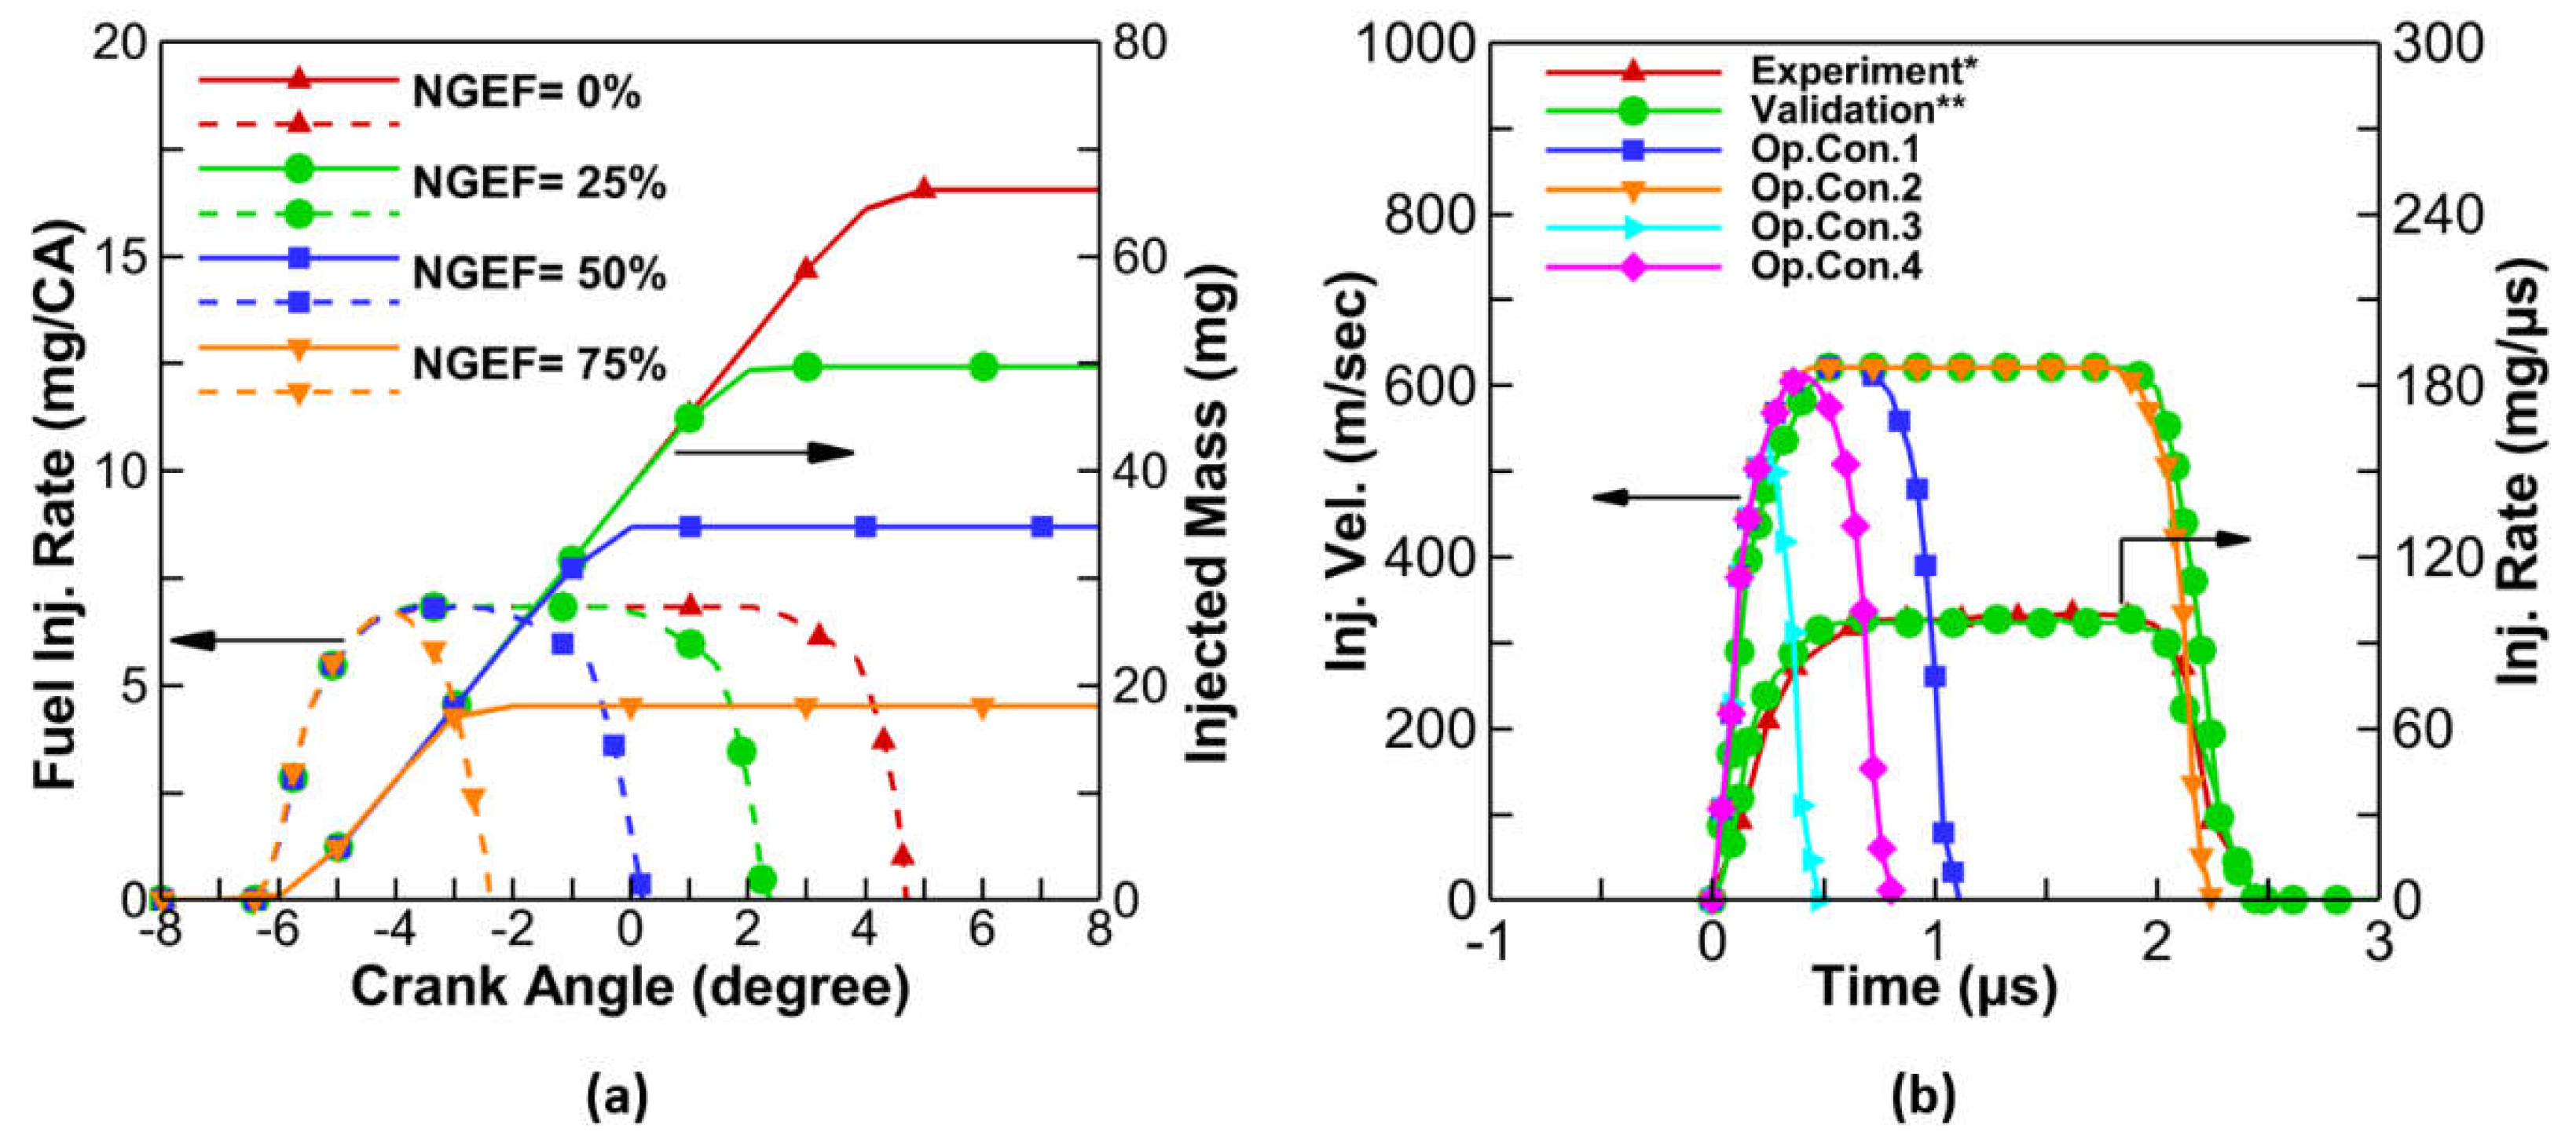
Figure 5.
Comparison of simulation results with experimental data [29]: (a) Cylinder pressure comparison; (b) Emission comparison.
Figure 5.
Comparison of simulation results with experimental data [29]: (a) Cylinder pressure comparison; (b) Emission comparison.
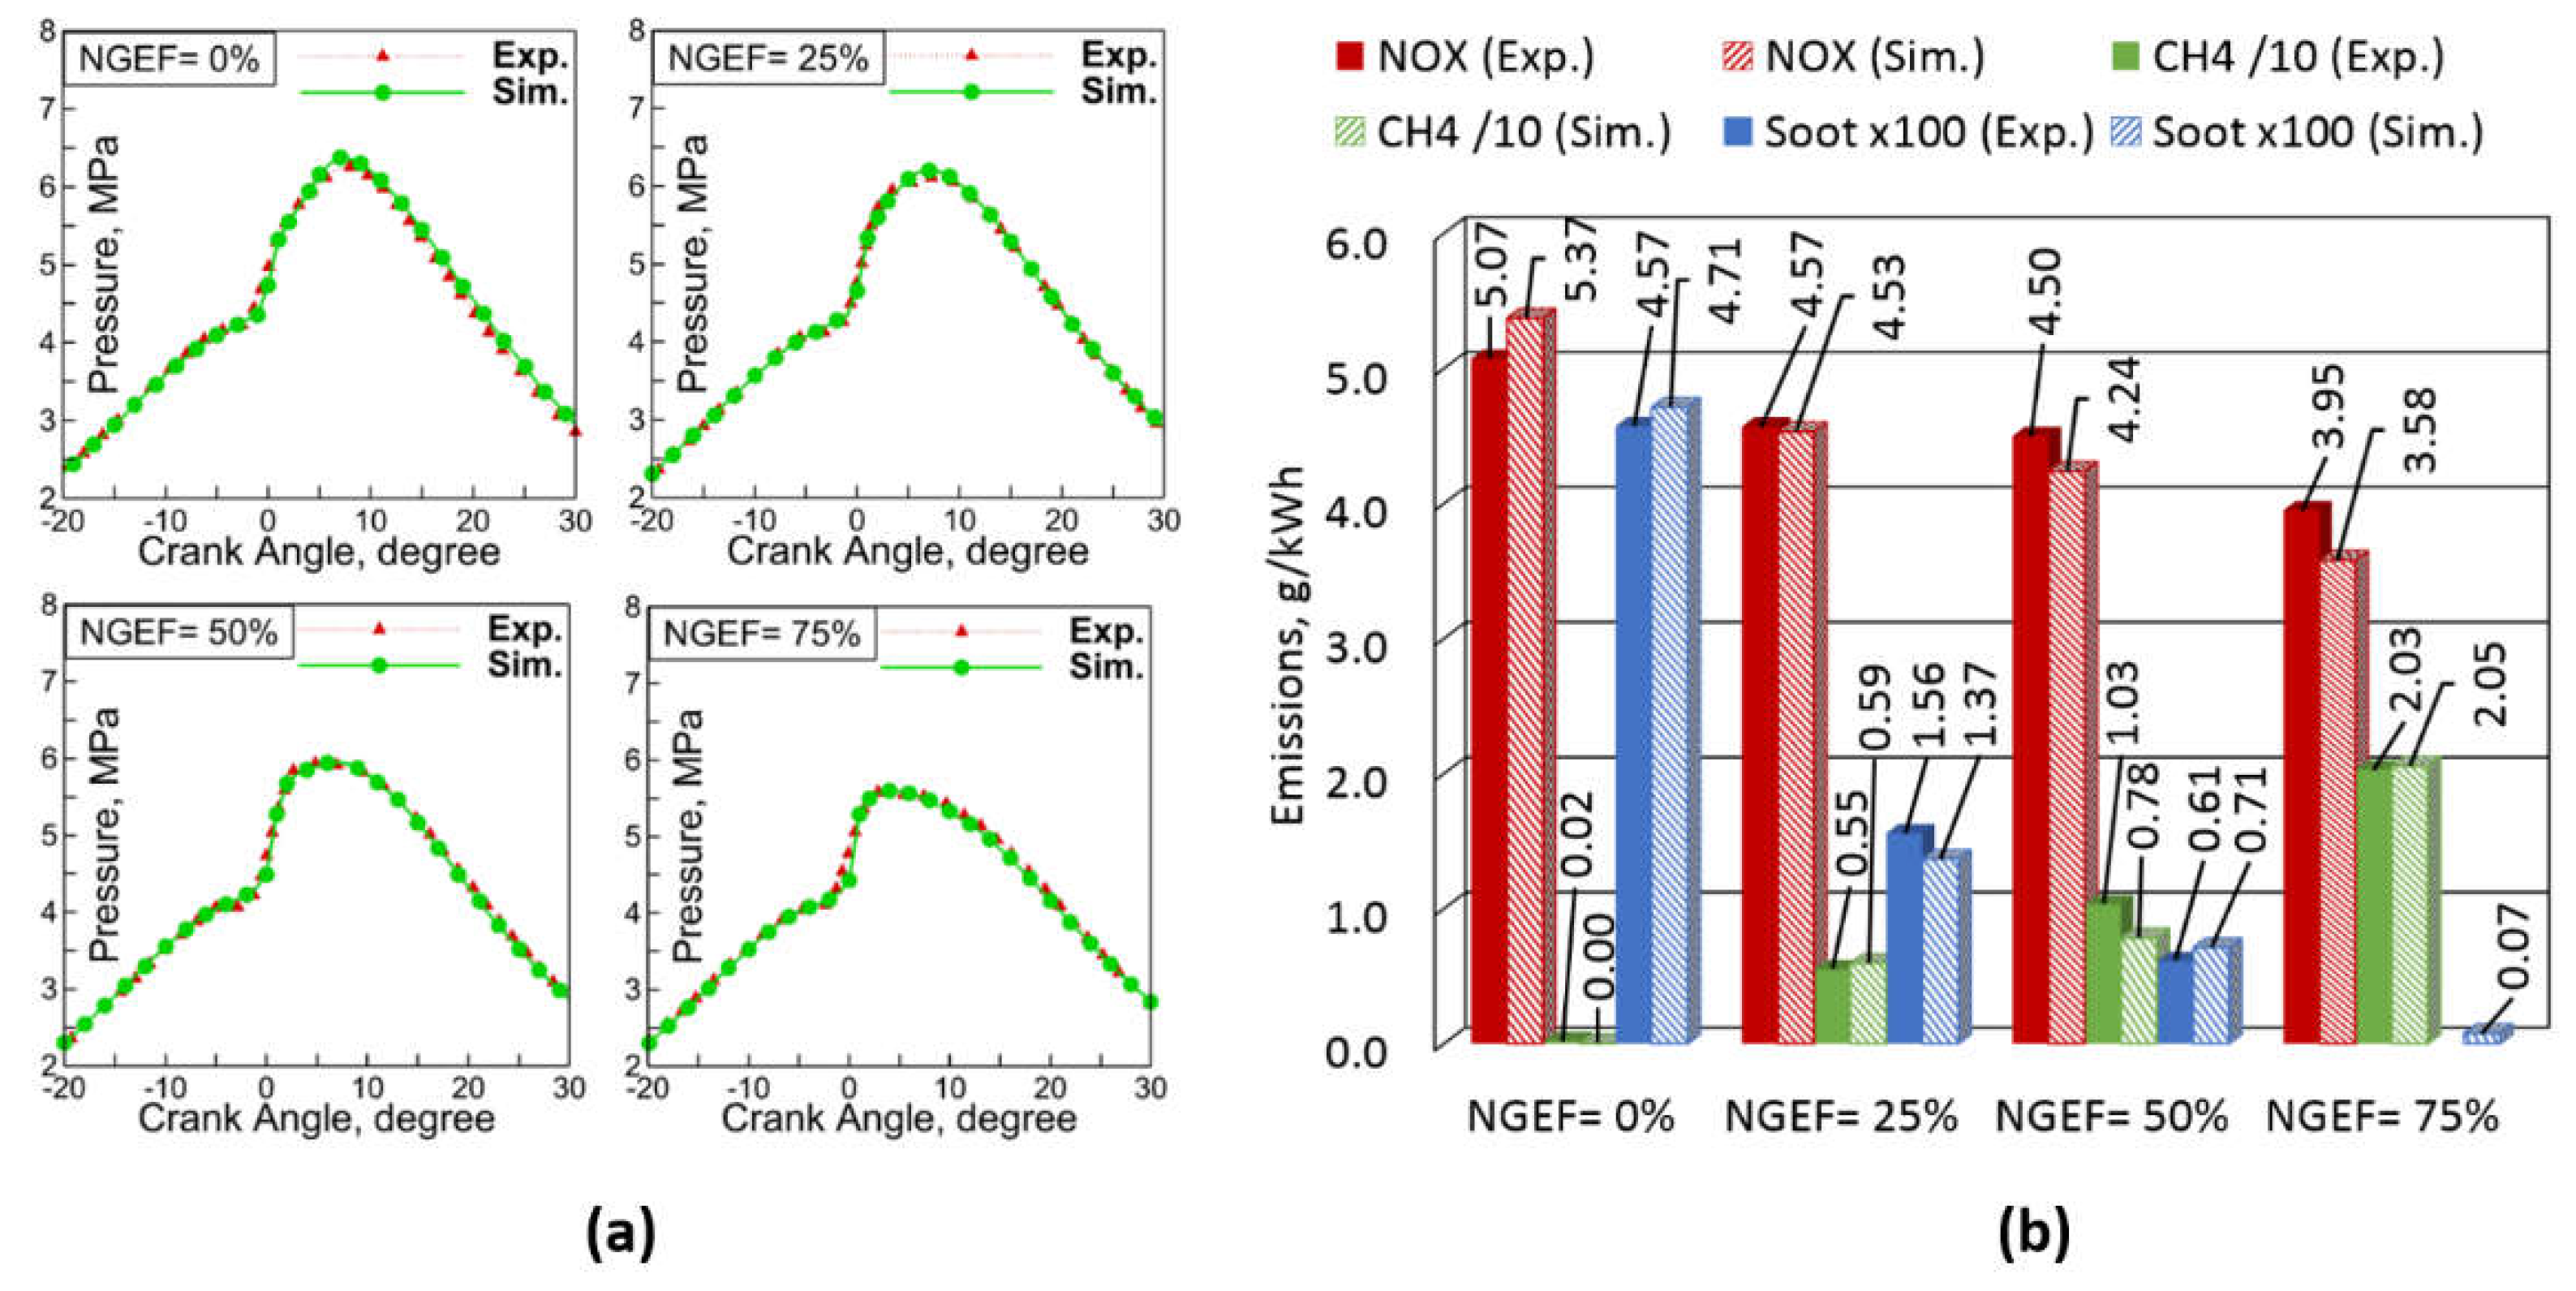
Figure 6.
Injection pressure effects: (a) Cylinder pressure and total heat release values at 0% NGEF; (b) Cylinder pressures and injection rates at 25% NGEF.
Figure 6.
Injection pressure effects: (a) Cylinder pressure and total heat release values at 0% NGEF; (b) Cylinder pressures and injection rates at 25% NGEF.
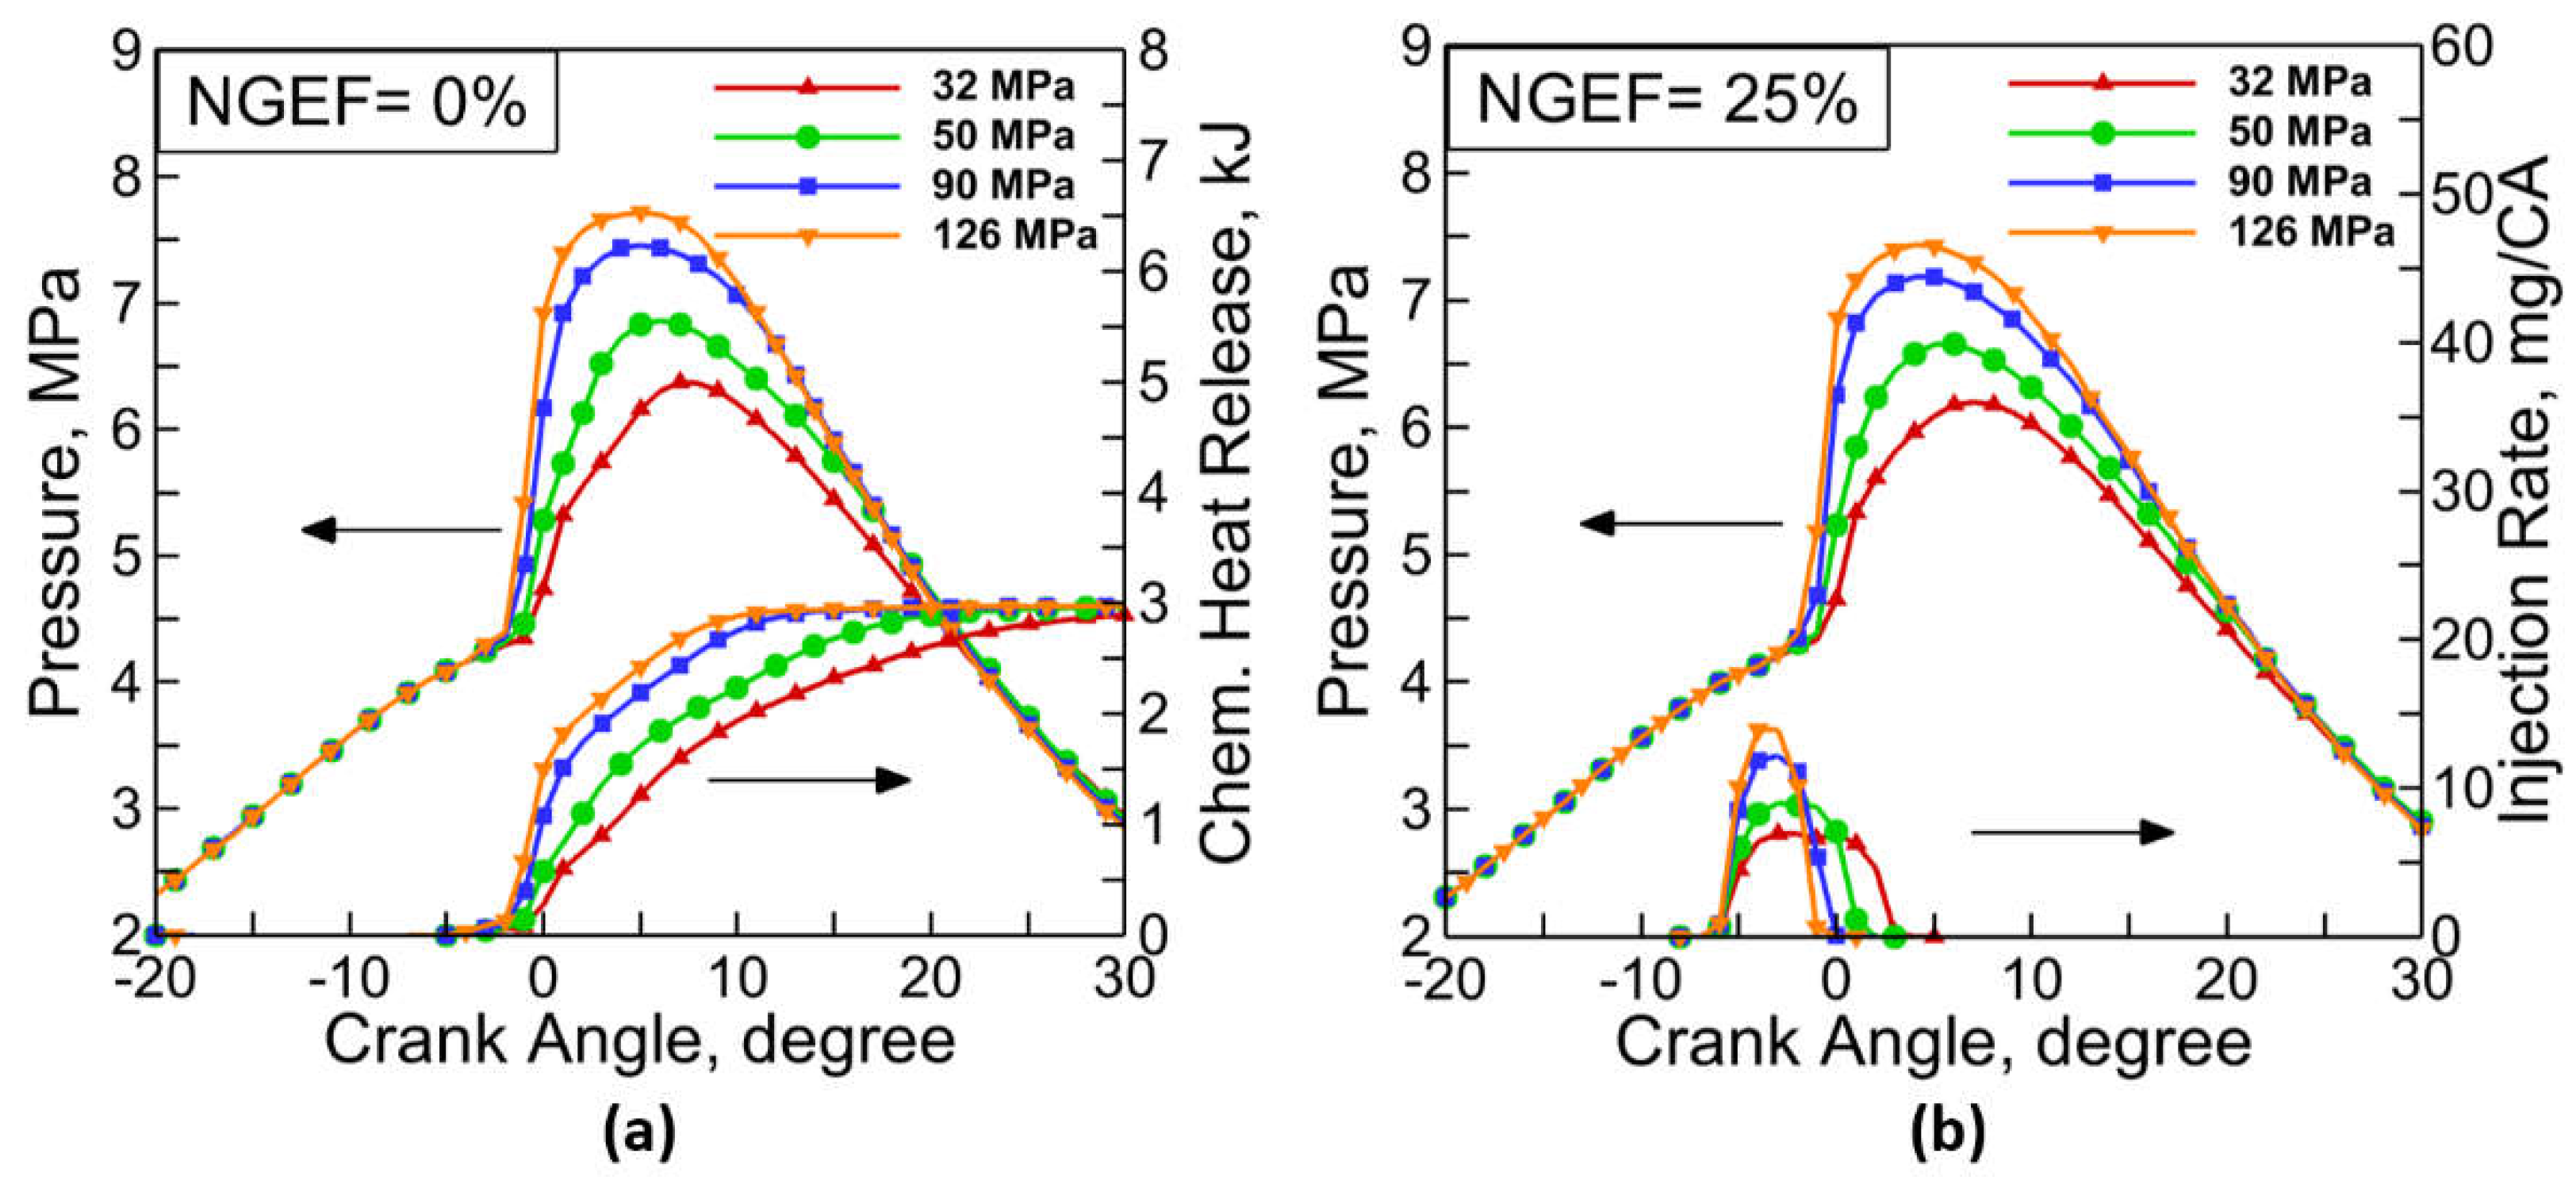
Figure 7.
CA50 and MPRR values under: (a) 0% NGEF and (c) 25% NGEF. MEP, NOX, and CH4 values under: (b) 0% NGEF and (d) 25% NGEF.
Figure 7.
CA50 and MPRR values under: (a) 0% NGEF and (c) 25% NGEF. MEP, NOX, and CH4 values under: (b) 0% NGEF and (d) 25% NGEF.
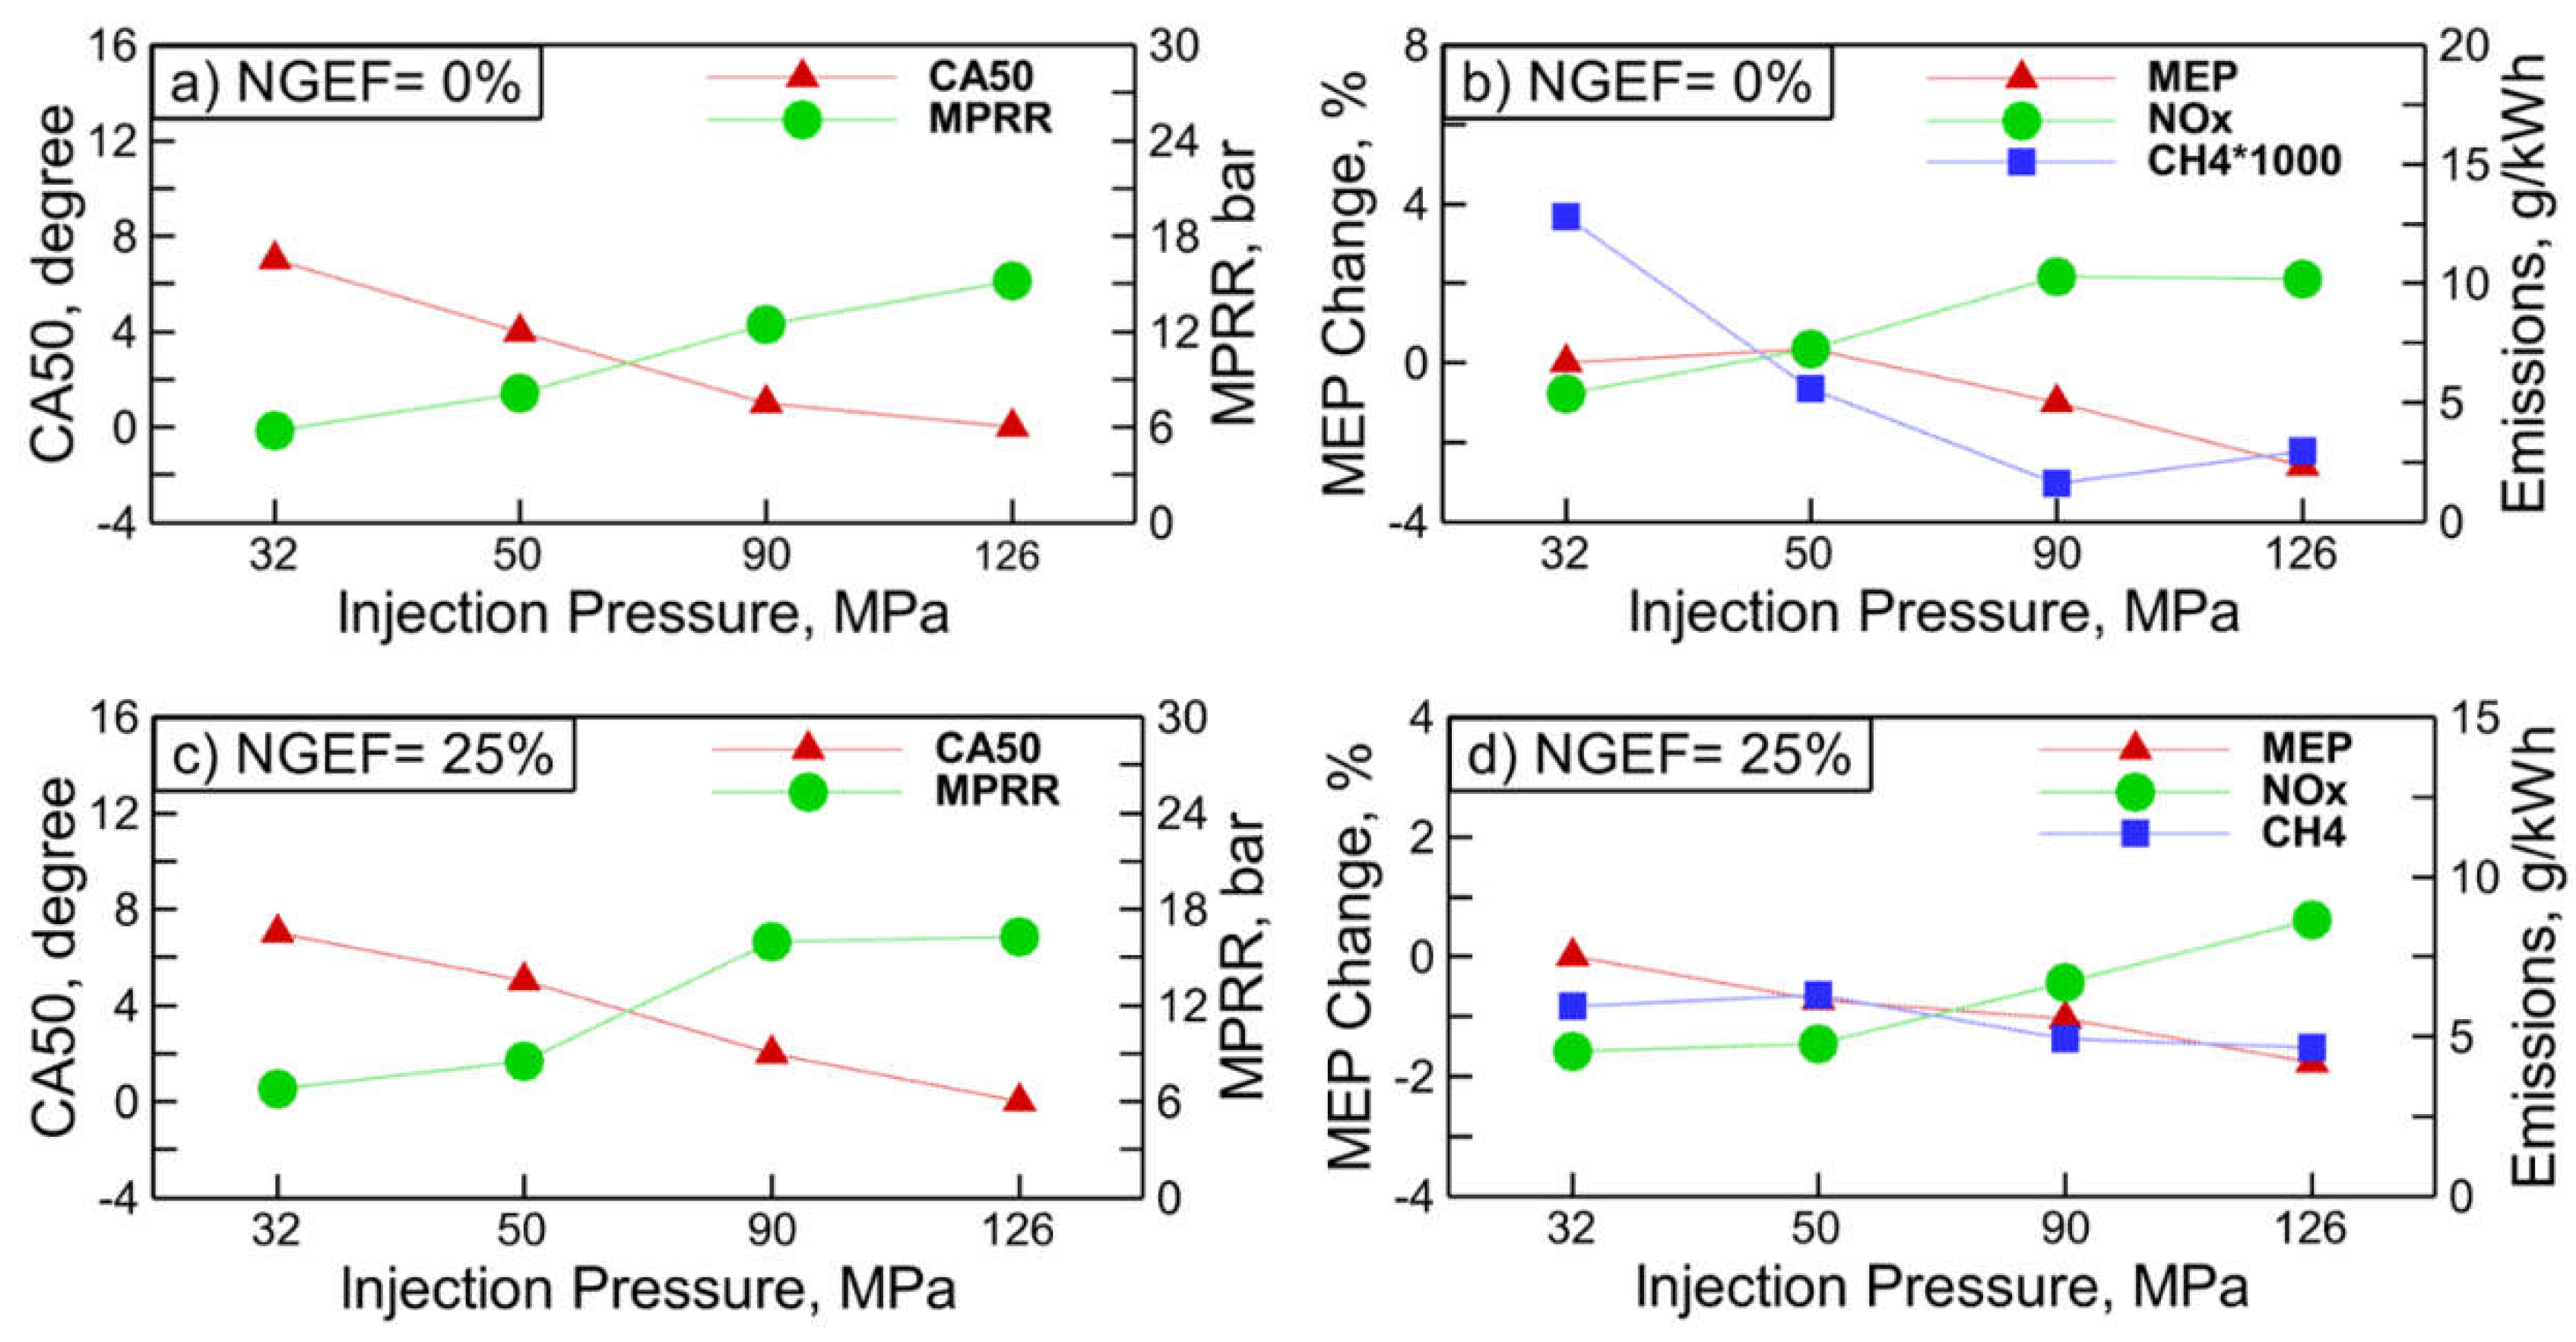
Figure 8.
Cylinder pressures and injection rates under: (a) 50% NGEF and (b) 75% NGEF.
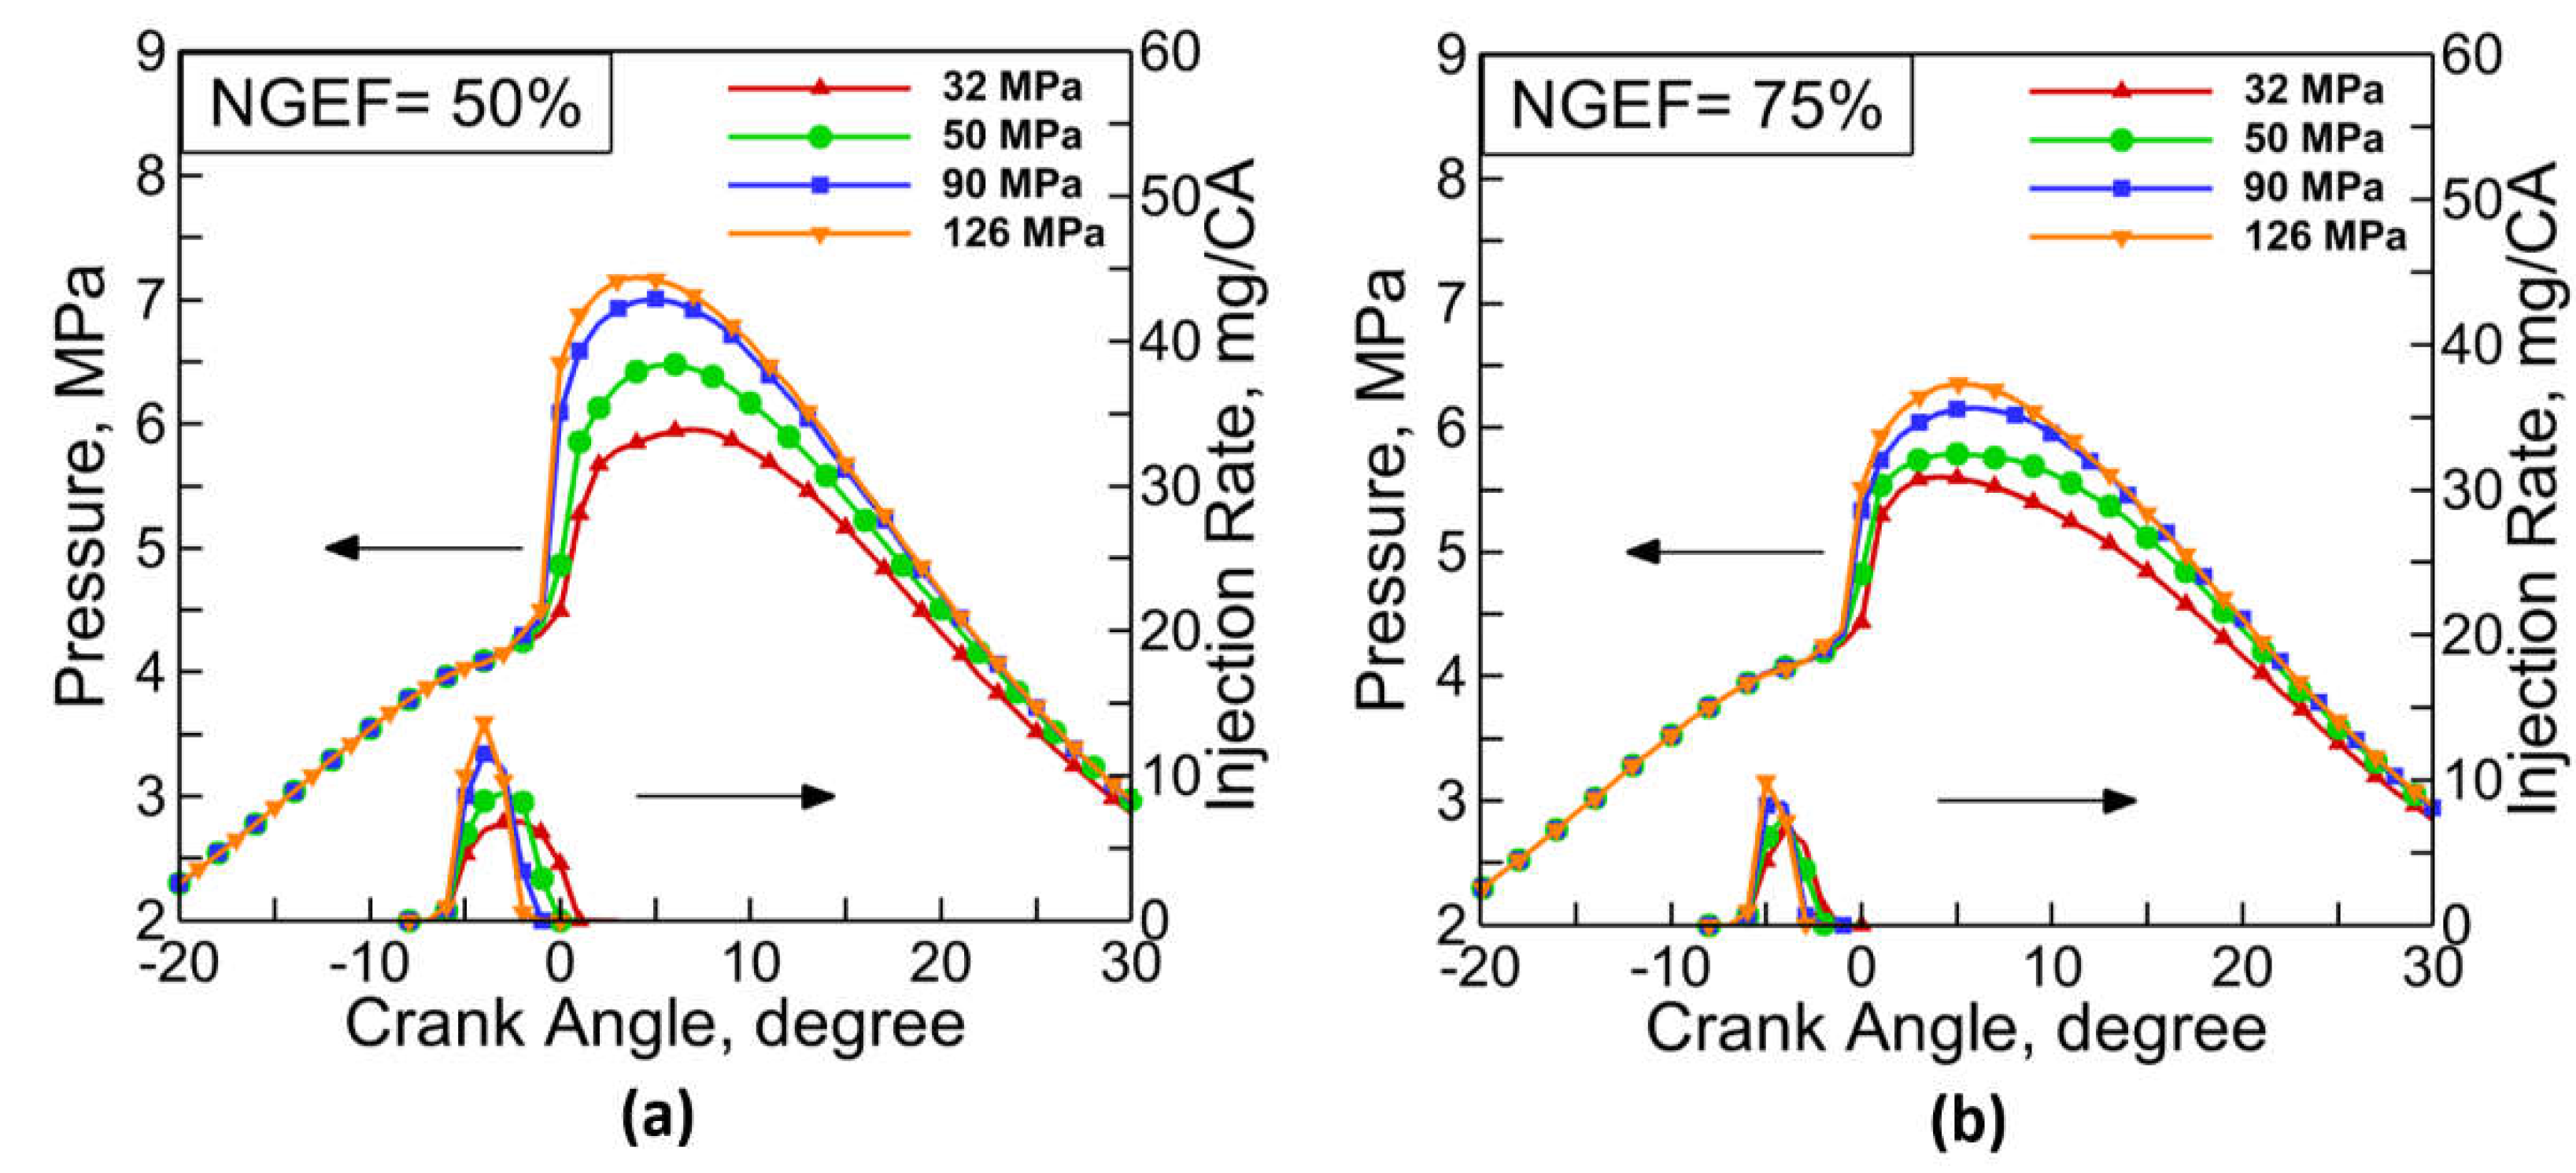
Figure 9.
CA50 and MPRR values under: (a) 50% NGEF and (c) 75% NGEF. MEP, NOX, and CH4 values under: (b) 50% NGEF and (d) 75% NGEF.
Figure 9.
CA50 and MPRR values under: (a) 50% NGEF and (c) 75% NGEF. MEP, NOX, and CH4 values under: (b) 50% NGEF and (d) 75% NGEF.
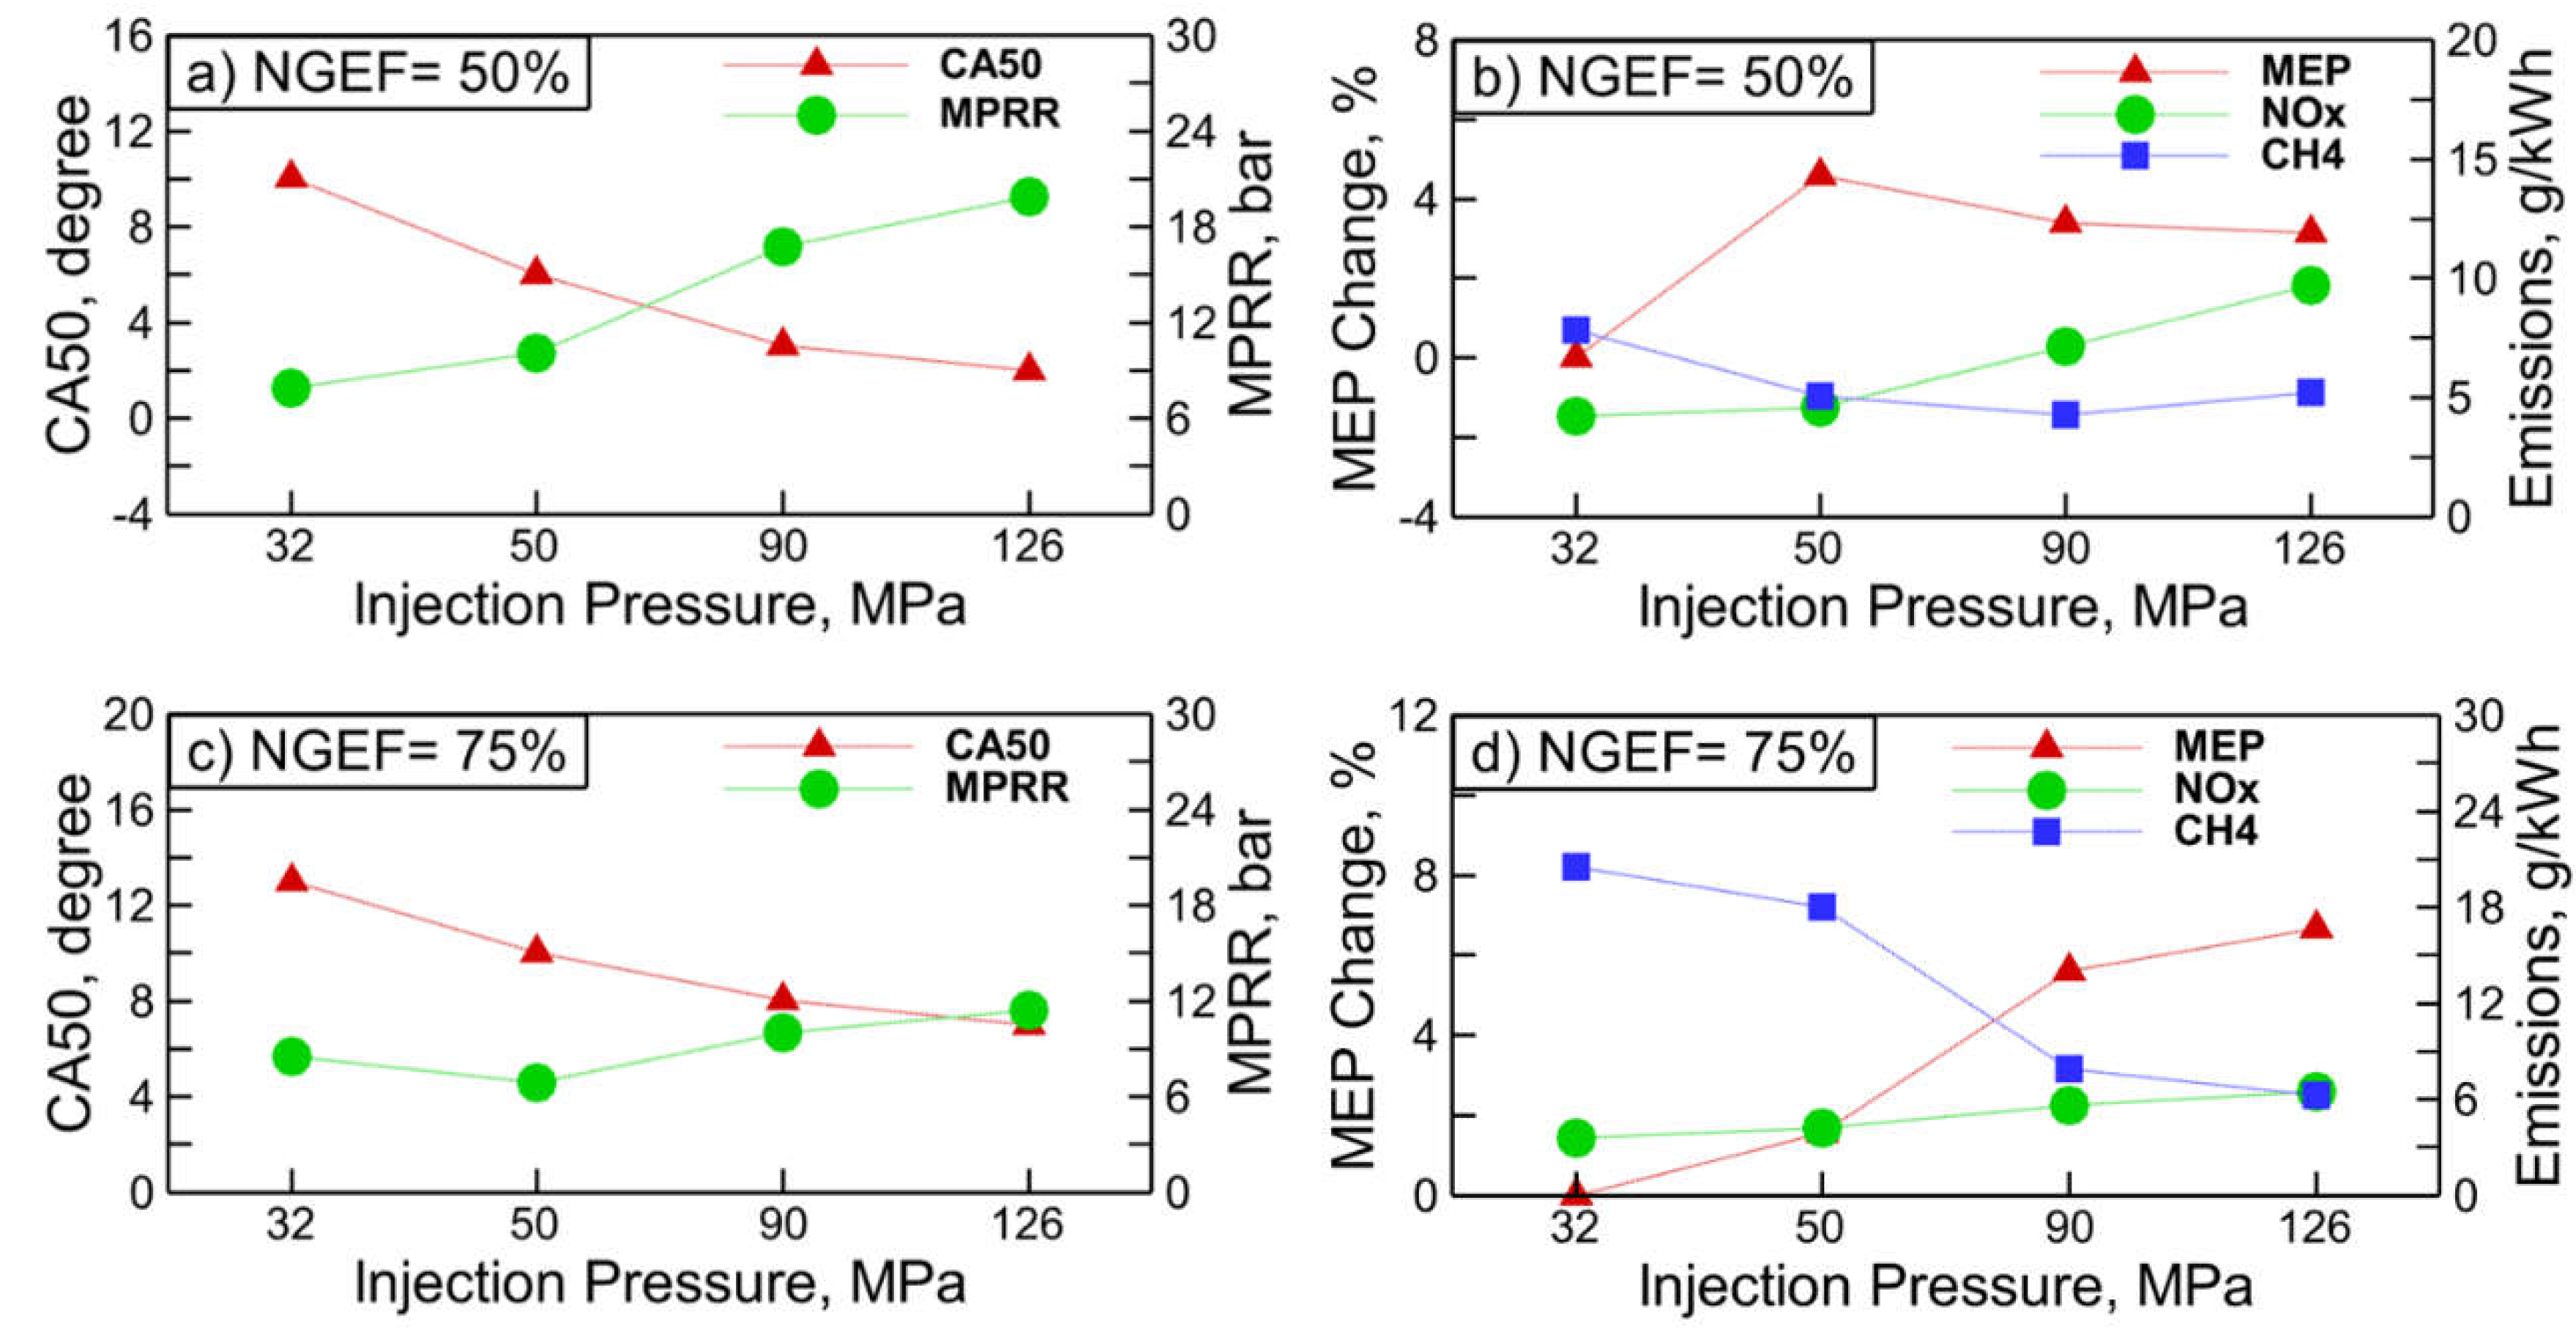
Figure 10.
NHD effects at 0% NGEF: (a) Cylinder pressures and HRR values at 32 MPa injection pressure; (b) Cylinder pressures and injection rates at 126 MPa injection pressure.
Figure 10.
NHD effects at 0% NGEF: (a) Cylinder pressures and HRR values at 32 MPa injection pressure; (b) Cylinder pressures and injection rates at 126 MPa injection pressure.
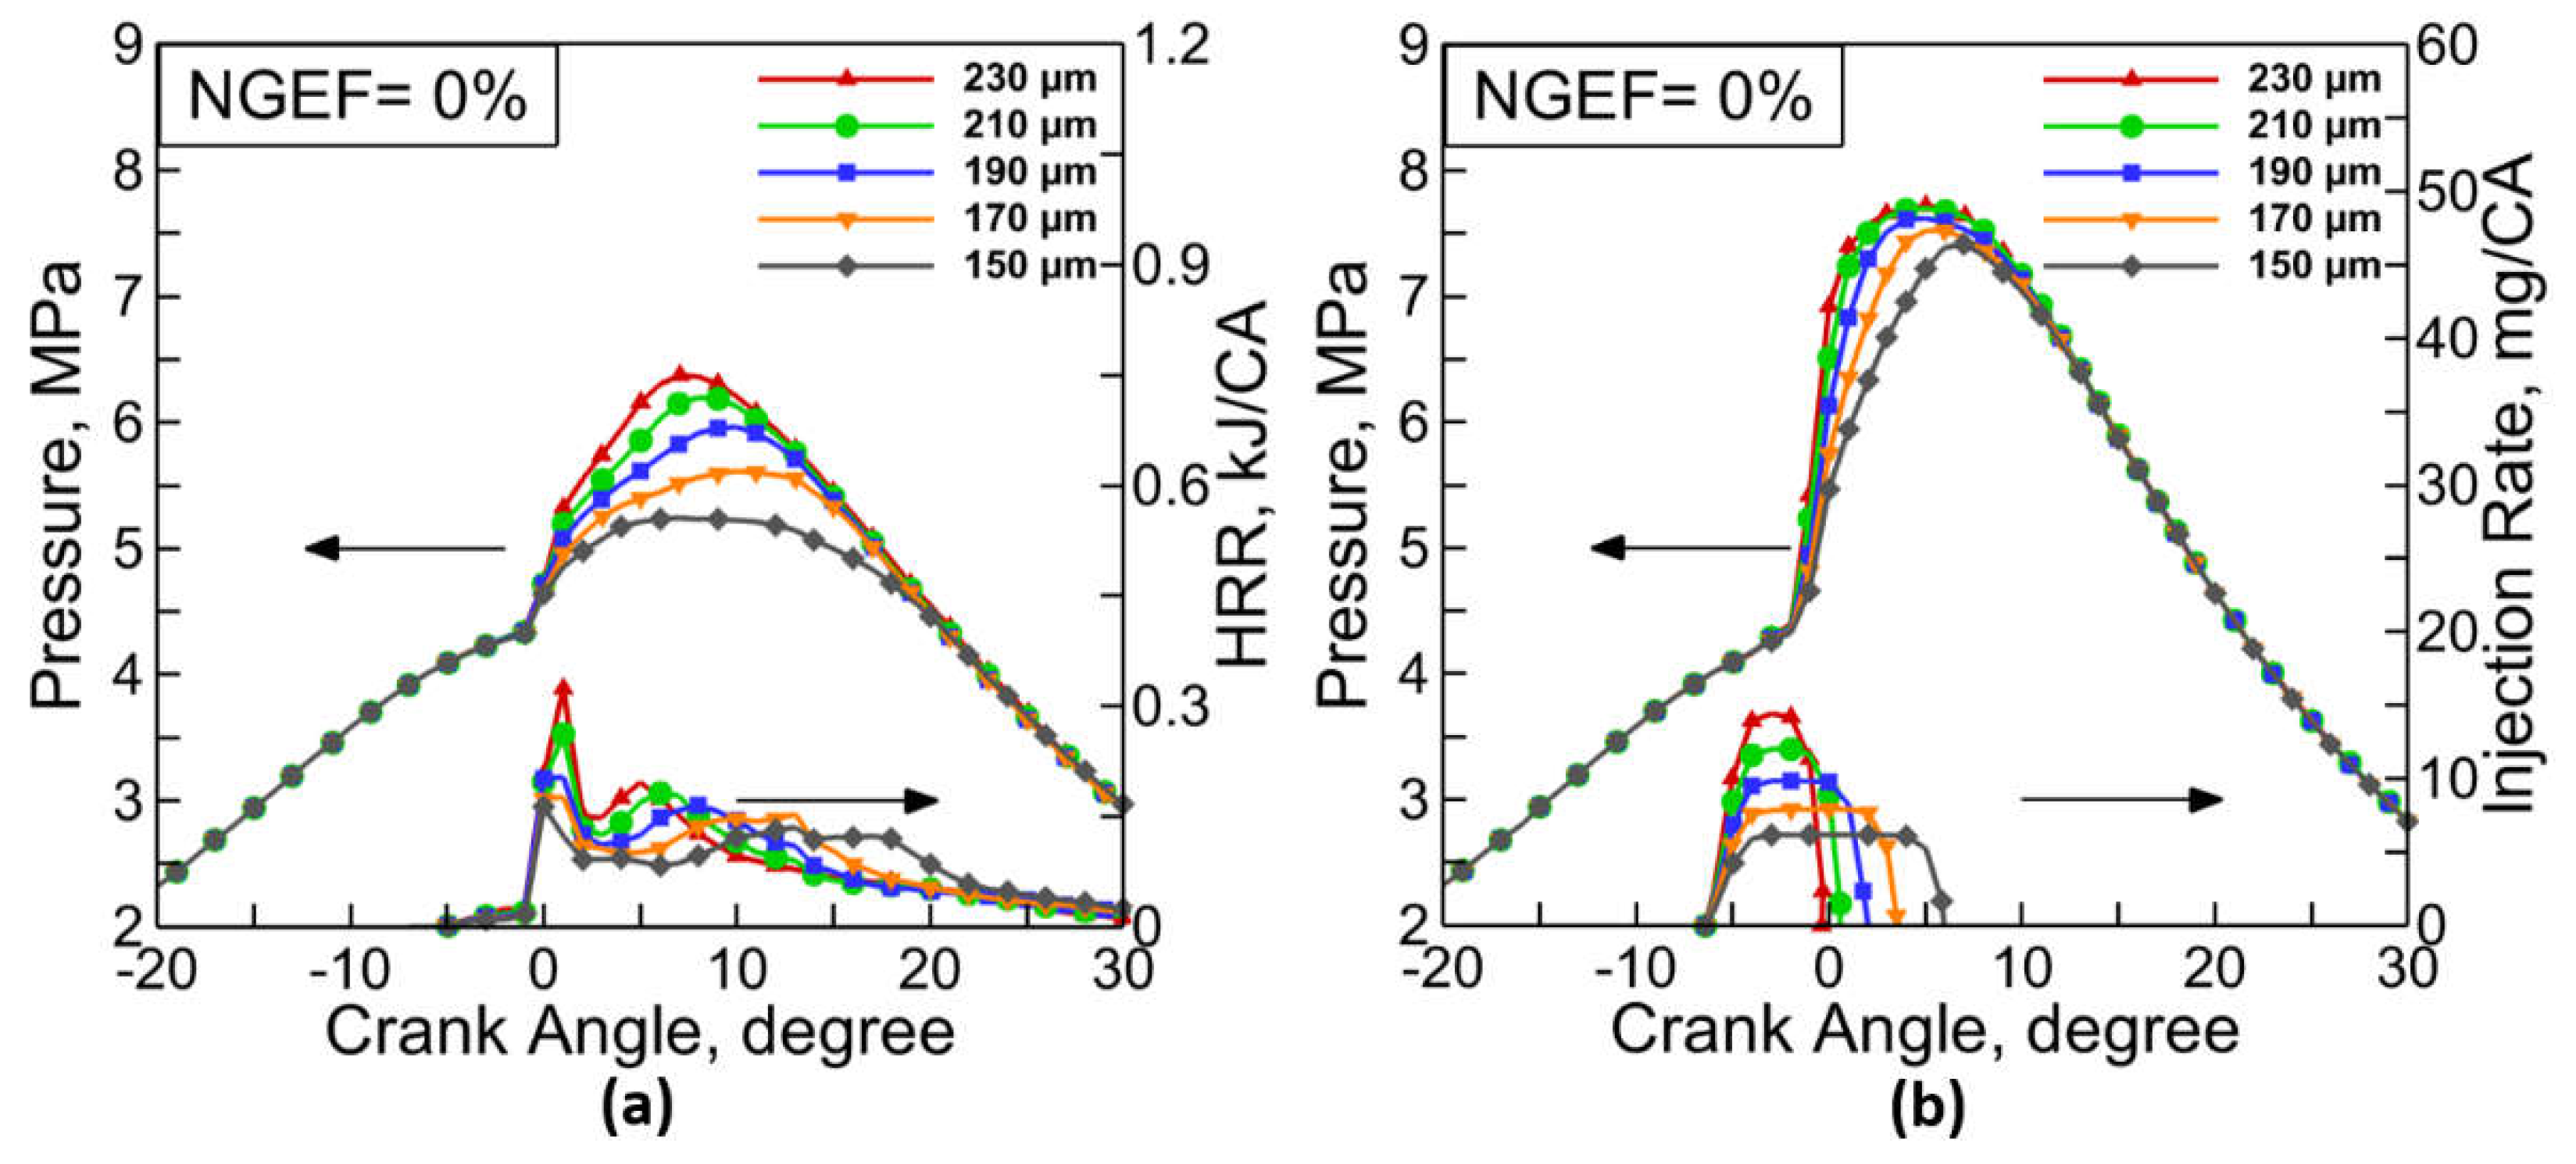
Figure 11.
Under 0% NGEF conditions: (a) CA50; (b) MEP; (c) MPRR; (d) NOX; and (e) Soot values.
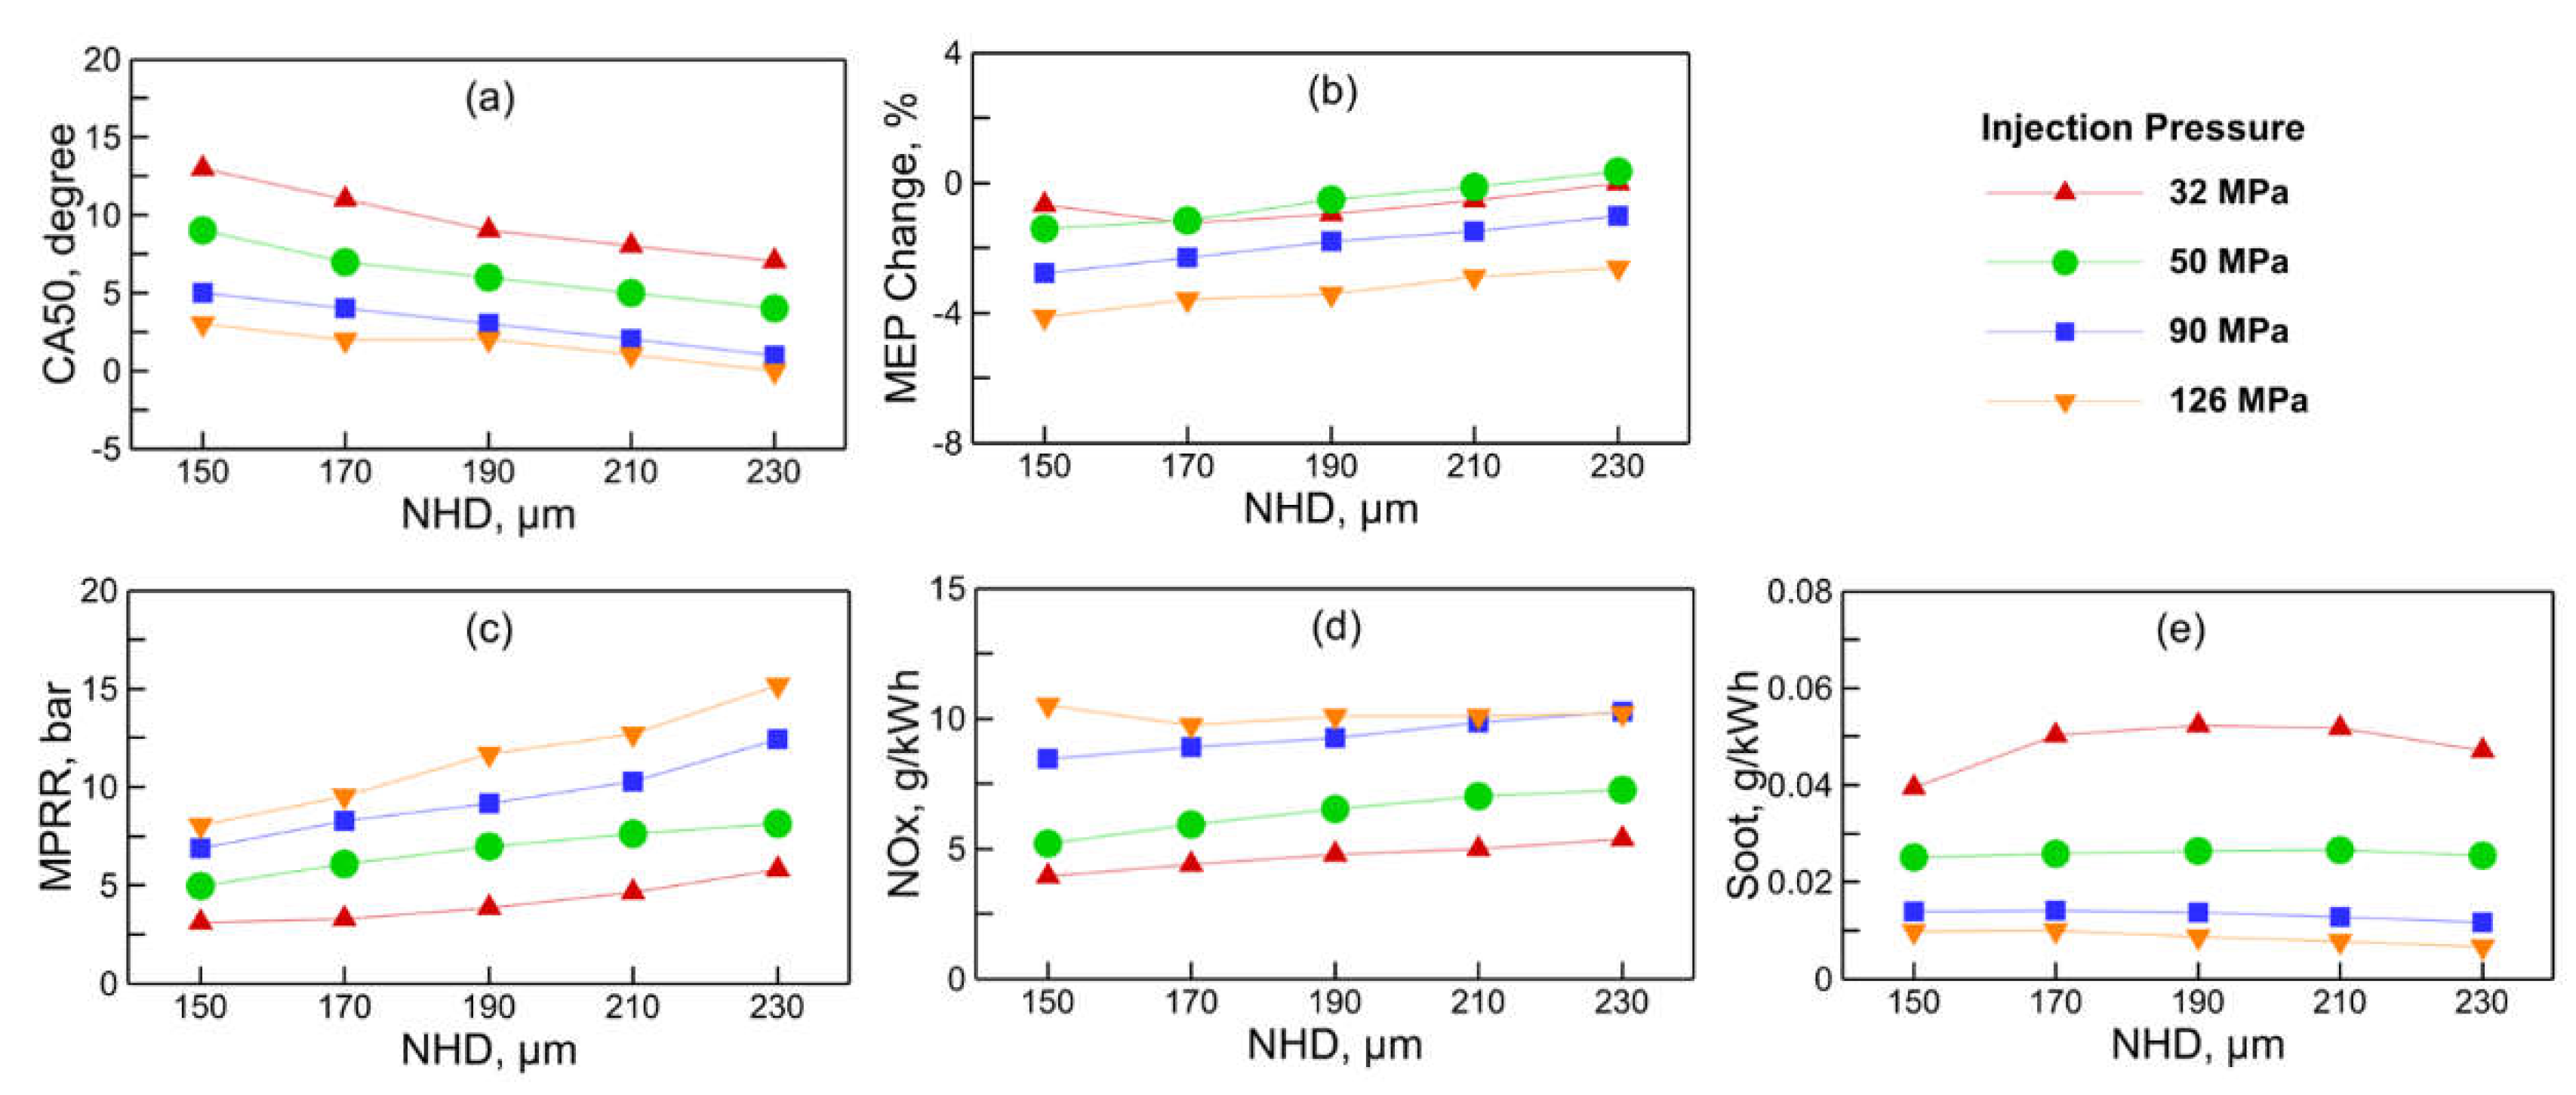
Figure 12.
Cylinder pressures and injection rates under 50% NGEF conditions with injection pressures of: (a) 32 MPa; (b) 126 MPa.
Figure 12.
Cylinder pressures and injection rates under 50% NGEF conditions with injection pressures of: (a) 32 MPa; (b) 126 MPa.
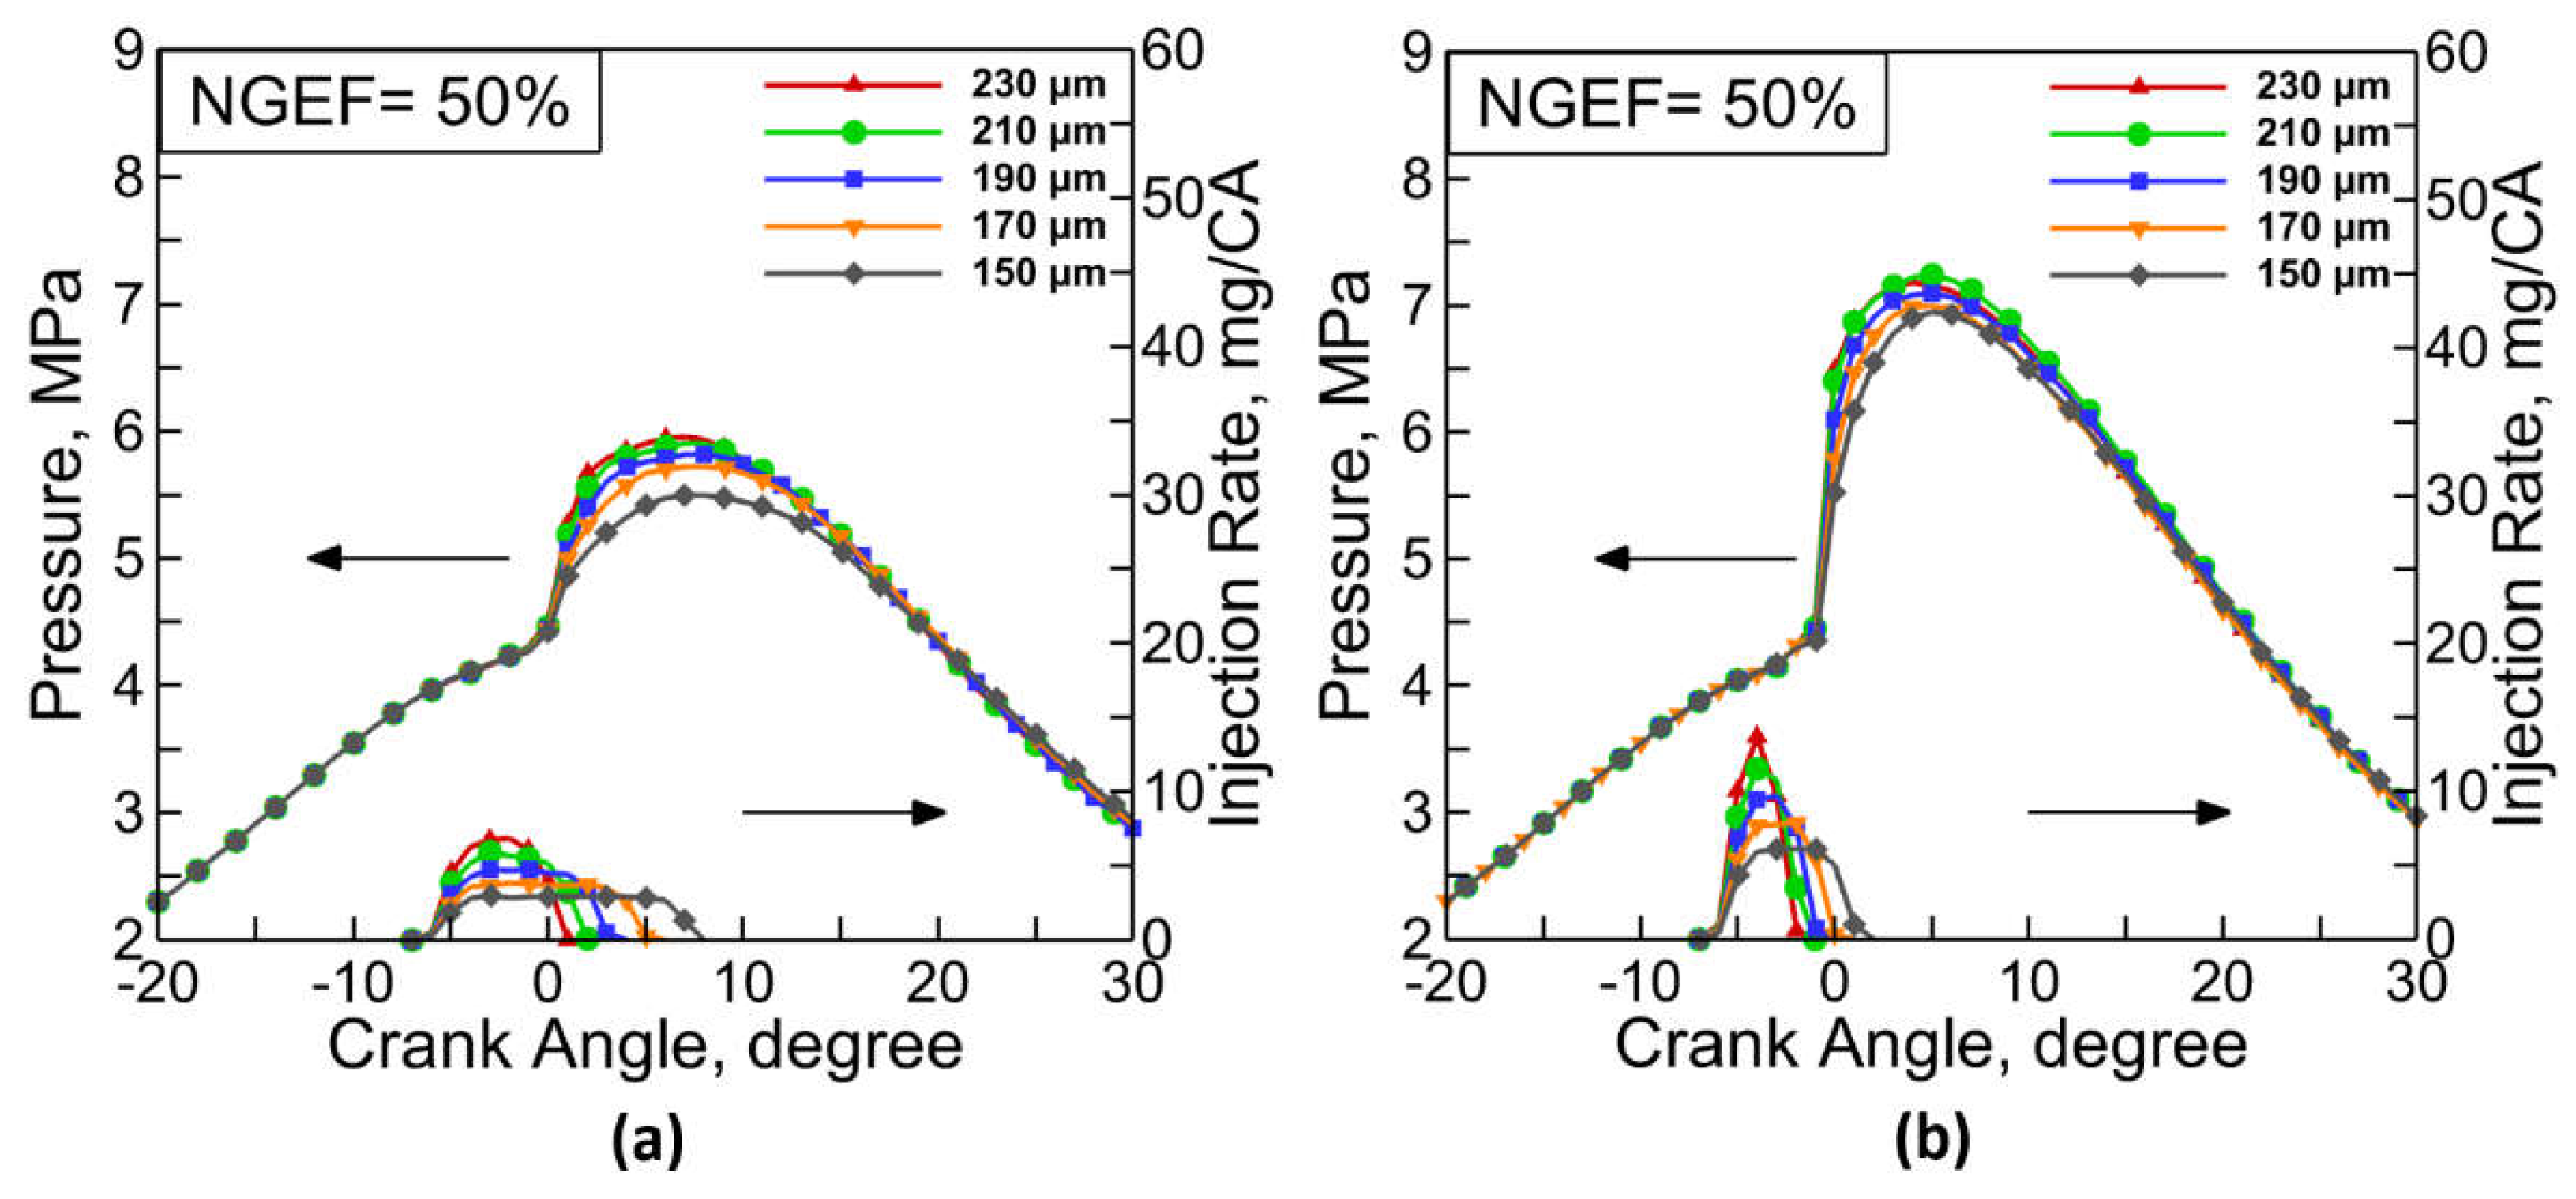
Figure 13.
Under 50% NGEF conditions: (a) CA50; (b) MEP; (c) MPRR; (d) NOX; and (e) CH4 values.
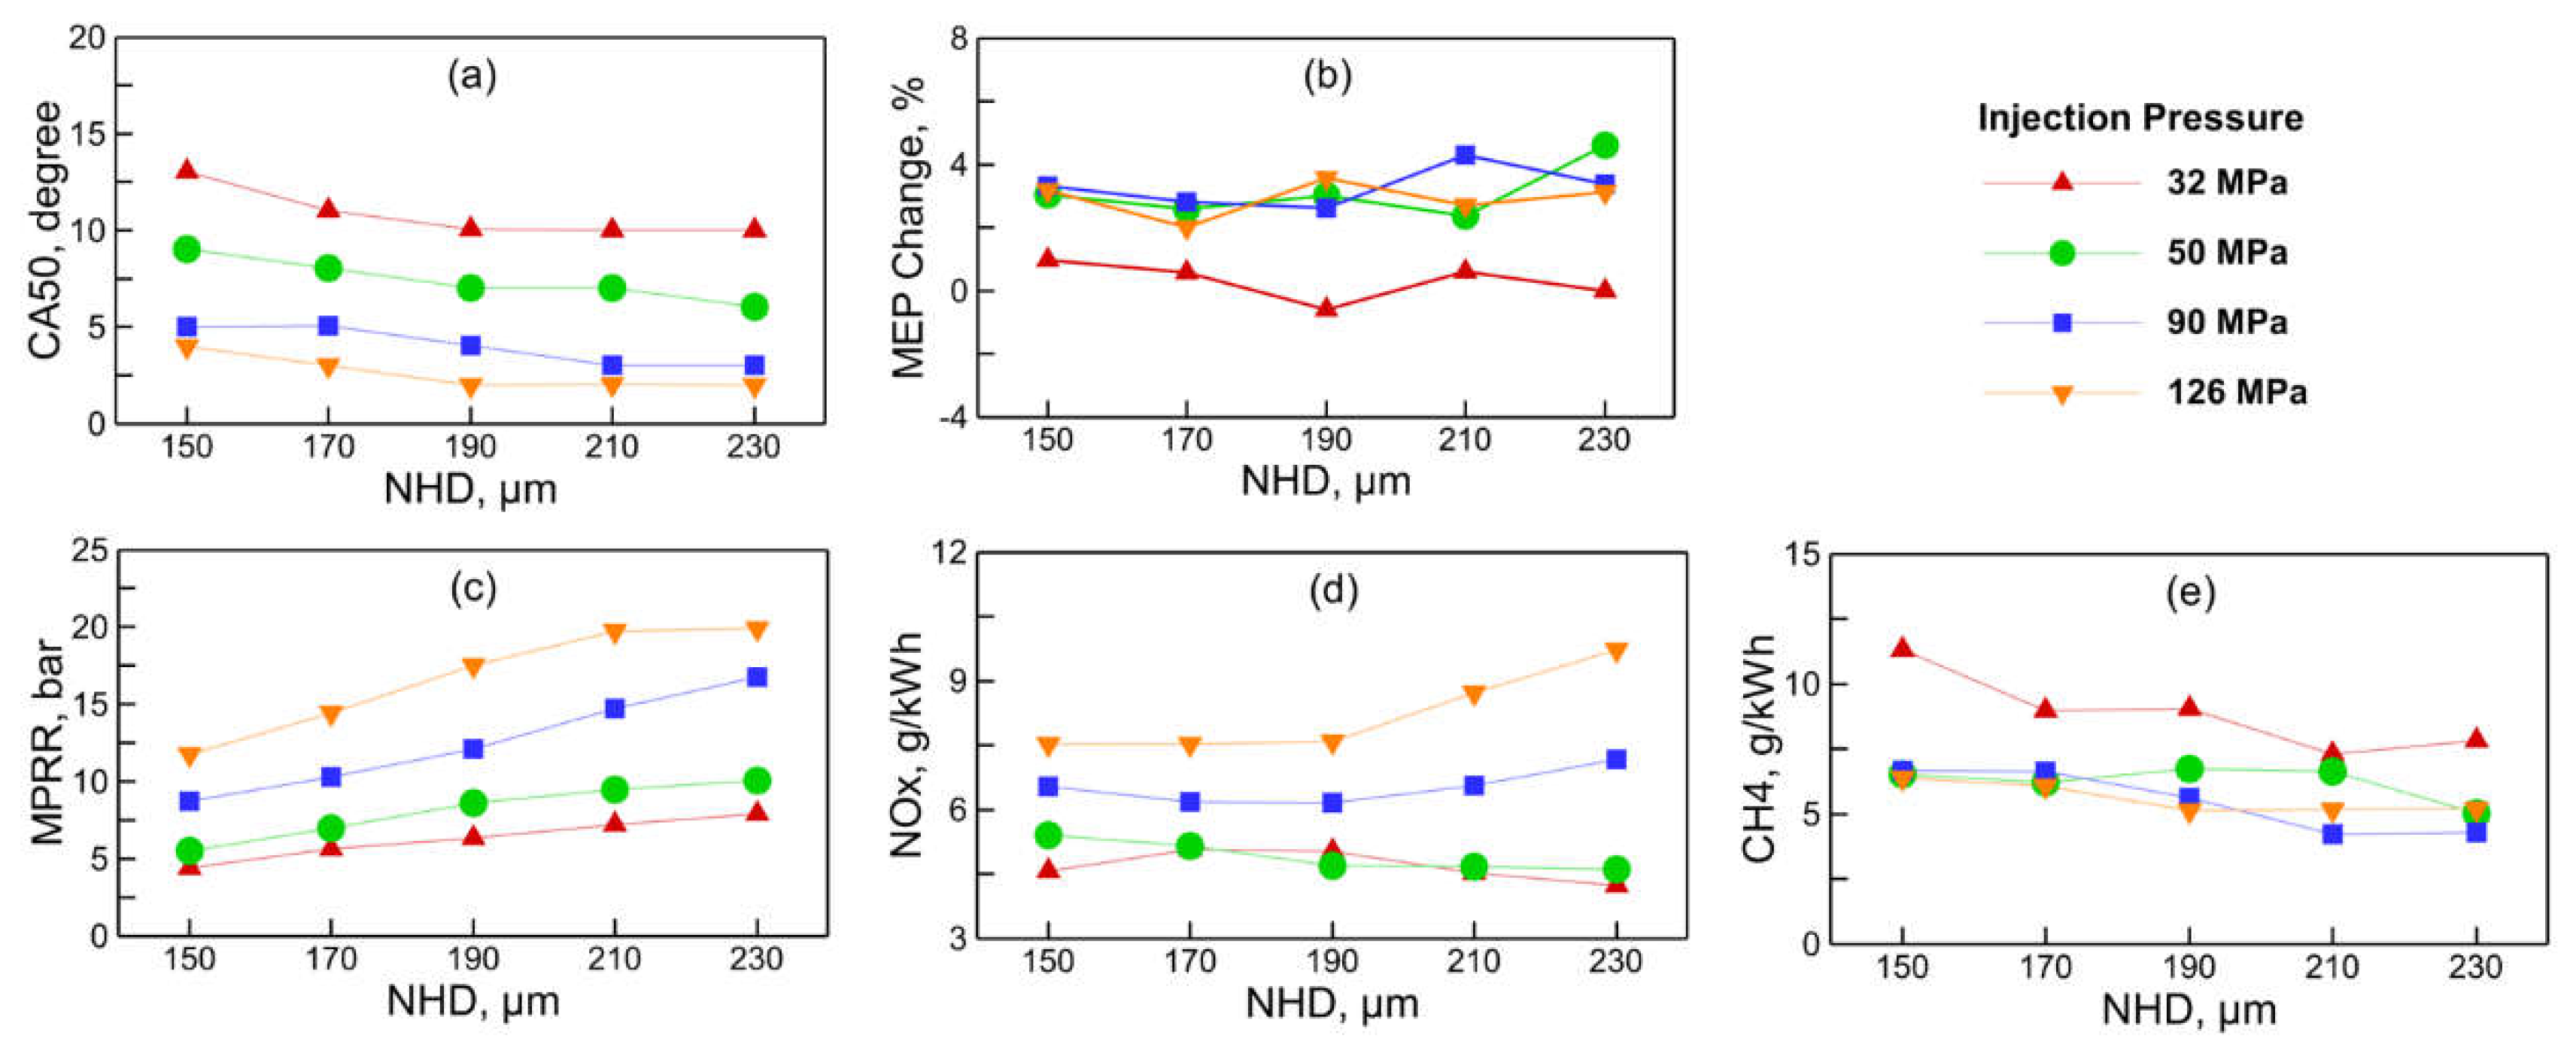
Figure 14.
Cylinder pressures and injection rates under 75% NGEF conditions with injection pressures of: (a) 32 MPa; (b) 126 MPa.
Figure 14.
Cylinder pressures and injection rates under 75% NGEF conditions with injection pressures of: (a) 32 MPa; (b) 126 MPa.
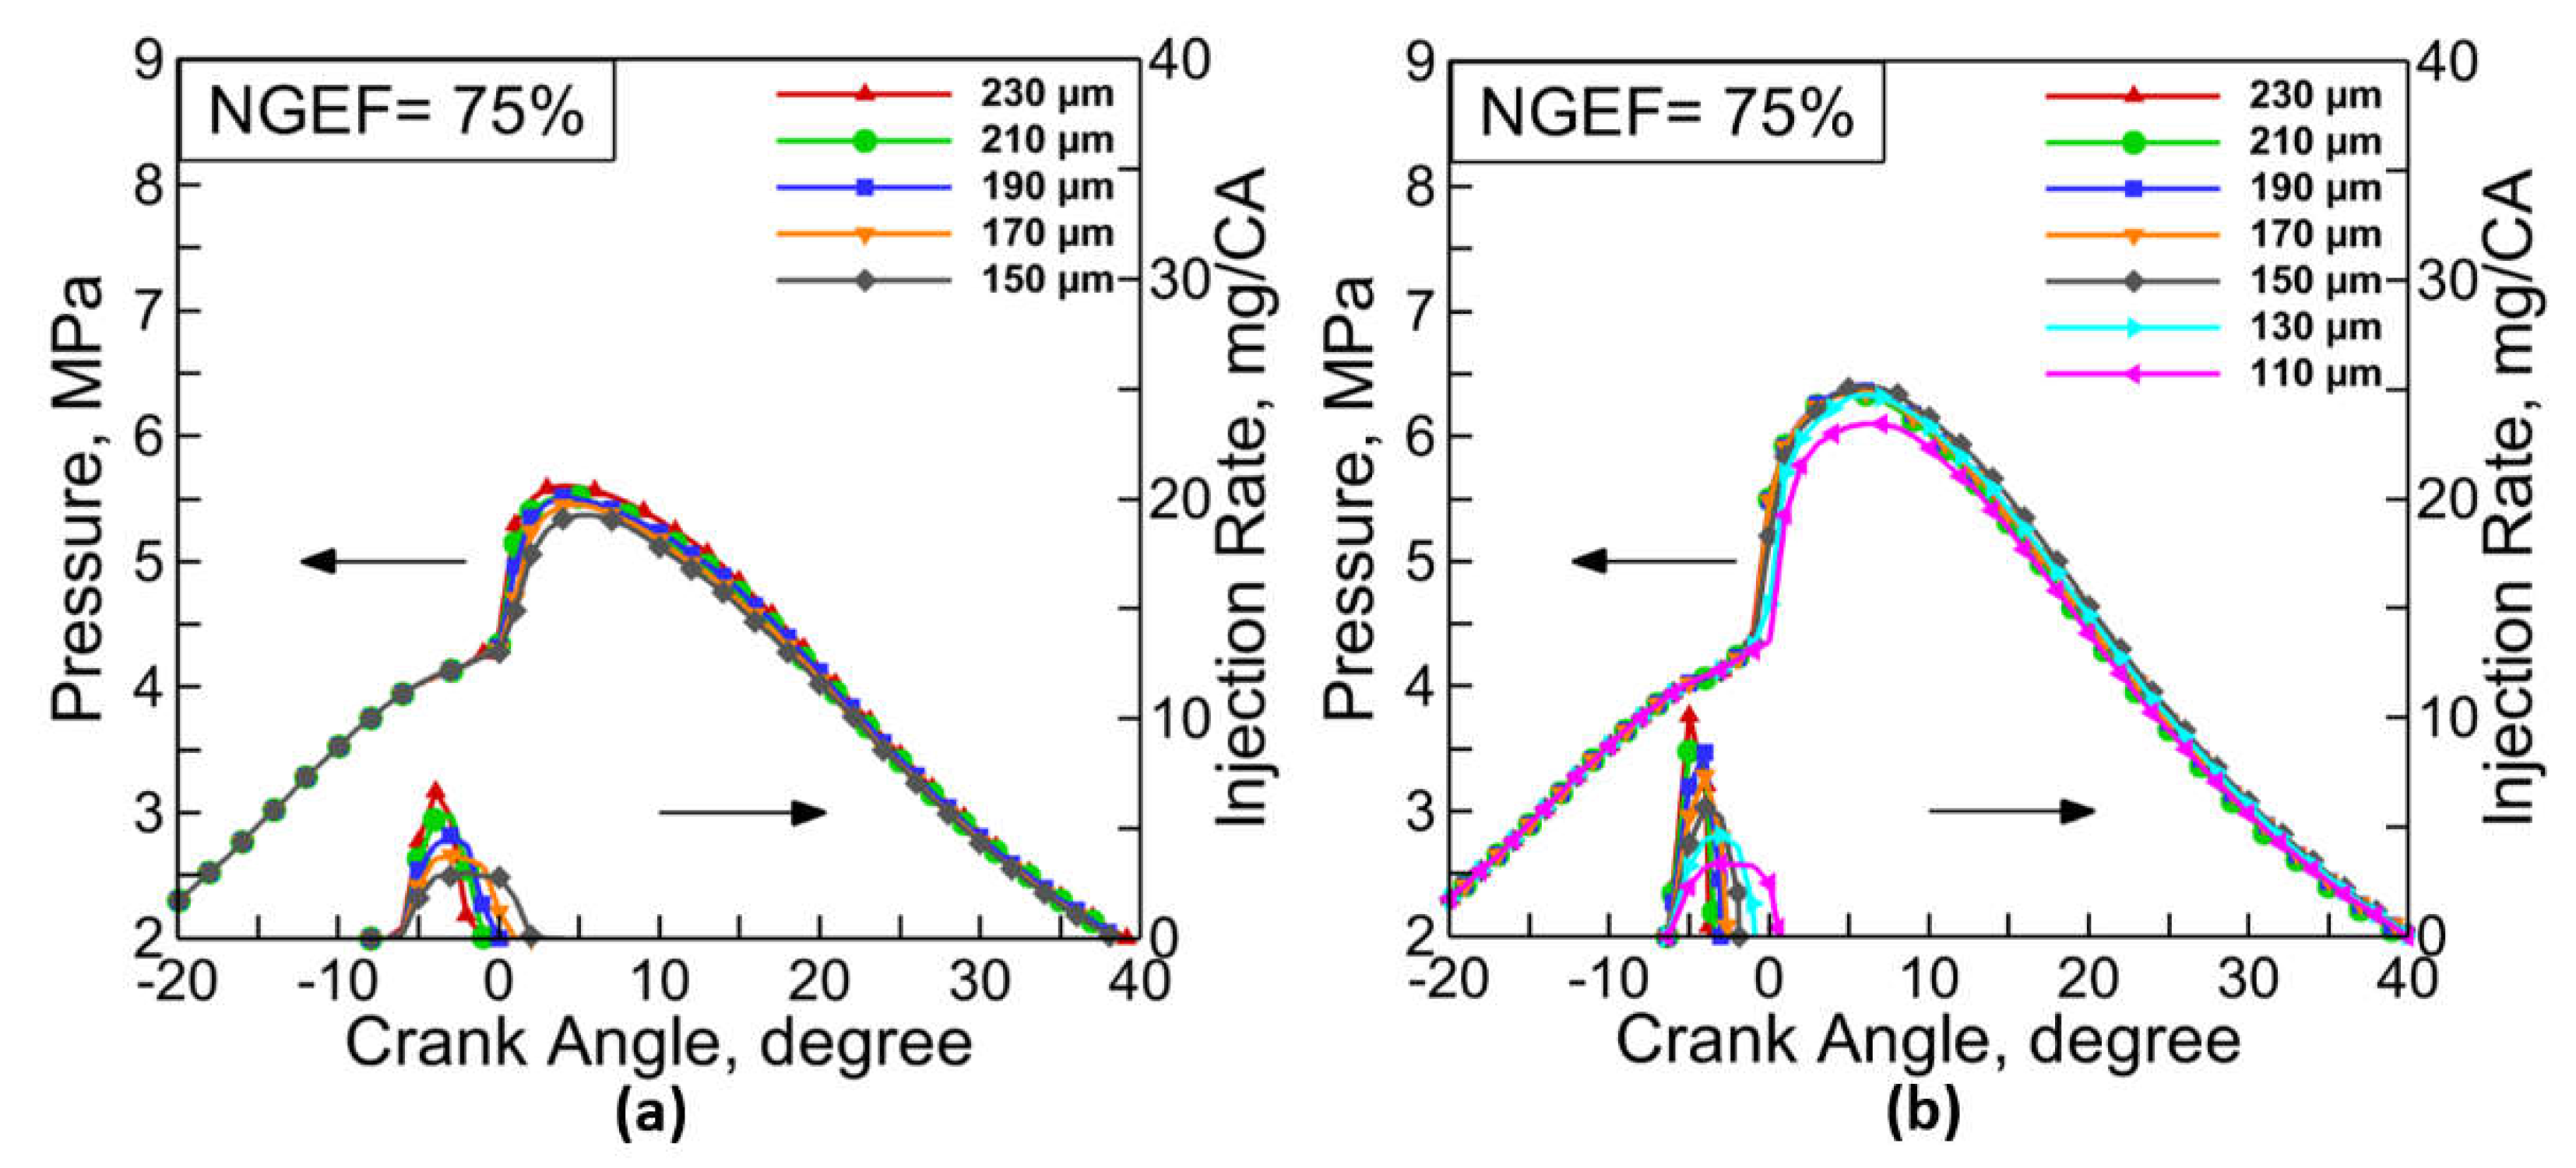
Figure 15.
Under 75% NGEF conditions: (a) CA50; (b) MEP; (c) MPRR; (d) NOX; and (e) CH4 values.
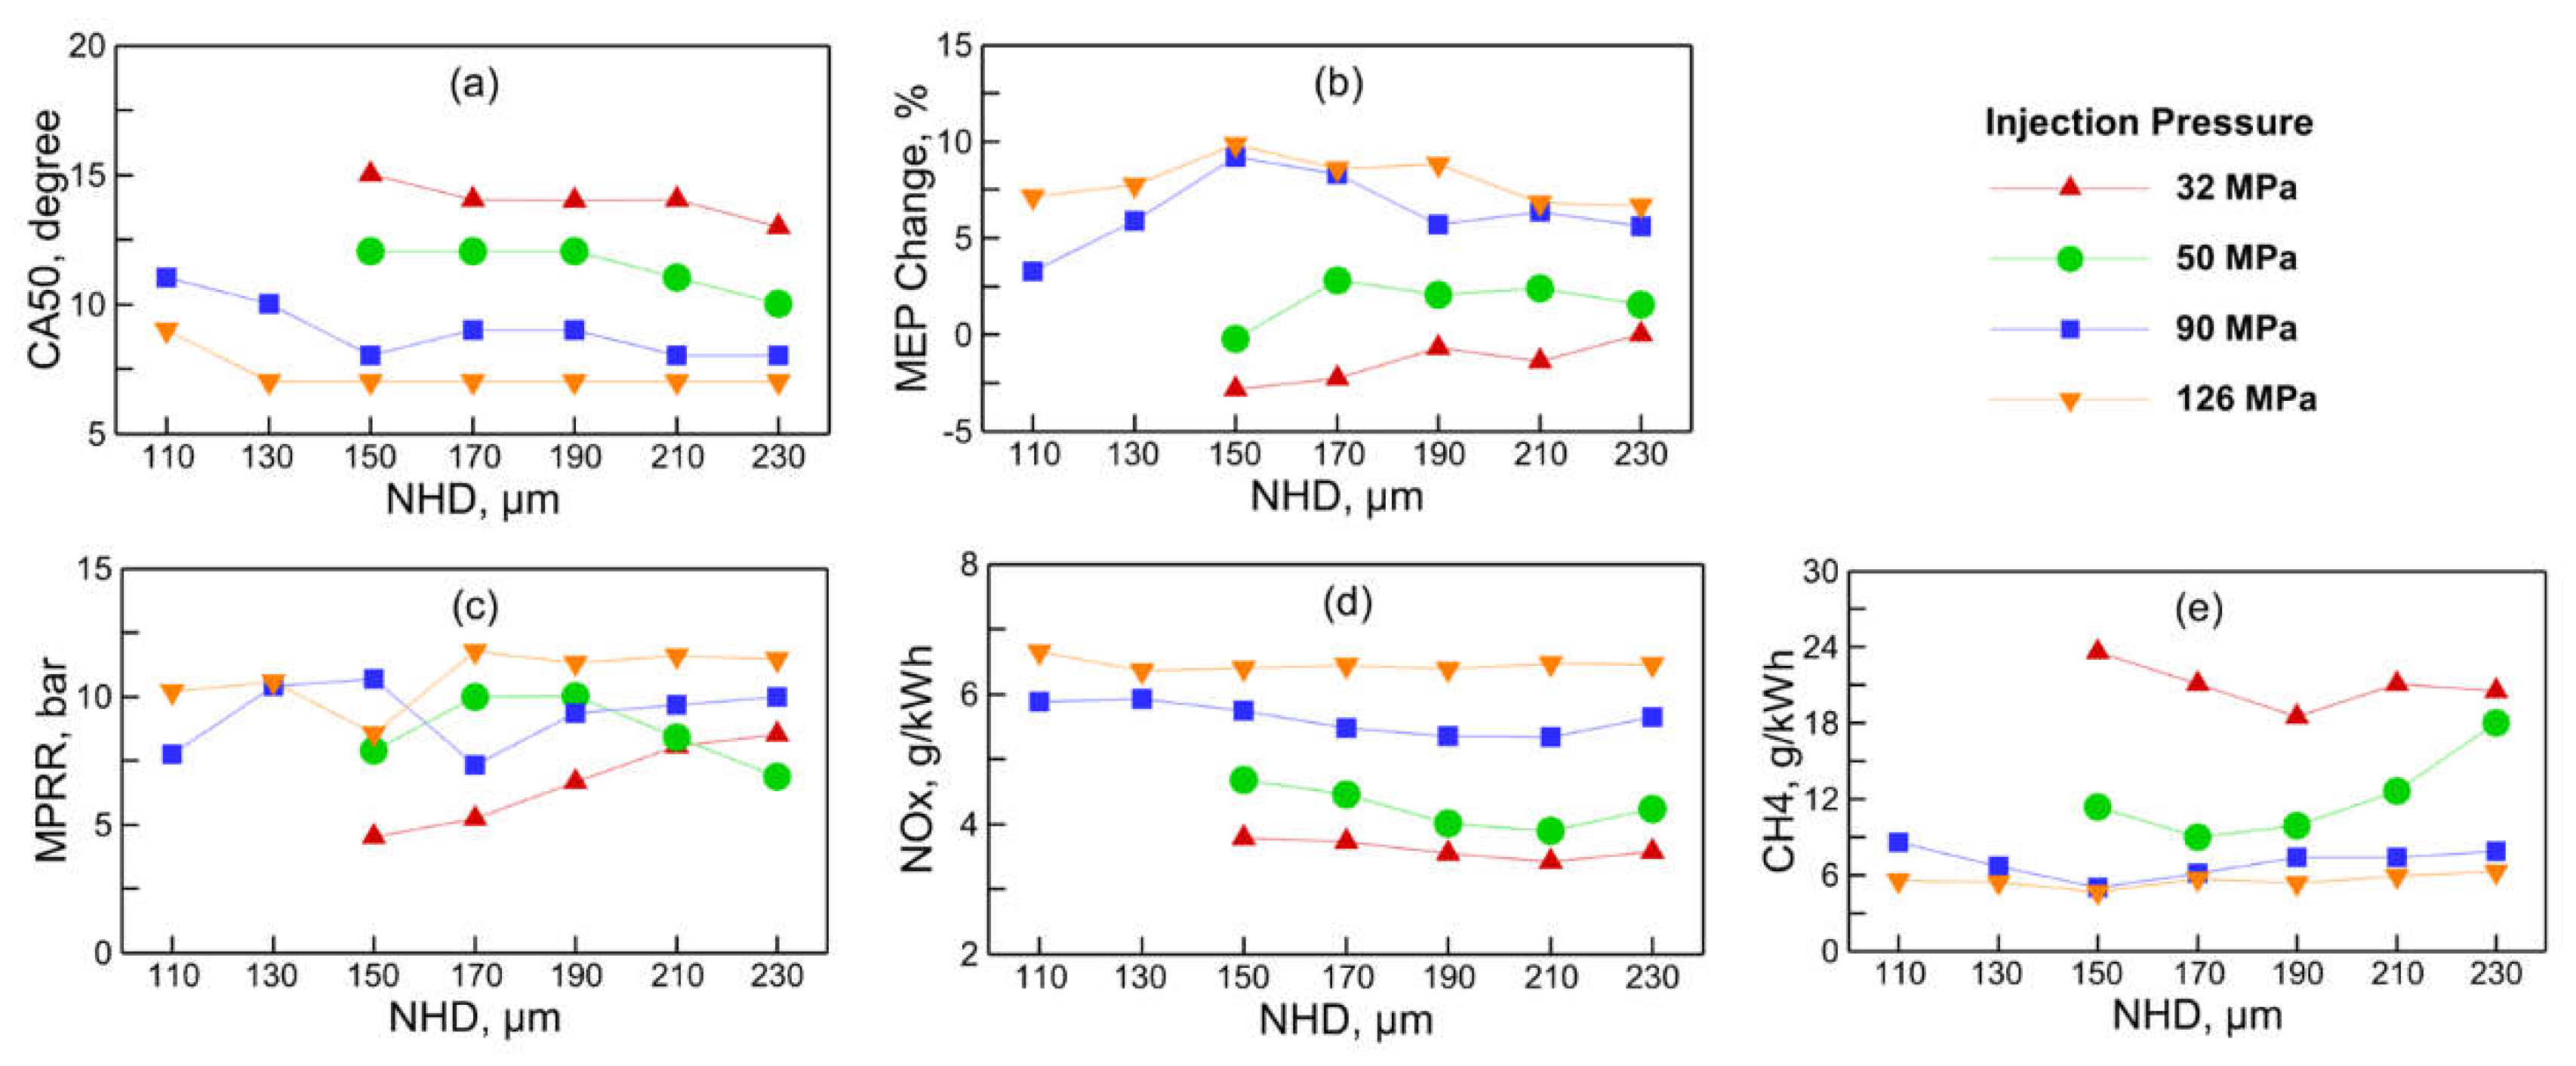
Figure 16.
Under 75% NGEF: (a) Cylinder temperatures and (b) CH4 mass fractions.
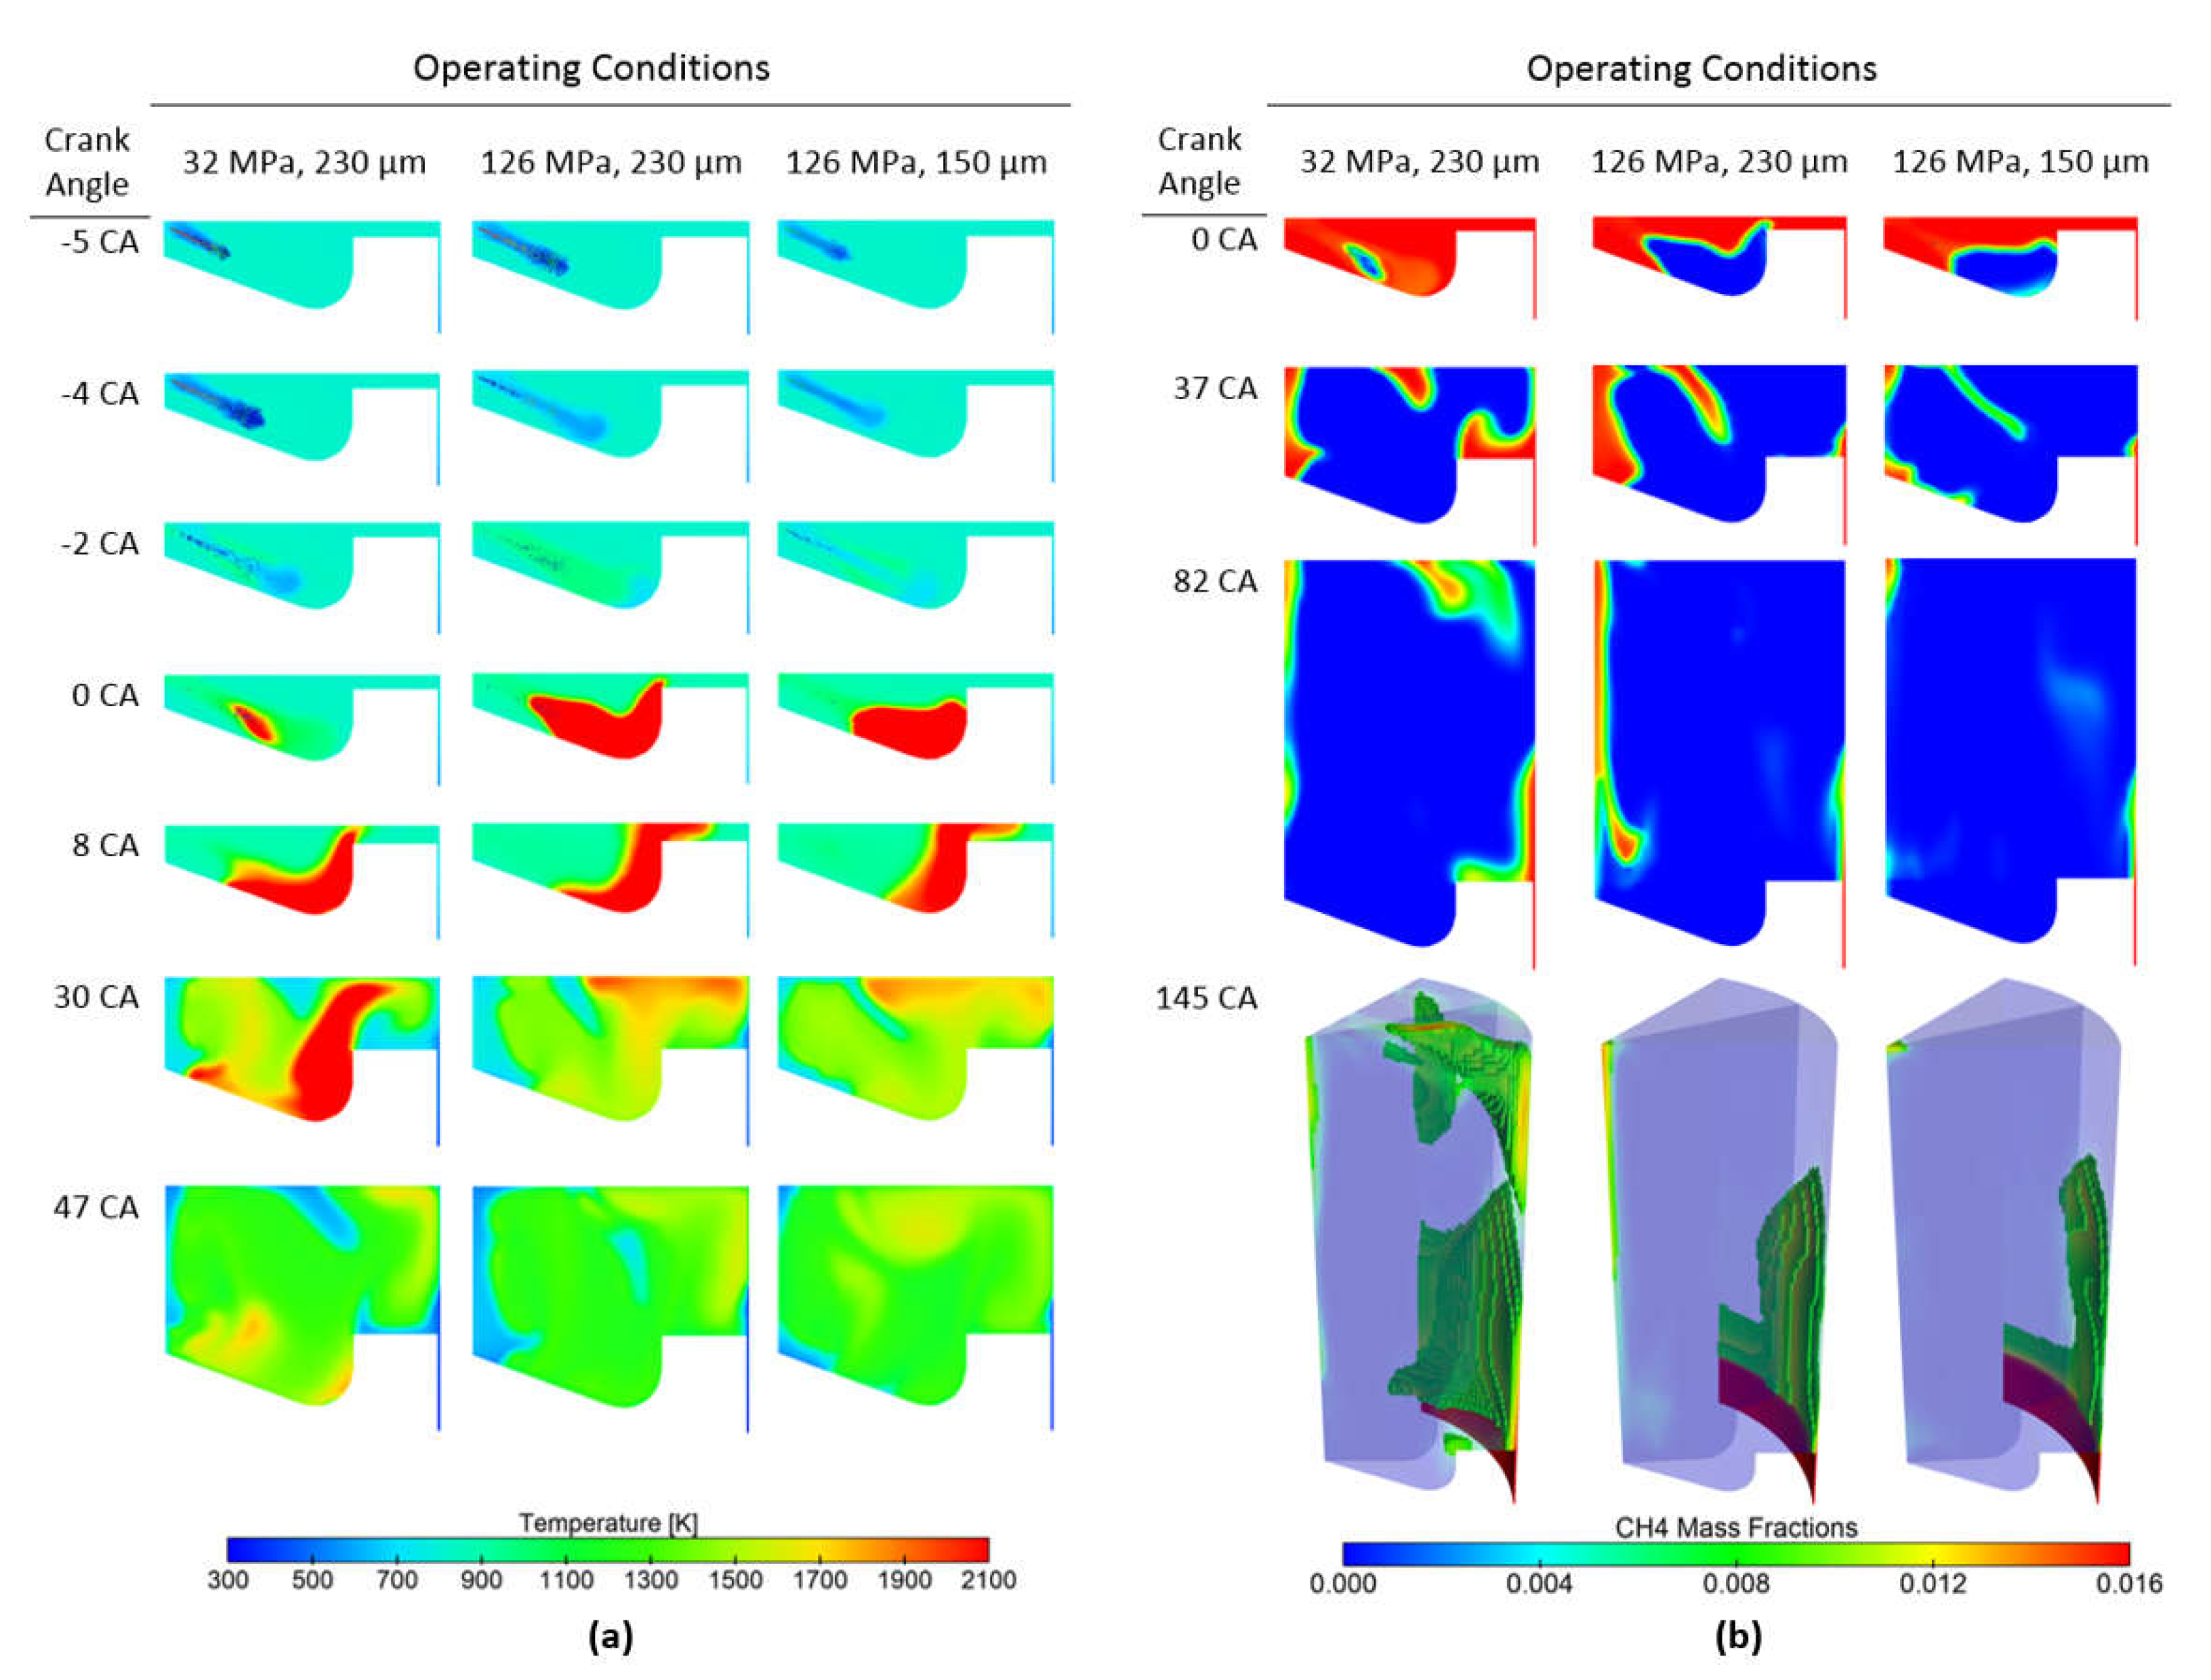
Figure 17.
Results of the combustion simulations considered in the study: (a) Relative MEP change; (b) NOX - CH4 relationships.
Figure 17.
Results of the combustion simulations considered in the study: (a) Relative MEP change; (b) NOX - CH4 relationships.
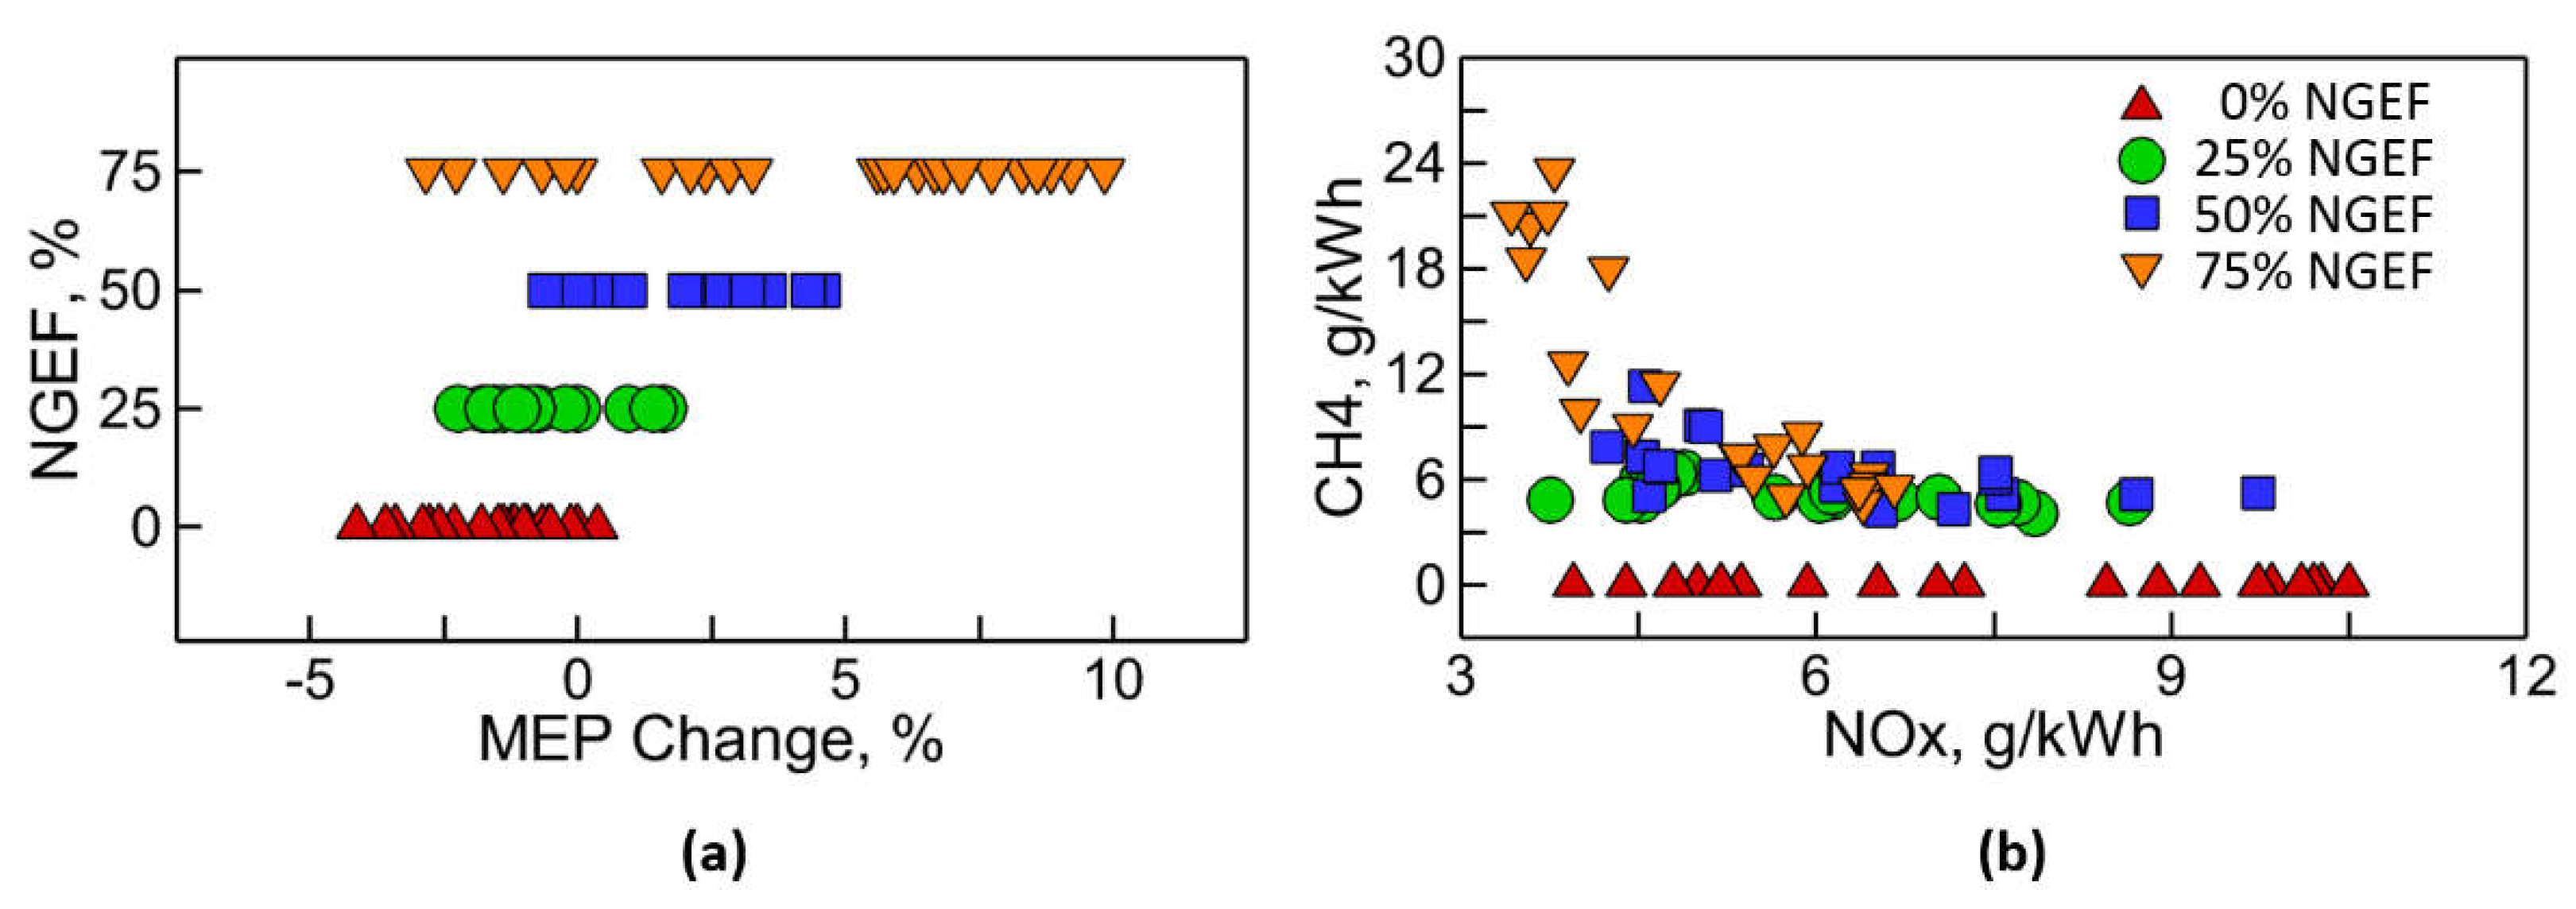
Figure 18.
Comparison of ITE.
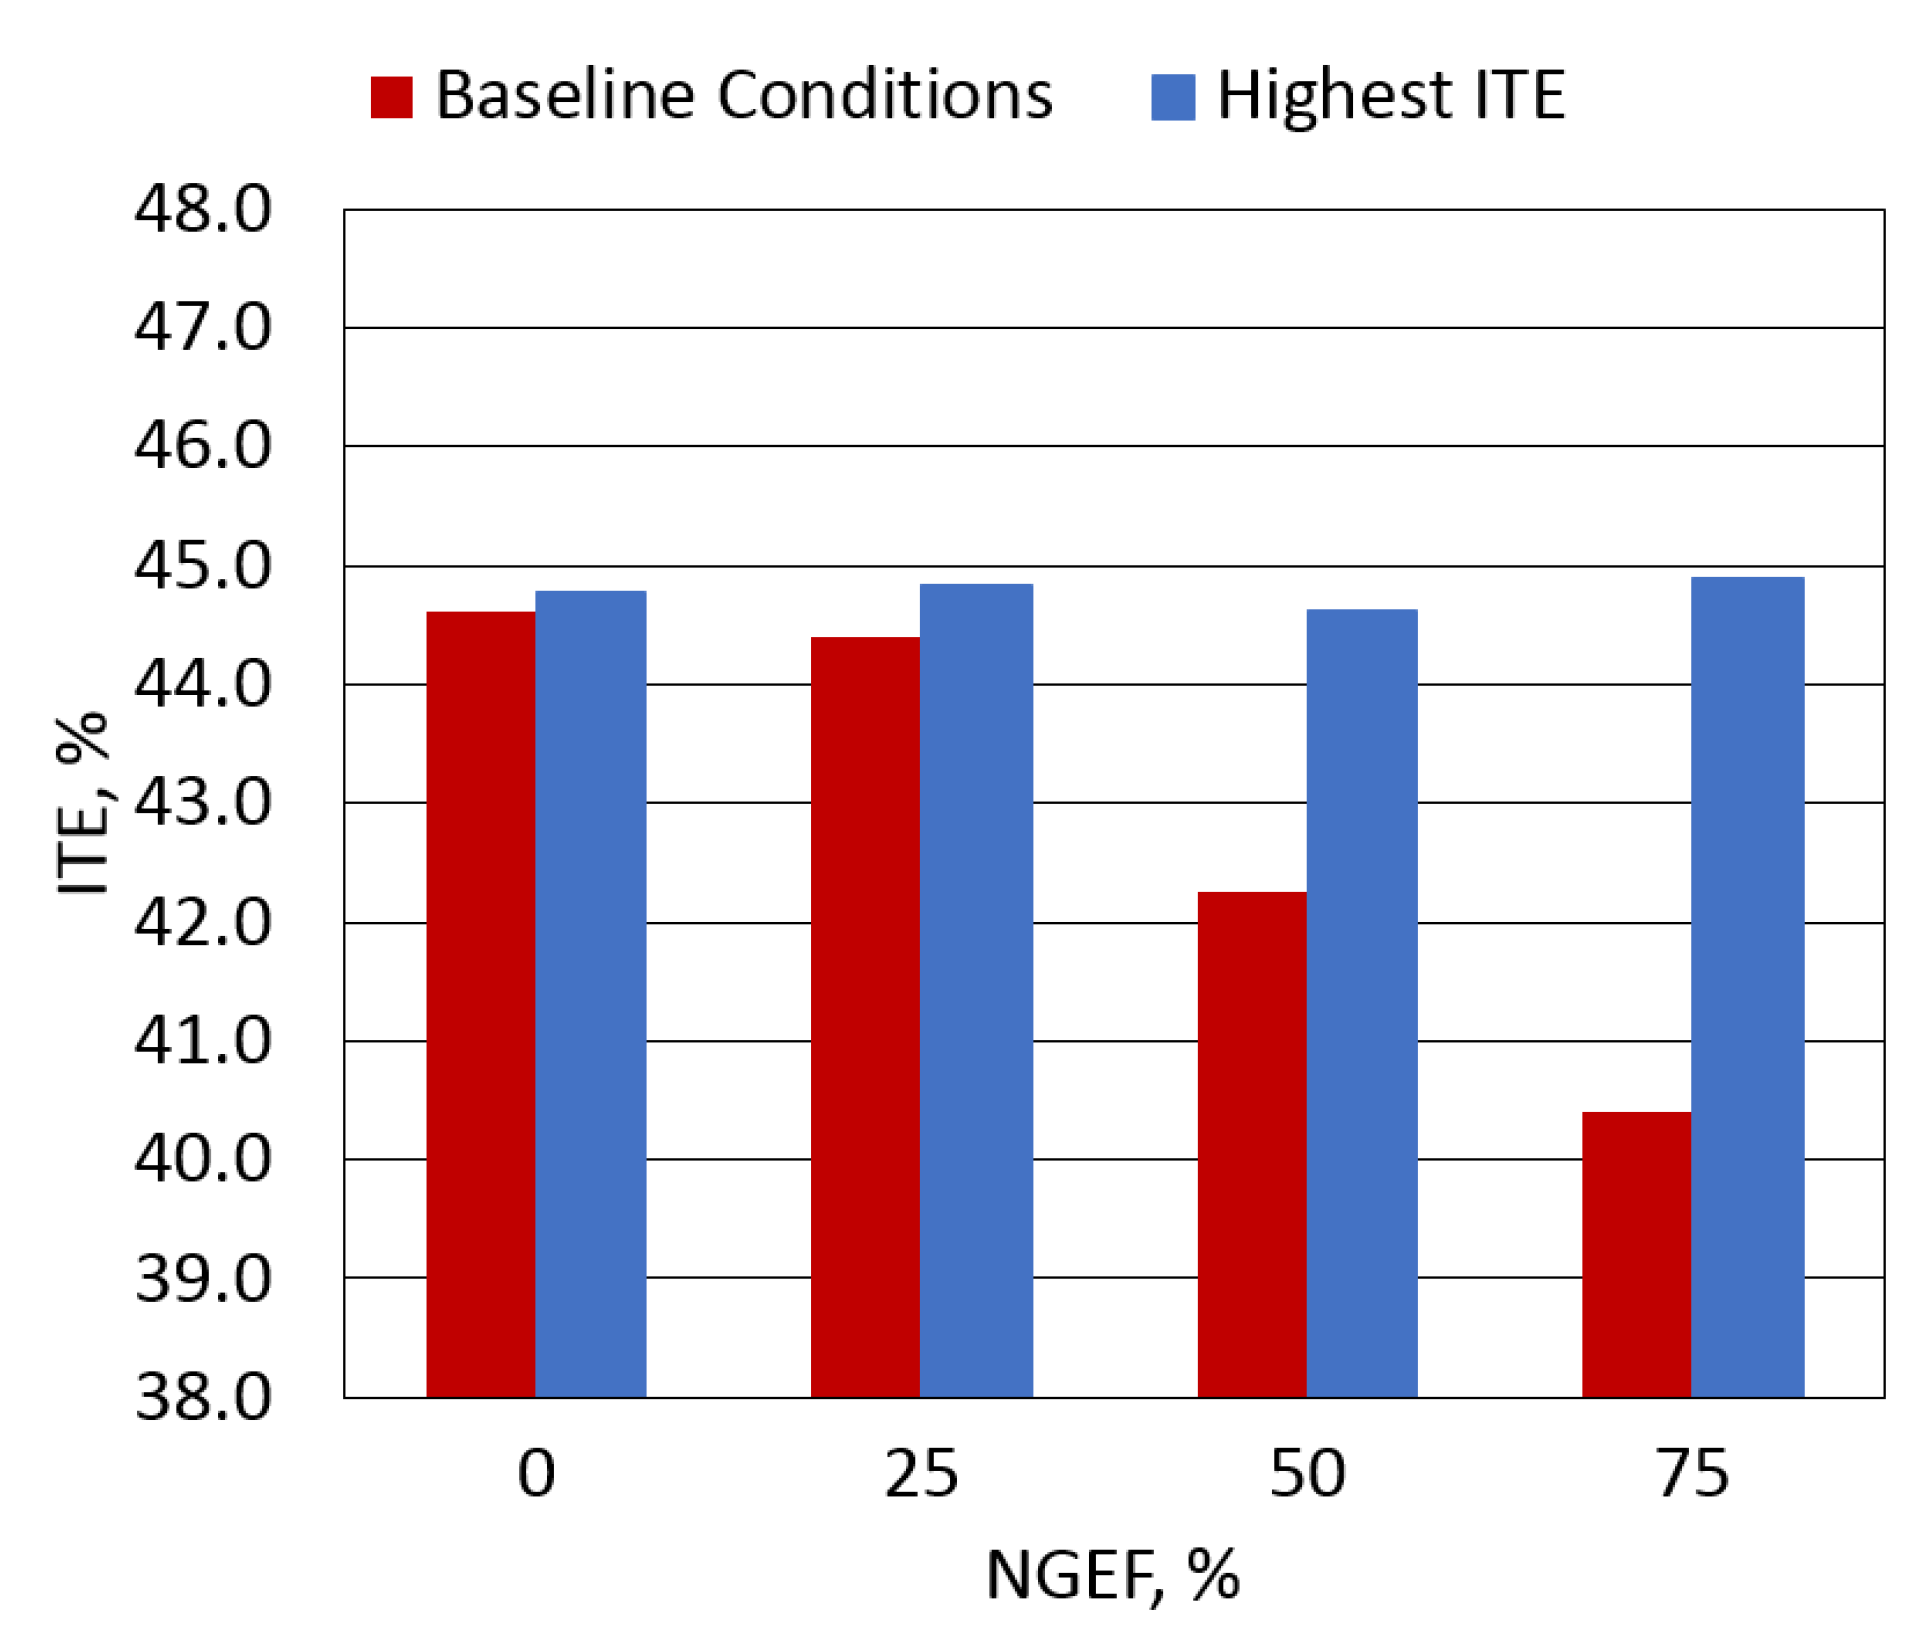
Figure 19.
Comparison of total GHG emissions observed at baseline (B.C.) and highest ITE (H. ITE) conditions.
Figure 19.
Comparison of total GHG emissions observed at baseline (B.C.) and highest ITE (H. ITE) conditions.
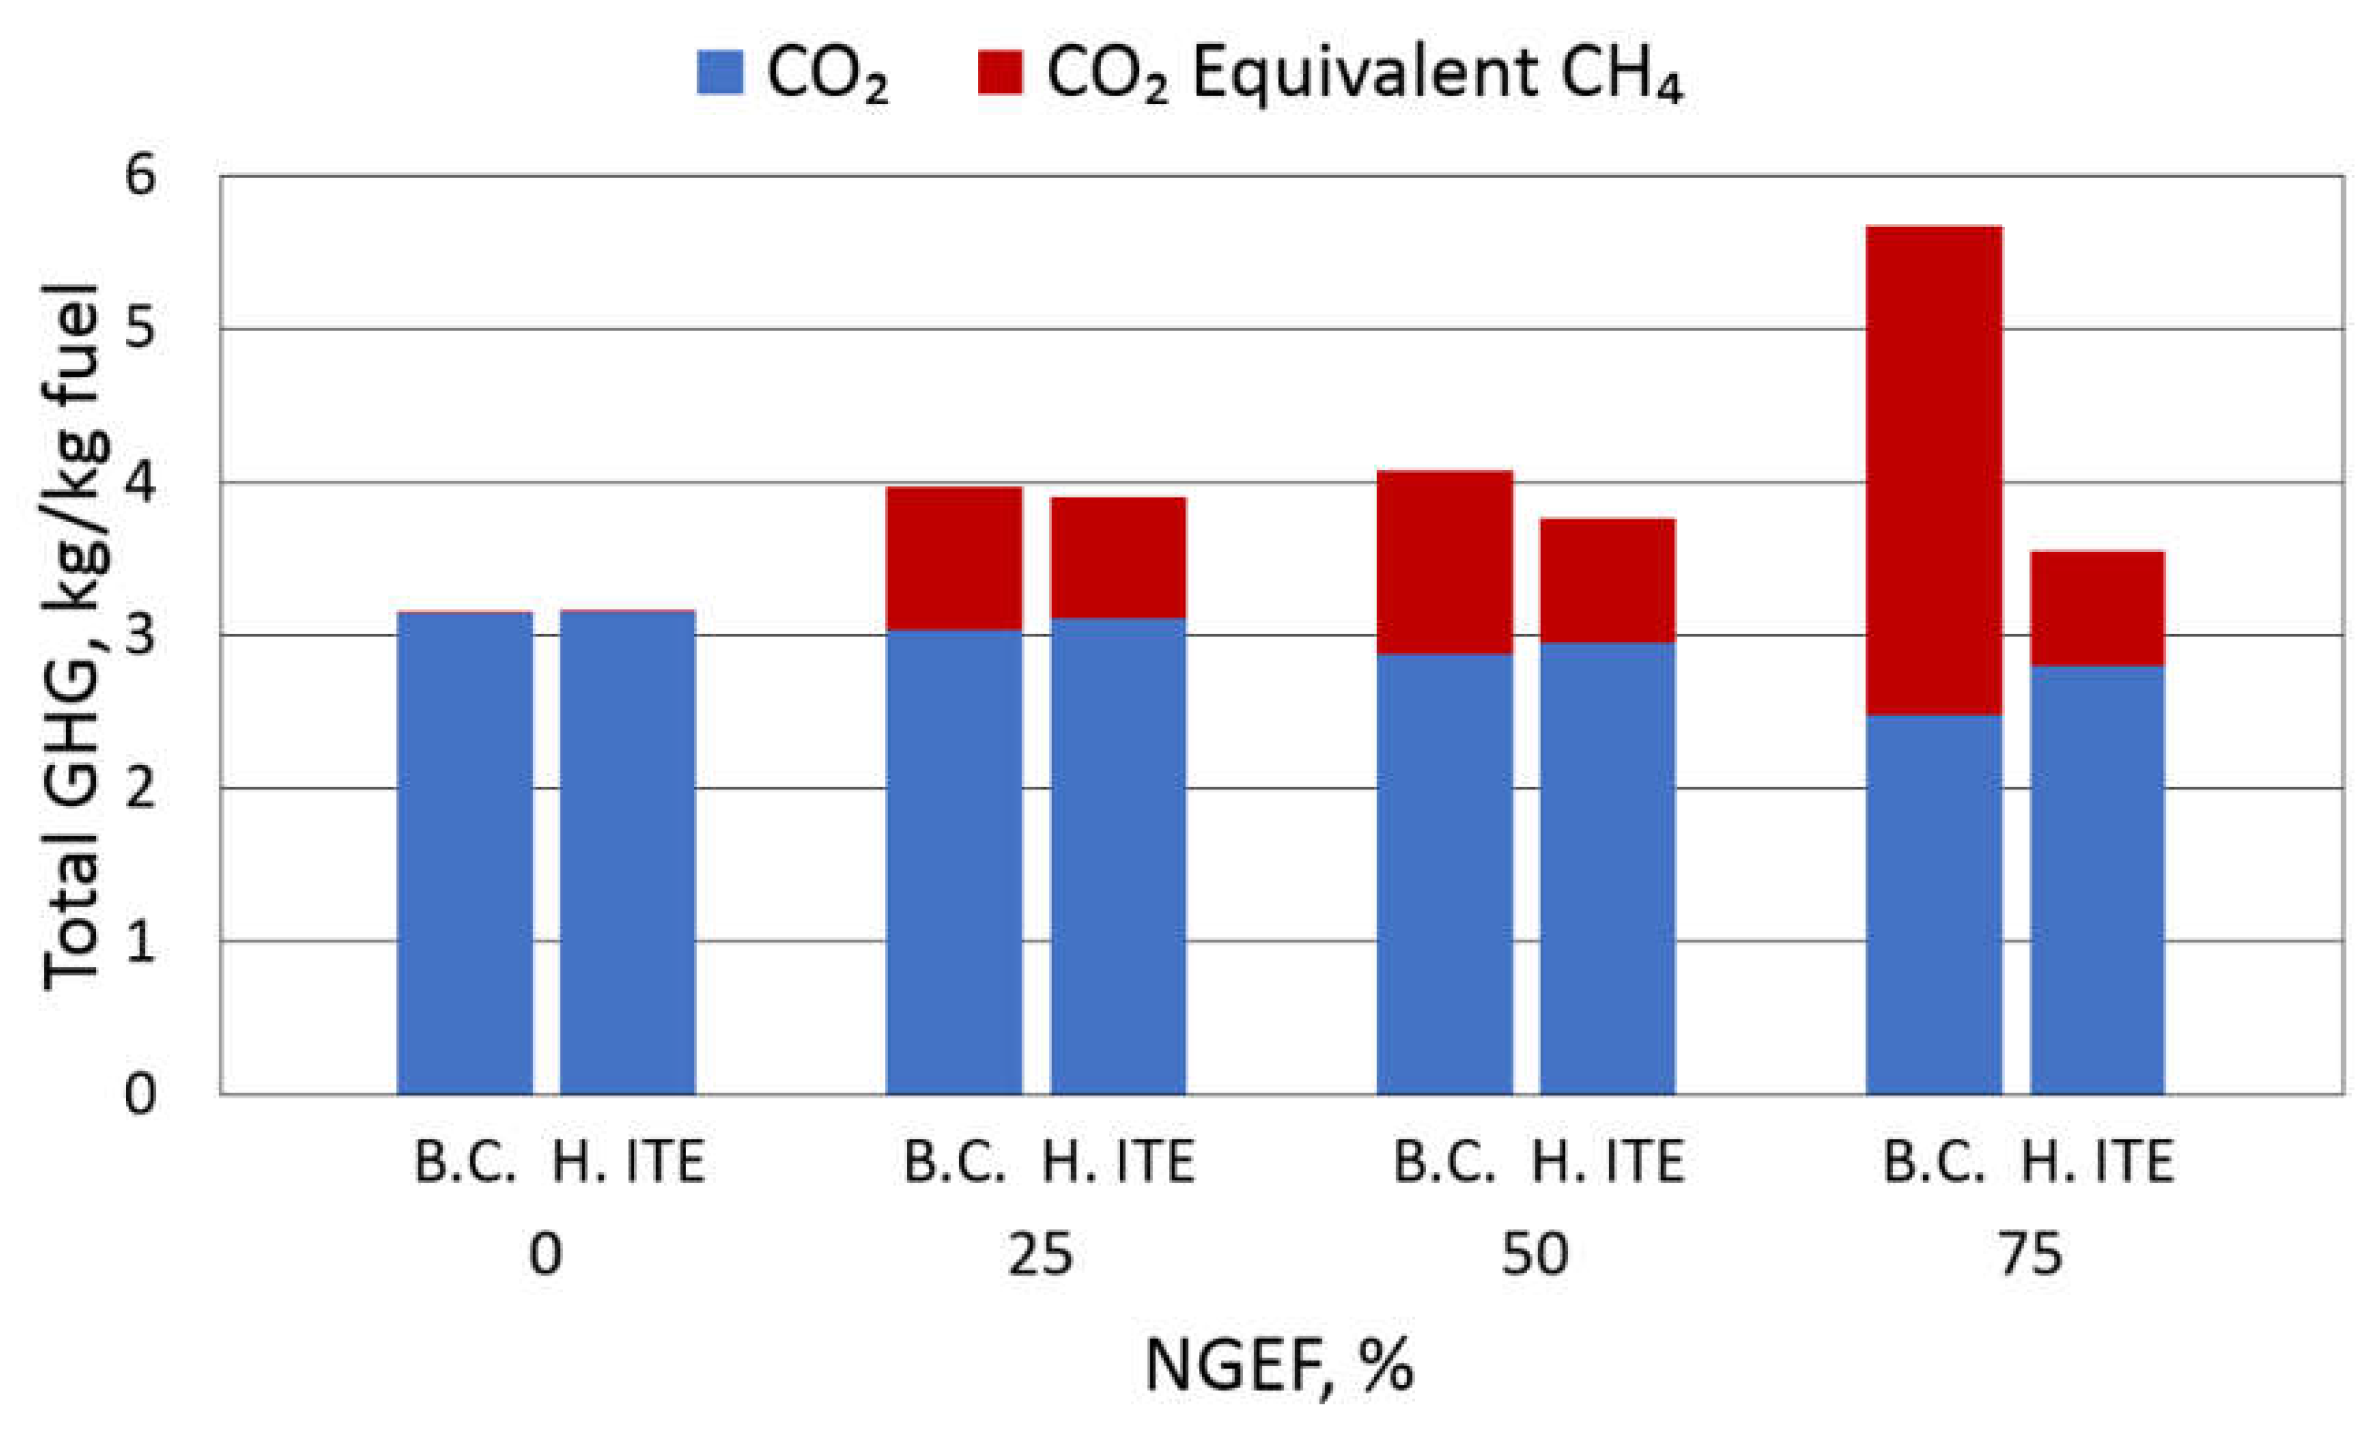

Table 1.
Engine Specifications and Operating Conditions.
| Engine Specification and Operation Conditions | Value |
|---|---|
| Engine speed, rpm | 910 |
| Compression ratio | 16.25 |
| Nozzle hole number | 6 |
| Nozzle hole diameter, μm | 230 |
| Inlet valve closure, CA degrees | -147 |
| Exhaust valve opening, CA degrees | 145 |
| NGEF (%) | 0, 25, 50, 75 |
Table 2.
Simulation matrix.
| Injection Pressure, MPa | NHD, μm |
|---|---|
| 32 | 150, 170, 190, 210, 230 |
| 50 | 150, 170, 190, 210, 230 |
| 90 | 150, 170, 190, 210, 230 |
| 126 | 150, 170, 190, 210, 230 |
Table 3.
Soot Emissions (g/kWh).
| Injection Pressure, MPa | 0% NGEF | 25% NGEF | 50% NGEF | 75% NGEF |
|---|---|---|---|---|
| 32 | 4.7E-02 | 1.4E-02 | 7.1E-03 | 7.5E-04 |
| 50 | 2.5E-02 | 5.1E-03 | 1.8E-03 | 2.5E-04 |
| 90 | 1.2E-02 | 1.8E-03 | 5.7E-04 | 1.6E-04 |
| 126 | 6.6E-03 | 9.1E-04 | 2.5E-04 | 1.5E-04 |
Disclaimer/Publisher’s Note: The statements, opinions and data contained in all publications are solely those of the individual author(s) and contributor(s) and not of MDPI and/or the editor(s). MDPI and/or the editor(s) disclaim responsibility for any injury to people or property resulting from any ideas, methods, instructions or products referred to in the content. |
© 2025 by the authors. Licensee MDPI, Basel, Switzerland. This article is an open access article distributed under the terms and conditions of the Creative Commons Attribution (CC BY) license (https://creativecommons.org/licenses/by/4.0/).
Copyright: This open access article is published under a Creative Commons CC BY 4.0 license, which permit the free download, distribution, and reuse, provided that the author and preprint are cited in any reuse.


