
Submitted:
25 February 2025
Posted:
26 February 2025
You are already at the latest version
Abstract
The hydrolysis of raw food sources by commercially available food-grade enzymes releases thousands of peptides. The full characterization of bioactive hydrolysates requires robust methods to identify and quantify key peptides in these food sources. For this purpose, the absolute quantification of specific peptides, part of a complex peptide network, is necessary. Protein quantification with synthetic tryptic peptides as internal standards is a well-known approach, yet the quantification of non-tryptic peptides contained in food hydrolysates is still largely unaddressed. Similarly, data analyses focus on proteomics applications, thus adding challenges to the study of specific peptides of interest. This paper presents an in-sample calibration curve methodology for the identification of 3 non-tryptic peptides present in a Vicia faba food hydrolysate (PeptiStrong™: NPN_1) using heavy synthetic peptides as both calibrants and internal standards.
Keywords:
Peptidomics
; food hydrolysate
; peptide
; absolute quantification
; mass spectrometry
1. Introduction
Plant-based peptides are sequences of 2-30 amino acids and exist either naturally in plant sources or they are released from endogenous parent proteins during hydrolysis [1,2]. Endogenous peptides in plants were shown to inhibit insect feeding, play an important part in the overall defense response, and control cell division and reproduction mechanisms [3]. The bioactivity of plant-based peptides is inert and can be released through fermentation or hydrolysis by the proteolytic action of enzymes in food processing strategies. The exact composition of the food hydrolysate depends on the composition of the raw food source, its geographical origin, growth season, storage conditions, etc. Hydrolysis takes place in large bioreactors and comprises of the following steps: extraction of food-protein and subsequent solubilization, enzyme addition, hydrolysis, inactivation of hydrolyzing enzymes, and the characterization of the final separated biopeptides or hydrolysate. The core of the process is enzymatic hydrolysis, which needs fine-tuning through the adjustment of the environmental conditions in the bioreactor, such as pH and temperature [4,5]. It is well-accepted that biopeptides with low molecular weight are more bioactive than the ones with high molecular weight [6,7]. Once the peptides are released, they can exert their beneficial bioactivities. A wide range of health benefits has been reported for plant peptides, such as antioxidant [8,9], anticarcinogenic [10,11], antimicrobial, antihypertensive, immunomodulatory [9,12], and cognitive function [13,14]. These bioactivities are significantly affected by the amino acid sequence of the peptides and their molecular weight, among other properties [6]. Namely, plant-based peptides with antioxidant activities have been reported, and these are generally short-chain peptides made of 4-16 amino acids, with low molecular weight in the range 0.4-2 kDa [6]. The peptides with anticancer activity modulate various biological mechanisms such as cell adhesion and topoisomerase inhibition, destruction of membranes in carcinogenic cells and inhibit intracellular signaling of cancer cells. Finally, the immunomodulatory effect of some low molecular weight (< 1000 Da) peptides is exhibited through the activation of macrophages, and the increasing number of leukocytes [1].
The structural integrity of bioactive peptides must be conserved to exhibit the above physiological bioactivities, before they reach their site of action, thus, the peptides must be resistant to the degradation by gastrointestinal and serum peptidases. The bioavailability of peptides in blood depends on structural properties such as charge, hydrophobicity and hydrodynamic volume [15]. The challenges in measuring the bioavailability of bioactive peptides when administered orally include their low concentration in complex food matrices and physiological samples (e.g. serum) and their susceptibility to enzymatic degradation [16]. The stability of biopeptides and the effect of gastrointestinal environments is a complex subject. The latter is a major factor that determines the bioavailability of peptides, and more studies are needed to identify whether such peptides are more stable within a protein hydrolysate network due to peptide-peptide interactions rather than their isolated form, thus, protein hydrolysates may be preferred over isolated peptides. The gastrointestinal degradation products of biopeptides may promote the bioactivity of intact peptides [17], whereas different food matrix components can hinder their absorption, in addition to various intestinal dietary conditions [18,19]. The first assessment of stability of biopeptides within a food matrix takes place with clinical trials but due to ethical or financial reasons of the latter, other in vivo models (e.g., simulated gastrointestinal models) serve as alternative approaches [20]. Their bioavailability depends on the stability, following gastrointestinal digestion, the release from the food matrix, and the absorption through epithelial cells. Cell lines, such as the Caco-2 monolayer, are employed as a tool for mimicking the in vivo absorption, but current approaches include the use of ex-vivo models such as the Ussing chamber [21]. Nevertheless, tissue-based models are the first approach [22].
Although the absorption of di and tri-peptides across the apical membrane has been shown previously, little is known about the transport mechanism through the basolateral compartment [23]. The efflux of previously surviving peptides through the basolateral compartment and into the hepatic portal system is low, and even when low, they are hydrolyzed by serum and endothelial tissue peptidases, thus the majority of peptides is difficult to detect and quantify [23,24]. The challenges for the absorption of peptides include the diffusion through the tight junctions of paracellular pathways and through enterocytes, and their subsequent digestion by a range of peptidases such as cytosolic enzymes and phagolysosomes in the apical membrane [23,25], although tripeptides were reported to be absorbed intact in the past [26]. The uptake of tetrapeptides or larger peptides from the small intestine is even more challenging with conflicting views [27]. Finally, the knowledge of peptide plasma concentrations and their kinetics mechanism for the proper assessment of peptide bioactivity in humans is required, where absorption evidence is lacking. The quantification of biopeptides in complex food matrices is necessary, prior to any assessment of stability, bioavailability and absorption studies. For a hydrolysate to exhibit the same level of bioactivity from batch to batch, or to assure the same quality of hydrolysis, it is important to quantify these key peptides in each batch. The reproducibility from batch-batch is rarely reported [28]. Some of the released peptides are predicted, through artificial intelligence (AI), to have biological activity which is then confirmed with bioassays [29].
The traditional quantification approach assumes the calibration curve generated using blank matrix, that does not contain peptides of interest, and spiking it with synthetic peptides and their versions labelled with heavy amino acids [30]. However, the challenge for food hydrolysates is that the peptides of interest in the hydrolysate are surrounded by thousands of other peptides, undigested proteins, carbohydrates, fats and small molecules [31]. On the other hand, different matrices interfere differently with peptides of interest, affecting their ion suppression, sample recovery and consequently the signal intensity which ultimately affects the quantification of each peptide [32]. Thus, construction of calibration curve in matrix different than hydrolysate of interest is not an appropriate approach.
Peptidomics uses and adapts techniques and methods from proteomics [30]. While some can be applied directly, this is not always the case. The main point of difference between approaches dedicated to protein quantification is the selection of peptides for quantification [33]. While for proteomics quantification analysis the analyst selects the best tryptic peptide from many released from one protein, for peptidomics quantification the exact peptide of interest is necessary for analysis. Furthermore, proteomics approaches utilize tryptic peptides that carry mainly +2 charge or more, allowing for detection of all fragment ions while large portion of peptides in food hydrolysate carries only +1 charge which complicates both identification and quantification [34,35].
The relative quantification of peptides in clinical settings for biomarker discovery was previously reported [36]. However, the peptide-centric absolute quantification of peptides from plant-based food hydrolysates remains poorly studied. Some of the existing methods, such as 1-point calibration curves and multiple reaction monitoring (MRM) methods are not suitable for our purpose [37,38]. Whereas the use of reversed internal curves and of targeted parallel reaction monitoring (PRM) methods have elements that help solve the problem of absolute quantification of peptides in food hydrolysates [39,40].
Although theoretically straightforward, peptide quantification has its challenges, such as selection of precursor ion with all y and b ions, side chain modifications and protonation of fragment ions [41]. Direct infusion of each peptide into the mass spectrometer can be used to account for many of these issues, such as confirming a precursor mass as well as running high concentration of peptides to give the best possible MS/MS fragment ions.
To that end, the aim of this project is to adapt methods from proteomics and develop an absolute quantification method for peptides by using in-sample calibration curve on a Q Exactive instrument.
2. Materials and Methods
We developed a method to quantify three peptides within a hydrolysate (PeptiStrong™) with the precise addition of C13 labelled, synthetic versions of these same peptides using previously characterized proprietary V. faba PeptiStrong™ [29]. The latter was manufactured from fava bean food material (V. faba) and supplied from our Ingredients laboratory. This hydrolysate was previously characterized in Cal et al. (2020) and in Corrochano et al. (2021) [29,42].
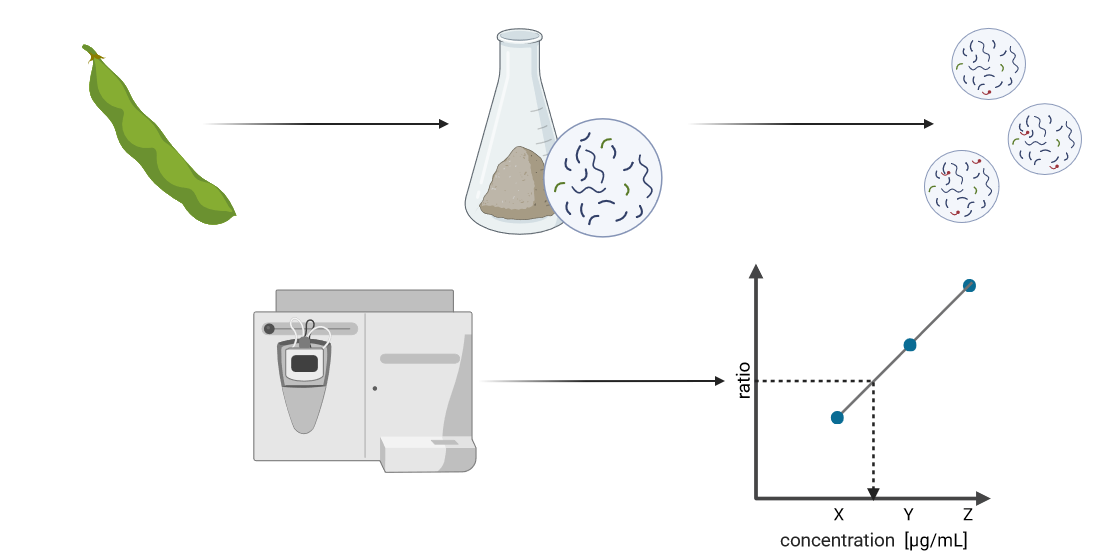
Figure 1 outlines the main experimental steps of this work to perform the absolute quantification of peptides of interest in PeptiStrong™. Details about materials and methods are available in the Supplementary Information.
We selected 3 peptides for quantification based on their intrinsic properties, with the following amino acid sequences: HLPSYSPSP, HLPSYSPSPQ, and TIKIPAGT. All three peptides were previously identified via mass spectrometry. The bioactivity of HLPSYSPSPQ and TIKIPAGT for protein synthesis increase and TNF-alpha reduction was previously predicted and validated [29]. HLPSYSPSP and HLPSYSPSPQ were added together due to their sequence similarity. Heavy labelled peptides were synthesized (GenScript, NJ, USA) for each peptide of interest (See Table 1). One residue per peptide was selected to be a heavy amino acid. Different residues for HLPSYSPSP and HLPSYSPSPQ were chosen to avoid overlap of MS2 fragments.
2.1. Sample Preparation
Hydrolysate powder PeptiStrong™ (0.2 g) was dissolved in water (4 mL), and the solution was vortexed for 30 seconds. The solution was centrifuged at 4000 rpm for 20 minutes at 4 °C and filtered through a 0.2 µm filter. The protein/peptide content of the filtrate was determined using a Bicinchoninic acid assay (BCA) (see Supplementary Material).
Volumes from the stock solution of the hydrolysate were normalised to 1000 µg of protein/peptide and added to low-binding Eppendorf tubes. The samples were evaporated to dryness in a rotary vacuum evaporator (Concentrator Plus, Eppendorf, UK). Dried samples were resolubilized in 1000 μL of LC-MS grade solution of 0.1% w/w formic acid in water. Heavy-labelled peptides, TIK[+8]IPAGT, HLP[+6]SYSPSPQ, and HLPSYSPSP[+6], were solubilized in LC-MS grade water at 1 mg/mL according to the net weight declared by the manufacturer.
2.2. Preparation of Broad and Refined Internal Calibration Curves
Two sets of calibration curves were prepared for this work. The first set of broad calibration curves for each peptide of interest, was prepared using the same concentrations of each heavy peptidoforms, covering a broad range of values. The second set of calibration curves was a refinement of the broad calibration curves. Following the peptide quantification with the broad calibration curves, a refined calibration curve was constructed for each peptide, using the assessed concentrations of the light peptidoform as the mid-point (Figure 2A). The hydrolysate sample (250 ug) was spiked with various concentrations of heavy peptides to a final volume of 1 mL for the construction of both types of calibration curves. Namely, 1 mL solution of 0.1% v/v formic acid contained 250 µg of PeptiStrong™ hydrolysate and the corresponding concentrations of heavy peptidoforms outlined in Supplemental Table S1 and Supplemental Table S2.
Following the spiking of the hydrolysate, the solutions (1 mL) were processed through solid phase extraction (Supplementary Information) and evaporated to dryness. The samples were resuspended in 21 uL of Pierce Retention Time Calibration Mix (PRTC) in 0.1% formic acid in water, centrifuged for 5 minutes at 15000 rpm, and transferred to LC-MS vials, for analysis via mass spectrometry.
2.3. Parallel Reaction Monitoring Mass Spectrometry Method and Inclusion List
Samples were analysed in triplicate by nano LC-MS/MS Dionex UltiMate 3000 coupled to a ThermoFisher Q Exactive™ in positive polarity mode. A trapping column was utilized for loading peptides which were subsequently eluted over a 25 cm analytical column PepMap RSLC C18 with a 70 min gradient at a flow rate of 300 nL/min. The gradient started with 95% mobile phase A (99.9% LC/MS grade water with 0.1% LC/MS grade formic acid) and 5% mobile phase B (99.9% LC/MS grade acetonitrile with 0.1% LC/MS grade formic acid) for 2 min, increased to 20% mobile phase B over 48 min and up to 75% mobile phase B for an additional 20 min. This gradient was held constant for 10 min followed by a 13 min re-equilibration step at a flow rate of 350 nL/min and a 2 min pressure re-equilibration step at a flow rate of 300 nL/min.
The mass spectrometer was operated in full MS and Parallel Reaction Monitoring (PRM) modes. The full MS method was performed in the Orbitrap at 17,500 FWHM at the PRM method was performed at 35,000 FWHM resolution utilizing an inclusion list built from the selected peptides and their heavy peptidoforms. Each sample was injected 3 times.
2.4. Peak Integration
The peak selection and integration in mass spectrometry raw files was done with Skyline (MacCoss Lab Software; Version 22.2.0.312) [43,44]. The peptides of interest, previously identified from a Data Dependent Acquistion (DDA) run using PEAKS (Bioinformatics Solution Inc.; Version 1.5) [45], were used as spectral library. Other b and y ions were added to the Skyline integration to identify fragments that were not found in the DDA run. The peptide sequences were modified to include heavy proline and heavy lysine at their respective positions. Skyline was set to search for heavy isotope label types and to use the light peptide as internal standard. Manual inspection of the peaks was performed to confirm and correct the retention time, peak integration time and selected transitions for quantification for each peptide. Data was then exported to CSV files from Skyline for downstream analysis.
2.5. Peptide Sequence Validation
The selected peptides were identified using open database searches from DDA experiments [46]. All 3 peptides contain leucine or isoleucine residues; thus, the exact sequence of these peptides might be incorrect due to the similar mass of these 2 amino acids. During the previous step of peak integration, we screened the retention time shifts between light and heavy peptides. If required, additional PRM runs were performed using synthetic light and heavy peptides in water. The analysis of the Extracted Ion Chromatogram (XIC) of these runs was used to test the hypothesis that the retention time shift observed in the MS runs of the spiked hydrolysate could be explained by the difference in hydrophobicity between amino acids leucine and isoleucine.
2.6. Linear Regression and Peptide Quantification
A linear regression fit was applied for each peptide by using the corresponding ratio of heavy and light to the on-column concentration of spiked heavy peptides on the x-axis. The concentration of each peptide of interest was calculated with inverse estimation of a ratio, with 1 representing the equal quantity of heavy and light peptides.
The limit of quantification was determined for the broad calibration curve by performing a segmentation analysis of the linear regression model using the segmented R package [47,48]. The breaking point between the two resulting linear regressions represents the point between the linear response and the noise. Segmentation analysis was not possible for the refined calibration curve. Thus, the limit of quantification was determined by using 10 times the slope of the calibration curve divided by the standard deviation of the peak area ratio at the y-intercept.
3. Results
3.1. Validation of Peptide Sequence Using Synthetic Heavy Peptides
Peptide TIKIPAGT/TIKLPAGT from V. faba [29] was previously characterized by other DDA experiments. We assumed the peptidoform with isoleucine was the correct sequence. Figure 3A-C show the XIC of the corresponding light endogenous peptide and its spiked, heavy-labelled counterpart in hydrolysate PeptiStrong™. Figure 3A-B show the identical retention time between peptides HLPSYSPSP and HLPSYSPSPQ with their spiked, heavy-labelled counterparts, whereas the retention time for peptide TIKIPAGT and its spiked heavy-labelled counterpart does not match in the XIC profiles, although both peptide sequences were confirmed at the MS2 level (Supplemental Figure S2).
We performed an experiment using synthetic peptides of both light and heavy TIKIPAGT peptides with synthetic light TIKLPAGT. Figure 4A-C represents different conditions of an experiment with different combinations of light and heavy peptidoforms in water using the same analytical parameters as for the absolute quantification method. Figure 4A shows the difference in retention time between TIKIPAGT and TIKLPAGT. The peak of the endogenous peptide does not match with the peak of the heavy version of peptide TIKIPAGT as it is the isoform of leucine (TIKLPAGT). Thus, after this point, we refer to this peptide using this corrected sequence. We identified TIKIPAGT with confidence as the first peak at 22.3 min and TIKLPAGT as the second peak at 24.2 min.
3.2. Estimation of Concentration for Multiple Peptides with Broad Internal Calibration Curves
In a reversed, in-sample calibration curve with heavy labelled peptidoforms, the signal of the quantified (light) peptide is constant, while the signal for the heavy peptidoform varies based on its increasing concentration (Figure 3). Figure 5 shows that the linear relationship between concentration and signal lies within a concentration range for the heavy-labelled peptide. There is a wide range of concentrations applied for the construction of a broad calibration curve, thus many points fall outside the limit of linearity. We used a segmentation analysis on a linear regression model between the concentration and peak area of the heavy peptide to find the breaking point between noise and the linear part of the calibration curve (Figure 5). The linear curve for heavy-labelled peptide HLPSYSPSP[+6] (Figure 5B) displays the lowest LOQ value, 0.00079 μg/mL, compared to 0.0031 and 0.002 μg/mL for heavy-labelled peptides HLP[+6]SYSPSPQ and TIK[+6]IPAGT, respectively.
3.4. Absolute Quantification Using Peptide-Specific, Refined Calibration Curves
The broad set of calibration curves cannot be used to accurately quantify the peptides of interest as there are not enough data points to compose the linear part of the calibration curve. Thus, we constructed a second, more refined set of calibration curves. for each peptide of interest using the estimated concentrations from their corresponding broad calibration curves.
Figure 6 shows the higher accuracy of the peptide specific refined calibration curves compared to the broad calibration. The broad calibration curves of each peptide (Figure 6A, C and E) show that the estimated concentration values differ by several orders of magnitude from the values found with the refined calibration curve. We found the following concentrations for the peptide of interests in the tested hydrolysate: TIKLPAGT at 0.01 x 10⁻⁴ µg.ml-1; HPLPSYSPSQ at 0.021 µg.ml-1; and HLPSYSPSP at 0.015 x 10⁻⁴ µg.ml-1.
4. Discussion
The approach of in-sample calibration curve involves the use of synthetic isotopologues to construct a calibration curve with each of these isotopologues serving as a calibrant [49]. High-resolution mass spectrometry allows for accuracy down to 10 ppm, corresponding to 0.0075 m/z for a peptide with molar mass 1500 Da and with +2 charge, together with the ability to collect data for all product ions from a precursor simultaneously. Application to higher charge states would be possible based on such resolution [50].
In this study, we present evidence validating use of a hydrolysate (PeptiStrong™) resulting from the proteolysis of V. faba in addressing the quantification of three peptides which are consistently detected in this hydrolysate and are part of a peptide network with proven muscle health benefits [42]. Bateman, K. et al., reported an analytical workflow based on DDA and XIC profiles, showing the quantitative nature of their work by using various spiked-in concentrations of bovine peptides in complex matrix (mouse plasma) [51]. In this work, the PRM method was chosen over the standard DDA method for the quantification of three peptides in a food, plant-based, hydrolysate. We chose this approach as the analyte is measured consistently with PRM and the limit of detection (LOD) is found when detection is absent, while the lack of identification with DDA type of acquisition indicates the LOD was either reached or the analyte was not sampled [52]. DDA experiments which involve an increased proteome coverage suffer from under sampling problems and lead to under representation of low abundance analytes [53]. In this work, the application of PRM acquisition method allowed for excellent robustness and accuracy, while avoiding the need for multiple analysis of individual calibrators, as mentioned elsewhere [54]. The quality of a calibration curve constructed by the PRM method is indicated by the linearity of the curve, where R2 values higher than 0.9 are acceptable, although there is no consensus yet [55]; individual parts of the curve should not vary more than 25% from the linear regression fit [56].
Our approach, which combined a basic workflow for sample preparation and the in-sample calibration curve approach for food-derived peptide quantification is more advantageous than other reported methods which used certain colorimetric assays and amino acid analysis with well-known additional steps (e.g., chromogenic substrates, chemical derivatization) that alter the chemical structure of peptides and using arbitrary conversion factors for in-sample peptide and protein quantification [57]. Τhe first part of our work differentiated between peptides TIKIPAGT and TIKLPAGT, based on their hydrophobicity difference or the existence of amino acids leucine and isoleucine (Figure 3 and Figure 4). As these two amino acids cannot be distinguished based on their masses, caution is needed when working with very similar (down to one amino acid difference) peptides. The use of the heavy peptidoform of TIKIPAGT was necessary to resolve the difference between the two peptides. Similar labelling approaches have been reported at the peptide level as well, such as the use of dimethyl labeling, and peptide quantification by comparing the peptides’ relative ion abundance, although the method is prone to variation in the earlier steps of sample preparation in proteomics [58].
Figure 5 shows the peak area of each heavy-labelled peptide against their concentrations and the dotted line separates the actual calibration curve (right-side) for each peptide to the noise (left side) during their detection. The lowest reported concentration value of the three heavy-labelled peptides, 0.00079 μg/mL (HLPSYSPSP[+6]), is representative of the quantification depth our method can access.
Our approach requires building two in-sample calibration curves. This may increase the cost of the experimental setup compared to a single calibration or to a single point broad calibration curve. However, the 1-point calibration curve is missing the limit of quantification of the applied heavy-labelled peptide. Our approach has two main advantages over these alternatives: the in-sample LOQ can be quantified from the broad calibration curve and the second, refined calibration curve reduces uncertainty of the peptide concentration calculation.
Further investigations to determine the LOQ for hydrophobic analytes are necessary as these are prone to surface adsorption and their reported values may not be reflective of actual LOQ. Also, the use of analyte isotope that falls within the linear range to back calculate the in-sample analyte concentration can be tested.
A compilation of the broad and refined calibration curves for each of the three peptides is shown in Figure 6. The absolute quantification values determined by the refined calibration curves for peptides TIKIPAGT, HLPSYSPSPQ and, HLPSYSPSP were 0.01 ± 7e-04, 0.021 ± 0.002 and 0.015 ± 8e-04 μg/mL, respectively (Figure 6B-F). It is also important to highlight the difference between the three absolute concentration values, and the three different calibration curves for each peptide, since not all can fit in one curve. Similar observations have also been highlighted in the work of Greer, T. et al. [59], where they used isotopic N,N-dimethyl leucine to label neuropeptide allatostatin and spiked a mouse urine matrix, creating two validated quantification methods. Various studies reported the quantification of peptides using labeled internal peptide standards as a single point calibration [60], but higher accuracy is achieved by constructing a calibration curve from the response ratio of the labelled pair within a certain concentration range [61].
The development of precise and standardized quantification of peptides in food supplements and functional products is crucial to characterize their positive and measurable bioactive and nutritional effects [62,63]. It is also capable of reducing uncertainty in the prediction of unintended negative effects [64]. Overall, a quantification approach of peptides from natural sources would be one of the first steps and in line with the current sustainable development goals of the United Nations, namely goals two and three, which focus on food security and improved nutrition and the promotion of well-being at all ages, respectively [65].
The absolute quantification of the identified peptides within a hydrolysate from a plant source will unlock their testing for survivability (blood half-life) and their subsequent quantification in blood and assess their effectiveness and clinical trials and in vitro assays.
5. Conclusions
We successfully resolved the retention time shift between isoleucine and leucine peptidoforms to identify the correct sequence of one of our peptides of interest using a spiked heavy labelled peptide. This sequence difference would not have been possible to resolve with a simple DDA run followed by standard peptide search. We achieved the absolute quantification of multiple peptides in a single hydrolysate using a PRM method targeting peptide of interest and their heavy peptidoforms. The heavy peptidoforms served two purposes: they were utilized both as calibrants to construct a five-point calibration curve and as internal standards to address the losses due to sample preparation and matrix effects. The refined calibration curves do not validate the corresponding broad curves, thus it is not sufficient to implement one generic set of concentrations in a calibration curve to fit all the experiments for peptide quantification.
Supplementary Materials
The following supporting information can be downloaded at: Preprints.org, Supplementary Materials and Methods: Materials, Heavy Peptides, Bicinchoninic Acid Assay, Solid-Phase Extraction; Figure S1: Selection of precursor ions matching the peptide of interest in noisy spectra.; Figure S2: Identification of light and heavy peptides.; Table S1: Broad calibration curves for each quantified peptide.; Table S2: Refined calibration curves for each quantified peptide.
Author Contributions
Conceptualization, S.T.; methodology, S.T., J.M., G.I.P., and B.D.; software, J.M.; validation, J.M., and G.I.P.; formal analysis, J.M.; investigation, J.M., G.I.P., and B.D.; resources, S.T.; data curation, J.M.; writing—original draft preparation, J.M., G.I.P., B.D. and S.T.; writing—review and editing, J.M., G.I.P., and S.T.; visualization, J.M.; supervision, S.T.; project administration, S.T. All authors have read and agreed to the published version of the manuscript.
Funding
This research received no external funding.
Institutional Review Board Statement
Not applicable.
Informed Consent Statement
Not applicable.
Data Availability Statement
Data sharing is not applicable to this article.
Acknowledgments
The authors wish to thank Dr. Andrew Franklin-Miller for his constructive feedback on the manuscript, Dr. Audrey Wall and Dr. Bethany Jose for constructive discussions on the data analysis. We acknowledge Figures 1 and 2 were created using BioRender.com.
Conflicts of Interest
The authors declare no conflict of interest. The design of the study; the collection, analyses, and interpretation of data; the writing of the manuscript; and the decision to publish the results was performed by Nuritas.
Abbreviations
The following abbreviations are used in this manuscript:
| PRM | Parallel Reaction Monitoring |
| MRM | Multiple Reaction Monitoring |
| XIC | Extracted Ion Chromatogram |
| DDA | Data Dependent Acquisition |
| BCA | Bichinconininc Acid Assay |
References
- Chalamaiah M, Yu W and Wu J 2018 Immunomodulatory and anticancer protein hydrolysates (peptides) from food proteins: A review Food Chem. 245 205–22. [CrossRef]
- Chalamaiah M, Keskin Ulug S, Hong H and Wu J 2019 Regulatory requirements of bioactive peptides (protein hydrolysates) from food proteins J. Funct. Foods 58 123–9. [CrossRef]
- Hayes M and Bleakley S 2018 21 - Peptides from plants and their applications Peptide Applications in Biomedicine, Biotechnology and Bioengineering ed S Koutsopoulos (Woodhead Publishing) pp 603–22.
- He R, Girgih A T, Rozoy E, Bazinet L, Ju X-R and Aluko R E 2016 Selective separation and concentration of antihypertensive peptides from rapeseed protein hydrolysate by electrodialysis with ultrafiltration membranes Food Chem. 197 1008–14. [CrossRef]
- Huang J, Liu Q, Xue B, Chen L, Wang Y, Ou S and Peng X 2016 Angiotensin-I-Converting Enzyme Inhibitory Activities and In Vivo Antihypertensive Effects of Sardine Protein Hydrolysate J. Food Sci. 81 H2831–40. [CrossRef]
- Ying X, Agyei D, Udenigwe C, Adhikari B and Wang B 2021 Manufacturing of Plant-Based Bioactive Peptides Using Enzymatic Methods to Meet Health and Sustainability Targets of the Sustainable Development Goals Front. Sustain. Food Syst. 5. [CrossRef]
- RUIZ-RUIZ J, DÁVILA-ORTÍZ G, CHEL-GUERRERO L and BETANCUR-ANCONA D 2013 ANGIOTENSIN I-CONVERTING ENZYME INHIBITORY AND ANTIOXIDANT PEPTIDE FRACTIONS FROM HARD-TO-COOK BEAN ENZYMATIC HYDROLYSATES J. Food Biochem. 37 26–35.
- Zhuang H, Tang N and Yuan Y 2013 Purification and identification of antioxidant peptides from corn gluten meal J. Funct. Foods 5 1810–21. [CrossRef]
- Ndiaye F, Vuong T, Duarte J, Aluko R E and Matar C 2012 Anti-oxidant, anti-inflammatory and immunomodulating properties of an enzymatic protein hydrolysate from yellow field pea seeds Eur. J. Nutr. 51 29–37. [CrossRef]
- Kim S E, Kim H H, Kim J Y, Kang Y I, Woo H J and Lee H J 2000 Anticancer activity of hydrophobic peptides from soy proteins BioFactors 12 151–5. [CrossRef]
- Li J-T, Zhang J-L, He H, Ma Z-L, Nie Z-K, Wang Z-Z and Xu X-G 2013 Apoptosis in human hepatoma HepG2 cells induced by corn peptides and its anti-tumor efficacy in H22 tumor bearing mice Food Chem. Toxicol. 51 297–305. [CrossRef]
- Wu W, Zhang M, Sun C, Brennan M, Li H, Wang G, Lai F and Wu H 2016 Enzymatic preparation of immunomodulatory hydrolysates from defatted wheat germ (Triticum Vulgare) globulin Int. J. Food Sci. Technol. 51 2556–66. [CrossRef]
- Katayama S, Corpuz H M and Nakamura S 2021 Potential of plant-derived peptides for the improvement of memory and cognitive function Peptides 142 170571. [CrossRef]
- Wang S, Zhao M, Fan H and Wu J 2022 Emerging proteins as precursors of bioactive peptides/hydrolysates with health benefits Curr. Opin. Food Sci. 48 100914. [CrossRef]
- Regazzo D, Mollé D, Gabai G, Tomé D, Dupont D, Leonil J and Boutrou R 2010 The (193–209) 17-residues peptide of bovine β-casein is transported through Caco-2 monolayer Mol. Nutr. Food Res. 54 1428–35.
- Grootaert C, Jacobs G, Matthijs B, Pitart J, Baggerman G, Possemiers S, Van der Saag H, Smagghe G, Van Camp J and Voorspoels S 2017 Quantification of egg ovalbumin hydrolysate-derived anti-hypertensive peptides in an in vitro model combining luminal digestion with intestinal Caco-2 cell transport Food Res. Int. 99 531–41. [CrossRef]
- Kong S, Zhang Y H and Zhang W 2018 Regulation of Intestinal Epithelial Cells Properties and Functions by Amino Acids ed S Ishihara BioMed Res. Int. 2018 2819154.
- Takeda J, Park H-Y, Kunitake Y, Yoshiura K and Matsui T 2013 Theaflavins, dimeric catechins, inhibit peptide transport across Caco-2 cell monolayers via down-regulation of AMP-activated protein kinase-mediated peptide transporter PEPT1 Food Chem. 138 2140–5. [CrossRef]
- Wang C-Y, Liu S, Xie X-N and Tan Z-R 2017 Regulation profile of the intestinal peptide transporter 1 (PepT1) Drug Des. Devel. Ther. Volume 11 3511–7.
- Ozorio L, Mellinger-Silva C, Cabral L M, Jardin J, Boudry G and Dupont D 2020 The influence of peptidases in intestinal brush border membranes on the absorption of oligopeptides from whey protein hydrolysate: An ex vivo study using an ussing chamber Foods 9 1415.
- Xu Q, Hong H, Wu J and Yan X 2019 Bioavailability of bioactive peptides derived from food proteins across the intestinal epithelial membrane: A review Trends Food Sci. Technol. 86 399–411.
- Castro P, Madureira R, Sarmento B and Pintado M 2016 Tissue-based in vitro and ex vivo models for buccal permeability studies Concepts and models for drug permeability studies (Elsevier) pp 189–202.
- Vermeirssen V, Camp J V and Verstraete W 2004 Bioavailability of angiotensin I converting enzyme inhibitory peptides Br. J. Nutr. 92 357–66. [CrossRef]
- Deacon C F, Nauck M A, Toft-Nielsen M, Pridal L, Willms B and Holst J J 1995 Both subcutaneously and intravenously administered glucagon-like peptide I are rapidly degraded from the NH2-terminus in type II diabetic patients and in healthy subjects Diabetes 44 1126–31.
- Shimizu M, Tsunogai M and Arai S 1997 Transepithelial Transport of Oligopeptides in the Human Intestinal Cell, Caco-2 Peptides 18 681–7.
- Adibi S 1976 Intestinal phase of protein assimilation in man Am. J. Clin. Nutr. 29 205–15. [CrossRef]
- Chabance B, Marteau P, Rambaud J C, Migliore-Samour D, Boynard M, Perrotin P, Guillet R, Jollès P and Fiat A M 1998 Casein peptide release and passage to the blood in humans during digestion of milk or yogurt Biochimie 80 155–65. [CrossRef]
- Lambers T T, Gloerich J, van Hoffen E, Alkema W, Hondmann D H and van Tol E A F 2015 Clustering analyses in peptidomics revealed that peptide profiles of infant formulae are descriptive Food Sci. Nutr. 3 81–90. [CrossRef]
- Corrochano A R, Cal R, Kennedy K, Wall A, Murphy N, Trajkovic S, O’Callaghan S, Adelfio A and Khaldi N 2021 Characterising the efficacy and bioavailability of bioactive peptides identified for attenuating muscle atrophy within a Vicia faba-derived functional ingredient Curr. Res. Food Sci. 4 224–32. [CrossRef]
- Dallas D C, Guerrero A, Parker E A, Robinson R C, Gan J, German J B, Barile D and Lebrilla C B 2015 Current peptidomics: Applications, purification, identification, quantification, and functional analysis Proteomics 15 1026–38.
- Arnold S L, Stevison F and Isoherranen N 2016 Impact of Sample Matrix on Accuracy of Peptide Quantification: Assessment of Calibrator and Internal Standard Selection and Method Validation Anal. Chem. 88 746–53. [CrossRef]
- Arnold S Sample matrix has a major impact on accuracy of peptide quantification: Assessment of calibrator and internal standard selection and method validation.
- Warwood S, Byron A, Humphries M J and Knight D 2013 The effect of peptide adsorption on signal linearity and a simple approach to improve reliability of quantification J. Proteomics 85 160–4. [CrossRef]
- Wei A Systematical Analysis of Tryptic Peptide Identification with Reverse Phase Liquid Chromatography and Electrospray Ion Trap Mass Spectrometry.
- Chauhan S Using Peptidomics and Machine Learning to Assess Effects of Drying Processes on the Peptide Profile within a Functional Ingredient.
- Foreman R E, George A L, Reimann F, Gribble F M and Kay R G 2021 Peptidomics: A Review of Clinical Applications and Methodologies J. Proteome Res. 20 3782–97. [CrossRef]
- van der Kloet F M, Bobeldijk I, Verheij E R and Jellema R H 2009 Analytical Error Reduction Using Single Point Calibration for Accurate and Precise Metabolomic Phenotyping J. Proteome Res. 8 5132–41. [CrossRef]
- Mesmin C, Dubois M, Becher F, Fenaille F and Ezan E 2010 Liquid chromatography/tandem mass spectrometry assay for the absolute quantification of the expected circulating apelin peptides in human plasma Rapid Commun. Mass Spectrom. 24 2875–84.
- Kandi S, Savaryn J P, Ji Q C and Jenkins G J 2022 Use of in-sample calibration curve approach for quantification of peptides with high-resolution mass spectrometry Rapid Commun. Mass Spectrom. 36 e9377. [CrossRef]
- Rauniyar N 2015 Parallel Reaction Monitoring: A Targeted Experiment Performed Using High Resolution and High Mass Accuracy Mass Spectrometry Int. J. Mol. Sci. 16 28566–81. [CrossRef]
- Steen H and Mann M 2004 The abc’s (and xyz’s) of peptide sequencing Nat. Rev. Mol. Cell Biol. 5 699–711. [CrossRef]
- Cal R, Davis H, Kerr A, Wall A, Molloy B, Chauhan S, Trajkovic S, Holyer I, Adelfio A and Khaldi N 2020 Preclinical Evaluation of a Food-Derived Functional Ingredient to Address Skeletal Muscle Atrophy Nutrients 12 2274. [CrossRef]
- MacLean B, Tomazela D M, Shulman N, Chambers M, Finney G L, Frewen B, Kern R, Tabb D L, Liebler D C and MacCoss M J 2010 Skyline: an open source document editor for creating and analyzing targeted proteomics experiments Bioinforma. Oxf. Engl. 26 966–8.
- Pino L K, Searle B C, Bollinger J G, Nunn B, MacLean B and MacCoss M J 2020 The Skyline ecosystem: Informatics for quantitative mass spectrometry proteomics Mass Spectrom. Rev. 39 229–44. [CrossRef]
- Krieger J, Xin L and Shan B (Paul) 2020 Multi-User, High-Throughput PEAKS Online Workflow, for large scale DIA and DDA Proteomic Analysis J. Biomol. Tech. JBT 31 S22–3.
- Fernández-Costa C, Martínez-Bartolomé S, McClatchy D B, Saviola A J, Yu N-K and Yates J R I 2020 Impact of the Identification Strategy on the Reproducibility of the DDA and DIA Results J. Proteome Res. 19 3153–61.
- Muggeo V M R 2003 Estimating regression models with unknown break-points Stat. Med. 22 3055–71. [CrossRef]
- Muggeo V M R 2008 segmented: an R package to fit regression models with broken-line relationships. R News 8 20–5.
- Gu H, Zhao Y, DeMichele M, Zheng N, Zhang Y J, Pillutla R and Zeng J 2019 In-Sample Calibration Curve Using Multiple Isotopologue Reaction Monitoring of a Stable Isotopically Labeled Analyte for Instant LC-MS/MS Bioanalysis and Quantitative Proteomics Anal. Chem. 91 2536–43. [CrossRef]
- Zheng N, Taylor K, Gu H, Santockyte R, Wang X-T, McCarty J, Adelakun O, Zhang Y J, Pillutla R and Zeng J 2020 Antipeptide Immunocapture with In-Sample Calibration Curve Strategy for Sensitive and Robust LC-MS/MS Bioanalysis of Clinical Protein Biomarkers in Formalin-Fixed Paraffin-Embedded Tumor Tissues Anal. Chem. 92 14713–22. [CrossRef]
- Bateman N W, Goulding S P, Shulman N J, Gadok A K, Szumlinski K K, Maccoss M J and Wu C C 2014 Maximizing Peptide Identification Events in Proteomic Workflows Using Data-Dependent Acquisition (DDA) Mol. Cell. Proteomics 13 329–38. [CrossRef]
- Gillette M A and Carr S A 2013 Quantitative analysis of peptides and proteins in biomedicine by targeted mass spectrometry Nat. Methods 10 28–34.
- Bourmaud A, Gallien S and Domon B 2016 Parallel reaction monitoring using quadrupole-Orbitrap mass spectrometer: Principle and applications PROTEOMICS 16 2146–59. [CrossRef]
- Gallien S, Bourmaud A, Kim S Y and Domon B 2014 Technical considerations for large-scale parallel reaction monitoring analysis Spec. Issue Can Proteomics Fill Gap Genomics Phenotypes 100 147–59. [CrossRef]
- Kimanani E K 1998 Bioanalytical calibration curves: proposal for statistical criteria1Presented at the Analysis and Pharmaceutical Quality Section of the Eleventh Annual American Association of Pharmaceutical Scientists Meeting, October 1996, Seattle, Washington, USA.1 J. Pharm. Biomed. Anal. 16 1117–24.
- Ronsein G E, Pamir N, von Haller P D, Kim D S, Oda M N, Jarvik G P, Vaisar T and Heinecke J W 2015 Parallel reaction monitoring (PRM) and selected reaction monitoring (SRM) exhibit comparable linearity, dynamic range and precision for targeted quantitative HDL proteomics J. Proteomics 113 388–99.
- Nwachukwu I D and Aluko R E 2019 A systematic evaluation of various methods for quantifying food protein hydrolysate peptides Food Chem. 270 25–31. [CrossRef]
- Boersema P J, Raijmakers R, Lemeer S, Mohammed S and Heck A J R 2009 Multiplex peptide stable isotope dimethyl labeling for quantitative proteomics Nat. Protoc. 4 484–94. [CrossRef]
- Greer T, Lietz C B, Xiang F and Li L 2015 Novel isotopic N,N-Dimethyl Leucine (iDiLeu) Reagents Enable Absolute Quantification of Peptides and Proteins Using a Standard Curve Approach J. Am. Soc. Mass Spectrom. 26 107–19.
- DeSouza L V, Taylor A M, Li W, Minkoff M S, Romaschin A D, Colgan T J and Siu K W M 2008 Multiple Reaction Monitoring of mTRAQ-Labeled Peptides Enables Absolute Quantification of Endogenous Levels of a Potential Cancer Marker in Cancerous and Normal Endometrial Tissues J. Proteome Res. 7 3525–34. [CrossRef]
- Zhang S, Wen B, Zhou B, Yang L, Cha C, Xu S, Qiu X, Wang Q, Sun H, Lou X, Zi J, Zhang Y, Lin L and Liu S 2013 Quantitative Analysis of the Human AKR Family Members in Cancer Cell Lines Using the mTRAQ/MRM Approach J. Proteome Res. 12 2022–33. [CrossRef]
- Gilani G S, Xiao C and Lee N 2008 Need for Accurate and Standardized Determination of Amino Acids and Bioactive Peptides for Evaluating Protein Quality and Potential Health Effects of Foods and Dietary Supplements J. AOAC Int. 91 894–900. [CrossRef]
- Rutherfurd-Markwick K J 2012 Food proteins as a source of bioactive peptides with diverse functions Br. J. Nutr. 108 S149–57. [CrossRef]
- Mamone G, Picariello G, Caira S, Addeo F and Ferranti P 2009 Analysis of food proteins and peptides by mass spectrometry-based techniques Adv. Sep. Methods Food Anal. 1216 7130–42. [CrossRef]
- Anon THE 17 GOALS | Sustainable Development.
Figure 1.
Outline of the preparation and analysis of internal calibration curves to quantify a peptide of interest in a food protein hydrolysate.
Figure 1.
Outline of the preparation and analysis of internal calibration curves to quantify a peptide of interest in a food protein hydrolysate.
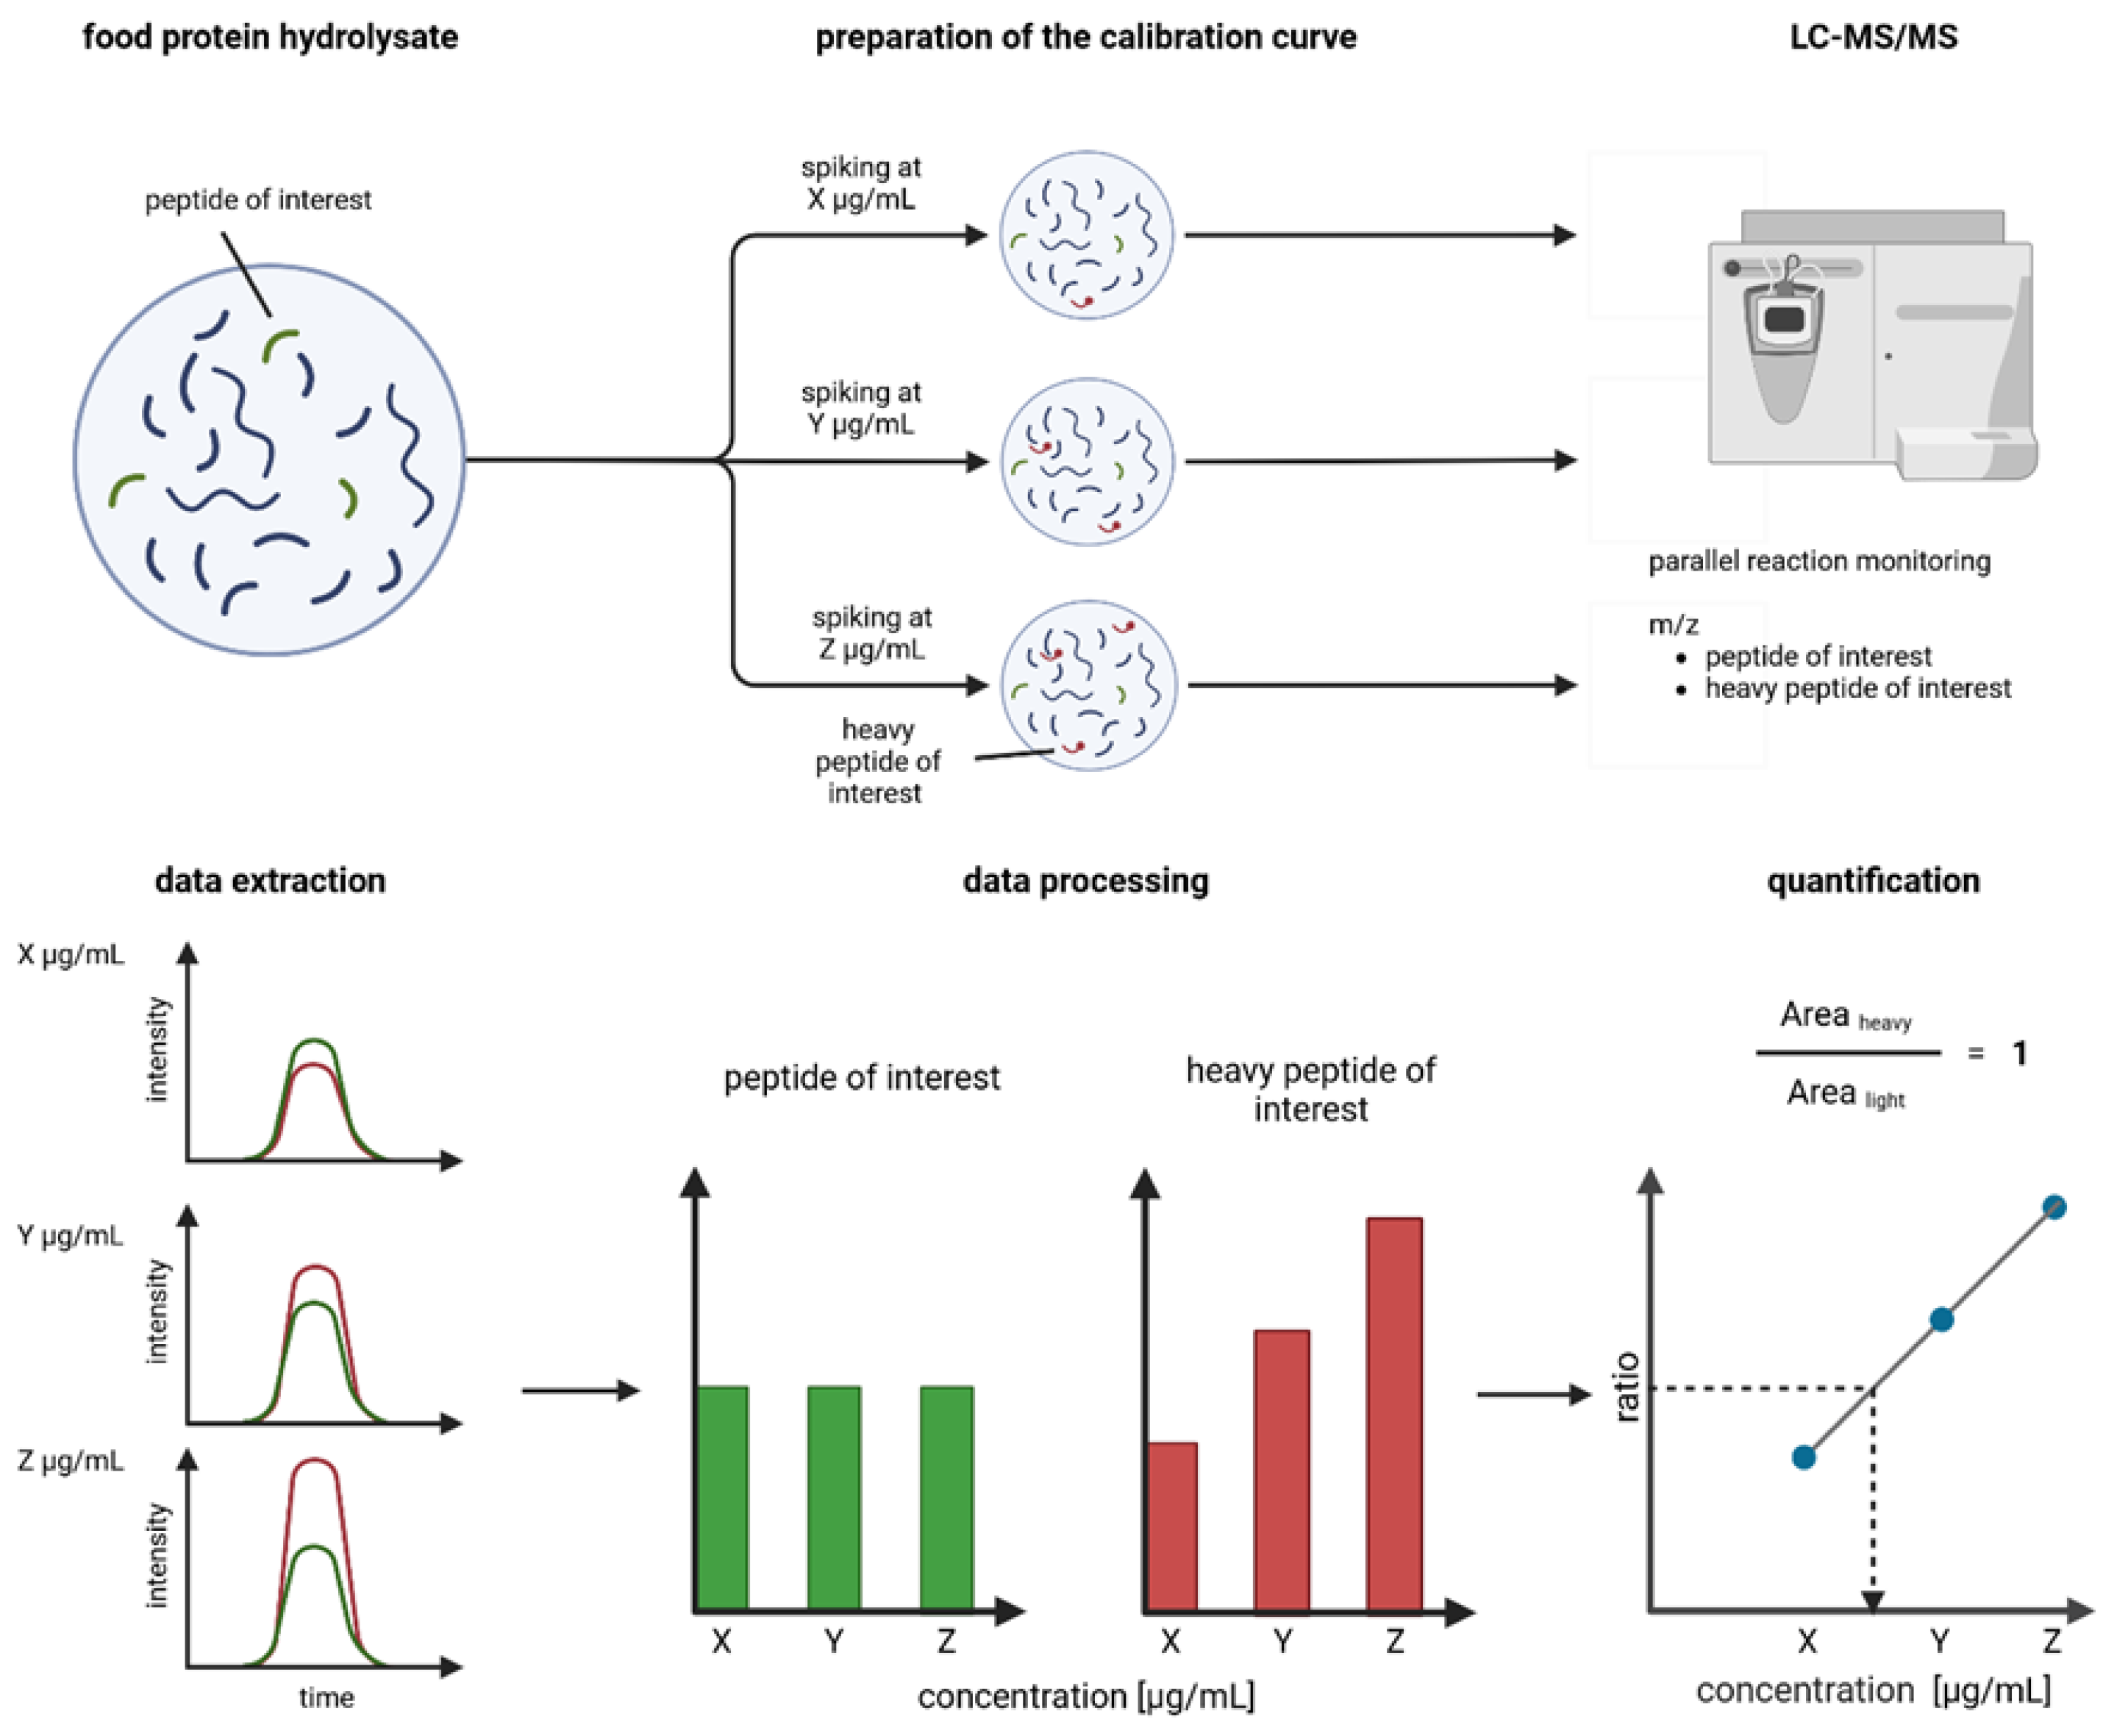
Figure 2.
(A) Building peptide-specific internal calibration curves (refined) from generic calibration curves (broad); (B) Illustration of the observable retention time shift caused by the difference of hydrophobicity between isoleucine and leucine.
Figure 2.
(A) Building peptide-specific internal calibration curves (refined) from generic calibration curves (broad); (B) Illustration of the observable retention time shift caused by the difference of hydrophobicity between isoleucine and leucine.
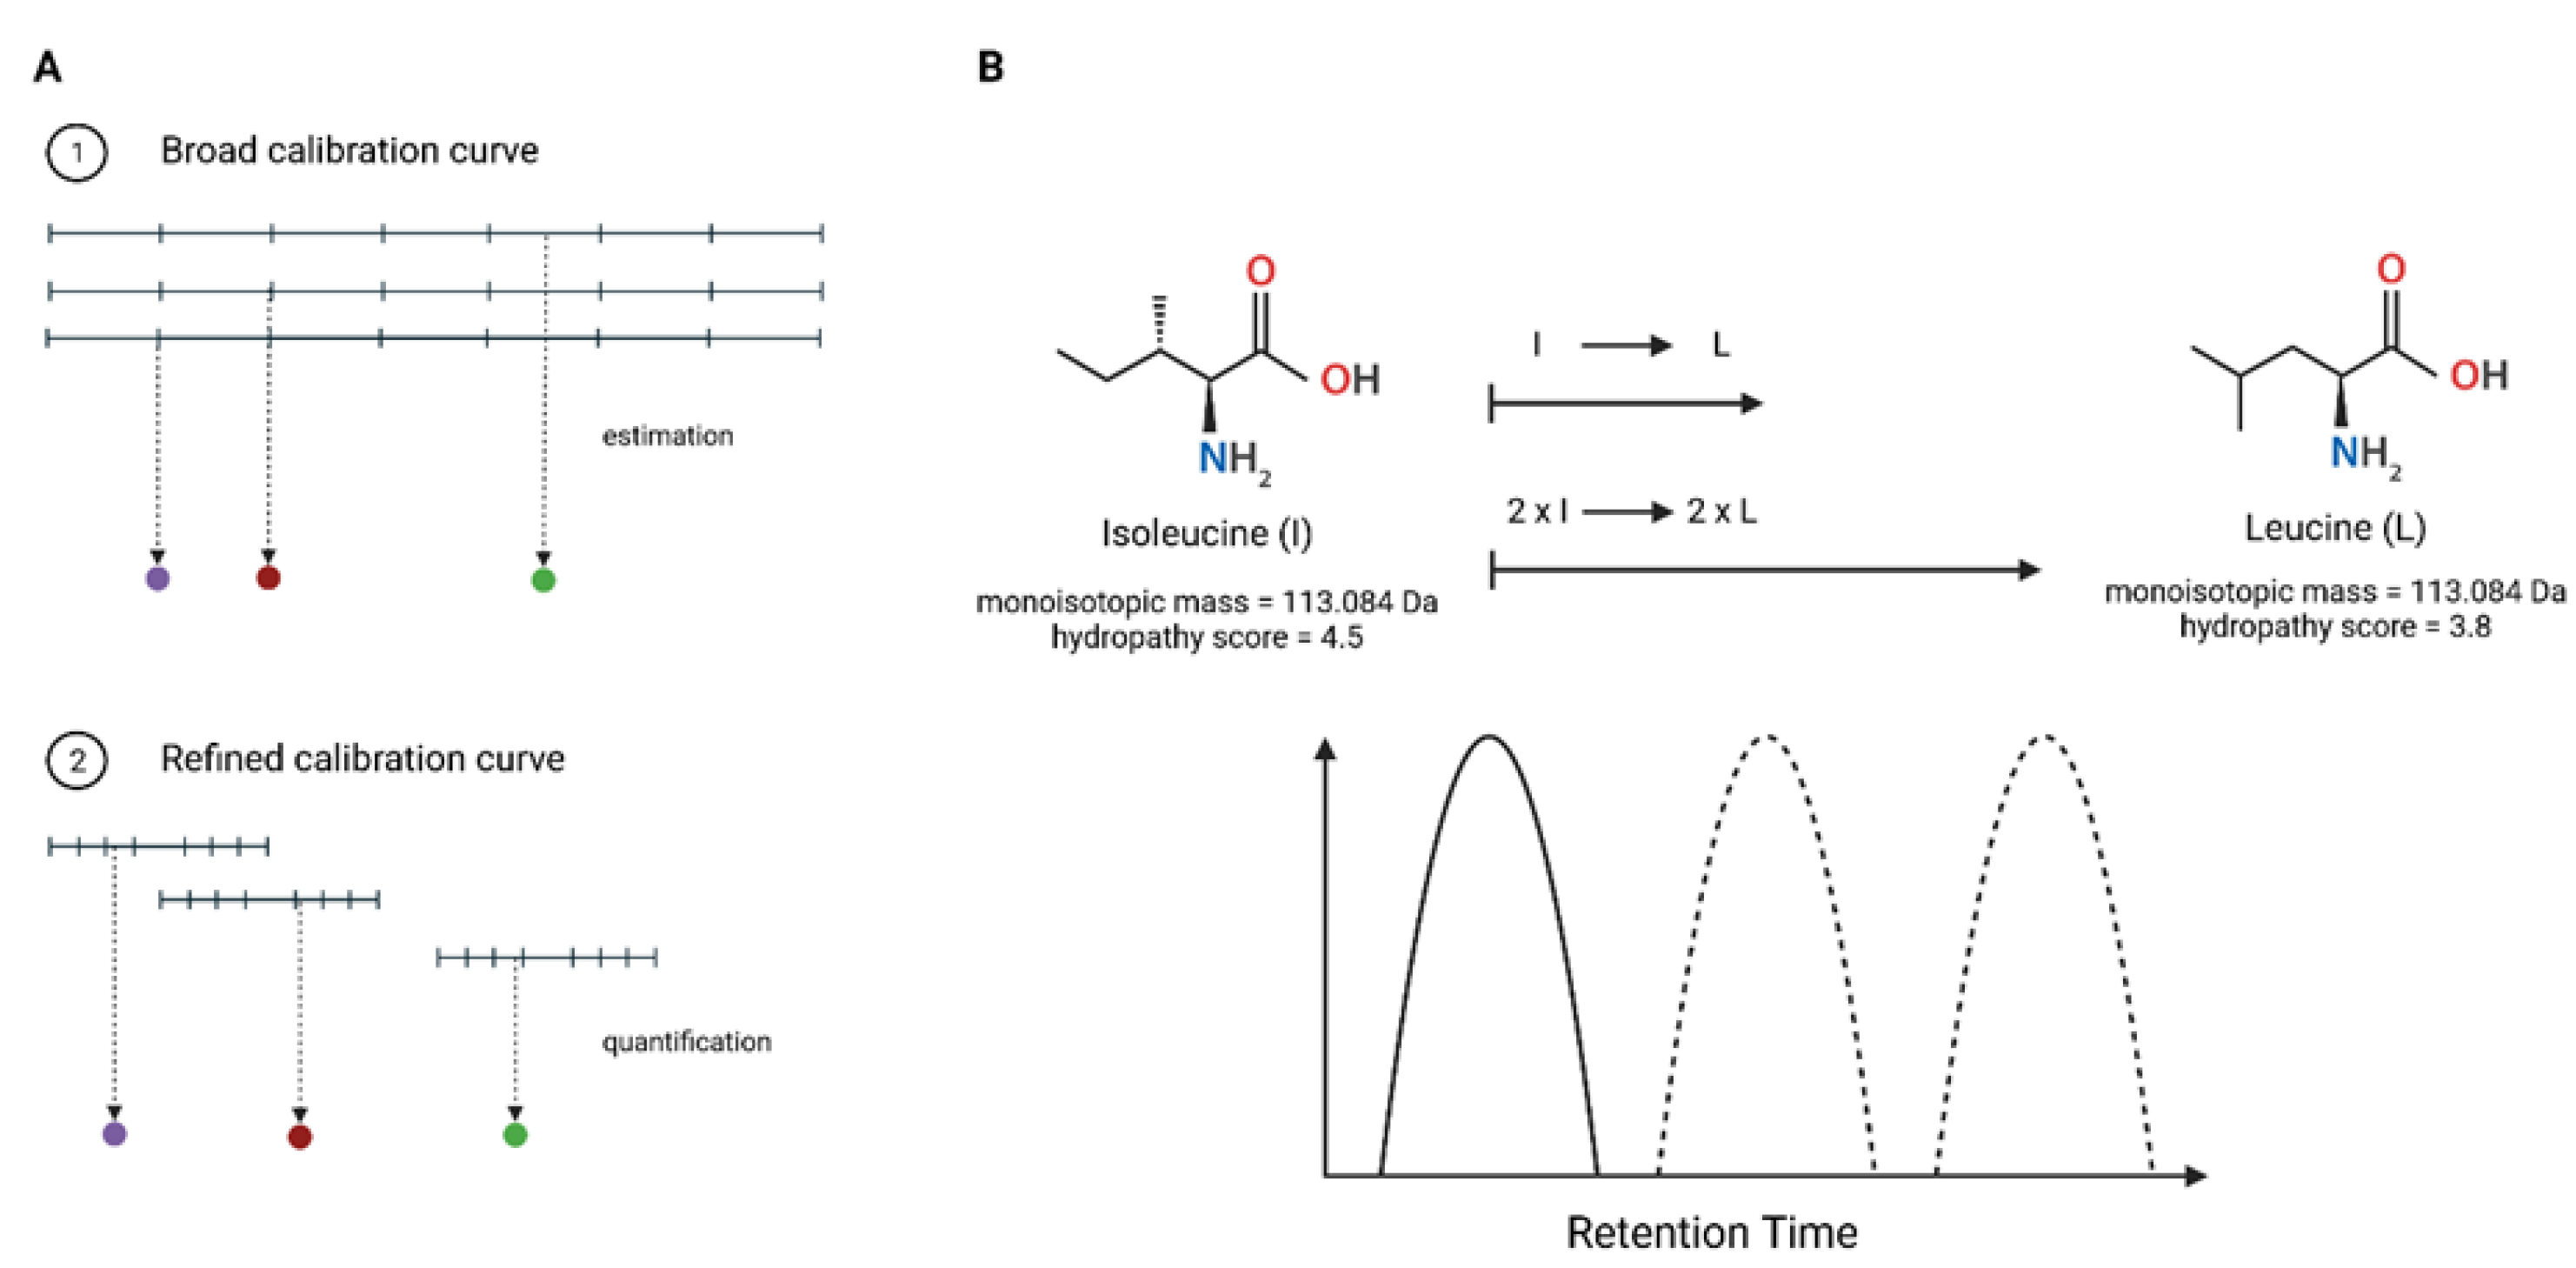
Figure 3.
Peptide sequence validation. (A) Extracted ion chromatogram (XIC) of peptide HLPSYSPSP (blue line) and its spiked heavy-labelled peptide (red line) at three different concentrations (0.003125-0.0125 μg/mL, red line) in food hydrolysate PeptiStrong™; (B) XIC of peptide HLPSYSPSPQ (blue line) and its spiked heavy-labelled peptide (red line) at three different concentrations (0.00125-0.0125 μg/mL, red line) in food hydrolysate PeptiStrong™; (C) XIC of peptide TIKIPAGT (blue line) and its spiked heavy-labelled peptide (red line) at three different concentrations (0.002-0.05 μg/mL, red line) in food hydrolysate PeptiStrong™.
Figure 4.
Mass spectrometry resolves the sequence of isoleucine-leucine isoforms using a heavy labelled peptide. (A) XIC (m/z tolerance = 0.1) analysis for synthetic peptides TIKIPAGT (24.2 min) and TIKLPAGT (22.3 min) with two different peaks for m/z 800.48 at different retention times; (B) Comparison of XIC for light synthetic TIKIPAGT and heavy-labelled TIKIPAGT peptides show two peaks for m/z 800.48 and 808.50, respectively, with the same retention time; (C) Comparison of heavy-labelled TIKIPAGT and synthetic TIKLPAGT peptides shows peaks for m/z 800.48 and 808.50, respectively, at different retention times. The retention times were consistent for each isoform across conditions.
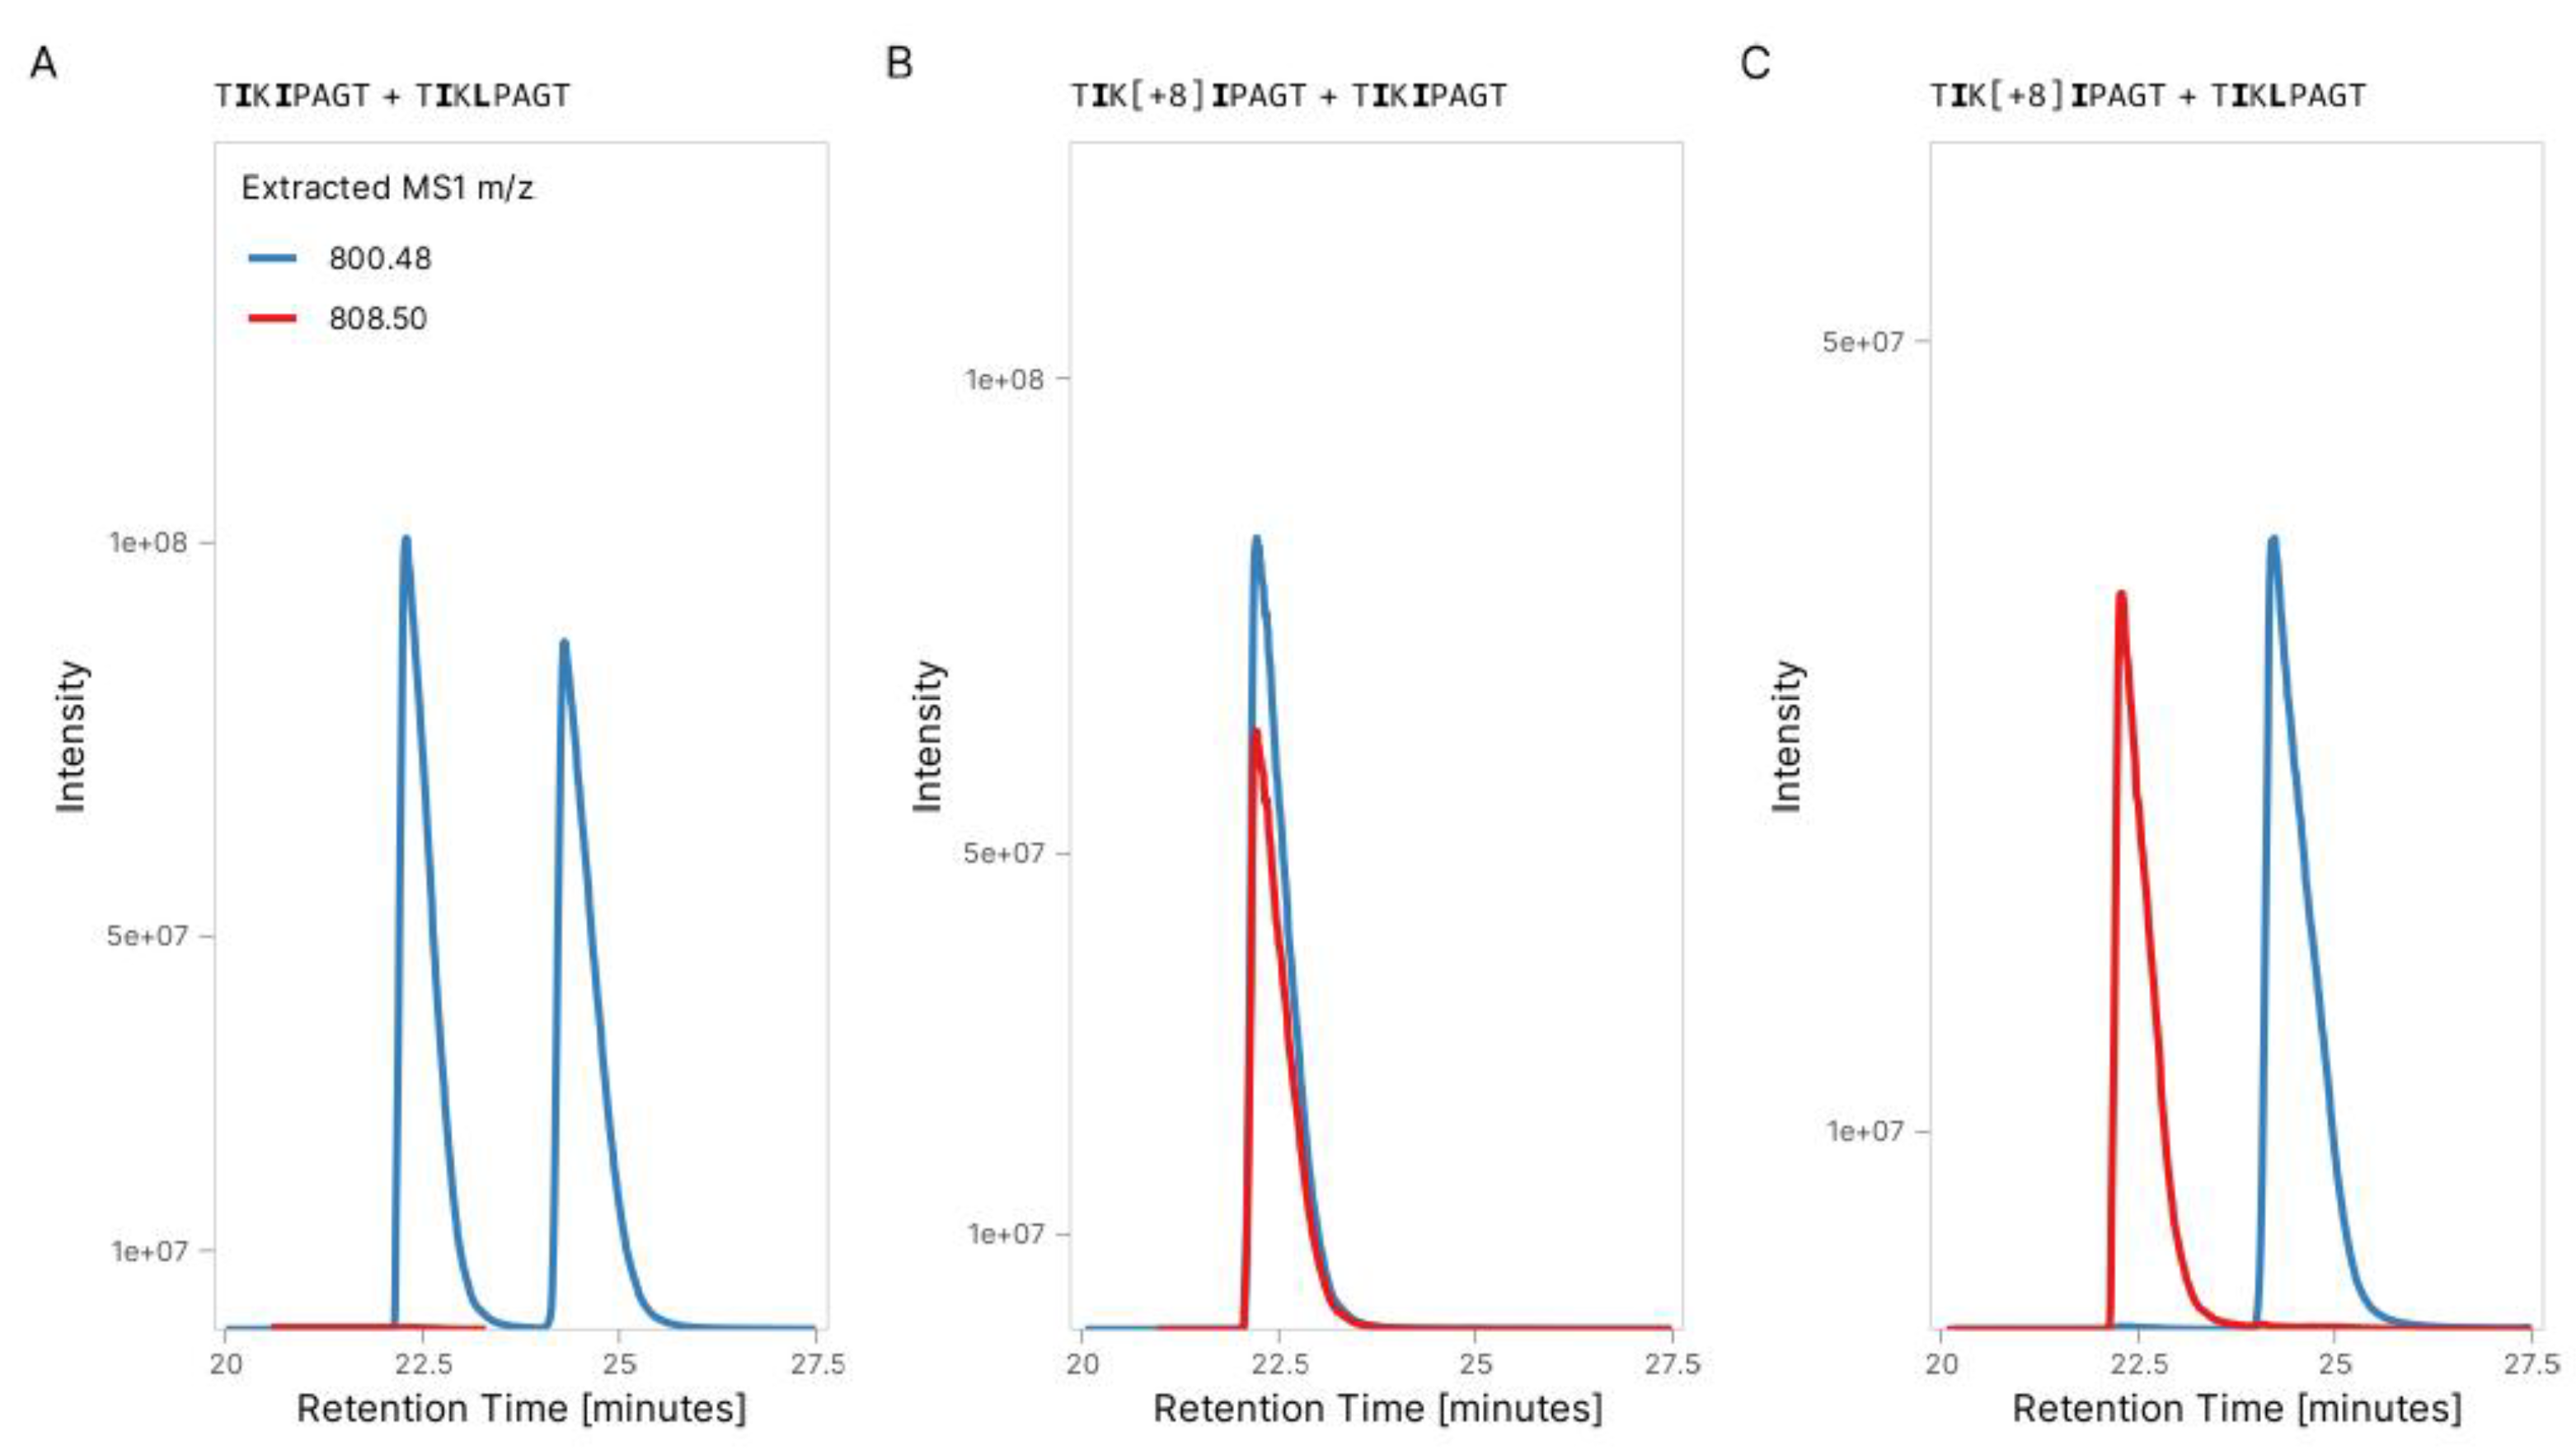
Figure 5.
The peak area of the heavy peptide (A) HLPSYSPSP[+6], (B) HLP[+6]SYSPSPQ, and (C) TIK[+8]IPAGT is plotted against its concentration in PeptiStrong™ hydrolysate matrix. The linear regression is segmented to separate the linear part of the calibration curve versus noise. The vertical dashed line represents this breaking point. The highest concentration is also excluded from the calibration curve due to saturation of the signal observed during the peak integration.
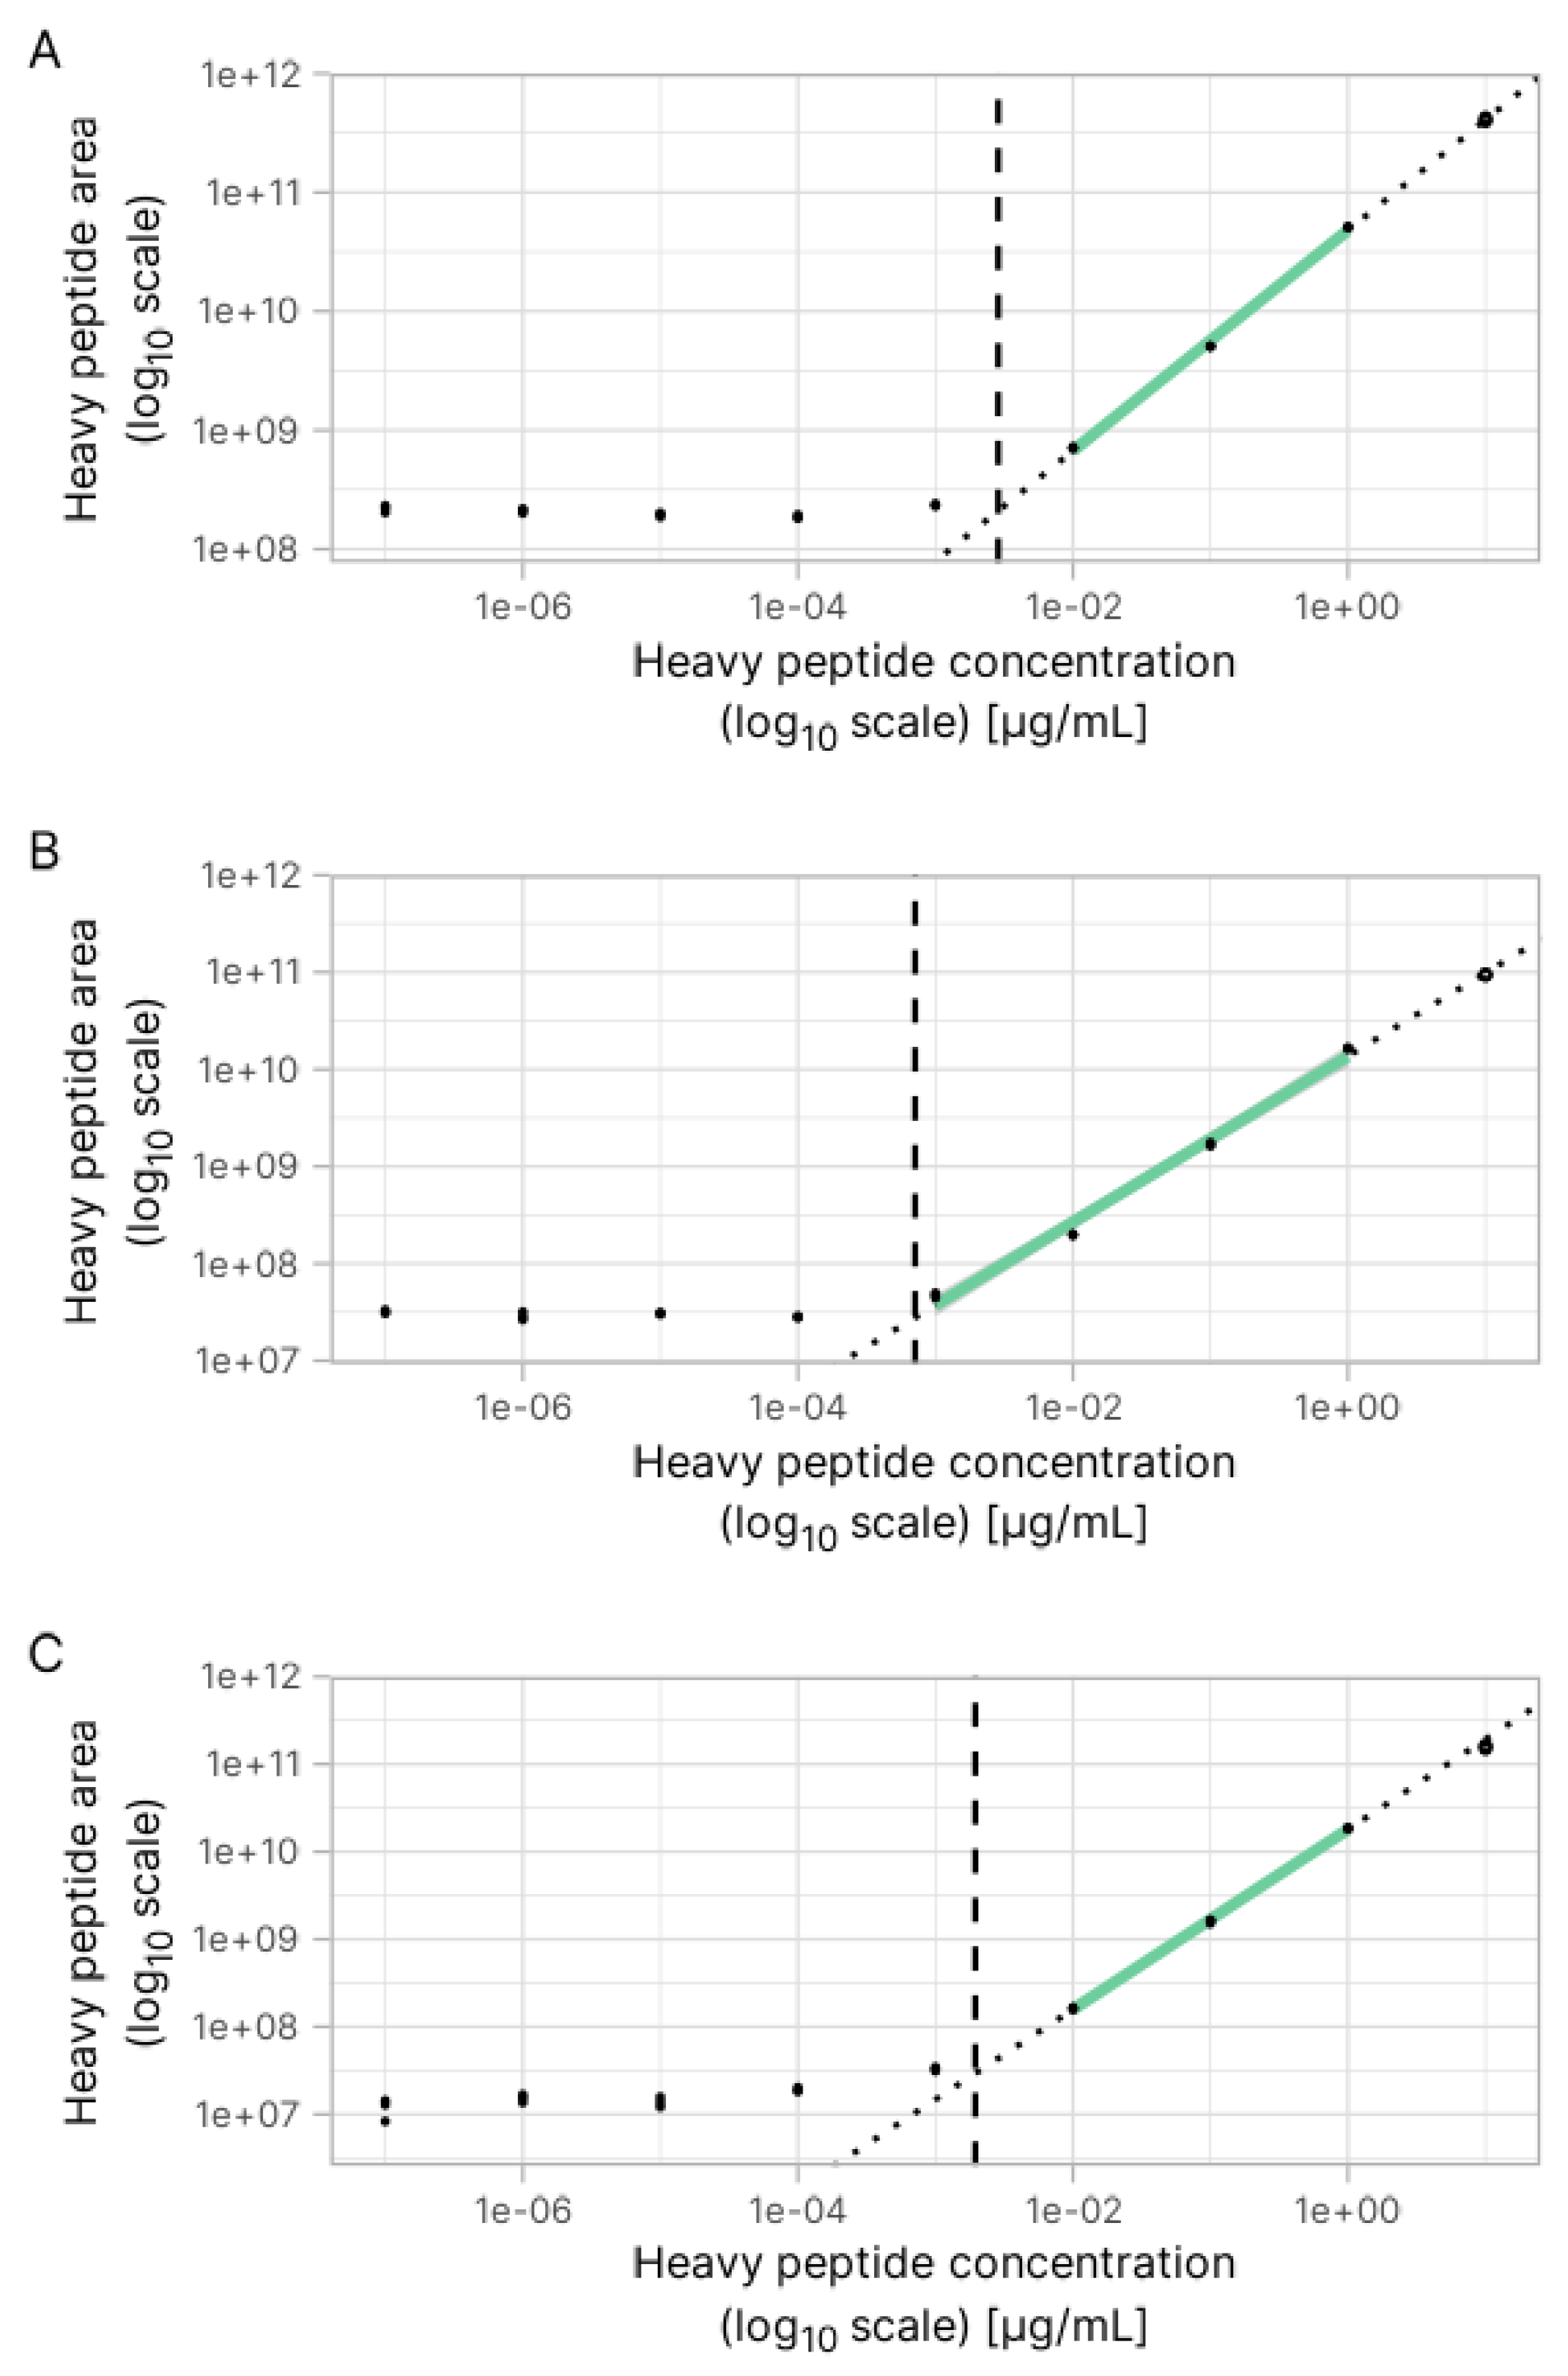
Figure 6.
Absolute quantification of peptides using in-sample calibration curves. (A, C, E) Broad calibration curves for peptides TIKLPAGT, HLPSYSPSPQ and, HLPSYSPSP; (B, D, F) Refined calibration curves for peptides TIKLPAGT, HLPSYSPSPQ and, HLPSYSPSP. Each panel shows the linear regression between heavy peptide concentration and heavy peptide peak area after segmentation between the flat response and the linear response. Points outside of the linear range were manually removed from the calibration curve. The linear regression used for calibration is shown with a solid black line (95% confidence interval). For illustration purposes, the line is continued above and below using a dotted line. The on-column concentration of each peptide is estimated with a ratio of heavy peptide over endogenous peptide of 1, herein shown with a horizontal dotted line.
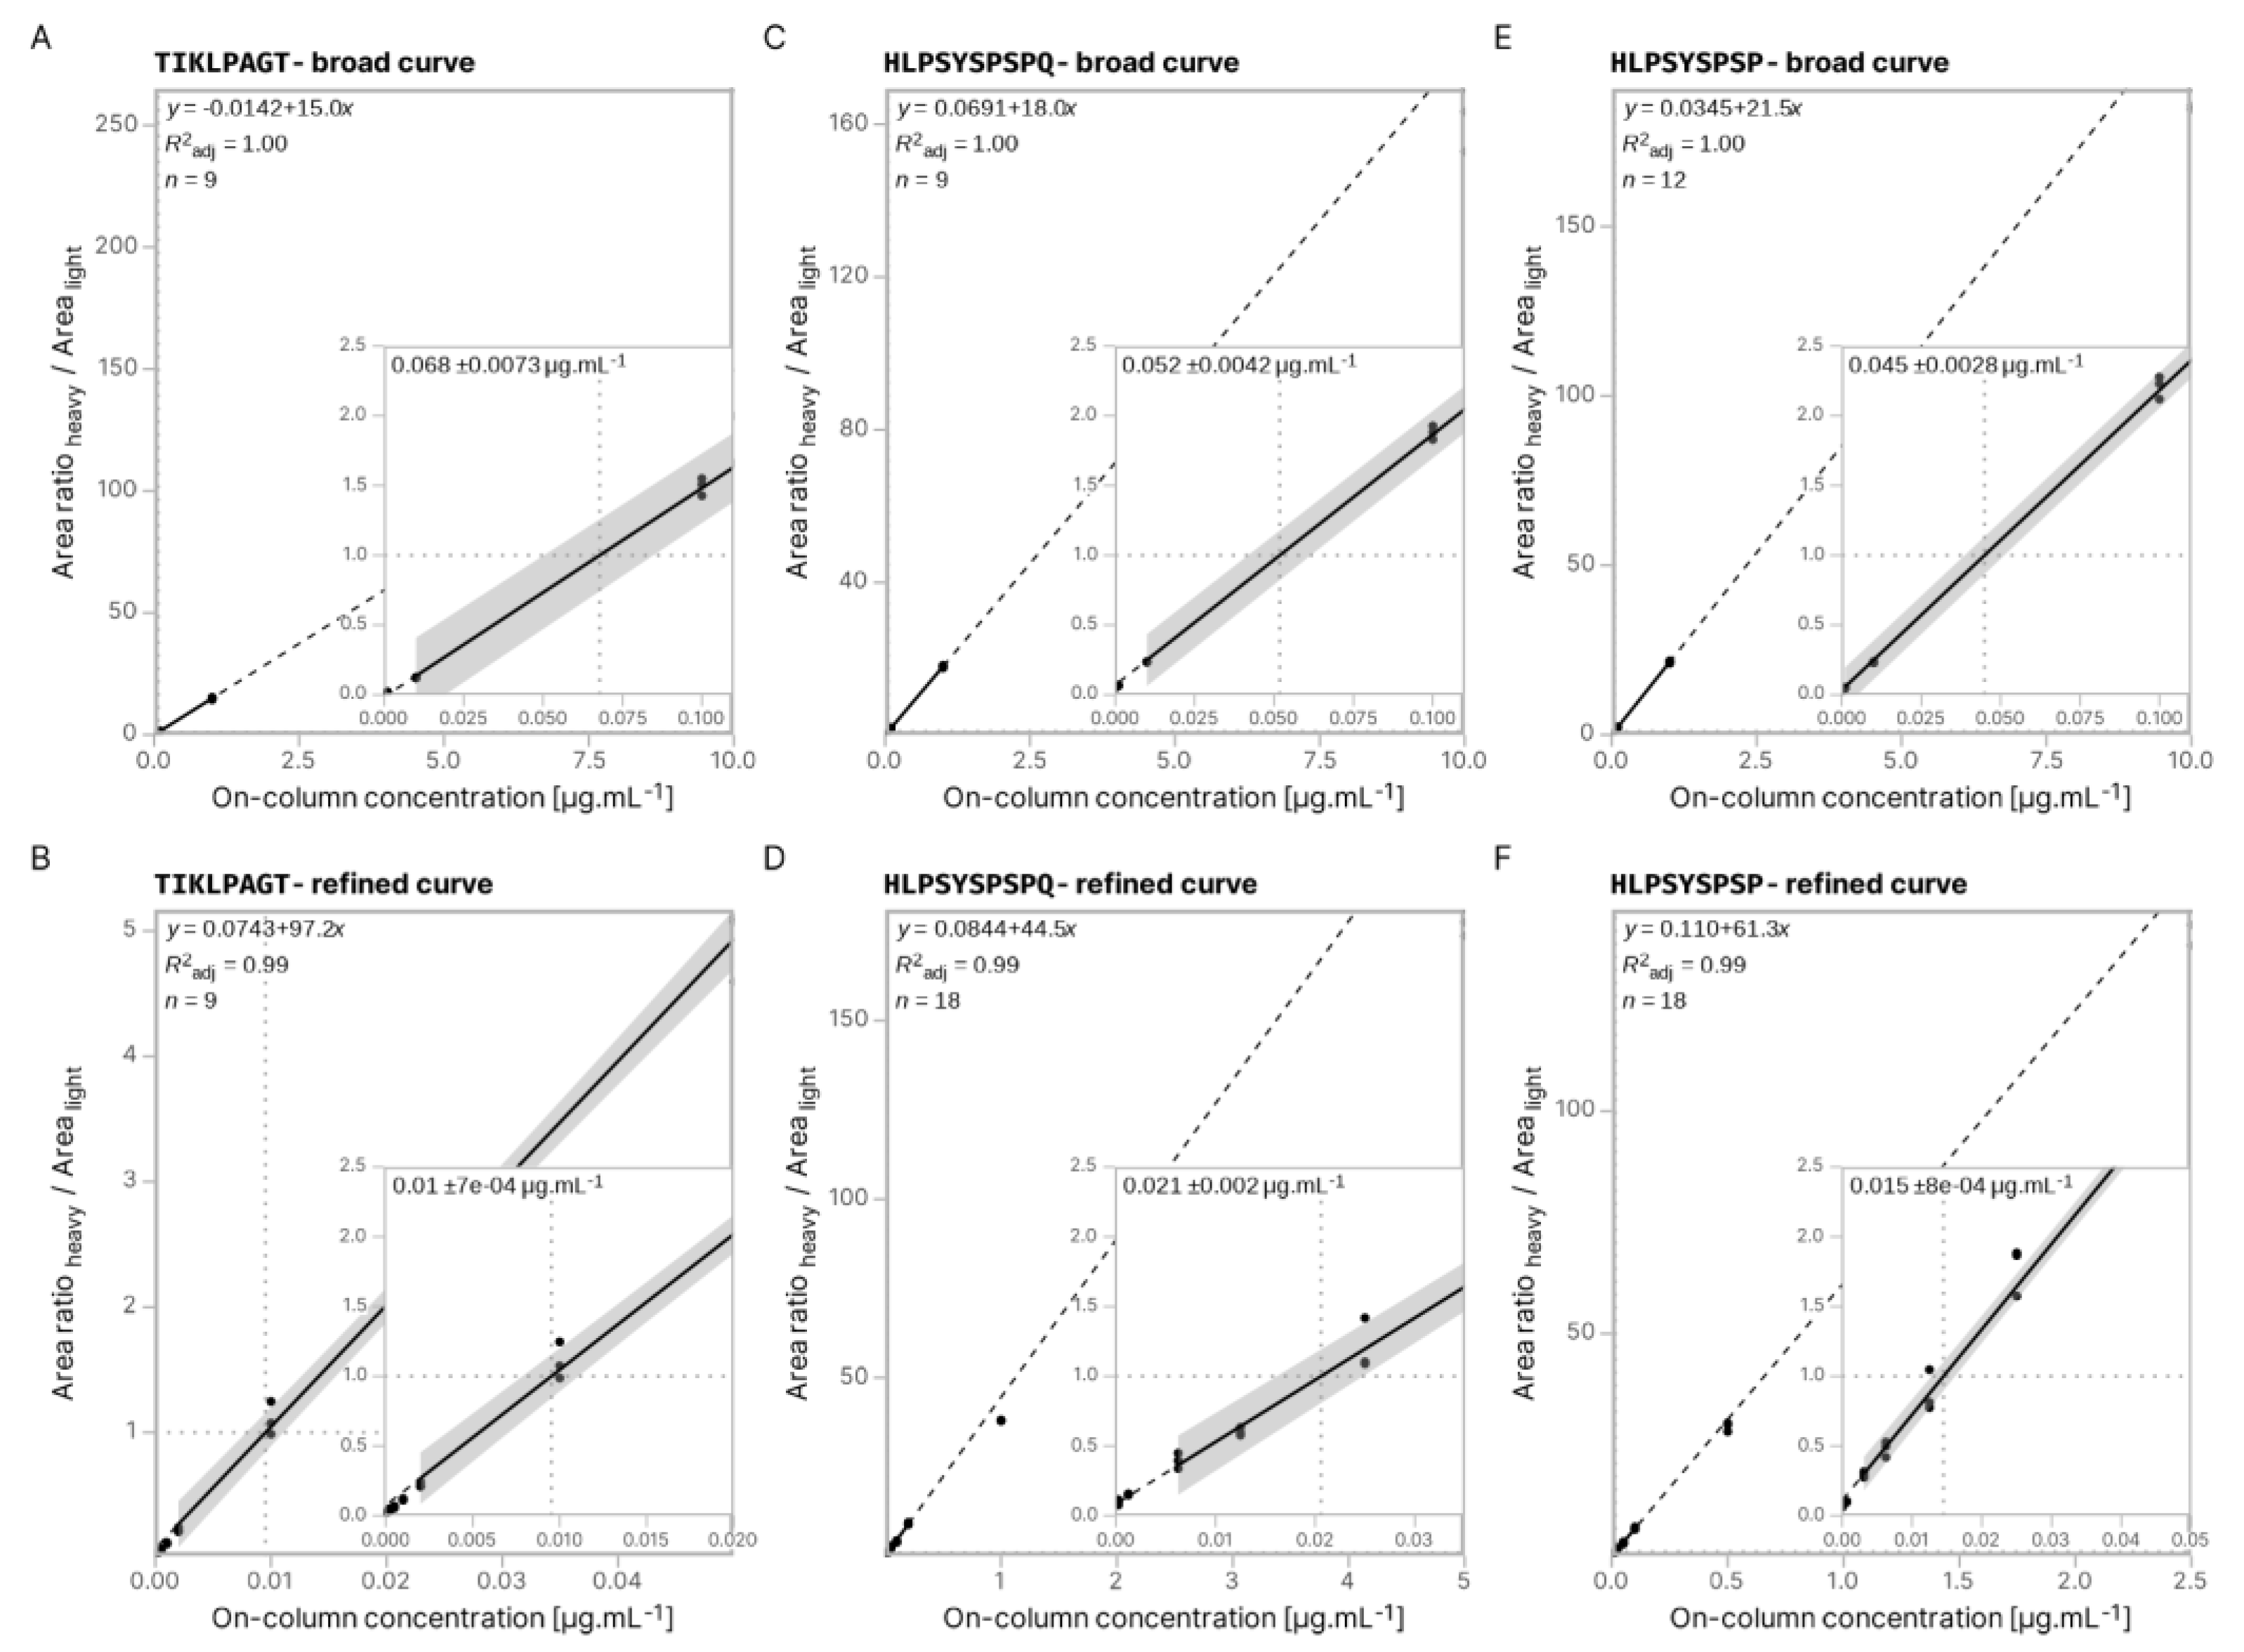

Table 1.
Peptide sequences (using the proforma v2 format) and their molecular weight values used in this work.
Table 1.
Peptide sequences (using the proforma v2 format) and their molecular weight values used in this work.
| Peptide of interest | Spiked internal standard | ||
| Peptide Sequence | Molecular Weight (Da) | Peptide Sequence | Molecular Weight (Da) |
| HLPSYSPSP | 984.4785 | HLPSYSPSP[Label:13C(5)15N(1)] | 990.4923 |
| HLPSYSPSPQ | 1112.5371 | HLP[Label:13C(5)15N(1)]SYSPSPQ | 1118.5509 |
| TIKIPAGT | 800.4876 | TI[Label:13C(6)15N(2)]KIPAGT | 808.4876 |
Disclaimer/Publisher’s Note: The statements, opinions and data contained in all publications are solely those of the individual author(s) and contributor(s) and not of MDPI and/or the editor(s). MDPI and/or the editor(s) disclaim responsibility for any injury to people or property resulting from any ideas, methods, instructions or products referred to in the content. |
© 2025 by the authors. Licensee MDPI, Basel, Switzerland. This article is an open access article distributed under the terms and conditions of the Creative Commons Attribution (CC BY) license (http://creativecommons.org/licenses/by/4.0/).
Copyright: This open access article is published under a Creative Commons CC BY 4.0 license, which permit the free download, distribution, and reuse, provided that the author and preprint are cited in any reuse.


