
Submitted:
23 March 2025
Posted:
24 March 2025
You are already at the latest version
Abstract
Demand for alternative sources of protein ingredients due to increasing population growth, environmental sustainability, and consumer demand is on the rise. However, processes used to generate these new food ingredients must be maximized to ensure a circular economy and a sustainable production system. In this study, the structural and functional properties of faba bean protein isolate and recovered fractions were investigated. Three different protein fractions were recovered with varying protein purities (35–89 %) using different pH conditions of protein fractions. Electrophoresis revealed major differences in protein distribution for protein isolate and recovered protein fractions. Additional FTIR analysis confirmed qualitative screening and differentiation of the different protein fractions based on protein amide regions and fingerprint regions. Faba bean protein isolates and the recovered fraction showed different functional properties with poor water-holding capacity for the albumin fraction. The application of discarded albumin fractions in food applications could improve resource efficiency.
Keywords:
Faba beans
; protein recovery
; FTIR
; functional properties
; extraction
Introduction
The global population is projected to grow by 40% by 2050, reaching around 10 billion people. However, currently, about 1 billion individuals are facing food insecurity [1]. Ironically, approximately 1.3 billion tons of food are wasted annually, leading to a carbon footprint of 3.3 billion tons of CO2 equivalents and the loss of significant quantities of water [2,3]. With a growing population, global food processing systems must expand and adapt as natural resources are becoming more scarce, unless effective mitigation strategies are implemented [4].
Sustainable and cost-effective food production is a crucial challenge in tackling this pressing issue. Both industrial and academic professionals bear significant responsibility in managing and developing innovative methodologies to this emerging trend. Biological conversion, extraction, and purification of valuable compounds from food byproducts are crucial for achieving “zero waste” in food production systems [5]. Utilizing pulses and legumes as a protein source reduces the escalating greenhouse gas emissions associated with animal-based protein sources like meat, dairy based products, and eggs [6]. Moreover, the requirement of water and energy input for the production of plant-based proteins are much lower in comparison with animal-based proteins [7]. In protein production and purification processes, circularity and sustainability are rarely prioritized [8,9].
While the application of purified ingredients is justified in specialised applications, such as infant formula and nutritional beverages, to ensure consistency and predictable processing behaviour, these ingredients are frequently recombined with other purified components in many formulations. A sustainable approach may involve utilizing minimally processed ingredients that naturally contain diverse techno-functional biomolecules, including proteins, fibre, and lipids. This strategy presents a promising means to reduce the environmental footprint of food production [10], particularly when derived from food processing side streams, which are generated in substantial quantities. Most recent studies investigating different types of faba bean protein have primarily focused on protein concentrates (~60% protein) [11] or protein isolates (80–92.2% protein) [12,13]. Despite the use of sustainable pulses in industrial processes to generate variety of protein ingredients, that result in significant generation of by-products which containing valuable compounds [14,15]. To achieve a more sustainable food production system, the valorization of processing side streams is crucial, requiring prior assessment of their potential applications in food systems. The recovery and application of such valuable compounds from protein extraction side streams could create novel ingredients with economic opportunities, and applications spanning the food, pharmaceutical, and cosmetic industries. Additionally, repurposing waste into value-added products may generate new revenue streams, contributing to economic growth.
Thus, to establish a circular economy, the utilization of side-stream biomass necessitates exploration of production stages which manage unavoidable food waste and evaluate their potential applications. This article explores the conventional extraction process of isolates from faba beans as well as recovered proteins from side streams following different process conditions. Mass balance was carried out to track protein levels at all stages. The selection and control of extraction conditions was evaluated based on their effectiveness in maximizing protein recovery whilst preserving structural integrity. Extraction efficiency can be evaluated by assessing protein purity and yield, alongside monitoring structural modifications occurring throughout the process.
Materials and Methods
Raw Materials and Chemicals
Faba beans were purchased from Whole Foods Earth (Kent, United Kingdom). NaOH, ((≥ 99.9% pure), β-mercaptoethanol, phosphate-buffered saline (PBS) and HCI were purchased from Sigma-Aldrich (United Kingdom).
Alkaline Isoelectric Precipitation of Faba Bean Protein Isolate
The preparation of faba bean isolate followed the standard protocol described by Sheikh et al., 2023; Shen et al., (2017), with modifications. Whole faba bean grains were dehulled and subsequently milled into flour using a laboratory-scale cyclone mill (Retsch, Twister) equipped with a 0.5mm sieve. The particle size distribution of the milled flour was analysed in replicates using a Mastersizer 3000 laser scattering particle size analyzer (Malvern, UK) with a dry sampling system [18].
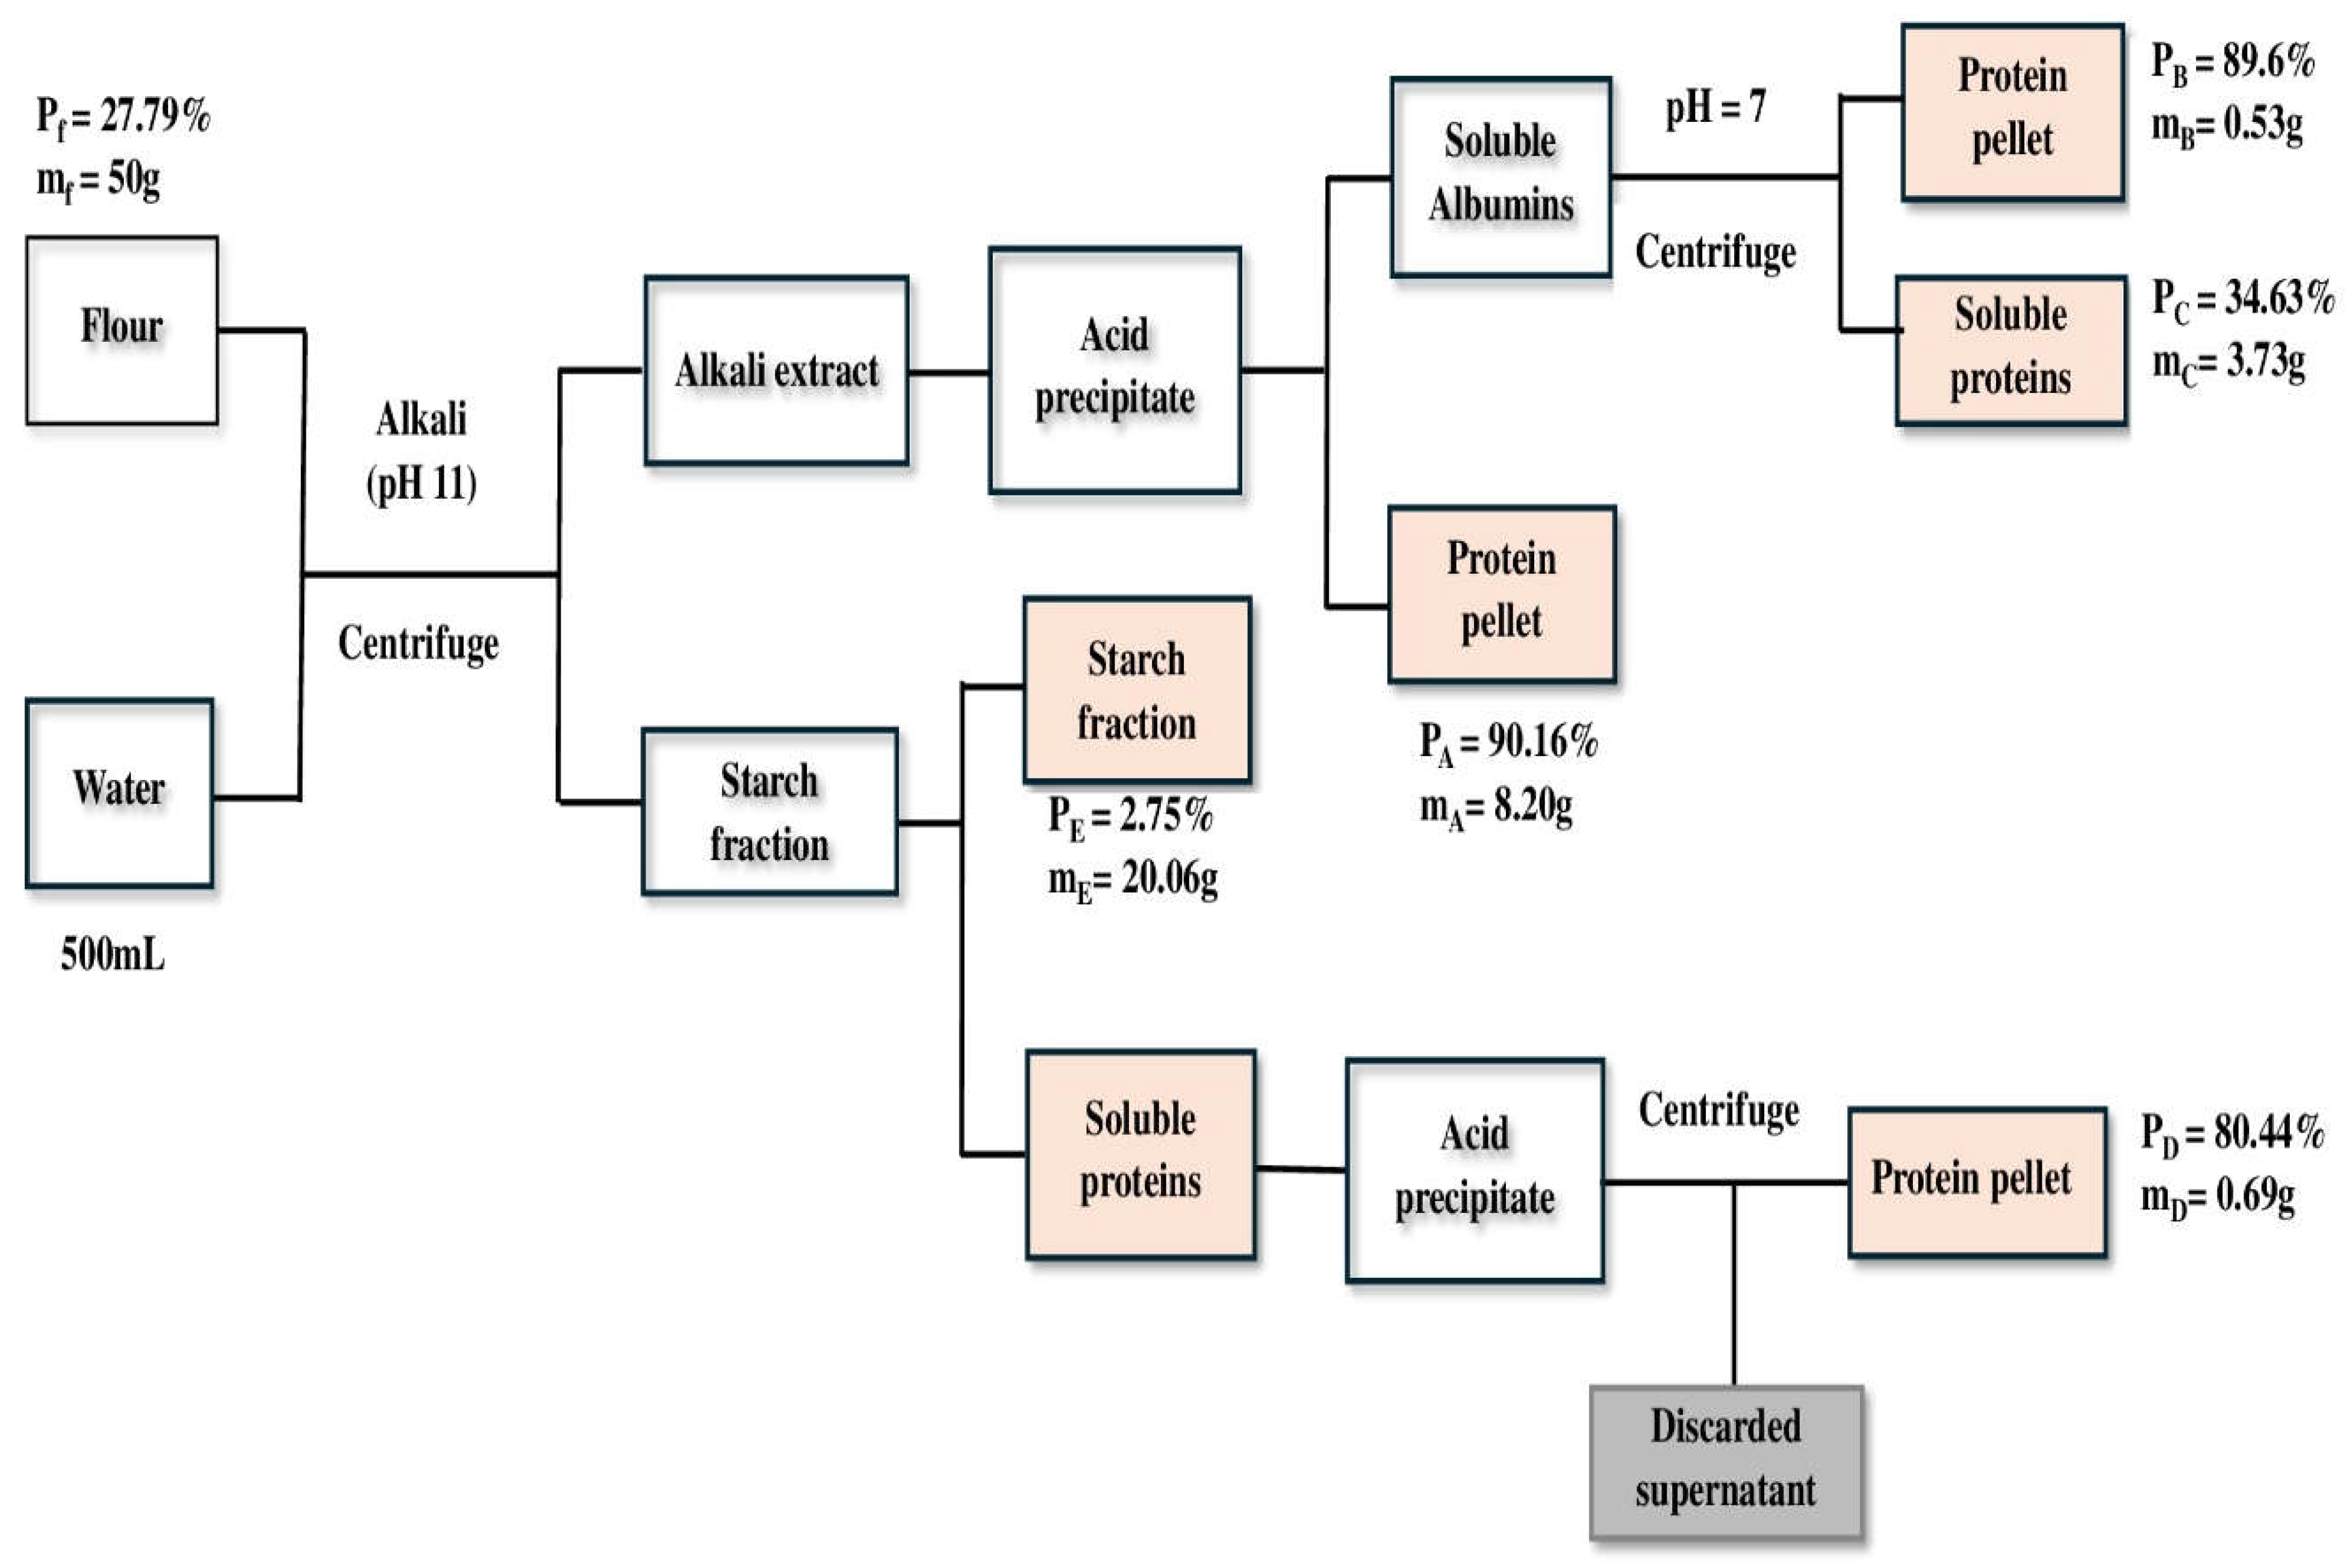
Faba bean Protein Isolate (FBPI) was prepared as follows: 50g flour was dissolved in 500mL water (1:10w/v). For alkaline solubilization, the suspension was stirred at 400 rpm using a magnetic stirrer for 20min and adjusted to pH 11 using 1M NaOH. The mixture was centrifuged at 6,000 rpm for 20min at 25°C. After centrifugation, the supernatant was collected and adjusted to pH 4.0, using 1M HCI while stirring for 30 min. Protein isolates were extracted by centrifugation at 6,000rpm for 20min at 25°C. The precipitated isolates were freeze-dried for 48h, and the resulting protein was stored at −20°C. Proteins in side streams from starch fraction and isoelectric precipitation were further isolated using different pH. Detailed process of protein isolation process and conditions is shown in Figure 1.
Protein Content and Extraction Yield
Protein content of the extracted protein isolates and side stream was determined using the Elementar Dumas system (Elemental, UK, Ltd). A factor of 6.25 was used for the conversion of nitrogen content into protein content. The extraction yield was calculated by dividing the weight of the protein isolate obtained by the initial weight of measured faba bean flour, as given in Equation (1).
The mass of the protein product and starting flour samples are denoted by mi and ms, respectively, while protein content of protein product, and flour is represented by pi and ps respectively.
The mass of the protein product and supernatant was determined after the centrifugation step, following extraction this was to identify which step proteins are lost and recovered. The protein content of the supernatant and the pellet was measured. The protein of the faba bean flour is either extracted into the supernatant or stays in the plant cell and lost in the pellet. If extraction is incomplete, residual proteins are found in the discarded supernatant or starch pellet.
As shown in Figure 1, the recovered proteins are represented by B, C, D and E (loss to starch fraction) in all extraction methods. Thus, the protein in the pellet recovered or lost during each step is shown in equation (3).
The loss (L) or recovered (R) protein in percentage relative to the amount of protein in the faba bean flour was calculated according to equation (4)
A mass balance was conducted from the protein content and protein recovery data for all different fractions as follows:
mfpf= mApA+ mBpB + mCpC + mDpD + mEpE
The sum of all fractions should equate 100%.
Qualitative Analysis of Proteins Using Electrophoresis (SDS-PAGE)
As per Laemmli, (1970), with some modifications, electrophoresis was carried out on SDS-PAGE in a reducing solution of β-mercaptoethanol. 50mg protein powders were dissolved in 10mL of PBS buffer (0.01M, pH 7) and shaken at 200rpm for 2hr at room temperature. 10μL protein solutions were dissolved, vortexed with 10μL loading buffer (reducing solution containing 10% 2-mercaptoethanol). The samples were heated for 4min at 95°C, cooled, and centrifuged at 13300xg for 3min. An aliquot was injected into the pocket of the Bio-Rad 4% acrylamide stacking gel and 20% acrylamide was used to separate the Precast Gels. DC separation at a current of 25mA was performed for one hour at a voltage of 200V for 35mins. SDS-PAGE pre-stained ladder ranging from 260–8kDa was used as standard marker. The gel was rinsed with water and stained sequentially with Coomassie blue and imperial stain. The destained gel was scanned using the Gel analyse software (Nugenius, United Kingdom).
Protein Oil and Water Holding Capacity
Oil and water holding capacities were determined according to the method by Yang et al., (2023) with modification. Faba bean protein isolate (1.0g) was dispersed in 40mL of distilled water for water holding capacity (WHC) and rapeseed oil for oil holding capacity (OHC). The mixtures were vortexed for 1 min on maximum speed (2,500rpm) before standing for 6hr at room temperature (20–23oC). Samples were then centrifuged at 3000 x g for 30min at 20oC.
WHC/OHC =
Where is the mass of the tube and protein isolate and absorbed water or oil; is the mass of the tube and protein isolate while is the mass of faba bean protein.
Fourier-Transform Infrared Spectroscopy Analysis (FTIR)
The Fourier-transform infrared (FTIR) study was carried out using an Attenuated total reflectance (ATR)-FTIR spectrophotometer (Spectrum 100 PerkinElmer, USA). Prior to the experiment, the absorbance spectrum of the air was recorded and automatically removed from the sample spectra. Spectroscopic studies were carried out with freeze-dried faba bean protein isolates in the range 4000–650cm− 1 at a resolution of 4cm−1 with 16 scans.
Results and Discussion
Extraction Yield
Extraction efficiency can be determined by tracking protein purity and yield while structural changes were also observed along the extraction process. The first processing step in the fractionation process was grinding. This step is essential, producing fractured cells which liberate the starch granules and protein bodies. Figure 2 and Table 1 shows faba bean flour ground to a mesh cut off size of 0.5mm. The smaller classes may be associated with mainly protein bodies.
The effect of each purification step on the composition was studied in the milled faba bean protein extraction process. The first step was grinding of faba beans into flour. This flour was considered the initial starting point with a protein content of 27.29%. The first functional fraction was labelled as fraction A from the usual extraction process and resulted in an extraction yield, protein yield and protein content of 16.41±0.50%, 53.22±0.30% and 90.16±0.25% respectively. Fraction B and C were obtained from soluble albumins mostly discarded during protein isolation. Fraction B was obtained by simple precipitation at pH 7 of the soluble albumin solution (pH 3.8, 4.5 and 5.0 were investigated, however no extract was obtained) and subsequent centrifugation to obtain protein pellets, while the remaining supernatant was labelled as fraction C (soluble proteins). Fraction B resulted in an extraction yield, protein yield and protein content of 1.06±0.32%, 3.41±0.43% and 89.60±0.10% respectively. Fraction C after freeze drying showed an extraction yield, protein yield and protein content of 7.45±0.37%, 9.29±0.40% and 34.63±0.12% as shown in Figure 3. Fraction D and E were obtained from starch residues which are usually discarded after alkaline solubilization and centrifugation. Starch pellets were redispersed in distilled water, and pH adjusted to 11. This was stirred and centrifuged to obtain a supernatant and starch pellet (E). The supernatant was adjusted to pH 4 to precipitate residual proteins represented as fraction D. The supernatant was then discarded. The step-by-step extraction and recovery process is fully illustrated in Figure 1. Fraction D showed that extraction yield, protein yield, and protein content of 1.39±0.37%, 4.01±0.52%, and 80.44±0.28% respectively. Refined starch fraction (E) showed extraction yield, and protein content of 40.13±0.43% and 2.75±0.15%. The fat content of faba bean flour used in the study was less than 2% and it is assumed that fractions contain a negligible amount of oil [21]. The protein purity of faba bean isolate (A), labeled fractions B, C, and D is consistent with that reported in the literature using a similar extraction process [22,23].
mfpf = mApA+ mBpB + mCpC + mDpD + mEpE + Lp
(50 x 0.2779) = (8.2023 x 0.9016) + (0.52825 x 0.896) + (3.72695 x 0.3463) + (0.6932 x 0.8044) + (20.0626 x 0.0275) + Lp
13. 895 =10.2681 + Lp
Lp = 3.63 g
Thus, the general loss to the extraction process was 3.63 g representing 26 % which may be attributable to discarded supernatant.
Figure 4.
Schematic representations of the faba bean protein isolation process showing mass balance and protein balance.
Figure 4.
Schematic representations of the faba bean protein isolation process showing mass balance and protein balance.
Qualitative Analysis of Proteins Using Electrophoresis (SDS-PAGE)
The primary structure of FBPI and the side stream recovered were analyzed by the patterns of reducing SDS-PAGE (Figure 5). Bands of the different proteins generated(A-D) showed different protein profiles. A similar SDS PAGE profile was observed between A and D which is not surprising since D represents the remaining globulin fraction extracted from discarded starch fraction. Protein bands ranging from 260–8 kDa were observed in A and D. Both A & D were extracted using Ip of 4.0 thus mostly composed of globulin fraction, hence the similarity in SDS band. Major bands were observed at 15, 30-38, 50, 60-70, 90, and ~ 125 kDa for samples A and D. Smearing bands were also observed from 260–125 kDa. Samples B and C represent albumin-soluble fractions that are usually discarded after protein precipitation. From Figure 5. major differences in protein profile were observed between fractions B and C despite being from the same albumin solutions. Sample B showed a protein band from 8~90 kDa while sample C showed a major band at only ~8 and 90 kDa. Additionally, minor bands were observed between 70-80 kDa and 30 kDa. Sample B contained a high protein content as compared to sample C which may indicate the presence of major protein bands. Comparing all fractions, globulin fraction (A and D) and albumin fraction (B and C) showed differences in protein profile, however, albumin fraction B showed some similarity in bands to that of globulin fractions. Interestingly, there was a band observed between 25–30 kDa in fraction B which was not found in any other fraction. Under the reducing conditions of SDS-PAGE, vicilin was found in its dissociated subunits of ~33–35 kDa (α and β) and 47–50 kDa (α, β, and γ), while legumin was observed in its acidic (α: 40 kDa) and basic (β: 20 kDa) subunits [24]. The observed band of ~70 kDa was presumed to correspond to convicilin [25]. Bands around 14 kDa have been reported to be a mixture of albumins and prolamins [26]. Overall, globulin fractions (A and D) showed a different profile compared to albumin fractions (B and C).
Functional Properties
Water and Oil Holding Capacity
Water holding capacity (WHC) is defined as the quantity of water that can be absorbed per gram of protein. This is the affinity of water to bind to the proteins via electrostatic interactions and are related to protein structure and the hydrophilic groups readily present to interact with water while oil holding capacity (OHC) represents the quantity of oil that can bind 1g of protein [27]. Both WHC and OHC are affected by several factors such as surface hydrophobicity, protein composition, particle size and processing conditions [12]. Understanding the water and oil holding capacities of ingredients is particularly important in developing novel food products such as plant-based meat analogues, egg, and yogurt alternatives. The ability to retain these fluids plays a crucial role in developing the desired juiciness, while preventing liquid separation, which could negatively impact visual and sensory appeal [28,29]. The OHC of protein ingredients is of great interest for food applications, as it is reflected in the emulsifying capacity, which is relevant for products such as mayonnaise. From Figure 6A, major differences in WHC were observed among all of the different fractions. Faba bean flour showed low WHC compared to protein samples except for C. The highest water absorption of samples A and B as well as sample D could be attributed to the high amounts of protein content. However, sample C showed a negative effect on WHC and therefore is not suitable for food applications due to its high solubility in water. Comparable OHC results were evident as shown in Figure 6B. The highest OHC was observed in starch fraction E (1.8±0.04 g/g) and protein fraction D (1.6± 0.12g/g). Protein isolates A, B, and C showed OHC values of 1.44±0.01, 1.40±0.01, and 1.22±0.10 g/g respectively. Raw faba bean flour was observed to have an OHC of 1.29±0.25 g/g. This indicates the possibility of incorporating these side streams usually regarded as waste in different food systems to achieve a circular economy.
ATR-FTIR Spectroscopy
Average spectra were acquired which show the characteristic band distribution of different fractions (A-E) (Figure 7). In general, high absorbance was observed in the regions 1500 –1700 cm-1 (Amide I and II region) [30] and 2700–3500cm-1 (lipid and carbohydrate regions) [31], moderate absorbance at 1200–950 cm-1 (carbohydrate band) [32] and relatively low average absorbance at 950–700cm-1 and 1200-950cm-1 (Figure 7A). All spectra of fractions A-E showed major peaks in the Amide I, II, III, A, and B. Similar peaks were also observed in the starch fractions (fraction E) though it had relatively low protein content compared to the other protein fractions. The modes most widely used in protein structural studies are amide I, amide II, and amide III (Figure 7B). Major differences among the fractions can be observed in the protein amide regions and fingerprint region 1200-700cm-1. Starch fraction E from Figure 7B showed a poor absorption peak in this region due to relatively low protein content. However, observing the fingerprint region 1200–700cm-1, starch fraction E showed relatively high absorption peaks in the region 1200–950cm-1. Similar high peaks were observed for peak Fraction B-D, though fraction A was low due to high protein content. Closely observing the fingerprint region 1200-700cm-1 clearly shows similar peaks and intensity between fractions C and E. This may be due to low protein content and possibly the presence of carbohydrates and lipids in these two fractions. Fractions A, B, and D had similar peaks in the fingerprint regions mainly due to high protein content and less amount of residual compounds. When looking at the carbohydrate region for the different extraction fractions from 1150–1000cm−1 (Figure 7C), Fractions A and B showed low levels of absorbance, but they were more distinct for fractions C, D, and E. This region may be useful for differentiating these fractions. Conformational differences in both protein regions and fingerprint regions could be attributed to changes in micro-environment [33] of extracted fractions and different protein components.
Qualitative Analysis of ATR-FTIR Spectra: Amide I Region
For the structural characterization of these intermediate steps in the extraction process, ATR-FTIR spectroscopy was employed. Given the sensitivity of infrared absorption to protein conformation, the amide regions of the infrared spectra serve as a valuable tool for both qualitative and quantitative assessment of protein secondary structures. To fully exploit the potential of ATR-FTIR spectra, each amide region was individually analysed for all obtained fractions.
Analysis of all spectra indicates notable absorption at higher wavenumbers, particularly in the Amide I region (1600–1700cm−1), which exhibits the highest sensitivity to conformational changes among all amide regions. In contrast, variations in the adjacent Amide II and III regions appear to be less influenced by secondary structure content. The Amide I region primarily originates from C=O stretching vibrations and out-of-phase CN stretching vibrations within the polypeptide backbone [34,35]. Upon protein extraction, due to differences in protein content and secondary structure changes, spectral differences are very pronounced. Figure 8 shows the overlaid average spectra of protein fraction A and other recovered fractions B-E in the amide I region. The spectra of fractions A, B, C and D display prominent peaks around 1640 and 1620 cm-1 while a minor peak was observed between 1660–1640 cm-1. Observing the Amide, I region, each fraction spectra induced spectral changes. There is a shift in the peak absorption maxima from 1640–1620cm-1. The average magnitude of the absorption of fraction A was lower compared to fractions B, C, and D. Generally, shifts in Amide I spectra region and differences in magnitude of absorption could be attributed to the fact that fraction may be mainly composed of globulin fractions while the fractions B, C and D may be composed of albumin fractions.
Qualitative Analysis of FTIR Spectra: Amide II Region
Regardless of complete perturbations in the Amide I region, faba bean fractions spectra in the Amide II conformational changes in the tertiary structure, suggesting that several amide NH groups are involved in strong hydrogen bonds and/or are buried within the hydrophobic protein core [36]. When comparing the different fractions, absorption maxima were observed around 1560–1500cm-1 for all samples except Fraction C and E which were mostly composed of starch and low protein. Observing fractions, A, B, and D which had high protein content shows major differences in the absorption maximum at this spectral region. Differences must be attributed to high globulin content in fraction A compared to the other fractions which may be mainly composed of albumin or other compounds. The results suggest that fractions A-D contained secondary structures with amide NH bond groups that are involved in stronger hydrogen bonds. Differences in spectra of all fractions reflect conformational variations in the tertiary structure among the samples.show major spectra differences from 1500–1600cm-1 due to differences in protein content and composition. The Amide II region, which primarily results from NH in-plane bending and CN stretching vibrations, exhibits significantly lower sensitivity to specific secondary structures compared to the Amide I region [2,37]. Due to its low sensitivity to secondary structure variations, the Amide II region is well-suited as an internal reference for comparing Amide I band intensities across different samples [38,39].
The spectral overlay for the amide II region, from 1600–1500cm−1, has been provided for the different fractions extracted (A-E) (Figure 9). Intensity changes in the amide II bands can reflect
Qualitative Analysis of ATR-FTIR Spectra: Amide III and A-B Region
The Amide III region is generally considered a less sensitive region within protein infrared spectra. Its bands primarily originate from NH bending and CN stretching vibrations, which exhibit some degree of conformation dependence [34]. Structural modifications influenced by variations in extraction conditions, protein content, and chemical composition also led to notable changes in this region.
The spectra shown in Figure 10 were analysed based on the Amide III band position ranges, as extensively studied by Cai et al., (1999). The Amide I region (1700–1600 cm−1) is widely used due to its strong signal; however, it has limitations, including water interference, an unstructured spectral contour, and overlapping bands from various secondary structures. In contrast, the Amide III region (1300–1200 cm−1), though weaker in intensity, is free from these limitations [41]. In recent years, several researchers have used amide III region to determine protein structures [33,42]. Observing Figure 10A, the Amide III spectra can differentiate between all the different fractions. A major peak was found in the region 1260 and 1225cm-1, however, this was less pronounced in fraction C and E due to their comparatively low protein content compared to fractions A, B, and D. Additionally, fraction A showed a lower absorption rate maxima compared to B and D. Figure 10B shows differences in Amide A and B regions of the different fractions obtained.
Conclusion
A sustainable food production system requires valorisation of side streams which have potential for different applications in the food, pharmaceutical, and cosmetic industries. Large scale of production of protein ingredients generates a significant volume of such by-products. In this study, we explored the maximisation of the traditional alkaline-isoelectric process to obtain valuable side streams which are usually discarded. The results show the possibility of recovering lost proteins with a reasonable amount of protein content using different process conditions. Additionally, ATR-FTIR was applied to monitor discrete compositional changes of each fraction that was obtained. Structural differences were observed in the Amide I, II, III, A, and B regions between fractions. SDS-PAGE analysis revealed, different protein profile bands for all protein fractions. Differences in functional properties such as water and oil holding capacity were observed for the individual fractions’ indicative of the usefulness of specific side streams for specific food applications.
Author Contributions
Abraham Badjona: Investigation, Writing – review & editing, Data curation, Formal analysis, Methodology, Writing – original draft. Robert Bradshaw: Methodology, Supervision, Writing – original draft, Writing – review & editing. Caroline Millman: Supervision, Writing – review & editing. Martin Howarth: Supervision, Writing – review & editing. Bipro Dubey: Conceptualization, Data curation, Methodology, Supervision, Writing – original draft, Writing – review & editing.
Data Availability Statement
The data generated during the current study are available upon reasonable request.
Conflicts of Interest
The authors declare that they have no known competing financial interests or personal relationships that could have appeared to influence the work reported in this paper.
References
- Wudil, A.H.; Usman, M.; Rosak-Szyrocka, J.; Pilař, L.; Boye, M. Reversing Years for Global Food Security: A Review of the Food Security Situation in Sub-Saharan Africa (SSA). Int J Environ Res Public Health 2022, 19. [Google Scholar] [CrossRef] [PubMed]
- Bhatia, L.; Jha, H.; Sarkar, T.; Sarangi, P.K. Food Waste Utilization for Reducing Carbon Footprints towards Sustainable and Cleaner Environment: A Review. Int J Environ Res Public Health 2023, 20. [Google Scholar] [CrossRef]
- Sadhukhan, J.; Dugmore, T.I.J.; Matharu, A.; Martinez-Hernandez, E.; Aburto, J.; Rahman, P.K.S.M.; Lynch, J. Perspectives on “Game Changer” Global Challenges for Sustainable 21st Century: Plant-Based Diet, Unavoidable Food Waste Biorefining, and Circular Economy. Sustainability 2020, 12. [Google Scholar] [CrossRef]
- Muhie, S.H. Novel Approaches and Practices to Sustainable Agriculture. J Agric Food Res 2022, 10. [Google Scholar]
- Cheng, F.; Brewer, C.E. Conversion of Protein-Rich Lignocellulosic Wastes to Bio-Energy: Review and Recommendations for Hydrolysis + Fermentation and Anaerobic Digestion. Renewable and Sustainable Energy Reviews 2021, 146. [Google Scholar] [CrossRef]
- Parlasca, M.C.; Qaim, M. Meat Consumption and Sustainability. Annual Review of Resource Economics 2022. [Google Scholar] [CrossRef]
- Chai, B.C.; van der Voort, J.R.; Grofelnik, K.; Eliasdottir, H.G.; Klöss, I.; Perez-Cueto, F.J.A. Which Diet Has the Least Environmental Impact on Our Planet? A Systematic Review of Vegan, Vegetarian and Omnivorous Diets. Sustainability 2019, 11. [Google Scholar] [CrossRef]
- Raak, N.; Corredig, M. Towards Creating Sustainable Foods from Side Streams: Heat-Induced Structure Formation in Blends of Sunflower Seed Press Cakes and Cheese Whey under Moderate Shear. Food Hydrocoll 2023, 144. [Google Scholar] [CrossRef]
- Karefyllakis, D.; Octaviana, H.; van der Goot, A.J.; Nikiforidis, C.V. The Emulsifying Performance of Mildly Derived Mixtures from Sunflower Seeds. Food Hydrocoll 2019, 88, 75–85. [Google Scholar] [CrossRef]
- Lie-Piang, A.; Braconi, N.; Boom, R.M.; van der Padt, A. Less Refined Ingredients Have Lower Environmental Impact – A Life Cycle Assessment of Protein-Rich Ingredients from Oil- and Starch-Bearing Crops. J Clean Prod 2021, 292. [Google Scholar] [CrossRef]
- Vogelsang-O’Dwyer, M.; Petersen, I.L.; Joehnke, M.S.; Sørensen, J.C.; Bez, J.; Detzel, A.; Busch, M.; Krueger, M.; O’Mahony, J.A.; Arendt, E.K.; et al. Comparison of Faba Bean Protein Ingredients Produced Using Dry Fractionation and Isoelectric Precipitation: Techno-Functional, Nutritional and Environmental Performance. Foods 2020, 9. [Google Scholar] [CrossRef] [PubMed]
- Badjona, A.; Bradshaw, R.; Millman, C.; Howarth, M.; Dubey, B. Faba Beans Protein as an Unconventional Protein Source for the Food Industry: Processing Influence on Nutritional, Techno-Functionality, and Bioactivity. Food Reviews International 2023. [Google Scholar] [CrossRef]
- Badjona, A.; Bradshaw, R.; Millman, C.; Howarth, M.; Dubey, B. Structural, Thermal, and Physicochemical Properties of Ultrasound-Assisted Extraction of Faba Bean Protein Isolate (FPI). J Food Eng 2024, 377. [Google Scholar] [CrossRef]
- Iylia Fatinee Mohd Yusree, F.; Paul Peter, A.; Zuhair Mohd Nor, M.; Loke Show, P.; Noriznan Mokhtar, M. Latest Advances in Protein-Recovery Technologies from Agricultural Waste. Foods 2021. [Google Scholar] [CrossRef]
- López-Pedrouso, M.; Zaky, A.A.; Lorenzo, J.M.; Camiña, M.; Franco, D. A Review on Bioactive Peptides Derived from Meat and By-Products: Extraction Methods, Biological Activities, Applications and Limitations. Meat Sci 2023, 204. [Google Scholar] [CrossRef]
- Sheikh, M.A.; Saini, C.S.; Sharma, H.K. Structural Modification of Plum (Prunus Domestica L) Kernel Protein Isolate by Supercritical Carbon-Dioxide Treatment: Functional Properties and in-Vitro Protein Digestibility. Int J Biol Macromol 2023, 230. [Google Scholar] [CrossRef] [PubMed]
- Shen, X.; Fang, T.; Gao, F.; Guo, M. Effects of Ultrasound Treatment on Physicochemical and Emulsifying Properties of Whey Proteins Pre- and Post-Thermal Aggregation. Food Hydrocoll 2017, 63, 668–676. [Google Scholar] [CrossRef]
- Jiang, Z.Q.; Pulkkinen, M.; Wang, Y.J.; Lampi, A.M.; Stoddard, F.L.; Salovaara, H.; Piironen, V.; Sontag-Strohm, T. Faba Bean Flavour and Technological Property Improvement by Thermal Pre-Treatments. LWT 2016, 68, 295–305. [Google Scholar] [CrossRef]
- Laemmli, U.K. Cleavage of Structural Proteins during the Assembly of the Head of Bacteriophage T4. Nature 1970, 227, 680–685. [Google Scholar] [CrossRef]
- Yang, J.; Lorenzetti, R.L.; Bing, D.; Zhang, S.; Lu, J.; Chen, L. Composition, Functionalities, and Digestibility of Proteins from High Protein and Normal Pea ( Pisum Sativum ) Genotypes. Sustainable Food Proteins 2023, 1, 4–15. [Google Scholar] [CrossRef]
- De Angelis, D.; Pasqualone, A.; Costantini, M.; Ricciardi, L.; Lotti, C.; Pavan, S.; Summo, C. Data on the Proximate Composition, Bioactive Compounds, Physicochemical and Functional Properties of a Collection of Faba Beans (Vicia Faba L.) and Lentils (Lens Culinaris Medik.). Data Brief 2021, 34. [Google Scholar] [CrossRef] [PubMed]
- Jeganathan, B.; Vasanthan, T.; Temelli, F. Isolation of Clean-Label Faba Bean (Vicia Faba L.) Proteins: A Comparative Study of Mild Fractionation Methods against Traditional Technologies. Innovative Food Science and Emerging Technologies 2023, 84. [Google Scholar] [CrossRef]
- Badjona, A.; Bradshaw, R.; Millman, C.; Howarth, M.; Dubey, B. Faba Beans Protein as an Unconventional Protein Source for the Food Industry: Processing Influence on Nutritional, Techno-Functionality, and Bioactivity. Food Reviews International 2023. [Google Scholar] [CrossRef]
- Higa, F.A.; Boyd, L.; Sopiwnyk, E.; Nickerson, M.T. Effect of Particle Size, Flour:Water Ratio and Type of Pulse on the Physicochemical and Functional Properties of Wet Protein Extraction. Cereal Chem 2022, 99, 1049–1062. [Google Scholar] [CrossRef]
- Gao, Z.; Shen, P.; Lan, Y.; Cui, L.; Ohm, J.B.; Chen, B.; Rao, J. Effect of Alkaline Extraction PH on Structure Properties, Solubility, and Beany Flavor of Yellow Pea Protein Isolate. Food Research International 2020, 131. [Google Scholar] [CrossRef]
- Liu, G.; Li, J.; Shi, K.; Wang, S.; Chen, J.; Liu, Y.; Huang, Q. Composition, Secondary Structure, and Self-Assembly of Oat Protein Isolate. J Agric Food Chem 2009, 57, 4552–4558. [Google Scholar] [CrossRef]
- Lam, A.C.Y.; Can Karaca, A.; Tyler, R.T.; Nickerson, M.T. Pea Protein Isolates: Structure, Extraction, and Functionality. Food Reviews International 2018, 34, 126–147. [Google Scholar] [CrossRef]
- Grasso, N.; Alonso-Miravalles, L.; O’Mahony, J.A. Composition, Physicochemical and Sensorial Properties of Commercial Plant-Based Yogurts. Foods 2020, 9. [Google Scholar] [CrossRef] [PubMed]
- Cornet, S.H.V.; Snel, S.J.E.; Lesschen, J.; van der Goot, A.J.; van der Sman, R.G.M. Enhancing the Water Holding Capacity of Model Meat Analogues through Marinade Composition. J Food Eng 2021, 290. [Google Scholar] [CrossRef]
- Carbonaro, M.; Nucara, A. Secondary Structure of Food Proteins by Fourier Transform Spectroscopy in the Mid-Infrared Region. Amino Acids 2010, 38, 679–690. [Google Scholar] [CrossRef]
- Andrade, J.; Pereira, C.G.; Ranquine, T.; Azarias, C.A.; Bell, M.J.V.; De Carvalho Dos Anjos, V. Long-Term Ripening Evaluation of Ewes’ Cheeses by Fourier-Transformed Infrared Spectroscopy under Real Industrial Conditions. Journal of Spectroscopy 2018, 2018. [Google Scholar] [CrossRef]
- Vodnar, D.C.; Pop, O.L.; Socaciu, C. Monitoring Lactic Acid Fermentation in Media Containing Dandelion (Taraxacum Officinale) by FTIR Spectroscopy. Not Bot Horti Agrobot Cluj Napoca 2012, 40, 65–68. [Google Scholar] [CrossRef]
- Milošević, J.; Prodanović, R.; Polović, N. On the Protein Fibrillation Pathway: Oligomer Intermediates Detection Using ATR-FTIR Spectroscopy. Molecules 2021, 26. [Google Scholar] [CrossRef] [PubMed]
- Barth, A. Infrared Spectroscopy of Proteins. Biochim Biophys Acta Bioenerg 2007, 1767, 1073–1101. [Google Scholar] [CrossRef]
- Badjona, A.; Cherono, B.; Bradshaw, R.; Dubey, B. Gelation and Rheological Properties of Ultrasound-Extracted Faba Bean Protein: A Comparative Study with Commercial Plant Proteins. Food Hydrocoll 2025, 162. [Google Scholar] [CrossRef]
- Tang, C.H.; Ma, C.Y. Effect of High Pressure Treatment on Aggregation and Structural Properties of Soy Protein Isolate. LWT 2009, 42, 606–611. [Google Scholar] [CrossRef]
- Seo, J.; Hoffmann, W.; Warnke, S.; Huang, X.; Gewinner, S.; Schöllkopf, W.; Bowers, M.T.; Von Helden, G.; Pagel, K. An Infrared Spectroscopy Approach to Follow β-Sheet Formation in Peptide Amyloid Assemblies. Nat Chem 2017, 9, 39–44. [Google Scholar] [CrossRef]
- Milošević, J.; Petrić, J.; Jovčić, B.; Janković, B.; Polović, N. Exploring the Potential of Infrared Spectroscopy in Qualitative and Quantitative Monitoring of Ovalbumin Amyloid Fibrillation. Spectrochim Acta A Mol Biomol Spectrosc 2020, 229. [Google Scholar] [CrossRef]
- Lee, T.H.; Lin, S.Y. Additives Affecting Thermal Stability of Salmon Calcitonin in Aqueous Solution and Structural Similarity in Lyophilized Solid Form. Process Biochemistry 2011, 46, 2163–2169. [Google Scholar] [CrossRef]
- Cai, S.; Singh, B.R.; Singh, B.R. Identification Of-Turn and Random Coil Amide III Infrared Bands for Secondary Structure Estimation of Proteins. Biophysical Chemistry 1999, 80. [Google Scholar] [CrossRef]
- Cai, S.; Singh, B.R.; Singh, B.R. Identification Of-Turn and Random Coil Amide III Infrared Bands for Secondary Structure Estimation of Proteins. Biophysical Chemistry 1999, 80. [Google Scholar] [CrossRef] [PubMed]
- Chen, J.; Chen, X.; Zhu, Q.; Chen, F.; Zhao, X.; Ao, Q. Determination of the Domain Structure of the 7S and 11S Globulins from Soy Proteins by XRD and FTIR. J Sci Food Agric 2013, 93, 1687–1691. [Google Scholar] [CrossRef] [PubMed]
Figure 1.
Flow chart for recovering protein isolate from faba bean flour.
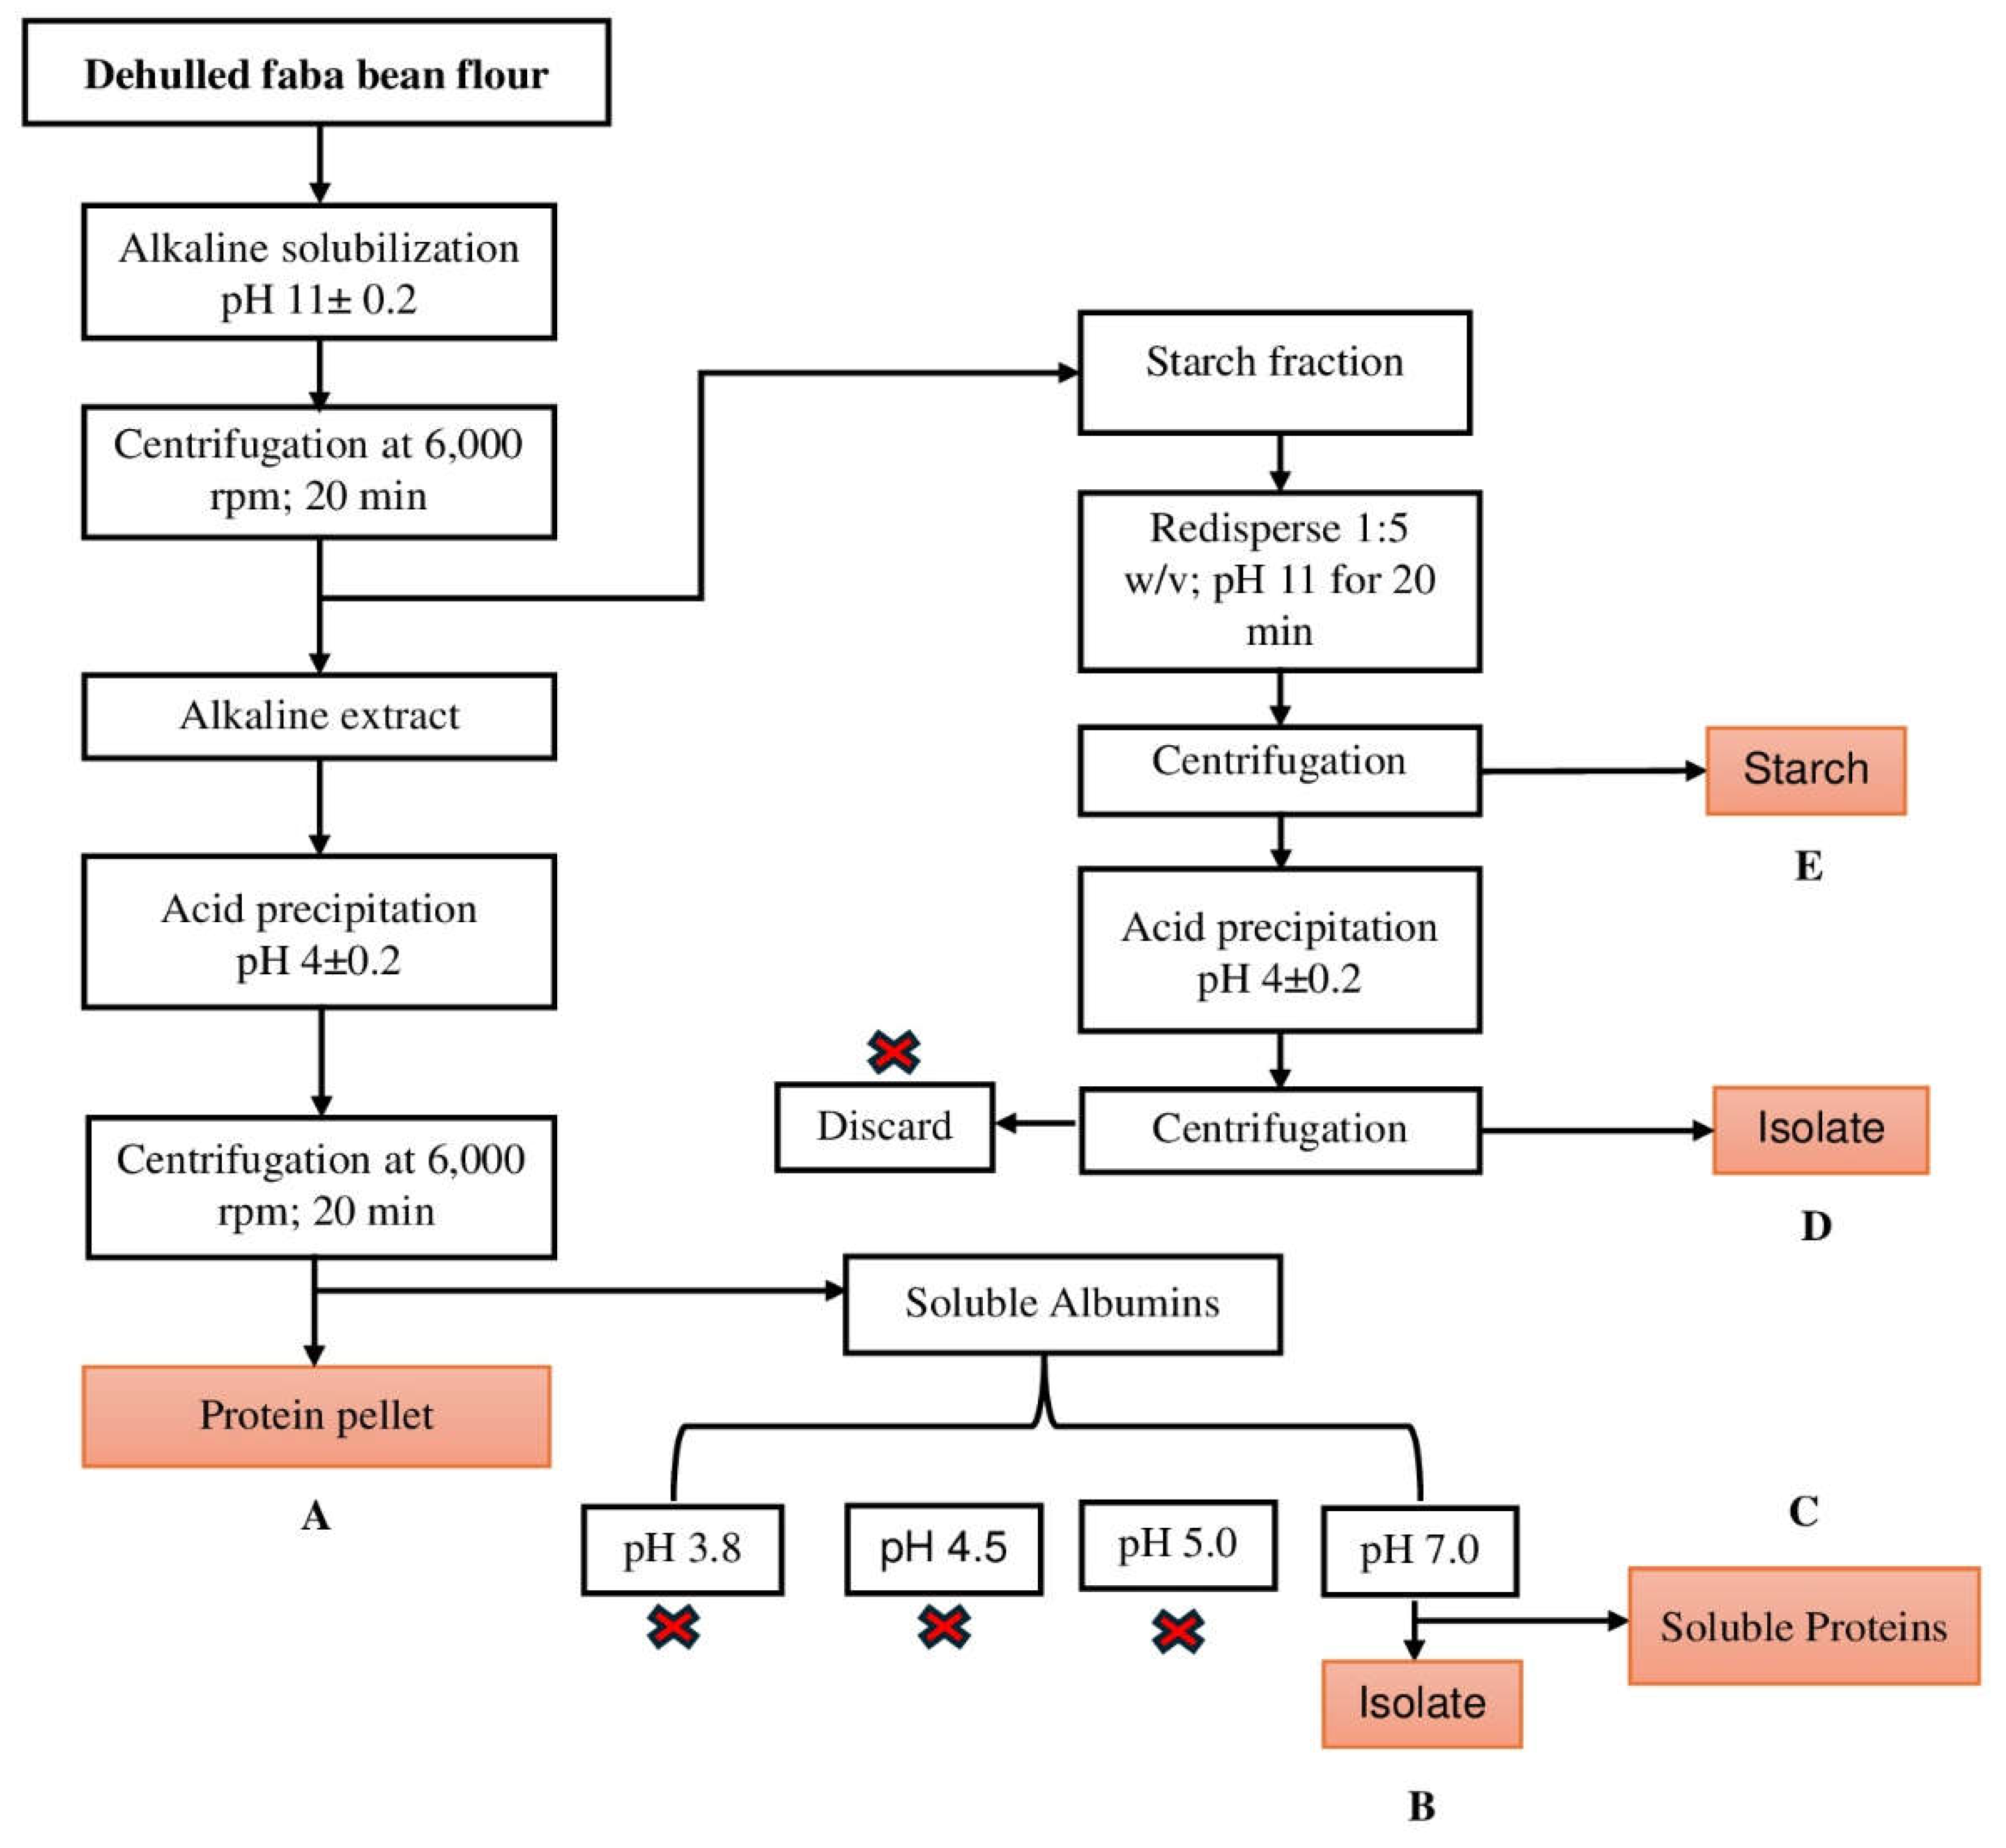
Figure 2.
Shows the particle size distribution of faba bean flour (n = 4).
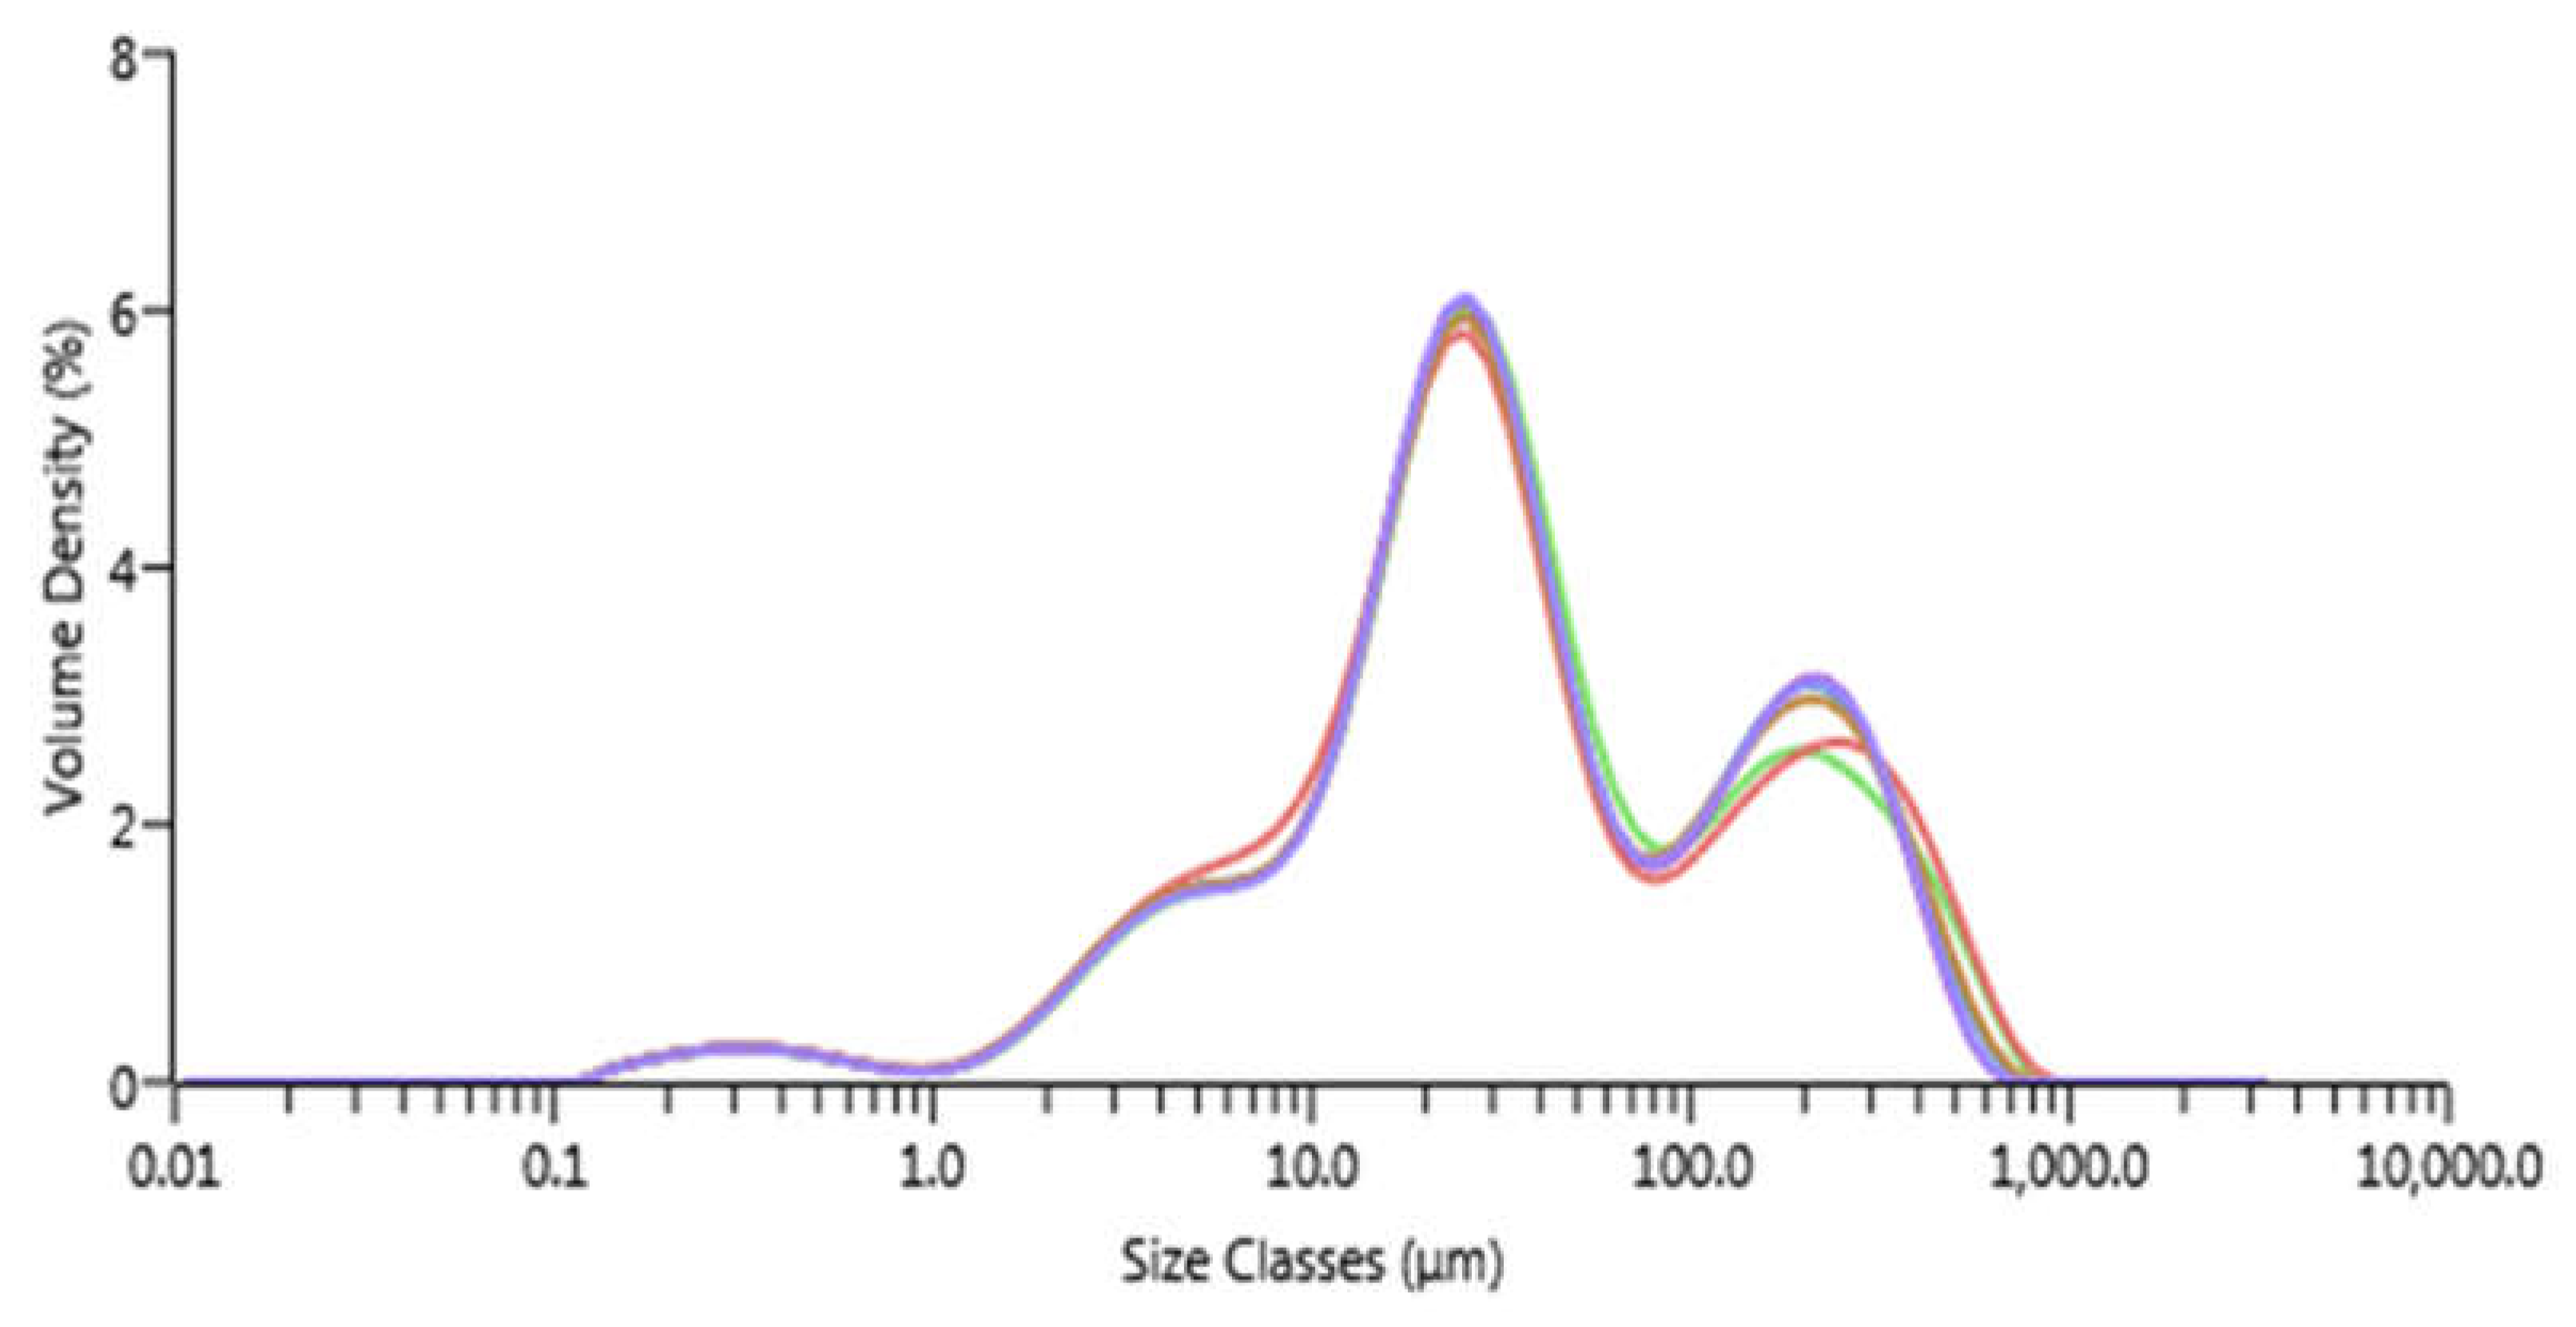
Figure 3.
Extraction yield, protein yield and content during extraction and yield of the four different side-streams and resulting isolates (n=3). Mass balance for different steps of Protein extraction.
Figure 3.
Extraction yield, protein yield and content during extraction and yield of the four different side-streams and resulting isolates (n=3). Mass balance for different steps of Protein extraction.

Figure 5.
SDS-PAGE gel visualization of the different protein fractions under reducing conditions.
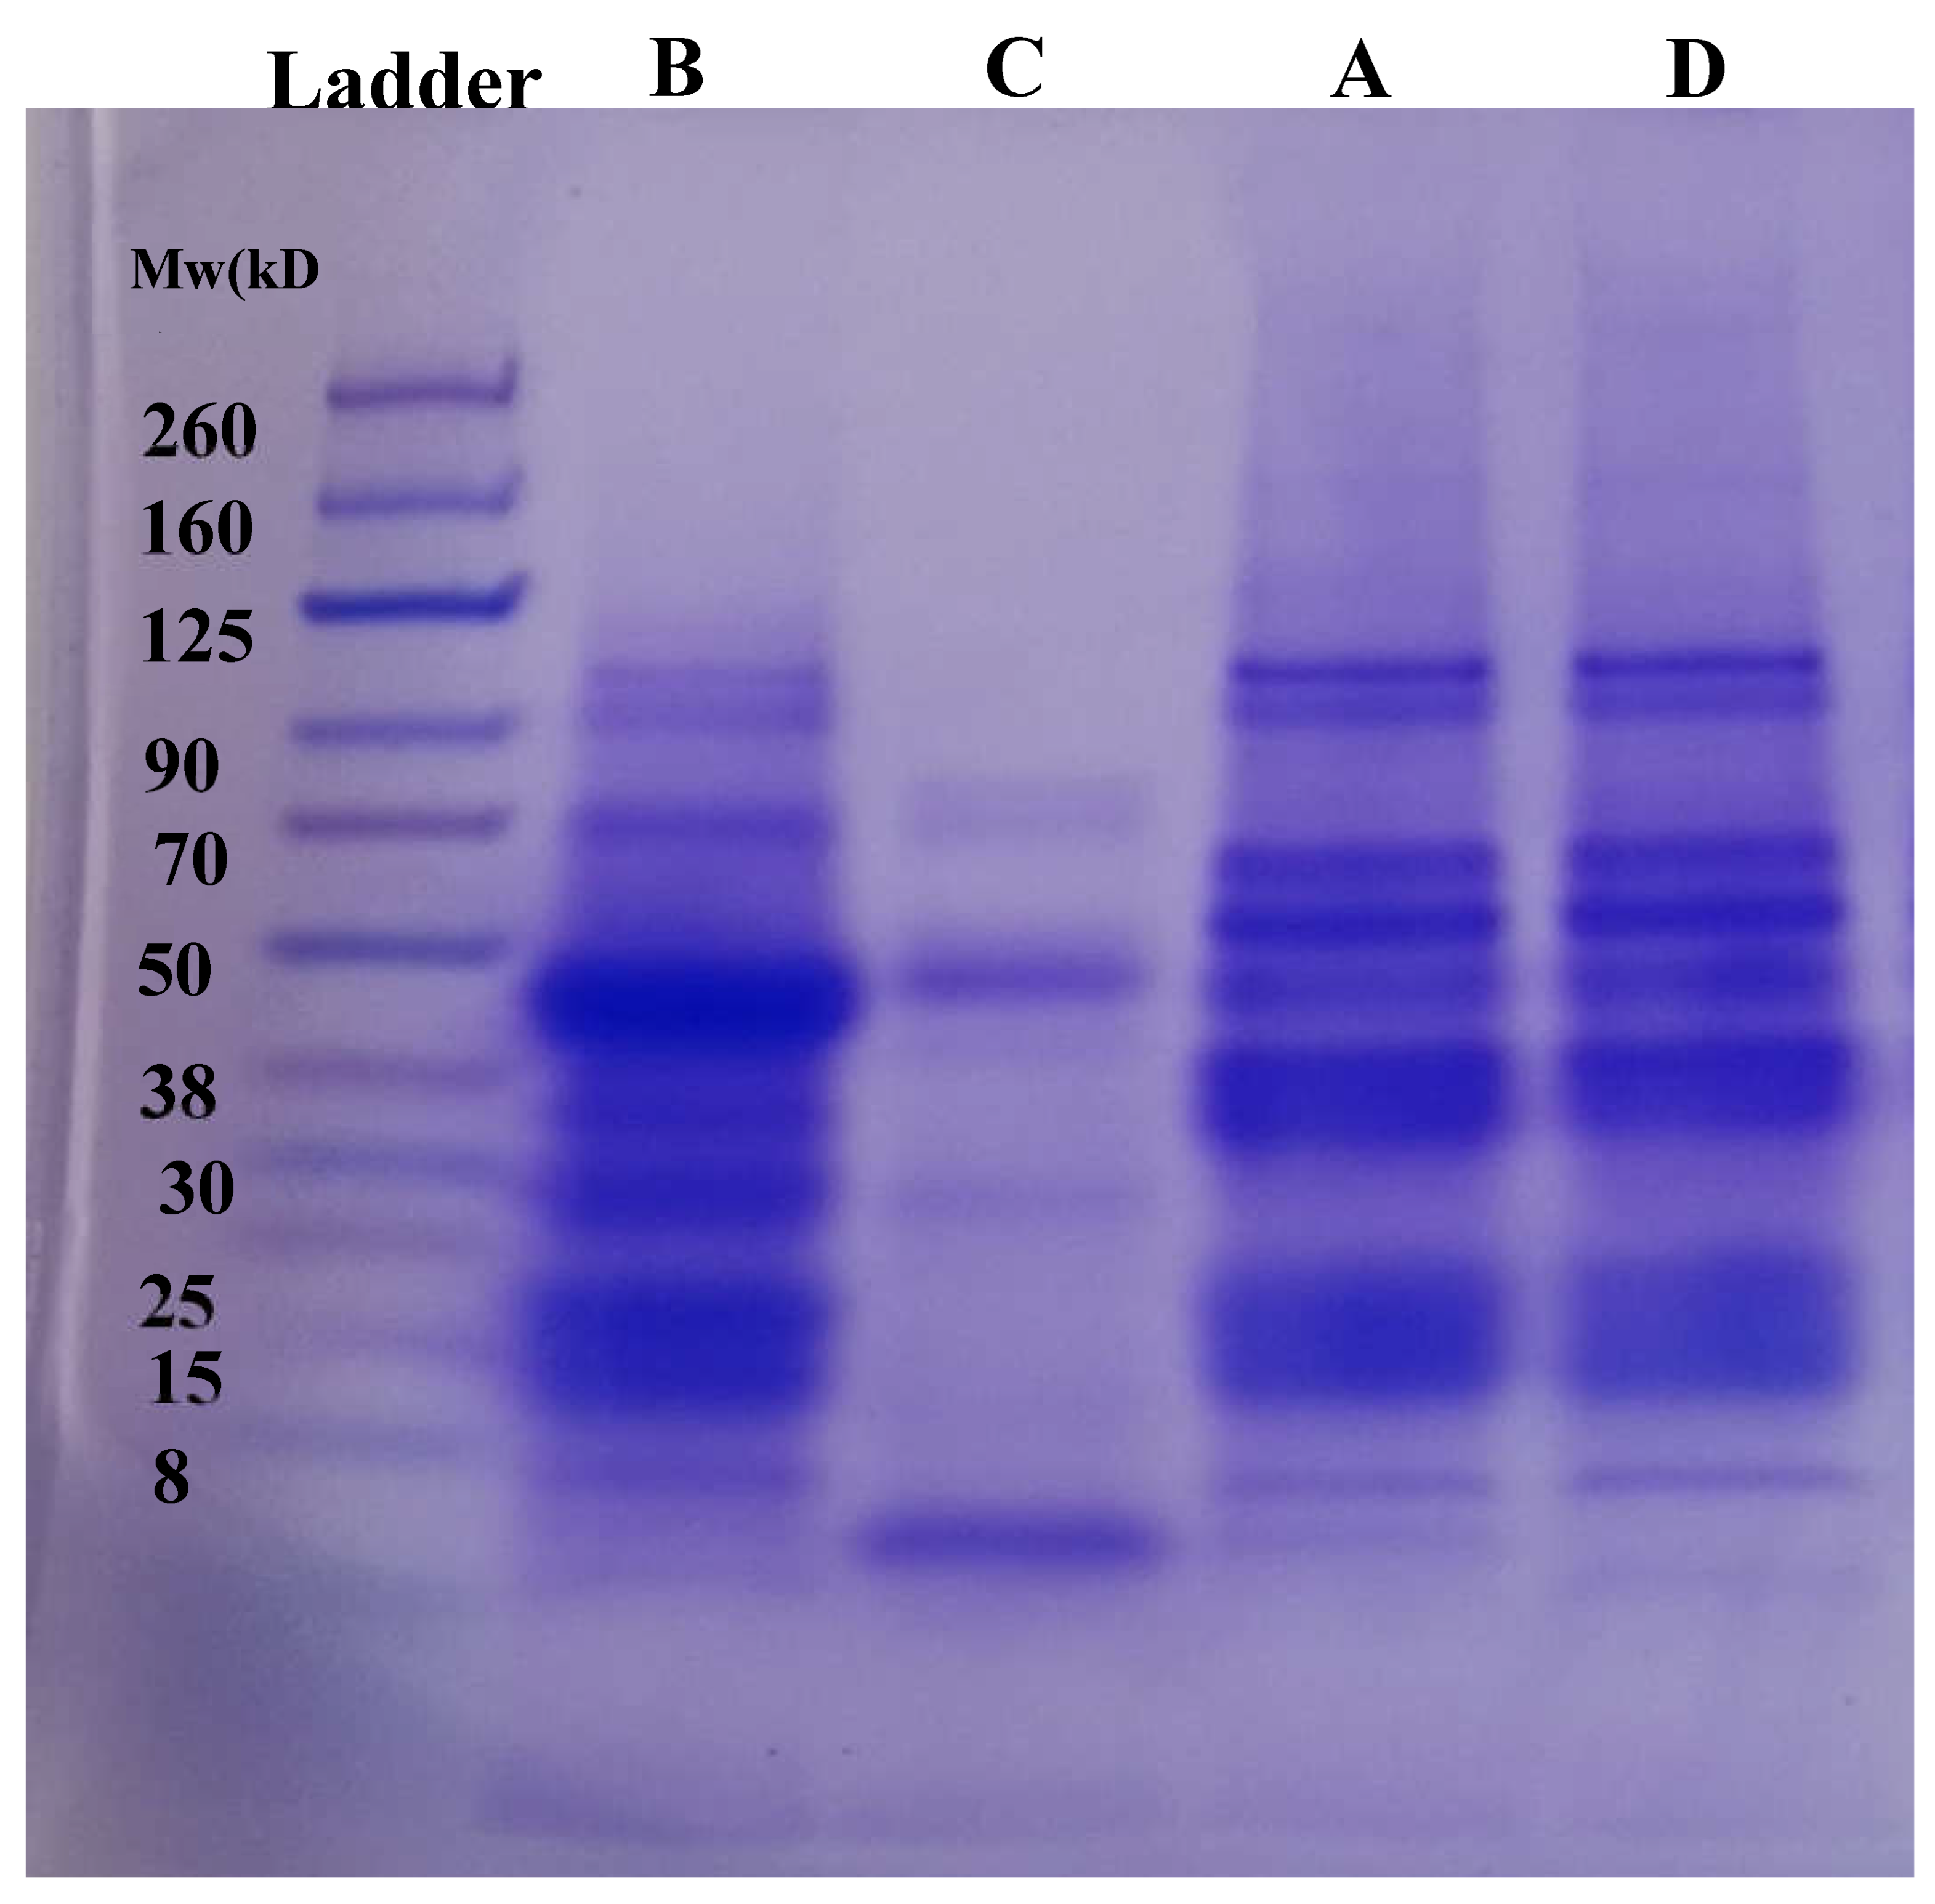
Figure 6.
Water (A) and oil (B) holding capacity of different protein fractions from faba bean flour.
Figure 6.
Water (A) and oil (B) holding capacity of different protein fractions from faba bean flour.
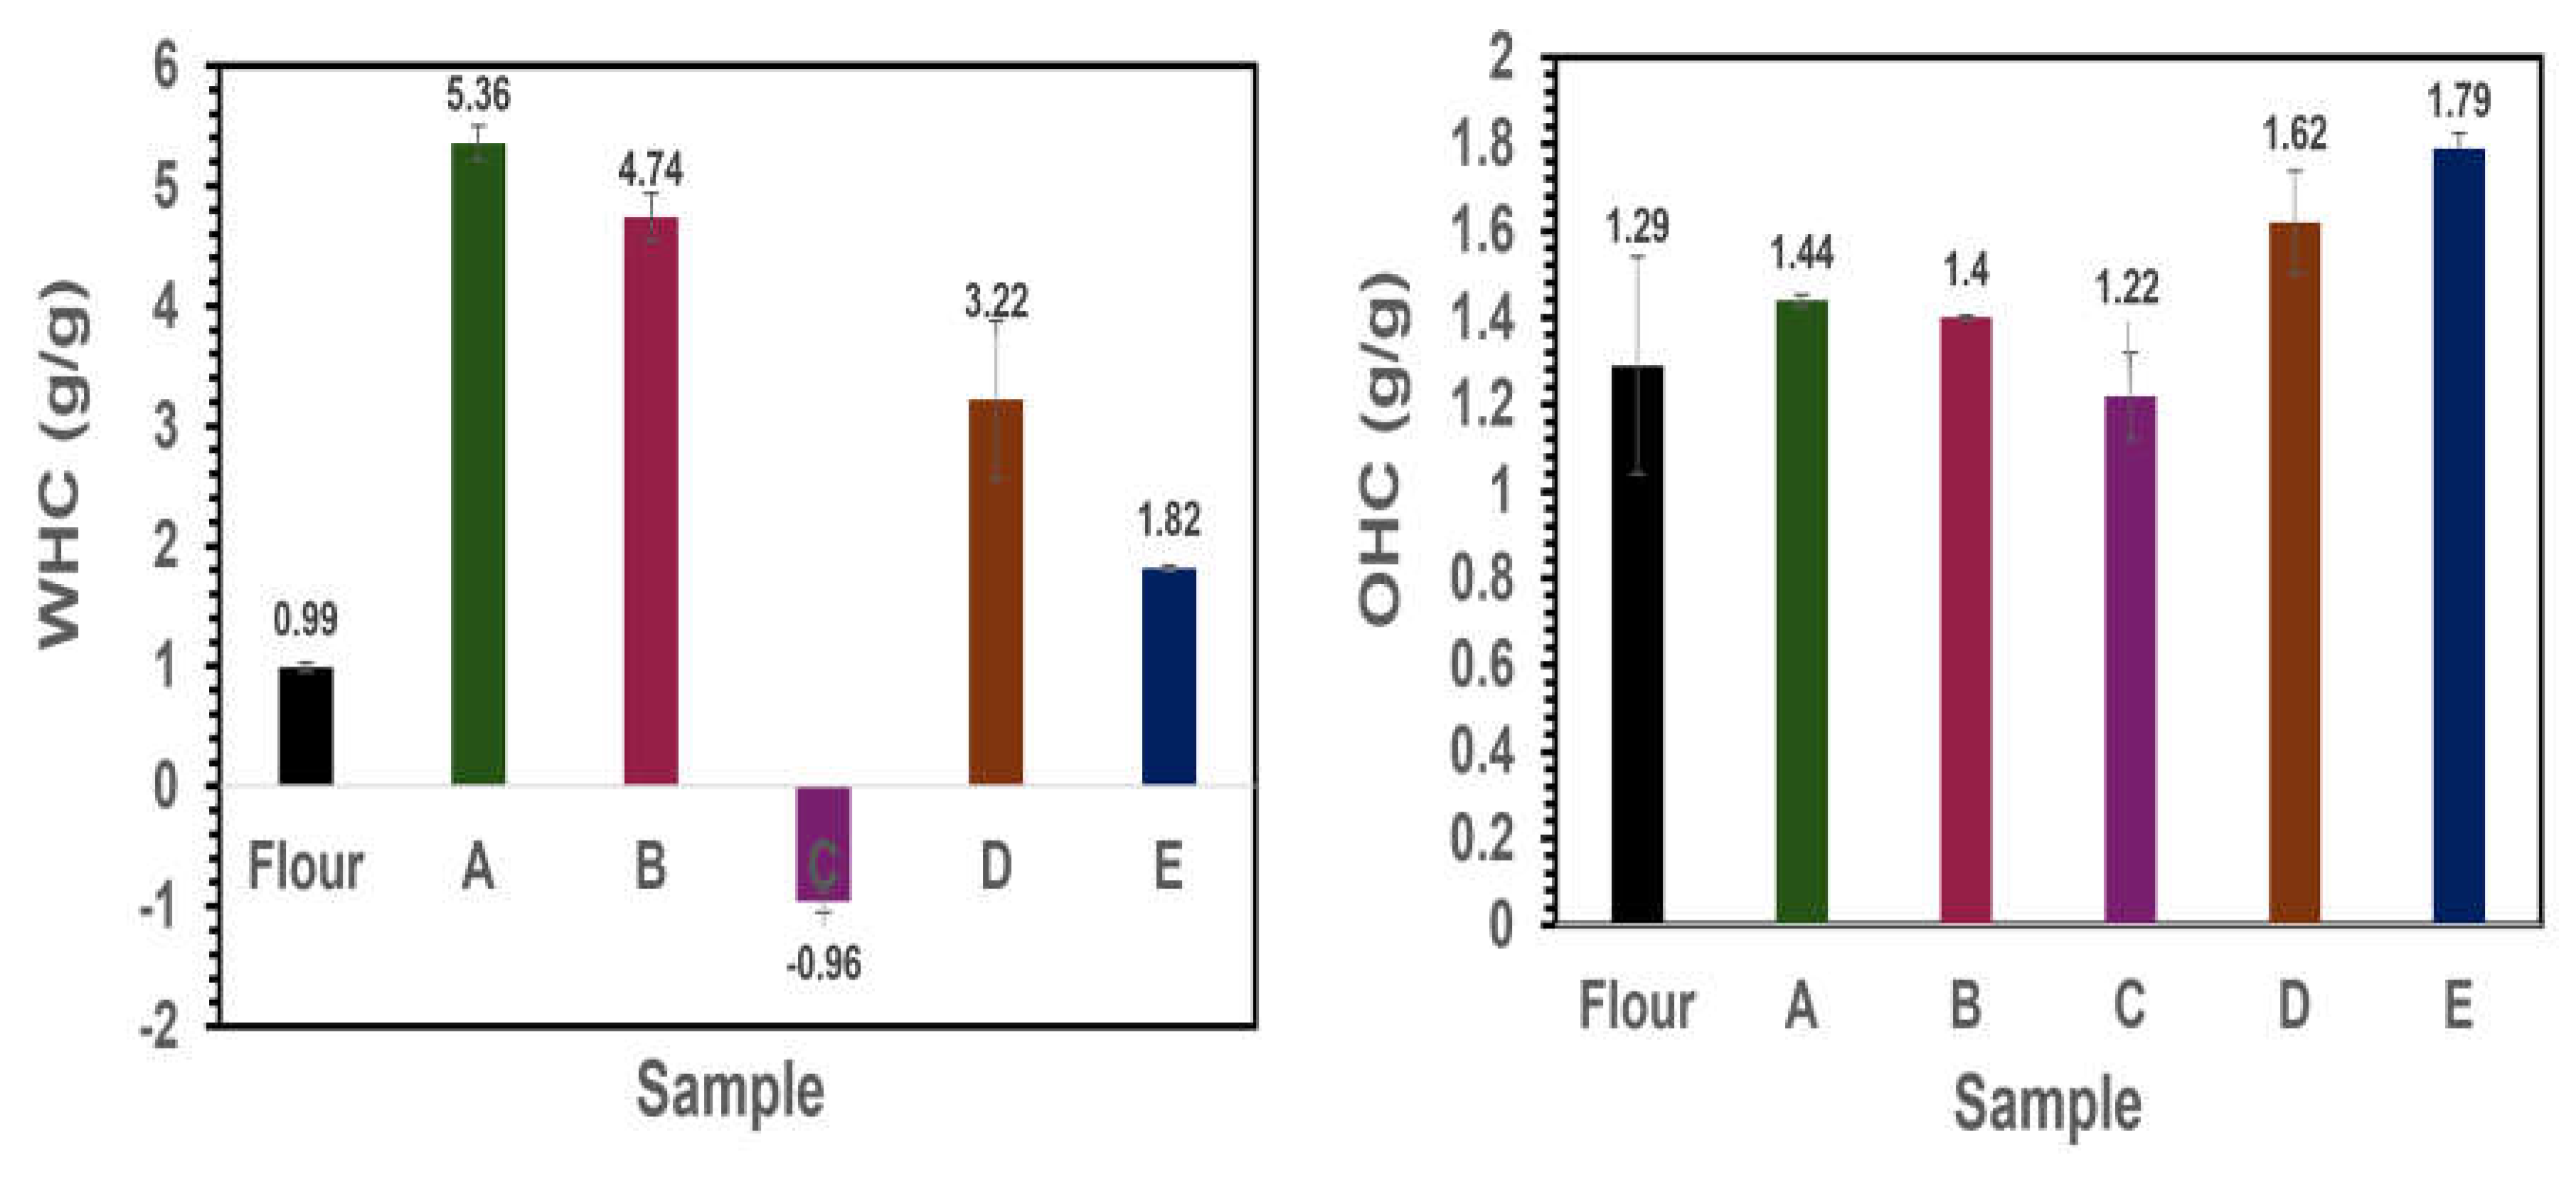
Figure 7.
FTIR spectra of protein samples extracted from faba beans and their side-streams (a) original spectra (n=3) (b) Amide I-III region 1700–1200cm -1 (c) fingerprint region 1200-700cm -1.
Figure 7.
FTIR spectra of protein samples extracted from faba beans and their side-streams (a) original spectra (n=3) (b) Amide I-III region 1700–1200cm -1 (c) fingerprint region 1200-700cm -1.
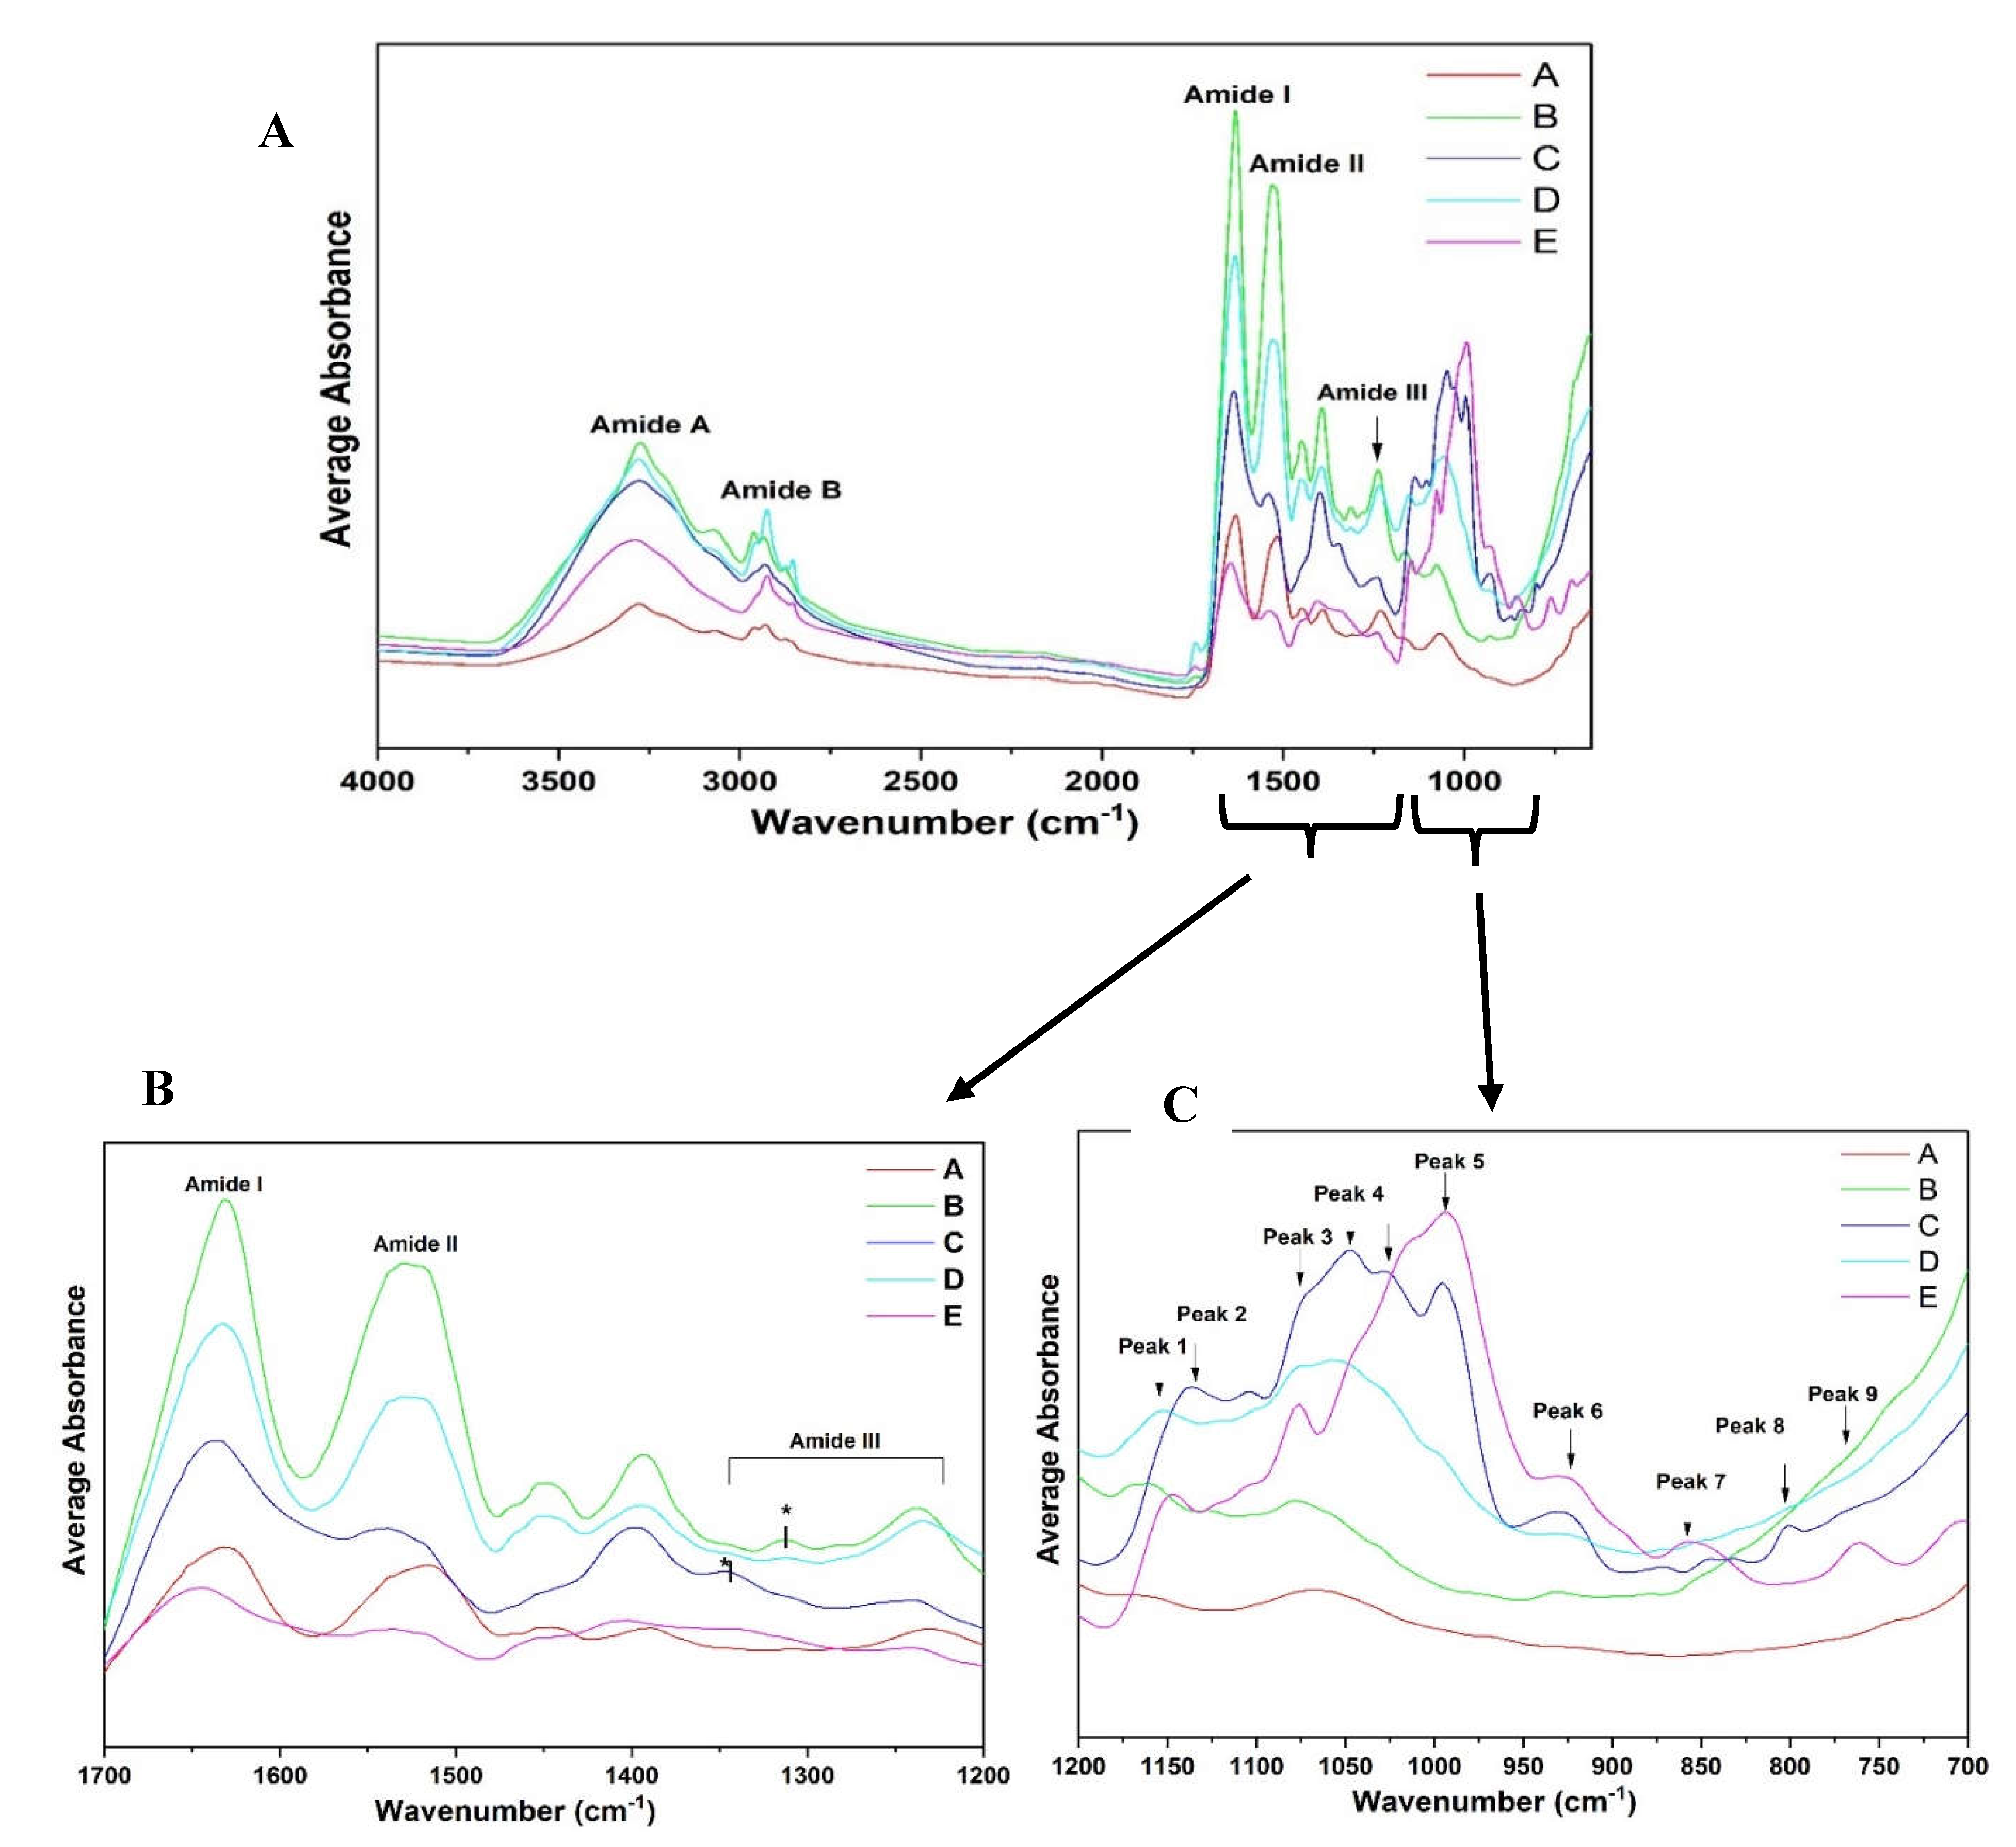
Figure 8.
Amide I region of faba bean isolate (A) and different side streams (B-E) (n=3).
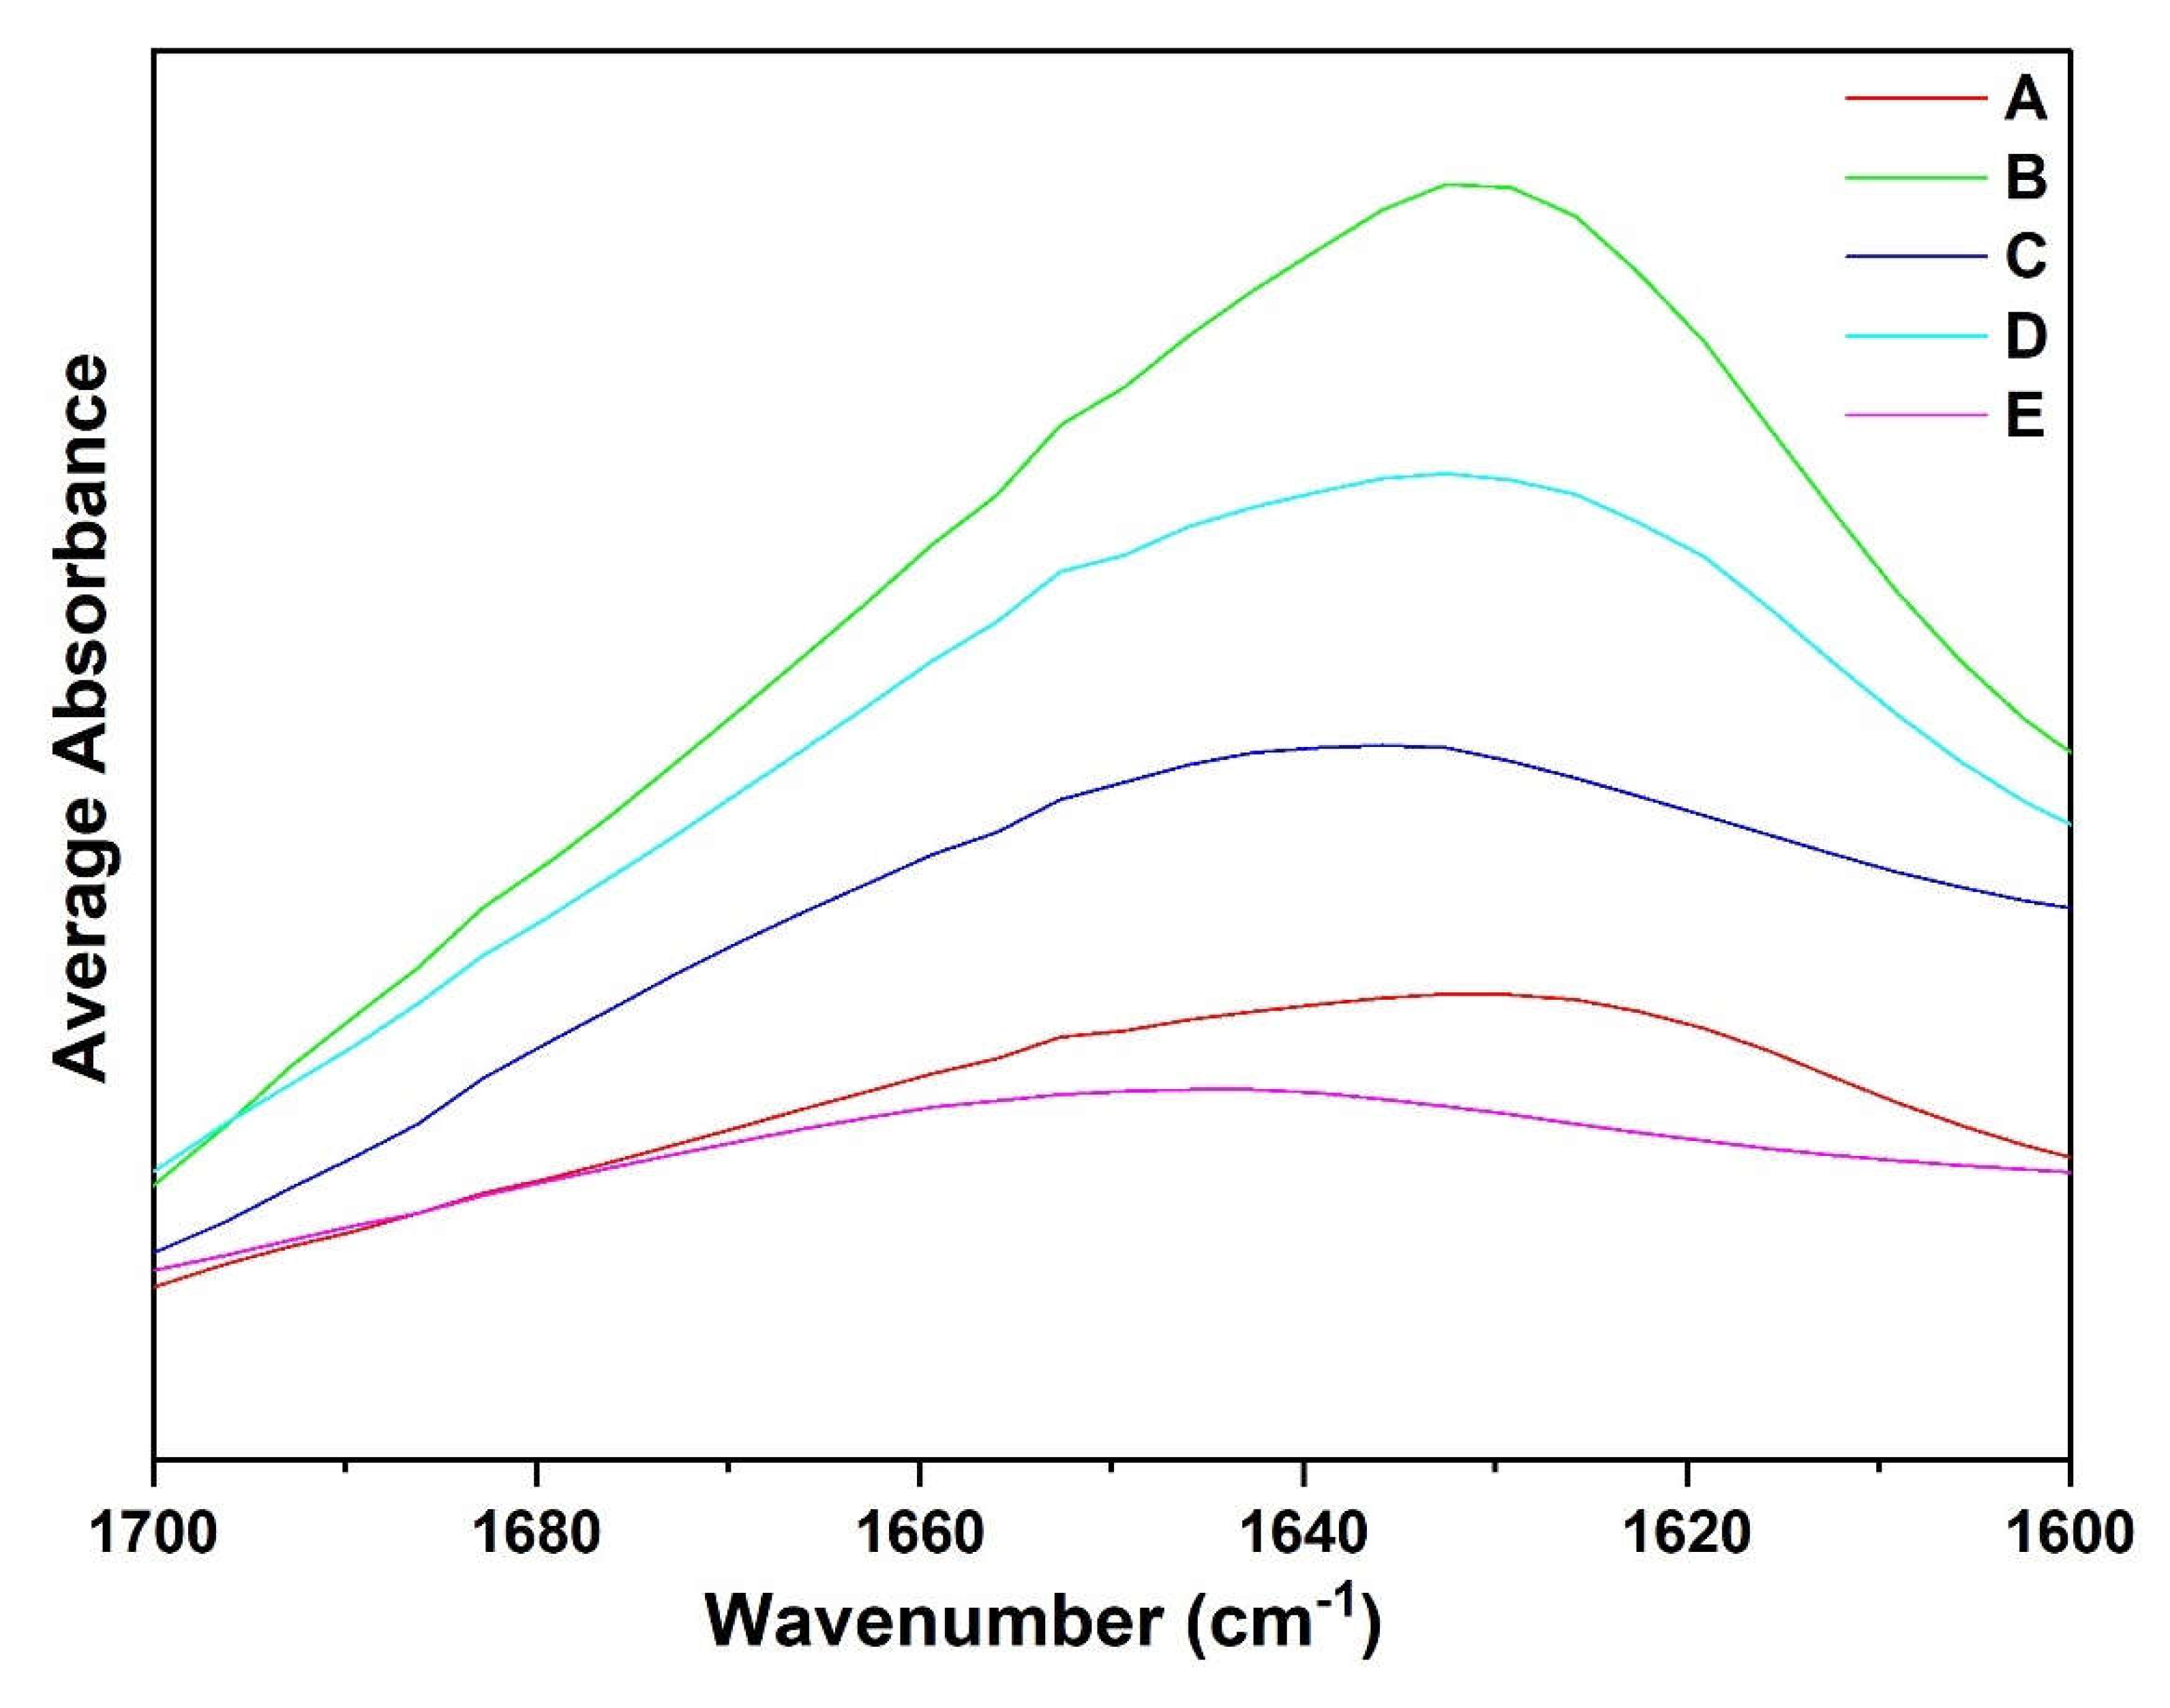
Figure 9.
Amide II region of faba bean isolate (A) and different side streams (B-E) (n=3).
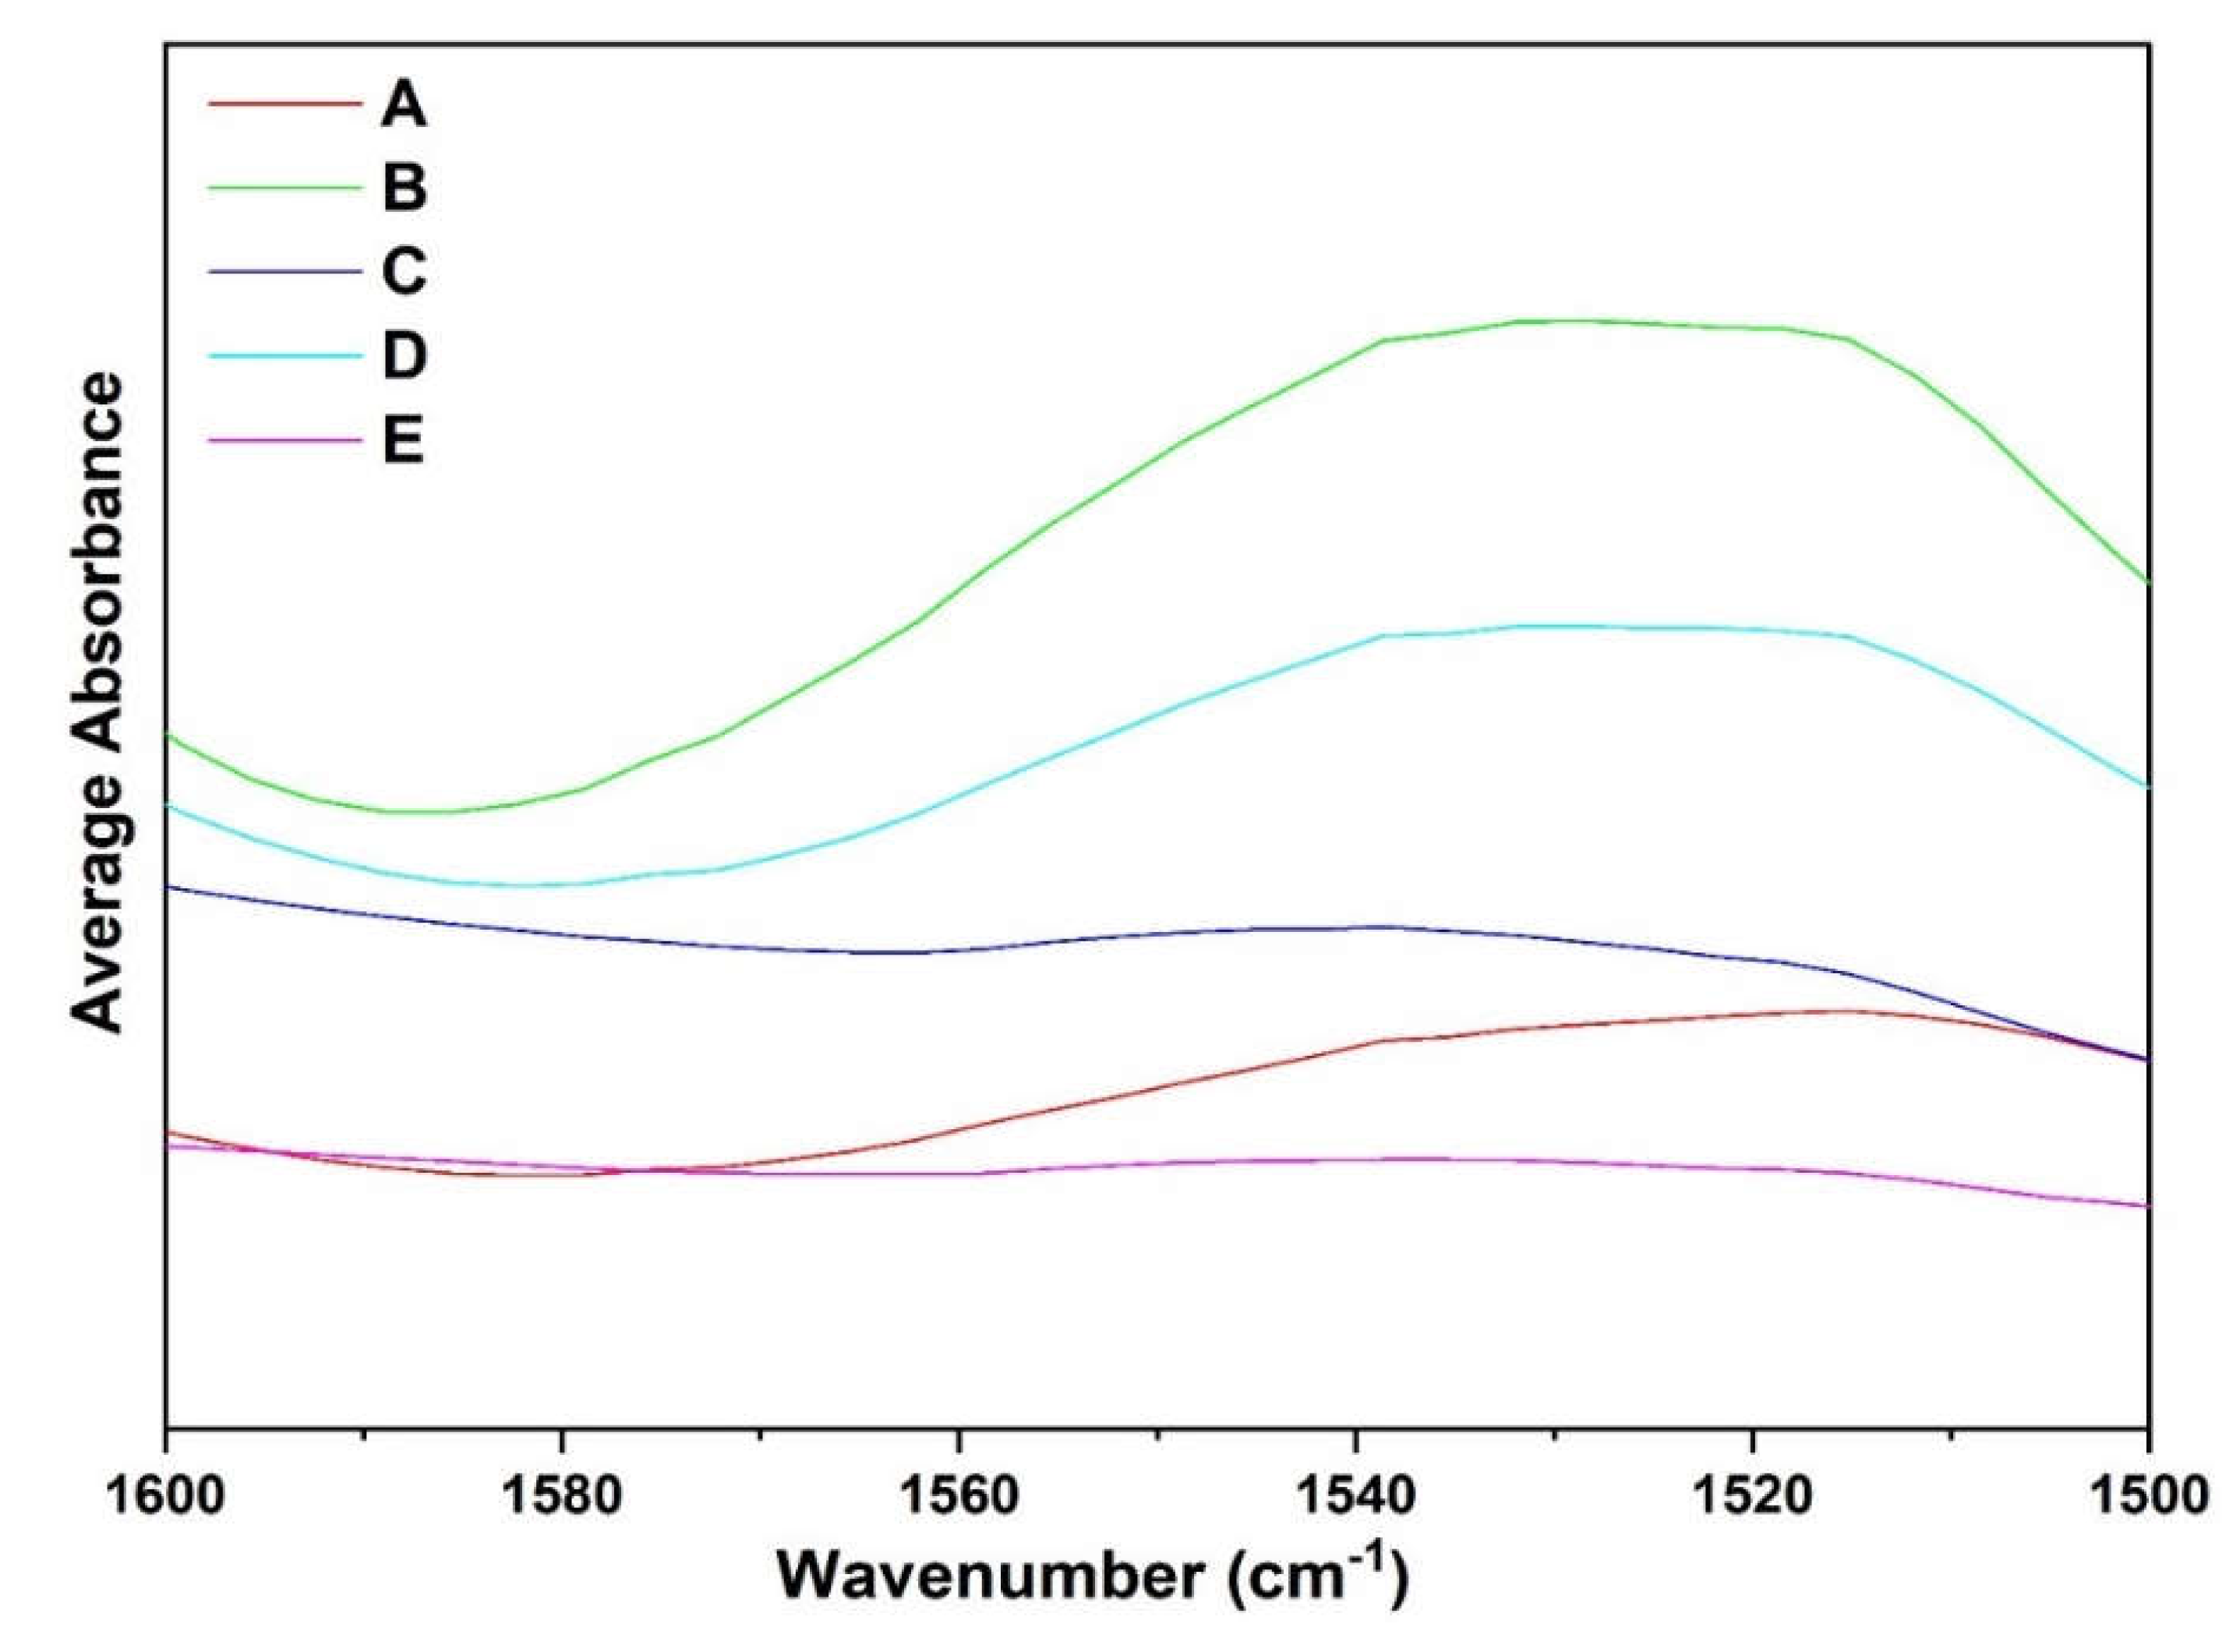
Figure 10.
Amide III region of different extracted fractions (A) and (B) Amide A-B regions (n=3).
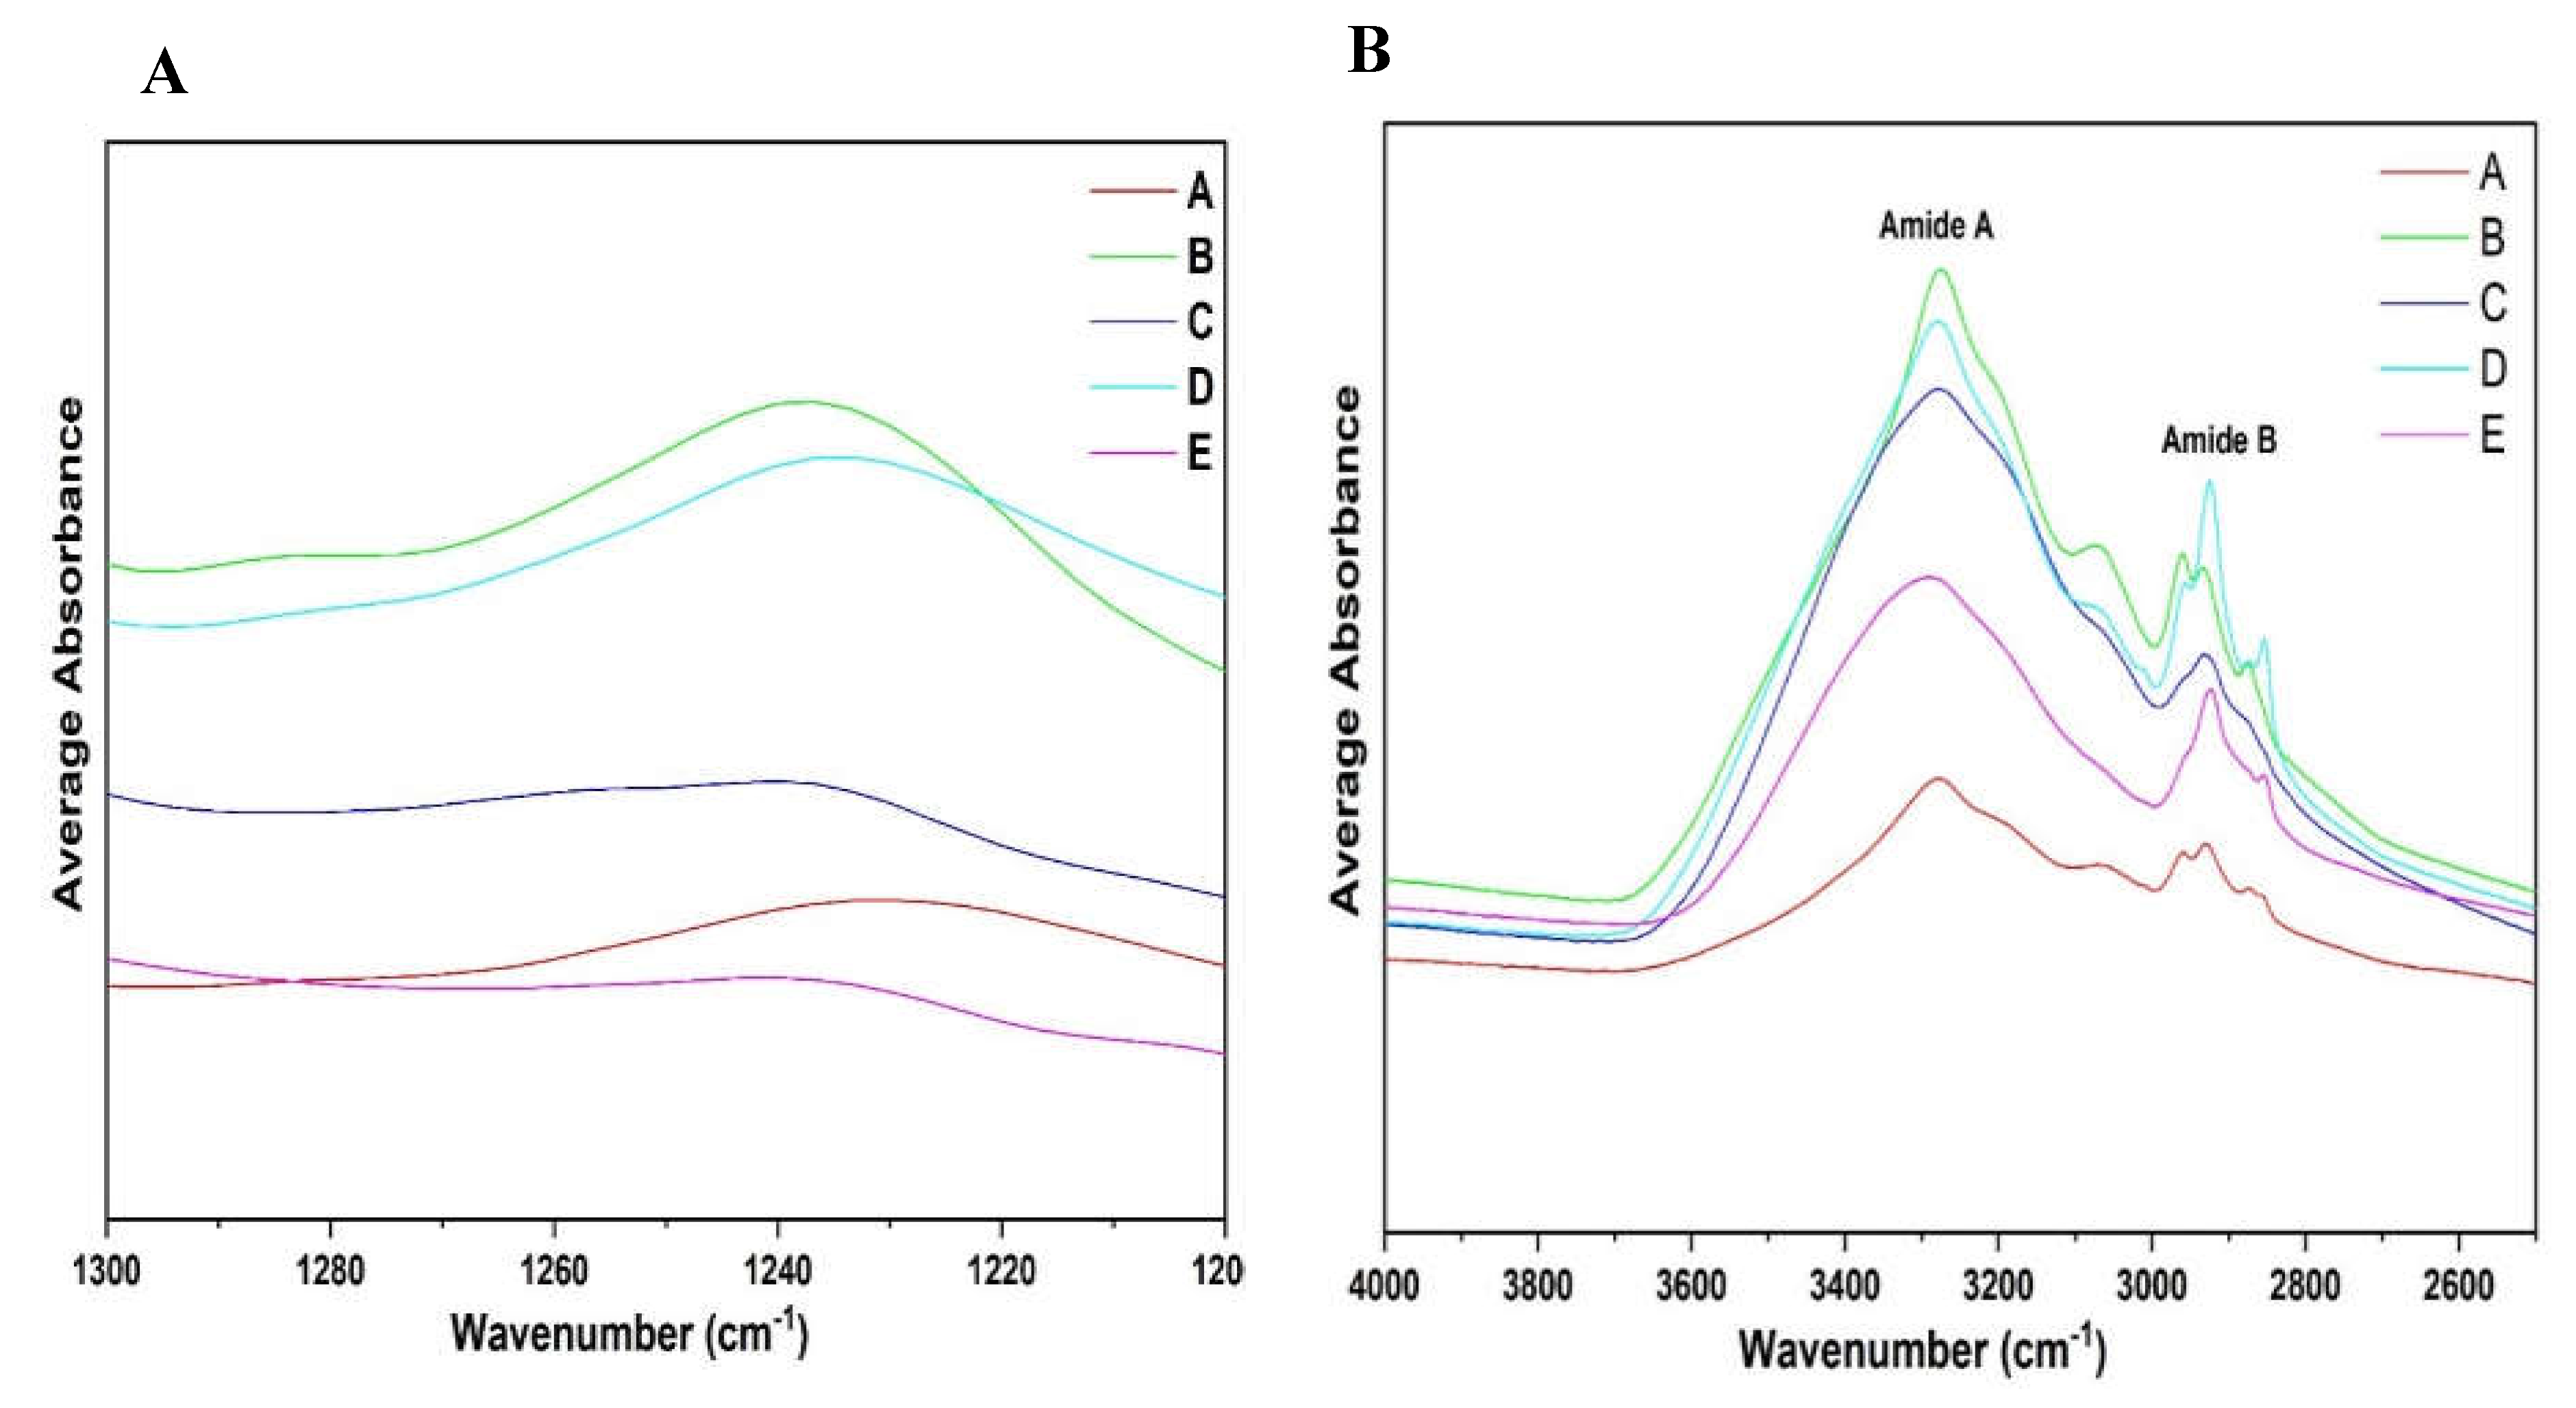

Table 1.
Particle size of faba bean flour used during protein fractionation.
| Particle size of flour | ||
| Dx [10] | 4.68 ± 0.1 | μm |
| Dx [50] | 29.4 ± 0.54 | μm |
| Dx [90] | 243.4 ± 2.61 | μm |
| Span: (D90-D10)/D50 | 8.12 | - |
Disclaimer/Publisher’s Note: The statements, opinions and data contained in all publications are solely those of the individual author(s) and contributor(s) and not of MDPI and/or the editor(s). MDPI and/or the editor(s) disclaim responsibility for any injury to people or property resulting from any ideas, methods, instructions or products referred to in the content. |
© 2025 by the authors. Licensee MDPI, Basel, Switzerland. This article is an open access article distributed under the terms and conditions of the Creative Commons Attribution (CC BY) license (http://creativecommons.org/licenses/by/4.0/).
Copyright: This open access article is published under a Creative Commons CC BY 4.0 license, which permit the free download, distribution, and reuse, provided that the author and preprint are cited in any reuse.


