Submitted:
25 February 2025
Posted:
25 February 2025
You are already at the latest version
Abstract
Sprinkler system performance enhancement has been a key area of research due to concerns about water shortages and rising energy costs. This study evaluated the hydraulic performance of the newly designed Spiral Fluidic Sprinkler (SFS) with various nozzles under different operating pressures. MATLAB software was used to simulate sprinkler uniformities under various operating pressures and the droplet diameter, velocity, and kinetic energy, was measured using a 2DVD video raindrop spectrometer. Results indicated that larger nozzles generally improved application uniformity and efficiency. Specifically, the application rates at distances from the sprinkler showed a reduction at smaller nozzle sizes and higher pressures, with larger nozzles maintaining better uniformity. The coefficient of variation (CV) was lower with the 4 mm nozzle compared to the 3 mm nozzle, suggesting more consistent water distribution. The average droplet size varied from 0.1 to 4.0 mm, with the majority of droplets smaller than 3 mm. The SFS demonstrated significant potential for enhancing water application efficiency, offering a means to conserve water while maintaining or improving agricultural productivity. Operating at lower pressures showed promising water savings, making the system suitable for use in varying field conditions, where uniformity and water conservation are critical.
Keywords:
sprinkler irrigation
; Spiral Fluidic Sprinkler
; droplet size
; uniformity coefficient
; water distribution
; nozzles
1. Introduction
Irrigation plays a pivotal role in ensuring efficient agricultural practices, directly impacting crop yield and water conservation. Traditional sprinkler systems often face challenges in achieving optimal water distribution, leading to inefficiencies in both water use and energy consumption. Applying water without adequate planning fails to meet the principles of effective irrigation, which require precise application at the right time and amount. Regular assessments of irrigation system performance using metrics such as application depth and water distribution uniformity coefficient are critical for optimizing water use in agriculture [1,2,3,4,5].
Numerous studies have explored factors influencing the performance and uniformity of sprinkler irrigation systems. Key variables include nozzle size, operating pressure, sprinkler spacing, riser height, field topography, discharge angle, and environmental conditions such as wind speed and direction [6,7,8,9,10]. Researchers have consistently highlighted the importance of irrigation uniformity, which measures the variance in water application across an area. Poor uniformity not only affects crop health but also results in energy inefficiencies and increased operational costs. Various solutions, such as auxiliary nozzles, distributive needles, and non-circular nozzles, have been employed to improve irrigation quality. However, their effectiveness diminishes at lower operating pressures, presenting a significant challenge for low-pressure systems [11,12,13,14,15].
In recent years, water conservation at reduced pressures has gained prominence in sprinkler irrigation research. Operating sprinklers at pressures below 100 kPa is a recommended strategy for achieving energy and water savings. However, conventional low-pressure systems often struggle with uneven water distribution, limited spray range, and prolonged irrigation durations. When operating at low pressure, water tends to concentrate at the end of the jet, leaving the forepart and middle segment inadequately irrigated. This phenomenon highlights the need for innovative designs capable of maintaining consistent performance under low-pressure conditions [16,17,18]. Although advancements like auxiliary nozzles and distributive needles have been introduced, their impact under low pressures remains limited [19,20,21].
To overcome these challenges, the Spiral Fluidic Sprinkler (SFS) has been developed by the Research Center of Fluid Machinery Engineering and Technology at Jiangsu University. Indoor testing was selected to eliminate environmental variability such as wind and uneven terrain, ensuring controlled and repeatable conditions for evaluating hydraulic performance. This novel sprinkler leverages dynamic fluidic principles to generate a spiral flow pattern, enhancing water dispersion and coverage. The design aims to address the limitations of conventional systems by improving uniformity and reducing energy consumption. This study evaluates the hydraulic performance of the SFS, focusing on the effects of various nozzle sizes (3, 4 and 5 mm) and operating pressures. These nozzle sizes and pressure ranges (100–250 kPa) are selected to cater for a range of practical applications, balancing small-scale precision irrigation with large-scale agricultural needs. The findings will contribute to advancing irrigation technologies, offering practical solutions for energy-efficient and effective water management in agriculture.
2. Materials and Methods
2.1. Study Area
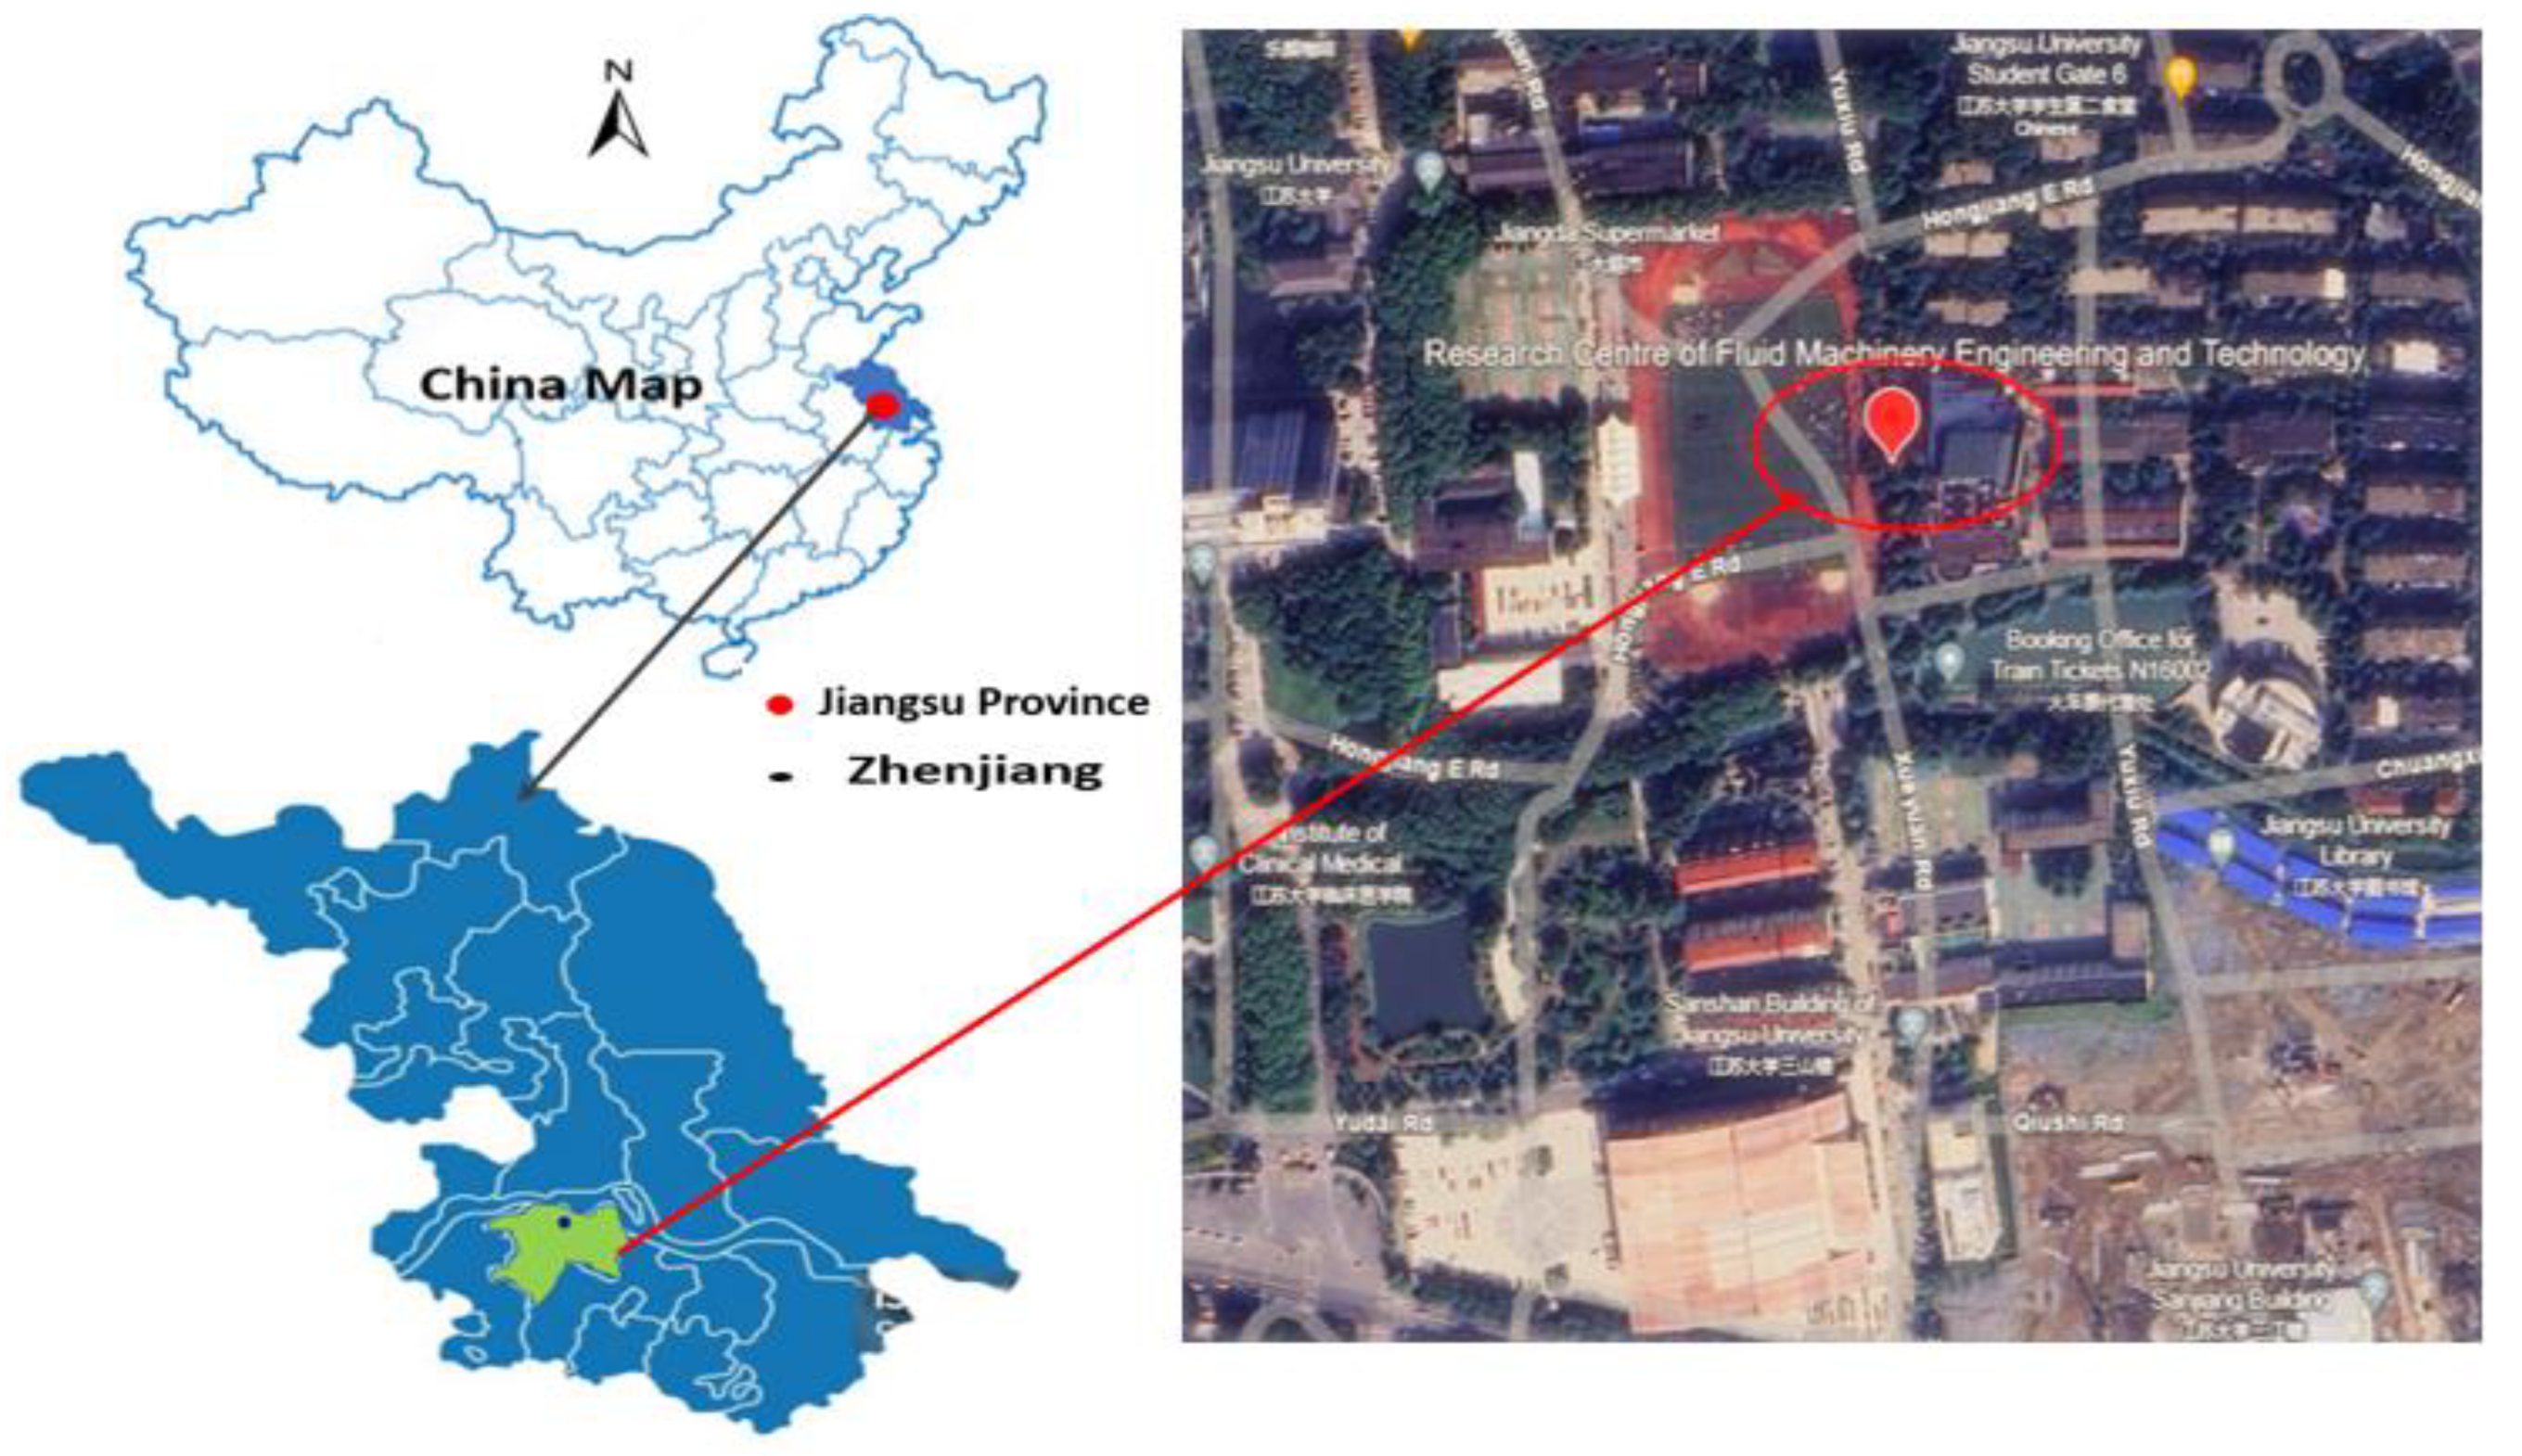
This section outlines the study area for evaluating the performance of the Spiral fluidic sprinkler (SFS). The sprinkler was designed by the Research Centre of Fluid Machinery Engineering and Technology at Jiangsu University in Zhenjiang, China. It is a region characterized by a humid subtropical climate with moderate elevation and significant annual rainfall. This area is located at latitude 32°11'57"N and longitude 119°30'51"E, at an elevation of 15 meters.
Figure 1.
Map of China showing Jiangsu University and its surroundings.
2.2. Materials and Equipment
The experimental parameters were selected based on industry standards for sprinkler irrigation and the need to evaluate performance under varying operational conditions. These conditions were chosen to simulate scenarios encountered in diverse agricultural settings.
The Spiral Fluidic Sprinkler (SFS) represents a novel approach to sprinkler design, characterized by its unique spiral flow pattern and dynamic fluidic mechanism. The principle of operation is based on spiral flow. This spiral flow pattern creates a swirling motion of water droplets, resulting in improved dispersion and coverage across the irrigated area. The dynamic nature of the SFS allows for greater flexibility in adjusting water distribution patterns, making it well-suited for diverse agricultural applications. Figure 2 and Table 1 show the prototype and schematic diagram of the Spiral Fluidic Sprinkler and the sprinkler head specifications.
2.3. Experimental Procedures
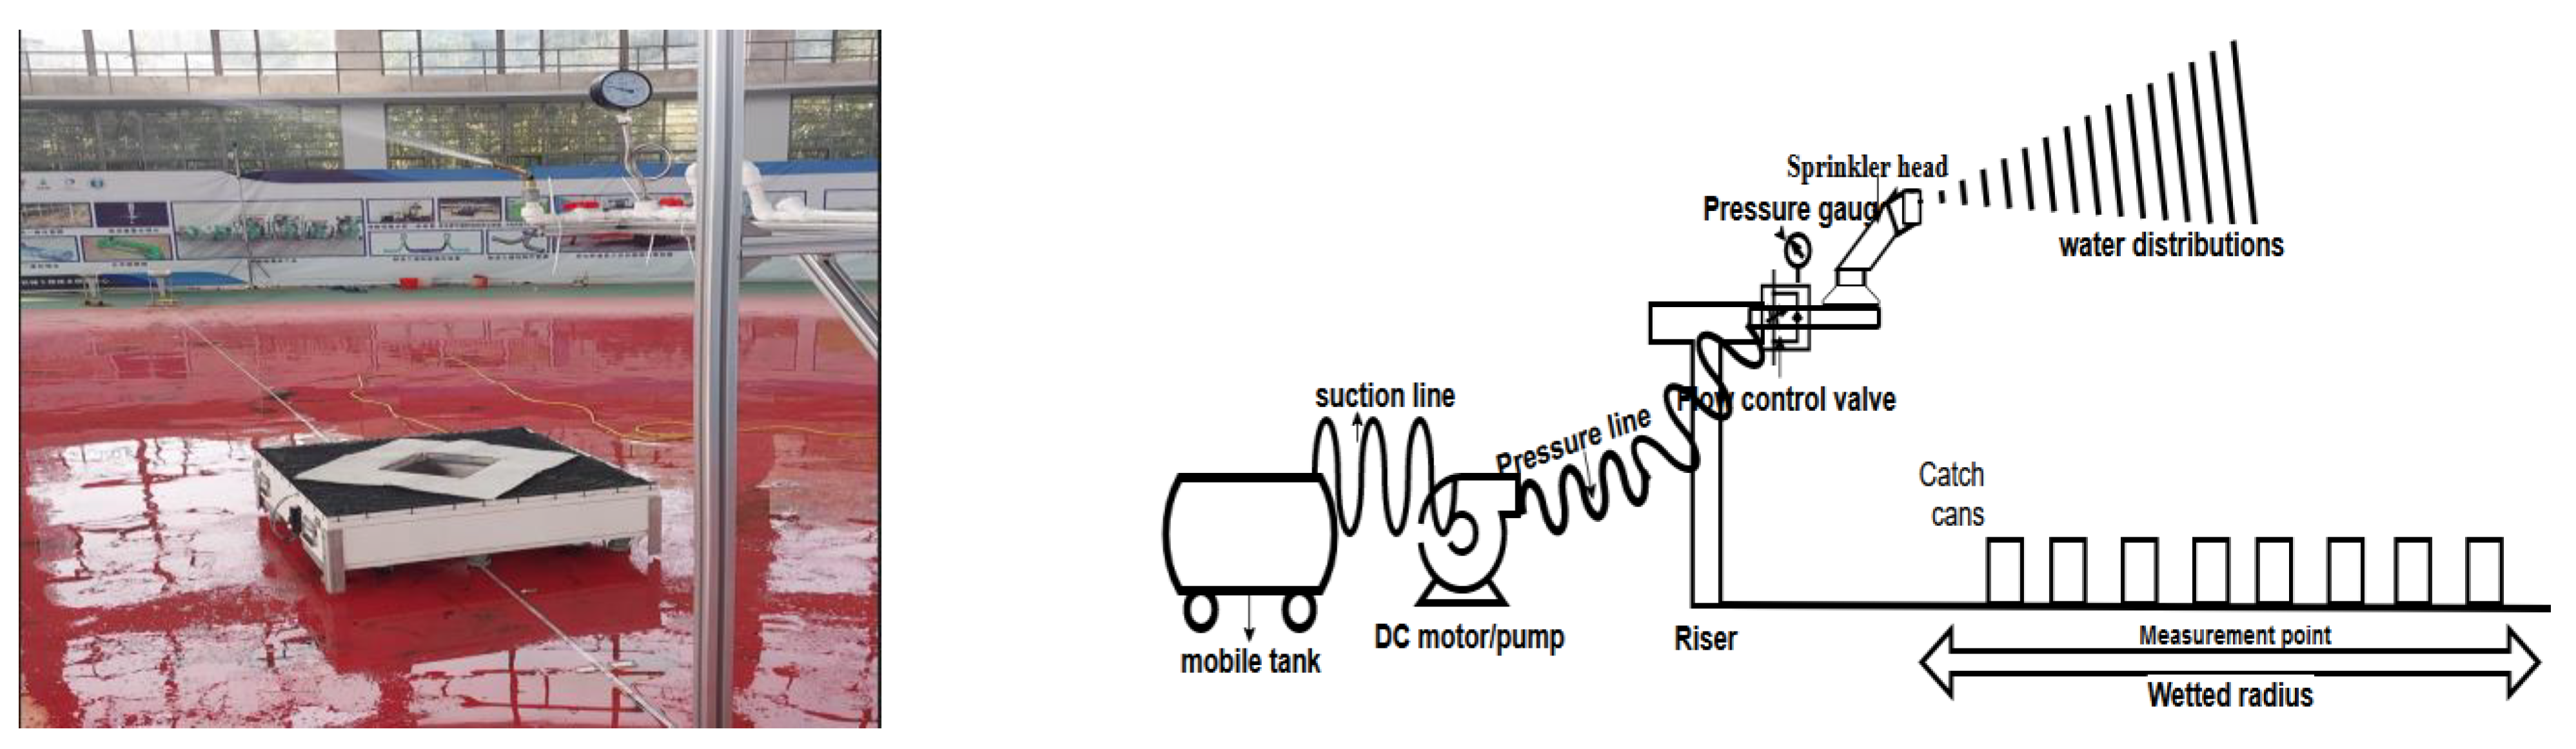
The experiments were conducted at the indoor facilities of the Research Center of Fluid Machinery Engineering and Technology, Jiangsu University (Jiangsu province). The diameter of the circular-shaped indoor laboratory is 44 m. The water pump was used to supply water from a movable water tank. The sprinkler head was mounted on a 1.5 m riser was mounted perpendicular to the horizontal. Catch cans used in performing the experiments were cylindrical in shape, 200 mm in diameter and 600 mm in height. The catch cans were arranged in two legs around the sprinkler as shown in Figure 3. Each leg contained 14 catch cans placed 0.5 m apart constituting 28 catch cans in total. The sprinkler was run for 60 minutes to standardize the environment conditions before the experiment was carried out Zhu et al., [23]. The sprinkler flow rate was 0.48 m3/h for an operating pressure of 250 kPa, which was controlled by pressure regulation.
The operating pressure at the base of the sprinkle head was regulated and maintained by a valve with the aid of a pressure gauge with an accuracy of ±1%. The corresponding operating pressures were 100, 150, 200 and 250 kPa, respectively. The application of water depth measurements was carried out in accordance with [24] The experiment lasted for an hour, and the water depth in the catch cans was measured with a graduated measuring cylinder. Droplet sizes were determined using a 2D-Video Distrometer (2DVD) technique. The device has the following specifications: a drop diameter measurement ranges from 0.125 to 6.5 mm with an increment of 0.125 mm, and a measuring area that is 1 m long, 1 mm wide, and 0.2 m thick. The working principle is that two CCD line scan cameras face the opening of the lighting units. The object in the measurement area (determined by the cross-section of the two light paths viewed from above) blocks the light and is detected as shadows by the cameras. Further optical elements of the light paths, which have been omitted from this picture for the sake of simplicity, are two mirrors and a pair of slit plates that can contribute to the compact dimensions of the device and its insensitivity concerning spray. Each camera contains a small embedded computer that is responsible for handling the data capture process, the analysis of the data and its conversion and compression into a format suitable for further processing and transporting to the indoor user terminal. The droplet measurement was carried out at 1 m intervals along the radial direction of the sprinkler under a working pressure of 100, 150, 200, and 250 kPa. The sprinkler was allowed to spray over the measurement area for at least five minutes to ensure a sufficient number of drops. A minimum of 100,000 drops were produced by the indoor user terminal, but only 92% of the drop sizes were analyzed after filtering. While the indoor conditions eliminate environmental factors such as wind, they do not account for field-level variables such as soil type, slope, or evapotranspiration, which could influence water distribution.
Figure 3.
Experimental setup in the indoor laboratory.
2.4. Computed Coefficient of Uniformity
Matrix Laboratory (MATLAB R2020b) software was used to simulate sprinkler uniformities under various operating pressures. The water distribution data from a single nozzle was analyzed using cubic spline interpolation, and the observed data was subsequently formatted into a grid. The combined uniformity coefficients for the overlapped sprinklers were then computed using the superposition approach to create the ideal combined water distribution maps. The range of the combination spacing value was R to 1.8R in order to avoid the occurrence of missed spraying. The statistical analysis of the droplet data set yielded the characteristics of centrality and droplet size dispersion. Equations (1) and (2) were used, respectively, to calculate the two droplet size parameters used in the study: Average volume diameter (, mm) and arithmetic mean diameter (d, mm). Equation (3) determines the water application rate using the Christiansen coefficient of uniformity (). Equation (4) was employed to compute the discharge coefficients of every nozzle by utilizing the observed pressure-discharge data:
where Q is the volumetric discharge of the sprinkler (m3 s−1), as is the mass of the i-th object or particle in the system, is the nominal cross-sectional area of the nozzle (m2), g is the gravitational acceleration (m s−2), H is the pressure head (m), c is the discharge coefficient, and the discharge exponent for the sprinklers. To describe the stability of the above-mentioned hydraulic performance when the sprinkler is working, the standard deviation (STD) and the variation coefficient (CV) were used to analyze the data, and the calculation formulas are (5) and (6).
Where hi represents the i-th water depth value (mm) of each measuring point arranged from small to large; n represents the total number of measuring points and represents the average spraying water depth (mm) on the sprinkling irrigation area.
3. Results and Discussion
3.1. Spray Range
The measurements of spray ranges were repeated three times, and the averages were recorded. The spray ranges for different types of nozzles are listed in Table 2. Different nozzle sizes resulted in variations in sprinkler ranges under the same operating pressure. The radius of throw increased as the nozzle size increased for all pressures. The lowest radius of throw was achieved when the sprinkler was operated at a pressure of 100 kPa, while the maximum radius of throw was obtained when it was operated at a pressure of 250 kPa. However, there was no appreciable variation in the radius of throw between 250 and 150 kPa. With the rising cost of electrical energy consumed by a pump, managing the operating pressure at a lower level of 150 kPa ensures more controlled water distribution, preventing over-irrigation, reducing water wastage, and improving energy efficiency, ultimately lowering operating costs. With a pressure of 250 kPa, the spray range from nozzle size 5 m was largest with a value of 7.7 m, possibly due to a smaller surface area for the interruption of jet flow, leaving it undisturbed for a sufficient period within the irrigation to maintain a large spray range. With an increase in pressure, the standard deviations were 2.6%, 2.4%, 2.5%, and 2.8% for 100, 150, 200, and 250 kPa, respectively. This aligns with previous research on the relationship between nozzle sizes and spray range [24,25]. In terms of the discharge equation, multiple studies have concluded that the discharge exponent is independent of pressure for a specific nozzle diameter, and that the discharge exponent remains constant at 0.5 [26,27]. In this study, the discharge exponent was assumed to be equal to 0.5. The equation allowed for the calculation of the flow rate considering each pressure and nozzle diameter as presented in Table 2. The discharge coefficient remained fairly unchanged for the pressure ranges with each type of nozzle used in this study. This means that the discharge coefficient was independent on the working pressure. Similar findings were previously reported [28]. Smaller nozzles (3 mm) typically deliver lower discharge and application rates, which may contribute to improved uniformity. However, they may not be sufficient to meet the water requirements of larger fields. Medium-sized nozzles (4 mm) offer a balanced performance, providing higher discharge across most pressures, making them well-suited for medium-to-large fields. Larger nozzles (5 mm) perform optimally at moderate pressures, making them suitable for larger fields. However, at high pressures, they may pose a risk of over-irrigation in certain areas. These results suggest that the 4 mm nozzle provides an optimal balance between uniformity and water conservation at moderate pressures (150 kPa), making it suitable for medium-sized fields.
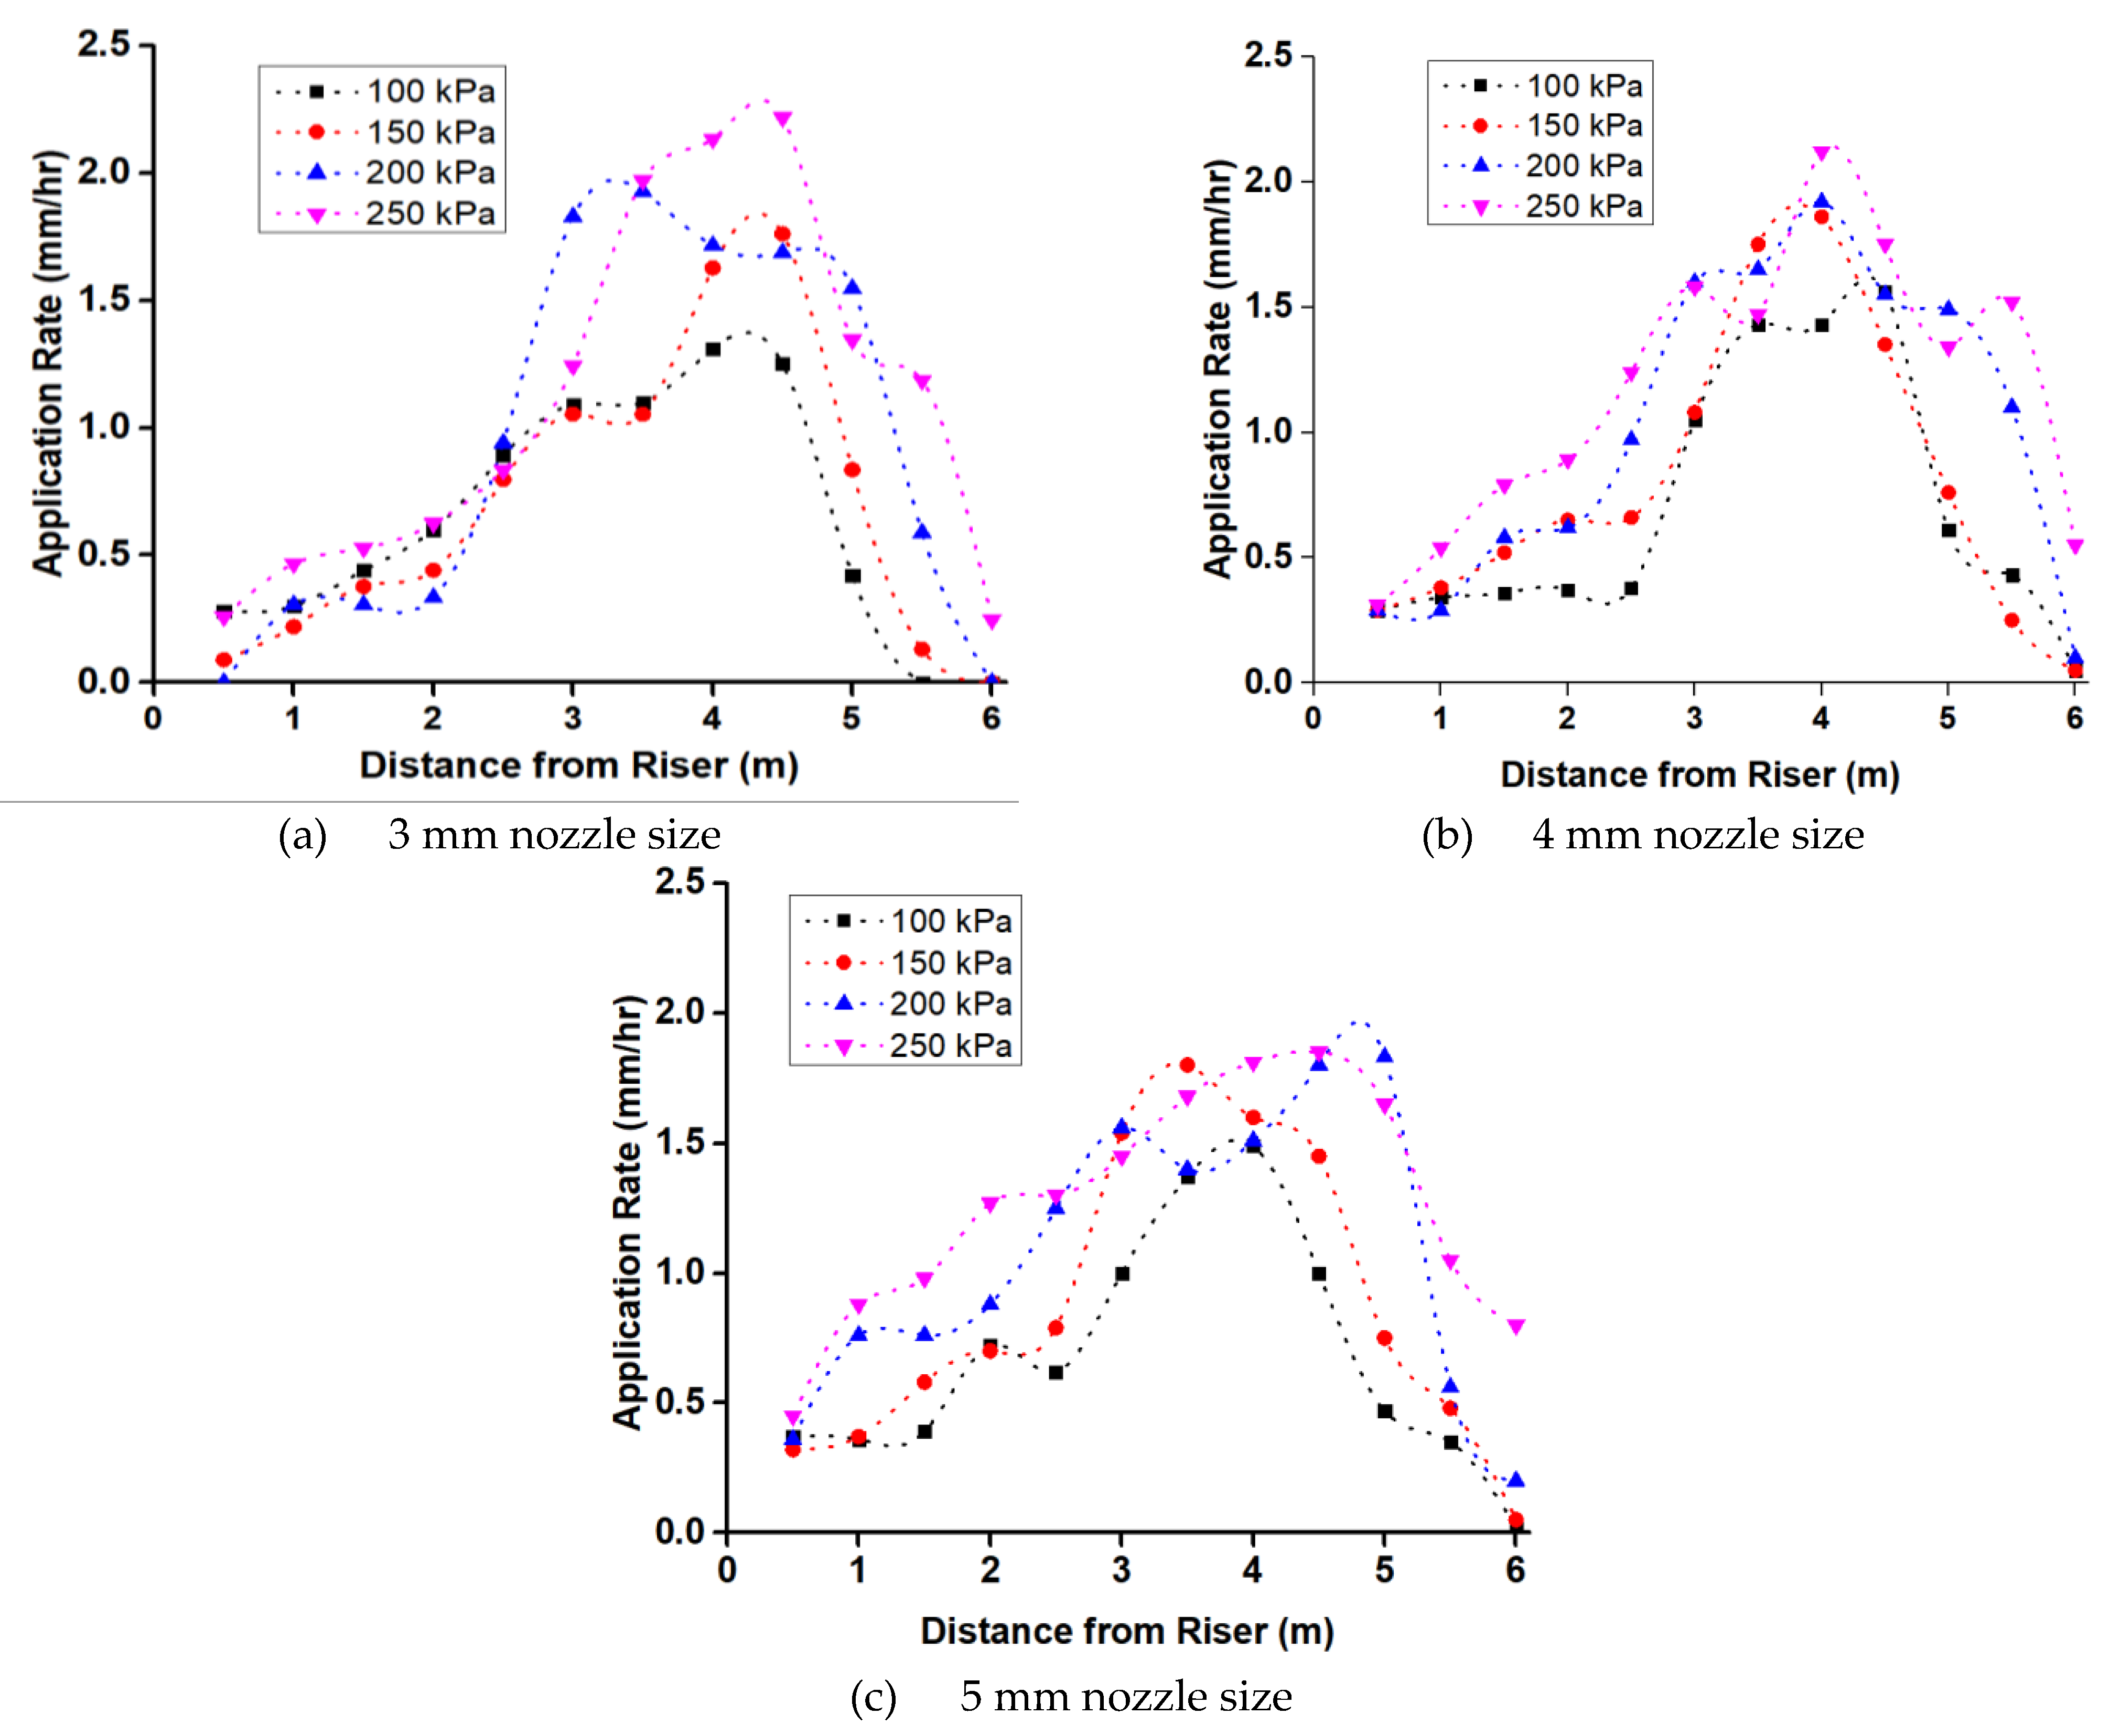
3.2. Water Distribution Patterns
Figure 4(a–c) shows the water distribution for different nozzle sizes at varying operating pressures in the investigation. The study revealed that the application rate grew with the sprinkler's distance from the riser until it reached its maximum value and then dropped for all pressures (100, 150, 200, and 250 kPa). The application rates rose as operating pressures were raised until they reached their maximum, at which point they began to fall. This shows that higher operating pressures result in increased application rates, with the highest values occurring at mid-range distances before tapering off.
The 3 mm nozzle's application rate fluctuated between 0.25 and 2.22 mm/hr for 250 kPa being the highest. For each of the four pressures under analysis, the highest application rate value was found to be 1.25 mm/h at a distance of 4.5 m for 100 kPa, 1.76 mm/h at 4.5 m for 150 kPa, 1.69 mm/h at 4.5 m for 200 kPa, and 2.22 mm/h at 4.5 m for 250 kPa.
The comparison of water distribution profiles at different operating pressures revealed that all nozzle sizes produced a bell-shaped curve, with variations in spray intensity and range depending on pressure settings. Larger nozzles, such as 4 mm and 5 mm, typically resulted in a higher average application rate due to increased discharge. However, the spray intensity near the sprinkler was lower compared to smaller nozzles, as the water was distributed over a larger area [29]. This highlights the trade-off between nozzle size and uniformity of water distribution—larger nozzles enhance coverage but reduce localized application near the sprinkler.
Smaller nozzles produced more concentrated water application near the sprinkler due to increased jet breakup, resulting in a finer, more localized spray pattern. While operating pressure influenced the application rate, its impact was less significant compared to nozzle diameter. This finding aligns with previous studies on the effects of pressure and nozzle size on irrigation sprinkler water distribution [30]. The comparison shows that in fields with varying topography, the uniform distribution achieved by the 4 mm nozzle at 150 kPa could reduce water runoff and enhance crop yield.
Figure 4.
Water distribution profiles for different types of nozzles and pressures.
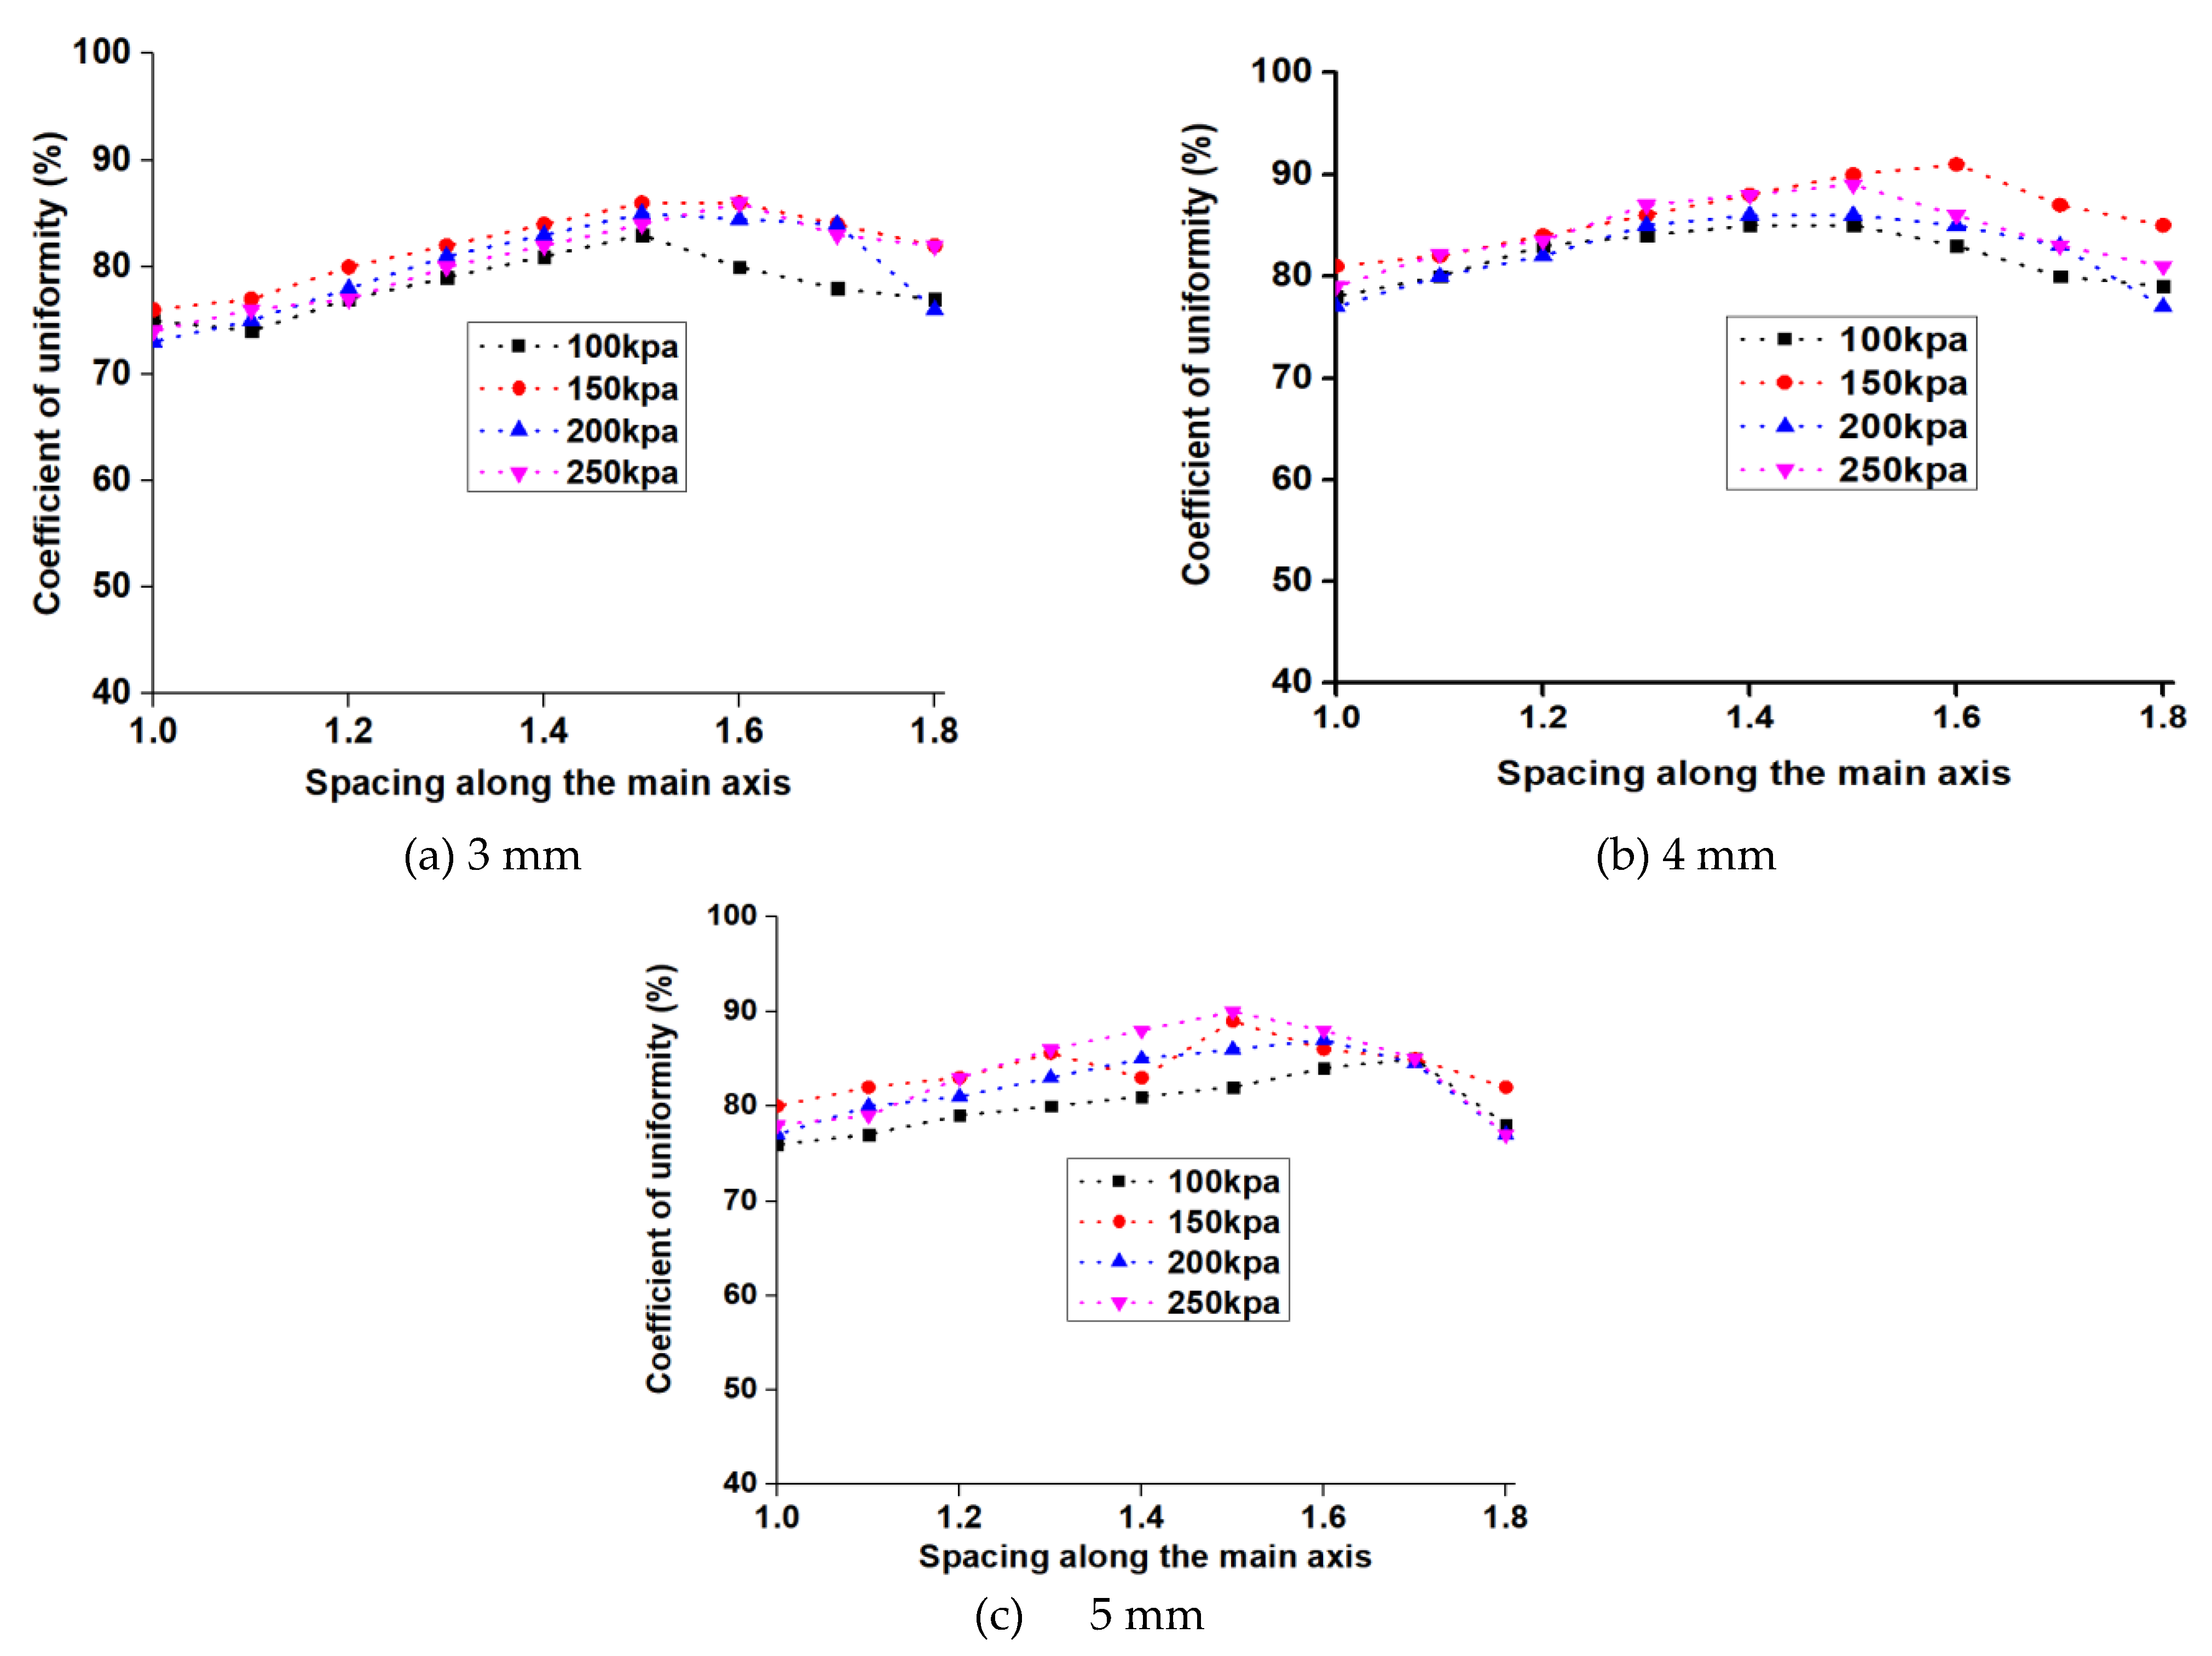
3.3. Simulated CUs
The study used rectangular spacing for lateral wetted radius multipliers of 1.0, 1.1, 1.2, 1.3, 1.4, 1.5, 1.6, 1.7, and 1.8 for all nozzle sizes. Figure 5 illustrates the relationships between the simulated CU and spacing along the vertical and horizontal axes. As the distance from the sprinkler increased, the CU also increased until it reached the maximum and then decreased for all the pressures and nozzles. For example, the simulated CUs from the 4 mm nozzle showed an increase in spray range, reaching 77% at R to 1.3R (200 kPa) and 79% at R to 87% at 1.3R (250 kPa). The uniformities increased from 1 to 1.3R spacing for the various pressures, averaging 79.67% and 81.57%, respectively. Comparatively, the simulated CUs from the 5 mm nozzle increased from 77% to 83 %, respectively. The uniformities increased from 77% at R to 83% at 1.3R (200 kPa) and from 78% at R to 86% at 1.3R (250 kPa). A comparison of the coefficient of variation (CV) showed that at 200 kPa, the 5 mm nozzle had a minimum value of 8.63%, while the 4 mm nozzle had a higher value of 12.4%. The 4 mm nozzle size exhibits a higher CV, indicating a more inconsistent distribution of water across the catchment points. In contrast, the 5 mm nozzle size demonstrates better uniformity in water distribution, as reflected by its lower coefficient of variation. Based on the t-test, the difference in the CVs for the 4 mm nozzle under 200 kPa and 250 kPa is statistically significant (p<0.05). This confirms that the water distribution is significantly more variable under 250 kPa pressure compared to 200 kPa pressure.
On the other hand, the simulated CUs from 3 mm at 200 kPa were only slightly lower than those below 250 kPa. More water was applied near the sprinkler as a result of the flow becoming less uniform due to the understanding that the water pressure and spray pattern typically cause the water to fall more densely near the sprinkler head. As the distance from the sprinkler increases, the water droplets tend to spread out, leading to a decrease in water intensity. This serves as more evidence that 3 mm performs better in low-pressure environments. Using a 3 mm nozzle device as an example, the CUs rose with an average value of 79.8% (150 kPa) from 76% at R to 84% at 1.4R. The CUs showed a modest increase with increasing pressure with spacing. This is in line with the general tendency of higher pressure observed in the sprinkler atomization effect. On the other hand, the simulated CUs from C2 at 200 kPa were only slightly lower than those at 250 kPa.
The observed trends can be attributed to the interaction of sprinkler spacing, nozzle characteristics, and operating pressures. At smaller spacings, the coefficient of uniformity (CU) is lower due to inadequate overlap of spray patterns, leading to inconsistencies in water distribution. However, as the spacing increases, the overlap between adjacent sprinkler patterns improves, and the CU increases, reaching an optimal value at spacings of approximately 1.3R to 1.4R. Beyond this point, further increases in spacing result in reduced overlap, causing a decline in CU. Larger nozzles, such as the 5 mm, show better performance at lower pressures, likely due to their ability to maintain a more consistent spray pattern and compensate for the effects of reduced pressure. Conversely, smaller nozzles, such as the 3 mm, exhibit higher sensitivity to pressure variations, which affects their uniformity.
Figure 5.
Computed coefficient of uniformity (CU) for different types of nozzles and pressures.
3.4. Droplet Size Distributions
Findings of droplet size distribution were obtained at the edge of the spray range using the 2DVD Technique. The weighted cumulative frequency represents the cumulative specific gravity value between the weighted full diameter of the spray and droplets smaller than one diameter. As the droplets rose in a radial direction, those with the biggest diameters fell at the terminal point. Figure 6 displays the cumulative droplet diameter frequencies as a function of droplet diameter from several types of nozzle sizes under 100 kPa, 150 kPa, 200 kPa, and 250 kPa. The smallest droplets were visible at the sprinkler range boundaries, and the droplets' sizes varied greatly. The average size of type 3 mm droplets varied from 0.1 to 4.0 mm. The droplets under 1 mm showed a cumulative frequency of 84%, 91%, and 70% at pressures of 150, 200, and 250 kPa. Under 2 mm, the percentages were 91%, 92%, and 81%; and under 3 mm, they were 96%, 94%, and 92%. The mean diameters of the 4 mm nozzle droplets ranged from 0 to 3.8 mm. Cumulative frequencies of drops below 1 mm were found to be 77%, 80%, and 82%; drops under 2 mm had frequencies of 84%, 92%, and 90%; and drops under 3 mm had frequencies of 90%, 95%, and 96%. The study revealed minor differences in droplet diameters, especially between 200 and 250 kPa. One potential explanation is that the jet flow broke up into smaller droplets near the sprinkler at higher working pressures. These smaller droplets tend to cluster near the sprinkler and show minimal variations in size as the pressure rises [31]. The nozzle size of 4 mm had the largest droplet size at 1.55 mm, while the 3 mm nozzle had the narrowest droplet size range, reaching a maximum of 1.44 mm. In comparison, the 5 mm nozzle generally produced droplet sizes ranging from 0.1 to 4 mm. Under pressures of 100 kPa, 150 kPa, and 200 kPa, the droplets under 1 mm had a cumulative frequency of 86, 84, and 80%; under 2 mm, 95%, 90%, and 90%; under 3 mm, 97%, 98%, and 96%; and under 4 mm, 100% as shown in (Figure 6). Because of the momentum loss, nozzles with smaller outlet diameters created finer droplets that tended to cover a smaller region. The increase in the nozzle's outlet diameter resulted in insufficient disruption of the jet, leading to larger droplet sizes. This indicates that changes in the nozzle outlet diameter had a significant impact on droplet diameter, consistent with the overall trend. The ballistic model simplifies the actual situation for modeling purposes by assuming a fixed droplet size at any distance from the sprinkler. This supports the theory that droplet formation continues constantly along the jet's path [32].
3.5. Statistical Analyses of Droplet Diameter
The statistical parameters of the droplet diameters obtained for the nozzles and operating pressures are shown in Table 3. The volumetric mean diameter, the median diameter, the coefficient of variation, the arithmetic mean, and the standard deviation are among the parameters. The mean droplet diameter of these characteristics decreased overall for the nozzles as the pressure increased. The coefficients of diameter variation ranged from 76~114%, with a mean value of 96%; the standard deviations of droplet diameter from 3 mm ranged from 0.41~0.59 mm, with a mean value of 0.51 mm. Regarding 3 mm, the standard deviation of droplet diameter varied from 0.62~0.79 mm, with a mean value of 0.72 mm; the coefficients of diameter variation ranged from 92~134%, with a mean value of 107%.The volumetric, mean, variances, CV, and median of the droplet sizes obtained from the sprinkler with different nozzle types. The mean droplet sizes of the nozzles generally decreased with increasing pressure. The nozzle size (4 mm) had a mean value of 0.43 mm and a standard deviation of droplet sizes ranging from 0.37 to 0.48 mm. The average value of the CV was determined to be 84%, ranging from 65% to 92%. Regarding 4 mm, the standard deviation of droplet diameter varied from 0.62~0.79 mm, with a mean value of 0.72 mm; the coefficients of diameter variation ranged from 92~134%, with a mean value of 107%. The mean droplet sizes of the nozzles generally decreased with increasing pressure. The sprinkler with the nozzle size 5 mm had a mean value of 0.43 mm and a standard deviation of droplet sizes ranging from 0.37 to 0.48 mm. The average value of the CV was determined to be 84%, ranging from 65% to 92%.
At a particular distance from the sprinkler, the average droplet sizes produced by the sprinkler devices were identical. The nozzle size that produced the smallest droplet size was 3 mm, which is less than the minimum droplet size diameter. The droplet size decreased from 0.6 to 0.3 mm, increasing losses from evaporation and wind drift [33,34,35,36,37]. Nevertheless, because the maximum droplet diameter shrank and outpaced the rate at which the minimum droplet size diameter increased, nozzle size 4 mm droplet sizes were greater. This indicates that, in field situations, the new sprinkler with the nozzle size of 5 mm may be helpful in minimizing evaporation and wind drift losses while avoiding soil damage. A summary of droplet sizes for 10%, 50%, and 90% from various nozzle and operating pressures is given in Table 4.
The distribution of the water droplets' kinetic energy intensity along the spray range for various nozzle sizes and operating pressures of 100, 150, 200, and 250 kPa is depicted in Figure 7. At all nozzle sizes and operating pressures, the droplet kinetic energy intensity generally followed the same trend, as seen in Figure 7. It is interesting to note that while the maximum intensity of the droplet kinetic energy decreased with increasing pressure, the intensity of droplet kinetic energy first increased and then decreased along the radial direction of the nozzle. Figure 7 illustrates the peak intensity of droplet kinetic energy under 100, 150, 200, and 250 kPa as follows: 0.05 × 10⁻³ W/m2, 0.39 × 10⁻³ W/m2, 0.6 × 10⁻³ W/m2, and 0.86 × 10⁻³ W/m2, for a 3 mm sample. For each pressure unit increase compared to 100 kPa, the maximum intensity of the droplet kinetic energy decreased by 25.6%, 37.2%, 41.2%, and 53.6%, respectively. As the nozzle size increased, the energy was distributed more evenly at constant pressure. At working pressures of 100, 150, and 200 kPa, the maximum droplet kinetic energy intensity was measured to be 0.86× 10⁻³ W/m2, 1× 10⁻³ W/m2, and 1.1× 10⁻³ W/m2, respectively.
4. Conclusions
In this study, an innovative sprinkler and nozzle device has been proposed to improve the performance characteristics of sprinkler irrigation. Indoor experiments were conducted across a range of operating pressures, and the following general conclusions can be drawn from the findings:
- Larger nozzle sizes generally increased the throw radius, with minimal variation observed between higher operating pressures. Given the rising cost of energy, operating at lower pressures can offer a practical balance between performance and water conservation, making it a more energy-efficient option for irrigation systems.
- The performance of the sprinkler system, including application rates and uniformity, varied with nozzle size and pressure. Larger nozzles contributed to more uniform water distribution, leading to more consistent irrigation. Smaller nozzles, while providing higher application rates at certain distances, showed greater variability in distribution, emphasizing the importance of nozzle selection for optimal performance.
- The Coefficient of Variation (CV) analysis revealed that the system exhibited better uniformity with specific nozzle sizes at certain pressures, emphasizing the critical role of selecting the right nozzle size to minimize variability in water distribution. This ensures more consistent coverage across the irrigated area, which is essential for efficient irrigation.
- The droplet size distribution was found to vary with pressure, with smaller droplets dominating at lower pressures. The distribution of droplet sizes affects both the efficiency of water application and the potential for evaporation losses, suggesting that optimizing droplet size is critical for maximizing irrigation efficiency.
The Spiral Fluidic Sprinkler demonstrated efficiency in conserving water while maintaining uniform application, making it a valuable tool for advancing sustainable agricultural practices. Further research under diverse environmental conditions will help solidify its role in modern irrigation systems.
Author Contributions
Conceptualization, Joseph Kwame Lewballah, Alexander Fordjour; Methodology, Joseph Kwame Lewballah; Software, Joseph Kwame Lewballah; Validation, Alexander Fordjour; Formal analysis, Joseph Kwame Lewballah; Investigation, Joseph Kwame Lewballah, Alexander Fordjour, Simin Yao; Resources, Xingye Zhu; Data curation, Joseph Kwame Lewballah, Alexander Fordjour, Simin Yao; Visualization, Simin Yao, Xingye Zhu; Writing—original draft, Joseph Kwame Lewballah; Writing—review & editing, Supervision, Project administration, and Funding acquisition were handled by Xingye Zhu.
Acknowledgments
The authors are greatly indebted to the Key R&D Project of Jiangsu Province (Modern Agriculture) (No. BE2022351), and the Project of Faculty of Agricultural Engineering of Jiangsu University (No. NZXB20210101).
Conflicts of Interest
The authors declare no conflict of interest.
References
- DeBoer, D.W.; Monnens, M.J.; Kincaid, D.C. Measurement of sprinkler drop size. Appl. Eng. Agric. 2001, 17, 11–15.
- Kohl, R.A.; Bernuth, R.D.; Heubner, G. Drop size distribution measurement problems using a laser unit. Trans. ASAE 1985, 28, 190–192. Water 2018, 10, 1301 14 of 15 17.
- Yuan S Q, Darko R O, Zhu X Y, Liu J P, Tian K. Optimization of movable irrigation system and performance assessment of distribution uniformity under varying conditions[J]. Int J Agric & Biol Eng. 2017, 10(1): 72-79.
- Thompson, A.; Gilley, J.R.; Norman, J.M. Sprinkler water droplet evaporation a plant canopy model. Trans. ASARE 1993, 36, 743–750.
- Lorenzini, G.; Wrachien, D. Performance assessment of sprinkler irrigation system a new indicator for spray evaporation losses. J. Int. Comm. Irrig. Drain. 2005, 54, 295–305.
- Bautista, C.; Salvador, R.; Burguete, J. Comparing methodologies for the characterization of water drops emitted by an irrigation sprinkler. Trans. ASABE 2009, 52, 1493–1504.
- Wilcox, J.C.; Swailes, G.E. Uniformity of water distribution by some under tree orchard sprinklers. Sci. Agric. 1947, 27, 565–583.
- Hart, W.E.; Reynolds, W.N. Analytical design of sprinkler systems. Trans. Am. Soc. Agric. Eng. 1965, 8, 83–85. 23.
- Kay, M. Sprinkler Irrigation Equipment and Practice; Batsford Limited: London, UK, 1988.
- Keller, J.; Bliesner, R.D. Sprinkle and Trickle Irrigation; Van Nostrand Reinhold Pun: New York, NY, USA, 1990. 25. Xiang, Q.J.; Xu, Z.D.; Chen, C. Experiments on air and water suction capability of 30PY impact sprinkler. J. Drain. Irrig. Mach. Eng. 2018, 36, 82–87.
- Karmeli, D. Estimating sprinkler distribution pattern using linear regression. Trans. ASAE 1978, 21, 682–686.
- Liu, J.P.; Liu, W.Z.; Bao, Y.; Zhang, Q.; Liu, X.F. Drop size distribution experiments of gas-liquid two phase’s fluidic sprinkler. J. Drain. Irrig. Mach. Eng. 2017, 35, 731–736.
- Liu, J.P.; Yuan, S.Q.; Li, H.; Zhu, X.Y. Numerical simulation and experimental study on a new type variable-rate fluidic sprinkler. J. Agric. Sci. Technol. 2013, 15, 569–581.
- Dwomoh, F.A.; Yuan, S.; Hong, L. Field performance characteristics of fluidic sprinkler. Appl. Eng. Agric. 2013, 29, 529–536.
- Zhu, X.; Yuan, S.; Jiang, J.; Liu, J.; Liu, X. Comparison of fluidic and impact sprinklers based on hydraulic performance. Irrig. Sci. 2015, 33, 367–374.
- Zhang, A.M.; Sun, P.N.; Ming, F.R.; Colagrossi, A. Smoothed particle hydrodynamics and its applications in fluid-structure interactions. J. Hydrodynamics 2017, 29, 187–216.
- Zhu, X.; Yuan, S.; Liu, J. Effect of sprinkler head geometrical parameters on hydraulic performance of fluidic sprinkler. J. Irrig. Drain. Eng. 2012, 138, 1019–1026.
- Coanda, H. Device For Deflecting a Stream of Elastic Fluid Projected Into an Elastic Fluid. U.S. Patent No. 2,052,869, 1 Spetember 1936.
- American Society of Biological Engineers. Procedure for Sprinkler Testing and Performance Reporting; ASAE S398.1; American Society of Biological Engineers: St. Joseph, MI, USA, 1985.
- Al-araki, G.Y. Design and Evaluation of Sprinkler Irrigation System. Doctoral Dissertation; University of Khartoum: Khartoum, Sudan, 2002.
- Chen, D.; Wallender, W.W. Droplet size distribution and water application with low-pressure sprinklers. Trans. ASAE 1985, 28, 511–516.
- Li, J.; Kawano, H.; Yu, K. Droplet size distributions from different shaped sprinkler nozzles. Trans. ASAE 1994, 37, 1871–1878.
- X. Zhu, A. Fordjour, S. Yuan, F. A. Dwomoh, and Z. Issaka, “Performance optimization of a newly designed dynamic fluidic sprinkler,” vol. 37, no. 1, pp. 33–41, 2021.
- Tarjuelo, J.M.; Montero, J.; Valiente, M.; Honrubia, F.T.; Ortiz, J. Irrigation uniformity with medium size sprinkler, part I: Characterization of water distribution in no—Wind conditions. Trans. ASAE 1999, 42, 677–689.
- King, B.A.; Winward, T.W.; Bjorneberg, D.L. Comparison of Sprinkler Droplet Size and Velocity Measurements using a Laser Precipitation Meter and Photographic Method. Am. Soc. Agric. Biol. Eng. 2013, 131594348.
- Sudheera, K.P.; Panda, R.K. Digital image processing for determining drop sizes from irrigation spray nozzles. Agric. Water Manag. 2000, 45, 159–167.
- Tarjuelo JM, Montero J, Carrión PA, Honrubia FT, Calvo MA (1999b) Irrigation Uniformity 823 with Medium Size Sprinklers. Part II. Influence of wind and other factors on water 824 distribution”. Trans ASAE 42(3):677–689.
- Wang, X., Fernandez, R.T., Cregg, B.M., Auras, R., Fulcher, A., Cochran, D.R., Niu, G., Sun, 826 Y., Bi, G., Nambuthiri, S., Geneve, R.L., 2015. Multistate Evaluation of Plant Growth 827 and Water Use in Plastic and Alternative Nursery Containers. HortTechnology 25, 42–49. 828. [CrossRef]
- West, Dr.J., 2014. Water Balance Case Study at an Outdoor Ornamental; Nursery Water 830 Resource Adaptation and Management Initiative. Ontario, Canada.
- Fordjour A, Zhu X Y, Jiang C L, Liu J P. Effect of riser height on rotation uniformity and application rate of the dynamic fluidic sprinkler[J]. Irrigation and Drainage, 2020, 69(4) :618-632.
- Zhang, L., Merkley, G.P., Pinthong, K., 2013. Assessing whole-field sprinkler irrigation 835 application uniformity. Irrig. Sci. 31, 87–105. [CrossRef]
- King, B.A.; Winward, T.W.; Bjorneberg, D.L. Comparison of Sprinkler Droplet Size and Velocity Measurements using a Laser Precipitation Meter and Photographic Method. Am. Soc. Agric. Biol. Eng. 2013, 131594348.
- Sudheera, K.P.; Panda, R.K. Digital image processing for determining drop sizes from irrigation spray nozzles. Agric. Water Manag. 2000, 45, 159–167.
- Thompson, A.; Gilley, J.R.; Norman, J.M. Sprinkler water droplet evaporation a plant canopy model. Trans. ASARE 1993, 36, 743–750.
- Liu J P, Liu X F, Zhu X Y, Yuan S Q. Droplet characterisation of a complete fluidic sprinkler with different nozzle dimensions, Biosystems Engineering. 2016, 148(6) 90-100.
- Lorenzini, G.; Wrachien, D. Performance assessment of sprinkler irrigation system a new indicator for spray evaporation losses. J. Int. Comm. Irrig. Drain. 2005, 54, 295–305.
- Zhang, L., Hui, X., Chen, J., 2018. Effects of terrain slope on water distribution and application 832 uniformity for sprinkler irrigation. Int. J. Agric. Biol. Eng. 11, 120–125. 833. [CrossRef]
Figure 2.
Prototype of the Spiral Fluidic Sprinkler. 1. Swivel connection block; 2. Hollow shaft; 3. Sprinkler body; 4. Water inlet; 5. Main nozzle; 6. Main flow; 7. Auxiliary nozzle; 8. element body; 9. cover plate; 10 Air hole Jet; 11. Outlet cover plate.
Figure 2.
Prototype of the Spiral Fluidic Sprinkler. 1. Swivel connection block; 2. Hollow shaft; 3. Sprinkler body; 4. Water inlet; 5. Main nozzle; 6. Main flow; 7. Auxiliary nozzle; 8. element body; 9. cover plate; 10 Air hole Jet; 11. Outlet cover plate.
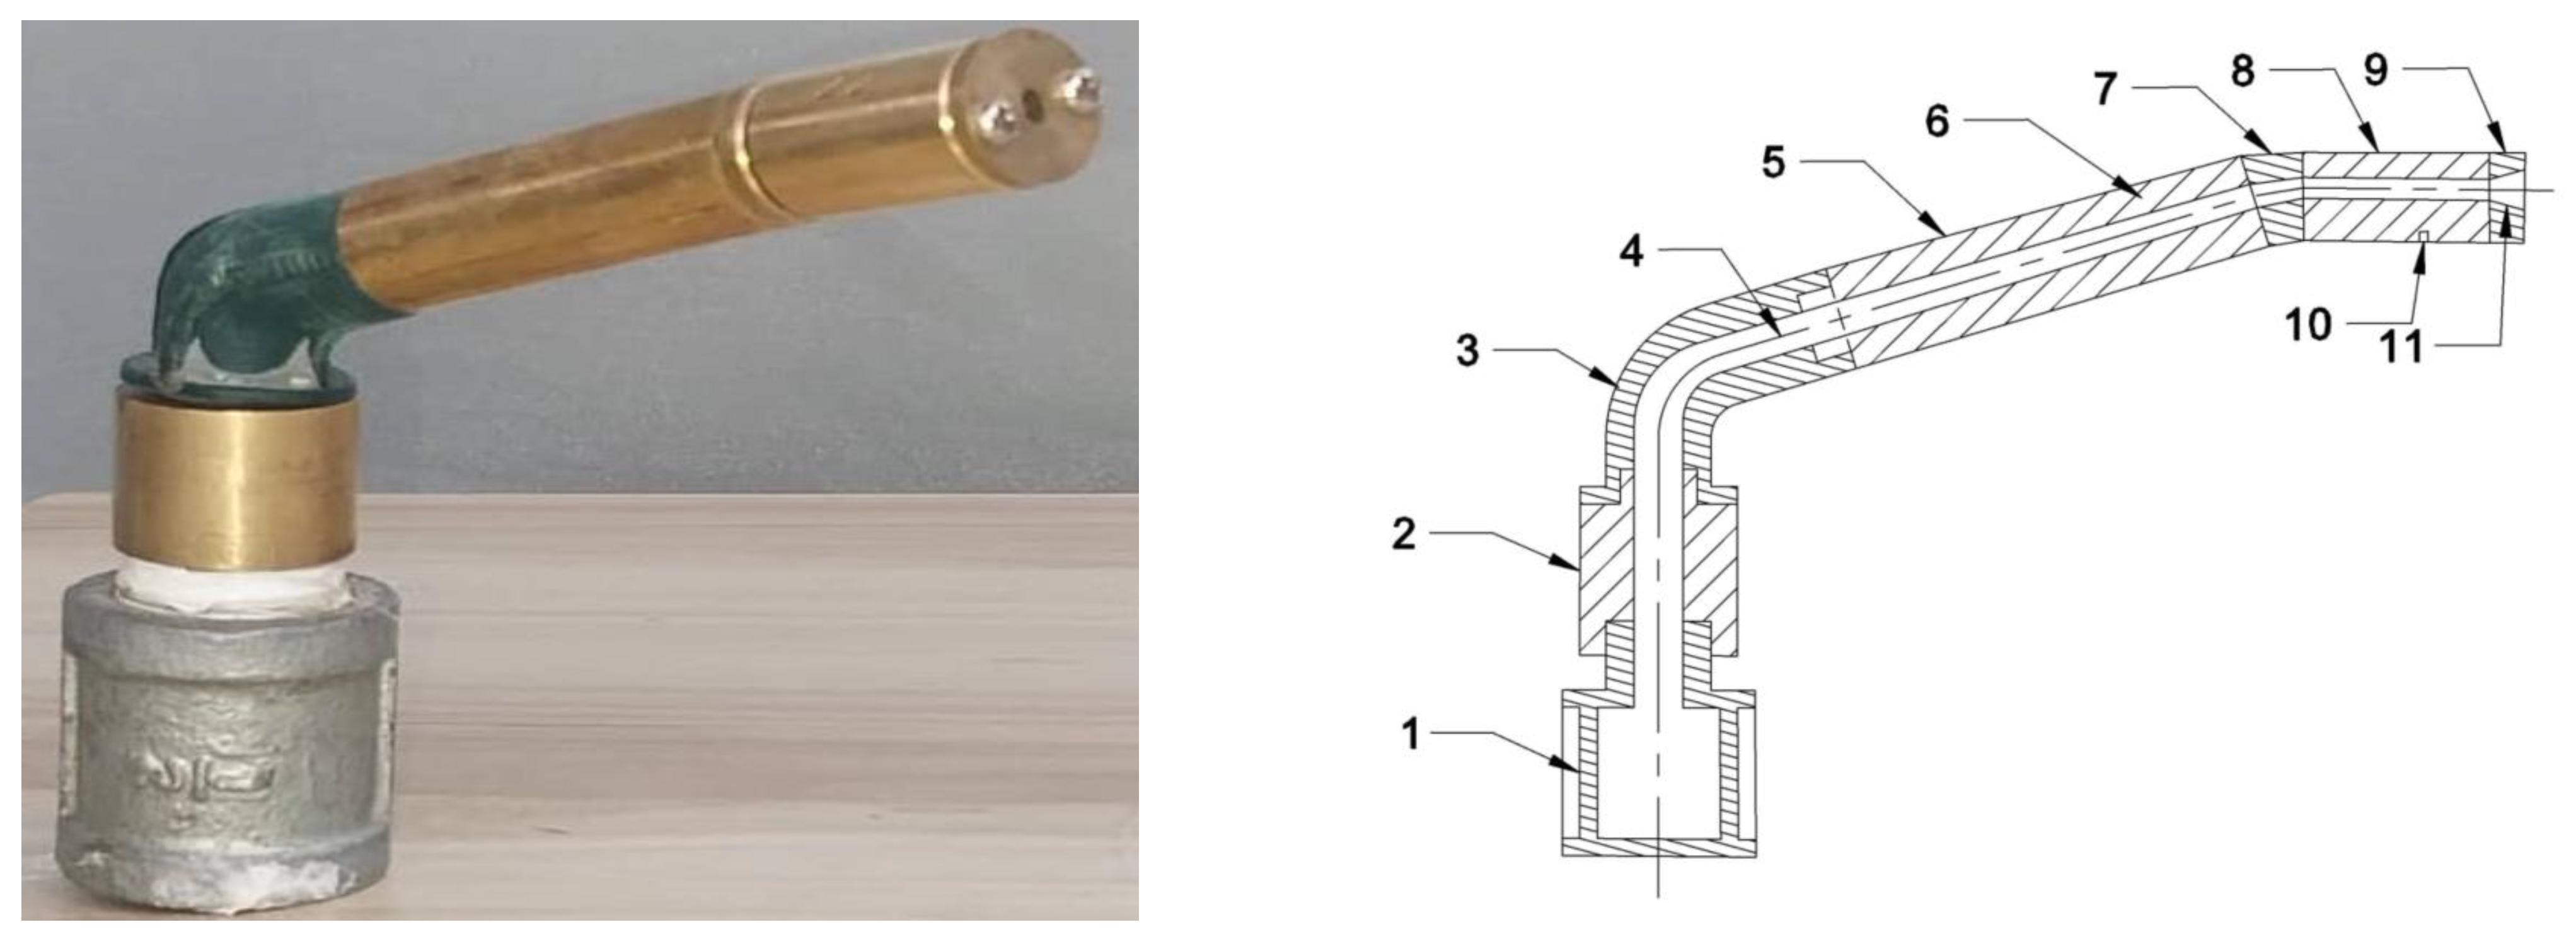
Figure 6.
Cumulative droplet diameter frequency for different conditions.
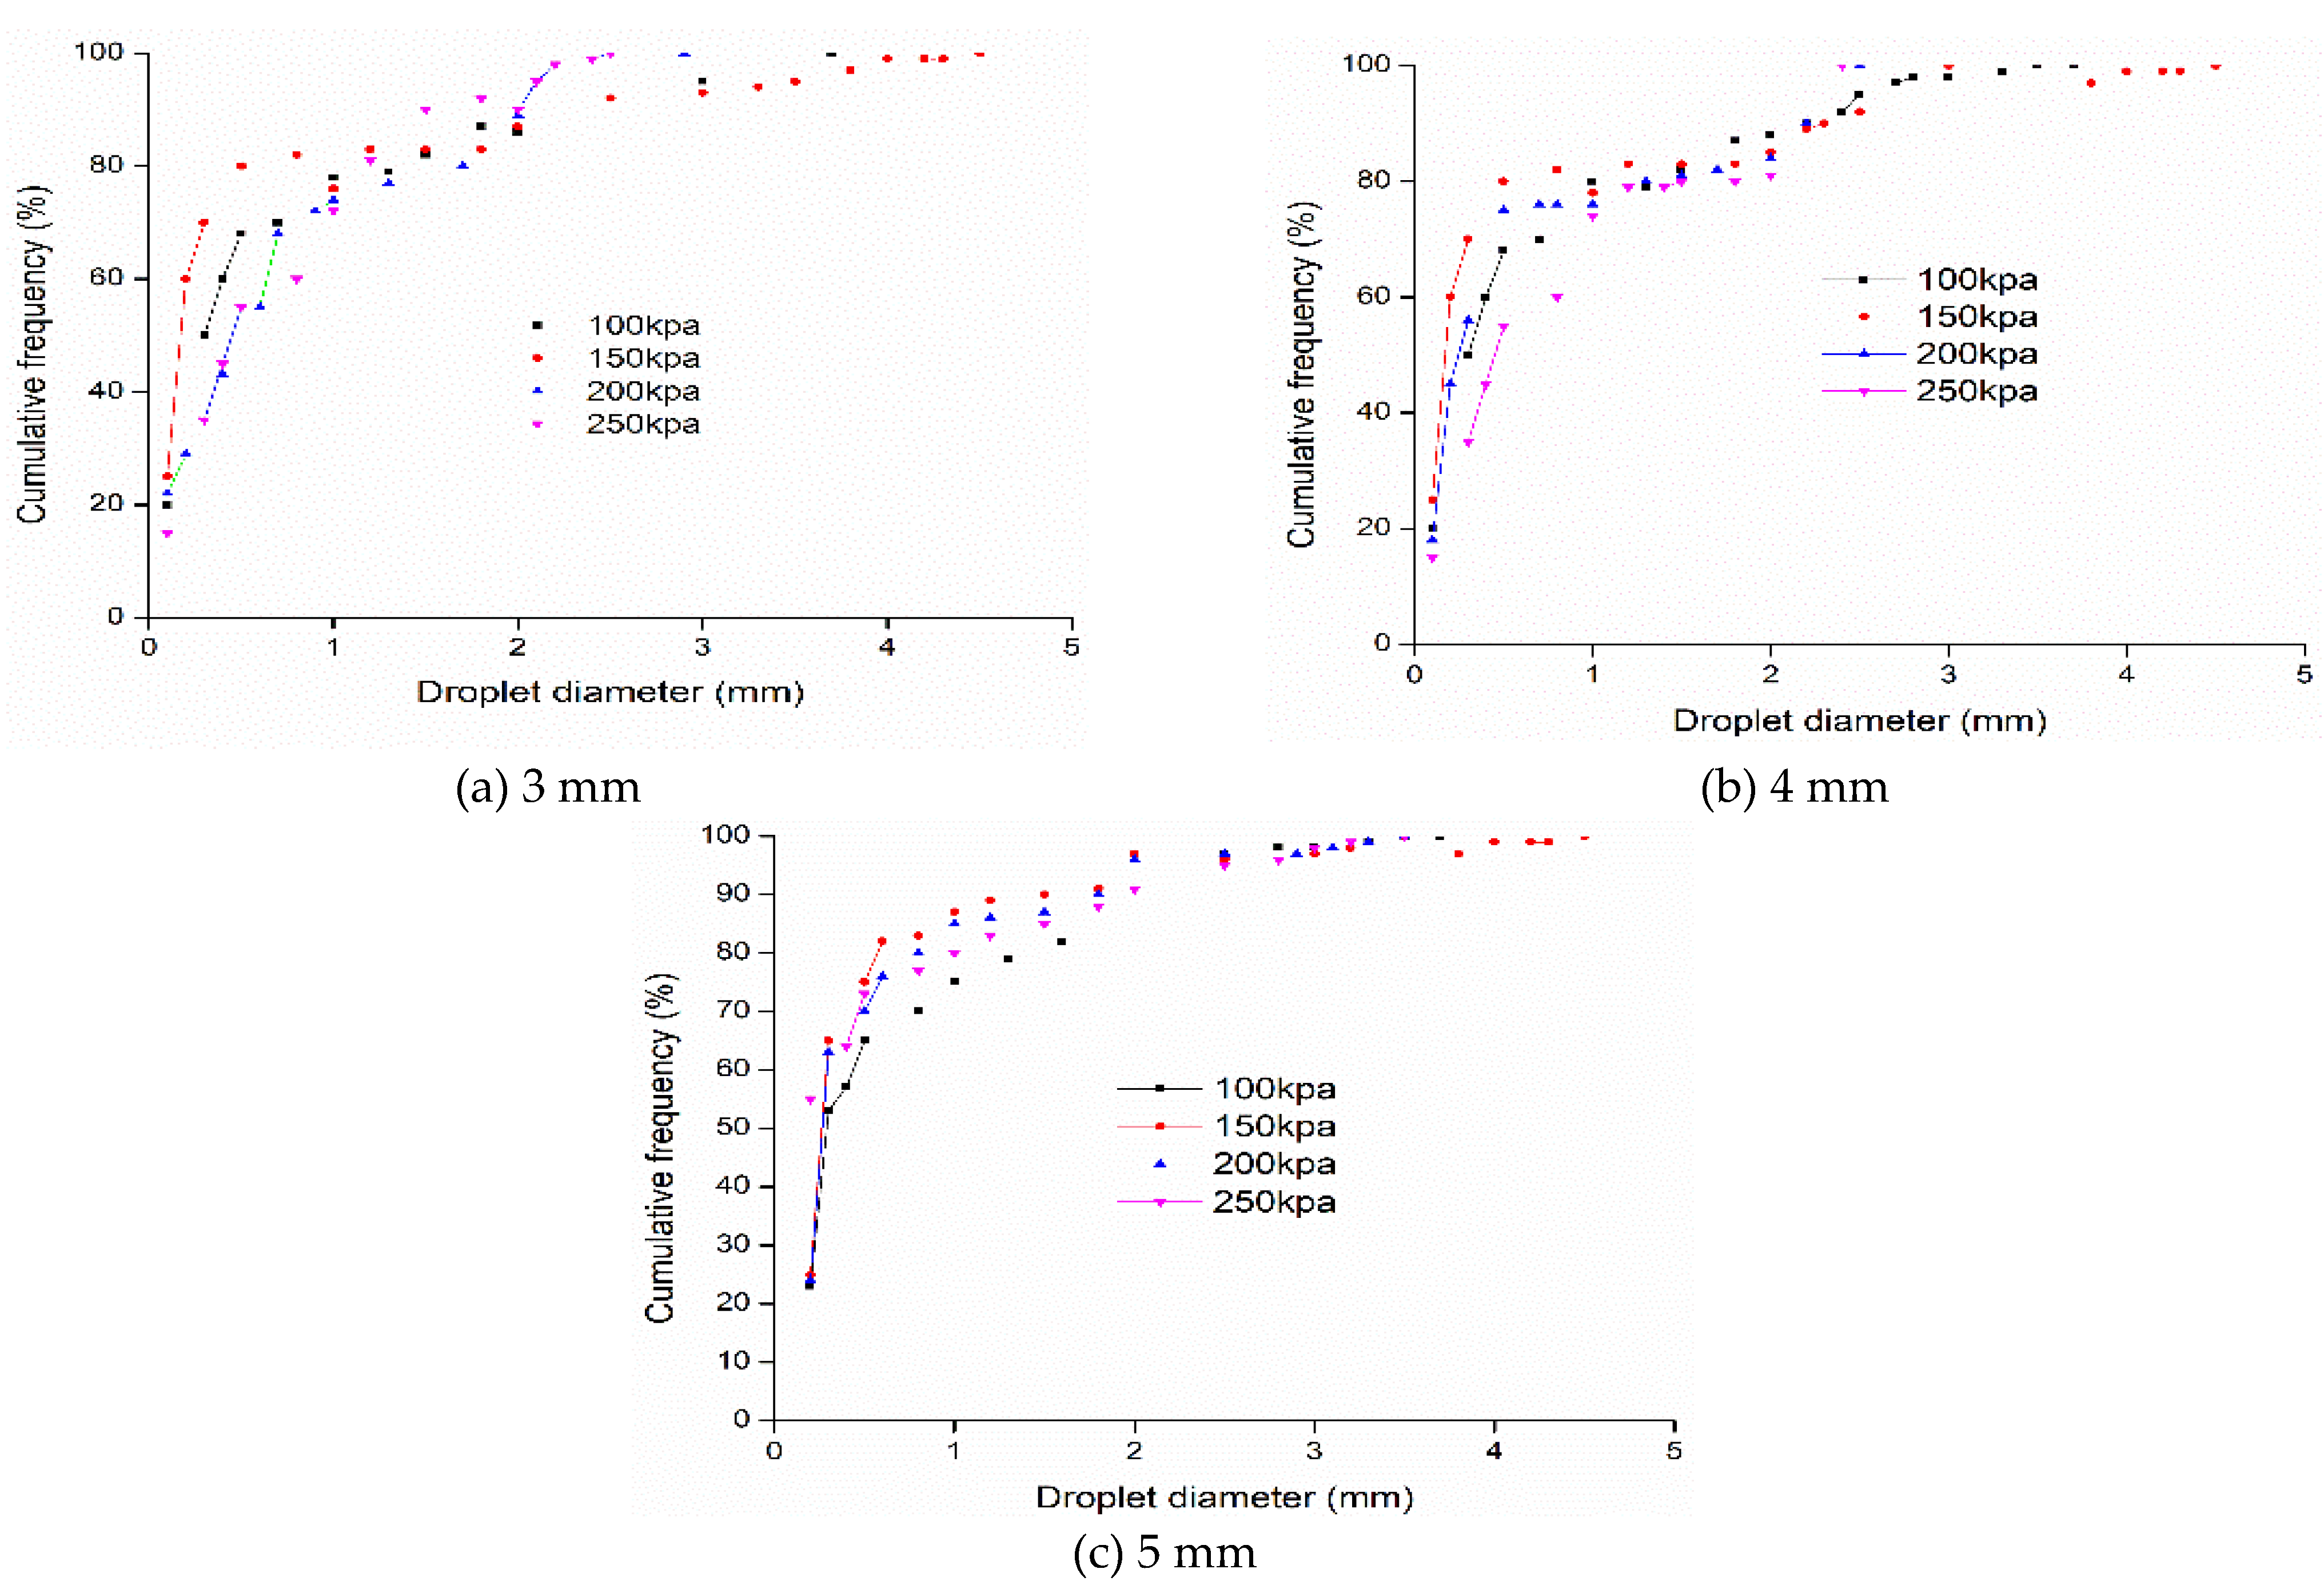
Figure 7.
The distribution of the Kinetic Energy of the water droplets.
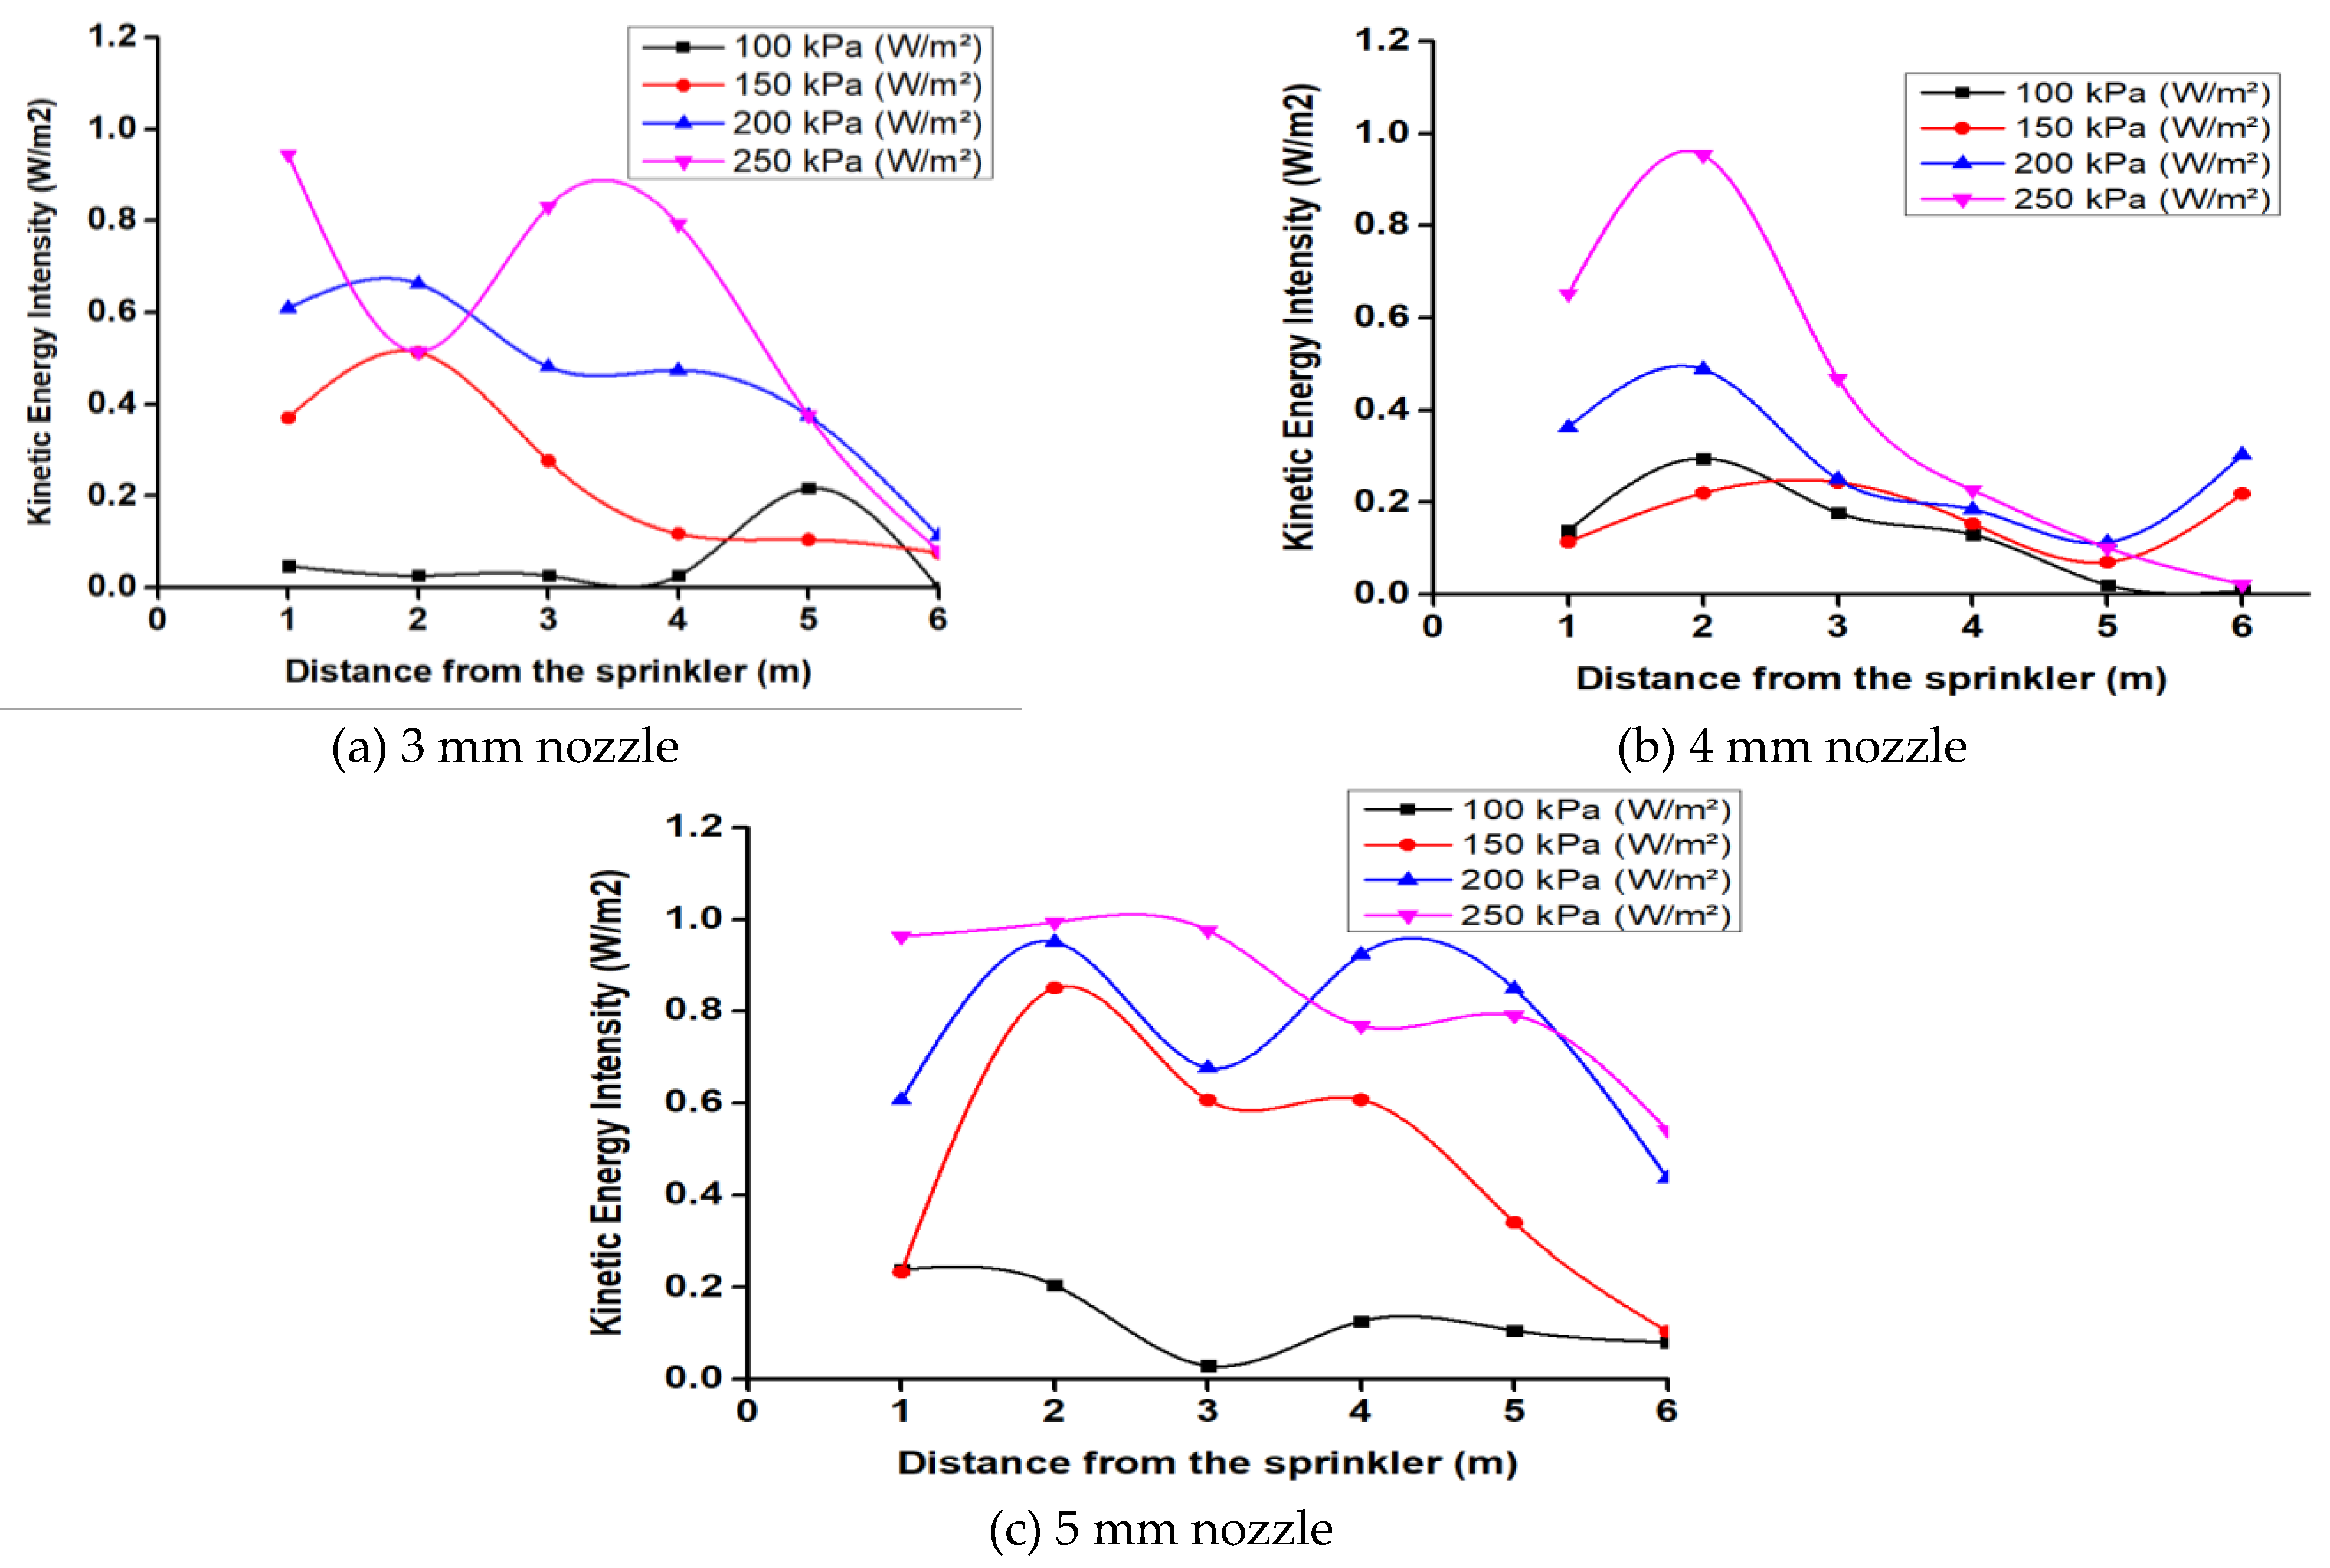

Table 1.
Sprinkler Head Manufacturers’ Specifications.
| Items | Specification |
|---|---|
| Pressure | 100-400 kPa |
| Spraying Radius | 4.0 – 8.5 m |
| Nozzle sizes (s) | 3, 4, 5 mm |
| Thread Size | ¾ inches |
| Spray Pattern | Full-circle (360º) |
| Material used | Zinc/brass |
Table 2.
Comparison of discharge coefficients and range for the nozzle size.
| Spray range (m) | Standard deviation (%) | Discharge coefficient | Standard deviation (%) | ||||||||||||||
|---|---|---|---|---|---|---|---|---|---|---|---|---|---|---|---|---|---|
| Nozzle size(mm) | P | 100 | 150 | 200 | 250 | 100 | 150 | 200 | 250 | 100 | 150 | 200 | 250 | 100 | 150 | 200 | 250 |
| 3 | 5.2 | 5.4 | 5.5 | 6.4 | 2.4 | 2.3 | 2.5 | 2.4 | 0.62 | 0.63 | 0.65 | 0.66 | 2.0 | 2.21 | 2.2 | 2.5 | |
| 4 | 6.2 | 6.4 | 6.7 | 6.9 | 2.3 | 2.1 | 2.4 | 2.2 | 0.65 | 0.67 | 0.69 | 0.71 | 2.1 | 2.27 | 2.3 | 2.6 | |
| 5 | 6.5 | 6.8 | 7.0 | 7.7 | 2.6 | 2.4 | 2.5 | 2.8 | 0.68 | 0.70 | 0.73 | 0.74 | 2.5 | 2.3 | 2.4 | 2.9 | |
Table 3.
shows the statistics of droplet diameters for different pressures and nozzle sizes.
| Type | di/mm | Dv/mm | D50/mm | SDD/mm | CVD/% | |||||||||||||||
|---|---|---|---|---|---|---|---|---|---|---|---|---|---|---|---|---|---|---|---|---|
| kPa | 100 | 150 | 200 | 250 | 100 | 150 | 200 | 250 | 100 | 150 | 200 | 250 | 100 | 150 | 200 | 250 | 100 | 150 | 200 | 250 |
| 3mm | 0.82 | 0.73 | 0.66 | 0.78 | 2.6 | 2.22 | 2.20 | 2.30 | 0.22 | 0.21 | 0.22 | 0.18 | 0.85 | 0.66 | 0.73 | 0.5 | 108 | 90 | 111 | 103 |
| 4mm | 7.36 | 0.77 | 0.70 | 0.60 | 2.87 | 7.52 | 2.14 | 6.81 | 0.36 | 0.22 | 0.21 | 0.17 | 1.01 | 0.98 | 0.93 | 0.8 | 111 | 129 | 132 | 120 |
| 5mm | 0.89 | 0.78 | 0.73 | 0.60 | 2.85 | 2.35 | 2.20 | 2.01 | 0.42 | 0.30 | 0.24 | 0.18 | 0.62 | 0.79 | 0.79 | 0.6 | 120 | 102 | 101 | 98 |
Table 4.
Droplet sizes for 10%, 50%, and 90% (d10, d50, and d90, respectively) for different types of nozzles and pressures.
Table 4.
Droplet sizes for 10%, 50%, and 90% (d10, d50, and d90, respectively) for different types of nozzles and pressures.
| d10/mm | d50/mm | d90/mm | ||||||||||
|---|---|---|---|---|---|---|---|---|---|---|---|---|
| kPa | 100 | 150 | 200 | 250 | 100 | 150 | 200 | 250 | 100 | 150 | 200 | 250 |
| 3mm | 0.07 | 0.08 | 0.07 | 0.07 | 0.51 | 0.35 | 0.51 | 0.30 | 1.53 | 1.40 | 1.50 | 1.53 |
| 4mm | 0.06 | 0.07 | 0.05 | 0.08 | 0.48 | 0.31 | 0.33 | 0.28 | 0.49 | 1.37 | 1.45 | 1.40 |
| 5mm | 0.07 | 0.04 | 0.04 | 0.07 | 0.44 | 0.26 | 0.30 | 0.25 | 0.3 | 1.34 | 1.44 | 1.50 |
Disclaimer/Publisher’s Note: The statements, opinions and data contained in all publications are solely those of the individual author(s) and contributor(s) and not of MDPI and/or the editor(s). MDPI and/or the editor(s) disclaim responsibility for any injury to people or property resulting from any ideas, methods, instructions or products referred to in the content. |
© 2025 by the authors. Licensee MDPI, Basel, Switzerland. This article is an open access article distributed under the terms and conditions of the Creative Commons Attribution (CC BY) license (http://creativecommons.org/licenses/by/4.0/).
Copyright: This open access article is published under a Creative Commons CC BY 4.0 license, which permit the free download, distribution, and reuse, provided that the author and preprint are cited in any reuse.


