Submitted:
25 February 2025
Posted:
26 February 2025
You are already at the latest version
Abstract
Exposure of organisms to nanoplastics (NPs) is inevitable given their global abundance and environmental persistence. Polyethylene terephthalate (PET) is a common plastic used in a wide range of products, including clothing and food and beverage packaging. Recent studies suggest that NPs can cross the blood-brain barrier and cause potential neurotoxicity. It is widely known that aggregation of amyloid beta (Aβ) peptides in the brain is a pathological hallmark of Alzheimer's disease (AD). While the impact of nanoplastics such as polystyrene (PS) on amyloid aggregation has been studied, the effects of PET NPs remain unexplored. In this study, we examined the effect of PET NPs of different sizes (PET50 nm and PET140 nm) and concentrations (0, 10, 50 and 100 ppm) on the fibrillation of Aβ1-40. Our results showed that the presence of PET50 nm as well as PET140 nm decreased the lag phase of the fibrillation processes in a dose- and size-dependent manner from 6.7 ± 0.08 h for Aβ in the absence of PET (Aβcontrol) to 3.1 ± 0.03 h for PET50 nm and 3.8 ± 0.06 h for PET140 nm. CD spectroscopy showed that PET50nm significantly impacts the structural composition of Aβ aggregates. A significant rise in antiparallel β-sheet content and β-turn structure and a substantial reduction in other structures were observed in presence of 100 ppm PET50 nm. These changes indicate that higher concentrations (100 ppm) of PET50 nm promote more rigid and uniform peptide aggregats. Although PET50 nm NPs influence the kinetics of aggregation and secondary structure, the overall morphology of the resulting fibrils remains largely unaltered, as seen by transmission electron microscopy. Also the local cross-β structure of the fibrils was not affected by the presence of PET50 nm NPs during fibrillation, as confirmed by 13C solid-state NMR spectroscopy. Overall, these findings show that PET NPs accelerate amyloid fibril formation and alter the secondary structure of Aβ fibrils. These results also indicate that the accumulation of PET-NPs in the brain may facilitate the progression of various neurodegenerative diseases, including Alzheimer's disease.
Keywords:
polyethylene terephthalate
; nanoplastics
; amyloid β
; fibrillation
1. Introduction
Single use plastic products for food and beverage packaging enjoy a high popularity and the global production of plastics keeps increasing along with the detrimental impact on the environment. As of 2022, the world produces nearly 400 million tons of plastic annually (OECD report [1]). The most abundant plastic polymers are polyethylene (PE), polypropylene (PP), polyvinyl chloride (PVC), polyethylene terephthalate (PET), and polystyrene (PS). Of the total production of plastics, about 70% ends up in landfills or is incinerated, only around 10% is recycled, and the remaining 20% ends up in the environment. Global plastic waste is expected to almost triple by 2060, reaching over 1,000 million tons per year if current trends continue (OECD report [1]).
All this plastic material eventually breaks down into smaller particles, which are further dispersed into terrestrial and marine environments [2,3,4]. The degradation of plastics can occur through various mechanisms, including thermal degradation, photodegradation, chemical degradation, and biodegradation [5,6,7,8]. During the degradation process, plastics release smaller fragments, called micro- or nanoplastics (MNPs) [9]. Nanoplastics (NPs), defined as plastic particles smaller than 1 micrometer, have emerged as environmental and health concerns due to their ability to interact with biological systems in various ways. Given their size these particles can be internalized by cells and potentially alter cellular structures such as the cell membrane at the molecular level [10].
Nanoplastics can enter the human body through ingestion of contaminated food and water or inhalation of airborne particles [11,12]. Research indicates that NPs can cross biological barriers such as the intestinal lining and lung epithelium, allowing them to enter the bloodstream and distribute to various organs [13,14]. In the bloodstream, NPs are transported to different tissues and may potentially cross the blood-brain barrier (BBB) [15]. Once NPs cross the BBB, they can accumulate in brain tissue, which may lead to neuroinflammation, oxidative stress and neurotoxicity [16,17,18]. These effects might impair brain function and contribute to neurological disorders. Although the full extent of their impact on human health is still being researched, the presence of NPs in the brain raises significant concerns about long-term health risks [18,19,20]. The widespread presence of NPs has been linked to several conditions such as obesity, diabetes, cognitive impairment, and neurodegenerative diseases including Alzheimer's disease (AD) and Parkinson's disease [21].
PET is a type of plastic widely used in various industries, mostly in food and beverage packaging as well as in textiles [22,23]. PET is valued for its strength, flexibility, durability and resistance to chemicals and moisture, making it an ideal material for a wide range of consumer products [24]. Recent studies have demonstrated that PET NPs exhibit neurotoxic effects in zebrafish embryos [24]. Exposure to PET NPs at a concentration of 100 ppm resulted in increased hypoactivity [24]. Additionally, Nile red staining revealed the accumulation of these particles in the zebrafish brain. Metabolomics analysis showed disruptions in energy metabolism (glucose, acetate, ATP, NADH, lactate) and neurotransmitter pathways (γ-aminobutyric acid (GABA), glutamate, glutamine) due to PET NP exposure [24]. Given the established impact of PET NPs on zebrafish embryos, it becomes crucial to explore their potential effects on human neurological health, particularly in the context of neurodegenerative diseases. AD is a neurodegenerative disease that menifests in a progressive decline in cognitive functioning, memory loss, and behavioral changes [25]. It is common cause of dementia among the elderly, affecting 30 million individuals worldwide [25]. Although the abnormal aggregation of amyloid peptides has been identified as a primary pathological mechanism in AD, there is growing concern that the increase in these neurological disorders may also be driven by exposure to ubiquitous but poorly understood environmental contaminants.
Although previously the effect of other nanoplastics such as polystyrene (PS) on aggregation of amyloid has been explored previously [20], the studies on effect of PET NPs on amyloid aggregation are lacking. Understanding of whether PET NPs may influence Aβ aggregation is important for assessing their potential role in neurodegenerative diseases. Here, we provide a proof-of-concept study to examine the impact of PET NPs on Aβ aggregation kinetics, aggregate morphology, and secondary structural changes. By investigating these interactions, we aim to elucidate the effect of PET NPs on human health and their potential contribution to AD.
2. Results and Discussion
In this work, we investigated the effect of PET NPs on Aβ aggregation. PET nanoparticles (PET NPs) with a size of 50 nm (PET50 nm) and 140 nm (PET140 nm) were prepared as described in method section. The suspension of PET NPs of both sizes remained stable for several weeks without any settling even at a concentration as high as 1 mg/ml.
2.1. Characterization of PET NPs
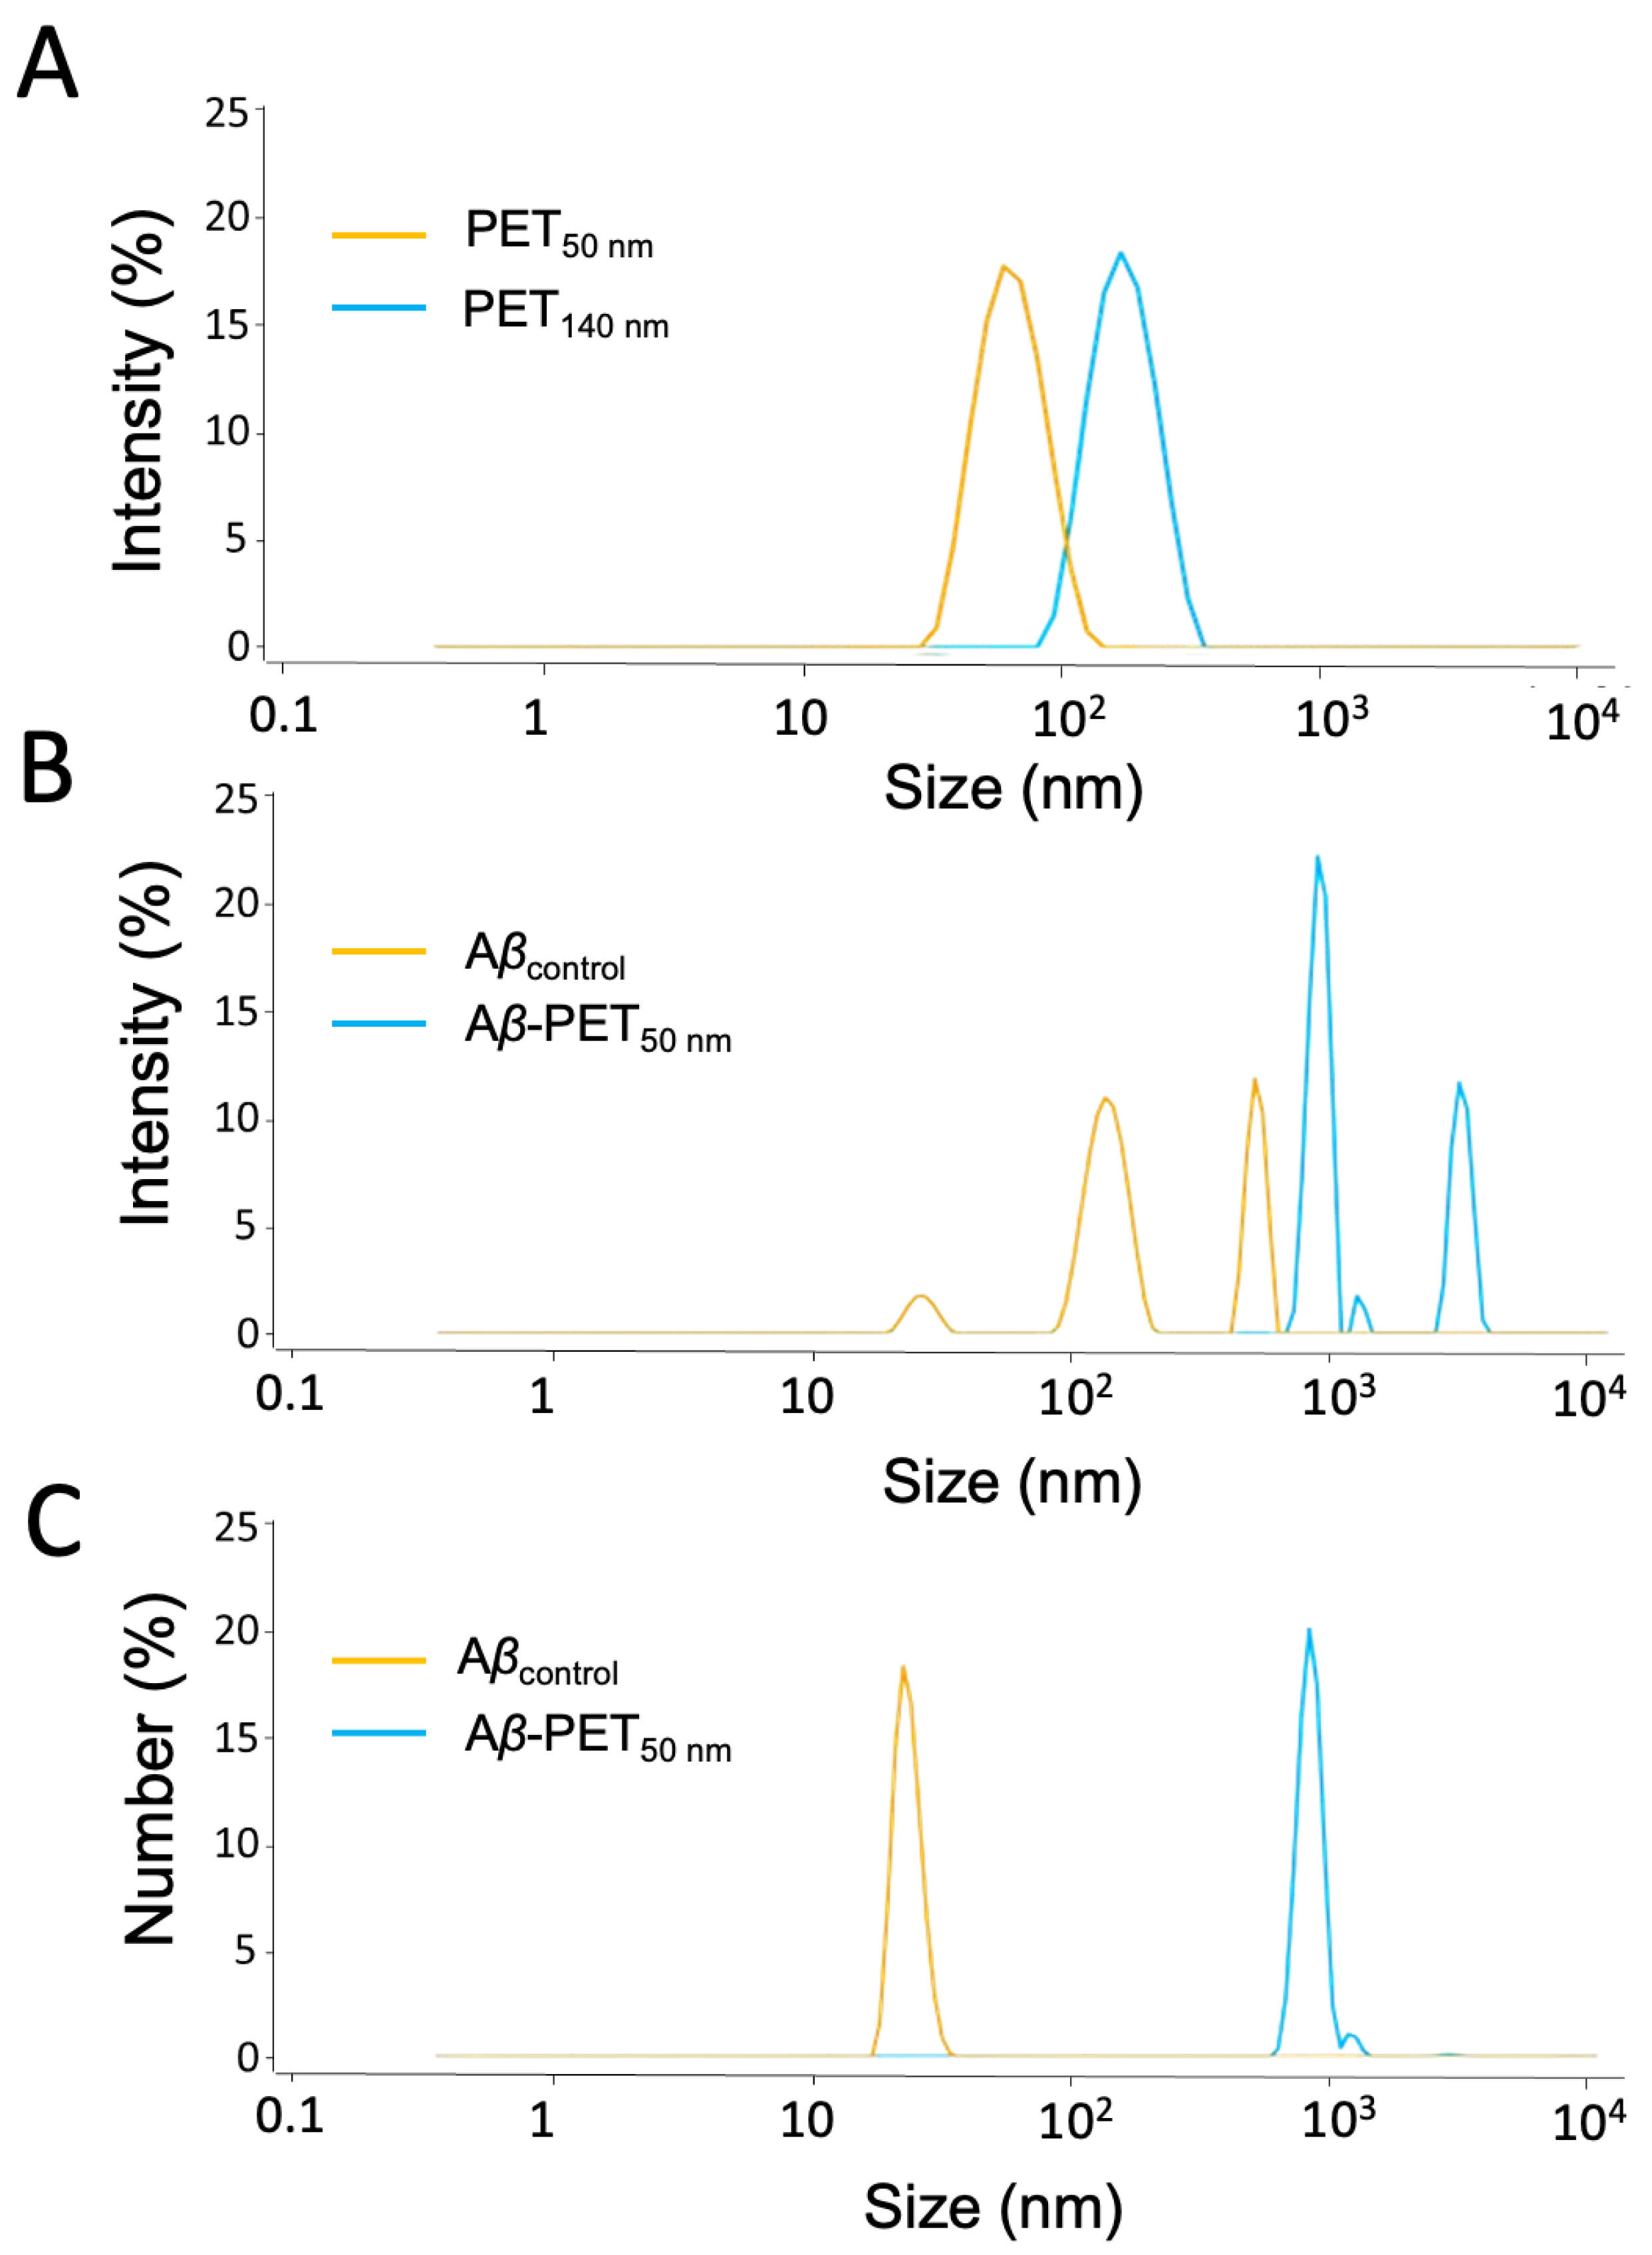
The size of PET nanoparticles (NPs) in the absence and in the presence of amyloid-beta (Aβ) peptides was measured by multi-angle dynamic light scattering (MADLS). Size distributions of PET NPs (PET50 nm and PET140 nm) are shown in Figure 1. The Aβ solution (Aβcontrol) shows particles of around 22 nm, 130 nm, and 430 nm, indicating different stages of Aβ aggregation, from smaller oligomers to larger structures. When Aβ is incubated with PET50 nm, additional peaks around 140 nm and 1000 nm appeared, suggesting that the PET NPs promote further aggregation of Aβ. Number-weighted analysis indicates that in the Aβcontrol sample, mostly small particles around 22 nm are found. Addition of PET50 nm resulted in a shift towards larger particles, with peaks at 140 nm and 1000 nm (Figure 1C).
PET NPs exhibit negative zeta potentials, with PET50 nm having a zeta potential of -41 ± 2 mV and PET140 nm a zeta potential of -15 ± 1 mV. Smaller particles tend to have a higher surface charge density, which results in more negative zeta potential [26]. This effect is due to the increased surface area to volume ratio in smaller particles. The zeta potential values indicate changes in the stability of the NPs upon interaction with Aβ. The zeta potential of the Aβcontrol was -30 ± 2 mV. When Aβ was combined with PET NP to form Aβ-PET50nm, the zeta potential increased to -20 ± 2 mV suggesting a decrease in stability over time due to presence of these PET NPs and further leading to aggregation and larger particle sizes.
Although the exact binding mechanisms between peptides and PET NPs are not fully understood, recent studies using other nanoparticles, indicate that these interactions are primarily mediated by weak forces such as hydrophobic interactions, hydrogen bonds, Van der Waals attraction forces, and electrostatic forces [27]. It has been shown that when NPs enter a biological environment, peptides and other biomolecules adsorb to their surfaces, forming a "peptide corona" [28,29]. This layer significantly alters the physicochemical properties of the NPs and their interactions with other proteins [30,31]. The surface of the NPs may undergo alterations in response to the adsorption of peptide molecules, which could influence the overall reactivity of the NPs [31,32]. The formation of the peptide corona is influenced by several factors, including size, shape, and chemical composition of the NPs, the type of medium (including the types of peptides and other chemical species present), the duration of exposure, and the ratio of NPs to peptides [33,34,35].
Figure 1.
Particle size of PET NPs and Aβ-PET NPs determined by DLS and MADLS. (A) PET NPs of two different particle size (B) Intensity weighted size distribution of Aβ (orange) and Aβ-PET NPs (blue). (C) Number weighted size distribution of Aβ (orange) and Aβ-PET NPs (blue).
Figure 1.
Particle size of PET NPs and Aβ-PET NPs determined by DLS and MADLS. (A) PET NPs of two different particle size (B) Intensity weighted size distribution of Aβ (orange) and Aβ-PET NPs (blue). (C) Number weighted size distribution of Aβ (orange) and Aβ-PET NPs (blue).
2.2. Aβ Fibrillation Kinetics
Amyloid-beta (Aβ) is an amphipathic peptide that tends to self-aggregate, forming structures such as oligomers and fibrils [36]. Typically, Aβ aggregation is characterized by an increase in β-sheet structure and the formation of the cross-β structure [37]. The fibril formation process starts with a slow interaction between misfolded peptides and preformed oligomers, which act as nuclei for fibril elongation [38]. The kinetics of peptide fibrillation includes three phases: the lag (nucleation) phase, the elongation phase, and the saturation phase, often displaying a sigmoidal growth curve [39]. The nucleation phase is the activation time required for seed formation, from which fibrillation begins. The thioflavin T (ThT) fluorescence assay is used to monitor the impact of PET NPs on amyloid fibril formation. The lag phase, characterized by the initial slow increase in ThT fluorescence intensity, is indicative of the nucleation process before rapid fibril growth occurs.
The time-dependent ThT fluorescence intensities of Aßcontrol and Aß treated with either PET50 nm or PET140 nm at various concentrations are presented in Figure 2. The presence of both PET50 nm and PET140 nm decreases the lag phase time as well as fibrillation time for Aβ, with clear trends observed across different concentrations. Aβcontrol shows a lag time of 6.7 ± 0.1 h, while the lag time is slightly reduced for 10 ppm PET50 nm (4.3 ± 0.1 h) and significantly reduced for 100 ppm PET50 nm (3.1 ± 0.1 h) (Figure 2A). Similarly, the effect of concentration of PET on fibrillation time has been observed. As shown in Figure 2E, the fibrillation time is short for 50 ppm and 100 ppm PET50 nm (5.0 ± 0.1 h), slightly longer for 10 ppm PET50 nm (6.2 ± 0.1 h) and longest for Aβcontrol (9.5 ± 0.1 h) (Figure 2E). Interestingly, our observations showed that the lag time as well as fibrillation time are slightly shorter for PET50 nm (in all concentration groups) compared to larger PET140 nm (Figure 2B-D). The fibrillation time is increased as the concentration of PET NPs increased. However, at higher concentrations, the larger particles exhibited a saturation effect, where additional increases in concentration (e.g., 50 and 100 ppm) did not further enhance the fibrillation kinetics. Zeta potential measurement clearly showed that our PET NPs are negatively charged. It is possible that the acceleration of the Aβ aggregation process by PET NPs is due to electrostatic interactions of negatively charged PET NPs with positively charged residues in the Aβ sequence (e.g., Arg5, His6, His13, His14, Lys16, Lys28).
Our results showed that the particle size of PET NPs have an impact on the kinetics of Aβ aggregation. It is conceivable that NPs act as efficient nucleation seeds, thereby accelerating the process of fibril growth. Thus, NPs can shorten the lag phase by providing catalytic surfaces that facilitate nucleation [40,41]. Previous studies have shown that polystyrene nanoparticles (PS NPs) accelerate the nucleation rate, increase the production of oligomers, and enhance the content of antiparallel β-sheets of Aβ40 peptide [21]. Likewise, it has been demonstrated that polyethylene nanoparticles (PE NPs) interact with secondary structure elements, promoting the formation of β-sheets [42]. Another kinetics study with amino-modified PS NPs showed that the fibrillation process of Aβ40 peptides is accelerated at NPs concentrations of 20 ppm and 50 ppm, resulting in a reduced lag phase [43]. Our results are consistent with these findings, suggesting the role of PET NPs in promoting β-sheet formation and accelerating fibril growth. However, unlike previous studies where polystyrene did not influence the nucleation rate when higher concentrations of Aβ was used (> 20 µM) [21], we see that PET NPs significantly influences the nucleation rate even at a high concentrations of Aβ (28 µM) as used in our study. Interestingly, while other investigations have seen that PS NPs promote more oligomers in Aβ solution during aggregation but inhibit higher-order fibrils formation [21], we observed that PET NPs also promote both aggregation as well as higher-order fibril formation.
2.3. Secondary Structure Analysis
To gain insight into the conformation of Aβ aggregates, circular dichroism (CD) spectroscopy studies were performed (Figure 3). The CD spectra of Aβcontrol and of varying concentrations of Aβ-PET50 nm (0, 10, 50 and 100 ppm) are shown in Figure 3A. The negative peak around 220 nm is indicative of β-sheet structure. As the concentration of PET50 nm increases there is a notable change in the negative peaks and the shape of the curves. Corresponding quantitative analysis of the secondary structure content derived from the CD spectra is shown in Figure 3B. As the concentration of PET50 nm increases, there is a significant rise in antiparallel β-sheet content, from 33.9% in the Aβcontrol to 55% in the presence of 100 ppm PET50 nm. (Figure 3C). This signifies a conformational shift that may be driven by the interaction between PET50 nm and specific regions of the Aβ peptide, disrupting its natural folding pathways [44]. This indicates an increase in structural disorder, which suggests that while some parts of the peptide become more ordered, others become more flexible. This flexibility could make certain regions of the peptide more accessible to interact with other molecules and influence the aggregation behavior of peptide. An increase in β-turn structures from 16% to 22% and the significant reduction in other structures from 49.8% to 23.3% further highlight the conformational specificity induced by PET50 nm (Figure 3C). The loss of these diverse structural elements indicates that PET50 nm may drive Aβ peptides towards an aggregation-prone conformation.
Our results are consistent with those of a previous study on another type of nanoplastic, PS NPs, which demonstrated a twofold increase in antiparallel β-sheet content in Aβ aggregates [21]. In addition, the change in β-turns observed with PS NPs in that study, similar to the structural changes we observed with PET50 nm, suggests that these nanoparticles induce regions of the peptide to become more flexible.
Figure 3.
Circular dichroism (CD) spectroscopy analysis of Aβ and Aβ with concentrations 0, 10, 50 and 100 ppm of PET50 nm. (A) CD spectra of Aβcontrol and Aβ-PET50 nm 10 ppm, 50 ppm, and 100 ppm. (B) Quantitative analysis of the secondary structure content from CD data analysed by BeStSeL. The bar graph shows the percentage of antiparallel β-sheet, β-turn, and other structures in Aβ and Aβ-PET50 nm. (C) Table derived from quantitative analysis results analyzed by BeStSeL (see Supplementary Figure S1).
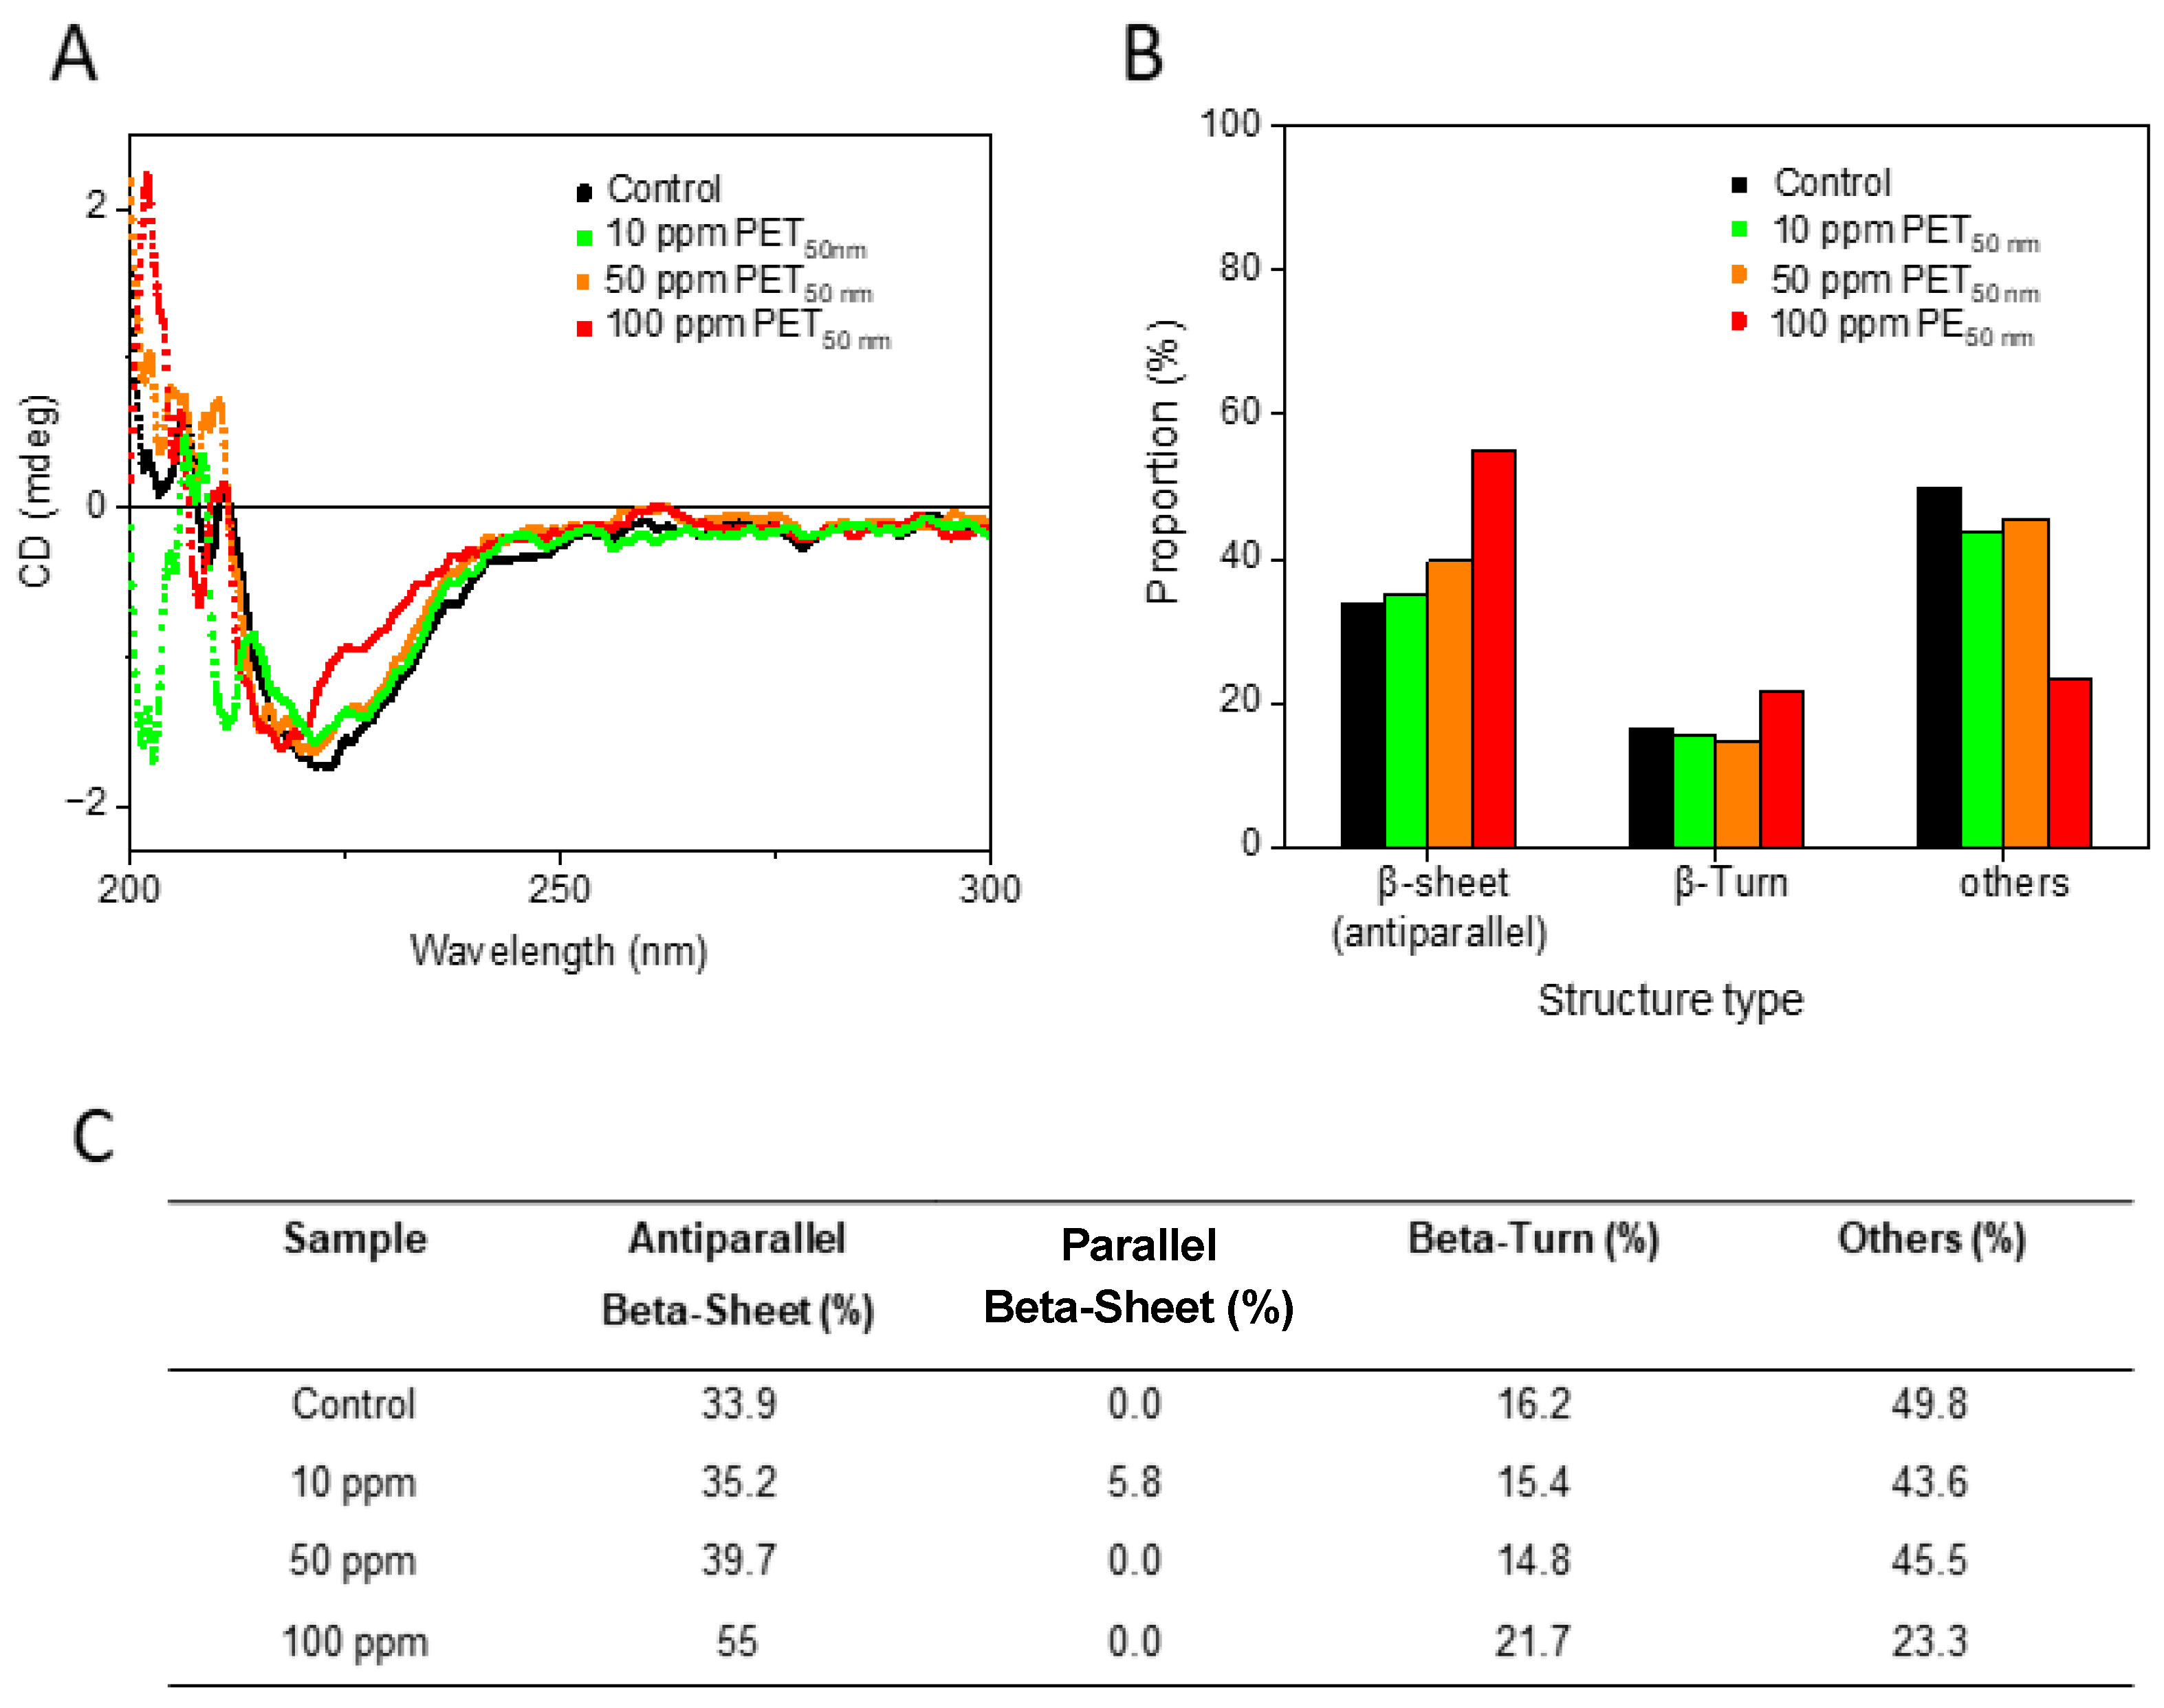
The CD data showed that PET50 nm at higher concentrations altered the secondary structure of Aβ peptides, by promoting the formation of antiparallel β-sheets and reducing the content of β-turns and other structures. These structural changes enhance the nucleation and aggregation processes, aligning with our observation in the acceleration of fibrillation kinetics at the elevated PET50 nm (50 and 100 ppm) concentrations.
To further investigate if the effect of PET NPs on fibrillation kinetics causes changes in the local structures within the cross-β structure of amyloid fibrils, we performed solid-state NMR measurements. To this end we used Aβ40 peptides isotopically labelled with 13C/15N for Phe19, Ala21 and Leu34 to obtain insights into some key features of Aβ40 structure in fibrils. The 1D 13C CP MAS NMR spectrum of the fibrils grown in the presence of the PET50 nm NPs is very similar to the spectrum of the fibrils in absence of the NPs (Figure 4A). From the 2D DARR NMR spectrum (Figure 4B) the isotropic 13C chemical shifts for the labelled amino acids were obtained, which are sensitive for the secondary structure [45]. These values (Figure 4C) correspond very well with the chemical shifts from other studies on Aβ1–40 and the known β-sheet structures typical for Aβ in the respective regions [46,47,48,49]. In addition, the well-known interresidual contact between Phe 19 and Leu34 is observed by cross peaks between the side chain of Leu34 and the aromatic ring of Phe 19 (Figure 4B) [46,47,48,49,50,51]. Overall, the 13C MAS NMR results show that the presence of PET NPs during fibrillation results in fibrils which exhibit a similar structure as the known Aβ1–40 fibrils, thus indicating that the local structure within cross-β structure of amyloid fibrils was not affected by the presence of PET50 nm NPs during fibrillation.
2.4. Transmission Electron Microscopy (TEM)
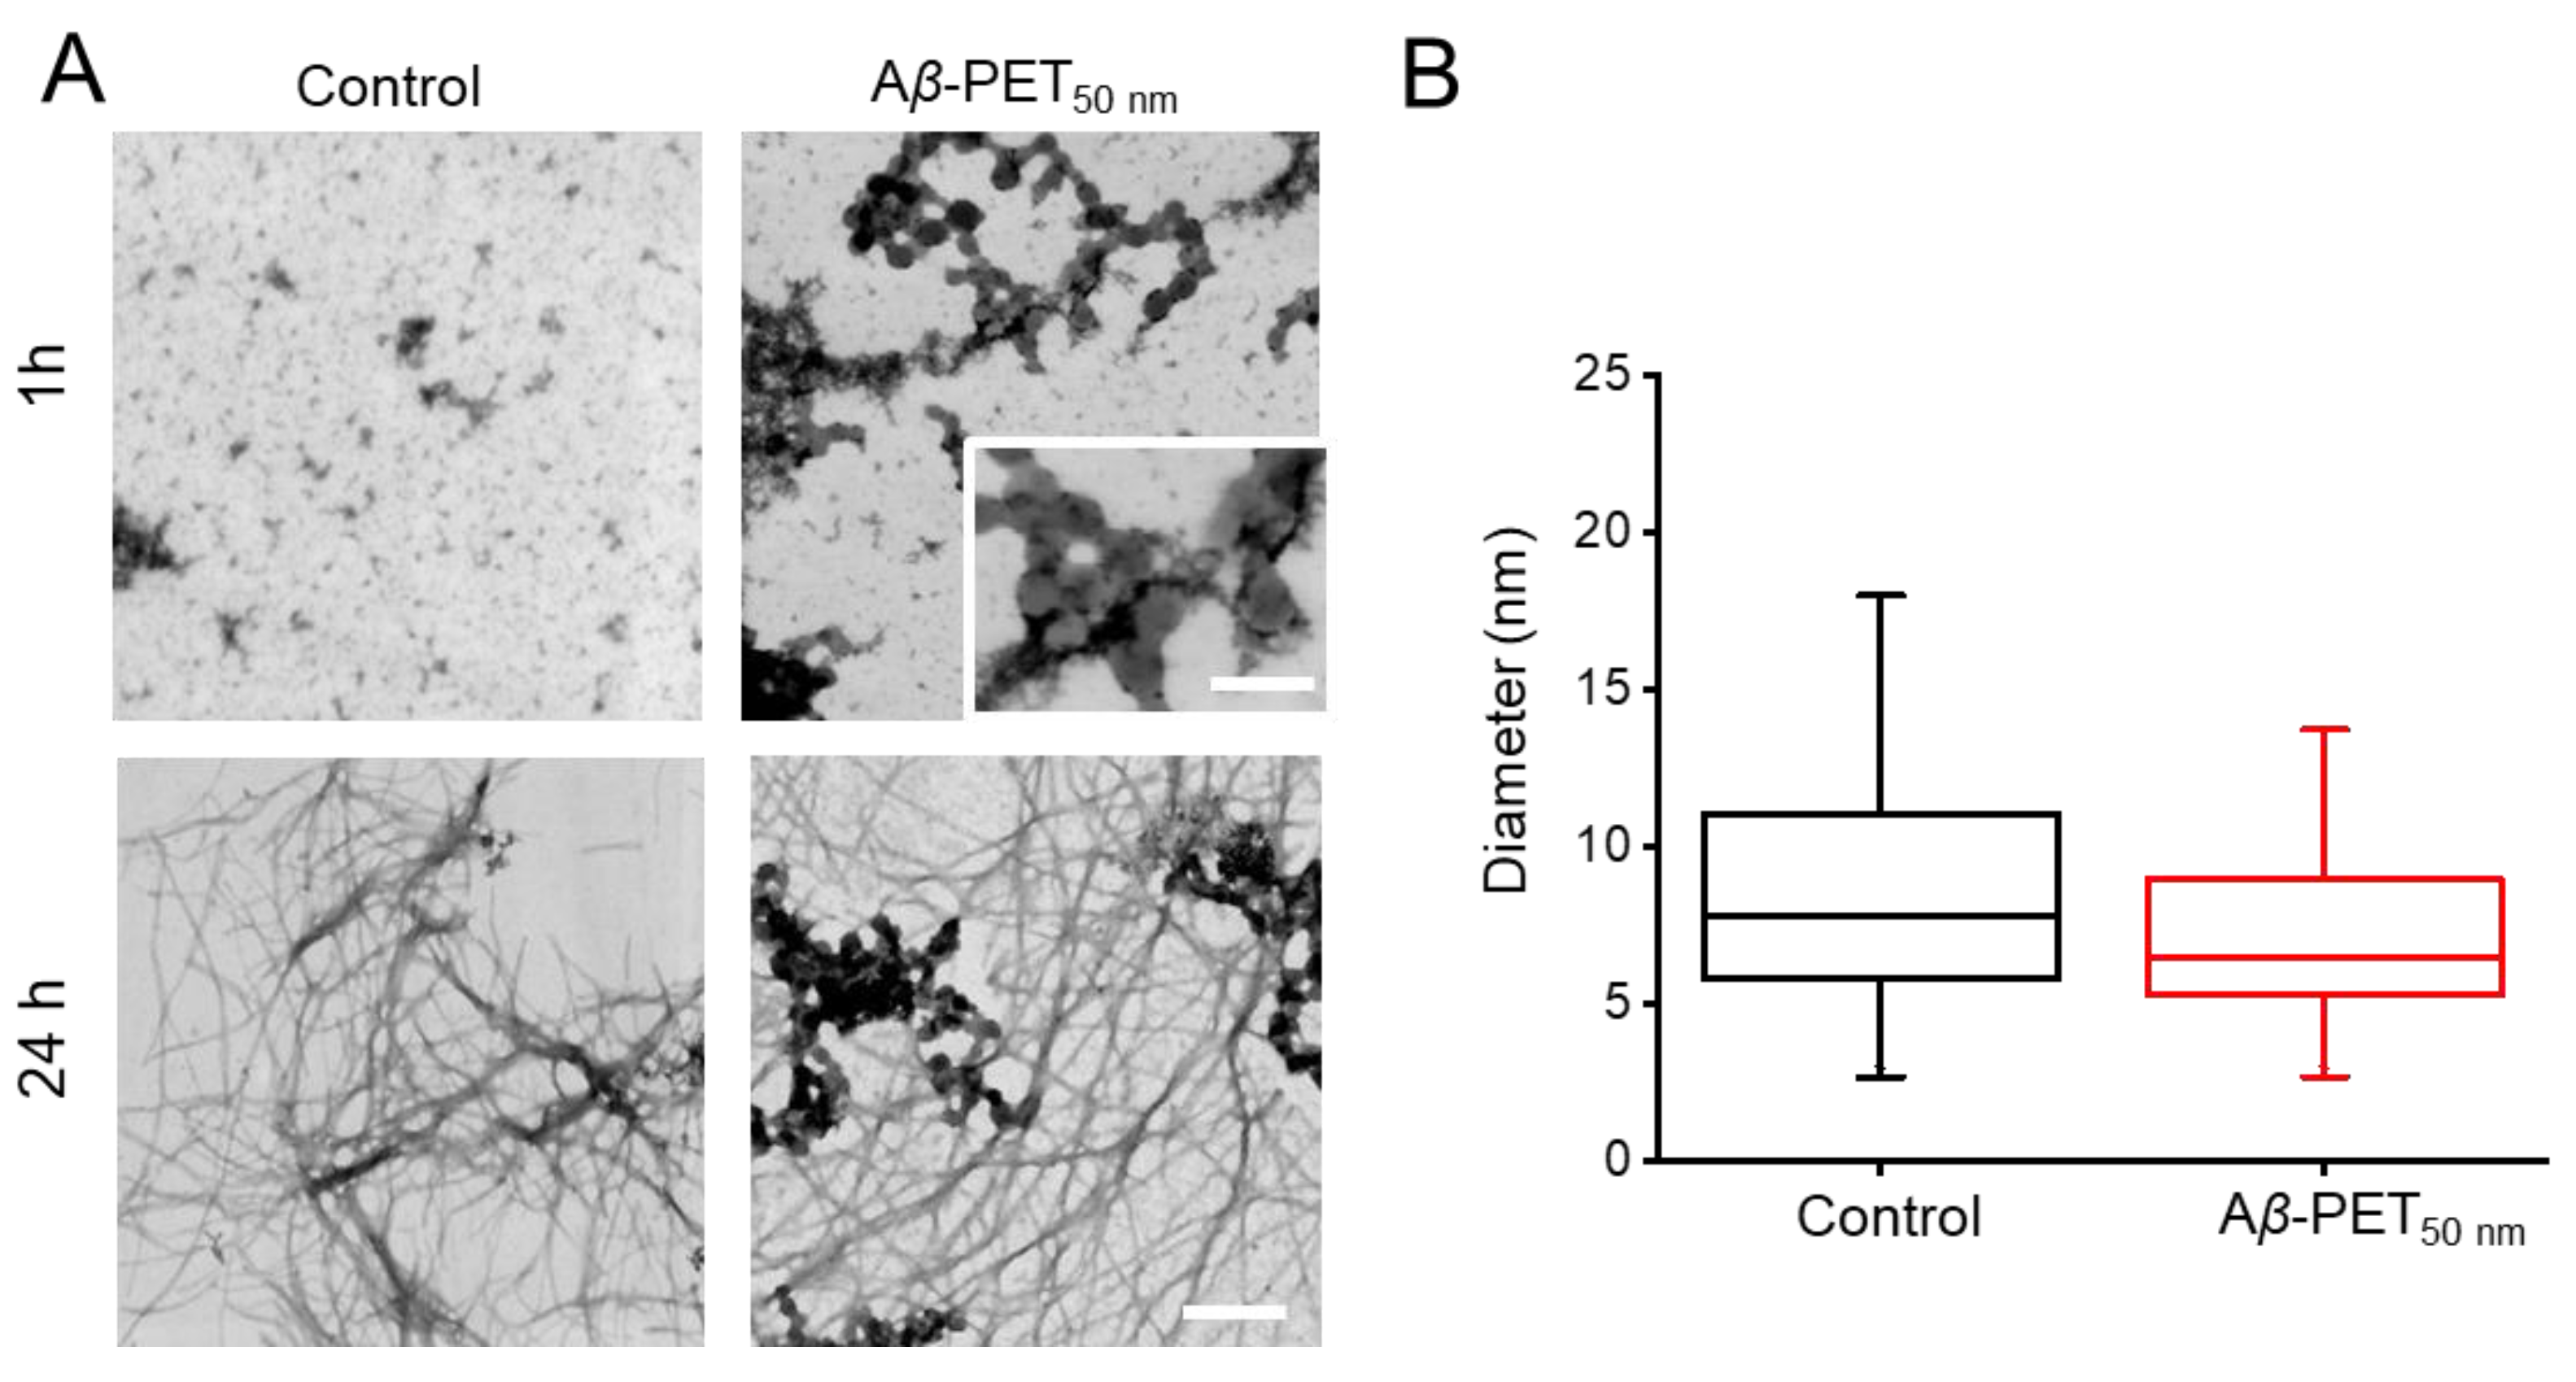
The morphology of Aβ fibrils in the presence and absence of PET NPs was investigated using TEM (Figure 5). The effect of PET50 nm on aggregation and fibrillation initially evaluated at two different time points shown in Figure 5A. At 1 h, Aβcontrol contains small spherical aggregates of varying size in which some of them cluster together. Interestingly, the introduction of 100 ppm PET50 nm NPs led to the formation of dense aggregates surrounding the nanoparticles. This might be due to interaction with the Aβ fibrils, as highlighted by the inset (inset Figure 5A). Moreover, when considering the MADLS data (Figure 1) in concert with these findings, one can infer that high fraction of peptide is attached to the surface of the PET NPs that contribute to the acceleration of early aggregation process of Aβ. By 24 h, in both Aβcontrol and Aβ-PET50 nm fibrils are formed. Furthermore, the fibril diameters were quantitatively assessed from TEM images (Figure 5B). The box plot comparison shows no significant difference in the average fibril diameter between Aβ alone and Aβ incubated with PET NPs (p > 0.05). The fibril diameter of 100 ppm Aβ-PET50nm is slightly smaller than Aβcontrol. The findings revealed that while PET NPs influenced the lag time and fibrillation time, it did not stop the formation of fibrils in both the Aβcontrol and the 100 ppm Aβ-PET50 nm samples. Furthermore, it did not result in a notable change in the diameter of the fibrils.
3. Materials and Methods
3.1. Chemicals
All chemicals were purchased from Sigma-Aldrich (St. Louis, MO, USA) unless otherwise stated.
3.2. Preparation of PET NPs
Different size of PET NPs were prepared based on previously described method [24,52]. Briefly, 100 mg of amorphous PET (Goodfellow, Germany) was dissolved in 10 mL of hexafluoroisopropanol (HFIP) (1% v/v) at room temperature over a period of 24 h. The resulting PET suspension was transferred to a buret and added dropwise into 200 mL of ice-cooled deionized (DI) water and stirred at different speeds to prepare different size of NPs (100 rpm for 140 nm NPs and 600 rpm for 50 nm NPs). Further, larger particles were removed from the suspension using a cellulose nitrate membrane filter with a pore size of 0.2 µm (Sartorius, Göttingen, Germany). The HFIP was then removed from the solution using a rotary evaporator (Heidolph Instruments, USA) at 50 °C and reduced pressure (~250 mbar). The NPs were allowed to settle in a cylinder for 2 h, after which the suspension was collected. The concentration of NPs was determined gravimetrically by drying 2 mL of the suspension on a pre-dried polymer pellet (triplicates) at 50 °C for 24 h and then weighing the residue. The prepared nanoparticle solution was stored at room temperature, and it was stable for several weeks without any precipitation.
3.3. Peptide Synthesis
Peptide synthesis was performed by the Peptide Synthesis Core Unit of Leipzig University (https://home.uni-leipzig.de/izkf/index peptide.html). Standard Fmoc solid phase synthesis was used to produce the Aβ40 peptides with the WT sequence DAEFRHDSGY EVHHQKLVFF AEDVGSNKGA IIGLMVGGVV. The peptide purity level determined by HPLC analysis and MALDI mass spectrometry was ≥ 97% depending on the peptide (see supplemetary information Figure S2).
3.4. Aβ40 Fibril Preparation
The peptide powder was dissolved in dimethyl sulfoxide (DMSO) (approximately 0.5 mg of peptide in 20 μL DMSO), incubated at room temperature for about 30 minutes, and then diluted to a concentration of 1 mg/mL using an aqueous buffer. The buffer consisted of 25 mM sodium phosphate, 150 mM NaCl at pH 7.4. Afterwards, peptide solution further diluted 0.125 mg/ml with aqueous buffer. To this mixture, different sizes (50 and 140 nm) and concentration (0, 10, 50 and 100 ppm) of PET50 nm and 20 µM ThT were added. A control experiment was performed by incubating Aβ monomers without PET50 nm, providing baseline data to compare the impact of PET NPs on Aβ aggregation. Six aliquots (125 μL) of final solution were transferred into a 96-well plate (Corning® 96-well half-area microplate, polystyrene with nonbinding surface coating, black, flat bottom clear). The dead time between the preparation of the measuring solution and the first measurement was less than 5 minutes. ThT fluorescence was recorded using a microplate reader (Tecan Infinite M200, Tecan Group AG, Mannedorf, Switzerland) at 37 °C, with an excitation wavelength of 440 nm and an emission detection wavelength of 482 nm. The measurements included a shaking/5 min waiting cycle and were taken every 5 minutes for 24 h.
3.5. Dynamic Light Scattering (DLS)
Hydrodynamic diameters and zeta potentials of Aβ40 in the presence and in the absence of PET NPs were measured using a Zetasizer Nano ZS, Malvern, UK. Measurements were made by dilution of peptide (0.125 mg/ml) with and without PET NPs (50 nm, 100 ppm) in the water (DI, 1:2 ratio) at pH 7.4 at 25 °C. The laser light was set at 633 nm. Multi-Angle Dynamic Light Scattering (MADLS) measurements were performed to collect the intensity of backscattering, forward scattering, and side scattering. Each measurement consisted of 100 scans. Zeta potential measurements for PET NPs (50 nm, 140 nm) as well as Aβ with and without PET50 nm recorded. Three independent measurements were performed, and the zeta potential was calculated based on electrophoretic mobility of sample particles. Refractive indices were 1.330 (water) and 1.45 (protein) for polydispersant and material, respectively. Data was processed with the Malvern Zetasizer Software (Malvern Instruments, UK).
3.6. Transmission Electron Microscopy (TEM)
A volume of 2 μL of a diluted fibril solution from the final state of ThT measurements (1:20 (v/v) with ddH2O) was transferred onto a formvar film-coated copper grid. After evaporating the solvent, the sample was stained with 1% uranyl acetate. Images were captured using a Zeiss SIGMA electron microscope equipped with a STEM detector and operated with Atlas software (Zeiss NTS, Oberkochen, Germany). Fibril diameters were measured (n = 100) using the ImageJ software (version 1.53e) with results presented as mean ± one standard deviation.
3.7. Circular Dichroism (CD) Spectroscopy
For stock solution preparation approximately 1 mg lyophilized peptide powder was presolubilized in 40 μL DMSO and diluted to a concentration of 1 mg/ml using standard phosphate buffer (25 mM sodium phosphate, 150 mM sodium chloride, pH 7.4) with and without PET50 nm (10, 50 and 100 ppm). For fibril measurements, the stock solution was incubated for 24 h at 37°C and 450 rpm using a thermoshaker prior to dilution to measure concentration. Before dilution to measuring concentration, fibrils were ultra-sonicated in a water bath for 30 min and vigorously vortexed. For recording CD spectra, the stock solution was diluted to a final peptide concentration of 10 μg/mL with DI water. CD spectra were recorded on a Jasco J-1500 spectrophotometer in a 1 mm cuvette at 25°C. The data was acquired at 50 nm/min with a data pitch of 0.1 nm, a bandwidth of 2 nm and 4 s data acquisition time. The phosphate buffer solution was measured separately and was automatically subtracted as a baseline. The proportion of each secondary structure component was further analyzed using the Beta Structure Selection (BeStSel). This method offers an enhanced β-structure determination by considering the parallel or antiparallel orientation and the twist of β-sheets, resulting in more accurate performance for all secondary structure types [53].
3.8. Solid-State NMR-Spectroscopy
For solid state NMR measurements the fibrils were prepared as before for the CD measurements using an Aβ40 peptide isotopically labelled with 13C/15N for the amino acids Phe19, Ala21 and Leu34. At the end of the fibrillation, the sample was ultracentrifuged (200,000 x g for 2h). The pellet was lyophilized overnight, rehydrated with 50wt% H2O, homogenized by ten freeze−thaw cycles and finally transferred into 3.2 mm MAS NMR rotors. Solid-state MAS NMR spectra were acquired on a Bruker 600 Avance III NMR spectrometer (Bruker BioSpin GmbH, Rheinstetten, Germany) at a resonance frequency of 600.3 MHz for 1H and 150.96 MHz for 13C, using a triple channel 3.2 mm MAS probe at temperature of 30°C and a MAS frequency of 11.7 kHz. The 90° pulse lengths were 4 µs for 1H as well as for 13C. The 13C MAS chemical shifts were referenced externally relative to TMS. 13C-13C DARR NMR spectra were acquired with a mixing time of 500 ms to also observe interresidual interactions.
3.9. Fluorescence Intensity Data Evaluation
Fluorescence intensity data were normalized by the equation I = where I represents the normalized intensity, It is the measured intensity value at the corresponding time point, and Imin and Imax are the minimal and maximal intensities measured for the corresponding well, respectively. Normalized data were fitted using a simple sigmoidal curve model, I = where I is the normalized intensity, t is the time, t0 is the time at half maximal intensity, and τ is a measure of the fibrillation time [54]. The lag time was derived by tlag= t0−2τ and the fibrillation time by tfib= 4τ. Mean values and standard deviations of lag time and fibrillation time were calculated. The statistical analysis was carried out using OriginPro v.8 (OriginLab, Northampton, MA, USA). A significance level of p < 0.05 was used to determine statistical significance.
4. Conclusions
In conclusion, our findings show that PET NPs significantly accelerate the aggregation process of Aβ peptides, as evidenced by a reduction in both the lag time and the fibrillation time, particularly at a concentration of 100 ppm PET NPs (both PET50 nm and PET140 nm). Moreover, our secondary structure analysis using CD spectroscopy demonstrated that PET50 nm induce a conformational shift in Aβ peptides, favoring the formation of antiparallel β-sheets while increasing structural heterogeneity. This shift is accompanied by a reduction in other secondary structures, suggesting that PET NPs promote a more uniform and aggregation-prone conformation. Despite these alterations, TEM analysis indicated that while PET50 nm modulates the aggregation kinetics, they do not significantly affect the final fibril morphology or diameter. 13C solid-state NMR spectroscopy revealed that the local structure of the cross-β configuration in amyloid fibrils was not affected by the presence of PET50 nm nanoparticles during fibrillation. Taken together, these results show that PET NPs, influence the aggregation behavior of Aβ peptides, potentially may exacerbate neurotoxic effects associated with AD. These findings raise concerns about the potential environmental and health impacts of PET NPs, emphasizing the need for further investigation into their long-term effects on neurodegenerative diseases.
Supplementary Materials
The following supporting information can be downloaded at the website of this paper posted on Preprints.org, Figure S1: The proportion of each secondary structure component analyzed from CD spectrum using the BeStSel; Figure S2: Mass spectrum ESI-MS of Amyloid beta 1-40
Author Contributions
N.B. with contributions by F.S, D.H, M.K, H.A.S. conducted experiments; N.B, A.A, D.H, F.S, M.K, H.A.S. analysed data; N.B wrote the manuscript text, and prepared figures; J.M., D.H., G.S. and A.A. supervised the work. All authors reviewed the manuscript.
Funding
This work was supported by the Deutsche Forschungsgemeinschaft (DFG) grant (SFB TRR-386 HYP*MOL).
Data Availability Statement
All relevant data are within the paper and its Supporting Information Files.
Acknowledgments
The authors thank Lara Bromme for help with PET NPs preparation.
Conflicts of Interest
The authors declare no conflicts of interest.
References
- OECD (2024), Policy Scenarios for Eliminating Plastic Pollution by 2040, OECD Publishing, Paris. [CrossRef]
- Jambeck, J.; Geyer, R.; Wilcox, C.; Siegler, T.; Perryman, M.; Andrady, A.; Narayan, R.; Law, K. Marine pollution. Plastic waste inputs from land into the ocean. Science (New York, N.Y.) 2015, 347, 768–771. [Google Scholar] [CrossRef]
- Yu, Z.; Xu, X.; Guo, L.; Jin, R. & Lu, Y. Uptake and transport of micro/nanoplastics in terrestrial plants: Detection, mechanisms, and influencing factors. Sci Total Environ 2024, 907, 168155. [CrossRef]
- Wayman, C.; Niemann, H. The fate of plastic in the ocean environment – a minireview. Environmental Science: Processes & Impacts 2021, 23, 198–212. [Google Scholar] [CrossRef]
- Dimassi, S. N.; Hahladakis, J. N.; Yahia, M. N. D.; Ahmad, M. I.; Sayadi, S.; Al-Ghouti, M. A. Degradation-fragmentation of marine plastic waste and their environmental implications: A critical review. Arabian Journal of Chemistry 2022, 15, 104262. [Google Scholar] [CrossRef]
- Takada, H.; Karapanagioti, H. Hazardous Chemicals Associated with Plastics in the Marine Environment; 2019. [CrossRef]
- Zhang, K.; Hamidian, A. H.; Tubić, A.; Zhang, Y.; Fang, J. K. H.; Wu, C.; Lam, P. K. S. Understanding plastic degradation and microplastic formation in the environment: A review. Environ Pollut 2021, 274, 116554. [Google Scholar] [CrossRef]
- Zeenat; Elahi, A.; Bukhari, D. A.; Shamim, S.; Rehman, A. Plastics degradation by microbes: A sustainable approach. Journal of King Saud University - Science 2021, 33, 101538. [CrossRef]
- Liu, L.; Xu, M.; Ye, Y.; Zhang, B. On the degradation of (micro)plastics: Degradation methods, influencing factors, environmental impacts. Sci Total Environ 2022, 806 Pt 3, 151312. [Google Scholar] [CrossRef] [PubMed]
- Hua, X.; Wang, D. Cellular Uptake, Transport, and Organelle Response After Exposure to Microplastics and Nanoplastics: Current Knowledge and Perspectives for Environmental and Health Risks. Reviews of Environmental Contamination and Toxicology 2022, 260. [Google Scholar] [CrossRef]
- Yee, M. S.-L.; Hii, L.-W.; Looi, C. K.; Lim, W.-M.; Wong, S.-F.; Kok, Y.-Y.; Tan, B.-K.; Wong, C.-Y.; Leong, C.-O. Impact of Microplastics and Nanoplastics on Human Health. Nanomaterials 2021, 11, 496. [Google Scholar] [CrossRef]
- Giri, S.; Lamichhane, G.; Khadka, D.; Devkota, H. P. Microplastics contamination in food products: Occurrence, analytical techniques and potential impacts on human health. Current Research in Biotechnology 2024, 7, 100190. [Google Scholar] [CrossRef]
- Pironti, C.; Ricciardi, M.; Motta, O.; Miele, Y.; Proto, A.; Montano, L. Microplastics in the Environment: Intake through the Food Web, Human Exposure and Toxicological Effects. Toxics 2021, 9, 224. [Google Scholar] [CrossRef]
- Wright, S. L.; Kelly, F. J. Plastic and Human Health: A Micro Issue? Environ Sci Technol 2017, 51, 6634–6647. [Google Scholar] [CrossRef] [PubMed]
- Hersh, A. M.; Alomari, S.; Tyler, B. M. Crossing the Blood-Brain Barrier: Advances in Nanoparticle Technology for Drug Delivery in Neuro-Oncology. Int J Mol Sci 2022, 23. [Google Scholar] [CrossRef] [PubMed]
- Shan, S.; Zhang, Y.; Zhao, H.; Zeng, T.; Zhao, X. Polystyrene nanoplastics penetrate across the blood-brain barrier and induce activation of microglia in the brain of mice. Chemosphere 2022, 298, 134261. [Google Scholar] [CrossRef]
- Sökmen, T.; Sulukan, E.; Türkoğlu, M.; Baran, A.; Özkaraca, M.; Ceyhun, S. B. Polystyrene nanoplastics (20 nm) are able to bioaccumulate and cause oxidative DNA damages in the brain tissue of zebrafish embryo (Danio rerio). Neurotoxicology 2020, 77, 51–59. [Google Scholar] [CrossRef]
- Prüst, M.; Meijer, J.; Westerink, R. H. S. The plastic brain: neurotoxicity of micro- and nanoplastics. Particle and Fibre Toxicology 2020, 17, 24. [Google Scholar] [CrossRef]
- Paul, M. B.; Stock, V.; Cara-Carmona, J.; Lisicki, E.; Shopova, S.; Fessard, V.; Braeuning, A.; Sieg, H.; Böhmert, L. Micro- and nanoplastics – current state of knowledge with the focus on oral uptake and toxicity. Nanoscale Advances 2020, 2, 4350–4367. [Google Scholar] [CrossRef] [PubMed]
- Kopatz, V.; Wen, K.; Kovács, T.; Keimowitz, A. S.; Pichler, V.; Widder, J.; Vethaak, A. D.; Hollóczki, O.; Kenner, L. Micro- and Nanoplastics Breach the Blood-Brain Barrier (BBB): Biomolecular Corona's Role Revealed. Nanomaterials (Basel) 2023, 13. [Google Scholar] [CrossRef]
- Gou, X.; Fu, Y.; Li, J.; Xiang, J.; Yang, M.; Zhang, Y. Impact of nanoplastics on Alzheimer 's disease: Enhanced amyloid-β peptide aggregation and augmented neurotoxicity. J Hazard Mater 2024, 465, 133518. [Google Scholar] [CrossRef]
- Dhaka, V.; Singh, S.; Anil, A. G.; Sunil Kumar Naik, T. S.; Garg, S.; Samuel, J.; Kumar, M.; Ramamurthy, P. C.; Singh, J. Occurrence, toxicity and remediation of polyethylene terephthalate plastics. A review. Environmental Chemistry Letters 2022, 20, 1777–1800. [Google Scholar] [CrossRef]
- Gwada, B.; Ogendi, G.; Makindi, S.; Trott, S. Composition of plastic waste discarded by households and its management approaches. Global Journal of Environmental Science and Management 2019, 5, 83–94. [Google Scholar] [CrossRef]
- Bashirova, N.; Poppitz, D.; Klüver, N.; Scholz, S.; Matysik, J.; Alia, A. A mechanistic understanding of the effects of polyethylene terephthalate nanoplastics in the zebrafish (Danio rerio) embryo. Scientific Reports 2023, 13, 1891. [Google Scholar] [CrossRef]
- Cipriani, G.; Dolciotti, C.; Picchi, L.; Bonuccelli, U. Alzheimer and his disease: a brief history. Neurol Sci 2011, 32, 275–279. [Google Scholar] [CrossRef] [PubMed]
- Nakatuka, Y.; Yoshida, H.; Fukui, K.; Matuzawa, M. The effect of particle size distribution on effective zeta-potential by use of the sedimentation method. Advanced Powder Technology 2015, 26. [Google Scholar] [CrossRef]
- Swartzwelter, B. J.; Mayall, C.; Alijagic, A.; Barbero, F.; Ferrari, E.; Hernadi, S.; Michelini, S.; Navarro Pacheco, N. I.; Prinelli, A.; Swart, E.; et al. Cross-Species Comparisons of Nanoparticle Interactions with Innate Immune Systems: A Methodological Review. Nanomaterials 2021, 11, 1528. [Google Scholar] [CrossRef]
- Wang, J.; Cong, J.; Wu, J.; Chen, Y.; Fan, H.; Wang, X.; Duan, Z.; Wang, L. Nanoplastic-protein corona interactions and their biological effects: A review of recent advances and trends. TrAC Trends in Analytical Chemistry 2023, 166, 117206. [Google Scholar] [CrossRef]
- John, T.; Adler, J.; Elsner, C.; Petzold, J.; Krueger, M.; Martin, L.L.; Huster, D.; Risselada, H.J.; Abel, B. Mechanistic insights into the size-dependent effects of nanoparticles on inhibiting and accelerating amyloid fibril formation. J Colloid Interface Sci. 2022, 15, 622:804–818. [Google Scholar] [CrossRef] [PubMed]
- Pino, P. d.; Pelaz, B.; Zhang, Q.; Maffre, P.; Nienhaus, G. U.; Parak, W. J. Protein corona formation around nanoparticles – from the past to the future. Materials Horizons 2014, 1, 301–313. [Google Scholar] [CrossRef]
- Hollóczki, O.; Gehrke, S. Nanoplastics can change the secondary structure of proteins. Scientific Reports 2019, 9, 16013. [Google Scholar] [CrossRef]
- Ke, P. C.; Lin, S.; Parak, W. J.; Davis, T. P.; Caruso, F. A Decade of the Protein Corona. ACS Nano 2017, 11, 11773–11776. [Google Scholar] [CrossRef]
- Kopac, T. Protein corona, understanding the nanoparticle–protein interactions and future perspectives: A critical review. International Journal of Biological Macromolecules 2021, 169, 290–301. [Google Scholar] [CrossRef]
- Vianello, F.; Cecconello, A.; Magro, M. Toward the Specificity of Bare Nanomaterial Surfaces for Protein Corona Formation. Int J Mol Sci 2021, 22. [Google Scholar] [CrossRef]
- Walkey, C. D.; Chan, W. C. W. Understanding and controlling the interaction of nanomaterials with proteins in a physiological environment. Chemical Society Reviews 2012, 41, 2780–2799. [Google Scholar] [CrossRef]
- Linse, S. Mechanism of amyloid protein aggregation and the role of inhibitors. Pure and Applied Chemistry 2019, 91, 211–229. [Google Scholar] [CrossRef]
- Tycko, R. Molecular structure of amyloid fibrils: insights from solid-state NMR. Q Rev Biophys. 2006, 39(1), 1–55. [Google Scholar] [CrossRef] [PubMed]
- Chatani, E.; Yamamoto, N. Recent progress on understanding the mechanisms of amyloid nucleation. Biophys Rev 2018, 10, 527–534. [Google Scholar] [CrossRef] [PubMed]
- Lee, C. C.; Nayak, A.; Sethuraman, A.; Belfort, G.; McRae, G. J. A three-stage kinetic model of amyloid fibrillation. Biophys J 2007, 92, 3448–3458. [Google Scholar] [CrossRef]
- Zaman, M.; Ahmad, E.; Qadeer, A.; Rabbani, G.; Khan, R. H. Nanoparticles in relation to peptide and protein aggregation. Int J Nanomedicine 2014, 9, 899–912. [Google Scholar] [CrossRef]
- Linse, S.; Cabaleiro-Lago, C.; Xue, W.-F.; Lynch, I.; Lindman, S.; Thulin, E.; Radford, S. E.; Dawson, K. A. Nucleation of protein fibrillation by nanoparticles. Proceedings of the National Academy of Sciences 2007, 104, 8691–8696. [Google Scholar] [CrossRef]
- Windheim, J.; Colombo, L.; Battajni, N. C.; Russo, L.; Cagnotto, A.; Diomede, L.; Bigini, P.; Vismara, E.; Fiumara, F.; Gabbrielli, S.; et al. Micro- and Nanoplastics’ Effects on Protein Folding and Amyloidosis. International Journal of Molecular Sciences 2022, 23, 10329. [Google Scholar] [CrossRef]
- Cabaleiro-Lago, C.; Quinlan-Pluck, F.; Lynch, I.; Dawson, K. A.; Linse, S. Dual effect of amino modified polystyrene nanoparticles on amyloid β protein fibrillation. ACS Chem Neurosci 2010, 1, 279–287. [Google Scholar] [CrossRef]
- Chen, G.-f.; Xu, T.-h.; Yan, Y.; Zhou, Y.-r.; Jiang, Y.; Melcher, K.; Xu, H. E. Amyloid beta: structure, biology and structure-based therapeutic development. Acta Pharmacologica Sinica 2017, 38, 1205–1235. [Google Scholar] [CrossRef] [PubMed]
- Wishart, D. S.; Sykes, B. D. Chemical shifts as a tool for structure determination. Methods Enzymol 1994, 239, 363–392. [Google Scholar] [CrossRef]
- Petkova, A. T.; Ishii, Y.; Balbach, J. J.; Antzutkin, O. N.; Leapman, R. D.; Delaglio, F.; Tycko, R. A structural model for Alzheimer's beta -amyloid fibrils based on experimental constraints from solid state NMR. Proc Natl Acad Sci U S A 2002, 99, 16742–16747. [Google Scholar] [CrossRef]
- Paravastu, A. K.; Petkova, A. T.; Tycko, R. Polymorphic fibril formation by residues 10-40 of the Alzheimer's beta-amyloid peptide. Biophys J 2006, 90, 4618–4629. [Google Scholar] [CrossRef] [PubMed]
- Bertini, I.; Gonnelli, L.; Luchinat, C.; Mao, J.; Nesi, A. A new structural model of Aβ40 fibrils. J Am Chem Soc 2011, 133, 16013–16022. [Google Scholar] [CrossRef]
- Scheidt, H. A.; Morgado, I.; Rothemund, S.; Huster, D. Dynamics of amyloid β fibrils revealed by solid-state NMR. J Biol Chem 2012, 287, 2017–2021. [Google Scholar] [CrossRef]
- Adler, J.; Scheidt, H. A.; Krüger, M.; Thomas, L.; Huster, D. Local interactions influence the fibrillation kinetics, structure and dynamics of Aβ(1–40) but leave the general fibril structure unchanged. Physical Chemistry Chemical Physics 2014, 16, 7461–7471. [Google Scholar] [CrossRef] [PubMed]
- Schwarze, B.; Huster, D.; How Single site mutations can help understanding structure formation of amyloid β1-40. Macromol Biosci. 2023, 23(5):e2200489. [CrossRef]
- Welzel, K.; Müller, R.-J.; Deckwer, W.-D. Enzymatischer Abbau von Polyester-Nanopartikeln. Chemie Ingenieur Technik 2002, 74, 1496–1500. [Google Scholar] [CrossRef]
- Micsonai, A.; Bulyáki, É.; Kardos, J. BeStSel: From Secondary Structure Analysis to Protein Fold Prediction by Circular Dichroism Spectroscopy. In Structural Genomics: General Applications, Chen, Y. W., Yiu, C.-P. B. Eds.; Springer US, 2021; pp 175-189.
- Nielsen, L.; Khurana, R.; Coats, A.; Frokjaer, S.; Brange, J.; Vyas, S.; Uversky, V. N.; Fink, A. L. Effect of environmental factors on the kinetics of insulin fibril formation: elucidation of the molecular mechanism. Biochemistry 2001, 40, 6036–6046. [Google Scholar] [CrossRef]
Figure 2.
Fibrillation kinetics of Aβcontrol and Aß - PET NPs (PET50 nm and PET140 nm) measured by ThT fluorescence. (A) Concentration and size dependent (B-D) effect of PET NPs on kinetics of Aβ. (E) The concentration and size dependent characteristic lag (tlag) and fibrillation time (tfib). The peptide concentration was 0.125 mg/ml (28 µM) at pH 7.4 and a temperature of 37°C. Experimental data were fitted to sigmoidal functions as described in the Materials and Methods.
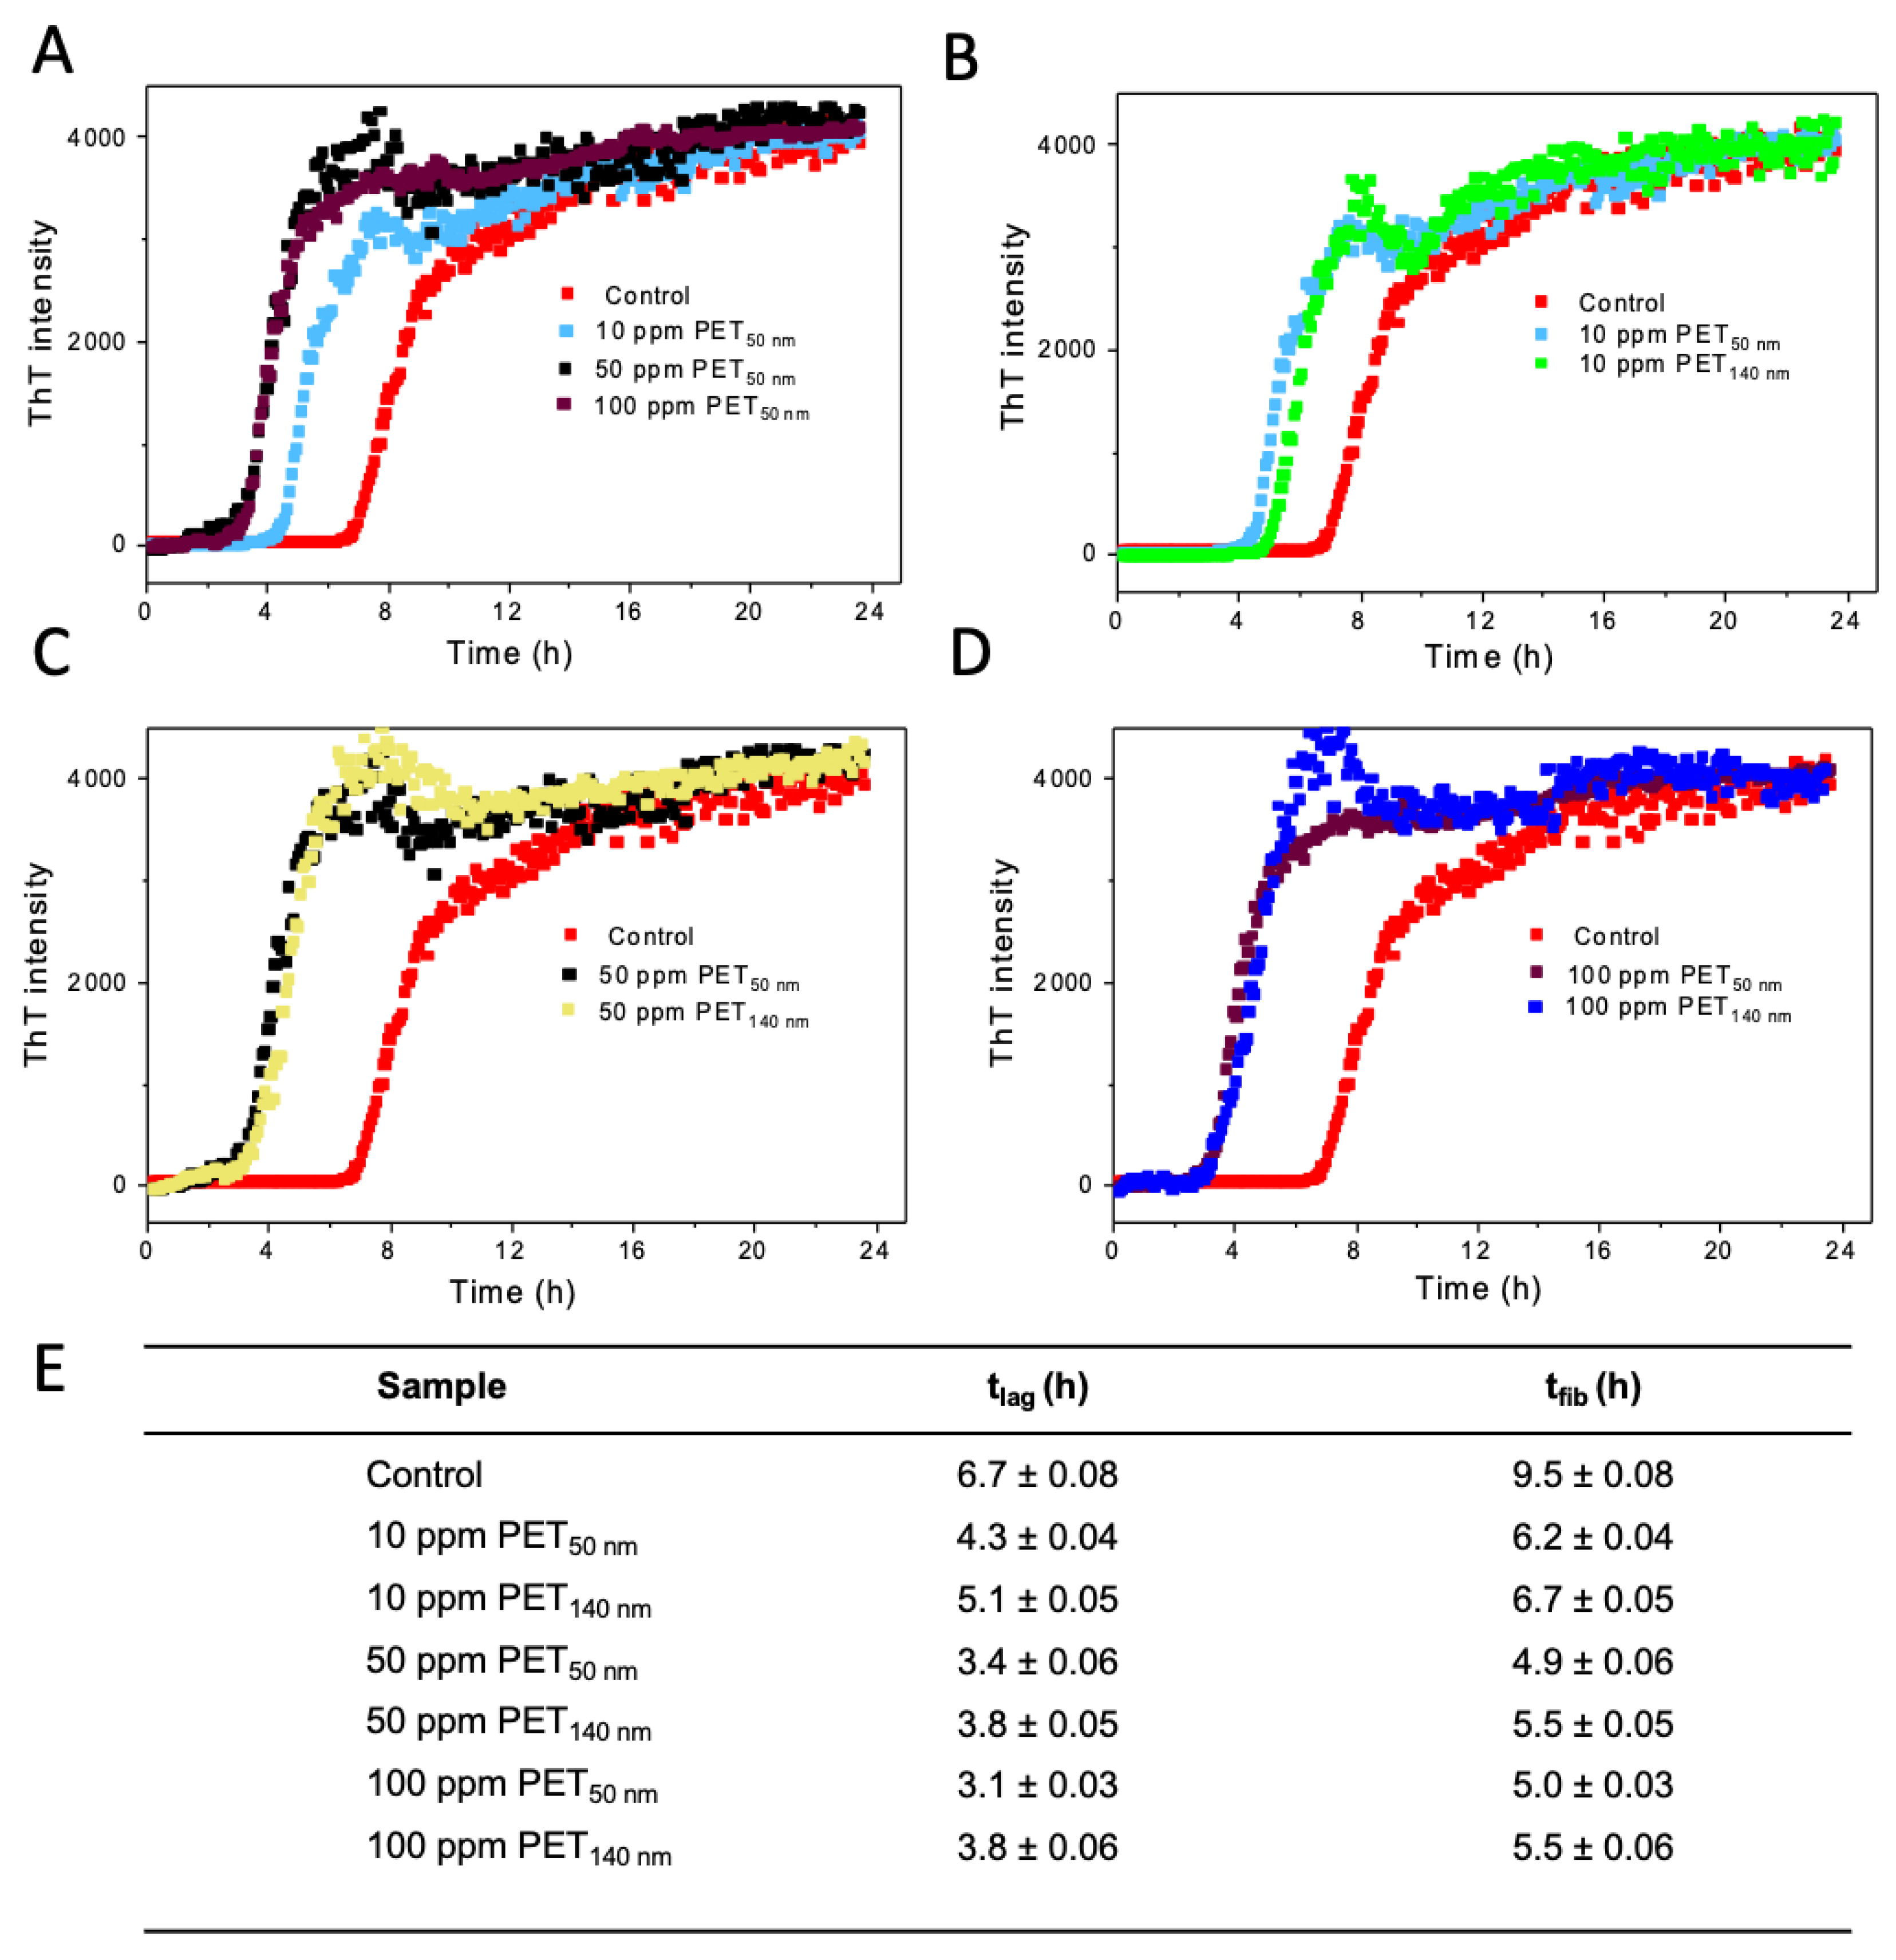
Figure 4.
(A) 1D 13C CP MAS NMR spectra of the Aβ40 in the absence (red) and presence of 100 ppm PET50 nm (black), (B) 13C–13C 2D DAAR NMR spectrum of the Aβ40 fibrils in the presence of 100 ppm PET50 nm. The intraresidual cross peaks are labeled for Phe19 (red), Ala21 (black) and Leu34 (blue). The blue doted box indicates the interresidual cross peak between the side chain of Leu34 and the aromatic ring of Phe19. All spectra were measured at 30°C and a MAS frequency of ~11,7 kHz. (C) Table showing isotropic chemical shifts (relative to TMS) for Aβ40 fibrils in the absence or presence of 100 ppm PET50 nm.
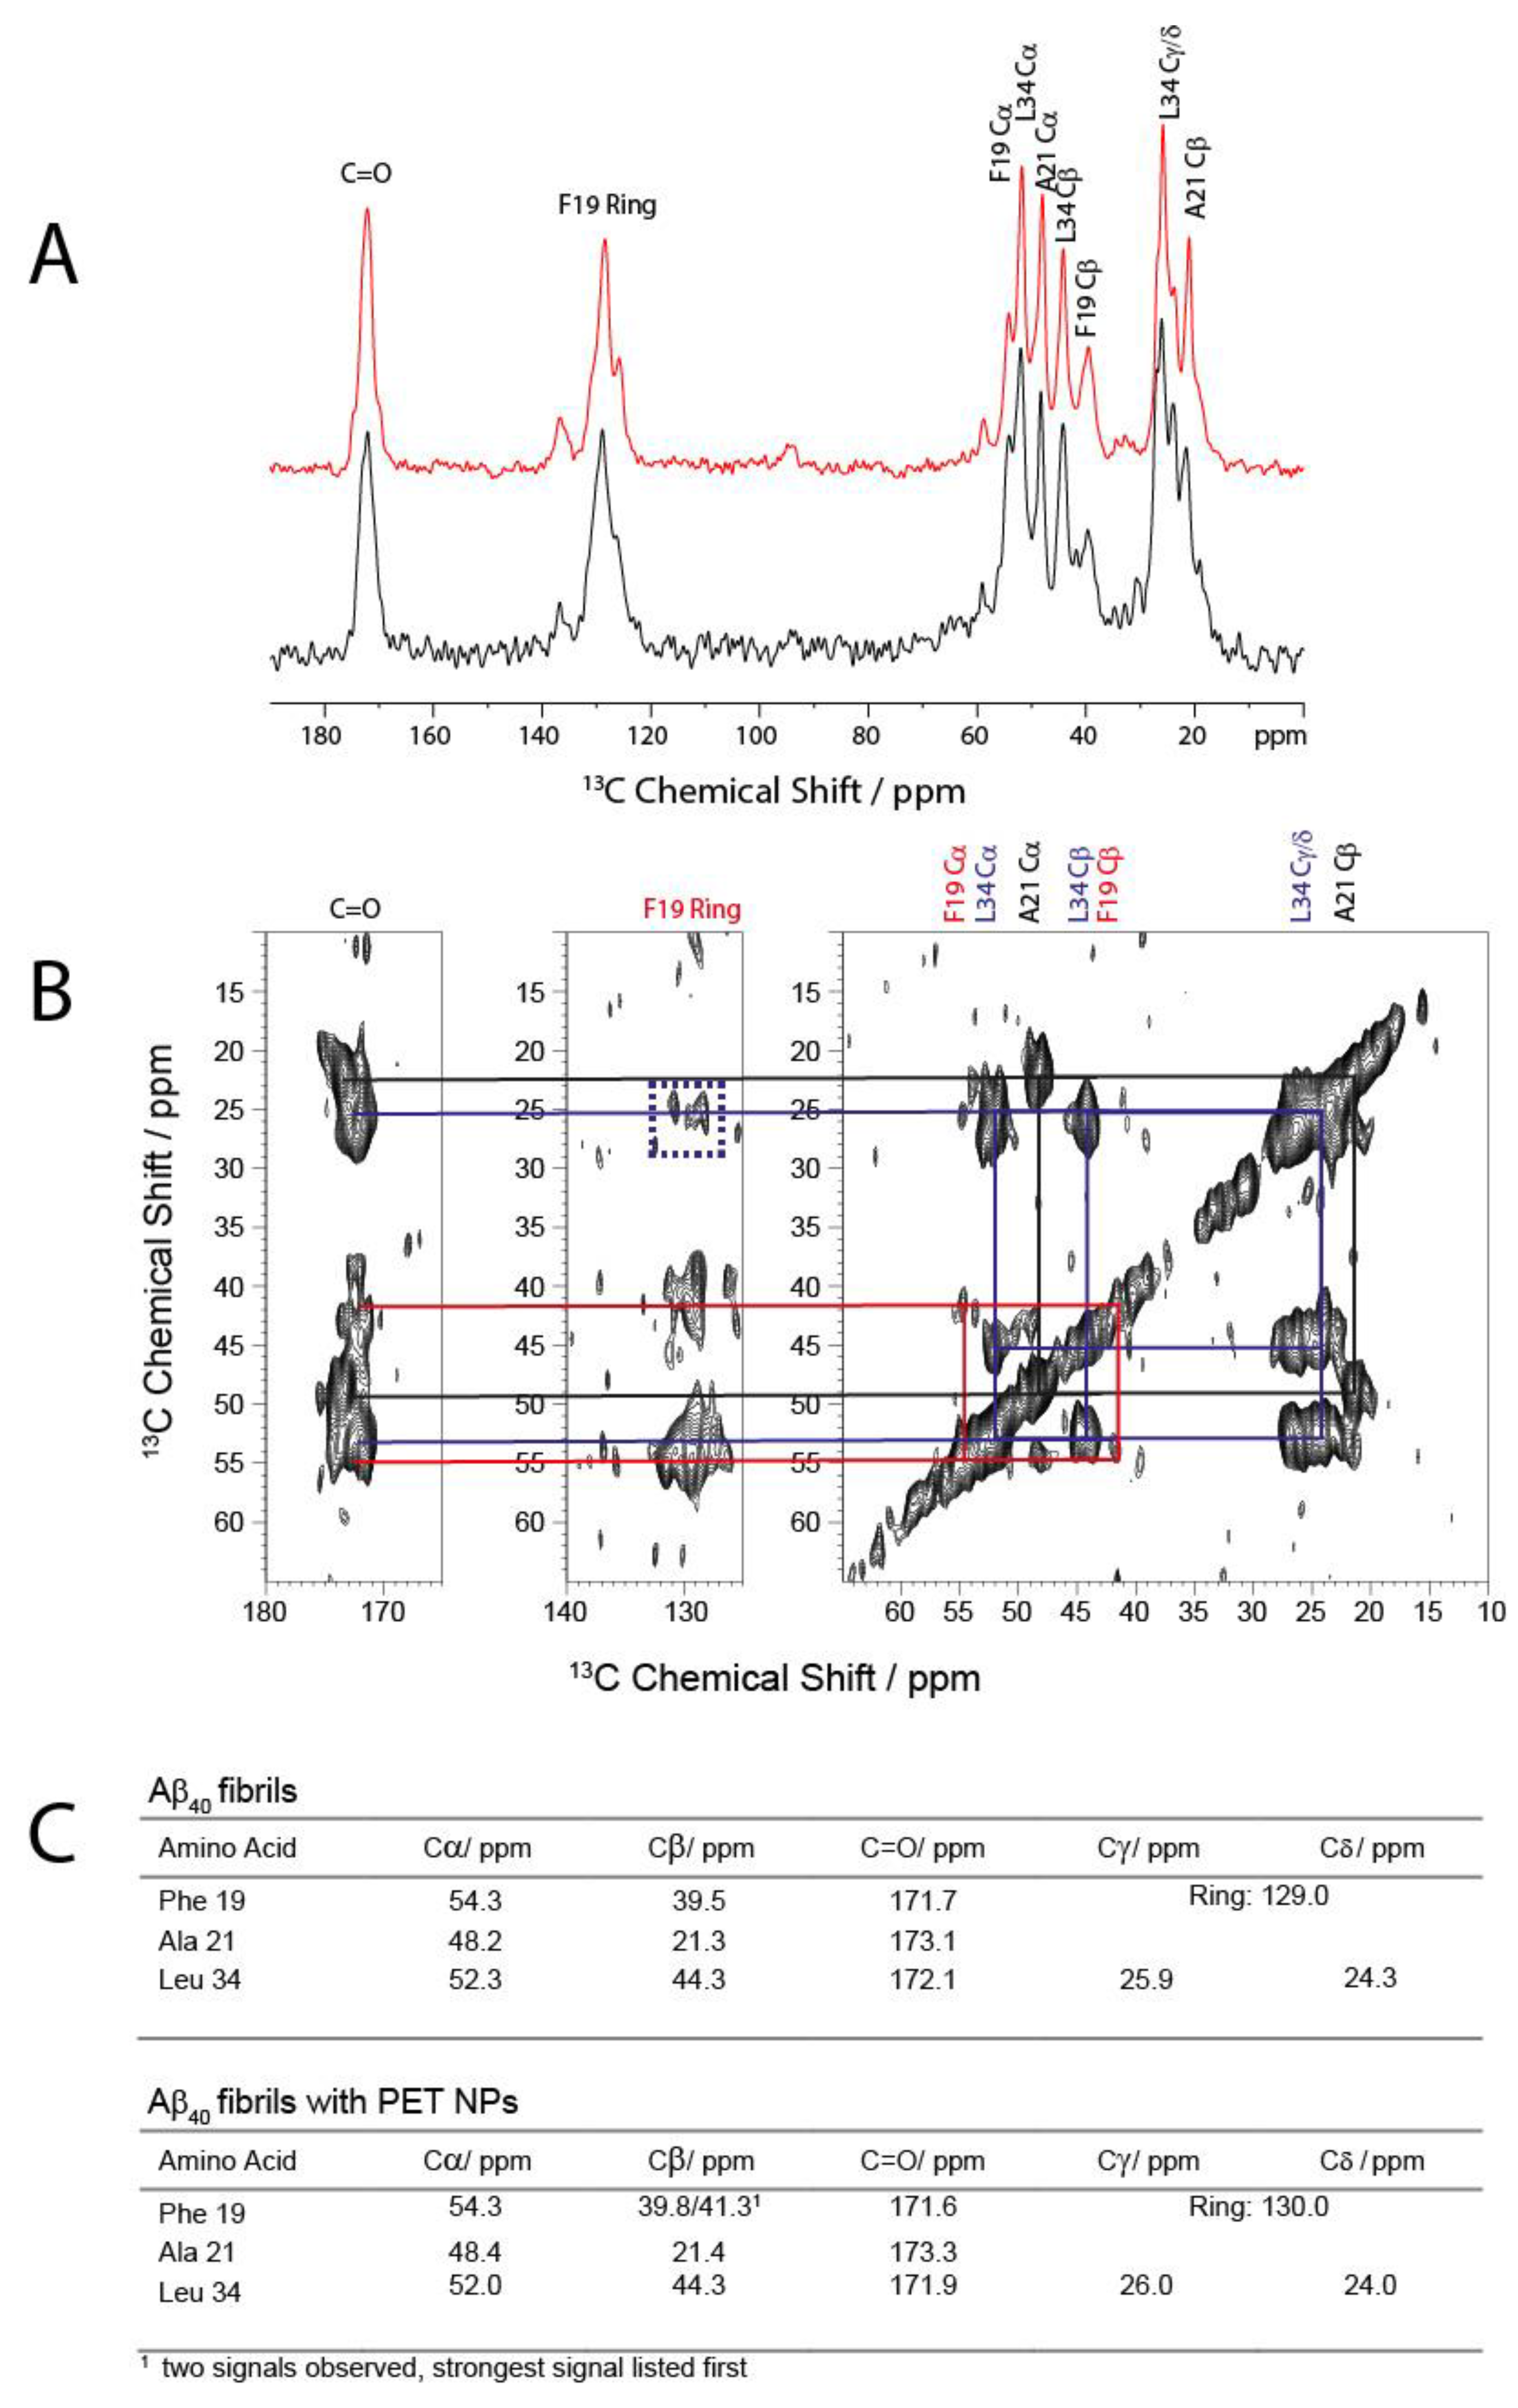
Figure 5.
Negatively stained images observed by TEM. (A) TEM images of Aβ and Aβ-PET50 nm NPs at two different time points. 1 h and 24 h. (B) Box plots of measured fibril diameters (n = 100, a total of 100 measurements from two independent preparations). Scale bars: 250 nm and 100 nm (inset).
Figure 5.
Negatively stained images observed by TEM. (A) TEM images of Aβ and Aβ-PET50 nm NPs at two different time points. 1 h and 24 h. (B) Box plots of measured fibril diameters (n = 100, a total of 100 measurements from two independent preparations). Scale bars: 250 nm and 100 nm (inset).
Disclaimer/Publisher’s Note: The statements, opinions and data contained in all publications are solely those of the individual author(s) and contributor(s) and not of MDPI and/or the editor(s). MDPI and/or the editor(s) disclaim responsibility for any injury to people or property resulting from any ideas, methods, instructions or products referred to in the content. |
© 2025 by the authors. Licensee MDPI, Basel, Switzerland. This article is an open access article distributed under the terms and conditions of the Creative Commons Attribution (CC BY) license (https://creativecommons.org/licenses/by/4.0/).
Copyright: This open access article is published under a Creative Commons CC BY 4.0 license, which permit the free download, distribution, and reuse, provided that the author and preprint are cited in any reuse.


